the way india invests: mutual funds
TRANSCRIPT
The Way India Invests: Mutual Funds
A dissertation submitted in partial fulfillment of the requirements for the
degree of Bachelor in Science (Major in Economics) of Presidency University
Session: 2013-2016
BY
ASHUTOSH KASHYAP
13120111023
DEPARTMENT OF ECONOMICS
PRESIDENCY UNIVERSITY
KOLKATA, INDIA

1
TO WHOM IT MAY CONCERN
This is to certify that Ashutosh Kashyap has completed his project work for the B.Sc.
degree with Major in Economics under my supervision for the session 2013-2016. The
title of the work is “The Way India Invests: Mutual Funds”. It is now ready for
submission towards of partial fulfillment of the B.Sc. degree with Major in Economics.
Name of Supervisor: Gagari Chakrabarti, Ph.D.
Signature of Supervisor:
Dated: April 28th, 2016
2
Table of Contents
1 Abstract .......................................................................................................................................... 3
2 Introduction .................................................................................................................................... 4
3 Literature Review ........................................................................................................................... 5
4 Growth and Challenges: Indian Mutual Fund Industry .................................................................. 7
5 Triggers Which Can Propel the Growth ......................................................................................... 8
6 Digital India, Banking and Mutual Fund ........................................................................................ 9
7 Objective of Study ........................................................................................................................ 10
8 Methodology ................................................................................................................................ 11
9 Analysis ........................................................................................................................................ 13
9.1 Balance Funds Vs S&P Sensex ............................................................................................ 13
9.2 Equity- ELSS Funds Vs S&P Sensex ................................................................................... 14
9.3 Debt- Short Term Funds Vs S&P Sensex ............................................................................. 15
9.4 Sortino Ratio Vs Sharpe Ratio ............................................................................................. 16
9.5 Standard Deviation ............................................................................................................... 18
9.6 Expense Ratio ....................................................................................................................... 19
10 SIP Yield Vs Annualized Return of Lump Sum Investment .................................................... 20
11 Regression of Calendar Returns for Balanced Vs Equity and Debt ......................................... 23
12 Conclusion ................................................................................................................................ 24
13 References ................................................................................................................................ 26
3
1 Abstract
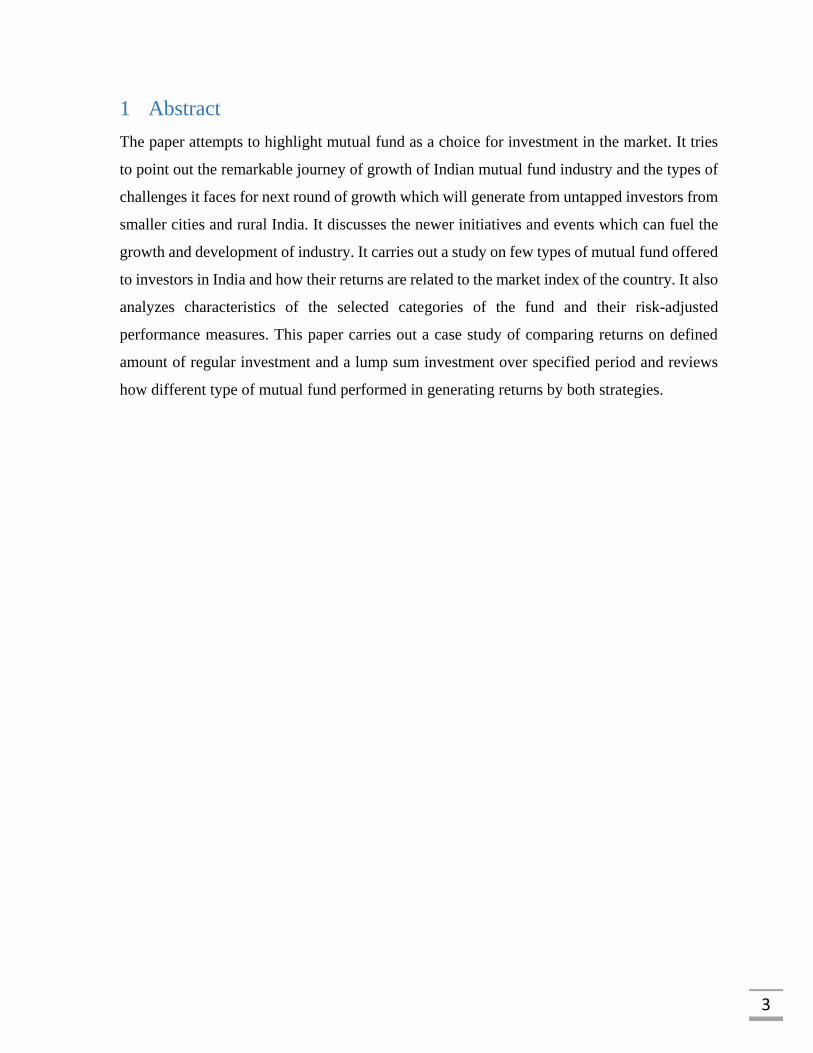
The paper attempts to highlight mutual fund as a choice for investment in the market. It tries
to point out the remarkable journey of growth of Indian mutual fund industry and the types of
challenges it faces for next round of growth which will generate from untapped investors from
smaller cities and rural India. It discusses the newer initiatives and events which can fuel the
growth and development of industry. It carries out a study on few types of mutual fund offered
to investors in India and how their returns are related to the market index of the country. It also
analyzes characteristics of the selected categories of the fund and their risk-adjusted
performance measures. This paper carries out a case study of comparing returns on defined
amount of regular investment and a lump sum investment over specified period and reviews
how different type of mutual fund performed in generating returns by both strategies.
4
2 Introduction
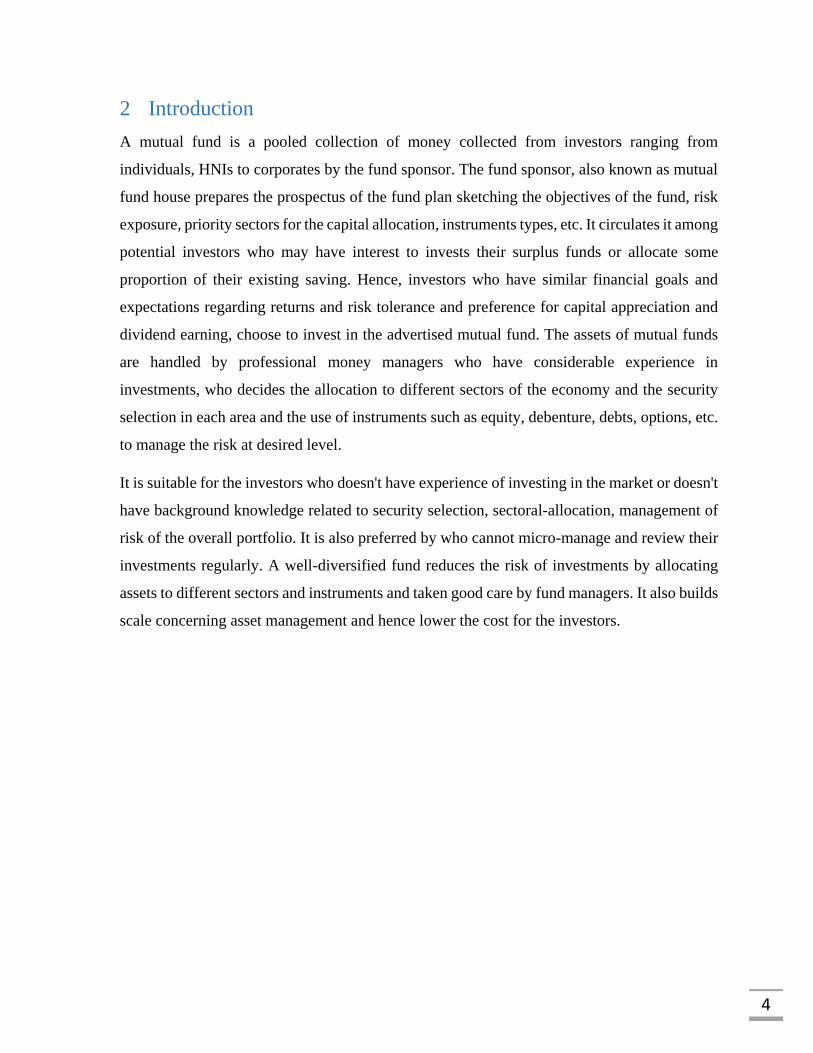
A mutual fund is a pooled collection of money collected from investors ranging from
individuals, HNIs to corporates by the fund sponsor. The fund sponsor, also known as mutual
fund house prepares the prospectus of the fund plan sketching the objectives of the fund, risk
exposure, priority sectors for the capital allocation, instruments types, etc. It circulates it among
potential investors who may have interest to invests their surplus funds or allocate some
proportion of their existing saving. Hence, investors who have similar financial goals and
expectations regarding returns and risk tolerance and preference for capital appreciation and
dividend earning, choose to invest in the advertised mutual fund. The assets of mutual funds
are handled by professional money managers who have considerable experience in
investments, who decides the allocation to different sectors of the economy and the security
selection in each area and the use of instruments such as equity, debenture, debts, options, etc.
to manage the risk at desired level.
It is suitable for the investors who doesn't have experience of investing in the market or doesn't
have background knowledge related to security selection, sectoral-allocation, management of
risk of the overall portfolio. It is also preferred by who cannot micro-manage and review their
investments regularly. A well-diversified fund reduces the risk of investments by allocating
assets to different sectors and instruments and taken good care by fund managers. It also builds
scale concerning asset management and hence lower the cost for the investors.
5
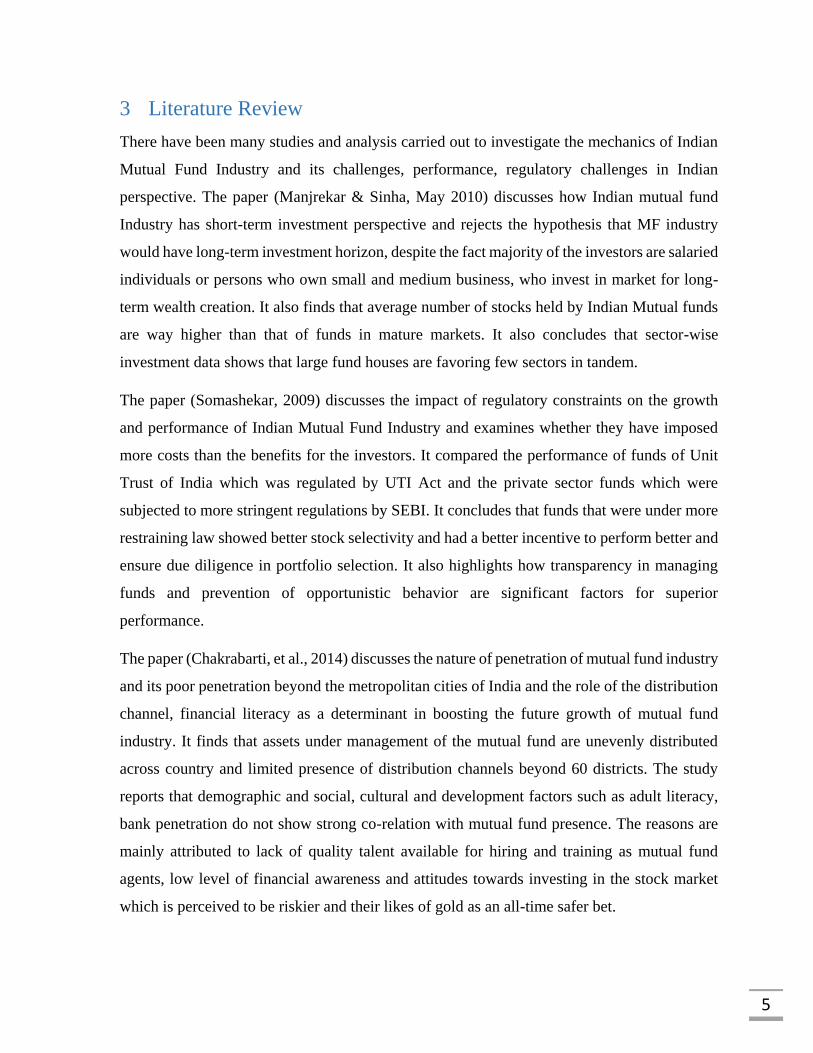
3 Literature Review
There have been many studies and analysis carried out to investigate the mechanics of Indian
Mutual Fund Industry and its challenges, performance, regulatory challenges in Indian
perspective. The paper (Manjrekar & Sinha, May 2010) discusses how Indian mutual fund
Industry has short-term investment perspective and rejects the hypothesis that MF industry
would have long-term investment horizon, despite the fact majority of the investors are salaried
individuals or persons who own small and medium business, who invest in market for long-
term wealth creation. It also finds that average number of stocks held by Indian Mutual funds
are way higher than that of funds in mature markets. It also concludes that sector-wise
investment data shows that large fund houses are favoring few sectors in tandem.
The paper (Somashekar, 2009) discusses the impact of regulatory constraints on the growth
and performance of Indian Mutual Fund Industry and examines whether they have imposed
more costs than the benefits for the investors. It compared the performance of funds of Unit
Trust of India which was regulated by UTI Act and the private sector funds which were
subjected to more stringent regulations by SEBI. It concludes that funds that were under more
restraining law showed better stock selectivity and had a better incentive to perform better and
ensure due diligence in portfolio selection. It also highlights how transparency in managing
funds and prevention of opportunistic behavior are significant factors for superior
performance.
The paper (Chakrabarti, et al., 2014) discusses the nature of penetration of mutual fund industry
and its poor penetration beyond the metropolitan cities of India and the role of the distribution
channel, financial literacy as a determinant in boosting the future growth of mutual fund
industry. It finds that assets under management of the mutual fund are unevenly distributed
across country and limited presence of distribution channels beyond 60 districts. The study
reports that demographic and social, cultural and development factors such as adult literacy,
bank penetration do not show strong co-relation with mutual fund presence. The reasons are
mainly attributed to lack of quality talent available for hiring and training as mutual fund
agents, low level of financial awareness and attitudes towards investing in the stock market
which is perceived to be riskier and their likes of gold as an all-time safer bet.

6
The report (ASSOCHAM India, ICRA Online, Nov 2015) analyzes the factors that can ignite
the next round of growth for the second half of this decade. It focuses on the era of enabling
regulations in consultation with the industry and emerging technology as a great facilitator
which can simplify the processes and help the funds to reach beyond the T-15 in a cost effective
manner to broaden and deepen its reach among large middle class which has still little exposure
to equity market and have not lost their love for traditional investment instruments. It discusses
the efforts by government-backed institutions and Investor Awareness programs by mutual
fund houses to reach out to the untapped residents and how the new initiatives and norms such
as Jan Dhan Yojna, a drive to increase penetration of banks which has brought more than 27000
crores in the banking system, e-KYC backed by Aadhaar infrastructure.
7
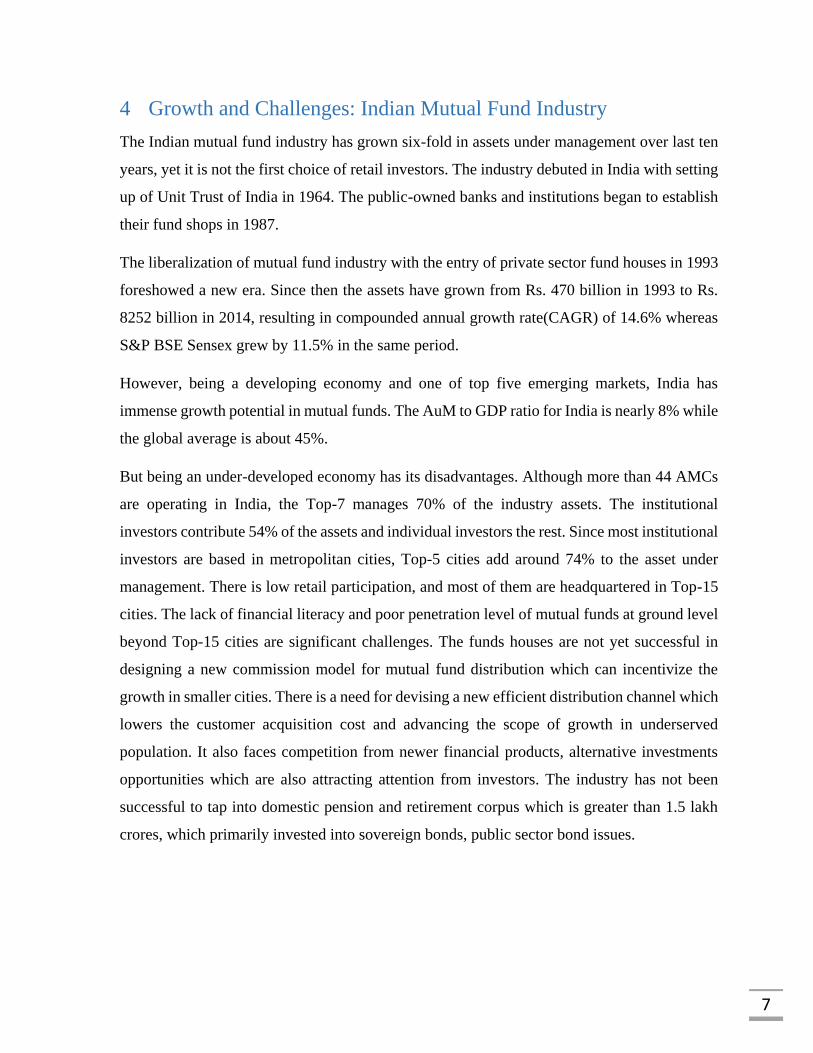
4 Growth and Challenges: Indian Mutual Fund Industry
The Indian mutual fund industry has grown six-fold in assets under management over last ten
years, yet it is not the first choice of retail investors. The industry debuted in India with setting
up of Unit Trust of India in 1964. The public-owned banks and institutions began to establish
their fund shops in 1987.
The liberalization of mutual fund industry with the entry of private sector fund houses in 1993
foreshowed a new era. Since then the assets have grown from Rs. 470 billion in 1993 to Rs.
8252 billion in 2014, resulting in compounded annual growth rate(CAGR) of 14.6% whereas
S&P BSE Sensex grew by 11.5% in the same period.
However, being a developing economy and one of top five emerging markets, India has
immense growth potential in mutual funds. The AuM to GDP ratio for India is nearly 8% while
the global average is about 45%.
But being an under-developed economy has its disadvantages. Although more than 44 AMCs
are operating in India, the Top-7 manages 70% of the industry assets. The institutional
investors contribute 54% of the assets and individual investors the rest. Since most institutional
investors are based in metropolitan cities, Top-5 cities add around 74% to the asset under
management. There is low retail participation, and most of them are headquartered in Top-15
cities. The lack of financial literacy and poor penetration level of mutual funds at ground level
beyond Top-15 cities are significant challenges. The funds houses are not yet successful in
designing a new commission model for mutual fund distribution which can incentivize the
growth in smaller cities. There is a need for devising a new efficient distribution channel which
lowers the customer acquisition cost and advancing the scope of growth in underserved
population. It also faces competition from newer financial products, alternative investments
opportunities which are also attracting attention from investors. The industry has not been
successful to tap into domestic pension and retirement corpus which is greater than 1.5 lakh
crores, which primarily invested into sovereign bonds, public sector bond issues.
8
5 Triggers Which Can Propel the Growth
Newly introduced e-KYC norms, which can revolutionize the way investor buys into the
mutual fund, faster processing of the application, reduction in intermediaries, reduced cost,
lower management fees, benefits the investor.
Technology as an enabler: e-KYC norms opens newer avenues of cost rationalization. Fund
managers may look into the idea of offering mutual funds on various e-commerce portals,
financial products aggregator like Policybazaar.com, Paisabazaar.com, etc.
Policy thrust on Financial Inclusion: New policy focus on increasing the penetration of
Banking sector among the unbanked and rural areas through PMJDY- Pradhan Mantri Jan
Dhan Yojna, which will increase the willingness to save and lead to increase in financial
awareness. Ultimately, they will look for additional ways to park their excess funds for long-
term, and that's where asset manager and mutual funds come in.

9
6 Digital India, Banking and Mutual Fund
In the last three decades, the telecom industry has seen explosive growth with the liberalization
and opening up the industry to the private sector. The growth in mobile user base has connected
billions of population and opened up avenues for new businesses and huge employment
opportunity.
Today the mobile network had wider and deeper reach than banking sector which was
mandated to serve all over the India after their nationalization in the 1960s. This drift has
largely been attributed to poor management, large scale corruption, lack of reforms and less
technology-intensive processes.
With banks starting to embrace the technology, a new era of digital banking has arrived which
promises to widen the reach and reduce the cost of last mile delivery of services. The readily
available mobile network and rising digital literacy will fast-track the adoption of banking
services and bring the unbanked to the formal banking system.
The step by the central bank to award ten payment bank and another 11 small finance bank
licenses to new private enterprises will also usher competition to acquire new customers who
are not yet part of the system.
All these factors will give rise to awareness and raise the level of financial literacy. The newer
banking channels will also allow mutual fund houses to tap into more new channels of the
banking system and increase the penetration of mutual funds beyond T-15 cities with lower
costs.
10
7 Objective of Study
The study involves analysis of how different categories of mutual funds in India have
performed in various time periods, i.e. 1-yr, 3-yr and 5-yr and benchmarking their performance
with market index and analyzing trends in returns over last five calendar years.
It also examines the relation between mutual fund Net Asset Value Data and the closing price
of S&P BSE Sensex using day-wise NAV return data and day-wise return closing Index of
Sensex.
It also seeks to analyze the return generated by systematic investment plans and compare
returns for the timely investment plans versus lump sum investment returns over the similar
period for selected funds. It also attempts to evaluate the widespread belief that whether
Systematic Investment Plan is the better strategy when it comes to long-term investment and
compares its yield with lump sum investment return for the same period.
11
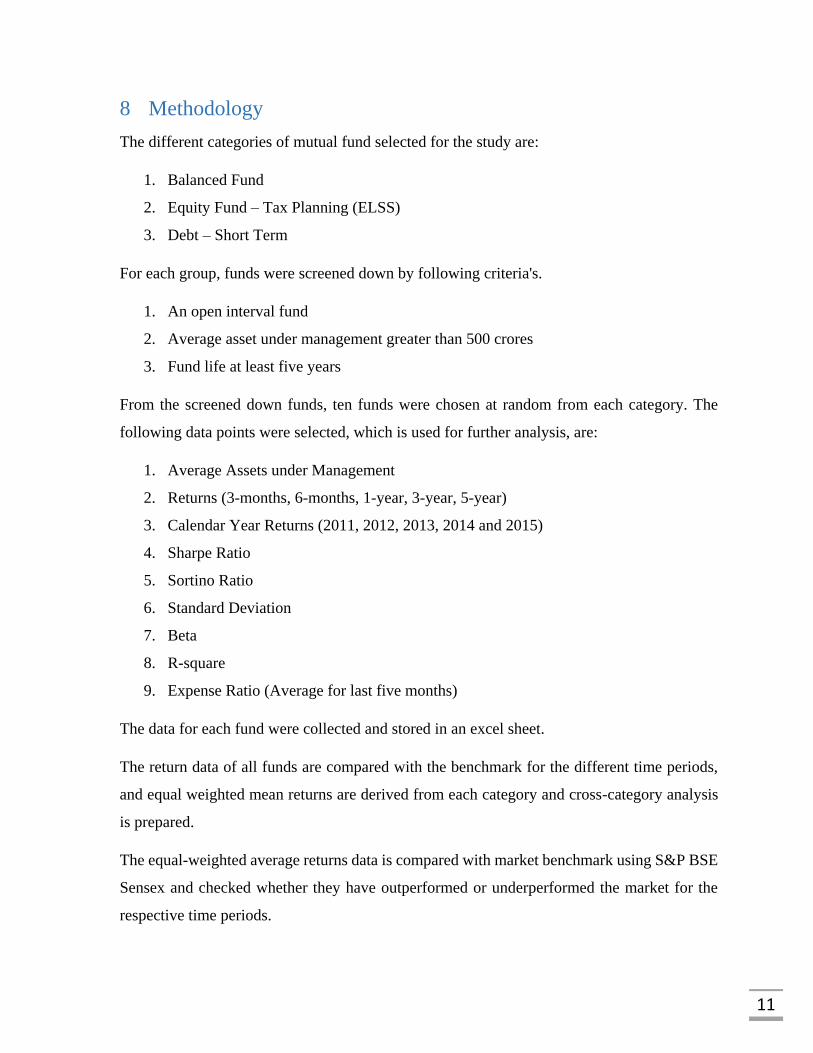
8 Methodology
The different categories of mutual fund selected for the study are:
1. Balanced Fund
2. Equity Fund – Tax Planning (ELSS)
3. Debt – Short Term
For each group, funds were screened down by following criteria's.
1. An open interval fund
2. Average asset under management greater than 500 crores
3. Fund life at least five years
From the screened down funds, ten funds were chosen at random from each category. The
following data points were selected, which is used for further analysis, are:
1. Average Assets under Management
2. Returns (3-months, 6-months, 1-year, 3-year, 5-year)
3. Calendar Year Returns (2011, 2012, 2013, 2014 and 2015)
4. Sharpe Ratio
5. Sortino Ratio
6. Standard Deviation
7. Beta
8. R-square
9. Expense Ratio (Average for last five months)
The data for each fund were collected and stored in an excel sheet.
The return data of all funds are compared with the benchmark for the different time periods,
and equal weighted mean returns are derived from each category and cross-category analysis
is prepared.
The equal-weighted average returns data is compared with market benchmark using S&P BSE
Sensex and checked whether they have outperformed or underperformed the market for the
respective time periods.

12
For the analysis of returns through SIP strategy and returns over a period, SIP calculator and
Return Calculator provided by MutualFundsIndia.com, online platform by ICRA, a Moody’s
Investor Services Company, was used for data on investment value using Systematic
Investment Plan and for a one-time investment.
For analyzing the relation between the return of mutual fund and market benchmark, day-wise
NAV data was collected by the online platform of Association of Mutual Funds in India
(AMFI). The day-wise closing values of S&P BSE Sensex is obtained from Yahoo India
Finance, for the period ranging five years for the financial year 2011-12 to 2015-16.
The day-wise values were checked for errors and exported to MS Access. Using date as
primary key and defining relationship between NAV Table and Sensex Table, the report was
generated and exported to MS Excel where daily returns were calculated and regressed.
13
9 Analysis
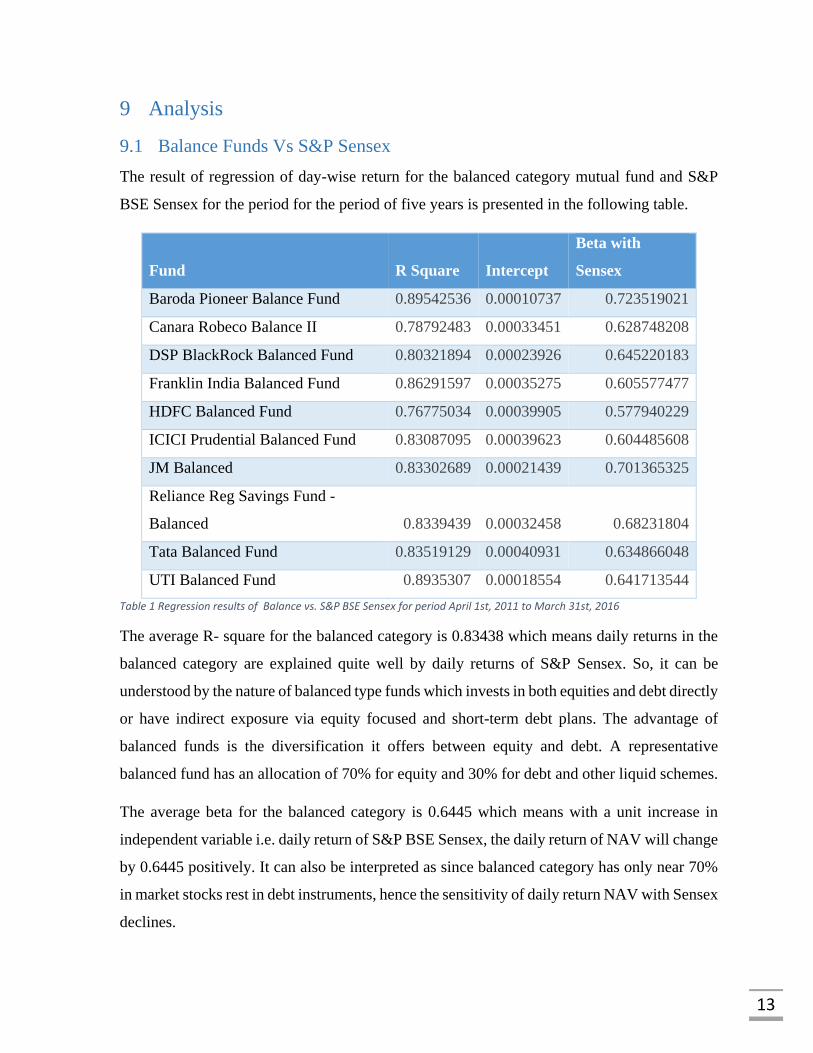
9.1 Balance Funds Vs S&P Sensex
The result of regression of day-wise return for the balanced category mutual fund and S&P
BSE Sensex for the period for the period of five years is presented in the following table.
Fund R Square Intercept
Beta with
Sensex
Baroda Pioneer Balance Fund 0.89542536 0.00010737 0.723519021
Canara Robeco Balance II 0.78792483 0.00033451 0.628748208
DSP BlackRock Balanced Fund 0.80321894 0.00023926 0.645220183
Franklin India Balanced Fund 0.86291597 0.00035275 0.605577477
HDFC Balanced Fund 0.76775034 0.00039905 0.577940229
ICICI Prudential Balanced Fund 0.83087095 0.00039623 0.604485608
JM Balanced 0.83302689 0.00021439 0.701365325
Reliance Reg Savings Fund -
Balanced 0.8339439 0.00032458 0.68231804
Tata Balanced Fund 0.83519129 0.00040931 0.634866048
UTI Balanced Fund 0.8935307 0.00018554 0.641713544
Table 1 Regression results of Balance vs. S&P BSE Sensex for period April 1st, 2011 to March 31st, 2016
The average R- square for the balanced category is 0.83438 which means daily returns in the
balanced category are explained quite well by daily returns of S&P Sensex. So, it can be
understood by the nature of balanced type funds which invests in both equities and debt directly
or have indirect exposure via equity focused and short-term debt plans. The advantage of
balanced funds is the diversification it offers between equity and debt. A representative
balanced fund has an allocation of 70% for equity and 30% for debt and other liquid schemes.
The average beta for the balanced category is 0.6445 which means with a unit increase in
independent variable i.e. daily return of S&P BSE Sensex, the daily return of NAV will change
by 0.6445 positively. It can also be interpreted as since balanced category has only near 70%
in market stocks rest in debt instruments, hence the sensitivity of daily return NAV with Sensex
declines.

14
9.2 Equity- ELSS Funds Vs S&P Sensex
The regression results for day-wise returns of Equity- ELSS category mutual fund and S&P
BSE Sensex for the same period of five years are presented in the following table.
Fund R Square Intercept Beta
Axis Long Term Equity Fund 0.82116963 0.00052868 0.775764
Birla Sun Life Tax Relief 96 0.86323986 0.00032641 0.847542
Canara Robeco Equity Taxsaver 0.86916871 0.00023065 0.862366
DSP BlackRock Tax Saver Fund 0.8530525 0.00031569 0.855451
Franklin India Taxshield 0.87355547 0.00036534 0.787544
HDFC TaxSaver 0.80970447 0.00015483 0.887136
ICICI Prudential LT Equity Fund -Tax
Saving 0.83702538 0.00030683 0.811816
Reliance Tax Saver-ELSS Fund 0.68225925 0.00040257 0.843683
SBI Magnum Tax Gain Scheme 93 0.90064232 0.00026457 0.856667
Sundaram Taxsaver 0.85550569 0.0001925 0.897937
Table 2 Regression results of Equity- ELSS vs. S&P BSE Sensex for period April 1st, 2011 to March 31st, 2016
The average R-square for the equity-ELSS category is 0.8365 which means daily returns of
S&P BSE Sensex explain daily returns of Equity-type funds decently. This performance can
be understood by the nature of Equity- ELSS funds which primarily invests in equities ranging
from large-cap to small-cap stocks. Sensex consists of only thirty stocks listed in Bombay
Stock Exchange, but the funds are much more diversified and have many small allocations to
various equities. This diversification is also reflected in the coefficient of Sensex daily return
or Beta, average for this category is 0.8426, which means with a unit change in Sensex return,
return in this category changes by only 0.8426.

15
9.3 Debt- Short Term Funds Vs S&P Sensex
The regression results for day-wise returns of Debt- Short Term category mutual fund and S&P
BSE Sensex for the similar period of five years are presented in the following table.
Fund R Square Intercept Beta
Birla Sun Life Medium Term Plan 0.01773889 0.00041704 0.012371
DSP BlackRock Income Opportunities Fund 0.04089601 0.000368 0.013246
Franklin India Short-Term Income Plan 0.03168071 0.000368 0.016446
HDFC Short Term Opportunities Fund 0.02932806 0.00037143 0.011549
HSBC Income Fund - Short Term 0.03668949 0.00033743 0.014226
ICICI Prudential Banking and PSU Debt Fund 0.02172309 0.00036889 0.012517
IDFC - SSIF - Medium Term 0.04490974 0.00034565 0.022788
Reliance Short Term Fund 0.03624142 0.00035757 0.017323
SBI Short Term Debt Fund 0.0404588 0.00035713 0.016034
UTI Short Term Income Fund 0.04804861 0.00038228 0.017806
Table 3 Regression results of Debt-Short Term vs. S&P BSE Sensex for period April 1st, 2011 to March 31st, 2016
The R-square for the regression between the daily return of short-term debt funds and S&P
BSE Sensex is 0.03477, which is lowest among the three categories. It can be interpreted as
movements in Sensex values doesn't explain the changes in NAV values of Debt category
mutual funds.
This weak correlation is evident from the fact that Debt oriented mutual funds invest only debt
securities or something which has significant debt component or characteristics. These type of
securities offers fixed returns over the holding period. But from the regression result, it is
evident that there is a small amount of correlation between both variables. This case might be
because both equity market and debt market move when there is a change in interest rate or
any significant macroeconomic events. For example, when the central bank increases policy
rate, so market interest rate also increases. This increase affects both equity stocks and debt
instruments since there is some reallocation of the portfolio. So the small amount of correlation
can be explained by these events.
The average coefficient of S&P BSE Sensex is 0.015 which is insignificant and near to zero.

16
9.4 Sortino Ratio Vs Sharpe Ratio
The Sortino ratio is the measure of risk-adjusted return of the portfolio using only downside
risk. It is a modified version of Sharpe Ratio which uses total risk or volatility in the
denominator. The purpose of Sortino was to differentiate between loss volatility and profit
volatility, and it accounts only for downside deviation. A higher Sortino Ratio indicates lower
chances of significant losses for a given excess return.
Sharpe Ratio is the measure of risk-adjusted return of portfolio using total deviation in the
portfolio. It indicates the amount of excess return per unit of total risk. Higher the Sharpe Ratio,
more attractive is the portfolio performance.
Sortino Ratio= R−RF
σd,
where R= Actual Return on Asset
RF= Risk-Free Rate of Return
σd= Standard Deviation of Negative Asset
Returns
Sharpe Ratio= RP−RF
σP,
where RP= Expected Portfolio Return
RF= Risk-Free Rate of Return
σP= Standard Deviation of Portfolio
17
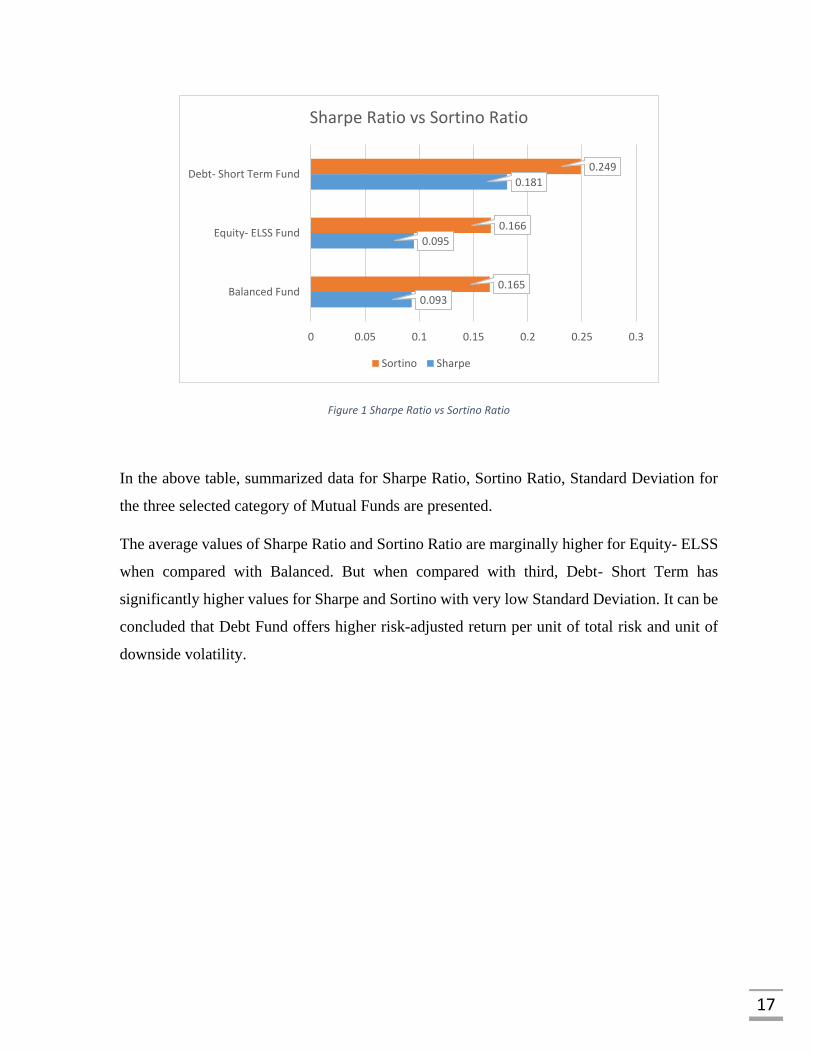
Figure 1 Sharpe Ratio vs Sortino Ratio
In the above table, summarized data for Sharpe Ratio, Sortino Ratio, Standard Deviation for
the three selected category of Mutual Funds are presented.
The average values of Sharpe Ratio and Sortino Ratio are marginally higher for Equity- ELSS
when compared with Balanced. But when compared with third, Debt- Short Term has
significantly higher values for Sharpe and Sortino with very low Standard Deviation. It can be
concluded that Debt Fund offers higher risk-adjusted return per unit of total risk and unit of
downside volatility.
0.093
0.095
0.181
0.165
0.166
0.249
0 0.05 0.1 0.15 0.2 0.25 0.3
Balanced Fund
Equity- ELSS Fund
Debt- Short Term Fund
Sharpe Ratio vs Sortino Ratio
Sortino Sharpe
18
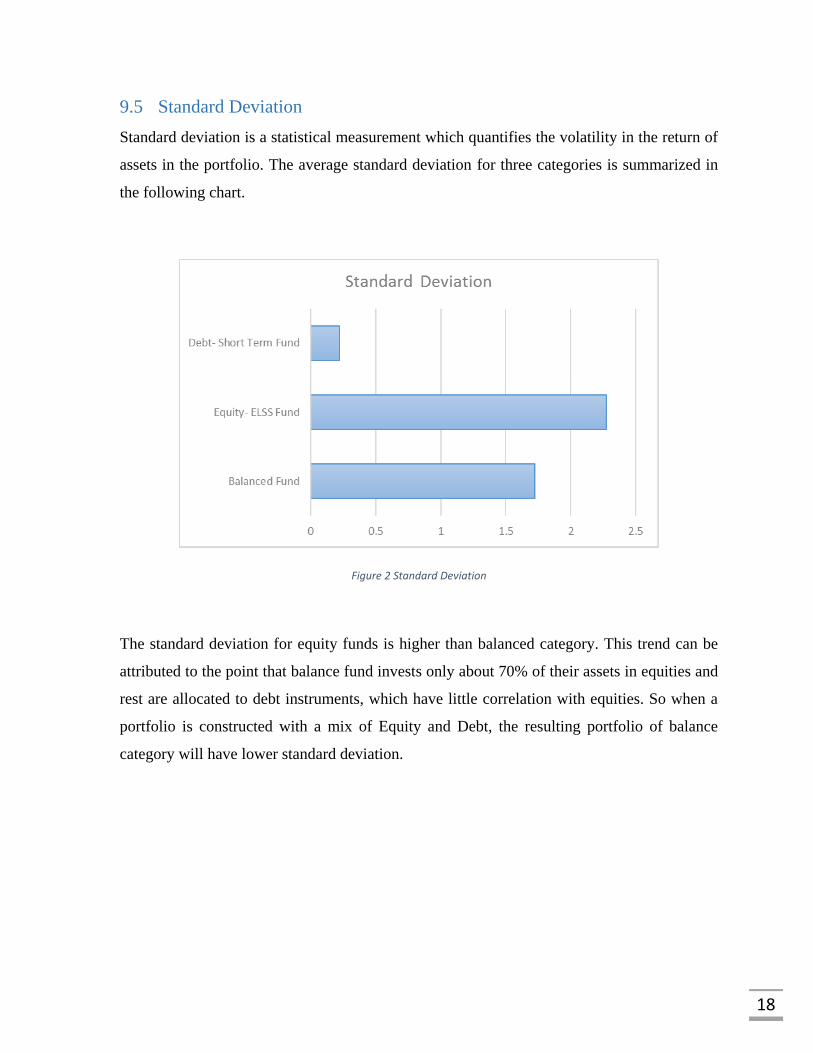
9.5 Standard Deviation
Standard deviation is a statistical measurement which quantifies the volatility in the return of
assets in the portfolio. The average standard deviation for three categories is summarized in
the following chart.
Figure 2 Standard Deviation
The standard deviation for equity funds is higher than balanced category. This trend can be
attributed to the point that balance fund invests only about 70% of their assets in equities and
rest are allocated to debt instruments, which have little correlation with equities. So when a
portfolio is constructed with a mix of Equity and Debt, the resulting portfolio of balance
category will have lower standard deviation.
19
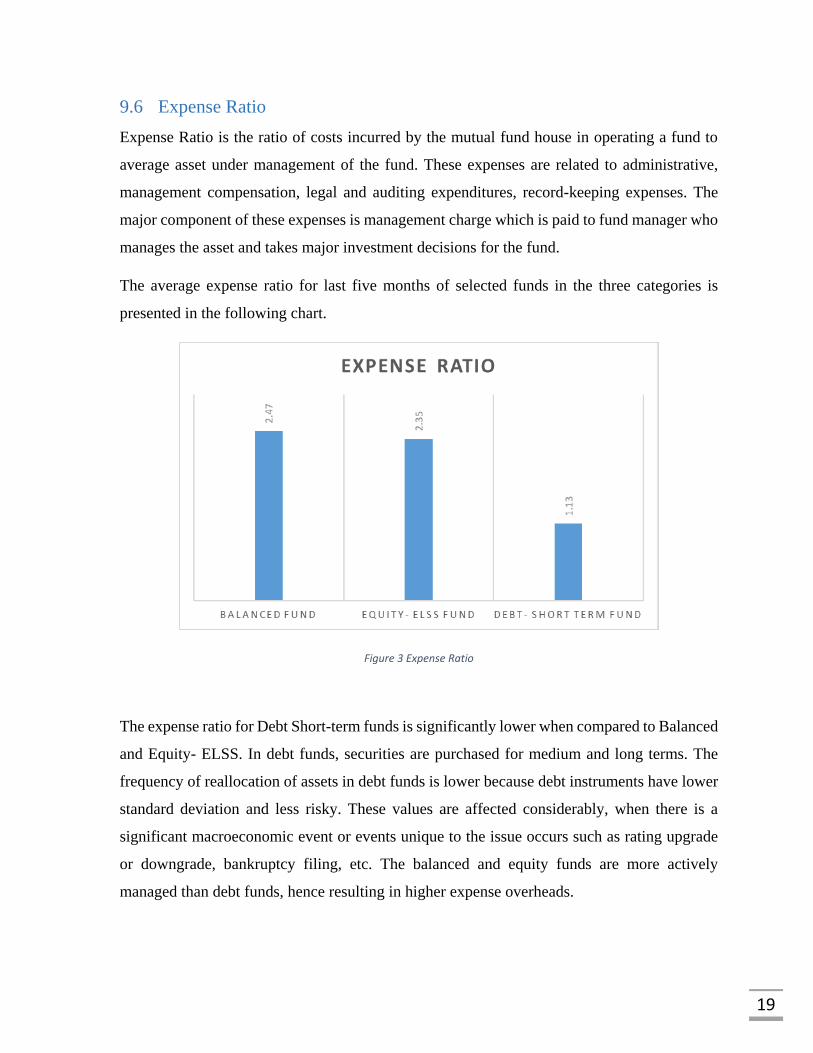
9.6 Expense Ratio
Expense Ratio is the ratio of costs incurred by the mutual fund house in operating a fund to
average asset under management of the fund. These expenses are related to administrative,
management compensation, legal and auditing expenditures, record-keeping expenses. The
major component of these expenses is management charge which is paid to fund manager who
manages the asset and takes major investment decisions for the fund.
The average expense ratio for last five months of selected funds in the three categories is
presented in the following chart.
Figure 3 Expense Ratio
The expense ratio for Debt Short-term funds is significantly lower when compared to Balanced
and Equity- ELSS. In debt funds, securities are purchased for medium and long terms. The
frequency of reallocation of assets in debt funds is lower because debt instruments have lower
standard deviation and less risky. These values are affected considerably, when there is a
significant macroeconomic event or events unique to the issue occurs such as rating upgrade
or downgrade, bankruptcy filing, etc. The balanced and equity funds are more actively
managed than debt funds, hence resulting in higher expense overheads.

20
10 SIP Yield Vs Annualized Return of Lump Sum Investment
Figure 4 Balanced: SIP Yield vs Annualized Return
Figure 5 Equity-ELSS: SIP Yield vs Annualized Return
0
2
4
6
8
10
12
14
16
18
BarodaPioneerBalance
Fund
CanaraRobeco
Balance II
DSPBlackRockBalanced
Fund
FranklinIndia
BalancedFund
HDFCBalanced
Fund
ICICIPrudentialBalanced
Fund
JMBalanced
RelianceRegularSavingsFund -
Balanced
TataBalanced
Fund
UTIBalanced
Fund
Balanced: SIP Yield vs Annualized Return
SIP Yield (%) Return from One-time Investment (%)
0
5
10
15
20
25
Axis LongTermEquityFund
Birla SunLife Tax
Relief 96
CanaraRobecoEquity
Taxsaver
DSPBlackRockTax Saver
Fund
FranklinIndia
Taxshield
HDFCTaxSaver
ICICIPrudential
LongTermEquity
Fund (TaxSaving)
RelianceTax Saver
(ELSS)Fund
SBIMagnumTax GainScheme
93
SundaramTaxsaver
Equity-ELSS: SIP Yield vs Annualized Return
SIP Yield (%) Return from One-time Investment (%)
21
This section attempts to find that does investment through systematic investment plans
generate superior returns when compared to annualized returns from one-time investment
using a sample period of five years starting from April 1st, 2011 to March 31st, 2016.
For the systematic investment plan analysis, monthly installments of Rs. 1000 at starting of
each month for 60 months is considered, an investment totaling Rs. 60,000.
For annualized returns analysis, lump sum investment of same amount i.e. Rs. 60000 is
considered, which is invested on April 1st, 2011.
The SIP means investing the constant amount of money in a mutual fund plan on a regular
basis regardless of its NAV value, or market sentiments at a fixed interval say weekly or
monthly for a period. When the person chooses to invests fixed amount via SIP, he buys more
units of mutual funds when NAV price is lower and buys fewer units of the mutual fund when
NAV price is higher. This approach leads to averaging of cost, which results in a lower average
cost per unit of the mutual fund. This lower cost automatically increases the gains from
investment when compared to lump sum investment which carries the risk of investing at a
higher price than the average price of the holding period. The advantage of SIPs is that it
ensures that investments are not ill-timed.
SIPs also correct the psychical error of investing more in when the market is uptrend and
reaching new high and selling off when there is a downtrend. Here the average cost of
investment is greater, and the investor doesn't take advantage of lower prices which can drive
down the cost of investment and hence resulting in less profit. SIP strategy takes care of this
problem as it buys more unit of stock when the price is lower and less unit of stock when the
price is higher.
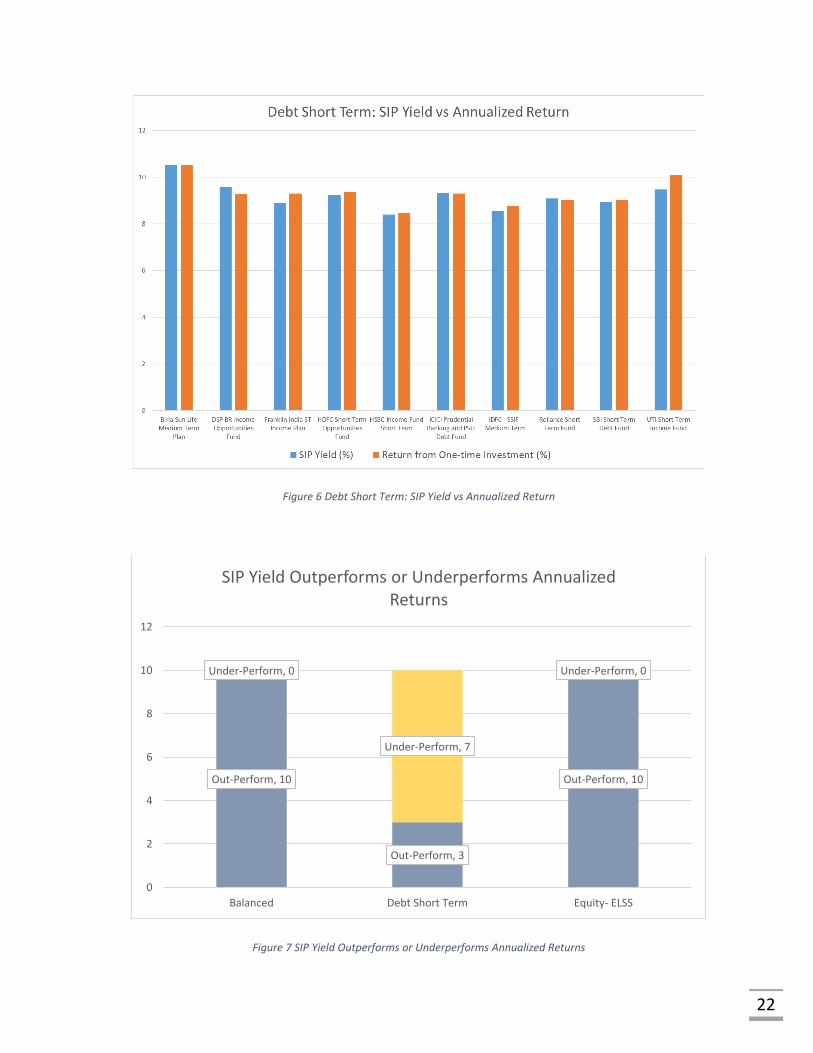
From the analysis of selected funds in the Balanced and Equity- ELSS categories, the yield of
SIP strategy outperforms the returns of lump sum investments for all the ten funds in each
category.
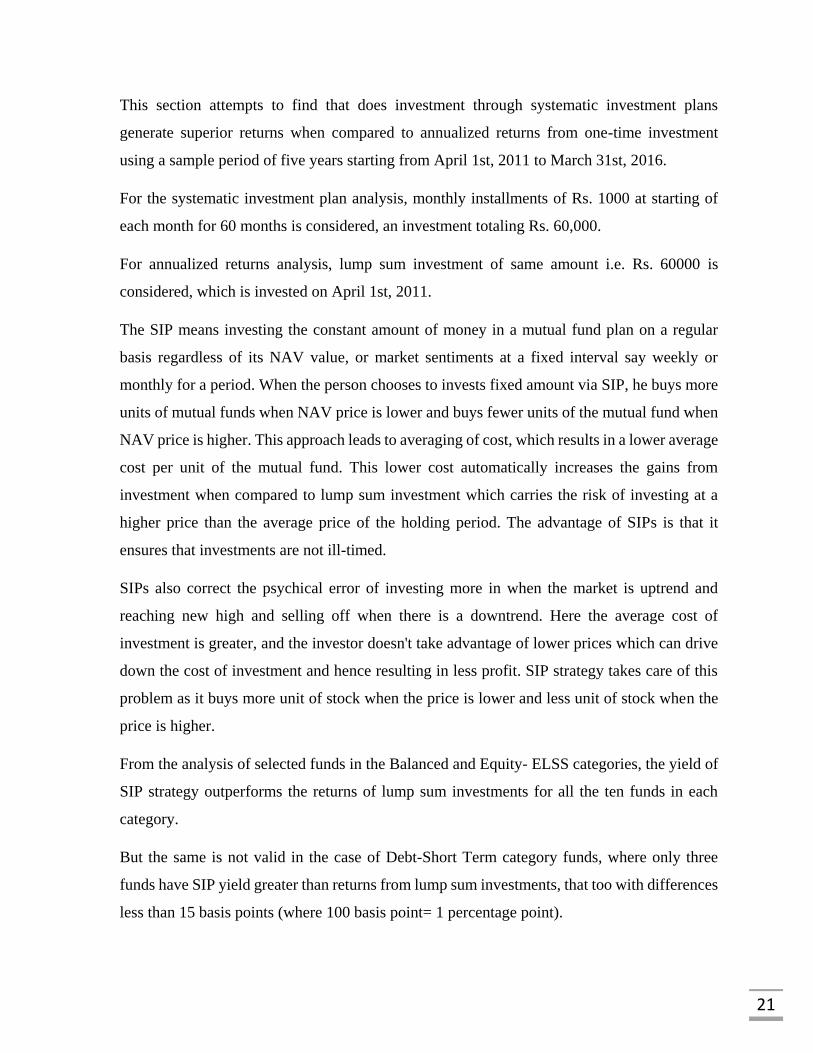
But the same is not valid in the case of Debt-Short Term category funds, where only three
funds have SIP yield greater than returns from lump sum investments, that too with differences
less than 15 basis points (where 100 basis point= 1 percentage point).
22
Figure 6 Debt Short Term: SIP Yield vs Annualized Return
Figure 7 SIP Yield Outperforms or Underperforms Annualized Returns
Out-Perform, 10
Out-Perform, 3
Out-Perform, 10
Under-Perform, 0
Under-Perform, 7
Under-Perform, 0
0
2
4
6
8
10
12
Balanced Debt Short Term Equity- ELSS
SIP Yield Outperforms or Underperforms Annualized Returns
23
11 Regression of Calendar Returns for Balanced Vs Equity and Debt
The calendar years returns for the period 2011 to 2015 for selected mutual funds of each
category were collected. For the multiple regression, average returns for the balanced group is
taken as the dependent variable, and average returns for equity and debt categories is taken as
an independent variable.
The following result were obtained:
Equation: y = 0.721948(x1) + 0.186598(x2)
where y = Returns for Balanced Funds;
x1= Returns for Equity- ELSS Funds;
x2= Returns for Debt- Short Term Funds
R-Square: 𝑅2 = 0.999778
From the results, we can infer that balanced category returns can be explained quite well by
returns of equity and debt funds. The interesting part of the outcome is the coefficient of x1
i.e. returns of equity which equals 0.722.
For a typical balanced mutual fund, nearly 70 percent of the funds are allocated to equity
oriented assets and rest for debt and other liquid assets. The results from multiple regression
conform to this point.
24
12 Conclusion
This study on mutual funds is centered around only three categories of the mutual fund. With
many new fund houses setting up their shops in India after liberalization of regulations,
investors are presented with a lot of options. In these years, every fund houses have launched
copious schemes in each category, with little differentiation in investment strategy and risk
factors. Sector experts often relate this to the psychological behavior of investors, who find it
easier to invest their money in New Fund Offers(NFO) than in similar existing schemes. This
preferring is the case because new mutual fund units are priced lower, at the base value, than
the NAV price of existing schemes. However, this issue has been taken up by regulator and
fund houses have been asked to merge similar schemes. This step will surely help first-time
investors in choosing what funds to invest in and reduce the efforts and confusion in the process
of making the most suitable and informed decision.
In the last decade, Indian markets have seen many bull-bear cycles. From the study, we have
seen movements in market index explain the returns in mutual funds quite well. Investors are
moved by returns in an uptrend market and get bullish in making their investment decisions.
But in the case of downtrend market, they sell off their investment, often at prices lower than
buy price, incurring significant losses. Investors always try to time their investment with the
market in these ways, and they are averse to make further investment in future after facing
losses. These investment decisions are not rational. The most basic rule of investment is to buy
cheap and sell high, which is often ignored by purchasing in a bullish market and selling in a
bearish market. The systematic investment plan, introduced around 2007, has become very
popular among small and salaried investor. Investment by SIP strategy avoids timing market
and has generated superior returns in most cases, which is also shown in the study. SIP
approach maintains discipline and regularity in investment, which is the key to long-term
wealth generation.
Though the Indian mutual fund industry has seen remarkable growth in these years, yet it has
not realized its potential. The assets under management of the industry are heavily skewed
towards top-20 cities of India. Several efforts by industry to increase penetration beyond top
15 cities has not made any significant achievement, mainly due to structural and logistical
challenges. In the coming years, the investment from top cities will start to approach saturation

25
and next round of growth can only be fueled by the investor from small cities. With the increase
in communication technologies, penetration of print and electronic media in smaller cities,
people are now exposed to information related to stock market and mutual fund. With rising
digital literacy and financial awareness, these investors have grown more confident and
comfortable while investing in newer instruments such as mutual funds. But the non-
availability of ground level support and reach of decentralized structure of mutual fund
distribution are the primary roadblocks to the growth of mutual funds.
But with renewed focus on increasing penetration of banking system in smaller cities and rural
India, schemes such as Jan-Dhan Yojna, Digital India, etc. have the potential to create new
channels of mutual fund distribution in these areas. Widened reach of Aadhaar and their linking
with bank accounts will smoothen the paperwork requirements and offer the investors to opt
for Systematic Investment Plans by transferring money automatically from their bank
accounts.
These initiatives will gradually improve the financial health of Indian households and offer
long-term wealth generation by regular savings. These drives will open newer streams of the
long-term fund for Indian financial market and reduce the volatility created by short-term
investments and FIIs, leading more deepened markets and robust financial system.
26
13 References
AMFI, 2016. Net Asset Value of Mutual Funds | Nav History Download. [Online]
Available at: https://www.amfiindia.com/nav-history-download
[Accessed 17 April 2016].
ASSOCHAM India, ICRA Online, Nov 2015. Indian Mutual Fund Industry: The Road
Ahead, Navi Mumbai, India: ICRA Online Limited.
Chakrabarti, R., Malik, S., Khairnar, S. & Verma, A., 2014. Penetration of Mutual Funds in
India: Opportunities and Challenges. SEBI Working Paper.
Investopedia, 2014. Sortino Ratio. [Online]
Available at: http://www.investopedia.com/terms/s/sortinoratio.asp
[Accessed 17 April 2016].
Investopedia, 2014. Understanding The Sharpe Ratio. [Online]
Available at: http://www.investopedia.com/articles/07/sharpe_ratio.asp
[Accessed 17 April 2016].
Manjrekar, R. & Sinha, P., May 2010. Myopic Investment View of the Indian Mutual Fund
Industry. Economic and Political Weekly.
MutualFundsIndia.com, 2016. SIP Calculator. [Online]
Available at: https://www.mutualfundindia.com/Mf/Performance/SIP
[Accessed 17 April 2016].
Research Desk, Value Research Online, 2015. Are SIPs always better than lump sum?.
[Online]
Available at: http://www.valueresearchonline.com/story/23987
[Accessed 17 April 2016].
Somashekar, T. S., 2009. Mutual Fund Regulation in India-Assessing its Benefits. The
International Lawyer.
Yahoo! India Finance, 2016. BSESN Historical Prices | S&P BSE SENSEX Stock. [Online]
Available at: https://in.finance.yahoo.com/q/hp?s=%5EBSESN
[Accessed 17 April 2016].