the way ahead: creating long-term shareholder value
TRANSCRIPT
The Way Ahead: Creating Long-Term Shareholder Value
2014 Annual Meeting of Shareholders
May 14, 2014
2
Forward-looking Statements This presentation contains forward-looking statements as defined by United States securities laws, including statements relating to our goals and expectations regarding our business, financial and capital condition, results of operations,
investment portfolio performance and strategies, the financial and market outlook, dividend and share repurchase plans, governmental and regulatory initiatives and developments, and the business environment. Forward-looking statements
are often, but not always, identified by such forward-looking terminology as "plan," "expect,“ ”intend,” “forecast,” “outlook," "believe," "anticipate," "estimate," "seek," "may," "will," "trend," "target," “objective”, "strategy" and "goal," or similar
statements or variations of such terms. These statements are not guarantees of future performance, are inherently uncertain, are based on current assumptions that are difficult to predict and involve a number of risks and uncertainties.
Therefore, actual outcomes and results may differ materially from what is expressed in those statements, and those statements should not be relied upon as representing our expectations or beliefs as of any date subsequent to May 14, 2014.
Important factors that may affect future results and outcomes include, but are not limited to: the financial strength and continuing viability of the counterparties with which we or our clients do business and to which we have investment, credit or
financial exposure, including, for example, the direct and indirect effects on counterparties of the sovereign-debt risks in the U.S., Europe and other regions; increases in the volatility of, or declines in the level of, our net interest revenue,
changes in the composition or valuation of the assets recorded in our consolidated statement of condition (and our ability to measure the fair value of investment securities) and the possibility that we may change the manner in which we fund
those assets; the liquidity of the U.S. and international securities markets, particularly the markets for fixed-income securities and inter-bank credits, and the liquidity requirements of our clients; the level and volatility of interest rates and the
performance and volatility of securities, credit, currency and other markets in the U.S. and internationally; the credit quality, credit-agency ratings and fair values of the securities in our investment securities portfolio, a deterioration or
downgrade of which could lead to other-than-temporary impairment of the respective securities and the recognition of an impairment loss in our consolidated statement of income; our ability to attract deposits and other low-cost, short-term
funding, and our ability to deploy deposits in a profitable manner consistent with our liquidity requirements and risk profile; the manner and timing with which the Federal Reserve and other U.S. and foreign regulators implement the Dodd-
Frank Act, changes to the Basel III capital framework and European legislation, such as the Alternative Investment Fund Managers Directive and Undertakings for Collective Investment in Transferable Securities Directives, with respect to the
levels of regulatory capital we must maintain, our credit exposure to third parties, margin requirements applicable to derivatives, banking and financial activities and other regulatory initiatives in the U.S. and internationally, including regulatory
developments that result in changes to our structure or operating model, increased costs or other changes to how we provide services; adverse changes in the regulatory capital ratios that we are required or will be required to meet, whether
arising under the Dodd-Frank Act or the Basel III capital and liquidity standards, or due to changes in regulatory positions, practices or regulations in jurisdictions in which we engage in banking activities, including changes in internal or
external data, formulae, models, assumptions or other advanced systems used in the calculation of our capital ratios that cause changes in those ratios as they are measured from period to period; increasing requirements to obtain the prior
approval of the Federal Reserve or our other regulators for the use, allocation or distribution of our capital or other specific capital actions or programs, including acquisitions, dividends and equity purchases, without which our growth plans,
distributions to shareholders, equity purchase programs or other capital initiatives may be restricted; changes in law or regulation, or the enforcement of law or regulation, that may adversely affect our business activities or those of our clients
or our counterparties, and the products or services that we sell, including additional or increased taxes or assessments thereon, capital adequacy requirements, margin requirements and changes that expose us to risks related to the
adequacy of our controls or compliance programs; financial market disruptions or economic recession, whether in the U.S., Europe, Asia or other regions; our ability to promote a strong culture of risk management, operating controls,
compliance oversight and governance that meet our expectations and those of our clients and our regulators; the results of, and costs associated with, governmental or regulatory inquiries and investigations, litigation and similar claims,
disputes, or proceedings; delays or difficulties in the execution of our previously announced Business Operations and Information Technology Transformation program, which could lead to changes in our estimates of the charges, expenses or
savings associated with the planned program and may cause volatility of our earnings; the potential for losses arising from our investments in sponsored investment funds; the possibility that our clients will incur substantial losses in investment
pools for which we act as agent, and the possibility of significant reductions in the liquidity or valuation of assets underlying those pools; our ability to anticipate and manage the level and timing of redemptions and withdrawals from our
collateral pools and other collective investment products; the credit agency ratings of our debt and depository obligations and investor and client perceptions of our financial strength; adverse publicity, whether specific to State Street or
regarding other industry participants or industry-wide factors, or other reputational harm; our ability to control operational risks, data security breach risks and outsourcing risks, and our ability to protect our intellectual property rights, the
possibility of errors in the quantitative models we use to manage our business and the possibility that our controls will prove insufficient, fail or be circumvented; dependencies on information technology and our ability to control related risks,
including cyber-crime and other threats to our information technology infrastructure and systems and their effective operation both independently and with external systems, and complexities and costs of protecting the security of our systems
and data; our ability to grow revenue, control expenses, attract and retain highly skilled people and raise the capital necessary to achieve our business goals and comply with regulatory requirements; changes or potential changes to the
competitive environment, including changes due to regulatory and technological changes, the effects of industry consolidation and perceptions of State Street as a suitable service provider or counterparty; changes or potential changes in how
and in what amounts clients compensate us for our services, and the mix of services provided by us that clients choose; our ability to complete acquisitions, joint ventures and divestitures, including the ability to obtain regulatory approvals, the
ability to arrange financing as required and the ability to satisfy closing conditions; the risks that our acquired businesses and joint ventures will not achieve their anticipated financial and operational benefits or will not be integrated
successfully, or that the integration will take longer than anticipated, that expected synergies will not be achieved or unexpected negative synergies will be experienced, that client and deposit retention goals will not be met, that other
regulatory or operational challenges will be experienced, and that disruptions from the transaction will harm our relationships with our clients, our employees or regulators; our ability to recognize emerging needs of our clients and to develop
products that are responsive to such trends and profitable to us, the performance of and demand for the products and services we offer, and the potential for new products and services to impose additional costs on us and expose us to
increased operational risk; changes in accounting standards and practices; and changes in tax legislation and in the interpretation of existing tax laws by U.S. and non-U.S. tax authorities that affect the amount of taxes due.
Other important factors that could cause actual results to differ materially from those indicated by any forward-looking statements are set forth in our 2013 Annual Report on Form 10-K and our subsequent SEC filings. We encourage investors
to read these filings, particularly the sections on risk factors, for additional information with respect to any forward-looking statements and prior to making any investment decision. The forward-looking statements contained in this presentation
speak only as of the date hereof, May 14, 2014, and we do not undertake efforts to revise those forward-looking statements to reflect events after that date.

3
The Way Ahead
Agenda
● 2013 Performance
● 2014 First Quarter Results
● Focused Strategy
● Summary

4
2013 Performance
5
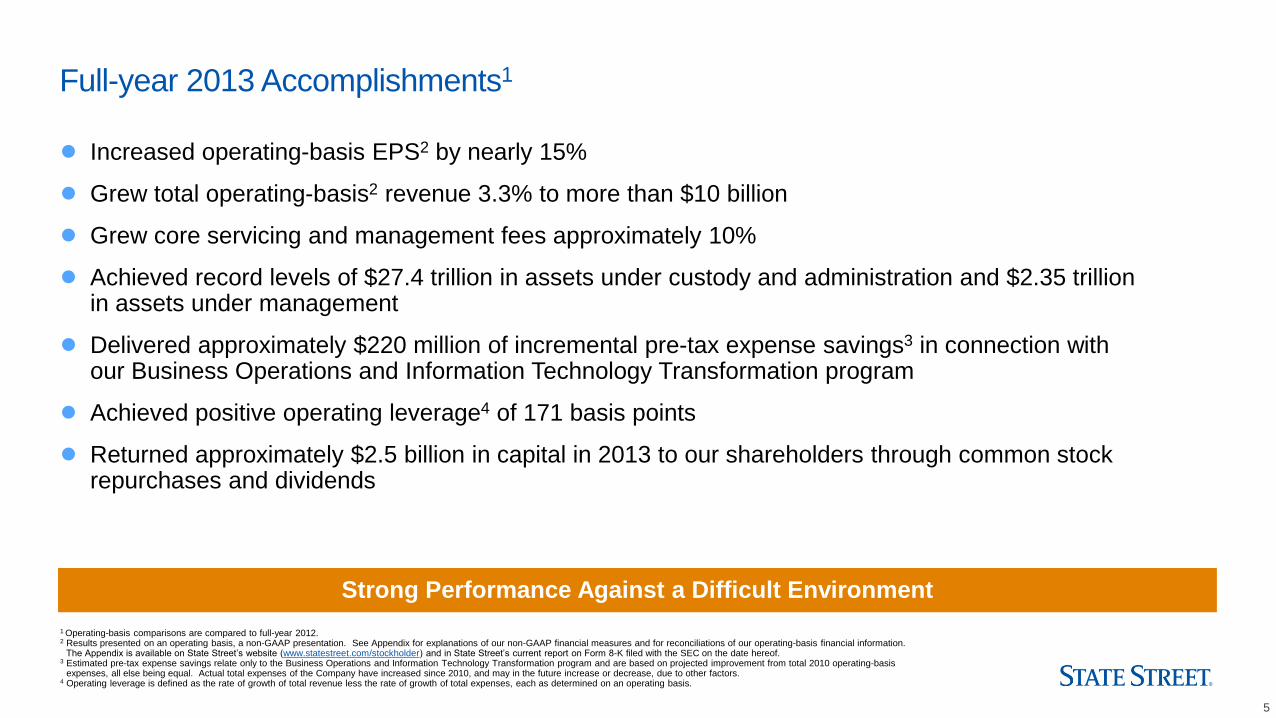
Full-year 2013 Accomplishments1
● Increased operating-basis EPS2 by nearly 15%
● Grew total operating-basis2 revenue 3.3% to more than $10 billion
● Grew core servicing and management fees approximately 10%
● Achieved record levels of $27.4 trillion in assets under custody and administration and $2.35 trillion in assets under management
● Delivered approximately $220 million of incremental pre-tax expense savings3 in connection with our Business Operations and Information Technology Transformation program
● Achieved positive operating leverage4 of 171 basis points
● Returned approximately $2.5 billion in capital in 2013 to our shareholders through common stock repurchases and dividends
1 Operating-basis comparisons are compared to full-year 2012. 2 Results presented on an operating basis, a non-GAAP presentation. See Appendix for explanations of our non-GAAP financial measures and for reconciliations of our operating-basis financial information.
The Appendix is available on State Street’s website (www.statestreet.com/stockholder) and in State Street’s current report on Form 8-K filed with the SEC on the date hereof. 3 Estimated pre-tax expense savings relate only to the Business Operations and Information Technology Transformation program and are based on projected improvement from total 2010 operating-basis
expenses, all else being equal. Actual total expenses of the Company have increased since 2010, and may in the future increase or decrease, due to other factors. 4 Operating leverage is defined as the rate of growth of total revenue less the rate of growth of total expenses, each as determined on an operating basis.
Strong Performance Against a Difficult Environment
6
1 (i) Data for each of State Street Corporation (STT), The Bank of New York Mellon Corporation (BK) and Northern Trust Corporation (NTRS) is derived from the relevant company’s public filings, earnings announcements or related materials (individually or collectively, “publicly disclosed information”), (ii) data from the relevant company’s publicly disclosed information is presented on a non-GAAP basis, which presentation is described, at the discretion of the relevant company, in that company’s publicly disclosed information as “operating basis,” “operating,” “adjusted” or “non-GAAP” (individually or collectively, “non-GAAP presentation”); and (iii) each company’s non-GAAP presentation is calculated differently and therefore may not be comparable to other companies’ non-GAAP presentations. Please review each company’s publicly disclosed information for a description, to the extent contained therein, of that company’s non-GAAP presentation. See Appendix for explanations of our non-GAAP financial measures and for reconciliations of our operating-basis financial information. The Appendix is available on State Street’s website (www.statestreet.com/stockholder) and in State Street’s current report on Form 8-K filed with the SEC on the date hereof.
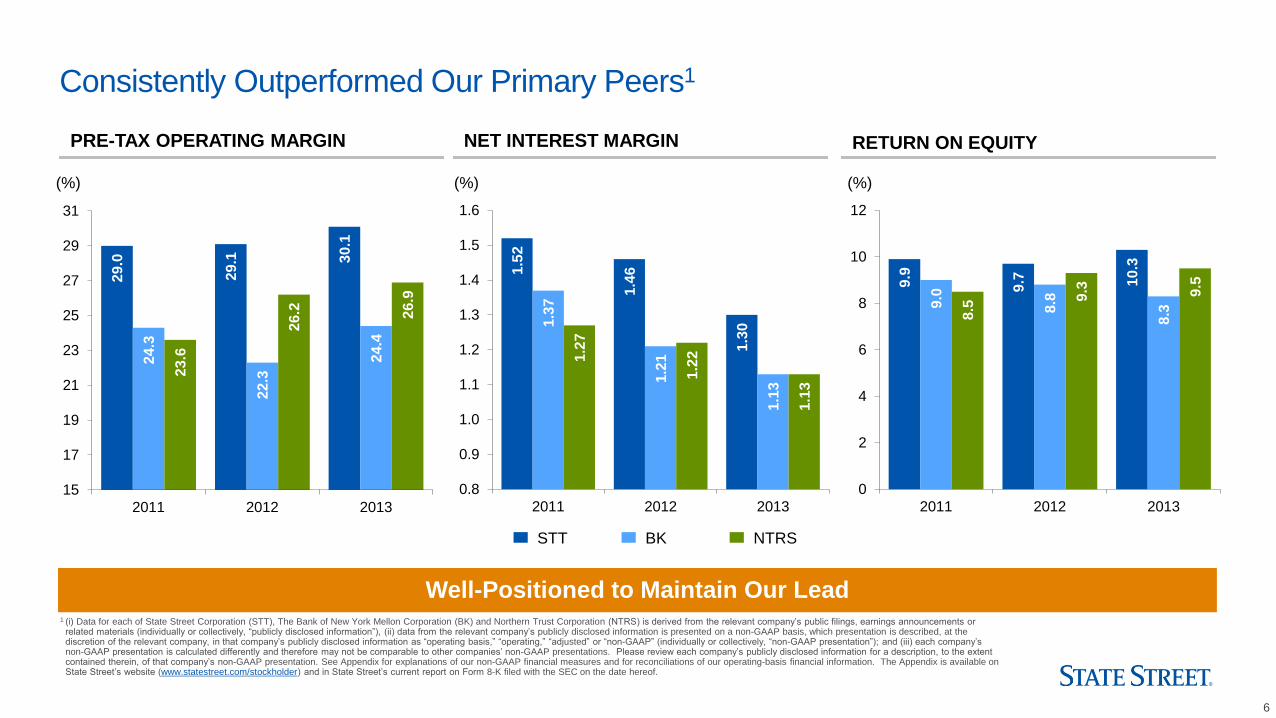
Consistently Outperformed Our Primary Peers1
(%) (%) (%)
PRE-TAX OPERATING MARGIN NET INTEREST MARGIN RETURN ON EQUITY
29.0
29.1
30.1
24.3
22.3
24.4
23.6
26.2
26.9
15
17
19
21
23
25
27
29
31
2011 2012 2013
9.9
9.7
10.3
9.0
8.8
8.3
8.5
9.3
9.5
0
2
4
6
8
10
12
2011 2012 20131
.52
1.4
6
1.3
0 1.3
7
1.2
1
1.1
3
1.2
7
1.2
2
1.1
3
0.8
0.9
1.0
1.1
1.2
1.3
1.4
1.5
1.6
2011 2012 2013
STT BK NTRS
Well-Positioned to Maintain Our Lead
7
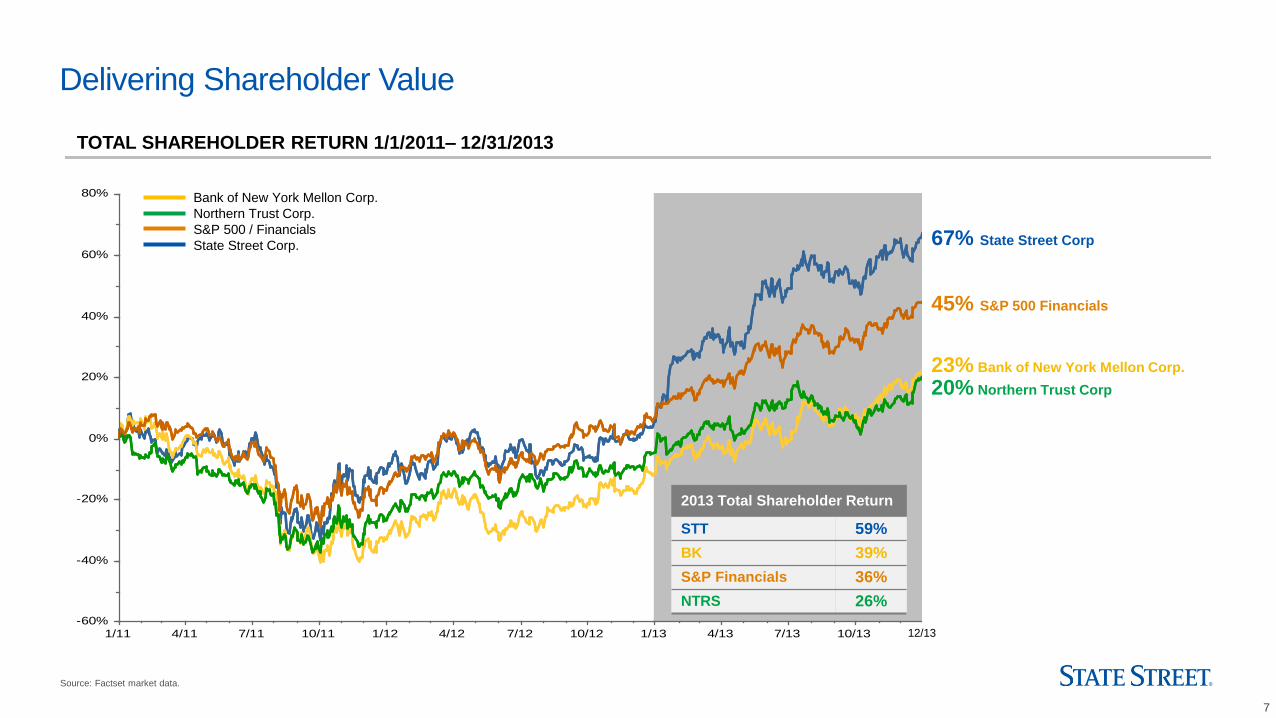
Source: Factset market data.
Delivering Shareholder Value
TOTAL SHAREHOLDER RETURN 1/1/2011– 12/31/2013
1/11 4/11 7/11 10/11 1/12 4/12 7/12 10/12 1/13 4/13 7/13 10/13
-60%
-40%
-20%
0%
20%
40%
60%
80%
67% State Street Corp
23% Bank of New York Mellon Corp.
20% Northern Trust Corp
45% S&P 500 Financials
Bank of New York Mellon Corp.
Northern Trust Corp.
S&P 500 / Financials
State Street Corp.
12/13
2013 Total Shareholder Return
STT 59%
BK 39%
S&P Financials 36%
NTRS 26%

8
2014 First-Quarter Results

9
First-Quarter 2014 Results
Compared to the First Quarter of 2013
● First-quarter 2014 operating-basis1 EPS of $0.99, increased 3.1%
● Total operating-basis1 revenue of $2.56 billion, up 3.6%
● Core total asset servicing and asset management fees increased 6.4%
● Market-driven revenue remained under pressure
● Higher expenses impacted by increasing compliance requirements
● Return of capital to shareholders continues to be a priority
1 Results presented on an operating basis, a non-GAAP presentation. See Appendix for explanations of our non-GAAP financial measures and for reconciliations of our operating-basis financial information. The Appendix is available on State Street’s website (www.statestreet.com/stockholder) and in State Street’s current report on Form 8-K filed with the SEC on the date hereof.
Continuing to Perform in a Challenging Environment
10
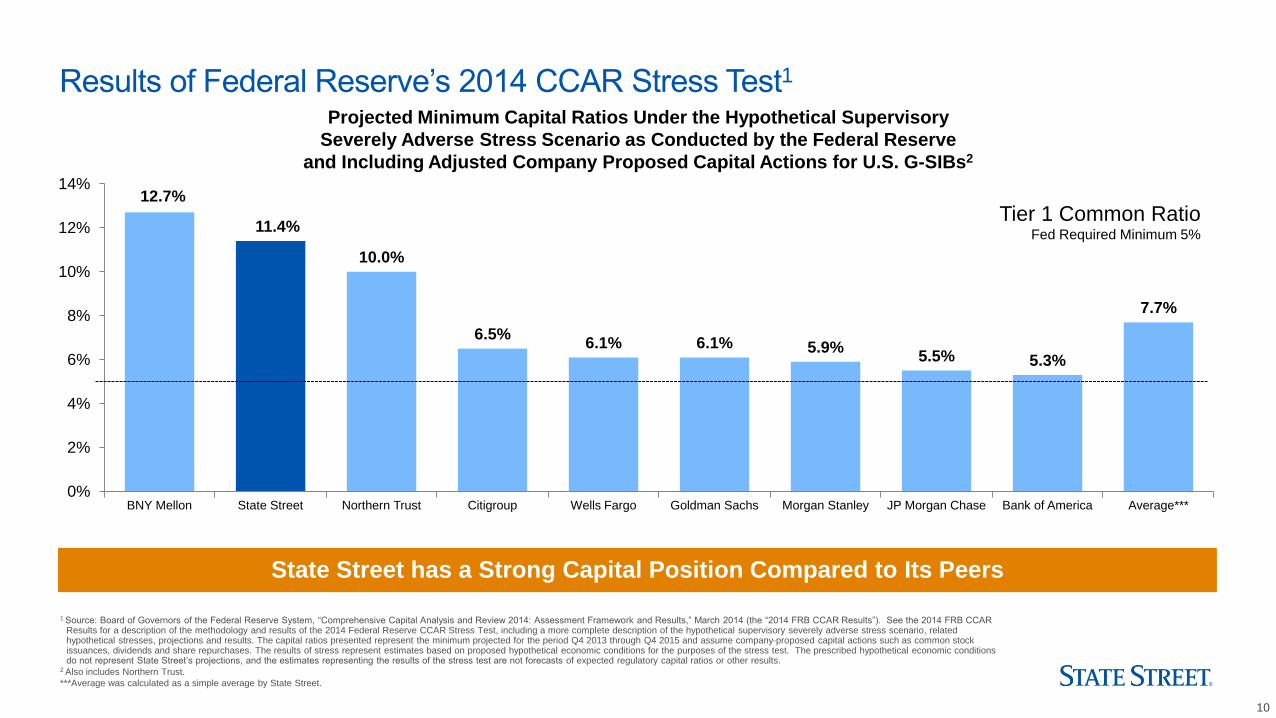
12.7%
11.4%
10.0%
6.5% 6.1% 6.1% 5.9%
5.5% 5.3%
7.7%
0%
2%
4%
6%
8%
10%
12%
14%
BNY Mellon State Street Northern Trust Citigroup Wells Fargo Goldman Sachs Morgan Stanley JP Morgan Chase Bank of America Average***
1 Source: Board of Governors of the Federal Reserve System, “Comprehensive Capital Analysis and Review 2014: Assessment Framework and Results,” March 2014 (the “2014 FRB CCAR Results”). See the 2014 FRB CCAR Results for a description of the methodology and results of the 2014 Federal Reserve CCAR Stress Test, including a more complete description of the hypothetical supervisory severely adverse stress scenario, related hypothetical stresses, projections and results. The capital ratios presented represent the minimum projected for the period Q4 2013 through Q4 2015 and assume company-proposed capital actions such as common stock issuances, dividends and share repurchases. The results of stress represent estimates based on proposed hypothetical economic conditions for the purposes of the stress test. The prescribed hypothetical economic conditions do not represent State Street’s projections, and the estimates representing the results of the stress test are not forecasts of expected regulatory capital ratios or other results.
2 Also includes Northern Trust.
***Average was calculated as a simple average by State Street.
Results of Federal Reserve’s 2014 CCAR Stress Test1
Projected Minimum Capital Ratios Under the Hypothetical Supervisory
Severely Adverse Stress Scenario as Conducted by the Federal Reserve
and Including Adjusted Company Proposed Capital Actions for U.S. G-SIBs2
Tier 1 Common Ratio Fed Required Minimum 5%
State Street has a Strong Capital Position Compared to Its Peers

11
Return of Capital to Shareholders Remains a Priority
Dividend Payout ● Plan to increase quarterly common stock dividend to $0.30 per share in Q2 ’14, subject to consideration and approval by the Board of Directors
Common Stock
Repurchase Program
● Completed final phase of $2.1 billion common stock repurchase program announced in March 2013 in Q1 ’14
● Board approved a $1.7 billion common stock repurchase program effective through March 31, 2015

12
Focused Strategy
13
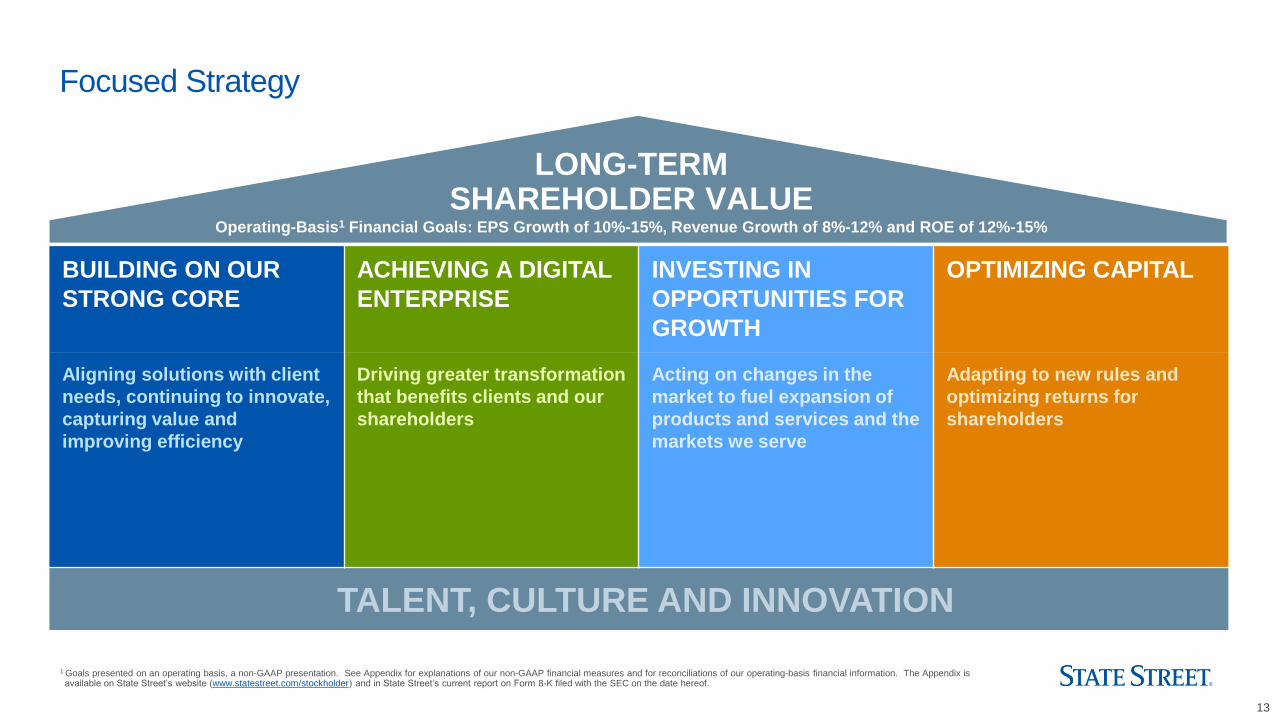
1 Goals presented on an operating basis, a non-GAAP presentation. See Appendix for explanations of our non-GAAP financial measures and for reconciliations of our operating-basis financial information. The Appendix is available on State Street’s website (www.statestreet.com/stockholder) and in State Street’s current report on Form 8-K filed with the SEC on the date hereof.
Focused Strategy
LONG-TERM SHAREHOLDER VALUE
Operating-Basis1 Financial Goals: EPS Growth of 10%-15%, Revenue Growth of 8%-12% and ROE of 12%-15%
BUILDING ON OUR
STRONG CORE
ACHIEVING A DIGITAL
ENTERPRISE
INVESTING IN
OPPORTUNITIES FOR
GROWTH
OPTIMIZING CAPITAL
Aligning solutions with client
needs, continuing to innovate,
capturing value and
improving efficiency
Driving greater transformation
that benefits clients and our
shareholders
Acting on changes in the
market to fuel expansion of
products and services and the
markets we serve
Adapting to new rules and
optimizing returns for
shareholders
TALENT, CULTURE AND INNOVATION
14
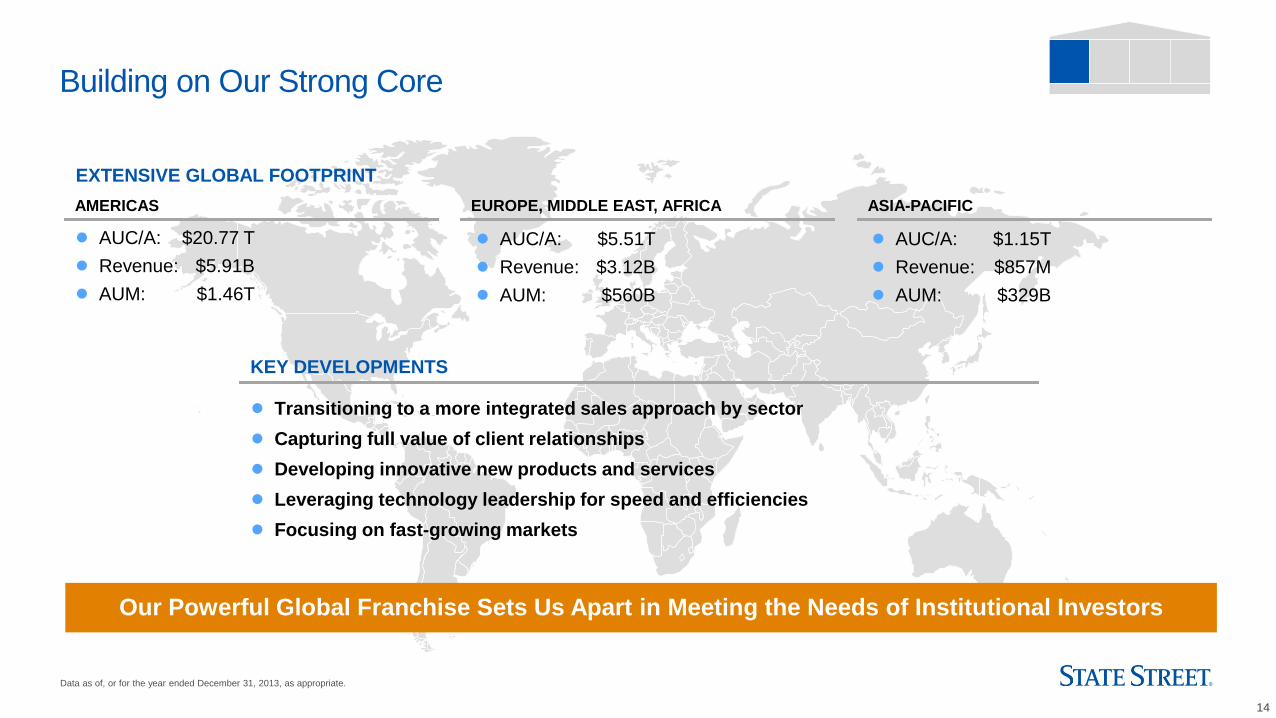
Data as of, or for the year ended December 31, 2013, as appropriate.
Building on Our Strong Core
● Transitioning to a more integrated sales approach by sector
● Capturing full value of client relationships
● Developing innovative new products and services
● Leveraging technology leadership for speed and efficiencies
● Focusing on fast-growing markets
KEY DEVELOPMENTS
AMERICAS
● AUC/A: $20.77 T
● Revenue: $5.91B
● AUM: $1.46T
EUROPE, MIDDLE EAST, AFRICA
● AUC/A: $5.51T
● Revenue: $3.12B
● AUM: $560B
● AUC/A: $1.15T
● Revenue: $857M
● AUM: $329B
ASIA-PACIFIC
EXTENSIVE GLOBAL FOOTPRINT
Our Powerful Global Franchise Sets Us Apart in Meeting the Needs of Institutional Investors
15
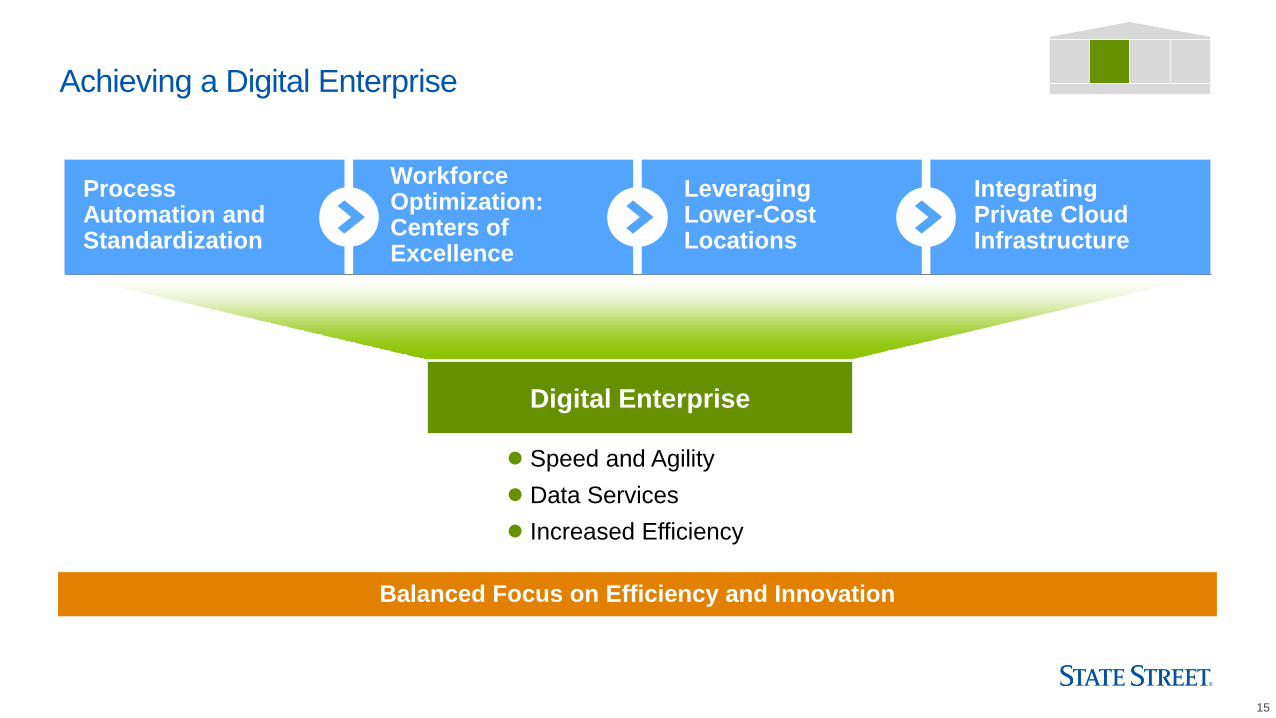
Achieving a Digital Enterprise
Digital Enterprise
Process Automation and Standardization
Workforce Optimization: Centers of Excellence
Leveraging Lower-Cost Locations
Integrating Private Cloud Infrastructure
● Speed and Agility
● Data Services
● Increased Efficiency
Balanced Focus on Efficiency and Innovation
16
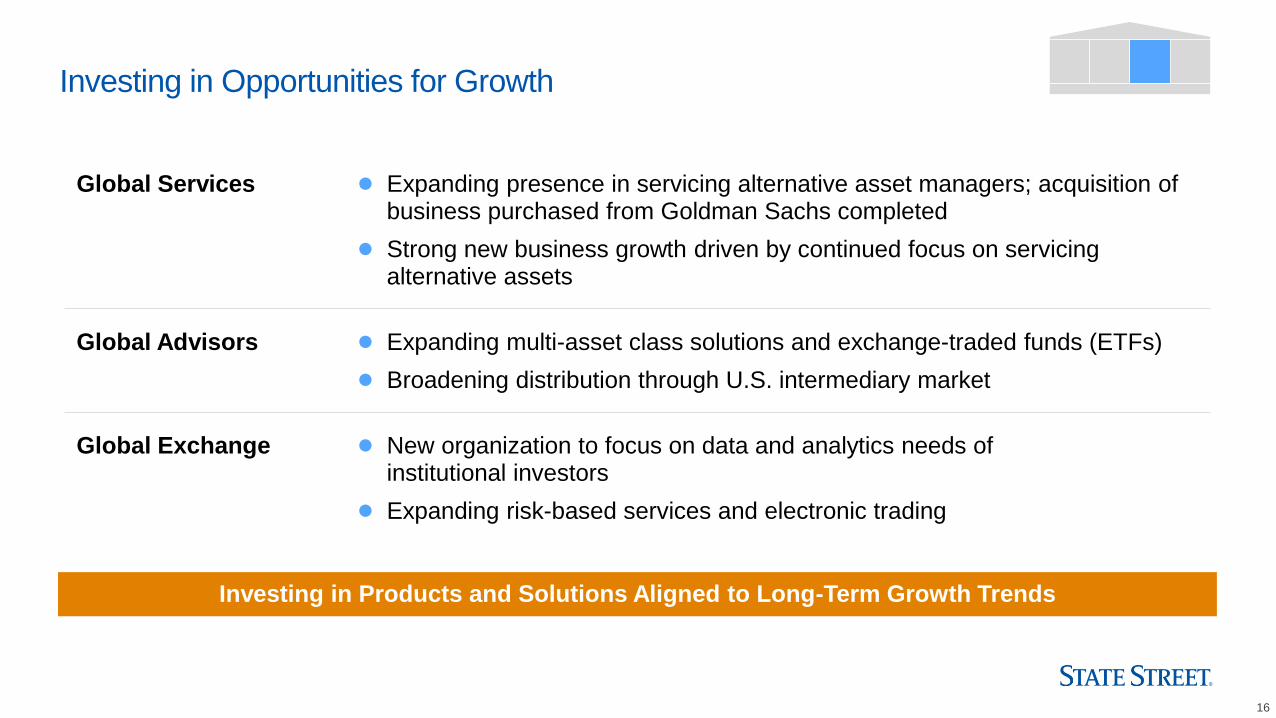
Investing in Opportunities for Growth
Global Services ● Expanding presence in servicing alternative asset managers; acquisition of business purchased from Goldman Sachs completed
● Strong new business growth driven by continued focus on servicing alternative assets
Global Advisors ● Expanding multi-asset class solutions and exchange-traded funds (ETFs)
● Broadening distribution through U.S. intermediary market
Global Exchange ● New organization to focus on data and analytics needs of institutional investors
● Expanding risk-based services and electronic trading
Investing in Products and Solutions Aligned to Long-Term Growth Trends
17
1 Goals presented on an operating basis, a non-GAAP presentation. See Appendix for explanations of our non-GAAP financial measures and for reconciliations of our operating-basis financial information. The Appendix is available on State Street’s website (www.statestreet.com/stockholder) and in State Street’s current report on Form 8-K filed with the SEC on the date hereof.
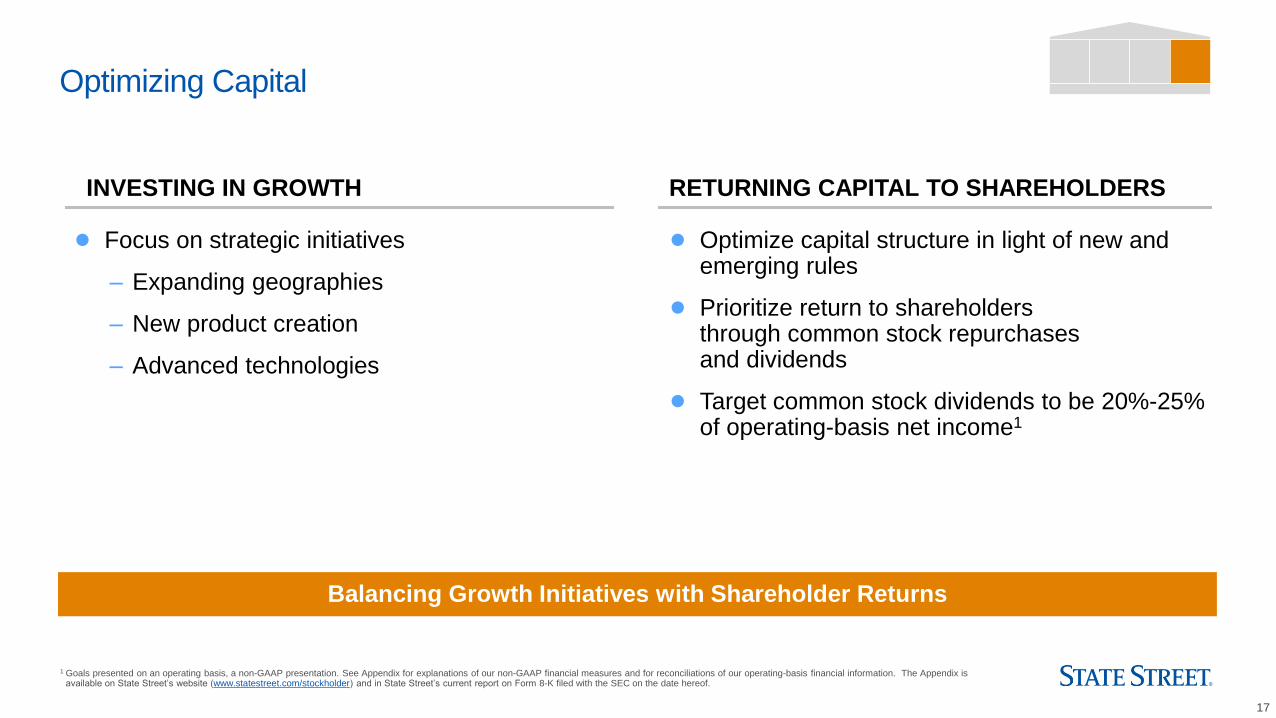
Optimizing Capital
INVESTING IN GROWTH RETURNING CAPITAL TO SHAREHOLDERS
● Focus on strategic initiatives
– Expanding geographies
– New product creation
– Advanced technologies
● Optimize capital structure in light of new and emerging rules
● Prioritize return to shareholders through common stock repurchases and dividends
● Target common stock dividends to be 20%-25% of operating-basis net income1
Balancing Growth Initiatives with Shareholder Returns
18
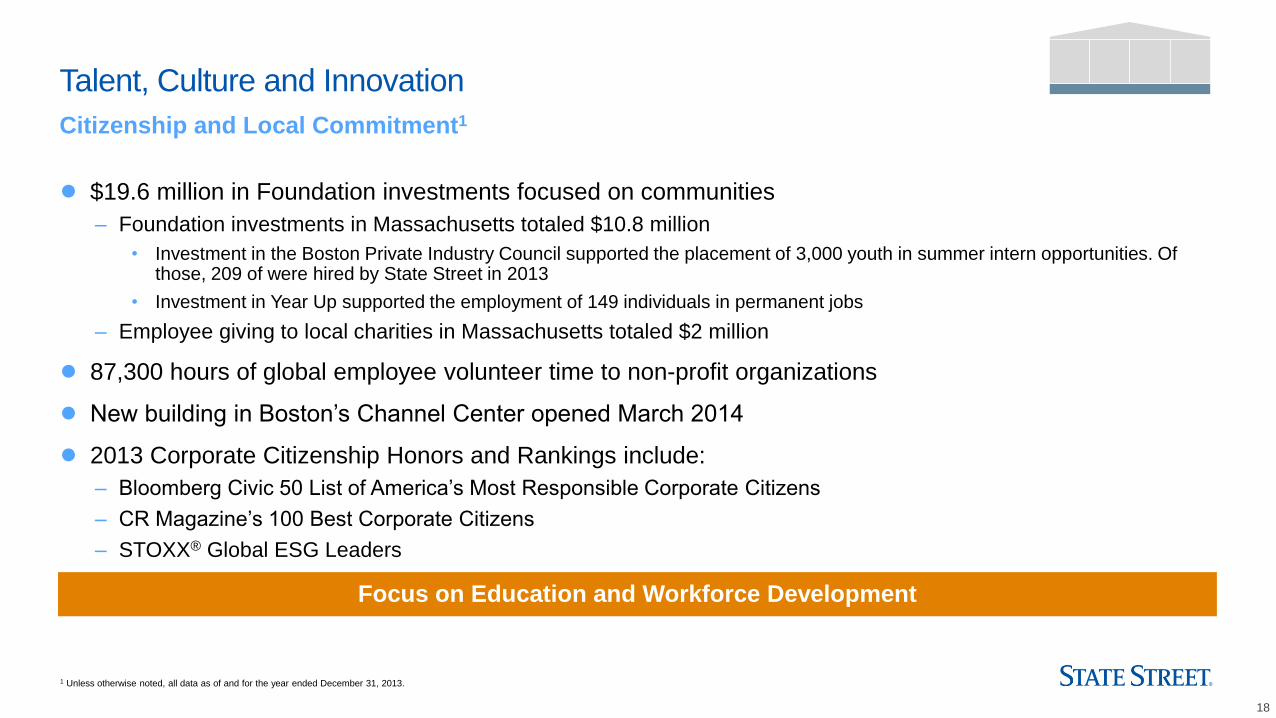
Talent, Culture and Innovation
Citizenship and Local Commitment1
● $19.6 million in Foundation investments focused on communities
– Foundation investments in Massachusetts totaled $10.8 million
• Investment in the Boston Private Industry Council supported the placement of 3,000 youth in summer intern opportunities. Of those, 209 of were hired by State Street in 2013
• Investment in Year Up supported the employment of 149 individuals in permanent jobs
– Employee giving to local charities in Massachusetts totaled $2 million
● 87,300 hours of global employee volunteer time to non-profit organizations
● New building in Boston’s Channel Center opened March 2014
● 2013 Corporate Citizenship Honors and Rankings include:
– Bloomberg Civic 50 List of America’s Most Responsible Corporate Citizens
– CR Magazine’s 100 Best Corporate Citizens
– STOXX® Global ESG Leaders
1 Unless otherwise noted, all data as of and for the year ended December 31, 2013.
Focus on Education and Workforce Development
19
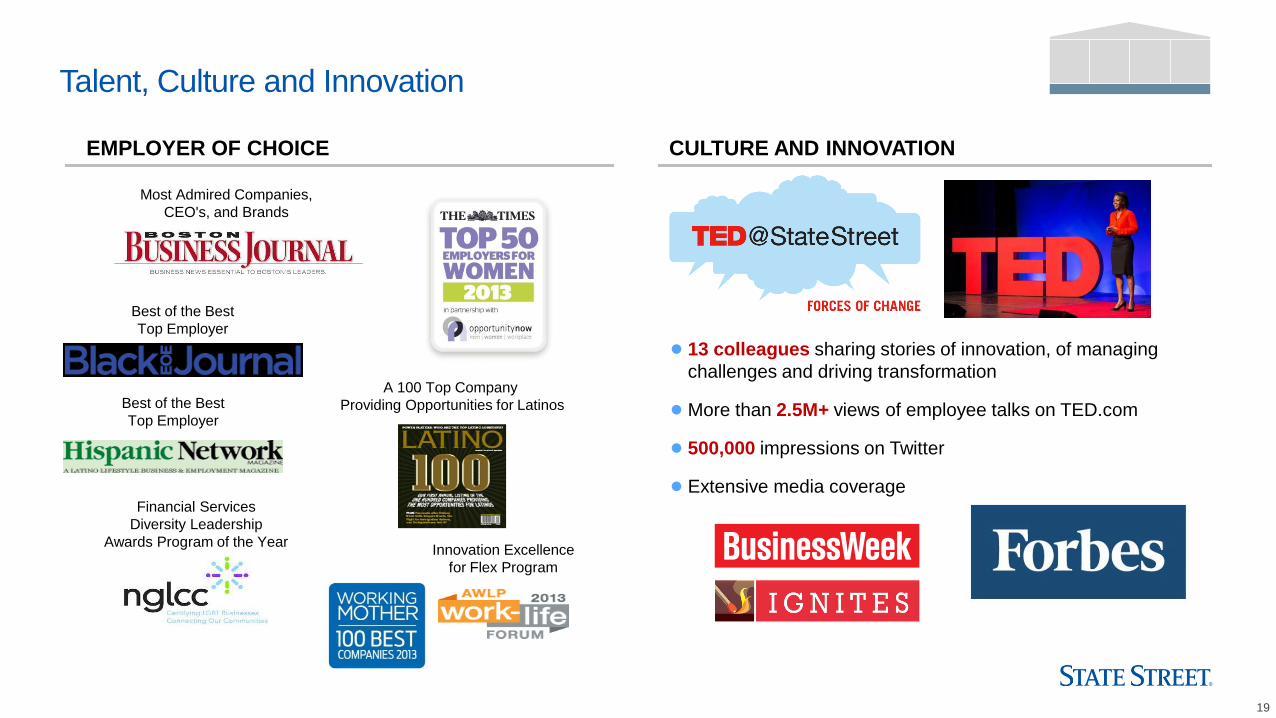
Best of the Best
Top Employer
Best of the Best
Top Employer
Innovation Excellence
for Flex Program
A 100 Top Company
Providing Opportunities for Latinos
Financial Services
Diversity Leadership
Awards Program of the Year
Most Admired Companies,
CEO's, and Brands
Talent, Culture and Innovation
EMPLOYER OF CHOICE CULTURE AND INNOVATION
● 13 colleagues sharing stories of innovation, of managing
challenges and driving transformation
● More than 2.5M+ views of employee talks on TED.com
● 500,000 impressions on Twitter
● Extensive media coverage

20
Summary

21
1 Goals presented on an operating basis, a non-GAAP presentation. See Appendix for explanations of our non-GAAP financial measures and for reconciliations of our operating-basis financial information. The Appendix is available on State Street’s website (www.statestreet.com/stockholder) and in State Street’s current report on Form 8-K filed with the SEC on the date hereof.
Focused Strategy
LONG-TERM SHAREHOLDER VALUE
Operating-Basis1 Financial Goals: EPS Growth of 10%-15%, Revenue Growth of 8%-12% and ROE of 12%-15%
BUILDING ON OUR
STRONG CORE
ACHIEVING A DIGITAL
ENTERPRISE
INVESTING IN
OPPORTUNITIES FOR
GROWTH
OPTIMIZING CAPITAL
Aligning solutions with client
needs, continuing to innovate,
capturing value and
improving efficiency
Driving greater transformation
that benefits clients and our
shareholders
Acting on changes in the
market to fuel expansion of
products and services and the
markets we serve
Adapting to new rules and
optimizing returns for
shareholders
TALENT, CULTURE AND INNOVATION
22
Appendix
22
The foregoing presentation includes financial information presented on a GAAP basis as well as on a non-GAAP, or “operating basis.” Management measures and compares certain financial information on
an operating basis, as it believes that this presentation supports meaningful comparisons from period to period and the analysis of comparable financial trends with respect to State Street’s normal ongoing
business operations. Management believes that operating-basis financial information, which reports revenue from non-taxable sources, such as interest revenue from tax-exempt investment securities and
processing fees and other revenue associated with tax-advantaged investments, on a fully taxable-equivalent basis and excludes the impact of revenue and expenses outside of the normal course of
business, facilitates an investor’s understanding and analysis of State Street’s underlying financial performance and trends in addition to financial information prepared and reported in conformity with GAAP.
Non-GAAP financial measures should be considered in addition to, not as a substitute for or superior to, financial measures determined in conformity with GAAP.
23
2013
vs.
(Dollars in millions) 2012
Total Revenue:
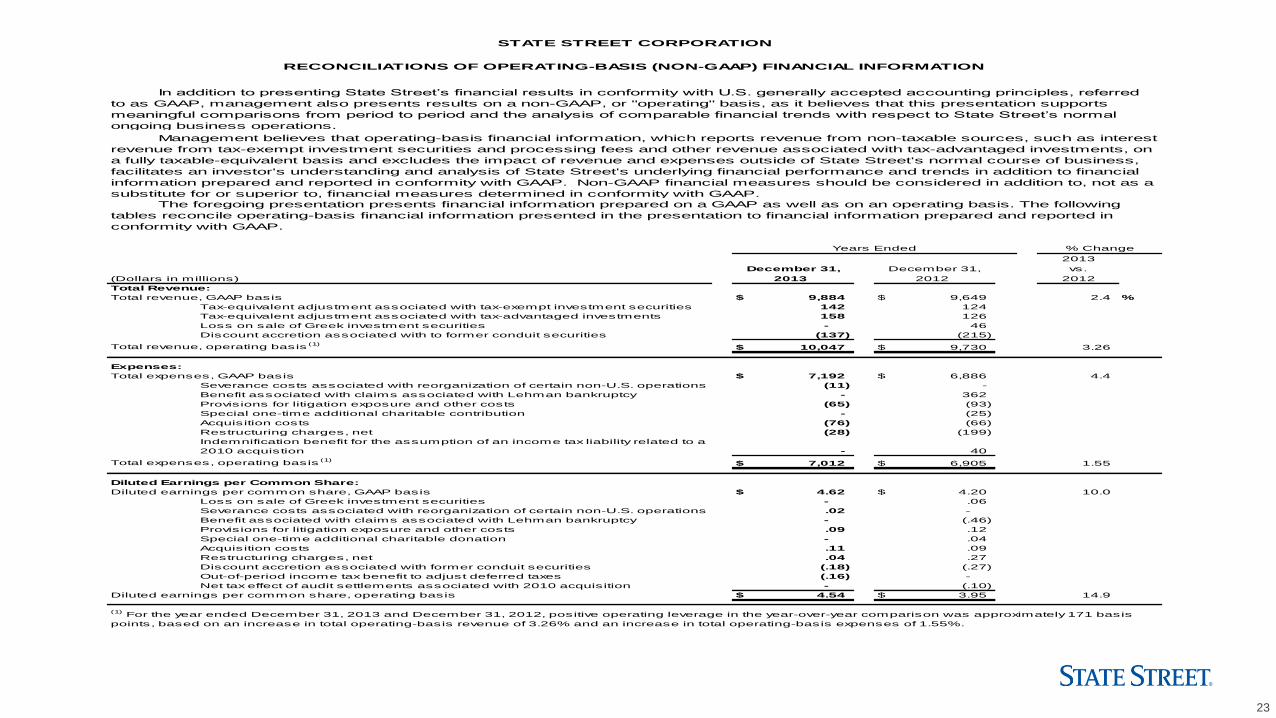
Total revenue, GAAP basis $ 9,884 $ 9,649 2.4 %
Tax-equivalent adjustment associated with tax-exempt investment securities 142 124
Tax-equivalent adjustment associated with tax-advantaged investments 158 126
Loss on sale of Greek investment securities - 46
Discount accretion associated with to former conduit securities (137) (215)
Total revenue, operating basis(1)
$ 10,047 $ 9,730 3.26
Expenses:
Total expenses, GAAP basis $ 7,192 $ 6,886 4.4
Severance costs associated with reorganization of certain non-U.S. operations (11) -
Benefit associated with claims associated with Lehman bankruptcy - 362
Provisions for litigation exposure and other costs (65) (93)
Special one-time additional charitable contribution - (25)
Acquisition costs (76) (66)
Restructuring charges, net (28) (199)
Indemnification benefit for the assumption of an income tax liability related to a
2010 acquistion - 40
Total expenses, operating basis(1)
$ 7,012 $ 6,905 1.55
Diluted Earnings per Common Share:
Diluted earnings per common share, GAAP basis $ 4.62 $ 4.20 10.0
Loss on sale of Greek investment securities - .06
Severance costs associated with reorganization of certain non-U.S. operations .02 -
Benefit associated with claims associated with Lehman bankruptcy - (.46)
Provisions for litigation exposure and other costs .09 .12
Special one-time additional charitable donation - .04
Acquisition costs .11 .09
Restructuring charges, net .04 .27
Discount accretion associated with former conduit securities (.18) (.27)
Out-of-period income tax benefit to adjust deferred taxes (.16) -
Net tax effect of audit settlements associated with 2010 acquisition - (.10)
Diluted earnings per common share, operating basis $ 4.54 $ 3.95 14.9
December 31, December 31,
STATE STREET CORPORATION
RECONCILIATIONS OF OPERATING-BASIS (NON-GAAP) FINANCIAL INFORMATION
In addition to presenting State Street’s financial results in conformity with U.S. generally accepted accounting principles, referred
to as GAAP, management also presents results on a non-GAAP, or "operating" basis, as it believes that this presentation supports
meaningful comparisons from period to period and the analysis of comparable financial trends with respect to State Street’s normal
ongoing business operations.
Management believes that operating-basis financial information, which reports revenue from non-taxable sources, such as interest
revenue from tax-exempt investment securities and processing fees and other revenue associated with tax-advantaged investments, on
a fully taxable-equivalent basis and excludes the impact of revenue and expenses outside of State Street's normal course of business,
facilitates an investor's understanding and analysis of State Street's underlying financial performance and trends in addition to financial
information prepared and reported in conformity with GAAP. Non-GAAP financial measures should be considered in addition to, not as a
substitute for or superior to, financial measures determined in conformity with GAAP.
The foregoing presentation presents financial information prepared on a GAAP as well as on an operating basis. The following
tables reconcile operating-basis financial information presented in the presentation to financial information prepared and reported in
conformity with GAAP.
Years Ended % Change
(1) For the year ended December 31, 2013 and December 31, 2012, positive operating leverage in the year-over-year comparison was approximately 171 basis
points, based on an increase in total operating-basis revenue of 3.26% and an increase in total operating-basis expenses of 1.55%.
2013 2012
24
(Dollars in millions, except per share amounts)
Income Before Income Tax Expense:
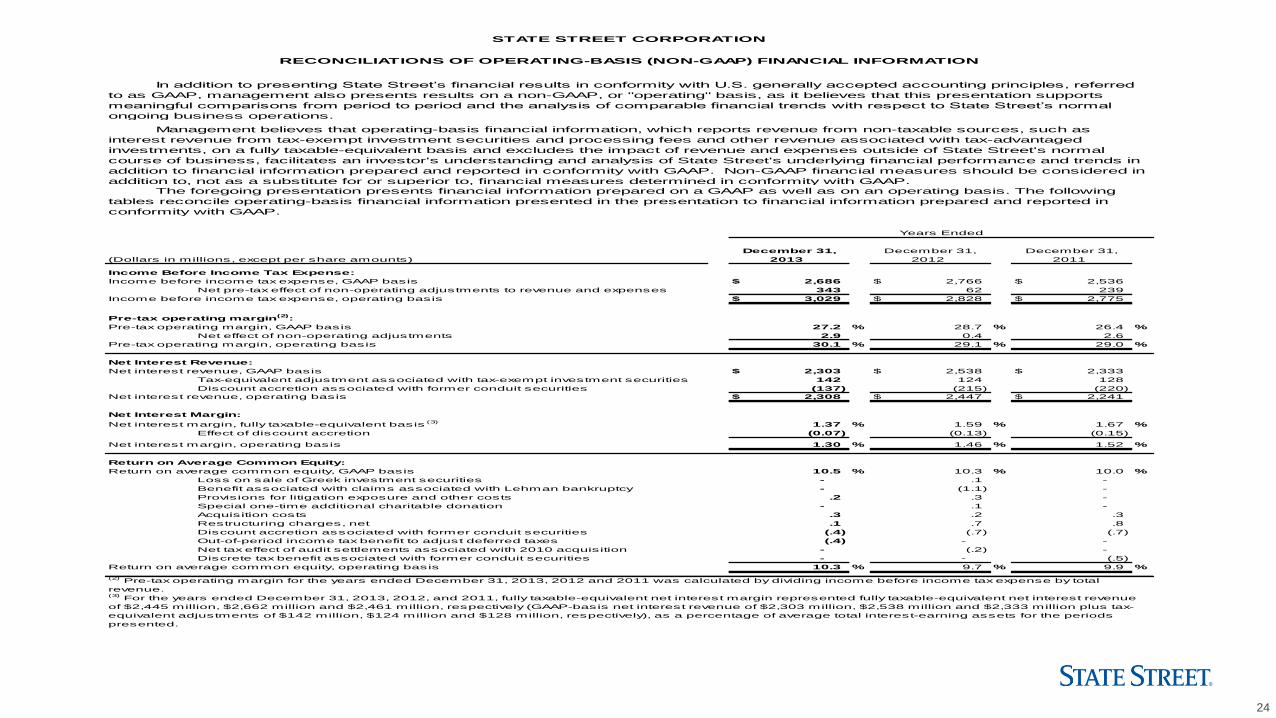
Income before income tax expense, GAAP basis $ 2,686 $ 2,766 $ 2,536
Net pre-tax effect of non-operating adjustments to revenue and expenses 343 62 239
Income before income tax expense, operating basis $ 3,029 $ 2,828 $ 2,775
Pre-tax operating margin(2)
:
Pre-tax operating margin, GAAP basis 27.2 % 28.7 % 26.4 %
Net effect of non-operating adjustments 2.9 0.4 2.6
Pre-tax operating margin, operating basis 30.1 % 29.1 % 29.0 %
Net Interest Revenue:
Net interest revenue, GAAP basis $ 2,303 $ 2,538 $ 2,333
Tax-equivalent adjustment associated with tax-exempt investment securities 142 124 128
Discount accretion associated with former conduit securities (137) (215) (220)
Net interest revenue, operating basis $ 2,308 $ 2,447 $ 2,241
Net Interest Margin:
Net interest margin, fully taxable-equivalent basis(3)
1.37 % 1.59 % 1.67 %
Effect of discount accretion (0.07) (0.13) (0.15)
Net interest margin, operating basis 1.30 % 1.46 % 1.52 %
Return on Average Common Equity:
Return on average common equity, GAAP basis 10.5 % 10.3 % 10.0 %
Loss on sale of Greek investment securities - .1 -
Benefit associated with claims associated with Lehman bankruptcy - (1.1) -
Provisions for litigation exposure and other costs .2 .3 -
Special one-time additional charitable donation - .1 -
Acquisition costs .3 .2 .3
Restructuring charges, net .1 .7 .8
Discount accretion associated with former conduit securities (.4) (.7) (.7)
Out-of-period income tax benefit to adjust deferred taxes (.4) - -
Net tax effect of audit settlements associated with 2010 acquisition - (.2) -
Discrete tax benefit associated with former conduit securities - - (.5)
Return on average common equity, operating basis 10.3 % 9.7 % 9.9 %
STATE STREET CORPORATION
RECONCILIATIONS OF OPERATING-BASIS (NON-GAAP) FINANCIAL INFORMATION
In addition to presenting State Street’s financial results in conformity with U.S. generally accepted accounting principles, referred
to as GAAP, management also presents results on a non-GAAP, or "operating" basis, as it believes that this presentation supports
meaningful comparisons from period to period and the analysis of comparable financial trends with respect to State Street’s normal
ongoing business operations.
2013 2012 2011
Management believes that operating-basis financial information, which reports revenue from non-taxable sources, such as
interest revenue from tax-exempt investment securities and processing fees and other revenue associated with tax-advantaged
investments, on a fully taxable-equivalent basis and excludes the impact of revenue and expenses outside of State Street's normal
course of business, facilitates an investor's understanding and analysis of State Street's underlying financial performance and trends in
addition to financial information prepared and reported in conformity with GAAP. Non-GAAP financial measures should be considered in
addition to, not as a substitute for or superior to, financial measures determined in conformity with GAAP.
(3) For the years ended December 31, 2013, 2012, and 2011, fully taxable-equivalent net interest margin represented fully taxable-equivalent net interest revenue
of $2,445 million, $2,662 million and $2,461 million, respectively (GAAP-basis net interest revenue of $2,303 million, $2,538 million and $2,333 million plus tax-
equivalent adjustments of $142 million, $124 million and $128 million, respectively), as a percentage of average total interest-earning assets for the periods
presented.
The foregoing presentation presents financial information prepared on a GAAP as well as on an operating basis. The following
tables reconcile operating-basis financial information presented in the presentation to financial information prepared and reported in
conformity with GAAP.
Years Ended
(2) Pre-tax operating margin for the years ended December 31, 2013, 2012 and 2011 was calculated by dividing income before income tax expense by total
revenue.
December 31, December 31, December 31,
25
Q1 2014
vs.
(Dollars in millions) Q1 2013
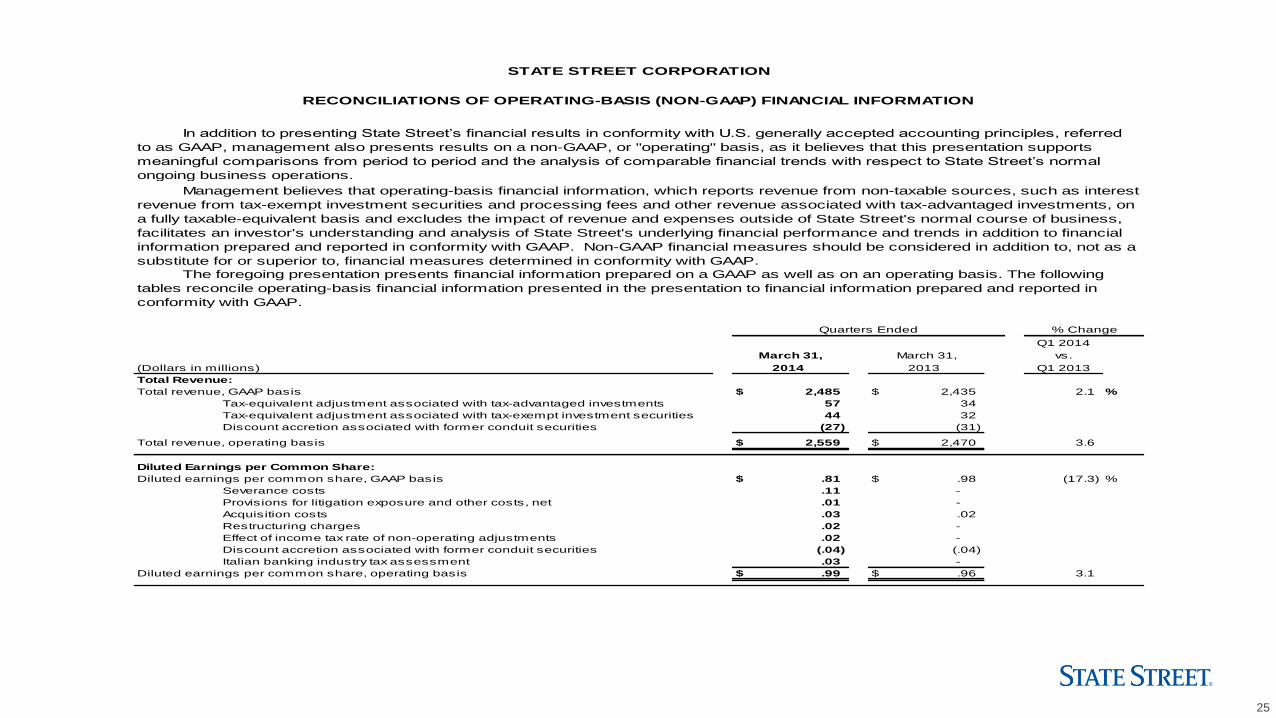
Total Revenue:
Total revenue, GAAP basis $ 2,485 $ 2,435 2.1 %
Tax-equivalent adjustment associated with tax-advantaged investments 57 34
Tax-equivalent adjustment associated with tax-exempt investment securities 44 32
Discount accretion associated with former conduit securities (27) (31)
Total revenue, operating basis $ 2,559 $ 2,470 3.6
Diluted Earnings per Common Share:
Diluted earnings per common share, GAAP basis $ .81 $ .98 (17.3) %
Severance costs .11 -
Provisions for litigation exposure and other costs, net .01 -
Acquisition costs .03 .02
Restructuring charges .02 -
Effect of income tax rate of non-operating adjustments .02 -
Discount accretion associated with former conduit securities (.04) (.04)
Italian banking industry tax assessment .03 -
Diluted earnings per common share, operating basis $ .99 $ .96 3.1
March 31,
2013
March 31,
2014
STATE STREET CORPORATION
RECONCILIATIONS OF OPERATING-BASIS (NON-GAAP) FINANCIAL INFORMATION
In addition to presenting State Street’s financial results in conformity with U.S. generally accepted accounting principles, referred
to as GAAP, management also presents results on a non-GAAP, or "operating" basis, as it believes that this presentation supports
meaningful comparisons from period to period and the analysis of comparable financial trends with respect to State Street’s normal
ongoing business operations.
% Change
The foregoing presentation presents financial information prepared on a GAAP as well as on an operating basis. The following
tables reconcile operating-basis financial information presented in the presentation to financial information prepared and reported in
conformity with GAAP.
Management believes that operating-basis financial information, which reports revenue from non-taxable sources, such as interest
revenue from tax-exempt investment securities and processing fees and other revenue associated with tax-advantaged investments, on
a fully taxable-equivalent basis and excludes the impact of revenue and expenses outside of State Street's normal course of business,
facilitates an investor's understanding and analysis of State Street's underlying financial performance and trends in addition to financial
information prepared and reported in conformity with GAAP. Non-GAAP financial measures should be considered in addition to, not as a
substitute for or superior to, financial measures determined in conformity with GAAP.
Quarters Ended