the water footprint of sweeteners and bio-ethanol · review the water footprint of sweeteners and...
TRANSCRIPT

Environment International 40 (2012) 202–211
Contents lists available at ScienceDirect
Environment International
j ourna l homepage: www.e lsev ie r.com/ locate /env int
Review
The water footprint of sweeteners and bio-ethanol
Winnie Gerbens-Leenes ⁎, Arjen Y. HoekstraTwente Water Centre, University of Twente, P.O. Box 217, 7500 AE Enschede, The Netherlands
⁎ Corresponding author.E-mail addresses: [email protected] (W
0160-4120/$ – see front matter © 2011 Elsevier Ltd. Aldoi:10.1016/j.envint.2011.06.006
a b s t r a c t
a r t i c l e i n f oArticle history:Received 3 January 2011Accepted 17 June 2011Available online 29 July 2011
Keywords:Water footprintSweetenersBio-ethanolSugar beetSugar caneMaize
An increasing demand for food together with a growing demand for energy crops result in an increasingdemand for and competition over water. Sugar cane, sugar beet and maize are not only essential food crops,but also important feedstock for bio-ethanol. Crop growth requires water, a scarce resource. This study aims toassess the green, blue and grey water footprint (WF) of sweeteners and bio-ethanol from sugar cane, sugarbeet and maize in the main producing countries. The WFs of sweeteners and bio-ethanol are mainlydetermined by the crop type that is used as a source and by agricultural practise and agro-climatic conditions;process water footprints are relatively small. The weighted global average WF of sugar cane is 209 m3/tonne;for sugar beet this is 133 m3/tonne and for maize 1222 m3/tonne. Large regional differences in WFs indicatethat WFs of crops for sweeteners and bio-ethanol can be improved. It is more favourable to use maize as afeedstock for sweeteners or bio-ethanol than sugar beet or sugar cane. The WF of sugar cane contributes towater stress in the Indus and Ganges basins. In the Ukraine, the large grey WF of sugar beet contributes towater pollution. In some western European countries, blue WFs of sugar beet and maize need a large amountof available blue water for agriculture. The allocation of the limited global water resources to bio-energy on alarge scale will be at the cost of water allocation to food and nature.
. Gerbens-Leenes), [email protected] (A.Y. Hoek
l rights reserved.
© 2011 Elsevier Ltd. All rights reserved.
Contents
1. Introduction . . . . . . . . . . . . . . . . . . . . . . . . . . . . . . . . . . . . . . . . . . . . . . . . . . . . . . . . . . . . . . 2032. Bio-ethanol and sweeteners . . . . . . . . . . . . . . . . . . . . . . . . . . . . . . . . . . . . . . . . . . . . . . . . . . . . . . 2033. Method and data . . . . . . . . . . . . . . . . . . . . . . . . . . . . . . . . . . . . . . . . . . . . . . . . . . . . . . . . . . . 204
3.1. Crop water footprints . . . . . . . . . . . . . . . . . . . . . . . . . . . . . . . . . . . . . . . . . . . . . . . . . . . . . . 2043.2. The water footprint of sugar, HFMS and bio-ethanol . . . . . . . . . . . . . . . . . . . . . . . . . . . . . . . . . . . . . . . . 2053.3. Sustainability assessment . . . . . . . . . . . . . . . . . . . . . . . . . . . . . . . . . . . . . . . . . . . . . . . . . . . . 2063.4. Environmental sustainability of the blue water footprint . . . . . . . . . . . . . . . . . . . . . . . . . . . . . . . . . . . . . . 2063.5. Hotspots . . . . . . . . . . . . . . . . . . . . . . . . . . . . . . . . . . . . . . . . . . . . . . . . . . . . . . . . . . . . 2063.6. Environmental sustainability in a global context . . . . . . . . . . . . . . . . . . . . . . . . . . . . . . . . . . . . . . . . . 207
4. Results . . . . . . . . . . . . . . . . . . . . . . . . . . . . . . . . . . . . . . . . . . . . . . . . . . . . . . . . . . . . . . . . 2074.1. The water footprint of sugar cane, sugar beet and maize . . . . . . . . . . . . . . . . . . . . . . . . . . . . . . . . . . . . . 2074.2. The WF of sugar, HFMS and bio-ethanol . . . . . . . . . . . . . . . . . . . . . . . . . . . . . . . . . . . . . . . . . . . . . 208
5. Environmental sustainability assessment . . . . . . . . . . . . . . . . . . . . . . . . . . . . . . . . . . . . . . . . . . . . . . . . 2085.1. Environmental sustainability of the blue water footprint . . . . . . . . . . . . . . . . . . . . . . . . . . . . . . . . . . . . . . 2085.2. Hotspots . . . . . . . . . . . . . . . . . . . . . . . . . . . . . . . . . . . . . . . . . . . . . . . . . . . . . . . . . . . . 208
5.2.1. Dnieper basin in the Ukraine . . . . . . . . . . . . . . . . . . . . . . . . . . . . . . . . . . . . . . . . . . . . . . 2085.2.2. The Ganges and Indus basins in India and Pakistan . . . . . . . . . . . . . . . . . . . . . . . . . . . . . . . . . . . . 209
5.3. Environmental sustainability in a global context . . . . . . . . . . . . . . . . . . . . . . . . . . . . . . . . . . . . . . . . . 2096. Discussion . . . . . . . . . . . . . . . . . . . . . . . . . . . . . . . . . . . . . . . . . . . . . . . . . . . . . . . . . . . . . . . 2097. Conclusions . . . . . . . . . . . . . . . . . . . . . . . . . . . . . . . . . . . . . . . . . . . . . . . . . . . . . . . . . . . . . . 210
stra).
203W. Gerbens-Leenes, A.Y. Hoekstra / Environment International 40 (2012) 202–211
Acknowledgement . . . . . . . . . . . . . . . . . . . . . . . . . . . . . . . . . . . . . . . . . . . . . . . . . . . . . . . . . . . . . 210Appendix A. Allocation of WF over economically valuable crop parts . . . . . . . . . . . . . . . . . . . . . . . . . . . . . . . . . . . . 210References . . . . . . . . . . . . . . . . . . . . . . . . . . . . . . . . . . . . . . . . . . . . . . . . . . . . . . . . . . . . . . . . . 210211
1. Introduction
Fresh water of adequate quality is a prerequisite to feed thegrowing world population and to sustain nature. Freshwateravailability and quality vary in time and space. The need for morefood in combination with a shift from fossil energy towards bio-energy leads to a growing demand for fresh water (UNEP, 2009).Increased global use of biofuels like bio-ethanol leads to a substantialincrease in global agricultural water use, which enlarges watercompetition (Berndes, 2002; De Fraiture et al., 2008) and contributesto further water quality deterioration from the seepage of fertilisersand pesticides (UNEP, 2009). There are various signs that waterconsumption and pollution exceed sustainable levels, for example inthe Ganges and Indus river basins in India and Pakistan (Alcamo et al.,2003; Mekonnen and Hoekstra, 2010).
The growing public interest in biofuels originates from the aim toreduce CO2 emissions from fossil fuels, but biofuels are alsoconsidered relevant in promoting rural development and securingan energy source for the long-term future (UNEP, 2009). Not onlydeveloped countries, such as the countries of the European Union(European Commission, 2009), but also large developing countrieslike China (Yang et al., 2009) and India (Government of India, 2008)aim to partially replace traditional transport fuels from fossil sourcesby renewables, such as bio-ethanol from sugar and starch crops.During the last three decades, global bio-ethanol production hasincreased rapidly. In 2005, the US and Brazil were the largestproducers. US production is based on maize and Brazilian productionon sugar cane (Berg, 2004). In developed countries, transportaccounts for about one third of total energy use (Blok, 2006; IEA,2006), which means that a shift towards biofuels will take largeefforts. First-generation bio-ethanol is mainly produced from sugarcrops (61%), especially from sugar cane and to a lesser extent fromsugar beet, or from grains, especially maize (corn) (39%) (Berg, 2004).In the future, also crop residues may be used for biofuels. A recentstudy, however, concluded that the use of crop residues for biofuels,so termed second-generation biofuels, needs to be critically evaluatedbecause of the positive effects of crop residues on soil quality andcarbon sequestration by the soil (Lal, 2005), which redirects theinterest to first-generation biofuels like bio-ethanol.
Sugar cane, sugar beet and maize are important food crops with alarge contribution to global agricultural food production (FAO, 2011).Sugar cane contributes to 29% of the total world crop production,maize 14% and sugar beet 4%. There is concern that increased bio-ethanol production will increase food prices and decrease foodsecurity (FAO, 2008; Fischer et al., 2009; Pimentel et al., 2009).Moreover, agricultural crops, such as sugar cane, are water intensive(WWF, 2003). Today, agriculture accounts for 86% of the globalfreshwater consumption (Hoekstra and Chapagain, 2008). An impor-tant question is whether we apply scarce water resources for foodor for fuel. This requires detailed information about how much wateris needed to produce food and fuel.
A tool to calculate water needs for consumer products is the waterfootprint (WF) concept (Hoekstra, 2003; Hoekstra et al., 2011;Hoekstra and Chapagain, 2008), an indicator of freshwater use thatincludes direct and indirect water use along product supply chains.The WF is a multi-dimensional indicator, giving water consumptionvolumes by source and polluted volumes by type of pollution. The tooldistinguishes between green, blue and grey waters and in this waygives a comprehensive and complete overview of freshwater use and
pollution. The blue WF refers to surface and groundwater volumesconsumed (evaporated or incorporated into the product) as a resultof the production of a good; the green WF refers to the rainwaterconsumed. The grey WF of a product refers to the volume offreshwater required to assimilate the load of pollutants based onexisting ambient water quality standards. Hoekstra and Hung (2002)made a first global estimation of freshwater needed to produce crops;Chapagain and Hoekstra (2004) made the first global dataset for allagricultural products. Subsequent studies, e.g. for cotton (Chapagainet al., 2006) and coffee and tea (Chapagain and Hoekstra, 2007)provide detailed WFs of crops and derived crop products. Sugar cropsare among the most important food crops that, at the same time, areused to produce growing amounts of bio-ethanol. Several studiesassessed bio-ethanol water requirements. Chiu et al. (2009) and KingandWebber (2008) made assessments for US bio-ethanol frommaizefocussing on irrigation water. Dominguez-Faus et al. (2009) made anassessment for US bio-ethanol, also including evapotranspiration.Gerbens-Leenes et al. (2009) calculated green and blue WFs for bio-ethanol and included the main producing countries. Detailed globalanalyses are needed to estimate how much water is required forthe production of food and biofuel and where overexploitationor pollution of water may occur. The aim of this study is to extendexisting studies and assess the water requirements of three cropsthat are important for food but feedstock for bio-ethanol as well.Objectives are: (i) to calculate the green, blue and grey WFs ofsweeteners and bio-ethanol from sugar cane, sugar beet andmaize forthe main producing countries and locations, (ii) to assess favourableproduction lines and locations and (iii) to evaluate the environmentalsustainability of WFs of sugar cane and sugar beet production in threeimportant production areas, as well as environmental sustainability ofsugar cane, sugar beet and maize production on a national and globallevel. Detailed WFs of sweeteners and bio-ethanol give an indicationof the feasibility of using sugar and starch crops for biofuels froma water perspective and show where and how they can be producedin the most water efficient way.
2. Bio-ethanol and sweeteners
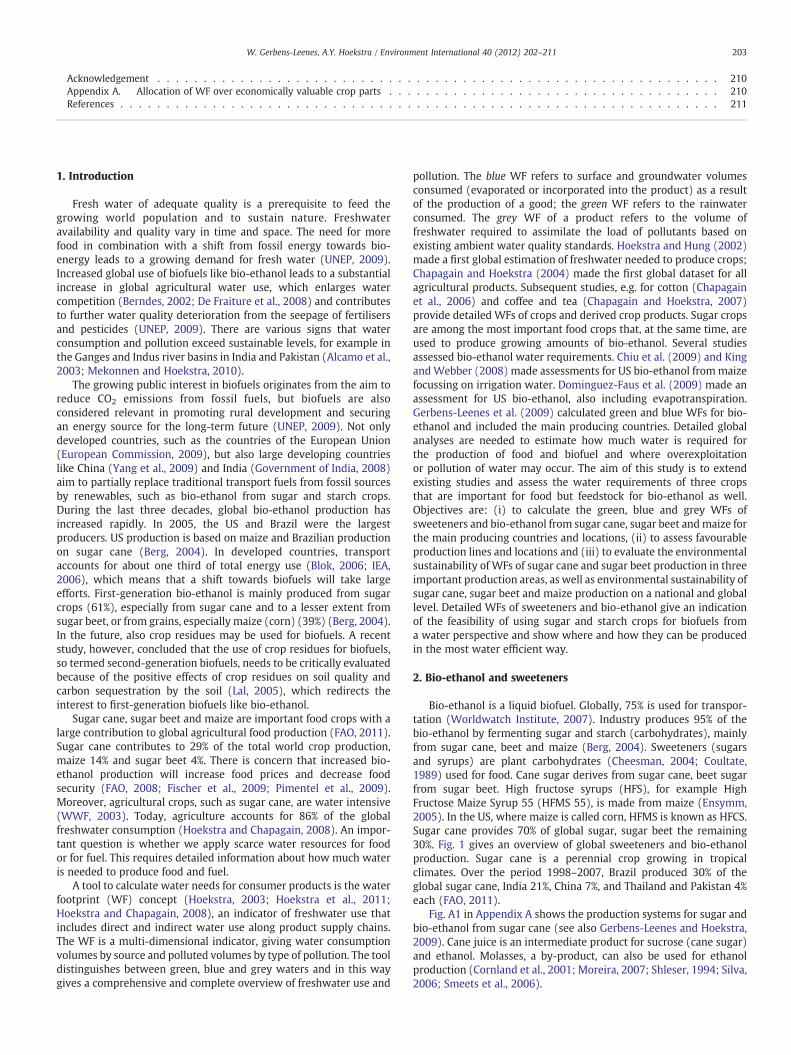
Bio-ethanol is a liquid biofuel. Globally, 75% is used for transpor-tation (Worldwatch Institute, 2007). Industry produces 95% of thebio-ethanol by fermenting sugar and starch (carbohydrates), mainlyfrom sugar cane, beet and maize (Berg, 2004). Sweeteners (sugarsand syrups) are plant carbohydrates (Cheesman, 2004; Coultate,1989) used for food. Cane sugar derives from sugar cane, beet sugarfrom sugar beet. High fructose syrups (HFS), for example HighFructose Maize Syrup 55 (HFMS 55), is made from maize (Ensymm,2005). In the US, where maize is called corn, HFMS is known as HFCS.Sugar cane provides 70% of global sugar, sugar beet the remaining30%. Fig. 1 gives an overview of global sweeteners and bio-ethanolproduction. Sugar cane is a perennial crop growing in tropicalclimates. Over the period 1998–2007, Brazil produced 30% of theglobal sugar cane, India 21%, China 7%, and Thailand and Pakistan 4%each (FAO, 2011).
Fig. A1 in Appendix A shows the production systems for sugar andbio-ethanol from sugar cane (see also Gerbens-Leenes and Hoekstra,2009). Cane juice is an intermediate product for sucrose (cane sugar)and ethanol. Molasses, a by-product, can also be used for ethanolproduction (Cornland et al., 2001; Moreira, 2007; Shleser, 1994; Silva,2006; Smeets et al., 2006).
86.3% Sweeteners for human consumption
Bio-ethanol
Starchy crops:maize
Sugar crops:sugar cane & sugar beet
Natural resources
8.0%
5.7%
39%
61%
Artificial sweeteners
Sucrose
HFMS
Fig. 1. Overview of the global sweeteners and bio-ethanol production.Sources: Berg (2004), Campos (2006), International Sugar Organization (2007), and Van der Linde et al. (2000).
204 W. Gerbens-Leenes, A.Y. Hoekstra / Environment International 40 (2012) 202–211
Sugar beet is a root crop growing in temperate climates. The mainproducers are France (12% of global production), the US (11%),Germany (10%), the Russian Federation (8%), Turkey (6%), the Ukraine(6%), Poland (5%), Italy (4%) and China (4%) (FAO, 2011). Althoughsugar beet has high ethanol yields per hectare (Rajagopal andZilberman, 2007), the use for ethanol is limited compared to sugarcane. Fig. A2 in Appendix A shows the production systems for sugarand bio-ethanol from sugar beet (Cheesman, 2004; CIBE/CEFS,2003; Henke et al., 2006; Vaccari et al., 2005). The basis for beetsugar and bio-ethanol production is beet juice. Molasses also providebio-ethanol.
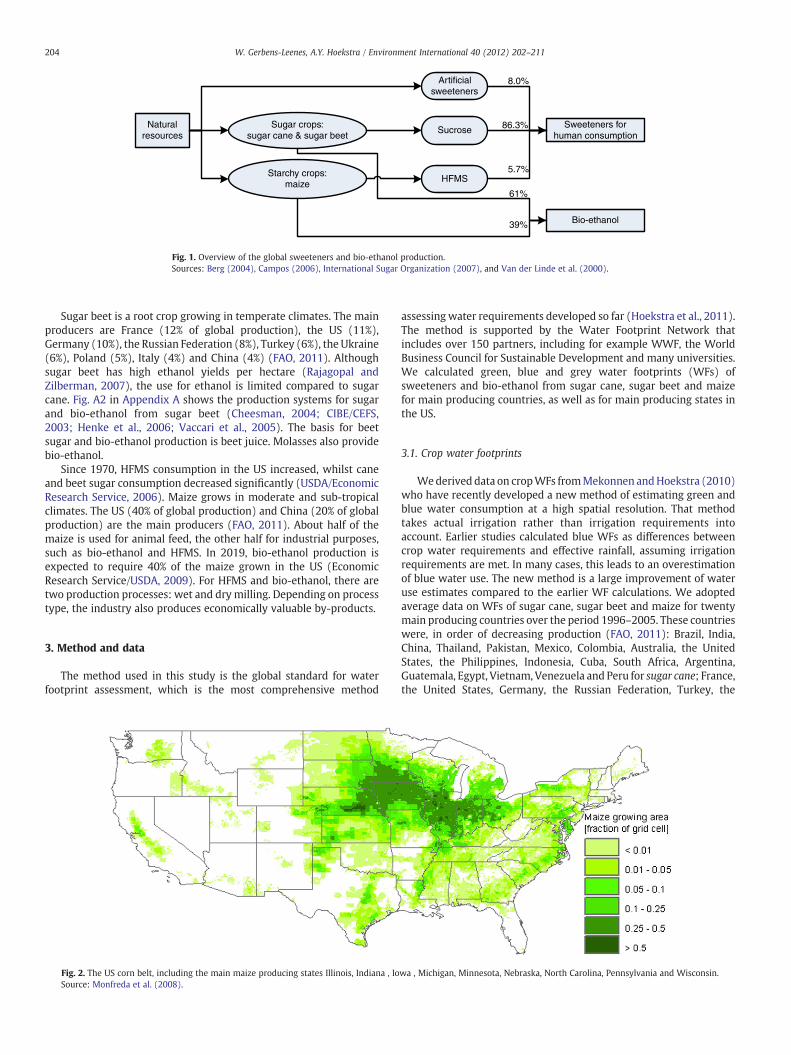
Since 1970, HFMS consumption in the US increased, whilst caneand beet sugar consumption decreased significantly (USDA/EconomicResearch Service, 2006). Maize grows in moderate and sub-tropicalclimates. The US (40% of global production) and China (20% of globalproduction) are the main producers (FAO, 2011). About half of themaize is used for animal feed, the other half for industrial purposes,such as bio-ethanol and HFMS. In 2019, bio-ethanol production isexpected to require 40% of the maize grown in the US (EconomicResearch Service/USDA, 2009). For HFMS and bio-ethanol, there aretwo production processes: wet and dry milling. Depending on processtype, the industry also produces economically valuable by-products.
3. Method and data
The method used in this study is the global standard for waterfootprint assessment, which is the most comprehensive method
Fig. 2. The US corn belt, including the main maize producing states Illinois, Indiana , IoSource: Monfreda et al. (2008).
assessingwater requirements developed so far (Hoekstra et al., 2011).The method is supported by the Water Footprint Network thatincludes over 150 partners, including for example WWF, the WorldBusiness Council for Sustainable Development and many universities.We calculated green, blue and grey water footprints (WFs) ofsweeteners and bio-ethanol from sugar cane, sugar beet and maizefor main producing countries, as well as for main producing states inthe US.
3.1. Crop water footprints
Wederived data on cropWFs fromMekonnen andHoekstra (2010)who have recently developed a new method of estimating green andblue water consumption at a high spatial resolution. That methodtakes actual irrigation rather than irrigation requirements intoaccount. Earlier studies calculated blue WFs as differences betweencrop water requirements and effective rainfall, assuming irrigationrequirements are met. In many cases, this leads to an overestimationof blue water use. The new method is a large improvement of wateruse estimates compared to the earlier WF calculations. We adoptedaverage data on WFs of sugar cane, sugar beet and maize for twentymain producing countries over the period 1996–2005. These countrieswere, in order of decreasing production (FAO, 2011): Brazil, India,China, Thailand, Pakistan, Mexico, Colombia, Australia, the UnitedStates, the Philippines, Indonesia, Cuba, South Africa, Argentina,Guatemala, Egypt, Vietnam, Venezuela and Peru for sugar cane; France,the United States, Germany, the Russian Federation, Turkey, the
wa , Michigan, Minnesota, Nebraska, North Carolina, Pennsylvania and Wisconsin.

WF sugar cane
0
100
200
300
400
500
Peru
Argen
tina
Colom
biaBra
zil
Austra
lia
Guate
mala
South
Afri
caEgy
pt
Philipp
ines
Mex
icoChin
a
Global
weight
ed av
erag
eUSA
Vene
zuela
Indo
nesia
Thaila
nd
Viet N
am India
Pakist
anCub
a
m3 /
ton
Grey WF
Blue WF
Green WF
Fig. 3. The water footprint of sugar cane for the main producing countries including the weighted global average value.
205W. Gerbens-Leenes, A.Y. Hoekstra / Environment International 40 (2012) 202–211
Ukraine, Poland, Italy, China, the United Kingdom, Spain, Belgium–
Luxembourg, the Netherlands, Iran, Japan, Egypt, Czech Republic,Serbia, Morocco and Denmark for sugar beet; and the United States,China, Brazil, Mexico, Argentina, France, India, Indonesia, Italy,South Africa, Canada, Romania, Hungary, Egypt, Nigeria, Serbia andMontenegro, the Ukraine, the Philippines, Spain and Thailand formaize. TheUS is responsible for 40% of globalmaize production,mainlyin the so-termed corn belt (Fig. 2). Moreover, the US aims to increasebio-ethanol production. Formaize (corn), the study therefore includedthe main producing US states: Illinois, Indiana, Iowa, Michigan,Minnesota, Nebraska, North Carolina, Pennsylvania and Wisconsin(USDA/Agricultural Statistics Service, 2008).
To grow crops, farmers apply fertilisers containing nitrogen andphosphorus and pesticides that partly leach to groundwater andcontribute to greyWFs.We took nitrogen as an indicator for greyWFs,assuming that on average 10% of total nitrogen applications leachto groundwater or run off to surface water streams (Chapagainet al., 2006). For the assessment of grey WFs, we adopted data fromMekonnen and Hoekstra (2010).
WF su
0
100
200
300
400
500
Belgium
Fran
ce
Denm
ark
the
Nethe
rland
s
United
King
dom
Germ
any
Japa
n
Czech
Rep
ublic
Italy
Spain
U
Global
weigh
m3 /
ton
Grey WF
Blue WF
Green WF
Fig. 4. The water footprint of sugar beet for the main producin
3.2. The water footprint of sugar, HFMS and bio-ethanol
For the assessment of the WF of sugar, HFMS and bio-ethanol, thecomplete production chain needs to be taken into account, includingwater use for crop processing into final products. Process water forcane sugar varies between 1 and 21 m3 per tonne (Macedo, 2005;Moreira, 2007). For sugar beet, plant process water use concerns beetwashing. Water consumption ranges from 0 to 4.5 m3 per tonne beet(Vaccari et al., 2005). For the production of bio-ethanol, Wu (2008)estimated water use of 3.5 l per litre bio-ethanol for dry milling and3.9 l for wet milling. Shapouri and Gallagher (2005) estimated thatbio-ethanol production requires between 1 and 11 l of water per litrebio-ethanol, with an average of 4.7 l. Using Wu's assumption, with anaverage yield of 503 l of bio-ethanol per tonne of grain for dry millsand 490 l of bio-ethanol for wet mills, water use is 1.7 m3 per tonnemaize (dry milling) or 1.9 m3 per tonne (wet milling).
The production of sugar and bio-ethanol also generates by-productswith an economic value. To calculate the WF of these products and by-products, we adopted the allocation methodology as in Hoekstra et al.
gar beet
SA
ted
aver
age
Mor
occo
Serbia
Turk
ey
Poland
Ukrain
e
Russia
n Fe
dera
tionChin
aEgy
ptIra
n
g countries including the weighted global average value.

WF maize
0
1000
2000
3000
Germ
any
Canad
a
Fran
ce Italy
US weig
hted
aver
ageSpa
in
Thaila
nd
Roman
ia
Argen
tina
China
Global
weight
ed av
erag
e
Ukrain
eEgy
pt
Indo
nesia
Brazil
South
Afri
ca
Philipi
nnes
Mex
ico
Nigeria
India
m3 /
ton
Gray
Blue
Green
Fig. 5. The water footprint of maize for the main producing countries including the weighted global average value.
206 W. Gerbens-Leenes, A.Y. Hoekstra / Environment International 40 (2012) 202–211
(2011). We allocated theWF of the crop over crop products by dividingthe cropWF (WFcrop) by the product fraction fp[p]. The product fractionis defined as the ratio of the product mass (kg) to the aggregated massof the crop (kg). Next, we distributed theWF over all the products withan economic value according to their value fraction fv[p]. The valuefraction is defined as the ratio of the product with an economic value tothe aggregated market value of all products obtained from the crop.Finally, to calculate theWF of a productWFprod[p], one needs to add theprocess water footprint WFproc[p]. The WF of product or by-productp is calculated according to:
WFprod p½ � = WFproc p½ � + WFcropfp p½ �
!× fv p½ � ð1Þ
The assessment of product and value fractions is given inAppendix A. To provide a better insight into the differences amongWFs for similar products derived from different crops, we introducedthe WF allocation factor defined as the ratio of the value fractionto the product fraction.
3.3. Sustainability assessment
A sustainability assessment aims to compare human footprintswith the carrying capacity of the earth (Hoekstra et al., 2011). Tomakean environmental sustainability assessment for water, one will needto put blue and green WFs in the context of the blue and green wateravailability in the catchment where the footprints occur. Similarly, thegrey WF in a catchment is to be regarded in the context of the wasteassimilation capacity in the catchment (Hoekstra et al., 2011). Anenvironmental sustainability assessment for water consists of four
Sugarbeet growing areas - Ukrain
fraction
0 - 0.006
0.006 - 0.015
0.015 - 0.03
0.03 - 0.05
0.05 - 0.065
Wate
%
Fig. 6. Sugar beet growing areas (Ramankutty, 2008) and
steps; (i) identification of sustainability criteria; (ii) identification ofhotspots; (iii and iv) identification and quantification of primary andsecondary impacts in the hotspots.
3.4. Environmental sustainability of the blue water footprint
Blue water availability in a catchment – the amount of wateravailable for humans to use – is defined as the natural run-off in thecatchment minus the environmental flow requirement. As a rule ofthumb, environmental flow requirements are about 80% of naturalrunoff if one does not allow more than a slight modification of theecological status of the river (Hoekstra et al., 2011). To estimate theenvironmental sustainability of sugar cane, sugar beet and maize, wecalculated the fractionof available bluewater for agriculture in a countryneeded to grow those crops. Available blue water for agriculture in acountry was calculated by subtracting environmental flow require-ments and 5% of industrial and household water withdrawals from thetotal renewable water resources. The factor 0.05 is applied to convertwithdrawals to consumptive use (AQUASTAT, 2011). We deriveddata on renewable water resources and industrial and domestic waterwithdrawals from AQUASTAT (2011).
3.5. Hotspots
We selected three hotspots where large-scale sugar productiontakes place, but do not give a detailed analysis of impacts. Thehotspots are three river basins experiencing water stress: the Dnieperbasin (Ukraine), with sugar beet, and the Indus and Ganges basins(India and Pakistan), with sugar cane. The study discusses waterstress in these basins by combining data on sugar beet and sugar canelocations, WFs and information on withdrawal-to-availability ratios.
r withdrawal-to-availability ratio
0 - 10
10 - 20
20 - 30
30 - 40
40 - 50
50 - 60
60 - 70
70 - 80
80 - 90
90 - 100
> 100
water withdrawal-to-availability ratio in the Ukraine.

Sugarcane growing
fraction
0 - 0.015
0.015 - 0.07
0.07 - 0.15
0.15 - 0.35
0.35 - 0.56
Ganges Riverbasin
Indus Riverbasin
Water withdrawal-to-availability ratio
%
0 - 10
10 - 20
20 - 30
30 - 40
40 - 50
50 - 60
60 - 70
70 - 80
80 - 90
90 - 100
> 100
Fig. 7. Sugar cane areas in India and Pakistan (Ramankutty, 2008) and water withdrawal-to-availability ratio for the Indus and Ganges basin.
207W. Gerbens-Leenes, A.Y. Hoekstra / Environment International 40 (2012) 202–211
3.6. Environmental sustainability in a global context
Because of international commodity trade, places of productionand places of consumption do not necessarily coincide. Given thatalso many water-intensive commodities are internationally traded,the indirect demand for water that underlies the consumption ofwater-intensive commodities in a river basin does not need to matchthe supply of freshwater resources in that basin. Rather, waterdemand and supply need to match at the global level. The amount ofglobally available water is limited, however. Estimates suggest thatthe annual global green WF of agriculture is 5771 Gm3, the blue WF899 Gm3 and the grey WF 734 Gm3 (Mekonnen and Hoekstra, 2010).From a sustainability perspective, it is necessary to improve thewise use of globally available water. Therefore, we also assessed the
and
Bagasse
Mechanical harvesting
Manual harvesting
Burning
Washing Milling
Tops and leaves
BoilingSteam and electricity
Filter mud /cake
Filtering an
and
and
Clean stalks
Bagasse
Tops and leaves
Clean stalks Crops as delivered at plant
Traded (by-) product or with economic value
Untraded (by-) product or with low/now economic value
Possible process but not commercially utilized yet
and and
Sugar caneand
Fig. A1. The cane sugar production system.Sources: Cornland et al. (2001), Moreira (2007)
fraction of globally applied green, blue and grey waters for sugar cane,beet and maize.
4. Results
4.1. The water footprint of sugar cane, sugar beet and maize
Fig. 3 shows the WFs of sugar cane (m3/tonne), Fig. 4 the WFs of sugar beet andFig. 5 the WFs of maize. There are large differences for similar crops that are caused bydifferences in climate and differences in yields (tonne per ha). Some countries haveunfavourableWFs, far above the global average, e.g. for sugar cane Cuba, Pakistan, India,Vietnam and Thailand. Egypt, India and Pakistan heavily rely on blue water forirrigation. For sugar beet, Iran, China, Egypt and Ukraine have WFs far above the globalaverage, whilst western European countries have WFs below the global average.Especially grey WFs are great for Poland and China indicating that much nitrogen isleaking or applied in too large amounts, polluting water bodies. For maize, developing
Juice
Evaporation Sucrose
Molasses
Fermentation Distilation Ethanol
Boiler andfly ash
or
or
and
d
Hydrolysis Vinasse
Crystalization Centrifugation
Fermentation
Distilation
and
and and
, Shleser (1994), and Smeets et al. (2006).

andSugar beet
Mechanical harvesting
Cutting Juice
Trash
Evaporation Sucrose
Molasses
Purification Crystalization
Beet pulp
Filtering
Centrifuging Drying
Fermentation
Distilation
EthanolFermentation Distilation
or
or
andand
Sugar factory lime
Beet pulp
Sugar factory lime
Sugar beet Crops as delivered at plant
Traded (by-) product or with economic value
Untraded (by-) product or with low/no economic value
andWashing
Fig. A2. The beet sugar production system.Source: CIBE/CEFS (2003).
208 W. Gerbens-Leenes, A.Y. Hoekstra / Environment International 40 (2012) 202–211
countries like India, Nigeria, Mexico and the Philippines have relatively great WFs,whilst developed countries like Germany, France, the US, Canada and Spain haverelatively small WFs. For all three crops, Egypt almost completely relies on irrigation.
Table 1 gives the WFs for the main maize producing states in the US, as well as theUS weighted average. Variation among states is small, with Nebraska and Illinois theonly exceptions. Nebraska uses a relatively great amount of blue water, Illinois has agreat grey WF and in this way these states influence the average US values. US values,however, are much smaller than global averages, indicating relatively favourableproduction and climatic circumstances.
4.2. The WF of sugar, HFMS and bio-ethanol
The WFs of sugar, HFMS and bio-ethanol are a function of crop WFs, product andvalue fractions and process water use (Eq. (1)). Table 2 gives the product and valuefractions that determine theWFmultiplication ratio. It shows that for the production ofsugar or bio-ethanol, maize is themost favourable cropwith amultiplication ratio of 2.0and 4.3 respectively. Sugar cane is the most unfavourable crop, requiring more than sixtimes the crop WF to produce sugar (m3 per tonne) and fifteen times the crop WF toproduce bio-ethanol (m3 per tonne). Results for WFs of crops indicate that processwater use is almost negligible compared to crop WFs.
5. Environmental sustainability assessment
5.1. Environmental sustainability of the blue water footprint
In eight of the twenty main sugar cane producing countries, sugarcane production requires a substantial share (5% or more) of totalavailable blue water for agriculture. These countries are Guatemala(5%), Mexico (7%), Thailand (10%), India (13%), Egypt (23%), South
Table 1Green, blue and grey WFs for the main maize producing states in the US, the USweighted average values and standard deviations.
US state Green WFm3 per tonne
Blue WF Grey WF
Illinois 578 5 192Indiana 526 7 172Iowa 553 2 177Michigan 466 14 163Minnesota 525 4 165Nebraska 443 191 153North Carolina 528 4 152Pennsylvania 458 3 158Wisconsin 465 3 158US weighted average 522 63 176US SD ±127 ±63 ±78
Africa (25%), Pakistan (48%) and Cuba (78%). Half of the sugar beetproducing countries show blue water requirements of 5% or more oftotal available water for agriculture in the country. These countriesare France (5%), Germany (5%), Turkey (6%), Belgium (6%), Iran (6%),Poland (7%), Morocco (8%), the Czech Republic (8%), Denmark (10%)and Ukraine (12%). For maize, also half of the producing countriesshow blue water footprints of 5% or more of total available water foragriculture in the country. These countries are Italy (5%), China (7%),France (7%), South Africa (8%), Nigeria (8%), the US (9%), Ukraine(12%), Romania (13%), Mexico (14%) and Egypt (16%). It can beexpected that in countries that rely on irrigation, e.g. in Egypt, Pakistanor India, irrigation requires a substantial share of available water.An unexpected result is that this is also the case for some westernEuropean countries that are not known as countries encounteringwater stress, e.g. Denmark, Belgium, Germany and France. The reasonis that a great part of available water is consumed by industry, whilsteighty percent is allocated to the environment.
5.2. Hotspots
5.2.1. Dnieper basin in the UkraineUkraine is a large net exporter of virtual water (Hoekstra and
Chapagain, 2008; Hoekstra and Hung, 2002) with large productionof sugar beet. 47% of the total sugar beet WF in Ukraine is bluewater. The Dnieper is the main river in Ukraine. Agriculture uses 90%of total water consumption in Central Asia (UNECE, 2006). Surfacewater is overexploited for irrigation and groundwater is overusedfor public freshwater supply. Fig. 6 compares sugar beet growing areasin Ukraine with a map of water withdrawal-to-availability ratios,
Table 2Product fractions, value fractions and WF multiplication ratios for sugar, HFMS andbio-ethanol from sugar cane, sugar beet and maize.
Product Product fraction Value fraction WF multiplicationratio
Cane sugar 0.14 0.87 6.2Beet sugar 0.16 0.89 5.6Maize sweetener (HFMS) 0.36 0.73 2.0Cane bio-ethanol 0.06 0.89 14.8Beet bio-ethanol 0.09 0.92 10.2Maize bio-ethanol 0.15 0.65 4.3

209W. Gerbens-Leenes, A.Y. Hoekstra / Environment International 40 (2012) 202–211
showing main beet producing areas in central Ukraine. Areas withlarge water stress are on the Krim and in the south. Sugar beet areashave relatively low water withdrawal-to-availability ratios and arenot located in the most water-stressed parts of Ukraine.
An important problem is water pollution (Fabry et al., 1993).Pollution in the Dnieper causes environmental damage to the BlackSea ecosystem. Besides pollution by excessive use of fertilisers,industrialization and lack of waste water treatment also influencewater quality. Future impacts might include effects of climate changeand the construction of dams (Palmer et al., 2008). The relatively largegreyWF of sugar beet in combination with large production contributesto the total grey WF of the catchment.
5.2.2. The Ganges and Indus basins in India and PakistanTheGanges is the largest riverof India.Althoughannualprecipitation
is locally above ten metres, periodically the basin experiences severewater stress. Studies by Rosegrant et al. (2002), Alcamo and Henrichs(2002), Alcamoet al. (2003) and Smakhtin et al. (2004) envisage seriouswater scarcity in the Ganges basin in future. The Indus originates on theTibetan Plateau and finds its way through India and Pakistan to theArabian Sea. The river basin area is over a million square kilometres, ofwhich 320,000 km2 belong to India. For Pakistan, the Indus is the largestriver. Agriculture is important in the Indus basin. Fig. 7 shows the areaswhere sugar cane is cultivated and the water-to-availability ratio. InIndia, sugar cane cultivation occurs south of the Himalaya and in thesouth west. The greenWF of sugar cane varies between 92 (Rajasthan)and 102 (Delhi) m3 per tonne in an area outside the Ganges basin, and300 (Assam) and 315 (Tripura) m3 per tonne inside the basin in theNorth East of the country (Mekonnen andHoekstra, 2010). The blueWFvaries between 10 (Tripura) and 25 (Assam) on the one hand, and 169(Delhi) and 192 (Rajasthan) m3 per tonne. Grey WFs range between9 m3 per tonne in Assam and Tripura and 17 m3 per tonne in the rest ofthe country. The Indian average values are 141 (green), 104 (blue) and17 (grey) m3 per tonne. For maize, green WFs range between 1330(Arunachal Pradesh) and 3537 (Daman and Diu) m3 per tonne; blueWFs between 0 (large part of India) and 453 (Karnataka), whilst greyWFs range between 156 (Assam) and 335 (Daman and Diu) m3 pertonne. The Indian average values are 2239 (green), 103 (blue) and 195(grey) m3 per tonne. In India, sugar beet is not a common crop. Theresults for sugar cane and maize in combination with results formTable 2 show that in India sugar cane is the most favourable crop forsugar and bio-ethanol, but also that there are great differences amongregions. The main sugar cane producing area in India is water scarce,showing a water withdrawal-to-availability ratio between 40 and 50%.In the southwest, the water stress is even higher, between 90 and 100%.In Pakistan, sugar cane is grown in the Indus basin, an area with severewater stress.
From total Indus discharge in Pakistan, only a small part drains tothe Arabian Sea, most water flows to canals for utilisation. Ground-water is overexploited and groundwater quality is deteriorating,causing soil salinization. Problems occur regarding maintenance ofwater infrastructure, governance, trust and productivity in thePakistani part of the basin (Royal Netherlands Embassy in Islamabad,Pakistan and Netherlands Water Partnership, 2007). The large WFsfor sugar cane in the water scarce Ganges and Indus basins have anegative impact on environmental sustainability.
5.3. Environmental sustainability in a global context
Globally, the production of sugar cane, beet and maize requiresa small share of total green water for agriculture, 2.2, 0.2 and 2.7%respectively. The share of blue water is larger, however, 15.9, 2.1and 11.7% respectively, indicating that the crops grown for sugar andbio-ethanol have relatively large irrigation requirements.
6. Discussion
TheWF is a volumetric measure, showing freshwater consumptionand pollution in time and space, providing information on how waterresources are allocated to different purposes. The WF of sugar or bio-ethanol shows the ‘water allocated’ to that product that cannotbe allocated to another product. The appropriated water volumefor a process or product provides key information in the allocationdiscussion, but does not provide information onwhether it contributesto an immediate problem of water scarcity or pollution within thecatchment where it occurs. For the purpose of visualising the localimpact, onewill need to put the green andblueWFof a specific productin the context of the green and bluewater availability in the catchmentwhere the footprint occurs. The grey WF of a specific product in acatchment needs to be regarded in the context of the water pollutionlevel in the catchment. It is relevant to know the size and colour of aWF, to knowwhenandwhere it occurs and inwhich context (degree ofwater scarcity, water pollution level). Aggregating this informationinto three indices or synthesising the three into one overall indexmeans that all information is covered. It should also be noted thattheWF sustainability indices account for environmental sustainabilityonly, not social or economic ones.
Our sustainability analysis at a hotspot level indicated that sugarcane production in India and Pakistan aggravates water stress. Thisis an expected result (WWF, 2005). Especially in densely populatedpoor developing countries, water scarcity occurs in a complex context.Water is not only needed to grow sugar cane, but also for other waterintensive crops like rice, the basic staple food in India and Pakistan(FAO, 2011). Our environmental blue water sustainability assessment,however, also provided unexpected results. It showed that in somecountries without hotspot areas, e.g. in western Europe, the productionof sugar beet andmaize takes an important share of bluewater availablefor agriculture. This has to do with the large water requirements ofindustry and the allocation of water to nature. In western countries, theindustrial water requirements are relatively large (AQUASTAT, 2011).When industrial water requirements in developing countries alsoincrease, this will cause competition with agriculture, increasing waterstress situations. Our analysis on a global scale showed that today, theproduction of crops for sugar and bio-ethanol requires a substantialshare of available blue water. When more bio-ethanol is produced, thismight requiremore bluewater if production is continued along existinglines. Our analysis, however, also indicated that some countries haveWFs far above global average values, indicating that there is space formore efficient production.
The US is the only country that uses maize on a large scale asfeedstock for sweetener and bio-ethanol production. In the US, maizeis the favourable feedstock with the smallestWF for sweetener as wellas for bio-ethanol. The weighted average WF for maize in the US is763 m3/tonne, which is below the global average. Only in Nebraska,maize production has great irrigation requirements.
Another issue is that crops for sugar and bio-ethanol, sugar cane,sugar beet and maize grow in different climates. This means that localconditions determine which crop is grown and farmers cannot easilyshift to another crop. However, the amount of water to produce a unitof product differs, in combination with water availability. This meansthat in order to use globally available water in the most efficient wayfor the production of sweeteners and bio-ethanol, also crop types andlocations need to be taken into account.With respect to environmentalsustainability, there aremore aspects thanwater alone. Environmentalimpacts also include impacts on soil health, e.g. compaction, erosion,salinisation and acidification, impacts on biodiversity, e.g. habitatdestruction for cane cultivation, impacts of intensive use of chemicals,and air pollution, e.g. caused by pre-harvest burning around sugarcane fields (Cheesman, 2004; WWF, 2005). We focused on the waterperspective of sweeteners and bio-ethanol production, which can beused to formulate better management practises for sugar cane, beet

210 W. Gerbens-Leenes, A.Y. Hoekstra / Environment International 40 (2012) 202–211
and maize production. With annual production expanding (WWF,2005), better practises are needed.
The study made several assumptions. First, we used the allocationmethod of Hoekstra and Chapagain (2008) based on product fractionsand value fractions, resulting in WFs depending on fluctuating worldproduct prices, givingfluctuatingWFs. The study therefore took averageprices for 1996–2005. Second, this study assumed small processwater use. With large variation in literature on process water use (e.g.Cheesman, 2004), modern industry recycles water and reduces use toalmost zero. For the grey WF, process water recycling and waste watertreatment are important. We assumed industry recycles process waterand does not release waste water, probably underestimating processwater use. The assumption does not have a large impact on results,because process water use is small compared to total WFs.
When compared to earlier studies, our results fall in the ranges foundearlier. For the US, Dominguez-Faus arrived at a water requirementfor bio-ethanol between 500 and 4000 l per litre bio-ethanol. Chiu et al.(2009) indicated that bio-ethanol's water requirements range from5 to 2140 l irrigation water per litre bio-ethanol.
7. Conclusions
Theweighted global averageWFof sugar cane is 209 m3/tonne, andranges between 120 and 410 m3/tonne, of sugar beet 133 m3/tonne(ranges between 37 and 446 m3/tonne) and of maize 1222 m3/tonne,(ranges between 566 and 2537 m3/tonne). The large ranges in WFsindicate that there is ample room to improve WFs of crops forsugar and bio-ethanol and use water more efficiently. In general, it ismore favourable to use maize as a feedstock for sweeteners or bio-ethanol than sugar beet or sugar cane. This is expressed in the WFmultiplication ratio, the factor applied to convert cropWFs to productWFs. For sugar, the multiplication ratio is 2.0 for maize and 5.6 and 6.2for sugar beet and sugar cane. For bio-ethanol, the ratio is 4.3 (maize),10.2 (sugar beet) and 14.8 (sugar cane).
Differences in WFs are mainly caused by two variables, crop waterrequirements and yields. Crop water requirements show variation anddepend on factors such as crop type, climate and soil characteristics.Some countries, for example Egypt, depend on irrigation, whilst othercountries, for example Japan growing sugar beet, have small irrigationrequirements. The yield levels differ between countries because ofgrowing conditions and agricultural practises. AllWF estimates are basedon current conditions, so they do not reflect what is technologicallypossible. Many of the large WFs can probably be reduced with betterpractises.
In general, grey WFs are about ten percent of total WFs andcontribute to water pollution. In some countries, however, grey WFsof maize-based products contribute to twenty percent of total WFs.At present, water stress is a problem in many parts of the world.Especially sugar cane is grown in water scarce river basins, as wasindicated for the Indus and Ganges basins. Sugar beet also has animpact on water quantity and quality in major river basins, such asthe basins of the Dnieper, where especially the greyWF contributes towater pollution. In some western European countries, blue waterrequirements for sugar beet andmaize are large compared to availableblue water. This is caused by large industrial and environmental waterrequirements. The globe's water resources are limited and allocationof water to bio-ethanol on a large scale will be at the cost of waterallocation to food and nature. In the light of increased interest forbiofuels, the availability of sufficient water to produce sweeteners andbio-ethanol forms a great challenge.
Acknowledgement
We thank our former student Wolter Scholten who devotedhis MSc thesis on the topic and whose work has formed the basis forthis paper.
Appendix A. Allocation of WF over economically valuable cropparts
For sugar cane, beet and maize, the FAOSTAT database providesannual yields. For maize, the FAO (2011) gives grain yields. Wecalculated WFs based on economically valuable crop parts. Stoverforms 56% of the total maize crop and has economic value.We therefore included stover and estimated total maize yields by:Y(c)=y(c)+stover, where y(c) is the maize yield (FAO, 2011) andstover is 56/44 ∗y(c). Yield data y(c) were derived from the FAO(2011) and data on US maize yields from the USDA/AgriculturalStatistics Service (2008). Sugar cane, beet and maize provide sugar,bio-ethanol and byproducts, e.g. stover and bagasse. For sugar cane,information is available from Allen et al. (1997), for sugar beetfrom Kranjc et al. (2006). Each product or byproduct has a marketprice (US$/tonne) and contributes to market prices of root products. Tocalculate average value fractions, we derived data from UNCTAD/WTO(2007).
Filter cake and vinasse are often used as fertiliser, reducing otherfertiliser use by 50% (Leal, 2005; Moreira, 2007). We determined filtercake and fertiliser values. For the calculation of the WF of bio-ethanolfrom sugar cane, the study assumed similar values for filter cake andvinasse. The US Department of Agriculture (USDA/Economic ResearchService, 2006) estimated total fertiliser costs for sugar cane at US$100per hectare for 1996–2005. With vinasse and filter cake application,this is US$50, giving a value for filter cake and vinasse of US$50 ($25per hectare for filter cake and $25 for vinasse). Application ratesof 2600 kg filter cake/ha and 1635 kg vinasse (dry matter)/ha givefilter cake values of US$10/tonne and US$15/tonne for vinasse. Wealso used filter cake values for assessing value fractions in sugarproduction. For bio-ethanol by-products from sugar cane, the studyused similar values.
We derived price data from the SITA-database of the InternationalTrade Centre (UNCTAD/WTO, 2007). For the six main producingcountries, we calculated average export prices for 1996–2005. Foreach exporter the countries that together account for more than 80%of total export were used to calculate (by) product values. Whenless than three countries account for 80% of the export, a minimumof three importing countries was used. When for a country no datawere available, the study estimated an average value fraction toestimate a global value. When SITA data were unavailable, the studyused other sources. For cane sugar and molasses, prices derive fromSITA export prices. The study assessed bagasse values from amountsof energy produced by burning to generate electricity and steam.Several studies (Leal, 2005; Mohee and Beeharry, 1999; Paturau,1989) indicate energy production between 360 and 510 kWh pertonne bagasse. Using average prices of 0.04 US$/kWh, the studycalculated the bagasse value fraction.
SITA excludes bio-ethanol. We used averages of current andexpected prices from FAPRI (2008). The study based bio-ethanolprices on average US (US$ 0.51) and Brazilian prices (US$ 0.37), givingan average of US$0.44. Sugar is the most valuable product of beetprocessing. According to ISR (2005), total values of by-products(molasses, beet pulp and lime) are €14 per tonne beet, correspondingto SITA market values on which we based value fraction calculations.For bio-ethanol production from beet, we included one by-product,beet pulp. Data on bio-ethanol values from sugar beet and cane camefrom FAPRI (2008). Sugar beet pulp values derived from the USDA(2006) (US$6 per tonne) and ISR (2005) (molasses, beet pulp and lime€14 per tonne). We estimated beet pulp values at US$10 per tonne.Value fractions of maize based bio-ethanol and HFMS's by-productsderived from the USDA cost of production survey (Shapouri andGallagher, 2005). The HFMS 55 value derived from average USMidwest prices from the Economic Research Service/USDA (2009).Prices of maize gluten meal, maize gluten feed, crude maize oil, DDGSand HFMS 55 are available for 2000–2003. This study took stover into

211W. Gerbens-Leenes, A.Y. Hoekstra / Environment International 40 (2012) 202–211
account because it represents an economic value for farmers reducingfertiliser application. 5% of the stover is used for animal bedding andfeed (ILSR, 2002).
References
Alcamo J, Henrichs T. Critical regions: a model-based estimation of world waterresources sensitive to global changes. Aquat Sci 2002;64:352–62.
Alcamo J, Döll P, Henrichs T, Kaspar F, Lehner B, Rösch T, et al. Global estimates of waterwithdrawals and availability under current and future “business-as-usual”conditions. Hydrol Sci J Sci Hydrol 2003;48(3):339–48.
Allen CJ, MackayMJ, Aylward JH, Campbell JA. New technologies for sugar milling and by-product modification. In: Keating BA, Wilson JR, editors. Intensive sugar caneproduction:meeting the challengesbeyond2000.Wallingford, UK: CAB International;1997. p. 267–85.
AQUASTAT. www.fao.org/nr/water/aquastat/countries/index.stm 2011. accessed 11-3-2011.
Berg C.World fuel ethanol, analysis and outlook. Presentation prepared for theMinistry ofEconomy, Trade and Industry of Japan; 2004 www.meti.go.jp/report/downloadfiles/g30819b40j.pdf.
Berndes G. Bio-energy and water—the implications of large-scale bio-energy produc-tion for water use and supply. Glob Environ Change 2002;12:253–71.
Blok K. Introduction to energy analysis. Amsterdam, the Netherlands: Techne Press; 2006.Campos LO. Still time to fuel up. Credit Suisse First Boston, USA; 2006.Chapagain AK, Hoekstra AY. Water footprints of nations, Value of Water Research
Report Series No.16. Delft, the Netherlands: UNESCO-IHE; 2004.Chapagain AK, Hoekstra AY. The water footprint of coffee and tea consumption in the
Netherlands. Ecol Econ 2007;64(1):109–18.Chapagain AK, Hoekstra AY, Savenije HHG, Gautam R. The water footprint of cotton
consumption: an assessment of the impact of worldwide consumption of cottonproducts on the water resources in the cotton producing countries. Ecol Econ2006;60(1):186–203.
Cheesman OD. Environmental impacts of sugar production. Wallingford, Oxfordshire,UK: CABI Publishing; 2004.
Chiu Y, Walseth B, Suh S. Water embodied in bioethanol in the United States. EnvironSci Technol 2009;43:2688–92.
CIBE/CEFS. Environmental report, beet growing and sugar production in Europe,International Confederation of European Beet Growers (CIBE), Paris, France andComité Européen des Fabricants de Sucre (CEFS), Brussels, Belgium; 2003.
Cornland DW, Johhson FX, Yamba F, Chidumayo EN, Morales MM, Kalumiana O, et al.Sugarcane resources for sustainable development: a case study in Luena, Zambia.Stockholm, Sweden: Stockholm Environment Institute; 2001.
Coultate TP. Food, the chemistry of its component. 2nd edition. London, UK: RoyalSociety of Chemistry; 1989.
De Fraiture C, Giordano M, Liao YS. Biofuels and implications for agricultural water use:blue impacts of green energy. Water Policy 2008;10:67–81.
Dominguez-Faus R, Powers SE, Burken JG, Alvarez PJ. The water footprint of biofuels:a drink or drive issue. Environ Sci Technol 2009;43(9):3005–10.
Ensymm. Project study for the enzymatic production of high fructose syrup (HFS).Düsseldorf, Germany: Ensymm Company; 2005.
European Commission. Renewable energies. http://ec.europa.eu/energy/renewables/index_en.htm 2009. Accessed: January 12, 2010.
Fabry V, Frohlich K, Osvath I. Environmental pollution of the Black Sea: a search foranswers. Features IEA Bull 1993;2:20–4.
FAO. Food outlook. Globalmarket analysis. Rome, Italy: Food and Agriculture Organization(FAO); 2008.. Available atwww.fao.org.
FAO. FAOSTAT, food and agriculture organization. Rome, Italy. http://faostat.fao.org/default.aspx 2011.
FAPRI. US and world agricultural outlook. Ames, Iowa, US: US Food and AgriculturalPolicy Research Institute; 2008.
Fischer G, Hizsnyik E, Prieler S, Shah M, Van Velthuizen H. Biofuels and food security.Laxenburg, Austria: International Institute for Applied Systems Analysis; 2009.
Gerbens-Leenes PW, Hoekstra. The water footprint of sweeteners and bio-ethanol fromsugar cane, sugar beet and maize. Value of Water Research Report Series No. 38.Delft, The Netherlands: IHE; 2009.
Gerbens-Leenes W, Hoekstra AY, Van der Meer TH. The water footprint of bioenergy.Proc Natl Acad Sci 2009;106(25):10219–23.
Government of India, Ministry of New & Renewable energy. National policy on biofuels;2008 http://mnes.nic.in/policy.biofuel-policy.pdf (Accessed January 5, 2010).
Henke S, Bubník Z, Hinková A, Pour V. Model of a sugar factory with bio-ethanolproduction in program Sugars™. J Food Eng 2006;77:416–20.
Hoekstra AY. Virtual water trade: Proceedings of the International Expert Meeting onVirtual Water Trade, Delft, the Netherlands, 12–13 December 2002, Value of WaterResearch Report Series No. 12. Delft, The Netherlands: IHE; 2003.
Hoekstra AY, Chapagain AK. Globalization of water, sharing the planet's freshwaterresources. Oxford, UK: Blackwell Publishing Ltd.; 2008.
Hoekstra AY, Hung PQ. Virtual water trade: a quantification of virtual water flowsbetween nations in relation to international crop trade. Value of Water ResearchReport Series No. 11. Delft, The Netherlands: IHE; 2002.
Hoekstra AY, Chapagain AK, Aldaya MM, Mekonnen MM. The water footprintassessment manual: setting the global standard. London, UK: Earthscan; 2011.
ILSR. Talking about corn stover with Jim HettenhausThe carbohydrate economy, Volume No.4, Issue No. 2; 2002. summer 2002, Institute for Local Self-Reliance, Minneapolis, USA.
International Energy Agency (IEA).World energy outlook 2006. France: OECD/IEA Paris;2006.
International Sugar Organization. Statistical bulletin 2007, Vol. 66, No. 12. InternationalSugar Organization, London, UK; 2007.
ISR. Sugar beet growing in The Netherlands, Institute of Sugar beet Research, Bergen opZoom, the Netherlands; 2005.
KingCW,WebberME.Water intensity of transportation. Environ Sci Technol 2008;42(21):7866–72.
Kranjc D, Mele M, Glavič P. Improving the economic and environmental performancesof the beet sugar industry in Slovenia: increasing fuel efficiency and usingbyproducts for ethanol. J Cleaner Prod 2006;15:1240–52.
Lal R. World crop residues production and implications of its use as a biofuel. EnvironInt 2005;32:575–84.
Leal MRLV. Better sugar; better business, mill issues and co-products. London, UK:WWF workshop; 2005.
Macedo IC. Sugar cane's energy, twelve studies on Brazilian sugar cane agribusinessand its sustainability. Berlendis & Vertecchia, Saõ Paulo, Brazil: UNICA; 2005.
Mekonnen MM, Hoekstra AY. The green, blue and grey water footprint of crops andderived crop products. Value ofWater Research Report Series No. 47, IHE, Delft, TheNetherlands; 2010.
Mohee R, Beeharry RP. Life cycle analysis of compost incorporated sugarcane bioenergysystems in Mauritius. Biomass Bioenergy 1999;17:73–83.
Moreira JR. Water use and impacts due ethanol production in Brazil. www.iwmi.cgiar.org/EWMA/files/papers/Jose_Moreira.pdf 2007.
Monfreda, C., Ramankutty, N., Foley, J.A., 2008. Farming the planet: 2. Geographicdistribution of crop areas, yields, physiologic types, and net primary production inthe year 2000. Global Biochemical Cycles 22, GB 1022. www.geog.mcgill.ca/landuse/Data/175crops2000 (retrieved September 18 2008).
Palmer MA, Liermann CAR, Nilsson C, Flörke M, Alcamo J, Lake PS, et al. Climate changeand the world's river basins: anticipating management options. Frontiers inecology and the environment, The ecological society of America; 2008.
Paturau JM. By-products of the cane sugar industry: an introduction to their industrialutilization. Amsterdam/New York: Elsevier; 1989.
Pimentel D, Marklein A, Toth MA, Karpoff MN, Paul GS, McCormack R, et al. Food versusbiofuels: environmental and economic costs. Hum Ecol 2009;37:1–12.
RajagopalD, ZilbermanD.Reviewof environmental, economicandpolicy aspects of biofuels,policy research. Working Paper 4341. Washington, D.C., US: The World Bank; 2007.
Ramankutty N. http://geomatics.geog.mcgill.ca/~navin/pub/Data/175crops2000/ArcASCII 2008.
Rosegrant MW, Cai X, Cline SA. World water and food to 2025: dealing with scarcity.Washington, D.C., US: International Food Policy Research Institute (IFPRI); 2002.
Royal Netherlands Embassy in Islamabad, Pakistan and NetherlandsWater Partnership.Workshop on the water situation in Pakistan. The Hague: the Netherlands; 2007.
Shapouri H, Gallagher P. USDA's 2002 ethanol cost-of-production survey, AgriculturalEconomic Report Number 841. US: USDA; 2005.
Shleser R. Ethanol production in Hawaii, processes, feedstocks, and current economicfeasibility of fuel grade ethanol production in Hawaii. State of Hawaii, Departmentof business, economic development & tourism. Honolulu, Hawaii, USA; 1994.
Silva JF. Industrial processing integration of alcohol and sugar production, Cogenerationof electricity. Presentation during the World Bank Seminar on Brazil's EthanolExperience and its Transferability; 2006.
Smakhtin V, Revenga C, Döll P. A pilot global assessment of environmental waterrequirements and scarcity. Water Int 2004;29(3):307–17.
Smeets E, Junginger M, Faaij A, Walter A, Dolzan P. Sustainability of Brazilian bio-ethanol. Utrecht, The Netherlands: Copernicus Institute-Department of Science,Technology and Society; 2006.
UNCTAD/WTO. Statistics for International Trade Analysis (SITA), version 1.1, programmedby LEI; 2007.
UNECE. Integrate water resources management (IWRM) including transboundaryriver basin issues.Working paper No.3; 2006www.unece.org/env/water/meetings/wgwm/4meeting/wp3e.pdf.
UNEP. Towards sustainable production and use of resources: assessing biofuels. Paris,France: United nations environment programme; 2009.
USDA. Corn and soybeans: production costs and returns. www.nass.usda.gov/Statistics_by_State/Minnesota/Publications/Annual_Statistical_Bulletin/agstatbk2006/page088093.pdf 2006.
USDA. Yields 2009; 2009 www.nass.usda.gov.USDA/Agricultural Statistics Service. Agricultural statistics 2008. Washington, US: United
States Government Printing Office; 2008.USDA/Economic Research Service. ERS loss-adjusted food availability data, April 2006.
www.ers.usda.gov/data/foodconsumption/foodguideindex.htm 2006.Vaccari G, Tamburini E, Sgualdinoa G, Urbaniecb K, Klemeš J. Overview of the
environmental problems in beet sugar processing: possible solutions. J CleanerProd 2005;13:499–507.
Vander LindeM,MinneV,WooningA, Vander Zee F. Evaluationof the commonorganisationof the markets in the sugar sector. Rotterdam, The Netherlands: NEI; 2000.
Worldwatch Institute. Biofuels for transport, global potential and implications forsustainable energy and agriculture. London, UK: Earthscan; 2007.
Wu M. Analysis of the efficiency of the US ethanol industry 2007. Washington, USA:Renewable Fuels Association; 2008http://www.ethanolrfa.org/objects/documents/1652/2007_analysis_of_the_efficiency_of_the_us_ethanol_industry.pdf.
WWF. Agricultural water use and river basin conservation. World Wide Fund for Nature,Gland, Switzerland; 2003http://assets.panda.org/downloads/agwaterusefinalreport.pdf.
WWF. Sugar and the environment. Encouraging better management practices in sugarproductionWWF Global Freshwater Programme.; 2005 www.panda.org/freshwater.
Yang H, Zhou Y, Liu J. Land andwater requirements of biofuels and implications for foodsupply and the environment in China. Energy Policy 2009;37(5):1876–85.