the “virgo photometry catalogue”; a catalogue of 1180 galaxies in
TRANSCRIPT

ASTRONOMY & ASTROPHYSICS FEBRUARY I 1998, PAGE 367
SUPPLEMENT SERIES
Astron. Astrophys. Suppl. Ser. 127, 367-395 (1998)
The “Virgo photometry catalogue”; a catalogue of 1180galaxies in the direction of the Virgo Cluster’s coreC.K. Young1,2 and M.J. Currie3
1Beijing Astronomical Observatory, Chinese Academy of Sciences, Beijing 100080, China2Department of Physics, University of Oxford, Nuclear and Astrophysics Laboratory, Keble Road, Oxford OX1 3RH, UK3Rutherford Appleton Laboratory, Chilton, Didcot, Oxfordshire OX11 0QX, UK
Received February 25; accepted May 22, 1997
Abstract. We present a new catalogue of galaxies inthe direction of the Virgo Cluster’s core: the VirgoPhotometry Catalogue (VPC)1. This catalogue contains1180 galaxies (including background objects) within a 23square-degree area of the sky centred on R.A.1950.0 =12h26m and dec.1950.0 = 13◦08′. The VPC galaxy samplecomprises of non-stellar objects brighter than BJ25 = 19.0;the completeness limits being BJ25 ≈ 18.5 for the northernhalf of the survey area and BJ25 ≈ 18.0 for the southernhalf.
Independently-calibrated photographic surface pho-tometry is presented for over 1000 galaxies in the U , BJ
and RC bands. Parameters listed for catalogued galax-ies include: equatorial coordinates, morphological types,surface-brightness profile parameters (which preserve themajority of the original surface photometry information),U , BJ & RC isophotal magnitudes, BJ and [transformed]B total magnitudes, (U − BJ) and (BJ − RC) equal-areaand total colours, apparent angular radii, ellipticities, po-sition angles, heliocentric radial velocities and alternativedesignations. All total magnitudes and total colours areextrapolated according to a new system denoted t in or-der to distinguish it from the T system already in use.
The VPC is based primarily on four (one U , two BJ
and one RC) UK-Schmidt plates, all of which were digi-tised using the Royal Observatory Edinburgh’s (ROE)COSMOS measuring machine. All magnitudes, coloursand surface-brightness parameters are derived from nu-merical integrations of segmented plate-scan data, exceptfor (in 109 cases) saturated or (in 51 cases) inextricably-
Send offprint requests to: C.K. Young by [email protected] Appendices B, C and E, which contain the surfacephotometry, the main catalogue and the summary cata-logue respectively, are only available in electronic form.They can be obtained from Le Centre de Donneesastronomiques de Strasbourg (CDS) via anonymous ftpto cdsarc.u-strasbg.fr (130.79.128.5) or via http://cdsweb.u-strasbg.fr/Abstract.html
merged images; our segmentation software being able tocope with the vast majority of image mergers.
Key words: galaxies: clusters: individual: Virgo —catalogues — galaxies: fundamental parameters —galaxies: photometry
1. Introduction
The Virgo Cluster, being the dominant nearby clus-ter of galaxies, has long attracted much attention.It is irregular and exhibits significant substructure.Binggeli et al. (1987) divided Virgo into two main clusters:a dominant cluster, Cluster A, which is rich in early typegalaxies and contains the giant elliptical NGC 4486 (oth-erwise known as M 87) and a secondary cluster, ClusterB, dominated by late spirals, in the direction of the giantelliptical NGC 4472 (M 49). Their Clusters A and B corre-spond to de Vaucouleurs’s concentric E ∪ S and S’ Cloudsrespectively (see e.g. de Vaucouleurs & Corwin 1986). TheVPC covers the central region of Cluster A/Clouds E&S.It does not cover the central region of Cluster B/CloudS’, but there may of course still be many objects from thissecondary cluster within the VPC survey area.
The equatorial coordinates of the centre of what is gen-erally held to be the Virgo Cluster proper (i.e. of ClusterA or the E/S Clouds) are approximately 12h26m in rightascension (1950.0) and +13◦00′ in declination (1950.0).The entire complex including substructures, is generallythought of as subtending a radius of about 6◦ on the ce-lestial sphere, though its true extent has yet to be estab-lished.
Radial velocities of the constituent galaxies vary fromthe most negative ones known (and the only negative onesknown for galaxies outside the neighbourhood of the LocalGroup) to a maximum of about +3000 km s−1, as is ev-ident from Binggeli et al.’s (1985) Virgo Cluster Catalog

368 C.K. Young and M.J. Currie: Virgo photometry catalogue
(VCC). There appears to be a ∼4000 km s−1-deep veloc-ity void behind the cluster, as the background system isat +7000 km s−1 (see e.g. Drinkwater et al. 1996).
Most attempts to pin down the value of the Hubbleconstant have long been based on distance measurementsfor Virgo-Cluster galaxies. There are probably two mainreasons for this. First, it is the nearest cluster in whicha full complement of morphological types is represented:i.e. giant elliptical galaxies; classical ellipticals, spirals andirregulars; dwarf ellipticals and irregulars; blue compactdwarfs; galaxies in the process of merging and others thatdefy classification. It has therefore been possible to applya wider variety of different distance indicators to Virgogalaxies than it has been for other clusters at similar red-shifts such as Fornax or Leo. Second, Virgo has the addedadvantage of being easily observable from observatories inboth the Northern and Southern hemispheres.
Virgo’s popularity as a pivotal step in the cosmic dis-tance scale has nevertheless not been without its difficul-ties and controversies. Until recently, the possibility thatthe spatial extent of the Virgo Cluster may have consider-able line-of-sight depth was not taken seriously. AlthoughPierce & Tully (1988) suggested the “possible presence ofsuperposed foreground and background galaxies” in theirsample of Virgo spirals, it was not until the distance-scalework of Tonry et al. (1990) and Tonry (1991) that anyauthor was prepared to stand by the case for consider-able depth. However, these authors did not confront thepotentially embarrassing issue of the cluster’s elongationratio in the line of sight; which would have to exceed 5:1in order to explain the depth in their derived galaxy dis-tributions. Other authors have understandably tended toexplain any apparent depth effect in Virgo galaxy distribu-tions in terms of random observational errors and scatterintrinsic to the distance indicators employed.
The first authors not to avoid the elongation issue wereFukugita et al. (1993). These authors suggested that theVirgo Cluster’s spiral-galaxy distribution is in fact fila-mentary in shape, rather than approximately sphericallysymmetric [as had been assumed before] with spirals ly-ing at distances from 13 Mpc all the way through to30 Mpc. In Young & Currie (1995) we also found a con-siderable depth effect, that we could not explain away interms of errors or intrinsic scatter, this time in the distri-bution of dwarf-elliptical galaxies in the direction of theVirgo Cluster’s core itself. Furthermore, we found prelim-inary evidence for a foreground concentration of galaxiesseveral Mpc in front of the main cluster, which led us tosuggest that the depth effect may be due to the projectionof more than one distinct galaxy concentration onto thesame sight line. This would avoid the need for elongationratios of the order of 5:1.
This catalgoue has been compiled primarily with aview to investigating the Virgo Cluster’s distance, three-dimensional structure and kinematics; but will also pro-vide the basis for a pencil beam survey in the Virgo direc-
tion. We will also be investigating the luminosity functionsof Virgo dwarfs, with the triple benefits of: galaxy samplesselected according to objective criteria, independently cal-ibrated machine generated magnitude measurements andthe consideration of depth effects. These studies will bethe subjects of future papers but a preliminary study ofthe spatial distribution of 64 Virgo dwarf-ellipticals hasalready been presented in Young & Currie (1995) and acomparison with the existing magnitude scales for Virgogalaxies will be presented by Young et al. (in preparation).
2. The observations
Table 1. The UKST plates on which the VPC is based
plate date (α, δ)a1950.0 emulsion/filter/exposure
U9362 84:06:03 12:27,13:30 IIIaJ/UG1/3 hr.J4882 79:03:23 12:25,13:20 IIIaJ/GG395/1 hr.J9229 84:04:26 12:27,13:30 IIIaJ/GG395/1 hr.R2936 77:02:27 12:25,13:20 IIIaF/RG630/48 min.
a the equatorial coordinates of the plate centres: in hoursand minutes of time for right ascension (α) and in degreesand minutes of arc for declination (δ).
The VPC is based on four photographic plates (one U ,two BJ and one RC) of the same field; all of which were ex-posed on the 1.2-metre UK Schmidt Telescope (UKST) atSiding Spring Observatory in Australia. Details of all fourplates are listed in Table 1. Each plate measured 356 mmsquare and covered an area of the sky 6.◦4 by 6.◦4 within animaging area of dimensions 343 mm by 343 mm. The platescale was therefore 67.12 arcsec/mm in each case. All ofthe plates were hypersensitised by successive soaking innitrogen and hydrogen gas. Those plates taken after 1982December 3 had the added advantage of being nitrogenflushed; that is exposed under a constant stream of nitro-gen. The significance of this flushing process is dealt within Sects. 3.7 and 6.2.
3. Data reduction procedure
3.1. The densitometry
The plates were digitised by the ROE’s Image and DataProcessing Unit using its COSMOS measuring machinein mapping mode with a spot/pixel size of 32 microns.The central 4.◦8-square field of each plate was subdi-vided into four separate scanning fields to ensure thatthe resulting data files would be of a manageable size.The configurations of the scanning fields, which were la-belled “A” through “D”, are depicted in Fig. 1. Each fieldyielded a data array of dimensions 4096 by 4096 2.1-arcsec-square pixels. As the position of each plate relative

C.K. Young and M.J. Currie: Virgo photometry catalogue 369
Fig. 1. Configuration of the square Virgo Fields A through Dinto which each plate was subdivided. Each field was the sub-ject of a separate scan yielding a separate 4096 by 4096 pixelgrid of transmission readings, though plates were not read-justed between scans of their different fields. Note that therewas a 192-pixel-wide overlap between Fields A and B, and be-tween C and D. Angular dimensions of the corresponding fieldsof view are indicated. Note that the positions of the peripheralareas containing the sensitometer spot sequences varied fromplate to plate and have therefore not been shown, even thoughthey were scanned
to the measuring-machine carriage remained unchangedthroughout the scans of its four different fields, the (x, y)coordinate systems of the different fields were not rotatedwith respect to one another; only the origins were shifted.Transformations between the coordinate systems of thesame field on different plates, did however always requirea degree of both shift and rotation as it was not possibleto scan identical regions of different plates.
In addition to the main scans, the peripheral areas ofthe plates containing the sensitometer calibration spotswere scanned too. As there were two sets of calibrationspots per plate, two such scans were needed per plate.
The original scans of plates J4882 and R2936, that hadbeen made in 1984, were found to be unsatisfactory (seeSect. 3.3) and re-scans were made in 1990 with a pixel sizeof 1.′′05 (though the resulting higher resolution data arrayswere later binned up to the 2.′′1 pixel size of the earlierscans). Several changes had been made to COSMOS dur-ing the intervening period such as increasing the cathode-ray beam strength and upgrading the density-data formatfrom 8 bit to 12 bit. These improvements also increasedthe machine’s dynamic range.
3.2. Relative calibration
The initial relative-intensity calibrations were based onthe sensitometer-spot scans. The UKST is presently fitted
with two different step-wedge sensitometers; one sixteen-step device of Kitt Peak National Observatory (KPNO)design and one seven-step device. Originally the UKSTcarried two identical seven-step devices, but one of themwas replaced by a KPNO sensitometer at the end of1979. The step-wedge combinations and configurations ofthe plates relevant to this study are listed in Table 2.The seven-step wedges were illuminated by tungsten lightbulbs whilst the KPNO projector uses a quartz-halogenlamp in conjunction with a BG34 colour-correction filter.
Table 2. The sensitometer combinations and configurations
plate scan used step wedges projecteda
U9362 1984; 8-bit N edge:7-step, SE corner:16-stepJ4882 1990; 12-bit N edge:7-step, E edge:7-stepJ9229 1984; 8-bit N edge:7-step, SE corner:16-stepR2936 1990; 12-bit N edge:7-step, E edge:7-step
a “N” for North, “SE” for South East and “E” for East.
Fig. 2. The characteristic curve generated for plate R2936 bycombining both of the plate’s seven-spot sequences
A median emulsion-density value was obtained for eachcalibration spot from the digitised scan data. A charac-teristic curve was then generated for each spot sequenceby fitting a polynomial function to plots of log spot den-sity against log relative light intensity; values of the lat-ter having been obtained directly from knowledge of therelative transmittances of the individual wedge compo-nents. The two characteristic curves for an individual platecould then be combined by sliding one in log relative-intensity space until the curves’ residuals were minimised[in log relative-intensity space]. 3rd-degree or 5th-degreepolynomial functions were then fitted to yield the final

370 C.K. Young and M.J. Currie: Virgo photometry catalogue
characteristic curves that were adopted. An example ofone of the adopted curves is shown in Fig. 2.
In order to generate a two-dimensional polynomial sur-face function to model the mode sky density levels overeach of the main scans, the central 4080-pixel square areaof each 4096 pixel square grid was divided into an array of48 by 48 square bins each containing 7225 pixels. A sep-arate histogram of pixel-density values was constructedfor each of the 2304 bins per scanning field. An optimumsky value was then obtained for each bin by kappa-sigmaclipping (as first described by Godwin 1976 and Newell &O’Neil 1977) of the data within each bin. After the ini-tial rejection of pixel values exceeding 3× the typical skydensity values (estimated roughly in the first instance byinspection of the digitised plate-scan data) the data foreach bin were “clipped” four times, on each occasion dis-carding pixels deviating from the sample mean by morethan a specified number of standard deviations: 1 σ on thefirst iteration, 2 σ on the second and third iterations and2.5 σ on the fourth. The increasing severity of the rejectioncriteria was necessary because the sample standard devia-tions were inevitably reduced by each iteration. After thefourth iteration the new mean pixel value was adopted asthe best estimate of the sky; on the grounds that it wouldcorrespond closely to the mode value provided that onlya minority of the pixels within the bin were influenced bystellar or galaxy images. Obviously the latter assumptiondid not hold for those bins containing extended galaxy im-ages and so further clipping of the resulting 48 by 48 ar-ray of sky estimates was necessary. The same kappa-sigmaclipping algorithm with the same rejection criteria wassubsequently applied to the 2304 sky estimates in orderto preclude those bins containing the images of extendedobjects from influencing the final function used to modelthe sky. For each of the four scanning fields; a 4th degree[28-term] two-dimensional orthogonal polynomial functionwas fitted to the remaining estimated mode-density val-ues (which corresponded typically to 93% of the bins).Individual pixel-density values were converted to relativeintensities by means of the relevant characteristic curveand each was then divided by the local sky-value estimate(also in the same relative-intensity units) after this localsky-value estimate had first been subtracted. The subtrac-tion was necessary in order to remove the night-sky contri-bution whilst the division served to counter “field effects”and “vignetting”; effects which are discussed in Sect. 7.The results were 4096-pixel-square arrays of intensity val-ues in sky units (i.e. normalised to the sky brightness).It therefore remained to estimate the true sky brightnessfunction for each plate in absolute units in order to providea zero point for the relative-intensity scale.
3.3. Absolute calibration
Photoelectric aperture measurements, including simulatedaperture CCD photometry of galaxies within the fields
covered by the scan data, were used in order to determinethe zero points of the relative-intensity scales. Ideally,all of the usable photoelectric measurements would havebeen compared directly with their photographic counter-parts; the latter being obtained by the summation of pixel-intensity values within circles of appropriate radius cen-tred on the image centres. However, owing to saturationof the emulsion density within the cores of the majorityof the galaxy images for which photoelectric photometrywas available, and to limitations in the dynamic range ofCOSMOS, such a direct comparison was only possible ina handful of cases. In the vast majority of cases it wastherefore necessary to compare intensities within annuli,and so provided the inner boundary of each annulus layexterior to the saturated core region of the relevant image,the problem of core saturation could be overcome.
A total of 387 U -, 658 B-, 658 V - and 36 RC-band pub-lished photoelectric-photometry measurements were col-lated for 65 galaxies within the field of interest from Longo& de Vaucouleurs (1983) Longo & de Vaucouleurs (1985)de Vaucouleurs & Longo (1985) Burstein et al. (1987) andPoulain (1988). The B and V measurements were used toderive BJ values via the transformation:
BJ = 0.65B + 0.35V, (1)
as used by e.g. Buta & Corwin (1986).
A radial integrated-light profile was generated for eachgalaxy image for which there existed usable aperture pho-tometry in the literature. As the scan data had alreadybeen reduced to a relative-intensity scale in sky units,these profiles could be computed in mag brighter than thesky. Each sum of an aperture measurement (in mag) andthe modulus of the profile value (in mag above the sky) atthe same radial distance, ρ, from the image centre there-fore provided an estimate of the sky brightness at the po-sition of the particular galaxy. The radial extent of eachimage’s saturated region (if present) could therefore be es-timated from plots of estimated sky brightness against ρ.Unreliable published aperture-photometry measurementscould often be spotted at this stage: as data-points devi-ating significantly from the curve defined by the majorityof the others. Outliers were only excluded however, if theother points had been obtained from several independentsources. Once the radius of the saturated core, ρsat, hadbeen established for a plate image, all measurements madewith apertures of less than 2ρsat were culled from the listsof photometry allocated to that image.
Cored sky-surface-brightness estimates were then gen-erated for each usable pair of published aperture mea-surements provided that the members of each pair wereseparated from one another in ρ by at least 5 arcsec. Theinner and outer radii of the annuli varied according to theavailability of the published measurements. A mean skybrightness (in mag arcsec−2) and a standard deviation onthe mean were then computed in intensity space for each

C.K. Young and M.J. Currie: Virgo photometry catalogue 371
Fig. 3. Sky-brightness estimates in mag arcsec−2 (rounded to the nearest one decimal place) for the positions of galaxy imageson Plate U9362. The circle sizes are an indication of the number of measurements used per galaxy (see key)
Table 3. The plate sky-brightness estimates obtained fromaperture-photometry measurements in the literature
plate estimated sky intensitya number of
(mag arcsec−2) measurements usedb
U9362 21.207 ±0.016 280 × UJ4882 22.209 ±0.025 221×B, 221 × VJ9229 21.875 ±0.031 239×B, 239 × VR2936 21.526 ±0.040 16×RC
a The U- and BJ-band values listed here were adopted asfinal zero points but the RC-band value was combined withCCD-derived values (see Sect. 3.4)b The “number of measurements used” is the number ofaperture-photometry measurements on which the corre-sponding sky estimate is based.
image separately along with totals of the number of mea-surements used for that image. A separate plot was thengenerated for each plate (see Fig. 3 for an example) so thatthe degree of flatness of the sky could be assessed. Onceit had been established that the skies were flat (i.e. field
effects and vignetting had been adequately compensatedfor) a grand weighted mean (again in intensity space) wascomputed for each plate for all of the annuli considered forthat plate. These means are listed in Table 3. The annuliwere weighted according to the number of intensity unitsthey spanned. Note that the actual standard deviation onthe mean for Plate R2936 was 0.020 mag arcsec−2, but itwas felt that a value of 0.040 mag arcsec−2 would be moreappropriate because this sky estimate was dominated by asingle observer’s photometry (that of Poulain 1988) whichcould be expected to be more self-consistent than the samenumber of measurements made by as many observers.
In the case of Plate R2936, additional zero-pointestimates were derived from independently calibratedCCD observations of NGC 4551 and NGC 4478 (seeSect. 3.4). The final zero point adopted for this platewas the weighted mean of the values given in Tables 3and 4; the value of which turned out to be 21.562 ±0.024 mag arcsec−2.

372 C.K. Young and M.J. Currie: Virgo photometry catalogue
3.4. RC-band CCD photometry
Whilst it was possible to calibrate the U and BJ platessolely with galaxy aperture photometry measurements ob-tained from the literature, a different approach was nec-essary for Plate R2936, owing to the scarcity of publishedR-band, and in particular RC (Cousins R) photometry. Inthis subsection we describe the reduction ofRC-band CCDframes of NGC 4478 and NGC 4551 to radial integrated-light profiles that could be used to improve the absolutecalibration. The sky-brightness estimates that were ob-tained from these profiles were used to supplement thoseestimates obtained using the published aperture photom-etry described in Sect. 3.3.
Our CCD frames originated from two different sources.We obtained one usable Jacobus Kapteyn Telescope(JKT) CCD frame of NGC 4551 exposed for 300 s to-gether with frames of flat fields and Landolt (1983) equa-torial standard stars from the data archives of the RoyalGreenwich Observatory. These observations were made byPeletier and Huizinga over the period 1987 May 22-26.Three additional KPNO 2.1-m telescope CCD frames werekindly provided to us by Reynier Peletier. These latterframes had already been independently calibrated withaperture-photometry measurements corresponding to sat-urated regions of the galaxy images on the UKST plates(i.e. measurements that could not be used in the calibra-tions described in Sect. 3.3). Two of the KPNO frameswere 300-s exposures of NGC 4551, whilst the third was a600-s exposure of NGC 4478.
We used essentially the same reduction procedure asdescribed in Young & Currie (1991) and the same soft-ware with only minor modifications. In the case of theJKT frames, the illumination of the flat fields was prob-ably not very uniform (Peletier, private communication)and this may be the origin of the small residual non-lineargradient across the sky that had to be subtracted with asecond-degree two-dimensional polynomial function evenafter flat-fielding process. Despite the difficulties encoun-tered in estimating the sky level beneath the JKT imageof NGC 4551 precisely, the probable error on the derivedsky surface-brightness value was small enough for this es-timate still to be extremely useful. The colour equationwe derived from the standard-star frames was:
RC =
−2.5 log10(N?
t)−
0.110
cos(z)− 0.068(B − V ) + 21.69 (2)
in which N? represents the total number of counts due tothe star, t is the exposure time in s and z is the zenithangle. This enabled us to generate a radial integrated-magnitude profile adopting (B−V ) = 0.96 from the ThirdReference Catalog of Bright Galaxies of de Vaucouleurset al. (1991) (RC3).
In the cases of the KPNO 2.1-m telescope frames, aftercleaning them, we subtracted the backgrounds (adoptingthe same background count and sky surface-brightness val-ues as quoted in Peletier et al. 1990) in order to generateradial integrated-magnitude profiles.
Fig. 4. Diagrammatic representation of the “coring” procedureadopted. An idealised graph of computed sky-brightness versusinnermost coring-radius is shown. See Fig. 5 for an example ofone of the curves derived experimentally
Table 4. The sky-brightness estimates for Plate R2936 thatwere derived from CCD observations
telescope galaxy [frame] estimated sky brightness(mag arcsec−2)
JKT NGC 4551 21.56 ± 0.04KPNO 2.1 m NGC 4551 [1] 21.55 ± 0.08KPNO 2.1 m NGC 4551 [2] 21.62 ± 0.08KPNO 2.1 m NGC 4478 21.65 ± 0.08
A coring procedure as described in Sect. 3.3 was nec-essary in order to estimate sky-brightness values for thepositions of NGC 4478 and NGC 4551 on Plate R2936.This time however, CCD radial integrated-magnitudedata were used in place of aperture-photometry measure-ments. Also, in order to estimate the radial extent of core
C.K. Young and M.J. Currie: Virgo photometry catalogue 373
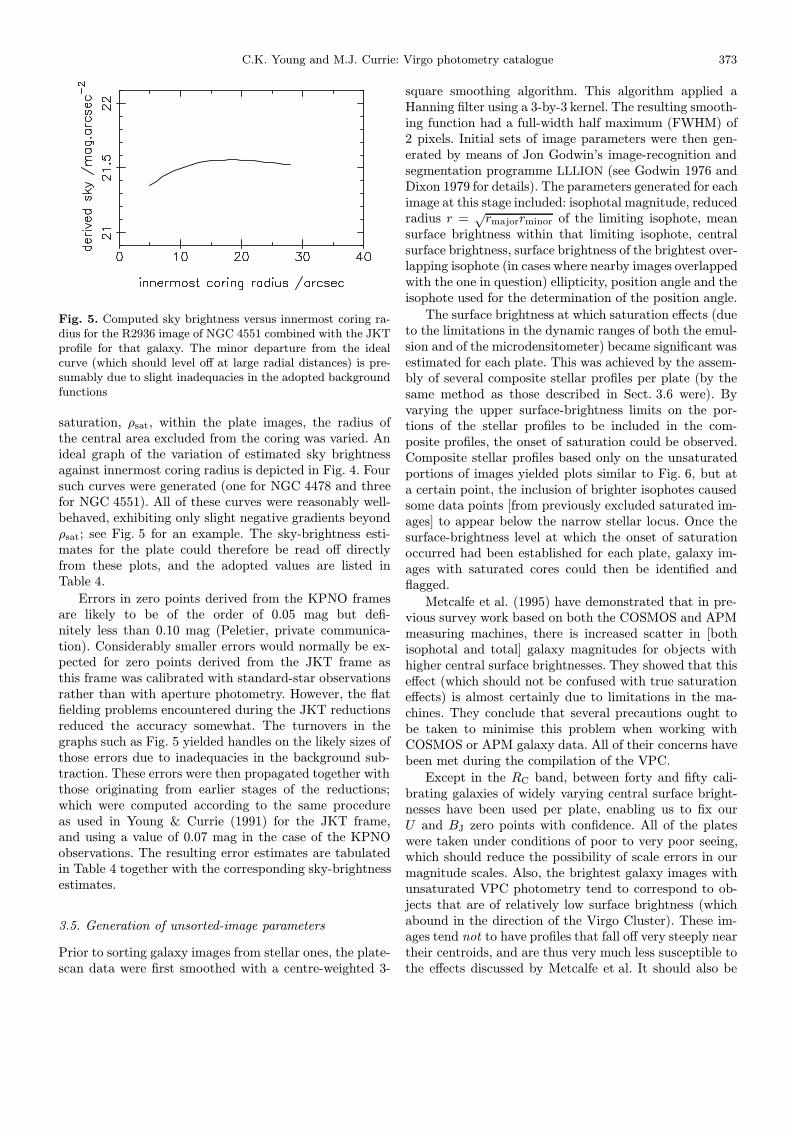
Fig. 5. Computed sky brightness versus innermost coring ra-dius for the R2936 image of NGC 4551 combined with the JKTprofile for that galaxy. The minor departure from the idealcurve (which should level off at large radial distances) is pre-sumably due to slight inadequacies in the adopted backgroundfunctions
saturation, ρsat, within the plate images, the radius ofthe central area excluded from the coring was varied. Anideal graph of the variation of estimated sky brightnessagainst innermost coring radius is depicted in Fig. 4. Foursuch curves were generated (one for NGC 4478 and threefor NGC 4551). All of these curves were reasonably well-behaved, exhibiting only slight negative gradients beyondρsat; see Fig. 5 for an example. The sky-brightness esti-mates for the plate could therefore be read off directlyfrom these plots, and the adopted values are listed inTable 4.
Errors in zero points derived from the KPNO framesare likely to be of the order of 0.05 mag but defi-nitely less than 0.10 mag (Peletier, private communica-tion). Considerably smaller errors would normally be ex-pected for zero points derived from the JKT frame asthis frame was calibrated with standard-star observationsrather than with aperture photometry. However, the flatfielding problems encountered during the JKT reductionsreduced the accuracy somewhat. The turnovers in thegraphs such as Fig. 5 yielded handles on the likely sizes ofthose errors due to inadequacies in the background sub-traction. These errors were then propagated together withthose originating from earlier stages of the reductions;which were computed according to the same procedureas used in Young & Currie (1991) for the JKT frame,and using a value of 0.07 mag in the case of the KPNOobservations. The resulting error estimates are tabulatedin Table 4 together with the corresponding sky-brightnessestimates.
3.5. Generation of unsorted-image parameters
Prior to sorting galaxy images from stellar ones, the plate-scan data were first smoothed with a centre-weighted 3-
square smoothing algorithm. This algorithm applied aHanning filter using a 3-by-3 kernel. The resulting smooth-ing function had a full-width half maximum (FWHM) of2 pixels. Initial sets of image parameters were then gen-erated by means of Jon Godwin’s image-recognition andsegmentation programme LLLION (see Godwin 1976 andDixon 1979 for details). The parameters generated for eachimage at this stage included: isophotal magnitude, reducedradius r =
√rmajorrminor of the limiting isophote, mean
surface brightness within that limiting isophote, centralsurface brightness, surface brightness of the brightest over-lapping isophote (in cases where nearby images overlappedwith the one in question) ellipticity, position angle and theisophote used for the determination of the position angle.
The surface brightness at which saturation effects (dueto the limitations in the dynamic ranges of both the emul-sion and of the microdensitometer) became significant wasestimated for each plate. This was achieved by the assem-bly of several composite stellar profiles per plate (by thesame method as those described in Sect. 3.6 were). Byvarying the upper surface-brightness limits on the por-tions of the stellar profiles to be included in the com-posite profiles, the onset of saturation could be observed.Composite stellar profiles based only on the unsaturatedportions of images yielded plots similar to Fig. 6, but ata certain point, the inclusion of brighter isophotes causedsome data points [from previously excluded saturated im-ages] to appear below the narrow stellar locus. Once thesurface-brightness level at which the onset of saturationoccurred had been established for each plate, galaxy im-ages with saturated cores could then be identified andflagged.
Metcalfe et al. (1995) have demonstrated that in pre-vious survey work based on both the COSMOS and APMmeasuring machines, there is increased scatter in [bothisophotal and total] galaxy magnitudes for objects withhigher central surface brightnesses. They showed that thiseffect (which should not be confused with true saturationeffects) is almost certainly due to limitations in the ma-chines. They conclude that several precautions ought tobe taken to minimise this problem when working withCOSMOS or APM galaxy data. All of their concerns havebeen met during the compilation of the VPC.
Except in the RC band, between forty and fifty cali-brating galaxies of widely varying central surface bright-nesses have been used per plate, enabling us to fix ourU and BJ zero points with confidence. All of the plateswere taken under conditions of poor to very poor seeing,which should reduce the possibility of scale errors in ourmagnitude scales. Also, the brightest galaxy images withunsaturated VPC photometry tend to correspond to ob-jects that are of relatively low surface brightness (whichabound in the direction of the Virgo Cluster). These im-ages tend not to have profiles that fall off very steeply neartheir centroids, and are thus very much less susceptible tothe effects discussed by Metcalfe et al. It should also be
374 C.K. Young and M.J. Currie: Virgo photometry catalogue
mentioned that even if some minor [true] saturation effectswere present in the VPC’s [integrated] isophotal magni-tude measurements, they would be unlikely to have anysignificant effect on the VPC’s t-system total magnitudes(see Sect. 4). This is because in the t system the centralsurface brightness is in fact an extrapolated quantity.
Table 5. The isophote limits adopted during the image seg-mentation and the relevant seeing conditions
plate faint limit bright limit seeing FWHM(mag arcsec−2) (mag arcsec−2) (arcsec)
U9362 25.0 20.9 2.7J4882 25.0 21.9 3.0J9229 25.0 21.9 1.7R2936 24.0 20.9 ∼ 3.5
The faintest usable limiting isophotes did of coursevary from plate to plate, even between plates exposedin the same band (on account of differences in the lev-els of plate noise and quantization of the intensity levels)though for consistency’s sake the same limiting isophoteof 25.0 mag arcsec −2 was adopted for both BJ plates.Although it had been decided to obtain as complete agalaxy sample as possible down to the integrated isopho-tal magnitude of BJ25.0 ≤ 18.5 all images down to BJ25.0
≤ 20.0, U25.0 ≤ 20.5 and R24.0 ≤ 20.0 were segmented inanticipation of differences (both systematic and random)between parameters derived from the different plates.Details of the isophote limits adopted are listed for allfour plates in Table 5. Note that although Plate J9229was made under better seeing conditions than Plate J4882was (which would normally yield plate scans of smaller dy-namic range), Plate J4882 was quite a dark plate and wasnot nitrogen flushed. As a result, the dynamic ranges ofthe plate-scan data from these two plates were actuallyfound to be very similar.
3.6. Star-galaxy sorting
Although the tasks of star-galaxy sorting and image se-lection are often still performed wholly by eye (the en-tries in the VCC, for example, were selected by visual in-spection alone) many different automated techniques havebeen developed for discriminating between images of starsand galaxies ever since those of Oemler (1974), Godwin(1976) and MacGillivray et al. (1976). These methods allinvolve isolating images that approximate well to the pointspread function and are therefore probably stellar, fromthose with shallower profiles that are probably not stel-lar; though it should be noted that none of these auto-mated procedures can be relied upon to yield a pure galaxysample.
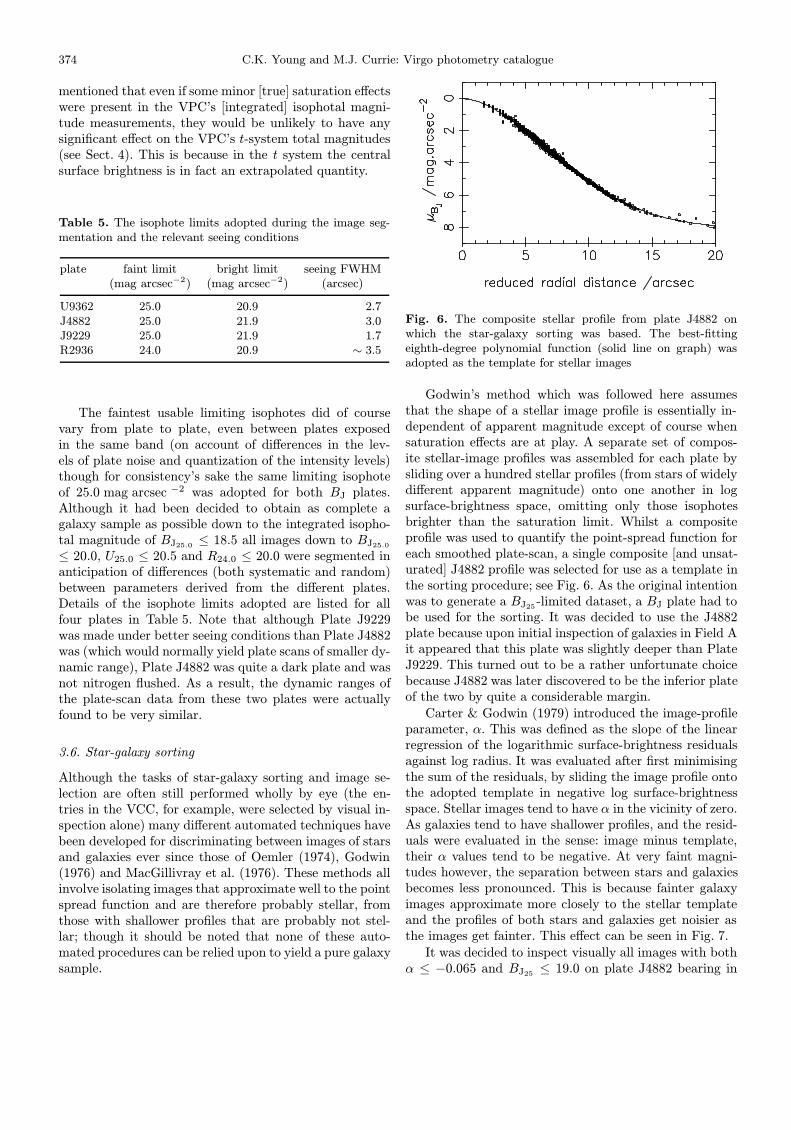
Fig. 6. The composite stellar profile from plate J4882 onwhich the star-galaxy sorting was based. The best-fittingeighth-degree polynomial function (solid line on graph) wasadopted as the template for stellar images
Godwin’s method which was followed here assumesthat the shape of a stellar image profile is essentially in-dependent of apparent magnitude except of course whensaturation effects are at play. A separate set of compos-ite stellar-image profiles was assembled for each plate bysliding over a hundred stellar profiles (from stars of widelydifferent apparent magnitude) onto one another in logsurface-brightness space, omitting only those isophotesbrighter than the saturation limit. Whilst a compositeprofile was used to quantify the point-spread function foreach smoothed plate-scan, a single composite [and unsat-urated] J4882 profile was selected for use as a template inthe sorting procedure; see Fig. 6. As the original intentionwas to generate a BJ25 -limited dataset, a BJ plate had tobe used for the sorting. It was decided to use the J4882plate because upon initial inspection of galaxies in Field Ait appeared that this plate was slightly deeper than PlateJ9229. This turned out to be a rather unfortunate choicebecause J4882 was later discovered to be the inferior plateof the two by quite a considerable margin.
Carter & Godwin (1979) introduced the image-profileparameter, α. This was defined as the slope of the linearregression of the logarithmic surface-brightness residualsagainst log radius. It was evaluated after first minimisingthe sum of the residuals, by sliding the image profile ontothe adopted template in negative log surface-brightnessspace. Stellar images tend to have α in the vicinity of zero.As galaxies tend to have shallower profiles, and the resid-uals were evaluated in the sense: image minus template,their α values tend to be negative. At very faint magni-tudes however, the separation between stars and galaxiesbecomes less pronounced. This is because fainter galaxyimages approximate more closely to the stellar templateand the profiles of both stars and galaxies get noisier asthe images get fainter. This effect can be seen in Fig. 7.
It was decided to inspect visually all images with bothα ≤ −0.065 and BJ25 ≤ 19.0 on plate J4882 bearing in

C.K. Young and M.J. Currie: Virgo photometry catalogue 375
Fig. 7. The slope parameter, α, plotted as function of BJ25
magnitude for all images within Field B (one quarter of thetotal area scanned) for which it could be evaluated. All im-ages of BJ25 ≤ 19.0 lying below the dashed line (representingα = −0.065) were inspected visually as part of the star-galaxyseparation procedure
mind that galaxies with steeper profiles almost invariablyhad very starlike appearances [on these Schmidt plates atleast] and would probably escape an independent visualselection process anyway. A glass copy of plate J9229 wasused in conjunction with a light table and binocular mi-croscope (of maximum magnification 25 times) for thispurpose. The total number of images that were visuallyinspected was almost 4000; and of these roughly one thirdwere confirmed to be galaxies. Stellar contamination of thegalaxy sample is almost certainly less than 0.25% (i.e. lessthan three objects) as only very occasionally was there anydoubt as to whether an object that satisfied the automaticgalaxy-candidate selection process was a star or a galaxy.The number of galaxies with αs in excess of −0.065 (andtherefore omitted from the final catalogue) is not certain.Nevertheless this number is expected to be very small forgalaxies brighter than the isophotal-magnitude complete-ness limit (see Sect. 6.2).
3.7. Generation of sorted-image parameters
Equatorial coordinates were generated from the plate(x, y) system by means of the Starlink package ASTROM.25 reference stars of mB > 10.0 were selected fromHeckmann et al.’s (1975) AGK3 astrometric catalogue forthis coordinate conversion.
Those galaxy images that were unsaturated on PlateJ4882 and which were successfully resolved from all ad-jacent images during image segmentation, of which therewere over a thousand, were matched with their counter-parts on the other plates by means of 3× 2-matrix trans-formations in their plate (x, y) coordinates (i.e. allowingfor both shift and rotation). The colour-generating pro-gramme KOLORE (see Godwin 1976 and Dixon 1979) wasthen run to compute (U −BJ) and (BJ −RC) equal-area
colours together with corresponding reduced radii, posi-tion angles, ellipticities and isophote information. Meanswere then taken of parameters derived independently fromeach of the two BJ plates, assigning equal weights to theplates. At a later stage however, it was discovered thatthose parameters generated from Fields C and D of plateJ4882 were unreliable due to inadequate hypersensitisa-tion of those regions. It was therefore decided only to usethose parameters derived from plate J9229 for those twofields. Also, when an image was affected by a plate flaw,only the scan data from the unaffected plates were used,resulting in the loss of some information. Luckily though,only a handful of images was affected. Note that totalcolours were also generated at a later stage (as describedin Sect. 4.2).
It was not possible to derive reliable image parame-ters for saturated objects owing to the loss of informationabout the image cores. However, as many of the saturatedobjects are amongst the most prominent galaxies in theVirgo field, the majority were already catalogued in theVCC and/or the RC3, whence certain parameters couldbe extracted. Some of the objects were not in either cat-alogue however, and eye estimates of their apparent BJ25
magnitudes were necessary. In such cases the values aris-ing from the segmented plate scans could only be used asa faint limit, as saturation effects would inevitably causethe image brightnesses to be underestimated.
Certain galaxy images were contaminated by adja-cent stellar images and/or by other galaxies. The image-recognition and segmentation programme LLLION wasable to separate most overlapping images from one an-other. However, in 51 cases LLLION could not resolvethem cleanly, because the degree of overlap was so largeand/or the disparity in brightness between the objects wasso great. Under such circumstances, apparent BJ25 mag-nitude estimates were based on the values derived fromthe image segmentation for the unresolved objects com-bined, minus an eye-estimated value for the contaminat-ing object. When the contaminating object was a star, themagnitude of the star was estimated by finding by eye anisolated stellar image of similar size and looking up itsmagnitude in the original unsorted list of segmented ob-jects. Subtracting contaminating-galaxy images was a lessprecise affair, and no attempt was made to separate theclosest pairs of double galaxies, unless the segmentationalgorithm had already succeeded to a certain extent.
3.8. Data for the saturated images
Those galaxy images that were saturated on the plate scanof J4882 were treated separately. In many cases, rightascensions, declinations, NGC or IC designations, VCCnumbers, ellipticities, position angles as well as (U −B)T
colours could be extracted from the RC3. (U − BJ)B25
colours were derived from the (U − B)T values by meansof Fig. 6b on page 35 of de Vaucouleurs et al. (1976); the

376 C.K. Young and M.J. Currie: Virgo photometry catalogue
required rB25 apparent radii values having been obtainedfrom the RC3.
BJ25 values were then estimated from those BT val-ues quoted in the VCC, by subtracting a typical offset of0.1 mag: BJ25 ≈ BT − 0.1, from BJT ≈ BT − 0.3 andBJ25 ≈ BJT + 0.2. These equations are only intendedas provisional approximations, and are not applicable todwarfs (which tend not to be saturated in the VPC).
3.9. Radial velocities and morphological types
Radial velocities were extracted from the RC3 wheneverpossible, but original sources had to be consulted for mostobjects known to be receding at velocities in excess of15 000 km s−1, as that was the velocity limit of the RC3galaxy sample. Morphological types were extracted fromthe VCC whenever listed therein, but visual inspection ofthe glass copy plate was necessary for those objects withBJ25 ≤ 17.0 not catalogued in the VCC. It was decidednot to attempt the morphological typing of galaxies fainterthan BJ25 = 17.0, as beyond this limit the galaxy imageswere generally too small to be typed reliably.
4. Total magnitudes
4.1. The t system
A reasonably discerning extrapolation procedure was re-quired for the VPC galaxy sample as (1) most VPC galax-ies are too bright and/or extended for their images to beseeing dominated, and (2) a wide variety of morphologicaltypes (including of course a very large number of low-surface-brightness galaxies) are represented. The total-magnitude system we adopted is the t system of Young(1994) and and Young et al. (submitted); as outlined byYoung (in press). This system involves the smoothingof galaxy images prior to modeling them by means ofSersic’s (1968) law. Note that in the specific case of un-nucleated ellipticals, prior smoothing is not actually nec-essary as demonstrated by Young & Currie (1994) whofitted Sersic’s law to high-resolution images of dwarf andintermediate ellipticals.
4.2. Total magnitudes and colours for unsaturated images
In the case of the low-resolution VPC data, Sersic’s lawwas found to offer an excellent fit to virtually every un-saturated surface-brightness profile, irrespective of mor-phological type. This can be seen from the thirty exampleplots presented in Appendix A2. No total magnitude es-timates were attempted for saturated galaxies. Instead,Young et al. (in preparation) will present t-system to-tal magnitudes for these objects based on even lower-resolution CCD photometry.
2 These plots correspond to the first thirty unsaturatedgalaxies in the VPC, and have therefore been selected on thebasis of their right ascensions alone.
During the image-segmentation stage of the re-ductions, profile information was generated for eachgalaxy image in the form of ellipticities, position an-gles and reduced radii, for all unsaturated isophotes in0.25 mag arcsec−2 intervals brightward of the limitingone. In the case of the BJ plates, this corresponded toa maximum of 12 levels (a maximum of 16 in the case ofplate U9362 and a maximum of 12 in the case of R2936).
The profile parameterizations were achieved by incre-menting n from 0.2 through 3.0 in steps of 0.01, and at-tempting to fit a straight line to µ(r) as a function of rn.Points corresponding to isophotes that overlapped withthose of other images (as represented by five-pointed starsin Appendix A) were assigned weights 50% lower thanthose assigned to the remaining points (as represented byasterisks in Appendix A). χ2 was evaluated for each fit,and the parameters (n, r0 and µ0) that provided the bestfit for a particular galaxy, were used to derive a total-magnitude estimate for that galaxy by means of Young &Currie’s (1994) Eq. (3).
In the case of the BJ band, although we had onlyparametrised the profiles from Plate J9229, as we had al-ready computed two usable BJ25 values for those galax-ies lying within Fields A and B (one value from each BJ
plate), we were still able to average the extrapolated to-tal magnitude values. This was achieved by subtracting[BJ25(J9229)−BJ25(J4882)]/2 from the total magnitudesderived from the parametrizations of the Plate J9229 im-ages.
The transformation of total magnitudes from the BJ
system to the B system was achieved by means of Eq. (1),and the approximate relationship:
(BJ −RC) = 0.46(±0.10)(B − V ) + 0.83(±0.07), (3)
which was derived from Fig. 8; a two-colour plot for un-saturated VPC galaxies with (B − V ) colours previouslymeasured by Caldwell (1983) Gallagher & Hunter (1986)Bothun et al. (1986) and/or Drinkwater & Hardy (1991).Note that although the (BJ − RC) and (B − V ) colourmeasurements were not based on identical regions of eachgalaxy concerned, errors due to colour-gradients are ex-pected to be considerably smaller than those due to theinherent scatter in such a colour-colour plot.
4.3. VPC magnitudes already published
The total magnitudes listed in Table 4 of Young & Currie(1995) as well as those VPC magnitude values listed inTable 9 of Drinkwater et al. (1996), were extracted froman earlier version of the VPC; that of Young (1994). Themagnitudes were computed by a variant on the methoddescribed in Sect. 4.2. This method involved adding theintegral of the same function between the isophotal radiusr = r25 and r25 << r << ∞ to the linear-unit equiv-alent of the BJ25 value tabulated in the VPC for eachgalaxy. The integral was evaluated numerically using the

C.K. Young and M.J. Currie: Virgo photometry catalogue 377
Fig. 8. Unsaturated VPC galaxies for which (B−V ) measure-ments have already been published (see text for references).This two-colour plot was used to derive a transformation equa-tion between (BJ − RC) equal-area colours and (B − V ) bymeans of the best-fitting least-squares (on (BJ −RC) becausethe (B−V ) values are expected to be more accurate as they arephotoelectric measurements rather than photographic ones)straight line
Compound Form of Simpson’s Rule, with 2000 intervalsspanning the range r = r25 to the point at which µ(r) haddropped to µ0 + (10× 1.086) mag arcsec−2:
2π
∫ 101n r0
r25
σrdr =
πσ0(101n r0 − r25)
3000[f0 + 4(f1 + f3 + ...
+f1999) + 2(f2 + f4 + ...f1998) + f2000], (4)
where f0 = rσ(r = r25) and f2000 = rσ(r = 101n r0).
It was adopted at a time when the catalogue listedBJ25 = [BJ25(J9229) + BJ25(J4882)]/2 and σBJ25
=|[BJ25(J9229)−BJ25(J4882)]/2| values for Field A and Bobjects; but did not list the senses of the differences be-tween the BJ25(J9229) and BJ25(J4882) values. With thismethod, it was therefore still possible to obtain averagedtotal magnitudes based on the isophotal magnitudes fromtwo plates [together with extrapolations from one plate]without knowing the senses of the differences between theplates.
In a small minority of cases there was a significant dif-ference between the sizes of the extrapolations obtainedby the different methods, but on average the choice ofmethod made little difference. The mean extrapolation[for the VPC as a whole] beyond BJ25 due to the oldmethod was 0.348 mag, compared to a mean of 0.352 forthe more rigorous method used in this paper; though thesemean extrapolations were 0.670 and 0.696 respectively forthe dwarf elliptical subsample of 64 objects presented inYoung & Currie (1995). The systematic difference between
the two sets of magnitude values is due to the minority ofobjects for which the light contribution from regions exte-rior to r = 10 1
nr0 would be significant should the profilesbe extrapolated to r =∞.
5. The dataset
Appendix A contains examples of the BJ-band surfacephotometry obtained from Plate J9229. The profiles cor-respond to those thirty unsaturated objects of lowest rightacension.
The complete dataset can be divided into three parts:Appendix B, which contains the surface photometry ob-tained from each plate separately for unsaturated objectsthat were not inextricably merged with adjacent objects(but excluding Fields A and B in the case of Plate J4882);Appendix C, which contains the main catalogue (of galax-ies VPC 1 through 1129); and Appendix D, the exten-sion to the main catalogue (which is reserved for those51 objects whose images were severely contaminated byoverlapping stellar or galaxy images, these being desig-nated VPCX 1 through 51). Machine-readable versions ofAppendix B (in ASCII format) and Appendix C (in bothASCII and FITS formats) are available from the CDS.
In addition to the complete dataset, we have includedtwo more appendices for the convenience of readers. Thefirst of these is Appendix E, which contains a summarycatalogue of key parameters in tabular from. This is avail-able from the CDS in electronic form as a LaTEXfile. Thelast appendix is Appendix F, which contains a list of VPCobjects with NGC or IC designations.
The parameters listed in Appendix E are:Column 1: VPC designation, galaxies being numberedin order of increasing right ascension (1950.0), objectsat identical right ascensions being numbered in order ofincreasing declination (1950.0), those objects saturated inBJ being flagged with an asterisk;Column 2: right ascension minus 12 hours (1950.0) in min-utes and seconds of time; followed by declination (1950.0)in degrees, minutes and seconds of arc (mean error of 1.′′5on each coordinate);Column 3: VCC designation and cluster-membership as-signment from Binggeli et al. (1985), their assignments be-ing denoted “B” for background, “P” for possible memberand “M” for member;Column 4: morphological type if discernable from visualinspection of a copy plate of Plate J9229 and/or a VCCgalaxy: “E” for elliptical,“S” for spiral, “S0” for lenticular,“I” for irregular, “BCD” for blue compact dwarf, “pre”for pre-merger and “pec” for peculiar (objects that defiedclassification being assigned “?”); followed by a one digitcoding for the source of the morphological classificationadopted: [1] for the VCC and [2] for this work; note thatwe have not flagged dwarf ellipticals because there maywell be a continuous range of galaxies separating “true”classicals from “true” dwarfs;

378 C.K. Young and M.J. Currie: Virgo photometry catalogue
Column 5: apparent BJ magnitude to the25.0 mag arcsec−2 isophote; the value quoted being themean3 of two values independently derived from PlatesJ4882 and J9229 (estimated mean error of ∼ 0.1 mag),except when followed by a single digit within the range [1]through [9] which denotes an alternative source of BJ25
estimate or measurement: [1] for de Vaucouleurs & Pence(1979) Table 2, [2] for de Vaucouleurs & Pence (1979)Table 4, [3] for Binggeli et al. (1984), [4] for Binggeli et al.(1985), [5] for Karachentsev & Karachentseva (1982), [6]for the mean of sources [1] and [4], [7] for the mean ofsources [2] and [4], [8] for the mean of sources [4] and [5],and [9] this work when an estimate was made by the au-thors by eye;Column 6: standard error on the mean BJ25 value whenapplicable; followed, only when flagged in Col. 5 by a codenumber other than [9], by a single character “R” for reli-able or “U” for unreliable from the VCC;Column 7: BJt [total extrapolated] magnitude, derived ac-cording to the procedure described in Sect. 4.2 (estimatedmean error of ∼ 0.15 mag);Column 8: transformedBt [total extrapolated] magnitude,derived from BJt via Eqs. (1) and (3) (estimated mean er-ror of < 0.20 mag);Columns 9, 10 and 11: BJ-band Sersic surface-brightnessparameters: n (profile shape parameter), µ0 (extrapolatedcentral surface brightness /mag arcsec−2) and r0 (scalelength parameter) respectively from Plate J9229 for galax-ies unsaturated in BJ, all derived according to the proce-dure described in Sect. 4.2;Column 12: (U − BJ) equal-area colour if relevant VPCphotometry unsaturated and not heavily merged (esti-mated mean error of ∼ 0.2 mag), or (U−0.65B−0.35V )T
from the RC3 whenever possible if VPC photometry sat-urated;Column 13: (BJ −RC) equal-area colour if relevant VPCphotometry unsaturated and not heavily merged (esti-mated mean error of ∼ 0.2 mag);Column 14: heliocentric radial velocity in km s−1 (basedon the approximation v = cz, where v is approximate ve-locity, c is the speed of light in a vacuum and z is redshift);followed by a one digit code for the source of the veloc-ity measurement: [1] for Karachentsev & Karachentseva(1982), [2] for Karachentsev et al. (1983), [3] for Binggeliet al. (1985), [4] for Rhee & Katgert (1988), [5] for deVaucouleurs et al. (1991), [6] for Binggeli et al. (1993), and[7] for Drinkwater et al. (1996); when more than one ve-locity measurement was available for a particular galaxy,the value that was adopted was either the value withthe smallest associated error if the measurements were inbroad agreement, or the value from the more recent com-
3 The mean values being applicable to Virgo Fields A andB only. Due to significant de-sensitisation (as described inSect. 7.1) of Fields C and D on Plate J4882, only Plate J9229was used for objects lying in these two latter fields.
pilation if the measurements were not in broad agreement,i.e. [7] supersedes [6], and [6] supersedes earlier compila-tions such as [5] (quoted errors vary greatly from sourceto source but are typically of the order of 50 km s−1).
The VPC also contains: U25 and RC24 isophotal magni-tudes together with corresponding apparent angular radii,mean surface-brightnesses within the limiting isophotes,measured central surface brightnesses, brightest overlap-ping isophotes with adjacent images, (U −BJ) and (BJ −RC) total colours, ellipticities, position angles, and the er-rors associated with various parameters (including radialvelocity measurements). However, these parameters areconfined to the the full version of the main catalogue.
6. Scope of the catalogue
Previous catalogues of Virgo Cluster galaxies have beenlimited in several respects. First, the vast majority of theirgalaxy magnitudes were estimated by eye without inde-pendent zero-point calibrations, secondly, the galaxy sam-ples themselves were selected by eye and thirdly, they wereconfined to a single pass band. The VPC does not sufferfrom any of these limitations. Also, the VPC does not dis-criminate against background galaxies (unlike the VCCwhich excludes non-Zwicky objects that were deemed tobe in the background).
The VPC however, covers a region of sky smaller inangular extent than those covered by de Vaucouleurs &Pence (1979) or by the VCC. The VPC survey area, whichis centred on Cluster A, is compared with the VCC’s inFig. 9.
6.1. Galaxy magnitudes
Most VPC-galaxy magnitudes have been derived by thenumerical integration of segmented plate-scan data andhave been calibrated with several CCD frames and/orseveral hundred aperture-photometry measurements. Wetherefore expect these magnitudes to be a significant im-provement on those found in previous catalogues. Forthe highest surface-brightness VPC galaxies however, theplate-scan data suffered from saturation effects, and alter-native measurements had to be sought from the literature.As can be seen from Fig. 10, saturation was a problem inthe BJ band for most galaxies brighter than BJ25 = 15.5,though fewer galaxies were saturated in the U band. Fora very small minority of saturated galaxies, no previousmeasurements could be found in the literature and eyeestimates were necessary.
6.2. The galaxy sample
There has been much discussion concerning the complete-ness of galaxy surveys in the literature, and particularly ofthose conducted by eye; see e.g. Phillipps et al. (1988). Asthe VPC galaxy sample was selected primarily by meansof an automated process, it was possible to quantify the

C.K. Young and M.J. Currie: Virgo photometry catalogue 379
Fig. 9. Map of the areas of the sky surveyed by the VPC(vertically shaded area) and VCC (heavily shaded area ∪ VPCsurvey area)
Fig. 10. Frequency distribution of VPC galaxies as a functionof BJ25 . The heavily shaded areas represent objects saturatedin BJ
observational limits to the sample with reasonable preci-sion. These limits were:(1) BJ25(J4882) ≤ 19.0 for the whole survey areaand(2) profile-slope parameter (see Sect. 3.6) α ≤ −0.065.However, Plate J4882 was found to be significantly de-sensitised over Fields C and D (by ∼ 0.3 mag) and themagnitudes for those fields had therefore to be based onJ9229 alone. Mean magnitudes (based on both the J4882and J9229 values) were nevertheless adopted for Fields Aand B. These considerations were found to lead to theVPC-sample completeness limits of:(1a) BJ25 ≤ 18.5 for Fields A and B,or(1b) BJ25 ≤ 18.0 for Fields C and D,and(2) profile-slope parameter α ≤ −0.065,which are derived at the end of this subsection.
Fig. 11. Frequency distribution of VPC galaxies unsaturatedin BJ, as a function of peak surface brightness; the heavilyshaded areas representing those galaxies brighter than the com-pleteness limits (BJ25 = 18.5 for Fields A and B; BJ25 = 18.0for Fields C and D)
Should populations of ultra-low-surface-brightnessgalaxies exist (of peak surface brightnesses fainter than25.0 mag arcsec−2 in BJ) they would therefore remainuncatalogued regardless of their apparent magnitude be-cause isophotal magnitudes rather than total magnitudeswere used to select the galaxy sample. Figure 11 wouldhowever suggest that galaxies with peak surface bright-nesses fainter than ∼ 24.0 mag arcsec−2 do not normallyhave flat enough surface-brightness profiles to qualify as18th-magnitude (or brighter) objects, unless they possessvery extensive haloes of surface brightness slightly fainterthan 25.0 mag arcsec−2. Likewise, discrimination againstultra-low-surface-brightness galaxies on account of usingisophotal magnitudes cannot be a problem unless suchgalaxies have very flat profiles and are quite large in an-gular extent (e.g. an object of mean surface brightness

380 C.K. Young and M.J. Currie: Virgo photometry catalogue
= 26.00 mag arcsec−2 would have to subtend 28 arcsecin diameter in order to be a 19.0 magnitude object or35 arcsec in diameter in order to be an 18.5 magnitudeobject). Although giant galaxies of very low surface bright-ness are known to exist (e.g. Malin 1, which escaped de-tection in the VPC) it is unlikely that such objects couldbe prolific enough to be a major hazard.
Fig. 12. Frequency distribution of VPC galaxies as a func-tion of the profile-slope parameter α (see Sect. 3.6); the heavilyshaded areas representing those galaxies brighter than the com-pleteness limits of (BJ25 = 18.0 for Fields A and B; BJ25 = 18.5for Fields C and D)
It would appear from Fig. 12 that brighter than thecompleteness limit of BJ25 = 18.0 galaxy loss due to thelimit α ≤ −0.065 is probably not significant. However,from the same figure it can be seen that [due to this cri-terion alone] the number of galaxies lost from the samplewithin the range 18.0 < BJ25 < 19.0 is probably quitesignificant. In other words, for BJ25 > 18.0, the galaxyprofiles tend to be significantly more starlike than forBJ25 < 18.0. Unfortunately, it is rather difficult to extrap-olate the frequency distribution of galaxies as a functionof α beyond the α = −0.065 cut off with great confidence,even though the indications are that the frequency is al-ready in sharp decline as α increases towards the cut off.An order of magnitude estimate based in Fig. 12 wouldsuggest that somewhere in the region of ten or possiblytwenty objects of 18.0 < BJ25 < 19.0 might have beenexcluded by the limit in α alone.
As for stellar contamination, this is unlikely to be aserious problem as objects for which α exceeded −0.065were excluded. Only in a couple of cases was there any un-certainty as to whether an object was a star or a galaxy, asall galaxy candidates were visually inspected. Overlappingstellar images were occasionally difficult to distinguishfrom elliptical galaxies, but it is extremely unlikely that
stellar contamination could account for even 0.25% of theobjects catalogued (i.e. about three objects in total).
From Fig. 13 it is evident that the VPC galaxy sampleis complete to BJ25 = 18.5 for Fields A and B (assumingBJ25(J4882)−BJ25(J9229) ≤ 1.0). It should be noted thatthe slight asymmetry in the distribution of data pointsabout BJ25(J4882)−BJ25(J9229) = 0.0 is due to the sen-sitivity of J4882 being less consistent than that of J9229.As a consequence, the most wayward data-points tend tocorrespond to images that yielded higher magnitudes onJ4882 than on J9229. For Fields C and D, there is almostcertainly completeness at BJ25 = 17.5, but galaxy lossprobably only becomes significant beyond BJ25 = 18.0, ascan be seen from Fig. 14.
Fig. 13. The disparity between magnitudes generated fromdifferent BJ plates as a function of mean magnitude [as quotedin the VPC] for Fields A and B combined. The complete-ness limit (dashed line) and the observational selection cri-terion, BJ25(J4882) ≤ 19.0, (solid diagonal line) are shown forreference
6.3. Galaxy colours
Equal-area and total (U−BJ) and (BJ−RC) colours havebeen computed for most VPC galaxies; the main excep-tions generally being those whose images were saturatedin one or both relevant pass bands, and/or those thatappeared heavily merged with adjacent images (whethergalaxies or stars). For the equal-area colours, the areaswere generally defined by the µU = 24.25 mag arcsec−2 orthe µBJ = 24.25 mag arcsec−2 isophote. The total colourswere based on the differences between extrapolated Ut,BJt and RCt values, and as a whole are probably less sus-ceptible to systematic effects even though they exhibit aconsiderably larger scatter. However, for any individualgalaxy, the equal-area colours are generally more reliablethan the total ones (see Sects. 7.2 and 7.3). It was also pos-sible to estimate very approximate total (U −BJ) coloursfor many of the saturated objects by means of Eq. (5)

C.K. Young and M.J. Currie: Virgo photometry catalogue 381
Fig. 14. The completeness limit (dashed line) to the galaxysample in the cases of Fields C and D. Note that due to pro-nounced de-sensitisation of Plate J4882’s emulsion over FieldsC and D, a mean zero-point shift of 0.31 mag was observedbetween those magnitudes from Fields C and D of Plate J9229[which were included in the VPC] and those due to J4882 forthe same fields [which were discarded]
(which is an approximation based on Eq. (1)) from val-ues of (U − B)T and (B − V )T whenever listed in theRC3. Unfortunately though, published (BJ −RC) colourscould not be found for those objects whose images weresaturated.
(U −BJ)t ≈ (U −B)T + 0.35(B − V )T. (5)
6.4. Radial velocities
Fig. 15. Frequency distribution of VPC galaxies still lackingpublished velocities (unshaded areas), those measured for thefirst time by Drinkwater et al. (1996) (vertically shaded areas)and those measured previously (unshaded); all as a function ofBJ25
Only a minority of galaxies fainter than BJ25 = 17.50 havepublished radial velocities, but the situation has improvedsince Drinkwater et al.’s (1996) study. The present situa-tion is depicted in Fig. 15.
6.5. Morphological types
Morphological types are essentially complete to BJ25 =17.00, but sporadic beyond this limit as shown by Fig. 16.As the Du Pont plates of Binggeli et al. (1985) had consid-erably larger plate scales than did our UKST plates, VCCtypes have been adopted for almost all of the galaxies incommon between the VPC and the VCC galaxy samples.Those galaxies which were brighter than BJ25 = 17.00yet not included in the VCC (generally because they weredeemed to be background objects) were classified by visualinspection of a copy plate of UKST plate J9229. Due tothe small scale of this copy plate and the problem of imagesaturation in many cases, no attempt has been made toprovide detailed morphological classifications (e.g. spiralsubclasses or luminosity classes) in the VPC.
Fig. 16. Frequency distribution of VPC galaxies that havebeen typed (heavily shaded areas) and untyped (unshaded ar-eas) as a function of BJ25 . Note that any unshaded area bright-ward of BJ25 = 17.00 represents galaxies which defied typing
6.6. Astrometry
Unambiguous identification of the vast majority of galax-ies within the central Virgo field (background objects in-cluded) brighter than BJ25 ∼ 18.5 should now be possible,as the use of a measuring machine has enabled improvedpositions to be computed. Only for a subset of objects sat-urated in BJ, was it necessary to extract the coordinatesfrom the RC3 or occasionally from the VCC, though theseobjects are generally so extended that the positional accu-racy required to identify them unambiguously is not thathigh. The VPC also contains orientation and ellipticityinformation.

382 C.K. Young and M.J. Currie: Virgo photometry catalogue
7. Sources of error
7.1. The photometry (general)
The issue of saturation effects due to limitations in thedynamic range of the COSMOS measuring machine hasalready been dealt with at length in Sect. 3.5. The othermost common causes of systematic errors in photographicphotometry include: differential de-sensitisation of photo-graphic emulsions due to exposure to atmospheric oxy-gen and water-vapour, vignetting, uneven and/or inad-equate hypersensitisation (these effects can prevent thesky density reaching the threshold necessary for a linearresponse on those areas of the emulsion affected) platedefects (such as scratches or spurious “images” that arewholly artefact) and inadequacies in background-fitting,sky-subtraction and calibration procedures (which also de-pend on the accuracy of the reference measurements e.g.photoelectric aperture- [or simulated-aperture-] photome-try measurements).
As can be seen from Fig. 13 and Fig. 14, for FieldsA and B the mean zero-point offset between the isopho-tal magnitudes generated from the different BJ plates issmall: BJ25(J4882) − BJ25(J9229) = +0.014, whilst forFields C and D it is quite substantial: BJ25(J4882) −BJ25(J9229) = +0.311. Significant de-sensitisation ofPlate J4882 over most of Fields C and D was found tobe the cause of this disparity. J4882 was the inferior plateof the two, almost certainly because it was taken beforean important modification was made to the UKST plate-holder in December 1982. This modification enabled theplate holder to be flushed with dry nitrogen (which is in-ert as far as the emulsions are concerned) during expo-sures, thus preventing de-sensitisation. Note that as J4882is quite a dark plate (i.e. emulsion densities due to thesky are quite high) the problem in this case was not thatthe differential de-sensitisation depressed the sky bright-ness below the threshold for a linear response on the partof the emulsion, but rather that the relative density-to-intensity calibration was based largely on that part of theemulsion’s characteristic-response curve between the lin-ear portion and the saturated portion. As the sky wasvery dense throughout Fields A and B, this calibrationwas quite adequate for these fields. However, over largeareas of Fields C and D, the sky density was depressedonto the central part of the characteristic curve’s linearportion for which the adopted relative-calibration polyno-mial was poorly determined.
As the BJ magnitudes were based on both plates inthe cases of Fields A and B, but by necessity just on PlateJ9229 in the cases of Fields C and D4, the errors are
√2
higher for the latter fields. Mean standard errors on those
4 Note that strictly speaking, due to the slight displacementbetween the J9229 and J4882 (x, y) coordinate systems, thoseimages near to the boundaries of any field in one system maylie within a neighbouring field in the other system. In thesecases and when a plate flaw rendered one plate unreliable for
mean magnitudes that were derived from two plates aretabulated in Table 6, and were multiplied by
√2 in order
to obtain values applicable to magnitudes derived fromone plate. Corresponding errors on the reduced µBJ =25.00 mag arcsec−2 isophotal radii are shown in Table 75.
Table 6. Mean standard errors on the BJ25 magnitudes quotedin the VPC as a function of the number of plates on which themeasurements were based, and as a function of mean apparentBJ25
magnitude range two plates one plate
15.5 ≤ BJ25 < 16.5 0.06 0.0816.5 ≤ BJ25 < 17.5 0.08 0.1117.5 ≤ BJ25 < 18.5 0.10 0.14
Table 7. Mean standard errors on the reduced µBJ = 25.00mag arcsec−2 isophotal radii in the VPC, expressed as percent-ages of the corresponding radii measurements, and shown asfunctions of both the number of plates on which the measure-ments were based and apparent BJ25
magnitude range two plates one plate
15.5 ≤ BJ25 < 16.5 4.9% 6.9%16.5 ≤ BJ25 < 17.5 4.5% 6.4%17.5 ≤ BJ25 < 18.5 4.0% 5.7%
Vignetting arises as a consequence of geometric shad-owing effects inherent to many telescope designs includingthat of the UKST. The net effect is that off-axis light is nottransmitted as efficiently to the image plane as is on-axislight, with the fractional reduction in efficiency increas-ing with off-axis distance. In the case of the UKST, thefractional reduction in efficiency is < 1% within ∼ 2.◦7 ofthe axis. As the survey area is 4.◦8 across and more or lesscentred on the plate centre, only four small areas near tothe corners of the survey area could possibly be affected,if the sky density failed to reach the threshold for a lin-ear response (on the part of the photographic emulsion)within these regions. In Sect. 3.3, it was mentioned that
a particular object, whether a quoted magnitude was based onone or two plates depended on other factors. Individual casescan be checked in the VPC which quotes standard errors onthe machine-generated (mean) BJ25 magnitudes only when twoplates were used.5 As with the mean standard errors on the colours quotedin the VPC, the lower values obtained for fainter objects maybe due to limitations in the dynamic range of the COSMOSmicrodensitometer.

C.K. Young and M.J. Currie: Virgo photometry catalogue 383
Table 8. Quantification of the effect of the 5-arcsec FWHM resolution function on model galaxy profilesa for a variety of Sersicparameters (n and µBJ(0)) and isophotal radii rBJ25
n µ(0) rBJ25=4′′ rBJ25
=6′′ rBJ25=8′′ rBJ25
=10′′c
0.25 16.5 +13 +0.16 >17.7 +7 +0.06 >17.4 +5 +0.03 >17.2 +3 +0.01 >16.9
0.50 22.0 [+3 +0.06 19.7]b +3 +0.04 19.0 +3 +0.03 18.4 −1 −0.02 17.9
0.50 23.5 [−1 −0.08 20.3]b [+1 +0.00 19.4]b +1 +0.00 18.8 −5 −0.11 18.4
1.00 22.0 [+5 +0.06 19.2]b +5 +0.04 18.5 +5 +0.03 17.9 +3 +0.01 17.4
1.00 23.5 [−1 −0.07 20.1]b [+1 +0.00 19.2]b +1 +0.00 18.6 −3 −0.06 18.2
2.00 22.0 +9 +0.03 18.8 +9 +0.03 17.9 +7 +0.02 17.3 +5 +0.01 16.9
2.00 23.5 [+1 +0.00 19.7]b +1 +0.00 18.9 +1 +0.00 18.3 +1 +0.00 17.8
a The three entries per convolution are [left to right]:(1) ∆rBJ25
= rBJ25(smoothed)− rBJ25
(unsmoothed) in units of 18′′ (only correct to ± 1
4′′);
(2) ∆BJ25 = BJ25(smoothed)−BJ25(unsmoothed); and(3) approximate BJ25(smoothed)b Entries corresponding to objects too faint to be included in the VPC are enclosed in square bracketsc For images with rBJ25
>10′′, the percentage changes will of course be smaller still.
the skies were established to be flat. In order to test forthe significance of any apparent slope in the estimated skyas a function of radial distance from a plate’s centre, thesky values estimated for the positions of those galaxieswith published aperture photometry measurements wereplotted as a function of radial distance.
Although, in the case of the U9362 (see Fig. 17)there does at first sight appear to be a slight fall offin estimated sky brightness as a function of off-axis dis-tance, the size of the slope was found to be −0.017 ±1.08 mag arcsec−2deg−1. In other words, the uncertaintyon the slope is very much larger than the best estimateof the slope. In the case of J9229, there is even less evi-dence for any radial variation as this slope was found tobe −0.008 ± 1.41 mag arcsec−2deg−1. These slopes werecomputed by means of bootstrap resampling with 10 000realisations in each case, and using as many data pointsfor each galaxy as there were individual aperture mea-surements for that galaxy; even though only one datapoint (the mean sky estimate) is shown in Fig. 17 for eachgalaxy’s position. In summary then, whilst more calibrat-ing galaxies beyond the 2.◦7 limit would really be requiredto establish conclusively that vignetting had been properlyaccounted for, no evidence has been found for significantradial variation in the skies of Plates J9229 and U9362.This does not of course rule out the possibility that thereis significant radial variation, but it does establish thatthe random disagreements between other observers’ aper-ture photometry measurements constitute a much largereffect.
The 1σ ranges of sky density values for Plate J9229 inFields A, B, C and D were 635−679, 660−690, 540−700and 545−690 density units respectively. Ignoring localised
regions affected by prominent objects, the sky density wassubject to variation of the order of 10% (625− 690 units)over 95.8% of the scanned area of Plate J9229. The re-maining 4.2% corresponded to the corners of the com-bined area of the four fields, where vignetting reducedthe densities. The vignetting was most severe in the outercorners of Fields C and D, where the densities were re-duced to about 550 units. Apart from the issue of howwell vignetting has been compensated for (which has al-ready been dealt with) the accuracy to which the sky couldbe determined depended on the noise associated with thebackground measurements and any bias there may havebeen in the determination of the mode sky density valuesto which the background fits were applied.
The bias in the estimation of mode densities was foundto be of the order of 0.06±0.02% of a sky unit, in the sensethat the sky brightness was slightly overestimated. Thisfigure of 0.06% was arrived at by comparing the adoptedestimate of the mode for each bin (containing 7225 pix-els) with that mode value obtained by interpolating ahistogram of density values for that bin. As described inSect. 3.2, there were typically 2000+ bins not significantlyaffected by extended objects. The interpolation process in-volved fitting a Gaussian curve to the central portion ofeach histogram’s modal peak, using Starlink’s ESP pack-age.
The sample standard deviation in the sky values withrespect to the background fits was less than 0.25% in skyunits (0.20%, 0.22%, 0.23% and 0.25% for Fields A, B, Cand D respectively). This is considerably larger than thebias effect which will henceforth be neglected. The VPC’slimiting BJ-isophote of 25.0 mag arcsec−2, was 5.6% ofPlate J9229’s sky intensity. The random component of the

384 C.K. Young and M.J. Currie: Virgo photometry catalogue
uncertainty on the limiting isophote due to backgroundfitting errors is therefore at most ±0.05 mag arcsec−2 forPlate J9229.
Fig. 17. The estimated surface brightness of the sky on PlateU9362 for the positions of galaxies with published U-bandaperture photometry, as a function of radial distance from theplate centre. Note that the points plotted are means for eachgalaxy, and that some points are very much more significantthan others due to either (1) being based on more aperturephotometry measurements and/or (2) because they are basedon more independent observers’ measurements
One of the advantages of having a slight displacementbetween the different J9229 and J4882 fields was that ifan image happened to be truncated by the edge of a fieldin one coordinate system, it was unlikely to be truncatedin the other system. It was therefore possible to base theBJ magnitudes of such galaxy images on the most suit-able plate. As a result, edge-of-field effects have been min-imised, though Fig. 18 was plotted in order to provide acheck on the effectiveness of the background-fitting proce-dure at the extremities of a field where interpolation wasnot possible. As can be seen from this figure, the mag-nitude measurements do tend to be noisier at the fieldedges than at the field centres, but the increase in noisewith distance from the field centres does appear to bequite gradual and without any very steep increase nearthe edges.
Overlaps between adjacent images could not alwaysbe resolved satisfactorily during the image segmenta-tion. Magnitudes and indeed other photometric parame-ters are therefore less reliable for images with overlappingisophotes, and particularly so in cases where the brightestoverlapping isophote approaches the mean (or even thepeak) surface brightness quoted for the galaxy.
As the measured mean and peak surface-brightness pa-rameters (as opposed to the extrapolated ones) quotedin the VPC have not been corrected for effects that de-grade image resolution; namely diffraction, atmospheric
Fig. 18. Individual standard errors on those mean BJ mag-nitudes that were derived from both BJ plates (overlappingimages excluded) as a function of distance from the nearestfield edge measured in 2.′′1 pixels
seeing, sampling due to the pixel size of the plate scansand the smoothing of the scans prior to image segmenta-tion; they tend to be slight over-estimates of the true val-ues as measured in mag arcsec−2. Unsaturated composite-stellar-profiles (as described in Sect. 3.5) were measuredin order to estimate the degree to which the resolution ofeach image had been degraded by smearing effects, partic-ularly the smoothing of the plate-scan data. The FWHMof the unsaturated composite stellar profiles were found tobe 4.′′75± 0.′′1 in the case of U9362, 5′′ ± 0.′′1 in the casesof the two BJ plates and 6′′ ± 0.′′1 in the case of R2936.
Of the four plates reduced, R2936 (for which the lim-iting isophote adopted corresponded to 10.4% of the sky)was the noisiest, followed by J4882 (7.7%), J9229 (5.7%)and the least noisy U9362 (3.1%). It was unfortunatethat without such severe smoothing, limiting isophotes0.5 mag arcsec−2 brighter would probably have to havebeen adopted as noise peaks in the plate-scan data wouldhave degraded the images around their edges. The smooth-ing was also very necessary to reduce image fragmentation(the segmentation of individual galaxy images into two ormore major components).
In order to investigate the extent to which theVPC’s BJ isophotal magnitudes have been degraded byatmospheric seeing, sampling and smoothing; model-galaxy profiles were convolved with a 5′′ FWHMGaussian6 distribution. Only relatively small images wereconsidered, as the significance of the degradation decreaseswith increasing image size. The results are tabulated inTable 8, in which the approximate changes in isophotalradius, rBJ25
, and isophotal magnitude, BJ25 , are shownfor a variety of different Sersic profile parameters (intrinsicindex, n, and intrinsic central surface brightness, µBJ(0),)and for a variety of small intrinsic isophotal radii, rBJ25
.
6 To be rigorous, the resolution function is not of course aperfect Gaussian (or identical for different parts of any plate)but a Gaussian is still a good approximation.

C.K. Young and M.J. Currie: Virgo photometry catalogue 385
As can be seen from Table 8, even though the effects onthe isophotal radii can be quite significant, the errors in-troduced to the isophotal magnitudes are typically of theorder of several percent (i.e. several hundredths of a mag-nitude) even for the small images considered, and are inmost cases insignificant compared to the other sources oferror quantified earlier. Also, note that a coarse resolu-tion function can cause observed isophotal radii to be ei-ther larger or smaller than their intrinsic values, in otherwords the effect is not uni-directional.
7.2. Equal-area colours
The standard error on each mean colour, as quoted inthe VPC, is based upon two colour values generated fromeither of the two following plate combinations:1) U9362 and J4882, U9362 and J92292) R2936 and J4882, R2936 and J9229.Assuming that U9362 and R2936 are of similar qualityto the BJ plates, the standard errors quoted in the VPCneed to be multiplied by
√2 in order to obtain meaningful
estimates of the standard errors on the quoted colours, astabulated in Table 9.
Table 9. Estimated mean standard errors on colours in theVPC, as a function of the number of plates on which the mea-surements were based, and as a function of mean apparentBJ25
magnitude range (U −BJ) (BJ −RC)2 plates 1 plate 2 plates 1 plate
15.5 ≤ BJ25 < 16.5 0.18 0.20 0.19 0.2216.5 ≤ BJ25 < 17.5 0.17 0.19 0.16 0.1817.5 ≤ BJ25 < 18.5 0.16 0.18 0.16 0.18
Systematic errors must also be present due to differ-ences between the resolution functions inherent to differ-ent plate scans. Systematic differences between the equal-area and total colours were however found to be very smallin the case of the BJ−RC index, though more noticeablein the case of the U −BJ.
7.3. Total magnitudes and colours
The estimated random errors on the total magnitudesquoted in the VPC are listed in Table 10. They arebased on several assumptions and approximations, andare therefore only intended as rough estimates. The meanextrapolation from BJ25 to BJt is 0.35 mag, and the esti-mated standard error on a mean extrapolation was takento be 0.35÷3 magnitudes. This value was propagated witheach of the mean standard errors on BJ25 values listed inTable(s) 6 (and 10) to yield mean standard-error estimateson BJt values. From Fig. 8 it can be seen that the uncer-tainty on any estimate of (B − V ) based on a value of
(BJ − RC) is ∼ 0.2 mag. The offset between the B andBJ systems is ∼ 0.35(B − V ), whence the mean error inthe BJt -to-Bt conversion was taken to be 0.07 magnitudes.This was increased to 0.1 magnitude in order to take intoaccount uncertainties in the colour-coefficient term, andpropagated with the mean standard deviation estimatesfor BJt values in order to obtain mean standard deviationestimates on Bt values. The mean extrapolations from U25
to Ut and from RC24 to RCt were found to be 0.45 and0.25 mag respectively. Therefore the random errors on the(BJ −RC)t colours can be expected to be considerablysmaller than those on the (U −BJ)t ones. This was con-firmed by intercomparisons between the equal-area andtotal colours.
Table 10. Estimated mean standard errors on the isophotaland total magnitudes quoted in the VPC, as a function of thenumber of plates on which the measurements were based, andas a function of mean apparent BJ25
Magnitude range σ(BJ25) σ(BJt) σ(Bt)
Two plates:
15.5 ≤ BJ25 < 16.5 0.06 0.13 0.1616.5 ≤ BJ25 < 17.5 0.08 0.14 0.1717.5 ≤ BJ25 < 18.5 0.10 0.15 0.18
One plate:
15.5 ≤ BJ25 < 16.5 0.08 0.14 0.1716.5 ≤ BJ25 < 17.5 0.11 0.16 0.1917.5 ≤ BJ25 < 18.5 0.14 0.18 0.21
7.4. Galaxy magnitudes from other sources
In the absence of alternative measurements for most of theobjects suffering from saturation effects in the VPC, thosesources listed in Sect. 5 have had to suffice. It is hopedthat for the bright galaxies concerned, these sources arereasonably reliable.
7.5. Equatorial coordinates
An indication as to the accuracy of the astrometry isgiven by the residuals between the positions as quotedin the AGK3 catalogue and those calculated according tothe plate solution adopted. The root-mean-squared resid-ual was 2.′′28 (0.′′87 in right ascension and 2.′′11 in dec-lination). As the segmentation software did not centroidthe galaxy images, but assigned (x, y) coordinates to thebrightest pixel within each image, this quantity is, as ex-pected, quite similar to the pixel size of the segmentedimages: 2.′′148. The lack of a centroiding algorithm wasnot a problem for the saturated galaxies however, as RC3positions were generally adopted for them.

386 C.K. Young and M.J. Currie: Virgo photometry catalogue
7.6. Radial velocities
These errors were taken from those sources of radial-velocities listed in Sect. 5 without modification. In thecases of the following VPC (VCC) objects, there are verylarge mutual disagreements between different sources inthe literature, and the true errors may be very much largerthan the values quoted: VPC 25, 424, 447, 502, 545, 624and 810 (which correspond to VCC 325, 815, 870, 945,1035, 1148 and 1355 respectively).
7.7. Morphological types
Owing to the small plate scale of the UKST plates,and the high degree of saturation exhibited by manyof the galaxy images, even approximate typing was notalways possible. The majority of those morphologicaltypes obtained from the VCC (see Sect. 5) were presumedto be correct, but one mis-classification was noticed.Binggeli et al.’s (1985) VCC 500 was classified as an S0,instead of as a ringed-spiral. This has been correctedin the VPC. Note that the re-classifications listed in deVaucouleurs & Corwin (1986) all concern spiral-galaxysubclasses, and are therefore beyond the scope of thebroad classifications provided by the VPC.
8. Comparisons with photoelectric photometry
8.1. Aperture photometry
Photographic radial integrated-light profiles were gener-ated for all unsaturated galaxy images for which com-parable photoelectric aperture and/or simulated-aperturephotometry measurements could be found in the liter-ature. These integrated-light profiles were then interpo-lated to radii corresponding to the apertures used byother observers yielding Tables 11, 12 and 13. The in-tegrations were performed using unsmoothed plate-scandata. Other observers’B- and V -band measurements weretransformed into the BJ system by means of Eq. (1). Notethat no comparisons have been made with published mea-surements made with apertures of radii less than 12 arcsec.This is because, at small apertures, comparisons are par-ticularly sensitive to differences in the angular resolutionsof the images concerned.
Four unsaturated VPC objects have been measured byobservers at McDonald Observatory of the University ofTexas (de Vaucouleurs 1959; de Vaucouleurs et al. 1978;de Vaucouleurs et al. 1981) as listed in Table 11. In theblue, de Vaucouleurs et al. find IC 3481A to be ∼ 1.7mag brighter than we do. Interestingly, in the VPC, theadjacent galaxy, IC 3481, is also found to be ∼ 1.7 magbrighter than IC 3481A. Assigning equal weights to eachgalaxy, the apparent mean zero-point offsets were foundto be ∆U = U(Texas) − U(VPC) = −0.33 mag witha sample standard deviation of σN−1 = 0.76 mag and∆BJ = BJ(Texas) − BJ(VPC) = −0.48 (σN−1 = 0.87)
Table 11. Galaxies in common with the VPC, that havebeen measured by observers at McDonald Observatory of theUniversity of Texasa
IC r/′′ BJ9229 BJ4882 U9362 ∆BbJ ∆Uc
3355 32.9 15.89 15.86 15.83 −0.40 −0.433355 65.6 15.49 15.82 15.53 −0.29 −0.333475 53.3 14.57 - 15.12 −0.05 −0.213475 65.6 14.38 - 14.94 −0.09 −0.303475 68.7 14.34 - 14.90 −0.09 −0.323475 104.0 14.07 - - +0.00 -3481A 41.4 15.85 - 16.37 −1.73 −1.263483 24.4 15.26 - 15.45 +0.25 +0.61
a Their measurements are compared with U and BJ mag-nitudes integrated radially to radii corresponding to theiraperturesb ∆BJ = 0.65B(Texas) + 0.35V (Texas)−BJ(VPC)c ∆U = U(Texas)− U(VPC).
Table 12. Objects in common between the VPC and Gallagher& Hunter (1986)a
IC/VCC r/′′b
BJ9229 BJ4882 U9362 ∆BJc ∆Ud
V1377 20.0 16.81 - - +0.41 -V512 39.5 16.08 - - −0.20 -I3239 20.0 16.53 - - −0.32 -I3355 30.0 15.97 15.90 15.92 −0.53 −0.63I3416 20.0 15.91 - 15.75 +0.02 −0.16I3475 15.0 16.53 - 16.89 −0.15 −0.04
a Their measurements are compared with U and BJ mag-nitudes integrated radially to radii corresponding to theiraperturesb Measurements corresponding to apertures of radius<12′′have not been included because they can be expectedto be particularly sensitive to differences in seeing condi-tionsc ∆BJ = 0.65B(G&H) + 0.35V (G&H)−BJ(VPC)d ∆U = U(G&H)− U(VPC).
mag. Removing IC 3481A from the sample, reduces theresiduals to ∆U = −0.02 (σN−1 = 0.55) mag and ∆BJ =−0.06 (σN−1 = 0.30) mag. As there is a tendency for theresiduals to be smaller, the larger the aperture employed,it is quite possible that resolution differences are respon-sible for many of the apparent discrepancies.
Gallagher & Hunter (1986) measured six galaxies withsufficiently large apertures for comparisons to be use-ful. These objects are listed in Table 12. The apparentmean zero-point discrepancies were found to be ∆U =U(G&H) − U(VPC) = −0.14 (σN−1 = 0.32) mag and∆BJ = BJ(G&H) − BJ(VPC) = −0.17 (σN−1 = 0.41)mag. However, as Gallagher & Hunter’s aperture sizes aregenerally quite small, a large part of the apparent discrep-ancies may well be due to resolution differences. In the

C.K. Young and M.J. Currie: Virgo photometry catalogue 387
Table 13. Caldwell (1983) dwarfs in common with the VPCa
dw/VPC r/′′ BJ9229 BJ4882 U9362 ∆BbJ ∆Uc
1/843 17.8 15.87 - 16.15 −0.42 −0.143/856 17.8 16.86 - 17.54 −0.20 −0.376/801 19.5 15.99 - 16.37 −0.14 +0.128/835 17.8 16.60 - 16.92 −0.28 −0.0911/834 17.8 16.04 - 16.42 −0.29 −0.1912/808 19.5 17.43 - 17.91 +0.00 −0.1127/420 17.8 17.06 17.31 17.50 −0.29 −0.0128/342 17.8 16.10 16.07 16.27 −0.34 −0.1131/937 17.8 16.57 - 16.92 −0.09 +0.00
a Caldwell’s measurements are compared with U and BJ
magnitudes integrated radially to radii corresponding tohis aperturesb ∆BJ = 0.65B(Caldwell) + 0.35V (Caldwell) −BJ(VPC)c ∆U = U(Caldwell) − U(VPC).
case of the most discrepant galaxy, IC 3355 (which wasalso measured by de Vaucouleurs et al.), there may be anadditional explanation. IC 3355 lies only ∼15 arcmin fromthe direction of the giant elliptical, NGC 4406, and theprominent galaxies NGCs 4435, 4438 and 4402 are evencloser at hand. As IC 3355’s direction is so central withinthe cluster, photometry of this galaxy may therefore bevery sensitive to the background procedures adopted, dueto the extended haloes of the giant galaxies in the vicinityand/or any intra-cluster light that may be present.
There are nine VPC objects in common withCaldwell’s (1983) sample of dwarfs7 as listed in Table 13.The apparent mean zero-point shifts were found to be∆U = U(Caldwell) − U(VPC) = −0.10 (σN−1 = 0.14)mag and ∆BJ = BJ(Caldwell) − BJ(VPC) = −0.23(σN−1 = 0.13) mag. These comparisons may however, beeven more susceptible to differences in image resolution,as Caldwell’s apertures tend to be smaller than those ofde Vaucouleurs et al. and Gallagher & Hunter.
8.2. Surface photometry
The integrated-light profiles of IC 3475 (in BJ) andNGC 4468 (in U) are depicted in Figs. 19 and 20 respec-tively. NGC 4468 has been measured by several other ob-servers, whose measurements tend to be about 0.2 magbrighter interior to a radial distance from the image centreof 50 arcsec. The outermost measurement however, devi-ates from the photographic profile by a negligible amount(< 0.01 mag).
CCD surface photometry has already been publishedby Vigroux et al. (1986) for IC 3475. Vigroux et al.’sprofile of IC 3475 was directly comparable with ourown smoothed elliptical surface-brightness profile. In both
7 These observations were not however amongst those usedto calibrate the Schmidt plates.
Fig. 19. Comparisons with previous B-band aperture-photo-metry measurements of IC 3475, converted to BJ by means ofEq. (1), with (B − V ) = 0.82. All of the data points corre-spond to values tabulated previously. The curve represents theradially integrated profile from the unsmoothed image-scan ofPlate J9229
Fig. 20. Comparison with the U-band simulated-apertureCCD photometry of Bower et al. (1992) and the aperture pho-tometry of Michard (1982) and Sandage & Visvanathan (1978)for NGC 4468. The curve represents the radially integratedprofile from the unsmoothed image-scan of Plate U9362
Fig. 21. Comparison between the CCD surface photometryof Vigroux et al. (1986) for IC 3475 and the smoothed pho-tographic surface photometry on which the VPC is based.Vigroux et al.’s error bars are depicted

388 C.K. Young and M.J. Currie: Virgo photometry catalogue
cases, elliptical isophotes were fitted to the images andspecified by the same reduced-radius parameter as well asby a position angle and an ellipticity. Conversion of µBJ
to µB was by means of Eq. (1) with a (B − V ) colour of0.82. As can be seen from Fig. 21, there is a differencein profile slope, but the agreement between the photo-graphic and CCD photometry is generally good, and wellwithin Vigroux et al.’s quoted errors. The difference inprofile slope is almost certainly due to the heavy smooth-ing applied to the VPC plate-scan data, as extrapolationof the two profiles to r =∞ yields Bt = 14.47 for Vigrouxet al.’s profile (using n = 1) and Bt = 14.5 for the VPCprofile (for which n = 1.2).
Additional comparisons with CCD surface photome-try were only possible in the cases of a few saturatedgalaxy images. This was because the published CCD sur-face photometry is confined to the very brightest galax-ies in the Virgo Cluster, most of which were resolvedinto multiple images by the image-segmentation software.Those saturated galaxy images that did not suffer fromimage fragmentation, and for which relevant surface pho-tometry could be found in the literature, are comparedwith these other sources in Fig. 22. Note that the VPCsurface-brightness profiles plotted are based on the heav-ily smoothed plate-scan data.
As (B−V ) colour-gradient information was not avail-able for NGC 4458 or NGC 4468, and Peletier et al. (1990)found no evidence for any colour gradient in the caseof NGC 4551, mean (B − V ) colours from the RC3were used for the transformations from the BJ system tothe B system. These colours were 0.90 for NGC 4458,0.86 for NGC 4468 and 0.96 for NGC 4551. Note thatPeletier et al.’s RC-band profile of NGC 4551 is likely tobe more reliable than Jedrejewski’s (1987) even thoughpublished aperture photometry was used for calibrationpurposes in both cases, as the former profile was theweighted mean of four different observations. It should alsobe noted that the exceptionally good agreement betweenPeletier et al.’s RC-band profile of NGC 4551 and thecorresponding photographic profile, cannot be attributedwholly or even largely to the coincidence that the VPC’sRC-band zero point was partially based on one of Peletieret al.’s four RC-band frames of that galaxy. This is be-cause, not only did we reduce the [one] common CCDframe independently from Peletier et al., but our abso-lute calibration was based on on observations of standardstars (as described in Sect. 3.4) rather than on existingaperture-photometry measurements.
The apparent mean zero-point offsets for the B pro-files were B(Boroson & Thompson) − B(VPC) = +0.14(σN−1 = 0.05) mag, B(Peletier et al.)−B(VPC) = −0.16(σN−1 = 0.1) mag, B(Jedrejewski) − B(VPC) = −0.19(σN−1 = 0.1) mag. These mean residuals were com-puted for those parts of the profiles for which the re-duced radius exceeded 20 arcsec, and N in these casesrefers to the number of data points on the relevant pro-
file(s) compared (rather than the number of galaxies com-pared). Discrepancies between the photographic profilesand Peletier et al.’s U and RC profiles were negligible,though Jedrejewski’s RC profile was significantly brighterthan both the photographic profile and Peletier et al.’sprofile.
8.3. Discussion
From the comparisons made in this section, any majorerror in the zero points of the VPC’s magnitude scaleswould seem unlikely, though it would appear possible thatthe true zero points could be slightly brighter than thoseadopted by as much as ∼ 0.1 mag, particularly in the caseof the BJ-band. One possibility is that Eq. (1) may not beas sound as it had been hoped and that its degree of appli-cability may vary significantly with galaxy type. In judg-ing the BJ-band comparisons made in this section, it mustbe remembered that the galaxy samples of other observersdo not tend to cover all morphological types, but are of-ten confined to a single type of object. Minor systematicdiscrepancies between the different mean residuals com-puted for different observers’ photometry can therefore beexpected.
There is still some disagreement as to the optimum re-lationship describing transformations between the UKSTBJ system (IIIa-J, GG395) and the Johnson B and V sys-tems. Equation (1) is identical to that used by Buta &Corwin (1986). Blair & Gilmore (1982) derived a colourterm of −0.28±0.04 empirically, by plotting the colours ofa large stellar sample, whilst Warren et al. (1991) deriveda colour term of −0.35 by a similar method. The latter au-thors noted also that their empirical value disagreed withtheir predicted value of −0.26, which was based on modelsof the manufacturer’s filter transmission data and emul-sion sensitivity functions. More recently, Metcalfe et al.(1995) have demonstrated the case for the colour term be-ing at least as negative as −0.35 based on a galaxy sample.
It should also be remembered that even the un-smoothed plate-scan data suffered from relatively coarsesampling (2.′′1 pixels) as well as relatively poor seeing.When other observers’ photoelectric observations weremade under good seeing conditions, slightly negativemag(other work)−mag(VPC) residuals would be expectedfor small apertures. Although this bias would make theVPC zero points look slightly fainter in these compar-isons, it is not applicable to the VPC’s BJ-total magni-tude scale, nor does it have more than second-order conse-quences for the VPC’s isophotal magnitudes (as is evidentfrom Table 8).
In conclusion, the exact zero-point errors in the VPC’smagnitude scales cannot be estimated with confidence onthe basis of the existing photoelectric measurements forVirgo galaxies in the literature, which exhibit some mu-tual disagreements. However, on the basis of all of the

C.K. Young and M.J. Currie: Virgo photometry catalogue 389
Fig. 22. Comparisons of saturated [and smoothed] photographic profiles generated during the compilation of the VPC withother observers’ CCD surface-photometry. In most cases, the extent of the saturated core within the photographic image isclearly discernable. The dashed lines represent the bright isophote limits listed in Table 5
comparisons made in this section, our best estimates ofthe observed U -band and BJ-band zero-point discrepan-cies are −0.10 and −0.15 magnitudes respectively. It can-not be overemphasized that a simple weighted mean ofthe zero-point discrepancies found with respect to exist-ing photoelectric aperture and CCD photometry (whichwould give most weight to Caldwell’s 1983 measurements)would be unlikely to yield a meaningful result becausemost observers did not document the FWHM of their see-ing discs and because of the variation in the aperture sizesused (with Caldwell’s apertures being amongst the small-
est). It is probably fair to assume that most observers’photometry had the twin advantages of better seeing andsampling than the VPC’s (even before smoothing) as dis-cussed in the previous paragraph. The actual zero-pointerrors are therefore almost without any doubt smallerthan the observed discrepancies. The overall very provi-sional zero-point error estimates are therefore mag(otherwork)−mag(VPC)= 0.0+0.0
−0.05 and 0.0+0.0−0.1 for the U and
BJ bands respectively. In the case of the RC-band magni-tude scale, there is very little photometry in the literature,and meaningful comparisons with other sources were not
390 C.K. Young and M.J. Currie: Virgo photometry catalogue
possible until Durrell’s (1997) observations of severaldwarfs that are also [unsaturated] VPC objects. Durrell(1997) has already noted the excellent agreement he foundbetween his total magnitudes (which were derived fromCCD observations) and those of Young & Currie (1995),hereunder YC3, which he based on three dwarf galax-ies in common between the two samples (T1(Durrell) −RC(YC3) = −0.04± 0.07 mag). As described in Sects. 4.2and 4.3, we have improved our total-magnitude extrapo-lation procedure since YC3. We now find an even smallerzero-point offset of T1(Durrell) − RC(VPC) = −0.03±0.06 mag based on the same three galaxies.
Acknowledgements. We thank the UKST Unit for loan ofthe plate material; the ROE’s Image & Data ProcessingUnit for scanning the plates with COSMOS; Starlink, OxfordUniversity Computing Service, the QSO & ObservationalCosmology Group at BAO and Wu Xiang-ping for use oftheir computing facilities; Tony Lynas-Gray for maintainingthe Oxford astrophysics VAX cluster beyond its period of sup-port by Starlink; Jon Godwin for his software environmentand in particular for his image-segmentation software; ReynierPeletier for several CCD frames; Michael Drinkwater for spot-ting a galaxy that we had overlooked and Bruno Binggeli fora machine-readable version of the VCC. CKY gratefully ac-knowledges a SERC studentship for the early part of this workand a PDRF from the National Postdoctoral Fellowship Officeof China for the later part.
References
Binggeli B., Popescu C.C., Tammann G.A., 1993, A&AS 98,275
Binggeli B., Sandage A., Tammann G.A., 1985, AJ 90, 1681(VCC)
Binggeli B., Sandage A., Tarenghi M., 1984, AJ 89, 64Binggeli B., Tammann G.A., Sandage A., 1987, AJ 94, 251Blair M., Gilmore G., 1982, PASP 94, 742Boroson T.A., Thompson I.B., 1987, AJ 92, 33Bothun G.D., Mould J.R., Caldwell N., MacGillivray H.T.,
1986, AJ 92, 1007Bower R.G., Lucey J.R., Ellis R.S., 1992, MNRAS 254, 589Burstein D., Davies R.L., Dressler A., et al., 1987, ApJS 64,
601Buta R.J., Corwin H.G., 1986, ApJS 62, 255Caldwell N., 1983, AJ 88, 804Carter D., Godwin J.G., 1979, MNRAS 187, 711de Vaucouleurs A., Longo G., 1985, Monographs in Astronomy
No. 5, University of Texas, Austinde Vaucouleurs G., 1959, Lowell Obs. Bull. 4, 97de Vaucouleurs G., Corwin H.G., 1986, AJ 92, 722de Vaucouleurs G., Pence W.D., 1979, ApJS 40, 425de Vaucouleurs G., de Vaucouleurs A., Buta R., 1981, AJ 86,
1429de Vaucouleurs G., de Vaucouleurs A., Corwin H.G., 1976,
Second Reference Catalogue of Bright Galaxies, Universityof Texas, Austin
de Vaucouleurs G., de Vaucouleurs A., Corwin H.G., 1978, AJ83, 1331
de Vaucouleurs G., de Vaucouleurs A., Corwin H.G., Buta R.J.,Paturel G., Fouque P., 1991, Third Reference Catalogue ofBright Galaxies. Springer-Verlag, New York (RC3)
Dixon K.L., 1979, D. Phil. thesis, University of OxfordDrinkwater M.J., Currie M.J., Young C.K., Hardy E., Yearsley
J.M., 1996, MNRAS 279, 595Drinkwater M., Hardy E., 1991, AJ 101, 94Durrell P.R., 1997, AJ 113, 531Fukugita M., Okamura S., Yasuda N., 1993, ApJ 412, L13Gallagher J.S., Hunter D.A., 1986, AJ 92, 557Godwin J.G., 1976, D. Phil. thesis, University of OxfordHeckmann O., Diekvoss W., Kox H., Gunther A., Brosterhus
E., 1975, AGK3; Star Catalogue of Positions and ProperMotions, Hamburger Sternwarte, Hamburg
Jacoby G.H., Branch D., Ciardullo R., et al., 1992, PASP 104,599
Jedrejewski R.I., 1987, MNRAS 226, 747Karachentsev I.D., Karachentseva V.E., 1982, Pis’ma Astron.
Zh. 8, 198Karachentsev I.D., Karachentseva V.E., Borngen F., 1983,
Pis’ma Astron. Zh. 9, 387Landolt A.U., 1983, AJ 88, 439Longo G., de Vaucouleurs A., 1983, Monographs in Astronomy
No. 3, University of Texas, AustinLongo G., de Vaucouleurs A., 1985, Monographs in Astronomy
No. 3A, University of Texas, AustinMacGillivray H.T., Martin R., Pratt N.M., et al., 1976,
MNRAS 186, 69Metcalfe N., Fong R., Shanks T., 1995, MNRAS 274, 769Michard R., 1982, A&AS 49, 591Newell B., O’Neil E.J., 1977, PASP 89, 925Oemler A., 1974, ApJ 194, 1Peletier R.F., Davies R.L., Illingworth G.D., Davis L.E.,
Cawson M., 1990, AJ 100, 1091Phillipps S., Davies J.I., Disney M.J., 1988, MNRAS 233, 485Pierce M.J., Tully R.B., 1988, ApJ 330, 579Poulain P., 1988, A&AS 72, 215Rhee G.F.R.N., Katgert P., 1988, A&AS 72, 243Sandage A., Visvanathan N., 1978, ApJ 223, 707Sersic J.L., 1968, Atlas de galaxias australes. Observatorio
Astronomica, CordobaTonry J.L., 1991, ApJ 373, L1Tonry J.L., Ajhar E.A., Luppino G.A., 1990, AJ 100, 1416Vigroux L., Thuan T.X., Vader J.P., Lachieze-Rey M., 1986,
AJ 91, 70Warren S.J., Hewett P.C., Irwin M.J., Osmer P.S., 1991, ApJS
76, 1Young C.K., 1994, D. Phil. thesis, University of OxfordYoung C.K., Galaxies. In: Chan K.C., Cheng
K.S. (eds.) Proceedings of 21st Century Chinese AstronomyConference. World Scientific Publishing, Singapore
Young C.K., Currie M.J., 1991, Observatory 111, 220Young C.K., Currie M.J., 1994, MNRAS 268, L11Young C.K., Currie M.J., 1995, MNRAS 273, 1141Young C.K., Metcalfe N., Zhu J., Wu H., Chen J., A&A
(in press)

C.K. Young and M.J. Currie: Virgo photometry catalogue 391
Appendix A:
Fig. 1. Example fits to galaxy surface-brightness profiles (r* denotes reduced radius)

392 C.K. Young and M.J. Currie: Virgo photometry catalogue
Fig. 1. continued

C.K. Young and M.J. Currie: Virgo photometry catalogue 393
Fig. 1. continued

394 C.K. Young and M.J. Currie: Virgo photometry catalogue
Appendix D: The extension to the main catalogue.
Table 14. Inextricably merged objects, which are designated VPCX to distinguish them from main-catalogue objects
VPCX (α−12h,δ)1950.0 n(gal.s)a BJ25b σBJ25
notes
1A,B 16 23.4 +12 43 22 2 17.1 0.2 interacting pair2 17 07.1 +12 40 10 1 17.5 0.3 star subtracted3A,B 17 11.2 +13 43 42 2 17.3 0.2 including small companion at end of spiral arm4A,B 18 09.3 +11 40 42 2 17.6 0.2 interacting pair5 18 32.6 +12 05 41 1 17.0 0.5 star subtracted6 19 23.5 +13 07 24 1 17.7 0.5 star subtracted7 20 08.6 +11 51 28 1 18.6 0.5 star subtracted8A,B 20 23.9 +12 34 09 2 17.8 0.2 interacting pair9A,B 20 39.7 +13 18 11 2 17.4 0.4 a third fainter galaxy subtracted,
leaving two interacting ones10 21 15.8 +13 00 04 1 18.2 0.5 star subtracted11 21 28.6 +10 57 15 1 18.6 0.4 one fainter galaxy subtracted12 21 49.9 +13 18 14 1E? 15.7 1.0 bright star subtracted during segmentation13 21 52.7 +15 21 10 1 17.3 0.5 star subtracted14A,B 21 56.2 +13 39 41 2 17.4 0.2 probably connected15 22 27.4 +12 16 14 1 18.3 1.0 most probably star and galaxy;
star suspect subtracted16A 22 43.4 +13 09 14 1 18.5 0.8 background subtraction problems16B ” ” 1 18.5 0.8 background subtraction problems17 22 56.7 +13 46 27 1 18.4 0.5 star subtracted18 24 12.2 +11 11 42 1S 16.6 0.5 star subtracted19 24 12.4 +11 30 56 1 18.1 0.5 one fainter galaxy subtracted20 24 46.0 +14 25 23 1 ? - possible galaxy behind star21A,B 25 25.3 +11 09 12 2 18.1 0.2 interacting pair22A,B 26 24.6 +10 47 35 2 17.9 0.2 interacting pair23 26 54.6 +14 31 11 1 17.7 0.5 star subtracted24A,B 27 08.4 +12 34 17 2 17.8 0.2 interacting pair25 27 10.5 +11 40 37 1S0? 16.0 0.5 star subtracted26 27 18.4 +12 02 04 1 18.6 0.5 star subtracted27A,B 27 20.3 +11 57 14 2E 15.7 0.2 interacting pair28 27 39.6 +12 01 13 1E 16.6 0.5 poorly resolved during segmentation29 27 40.0 +12 01 15 1E 16.5 0.5 poorly resolved during segmentation30 27 50.8 +11 08 44 1 17.5 0.5 star subtracted31 27 52.6 +11 27 58 1 17.8 0.4 one fainter galaxy subtracted32 28 02.8 +13 01 52 1 17.7 0.5 star subtracted33A,B 28 11.0 +10 51 17 2 18.2 0.2 interacting pair34 28 34.0 +10 53 22 1 18.6 0.3 star subtracted35 28 45.9 +14 06 16 1S? 16.8 0.5 star subtracted36A,B 28 48.9 +15 13 30 2 17.8 0.2 probably interacting37 28 54.8 +13 11 31 1 17.8 0.5 star subtracted38A,B 29 09.9 +15 24 25 2 18.6 0.2 interacting pair39 29 20.6 +15 05 06 1 18.3 0.5 star subtracted40 29 23.4 +13 32 47 1 18.4 0.5 star subtracted41A,B 30 14.2 +15 20 34 2 18.6 0.2 interacting pair42 30 29.3 +11 25 41 1S? 16.8 0.3 star subtracted43A,B 31 38.7 +15 25 56 2 17.7 0.2 interacting pair44 31 51.7 +12 20 23 1 17.9 0.3 star subtracted45 32 23.6 +15 26 35 1 17.6 0.5 star subtracted46A,B 33 03.6 +11 25 01 2 18.1 0.2 interacting pair47A,B 33 25.9 +11 32 50 2E 16.7 0.2 interacting pair48 33 43.1 +14 56 38 1 18.8 0.5 star subtracted49A,B 33 52.5 +13 12 02 2 17.4 0.2 interacting pair50 34 07.8 +11 22 37 1S0 15.9 0.3 IC 3578; star subtracted51 34 38.7 +14 59 33 1 17.5 0.5 star subtracted
a n(gal.s)= number of galaxies observed for which BJ25 ≤ 19.0; morphological types quoted if BJ25 ≤ 17.0b combined light due to all galaxies for which BJ25 ≤ 19.0.

C.K. Young and M.J. Currie: Virgo photometry catalogue 395
Appendix F: NGC and IC designations for VPC objects.
Table 15. VPC objects with NGC designations
VPC NGC VPC NGC
49 4262 622 445863 4267 626 4459
130 4294 629 4461146 4298 665 4468149 4299 687 4473155 4302 700 4474178 4305 706 4476179 4306 711 4477222 4313 722 4482242 4320 736 4478250 4325 741 4479271 4330 755 4486B324 4351 771 4486328 4352 778 4491375 4371 780 4486A385 4374 820 4497394 4377 840 4501432 4387 849 4503438 4388 855 4506441 4390 894 4516452 4402 919 4523454 4406 935 4528472 4413 948 4531511 4419 995 4548518 4425 1002 4550531 4429 1010 4551532 4431 1012 4552542 4435 1050 4564544 4436 1058 4567550 4438 1064 4568560 4440 1082 4569574 4446 1088 4571582 4447 1119 4579613 4452
Table 16. VPC objects with IC designations
VPC IC VPC IC
4 775 704 342518 3142 751 343236 3147 760 343540 3149 765 343778 781 801 344399 3173 810 3442
114 3187 813 3446116 3188 827 3453159 3199 834 3457182 3209 838 797252 3238 839 3459256 3239 843 3461260 3244 847 3466301 3258 864 3467356 3284 865 3470395 3305 878 3475397 3303 881 3476419 3311 884 3478446 3327 885 3481447 3331 887 3481A474 3344 897 3483496 3349 898 3490502 3355 900 3489505 3356 901 3492507 3358 918 3499514 3363 920 3500528 3371 923 350575 794 943 3509589 3381 947 3510600 3388 960 3520610 3393 973 3522615 3392 996 3540651 3413 1047 3567670 3416 1073 3583682 3418 1085 3586