the views expressed in this working paper are those of the
TRANSCRIPT

The views expressed in this Working Paper are those of the individual author(s) and do not
necessarily represent the position of the Kenya School of Monetary Studies (KSMS) or KSMS policy.
Working Papers are preliminary research by the author(s) and are published to stimulate discussion
and comments.
Impact of the real exchange rate on Kenya’s exports
Moses C. Kiptui*, Joseph Wambua and Lydia Ndirangu
Abstract
This study examines the relationship between the real exchange rate and exports in Kenya over the
period 1999Q3 – 2012Q3. A vector error correction model (VECM), which postulates that real
exports is a function of the real exchange rate and income of main trading partners is estimated.
Results from the estimated long run cointegrating vector show that the real exchange rate has a
significant effect on exports in the long-run. Foreign economic activity is found to have short-run
positive effects on exports.
JEL Classification: F30, F31, F41.
Key Words: Real exchange rate, Exports, Vector Error Correction Model.
* Moses Kiptui (corresponding author), Kenya School of Monetary Studies, Research Centre, PO BOX 65041-
00618, Nairobi, Kenya, Email: [email protected]

Page 1 of 10
1. Introduction
Numerous studies have been carried out to investigate if the real exchange rate is a significant factor
in explaining exports, after controlling for other relevant factors. Despite the existence of these
studies, very few have been undertaken for Kenya and the few that exist for Kenya do not consider
the most recent period. This paper therefore seeks to fill the gap.
The study is motivated by four main factors. One, the economic blueprint for Kenya - the Vision 2030
blueprint - identifies the special role that exports are expected to play in propelling Kenya into middle
income status by 2030. The choice of exports as a growth propelling factor is appropriate since the
experience of countries that have managed to reduce poverty shows heavy reliance on export growth.
China, South Korea, Taiwan, Singapore, Malaysia and other emerging economies have managed to
uplift their economies partly due to exports expansion. Secondly, the anticipated growth of 10 percent
annually for the next 20 years requires heavy imports of essential inputs such as farm machinery,
transport equipment, fertilizers, fuel, among others, which can lead to unsustainable current account
deficits unless the imports are well matched by exports. It is imperative that exports must expand in
order for the country to sustainably finance its imports most of which are essential inputs in the
production process. Thirdly, the exports sector can directly contribute to poverty reduction through
creation of employment opportunities and alleviation of the negative aspects of unemployment such
as poor health, lack of access to clean water, lack of access to education, environmental degradation,
among others. These are goals that the country has set itself to accomplish as part of the Millennium
Development Goals (MDGs). A thriving exports sector would therefore be a solution to various
problems that the country seeks to address. The fourth motivating factor for this study is to understand
the relationship between exports and the real exchange rate which involves computation of elasticities
whose sign and magnitude have major implications for trade policy as well as for balance of
payments. The sign and magnitude of these elasticities is critical in determining whether it makes
economic sense to weaken the domestic currency as a way of promoting exports.
It is clear from the above discussion that if exports are to be an integral part of the economic growth
targets as stated in the Vision 2030 development blueprint, it is critical that a clear understanding is
sought about the factors that influence exports growth. While there are obviously numerous factors
such as technology, quality of labour, infrastructure, legal and regulatory framework, trade policy,
among others, that affect exports, this study seeks to find out whether the real exchange rate has been
competitive for the export sector. The choice of the exchange rate is motivated on several grounds -
first, the real exchange rate is directly related to the price of the exports and hence very important
even if all other factors for exports were ‘right’. Secondly, the real exchange rate is directly connected
with domestic inflation through its computation hence by assessing its impact on exports the paper
Page 2 of 10
will indirectly be assessing whether domestic inflation has been a boost or a constraint to export
growth.
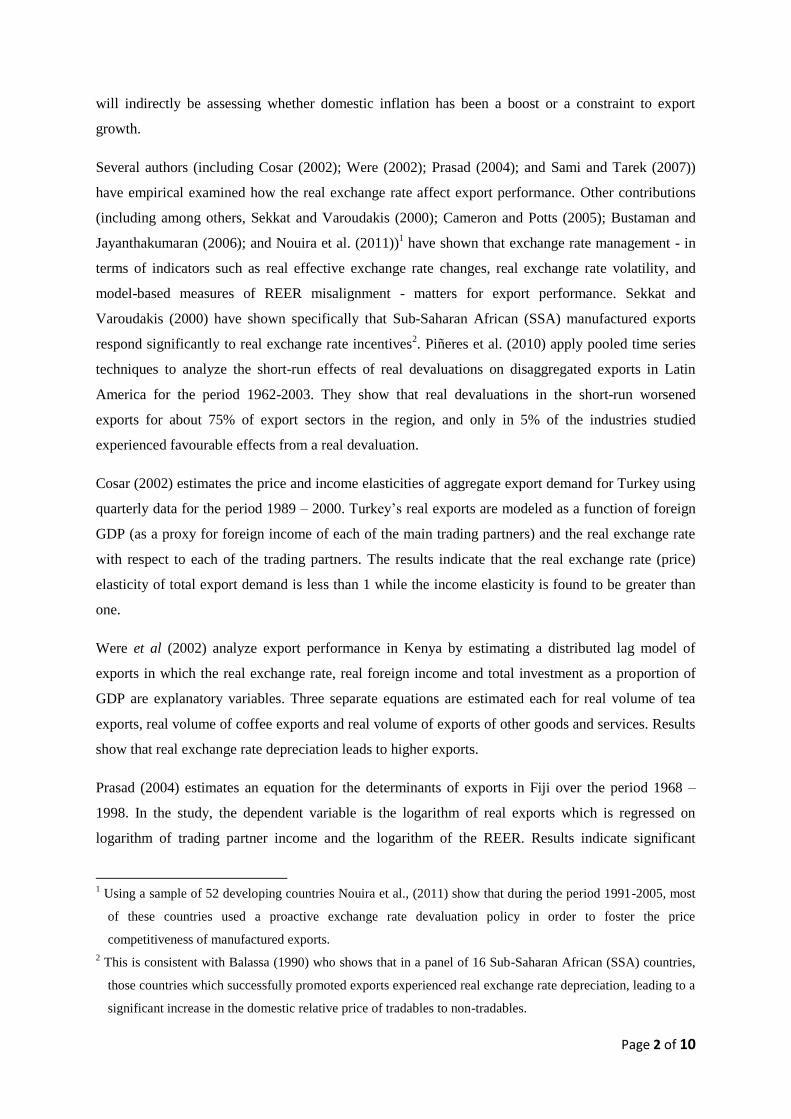
Several authors (including Cosar (2002); Were (2002); Prasad (2004); and Sami and Tarek (2007))
have empirical examined how the real exchange rate affect export performance. Other contributions
(including among others, Sekkat and Varoudakis (2000); Cameron and Potts (2005); Bustaman and
Jayanthakumaran (2006); and Nouira et al. (2011))1 have shown that exchange rate management - in
terms of indicators such as real effective exchange rate changes, real exchange rate volatility, and
model-based measures of REER misalignment - matters for export performance. Sekkat and
Varoudakis (2000) have shown specifically that Sub-Saharan African (SSA) manufactured exports
respond significantly to real exchange rate incentives2. Piñeres et al. (2010) apply pooled time series
techniques to analyze the short-run effects of real devaluations on disaggregated exports in Latin
America for the period 1962-2003. They show that real devaluations in the short-run worsened
exports for about 75% of export sectors in the region, and only in 5% of the industries studied
experienced favourable effects from a real devaluation.
Cosar (2002) estimates the price and income elasticities of aggregate export demand for Turkey using
quarterly data for the period 1989 – 2000. Turkey’s real exports are modeled as a function of foreign
GDP (as a proxy for foreign income of each of the main trading partners) and the real exchange rate
with respect to each of the trading partners. The results indicate that the real exchange rate (price)
elasticity of total export demand is less than 1 while the income elasticity is found to be greater than
one.
Were et al (2002) analyze export performance in Kenya by estimating a distributed lag model of
exports in which the real exchange rate, real foreign income and total investment as a proportion of
GDP are explanatory variables. Three separate equations are estimated each for real volume of tea
exports, real volume of coffee exports and real volume of exports of other goods and services. Results
show that real exchange rate depreciation leads to higher exports.
Prasad (2004) estimates an equation for the determinants of exports in Fiji over the period 1968 –
1998. In the study, the dependent variable is the logarithm of real exports which is regressed on
logarithm of trading partner income and the logarithm of the REER. Results indicate significant
1 Using a sample of 52 developing countries Nouira et al., (2011) show that during the period 1991-2005, most
of these countries used a proactive exchange rate devaluation policy in order to foster the price
competitiveness of manufactured exports.
2 This is consistent with Balassa (1990) who shows that in a panel of 16 Sub-Saharan African (SSA) countries,
those countries which successfully promoted exports experienced real exchange rate depreciation, leading to a
significant increase in the domestic relative price of tradables to non-tradables.

Page 3 of 10
effects of incomes of trading partners, the real effective exchange rate and agricultural supply side
shocks. As expected, results showed a positive relationship between the volume of Fiji’s exports and
incomes of the trading partners. Similarly, the study found that the relationship between Fiji’s export
volume and exchange rate depreciation was almost one-on-one implying that a weaker currency was
good for exports. In a related study, Veeramani (2008) finds that the appreciation of the REER led to
a fall in the dollar value of India’s merchandise exports, and that the extent of the negative
relationship between the REER and exports declined since 2002.
Bustaman and Jayanthakumaran (2006) apply an ARDL bounds testing procedure to investigate the
short run and long-run impacts of exchange rate volatility on Indonesia’s exports of priority
commodities to the U.S. They find that, for most of the commodities, a depreciation of the Rupiah
against the dollar led to an increase in export volume in the long run, although their effects were
insignificant (except for cocoa). A similar result is also reported by Cameron et al., (2005) for
Ugandan coffee export earnings.
Sami and Tarek (2007) estimate an exports equation for Tunisia in which the volume of Tunisian
exports is the dependent variable and the real GDP of trading partners (used as proxy for foreign
income) and the real exchange rate are the explanatory variables. The sample period is 1987 – 2004.
Results show that the real exchange rate is a significant determinant of Tunisian exports. However,
the study cautions that a mere weakening of the domestic currency does not improve Tunisian exports
because the exports are inelastic with respect to the real exchange rate
Various approaches have been adopted by these authors to study the relationship between real
exchange rate and exports. In virtually all studies, the real exchange rate and income of the partner
state are included. Others have included variables to capture supply side shocks. For instance, Prasad
(2004) included sugar cane production per hectare to capture supply side shocks while Were et all
(2002) use investment to GDP ratio – a proxy for capital formation – to capture supply constraints.
Some use time series data while others use panel data estimation. The literature review thus provides
a rich set of information on how various authors have studied the link between export performance
and the real exchange rate.
Our study covers the period 1999Q3 to 2012Q3. The rest of the paper is organized as follows: in
section 2, we provide an overview of the methodology. Section 3 discusses the results, while section 4
concludes.

Page 4 of 10
2. Methodology
The export demand equation assumes that external buyers make their decisions on the basis of relative
prices (proxied by real exchange rate) and the growth of external demand or incomes as follows:
])(,)[log( ttt FYLogRERFLogX (1)
where X = value of exports; FY = world income or economic activity; RER = real exchange rate.
The Johansen approach begins with the estimation of an autoregressive model of the form:
tktX
ktX
tXtX
22
11 (2)
Tt ,,2,1
Where: tX is a vector of N variables,
i
are NN coefficient matrices,
t is IID N -dimensional vector with zero mean and covariance .
This VAR framework can be transformed into an error correction model (ECM) of the form:
ttX
ktX
ktX
tXtX
1112211 (3)
The matrix contains information on the long-run relationship among the given variables.
The Johansen approach applies maximum likelihood technique to estimate the system by imposing
the restriction given the number of cointegrating relationships, r . In this case, is
rn and measures the speed of adjustment to equilibrium of the dependent variable; ' is nr ,
where r represents the rank of or simply the cointegrating relationships.
The Johansen procedure involves checking the rank of long-run matrix . If 0 , there are no
cointegrating relationships. If n , then there is full rank, implying that the variables must be
stationary in levels. If kr 0 , then r cointegrating vectors exist if the variables in tX are )1(I
and the rank of the matrix is said to be r . There are r cointegrating vectors despite non-
Page 5 of 10
stationarity of the variables in tX . The test for cointegration is carried out using the Trace test
statistic and Maximum eigenvalue test.
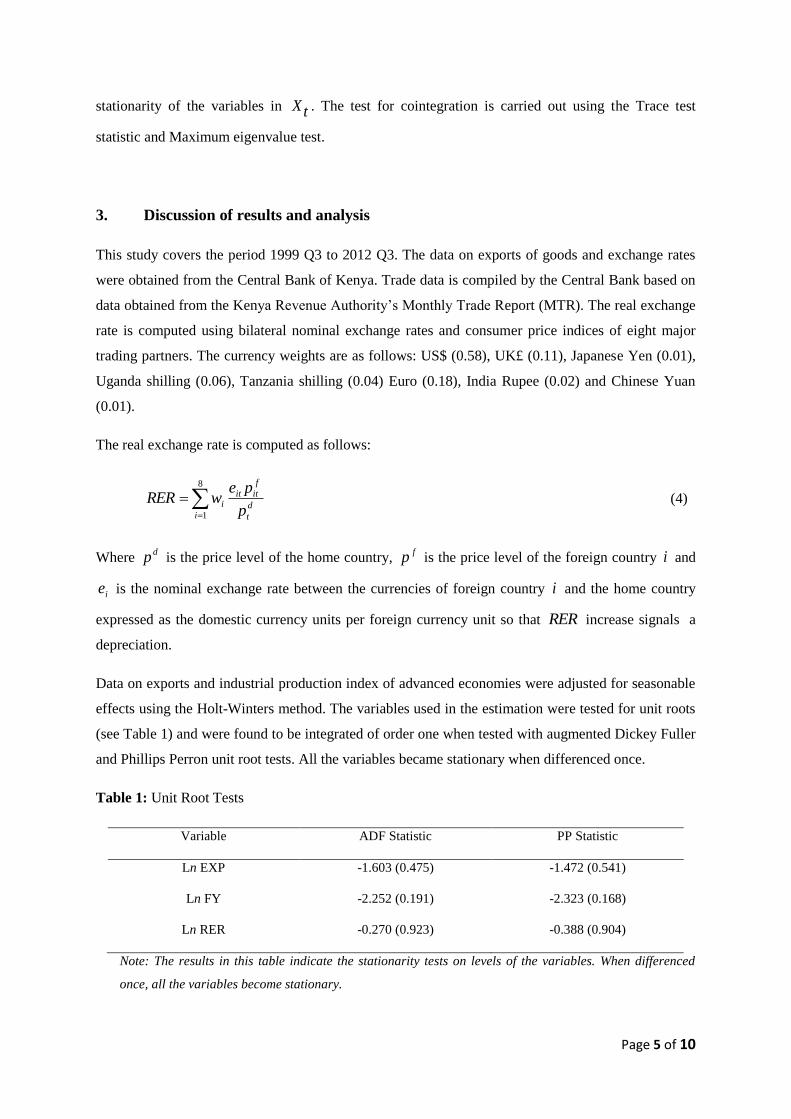
3. Discussion of results and analysis
This study covers the period 1999 Q3 to 2012 Q3. The data on exports of goods and exchange rates
were obtained from the Central Bank of Kenya. Trade data is compiled by the Central Bank based on
data obtained from the Kenya Revenue Authority’s Monthly Trade Report (MTR). The real exchange
rate is computed using bilateral nominal exchange rates and consumer price indices of eight major
trading partners. The currency weights are as follows: US$ (0.58), UK£ (0.11), Japanese Yen (0.01),
Uganda shilling (0.06), Tanzania shilling (0.04) Euro (0.18), India Rupee (0.02) and Chinese Yuan
(0.01).
The real exchange rate is computed as follows:
8
1id
t
f
ititi
p
pewRER (4)
Where dp is the price level of the home country,
fp is the price level of the foreign country i and
ie is the nominal exchange rate between the currencies of foreign country i and the home country
expressed as the domestic currency units per foreign currency unit so that RER increase signals a
depreciation.
Data on exports and industrial production index of advanced economies were adjusted for seasonable
effects using the Holt-Winters method. The variables used in the estimation were tested for unit roots
(see Table 1) and were found to be integrated of order one when tested with augmented Dickey Fuller
and Phillips Perron unit root tests. All the variables became stationary when differenced once.
Table 1: Unit Root Tests
Variable ADF Statistic PP Statistic
Ln EXP -1.603 (0.475) -1.472 (0.541)
Ln FY -2.252 (0.191) -2.323 (0.168)
Ln RER -0.270 (0.923) -0.388 (0.904)
Note: The results in this table indicate the stationarity tests on levels of the variables. When differenced
once, all the variables become stationary.

Page 6 of 10
Given that all the variables were found to be integrated of order one, a VAR model consisting of the
three endogenous variables was estimated and the Johansen test of cointegration applied. The
Johansen test identifies one cointegrating vector using both the Trace and the Maximum eigen value
tests (see Table 2). A vector error correction model was therefore estimated with five lags of each
variable. In the VAR estimation the Akaike information criteria identified five lags as the optimal lag
length. Other information criteria such as Hannan-Quinn also identified five lags as optimal. The
long-run cointegrating vector estimated using the Johansen approach showed that the real exchange
rate has significant effects on exports in the long run (see Table 3). A depreciation of the currency
leads to export growth. This result is significant at 5% level of significance. Foreign economic
activity (provided by industrial production index of the advanced economies) did not have significant
effects on exports in the long run. However, it has positive effects on exports as expected. Real
exchange rate elasticity was found to be quite low, at 0.29 and is consistent with findings in previous
studies which show that export demand price elasticity for agricultural products are low.
Table 2: VAR cointegration test Statistics
Hypothesized no. of
cointegrating equations
Eigenvalue Trace Statistic Maximum Eigenvalue
Statistic
= 0 0.441 51.835** (42.915) 30.839** (25.823)
= 1 0.235 20.996 (25.872) 14.205 (19.387)
= 2 0.120 6.791 (12.518) 6.791 (12.518)
Note: ** denotes rejection of the null hypothesis of no cointegrating vectors at 5% significance level. Numbers
in parenthesis are the critical values at 5% significance level.

Page 7 of 10
Estimation of Co-Integrating and Adjustment Coefficients
Table 3: (a) Normalized Co-integrating Coefficients
D(Ln EXP) Constant D(Ln FY) D(Ln RER) Trend
1.00 3.21 –0.27
(0.256)
[–1.056]
–0.287**
(0.190)
[–2.404]
–0.0096*
(0.009)
[–10.396]
(b) Adjustment Coefficients
Ln EXP Ln FY Ln RER
–0.807*
(0.157)
[5.154]
–0.032
(0.073)
[–0.438]
0.063
(0.142)
[0.445]
Note: Standard errors are in parenthesis and t statistic in the brackets; * denotes significant rejection of null
hypothesis at 1% level of significance; ** denotes significant rejection of hypothesis at 5% level of
significance
The results in Table 3(a) above imply that we have the following cointegrating vector:
TrendLnRERLnFYLnEXP @0096.0287.027.021.3 (5)
A trend variable introduced in the long run cointegrating vector produced significant positive effects
suggesting a change in the structure of exports with positive effects on export earnings. An error
correction model incorporating the short run properties confirmed the significance of the error
correction term thus confirming existence of the long run cointegrating vector (see Table 4). The
adjustment coefficient is found to be -0.74 implying a relatively fast adjustment to equilibrium.
Page 8 of 10
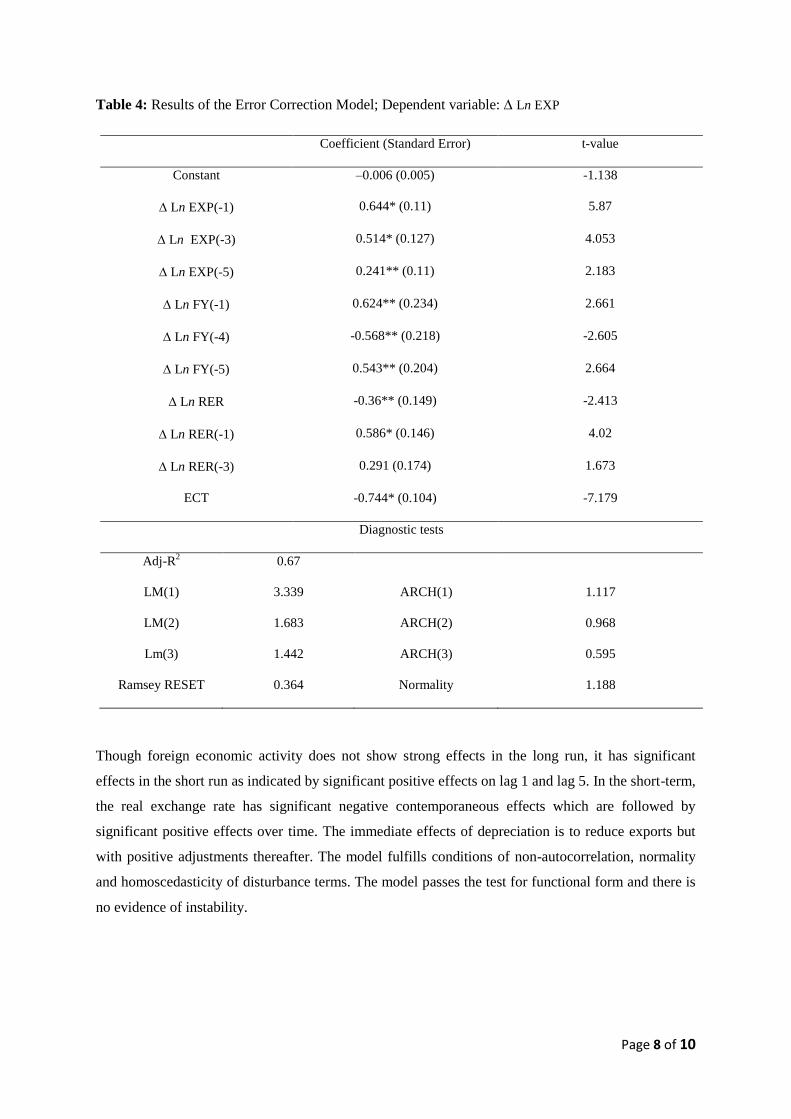
Table 4: Results of the Error Correction Model; Dependent variable: Ln EXP
Coefficient (Standard Error) t-value
Constant –0.006 (0.005) -1.138
Ln EXP(-1) 0.644* (0.11) 5.87
Ln EXP(-3) 0.514* (0.127) 4.053
Ln EXP(-5) 0.241** (0.11) 2.183
Ln FY(-1) 0.624** (0.234) 2.661
Ln FY(-4) -0.568** (0.218) -2.605
Ln FY(-5) 0.543** (0.204) 2.664
Ln RER -0.36** (0.149) -2.413
Ln RER(-1) 0.586* (0.146) 4.02
Ln RER(-3) 0.291 (0.174) 1.673
ECT -0.744* (0.104) -7.179
Diagnostic tests
Adj-R2 0.67
LM(1) 3.339 ARCH(1) 1.117
LM(2) 1.683 ARCH(2) 0.968
Lm(3) 1.442 ARCH(3) 0.595
Ramsey RESET 0.364 Normality 1.188
Though foreign economic activity does not show strong effects in the long run, it has significant
effects in the short run as indicated by significant positive effects on lag 1 and lag 5. In the short-term,
the real exchange rate has significant negative contemporaneous effects which are followed by
significant positive effects over time. The immediate effects of depreciation is to reduce exports but
with positive adjustments thereafter. The model fulfills conditions of non-autocorrelation, normality
and homoscedasticity of disturbance terms. The model passes the test for functional form and there is
no evidence of instability.

Page 9 of 10
4. Conclusion
The objective of this study was to examine the effect of the real exchange rate on Kenya’s exports. A
vector error correction model was estimated which included also foreign economic activity as an
independent variable.
The results have shown that the real exchange rate has significant long run effects on exports. In the
short-run however, the contemporaneous effects of the real exchange rate is negative but subsequent
effects are positive, resulting in positive long run effects of real exchange rate on exports. Foreign
economic activity was found to have insignificant long run effects on exports. Nonetheless, foreign
economic activity has significant short run effects. In conclusion, the results of the study suggest that
exchange rate policy remains important in the pursuit of an export promotion agenda. It is important
to ensure that the exchange rate is not over valued to ensure exports competitiveness. However, the
benefits of pursuing an appropriate exchange rate policy are accrued in the long-run.
References
Balassa, B. (1990). Incentive policies and export performance in Sub-Saharan Africa. World
Development, 18(3), 383-391.
Bustaman, A., and Jayanthakumaran, P. (2006). The impact of exchange rate volatility on Indonesia’s
exports to the USA: an application of ARDL bounds testing procedure. Padjadjaran
University Department of Economics Working Paper No 10.
Cameron S., K., D., and Potts, D. (2005). Has exchange rate volatility reduced Ugandan coffee export
earnings? Brandford Centre for International Development (BCID) Research Paper,
University of Bradford, Bradford, BD7-IDP, U.K.
Cosar, E. E. (2002). Price and income elasticities of Turkish export demand: a panel data application.
Central Bank of the Republic of Turkey Department of Statistics, Central Bank Review 2, 19-53.
Nouira, R., Plane, P., and Sekkat, K. (2011). Exchange rate undervaluation and manufactured exports:
a deliberate strategy? Journal of Comparative Economics, 39, 584-601.
Prasad, S. (2000). Determinants of exports in Fiji. Reserve Bank of Fiji Economics Department
Working paper No 04.
Piñeres, S. A. G., and Cantavella-Jorda, M. (2010). Short-run effects of devaluation: an analysis of
Latin American exports. Applied Economics, 42, 133-142.

Page 10 of 10
Sami, K., and Tarek, B. (2007). Empirical analysis of the demand elasticity for Tunisian exports.
Applied Econometrics and International Development, 7-1.
Sekkat, K., and Varoudakis, A. (2000). Exchange rate management and manufactured exports in Sub-
Saharan Africa. Journal of Development Economics, 61, 237-253.
Veeramani, C. (2008). Impact of exchange rate appreciation on India's exports. Economic and
Political Weekly, 43(22), 10-14.
Were, M., Ndung’u, N. S., Geda, A., and Karingi, S. N. (2002). Analysis of Kenya’s export
performance: An empirical evaluation. KIPPRA Discussion Paper No 22, November.