the validity of 21 cm spin temperature as a kinetic...
TRANSCRIPT

The Validity of 21 cm Spin Temperature as a KineticTemperature Indicator in Atomic and Molecular Gas
Item Type Article
Authors Shaw, Gargi; Ferland, G. J.; Hubeny, I.
Citation The Validity of 21 cm Spin Temperature as a Kinetic TemperatureIndicator in Atomic and Molecular Gas 2017, 843 (2):149 TheAstrophysical Journal
DOI 10.3847/1538-4357/aa7747
Publisher IOP PUBLISHING LTD
Journal The Astrophysical Journal
Rights © 2017. The American Astronomical Society. All rights reserved.
Download date 01/07/2018 00:17:58
Link to Item http://hdl.handle.net/10150/625168
The Validity of 21 cm Spin Temperature as a Kinetic TemperatureIndicator in Atomic and Molecular Gas
Gargi Shaw1,2, G. J. Ferland3, and I. Hubeny41 Dept. of Physics, UM-DAE Centre for Excellence in Basic Sciences, University of Mumbai, Mumbai 400098, India; [email protected]
2 Tata Institute of Fundamental Research, Homi Bhabha Road, Navy Nagar, Colaba, Mumbai 400005, India3 Department of Physics and Astronomy, University of Kentucky, Lexington, KY 40506, USA; [email protected]
4 Steward Observatory, University of Arizona, Tucson, AZ 85721, USA; [email protected] 2015 September 29; revised 2017 May 31; accepted 2017 June 2; published 2017 July 14
Abstract
The gas kinetic temperature (TK) of various interstellar environments is often inferred from observations that candeduce level populations of atoms, ions, or molecules using spectral line observations; H I 21 cm is perhaps themost widely used, and has a long history. Usually the H I 21 cm line is assumed to be in thermal equilibriumandthe populations are given by the Boltzmann distribution. A variety of processes, many involving Lyα, can affectthe 21 cm line. Here we show how this is treated in the spectral simulation code Cloudy, and present numericalsimulations of environments where this temperature indicator is used, with a detailed treatment of the physicalprocesses that determine level populations within H0. We discuss situations where this temperature indicator tracesTK, cases where it fails, as well as the effects of Lyα pumping on the 21 cm spin temperature. We also show thatthe Lyα excitation temperature rarely traces the gas kinetic temperature.
Key words: ISM: clouds – radiative transfer – radio lines: galaxies
1. Introduction
The gas kinetic temperature, TK, is one of the most importantparameters for a comprehensive understanding of the inter-stellar and intergalactic medium (ISM and IGM, respectively;Spitzer 1978) and there are various ways to determine it inneutral and molecular regions (Spitzer 1978; Tielens 2005;Osterbrock & Ferland 2006; Draine 2011). The 21 cm lineoriginates from the transition between the hyperfine levelswithin the 1S level of H0 (Griffiths 1995). This line is a directprobe of conditions in the neutral atomic phase of the ISM(Heiles & Troland 2004; Murray et al. 2015).
The level populations are determined by thermal collisions,which drive the levels into equilibrium with the surroundinggas, and by non-thermal radiative processes, including directpumping by the 21 cm radio continuum, pumping by thecontinuum near Lyα, and by the Lyα line itself (Field1959a, 1959b; Urbaniak & Wolfe 1981; Deguchi & Watson1985; Liszt 2001). It is well known that if the level populationsare collisionally dominated in the absence of other non-thermalprocesses, the 21 cm line will trace TK. In general, it is notpossible to tell whether the 21 cm spin temperature (hereafterTs), measured using emission and absorption in the case ofneutral gas, traces TK.
There are a few sources with sufficient observations to allowa comparison of the spin and kinetic temperatures from radioand UV observations. Orionʼs Veil, several layers of largelyneutral gas lying between Earth and the main ionizing stars ofthe Orion Nebula, is an example where the spin temperature ismuch greater than the kinetic temperature (Abel et al. 2006).This also occurs in the damped Lyman alpha absorbers (DLAs)at z=1.78 toward Q1331+ (Ts∼1000 K (Chengalur &Kanekar 2000) and TK∼150 K (Cui et al. 2005). Theseobservations are difficult to make and hence there are relativelyfew situations where these comparisons between Ts and TK canbe made. This paper describes how we have incorporated thephysics of the 21 cm transition into the spectral simulation code
Cloudy, last described by Ferland et al. (2013). Mostprocesses that drive the 21 cm line away from thermalequilibrium involve Lyα. Cloudy includes complete calcula-tions of the ionization and level populations of hydrogen,including the effects of photoionization, cosmic rays (CRs),thermal excitation, and many other processes. The result is aself-consistent calculation of the Lyα intensity, appropriatefor local conditions. Many previous calculations assumedthat the Lyα excitation temperature would be equal tothe gas kinetic temperature if the Lyα line is opticallythick (Wouthuysen 1952; Field 1959a, 1959b; Chen &Miralda-Escudé 2004). Actually the upper 2P level of H0 ispopulated by non-thermal processes in the neutral ISM,especially CR excitation and recombination following CRionization, so we find that the excitation temperature of Lyα isgenerally significantly greater than the local kinetic temper-ature. This drives the 21 cm spin temperature away from thekinetic temperature and so it can only be treated with a fullyself-consistent calculation.This paper is organized as follows. The next section outlines
our treatment of the microphysics of the 21 cm line. We thenpresent calculations of several standard environments to examinethe 21 cm spin temperature and whether it traces the kinetictemperature. Further details can be found in the PhD thesis ofGargi Shaw (2005)
2. Calculations
This section describes the detailed microphysics included inour simulations. The calculation described below is a part ofthe numerical spectra simulation code Cloudy since 2006 andhas been briefly mentioned in Pellegrini et al. (2007), but hasnever been described in detail. All numerical calculations areperformed using version C13.04 of Cloudy, which was lastdescribed by Ferland et al. (1998, 2013). Cloudy is based on aself-consistent calculation of the thermal, ionization, andchemical balance. Our chemical network, H2 chemistry, and
The Astrophysical Journal, 843:149 (10pp), 2017 July 10 https://doi.org/10.3847/1538-4357/aa7747© 2017. The American Astronomical Society. All rights reserved.
1
grain physics is described in Abel et al. (2005), Shaw et al.(2005), and van Hoof et al. (2004) and summarized in Ferlandet al. (2013). Our representation of H I line-formation processesis described by Ferland & Rees (1988), Ferguson & Ferland(1997), Luridiana et al. (2009), and Ferland et al. (2013). Weconsidered both external and locally generated Lyα photons.Internal Lyα photons are created by recombination followingionization or by collisional de-excitation, by thermal orsuprathermal particles, and may scatter many times beforethey either escape or are destroyed by dust (we treat thisprocess following Netzer et al. 1985).
2.1. The 21 cm Spin Temperature (Ts)
The detailed mathematical procedure to compute Ts isdescribed below. Two notations for temperatures will be used,a local temperature designated by t at each point of the cloudand an integrated temperature T over that line of sight.
The ground state of H0 undergoes hyperfine splitting due tothe interaction between the magnetic moments of the protonand the electron spin creating 1S1/2 (triplet) and 0S1/2 (singlet)levels. Here FLJ notation is used to denote the hyperfinelevels (Deguchi & Watson 1985) where F denotes thehyperfine quantum number. The statistical weight of a levelwith hyperfine quantum number F is (2×F+1) and thecorresponding selection rule is ΔF=0,±1. The levels 1S1/2and0S1/2 are separated by an energy gap equivalent to 0.068K. As summarized in Table 1, the hyperfine levels of 1S and 2Pstates, 0S1/2, 1S1/2, 1P1/2, and 1P3/2, are represented by levels1, 2, 3, and 4, respectively (see also Figure1 of Urbaniak &Wolfe 1981). Using this notation, the 21 cm transition is the2–1 transition while Lyα has the transitions between 3 or 4 and1 or 2 according the selection rule. The correspondingtransition probabilities are calculated from Equation(17.64)of Cowan (1981). Table 1 lists all these Einsteinʼs Acoefficients. The following discussion focuses on the 21 cmtransition, but in Cloudy these levels are part of a much largermodel of H0, as described in Ferland et al. (2013).
We define ts and Ts in terms of the hyperfine levelpopulations (n1 and n2) and column densities (N1 and N2) as
tn n
TN N
0.068
ln 3K, and
0.068
ln 3K. 1s s
2 1 2 1= - = -
( ) ( )( )
We work in terms of the dimensionless photon occupation
number within the Lyα transition, defined as J
h c2 3 2h =n
where J is the mean intensity and h c2 3 2n is the volume ofphase space for photons. With this definition, the pump rate isgiven by Bul J = Aul η. In the escape probability approach, Jand the line source function (Sl) are related byJ S 1l P S2 1b= -( ) where P S2 1b is the escape probability and
Slh
c
n P g
n S g n P g
2 2
1 2u
l u
3
2= ´n-
( )( ) ( )
(Elitzur 1992). Combining all
these, the final expression for h becomes
n P g
n S g n P g
n P
n S
2
1 21
2
3 11 . 2
l
u lP S
P S
2 1
2 1
h b
b
=-
´ -
» ´ -
( )( ) ( )
( )
( )( )
( ) ( )
The expressions for the rates that set the level populations inthe upper (2) and lower (1) levels of the 21 cm line are
R C PA
A AA
A
A AA
R A C PA
A AA
A
A AA
3 3
1
.
3
12 12 1232
31 3231 13
42
42 4141 14
21 21 21 21 21
31
31 3232 23
41
41 4242 24
h
h
b
h h
= + + ´+
´ ´ +
´+
´ ´
= ´ - + +
++
´ ´ ++
´ ´
( )
( )
R12 represents rates for all processes that depopulate level 1 andeventually populate level 2. The reverse rate is denoted by R21.Here C and P represent rates for collisions and externalpumping in the 21 cm line, respectively. The hyperfine-resolved η are all nearly equal since the hyperfine splitting issmall compared with the energy of Lyα. We assume that theyare equal in the following but do account for the small energydifferences in our code. The values of 13h , 14h , 23h , and 24h are
listed in Table 1. The terms A3 A
A A 31 1332
31 32h´ ´ ´
+and
A3 A
A A 41 1442
42 41h´ ´ ´
+represent the rate of level 2 being
pumped from level 1 via levels 3 and 4, respectively. Similarly,AA
A A 32 2331
31 32h´ ´
+and AA
A A 42 2441
41 42h´ ´
+represent the
rate of level 1 being pumped from level 2 via levels 3 and 4,respectively.We include collisional excitation and de-excitation in the
upper and lower level of 21 cm by various colliders such as H0,e-, and H+. The collisional de-excitation rate coefficients forH0 21 cm are taken from Zygelman (2005) in the temperaturerange 1–300 K. We use Allison & Dalgarno’s (1969) ratemultiplied by 1.24 above 300 K. Above 1000 K, we extrapolatethe rate as a power of T0.33. The collisional rate coefficients forelectrons are taken from Smith (1966) and updated to thevalues given by Liszt (2001), whereas the rate coefficient forH+ is taken from Furlanetto & Furlanetto (2007).
If the 1S populations are determined by processes that are indetailed balance, such as collisions, they will have a Boltzmanndistribution and so determine the kinetic temperature. How-ever, other processes, mainly pumping by the Lyα continuum,Lyα, or the cosmic microwave background (CMB), orsuprathermal electron excitation following CR or X-rayionization, can affect the populations and cause T Ts k¹ (Field1959a, 1959b).The radiative transition rate between the two hyperfine levels
is 2.85×10⁻¹⁵ s−1 (Wild 1952), which is usually smallcompared to the collision rates given above, 2.1×10⁻¹⁰ n(H0)s−1. The critical density, the density where collisions are moreimportant than radiative decays, is n(H0)=1.37×10⁻⁵ cm−3
for T=300 K. This is very low and hence the levelpopulations will trace TK if they were determined solely bycollisional processes and radiative decays.
Table 1Einstein A Coefficients and the Occupation Numbers for Different Transitions
(ΔE Is the Energy Difference between 2P1/2 and2P3/2 Levels in K)
Transition A (s−1) Index
1S1/2–0S1/2 2.85×10⁻¹⁵ 2 11P1/2–0S1/2 2.08×10⁸ 3 11P1/2–1S1/2 4.16×10⁸ 3 21P3/2–0S1/2 4.16×10⁸ 4 1
2
The Astrophysical Journal, 843:149 (10pp), 2017 July 10 Shaw, Ferland, & Hubeny

The populations of hyperfine levels can be affected by bothline and continuum pumping, which can drive ts away from tK.Pumping by the external continuum, usually the CMB, istreated as in Ferland et al. (2013). This is very importantbefore the re-ionization epoch when stars have not yetformed. Pumping by the external Lyα continuum is also veryimportant and the pumping rate [s−1] is simply Rlu=JluBlu=ηLyαAul gu/gl (s
−1). The rate of pumping by the externalcontinuum depends on the line optical depth and resulting self-shielding and finally can be expressed as CMB 21 cmh h b= ´ .
2.2. The Effects of Lyα
The following presents simple estimates of the effects ofLyα upon 21 cm. The intensity of the Lyα line J is set by the1S and 2P level populations. We derive simple estimates ofthese populations and the Lyα occupation number by assumingthat n=2 is mainly populated following recombination, asshown by the detailed numerical simulations presented below.For simplicity the following equations neglect terms account-ing for direct collisional excitation from 1S to 2P since theseare negligible for the low temperatures present in the neutralISM. In the numerical simulations the populations aredetermined from the simultaneous solution of the hydrogenionization and level populations as discussed in Ferlandet al. (2013).
We present the Lyα excitation temperature by tLya as
tn P n S
1.183 10
ln 2 3 1. 4Ly
5= -
´a [ ( ) ( )]
( )
Although we actually solve a full system of equations, whichincludes a large number of physical processes, we can simplifyour results in the low-density ISM limit to illustrate theimportant effects. The hydrogen ionization equilibrium can bewritten as
n S n n1 , 5e p BaG =( ) ( )
(Osterbrock & Ferland 2006) and the level populations of n(1S)and n(2P) are derived from
n P C A n n P2 2 . 6P S P S P S e p B2 1 2 1 2 1b d a+ + =( )[ ( )] ( ) ( )
Here Γ, ne, np, αB, C2P1S, A2P1S, and δ represent the ionizationrate (both photoionization and CR ionization), the electron andproton densities, the Case B radiative recombination ratecoefficient, the collisional de-excitation rate, the transitionprobability, and the destruction probability, respectively. In anH II region photoionization is the dominant ionization processwhile CR and X-ray ionization are important in the neutral andmolecular ISM. In both cases Lyα is produced by recombina-tion. For the CR ionization, we assume an H0 ionization rate of2×10−16 s−1 as the Galactic background value in atomicregions (McCall et al. 2003).
Equations (5) and (6) give the ratio of level populations,which then determines ηLyα, and thus the pumping ratebetween the hyperfine levels of the 1S state. Hence,
n P
n S
P
C A
2
3 11
2
3
1 7
P S
P S P S P SP S
Lya 2 1eff
2 1 2 1 2 12 1
h ba
a
b db
» ´ - »
´G
+ +´ -
b
( )( )
( ) ( )
( )( ) ( )
where we assume n(2P)=n(1S). In the ISM limit for a UVtransition like Lyα, where hν>kTk, tLya and ηLya are simplydifferent forms of the population ratio.
2.3. Simple Estimates
The following section will present numerical results for the21 cm spin temperature and the Lya excitation temperature.The slope of the Lyα source function, and not the intensity, setsthe 21 cm spin temperature when pumping dominates collisionsand CRs. In the calculations presented in this paper, we assumea constant source function at the Lyα line center (for details seethe Appendix).The 2P term is populated following radiative recombination
and depopulated by radiative and collisional decays to 1S. Oncecreated, Lyα photons undergo a large number of scatterings andeither escape the cloud, are absorbed by dust, or are collisionallyde-excited (thermalized). The scattering and absorption ratesare fastest in ISM conditions because the critical density of 2Pat 70 K, n A C 10P S P S P S P Scrit 2 1 2 1 2 1
152 1b d b d= + » +[ ( )] ( )
(cm−3) is large. The line will be collisionally de-excited onlywhen n 10P S2 1
15b d> +( ) . Here δ depends on the ratio of theabsorption to scattering plus absorption probabilities of dust andLyα through (Netzer et al. 1985),
n
n n. 8d d
d d H Ly0d
ss s
=+ a
( )
Here nd, σd, nH0, σLyα represent the dust density, dustabsorption coefficient, neutral hydrogen density, and Lyαabsorption coefficient, respectively. As shown below, δdominates in atomic regions of the ISM, so most Lyα photonsare lost by dust absorption rather than by escape or collisionalde-excitation. Although the numerical calculations will includeall terms, the following analytical estimates will consider onlythe escape and absorption terms.The ISM near a newly formed star can be in three different gas
phases: an H II region with H+, a PDR (photo-dissociation region)with H0 and H2, and a molecular region with H2. We next describethe characteristics of ηlya, or equivalently the 2P/1S populationratio (see Equation (7)), for each of these phases.We first consider the H II region. The Lyα optical depth is
small near the illuminated surface of a cloud, so β2P1S∼1 andline photons escape freely. As a result, η is small and tLyα islarge. Deep in the H II region the Lyα line becomes opticallythick and is strongly trapped, β2P1S decreases while Γ is alsolarge. As a result, ηlyα becomes larger and tLyα becomessmaller. Furthermore, since little H0 is present, the line opacityis small, the absorption to scattering ratio is large, and thedestruction probability is large. In this case ηLya simplifies to
P
A
P
A
n n
n
P
A
2
3
2
3
2
3.
9
P S
P S
d d
d d P S
Lyeff
2 1
eff
2 1
H Ly eff
2 1
0
ha
a da
as s
sa
a
= ´G
=
´G
´+
» ´G
ab b
a
b
( ) ( )
( )
( )
Hydrogen is atomic and molecular in the PDR. Γ decreasesin the transition from the ionized region, where it is dominatedby photoionization, to the atomic and molecular regions,where CR or X-ray ionization dominates. The H0 fraction islarge in the PDR, so n nd dH Ly0s sa , and therefore,
P
A
n
nLy2
3 P S d d
eff
2 1
H0 Lyh = ´ ´aa
a
s
sG
b
a( ) . The smaller Γ in the PDR
3
The Astrophysical Journal, 843:149 (10pp), 2017 July 10 Shaw, Ferland, & Hubeny

causes η to be smaller, Lyα pumping becomes less importantand tLyα decreases further. Finally, in molecular regions,where hydrogen is mostly H2 and little H0 is present,n nd dH Ly0s sa . In this case, β2P1S is small, and consequently
P
ALy2
3 P S
eff
2 1h = ´a
aa
G
b
( ) . This clearly shows that ηLya is verysmall and pumping is insignificant in molecular gas when dustis present.
However, in a metal- free and dust-free environment thedestruction probability δ due to absorption of Lyα photons bygrains is zero. Then ηLyα is proportional to,
P
C A
2
3. 10
P S P S P SLy
eff
2 1 2 1 2 1h
aa b
» ´G
+ab
( ) ( )
As a result, Lyα scattering and pumping are more important indust-free environments.
3. Results—Various Astrophysical Environments
In this section we present simulations of M17 and OrionʼsVeil where observations have revealed differences between Tsand TK. We also present simulations for the Galactic ISM. Itconcludes with a discussion of the effects of metallicity on thespin temperature in DLA-like systems.
3.1. Orion’s Veil
Orionʼs Veil is an absorbing screen lying along the line ofsight of the Orion H II region (O’Dell 2001). This is the nearestH II region and is a region of active star formation, although thestar formation rate is relatively low. The H II region is mainlyionized by a single O star. It is one of the few regions where adetailed map of the magnetic field strength exists from 21 cmcircular polarization studies (Troland et al. 1989). There aretwo main components (A and B) lying within a few parsecs ofthe Trapezium cluster with different turbulent and magneticpressures. Abel et al. (2006) studied these layers extensivelyand derived density, kinetic temperature, and distance from theTrapezium, from analysis of various ionic, atomic, andmolecular lines together with 21 cm measurements of the lineof sight component of the magnetic field. The density andmagnetic field strength are both higher than what is typicallyfound in the cold neutral medium (CNM), and the resulting gaspressure is also higher.
Here we have adopted the parameters derived by Abel et al.(2006) and recomputed their Veil model. The hydrogen densitynH is ∼102.5 cm−3 for component A and ∼103.4 cm−3 forcomponent B. They derived an upper limit on Tk by assumingthat the 21 cm H I line widths are entirely due to thermalmotions and also used the density–temperature relationshipfrom Abel et al. (2005) to deduce the same temperature(TK=50 and 80 K in components A and B of the Orion Veil).The 21 cm spin temperature was determined from the observedN (H0)/Ts with values 1019 cm−2 K−1 and 1019 cm−2 K−1 forcomponent A and B, respectively. Hence, they concludedthat for components A and B, 80 K<Ts<110 K and100 K<Ts<165 K, respectively.
Figure 1 shows the hydrogen ionization structure ofcomponent B of the Orion Veil. Hydrogen is mostly H+
in the H II region; this is followed by an atomic hydrogenregion (the PDR). In the H II region tK∼8000 K and theelectron density is nearly equal to the H+ density. In the PDRregion tKis lower (∼115 K) and C+ is the main electron donor.The molecular fraction is small in the Veil due to its proximity
to the Trapezium. The small separation and resulting highradiation field is the reason for the puzzlingly small molecularhydrogen abundance first noted by Savage et al. (1977).Figure 2 shows the various temperature indicators as a
function of depth into the Veil from its illuminated face. Theionization rate is high in the H II region and consequently bothηLyα and tLyα are high (Equation (7), Section 2.2). As a result,ts is close to tLyα although less than tK.The kinetic temperature decreases sharply across the
ionization front and reaches ∼115 K in the atomic region.The ionization rate decreases and the neutral hydrogen densityincreases across the PDR. As a result, Lyα pumping is less thanthat in the ionized region (Section 2.2) and ts is less than that inthe H II region. At the shielded face the spin temperatureapproaches the kinetic temperature and the difference betweentk and ts is only 13 K. However tLyα remains much higher thantk due to the significant recombination contribution to the line.The populations of the H0 2P term are affected by Lyα
pumping by the external continuum at shallow depths into theH+ layer, increasing ηLyα. This in turn affects the 21 cm spin
Figure 1. Solid (black), medium-dashed, dotted and solid (gray) lines representthe H+, H0, H2, and e- densities as a function of depth into the cloud from itsilluminated face for component B of the Orion Veil. At the illuminated face,hydrogen is mostly H+ (in the H II region); this is followed by an atomichydrogen region.
Figure 2. Various temperatures plotted as a function of cloud depth for componentB of the Orion Veil. The solid, dotted and medium-dashed lines represent ts, tlya,and tk, respectively. This figure shows that tLya does not trace tk.
4
The Astrophysical Journal, 843:149 (10pp), 2017 July 10 Shaw, Ferland, & Hubeny
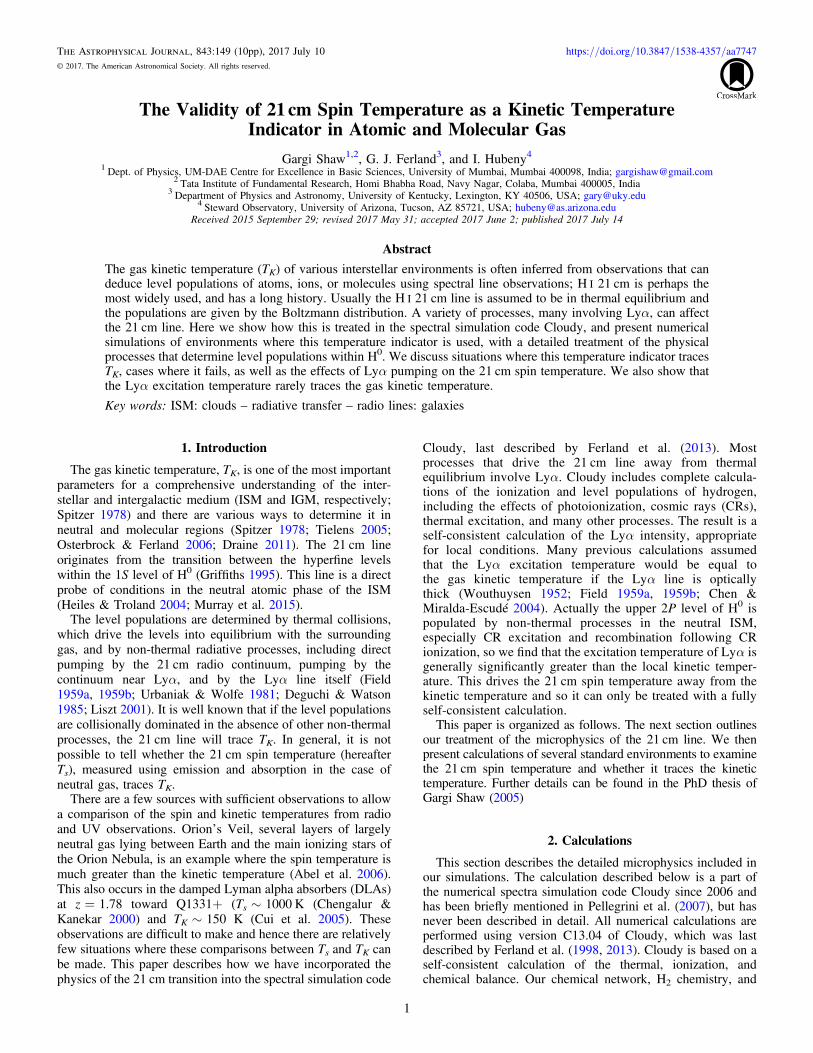
temperature. The external continuum near the Lyα line is set bythe spectral energy distribution (SED) of the ionizing star. Weuse a modified Kurucz local thermodynamic equilibrium stellarionizing continuum atmosphere as described in Rubin et al.(1991) as the incident SED. In real stars the Lyα line could bein absorption or in emission, depending on the wind structure.The Lyα line is very difficult to observe directly since, in mostcases, it is absorbed by the intervening ISM. The detailed effectof the Lyα line upon the 21 cm line is determined by the stellarSED. The thick black lines in Figure 3 show the varioustemperatures in the absence of continuum Lyα pumping. In thiscase, where we have assumed that the stellar SED has noemission in the Lya line, ts and tk trace each other in the atomicregion. The observed value of Ts is higher than the Tkdeducedby Abel et al. (2006), implying that the star does increase theLyα pumping. A similar effect was observed by Pellegrini et al.(2007) which was shown in their Appendix.
3.2. Orion H II Region
The Appendix of Pellegrini et al. (2007) shows the effects ofpumping by Lyman lines in the stellar continuum upon the21 cm spin temperature in the PDR.For the parameters of theirmodel of M17 even a modest amount of radiation in the stellarLyman lines could affect the 21 cm temperature by theprocesses described above.
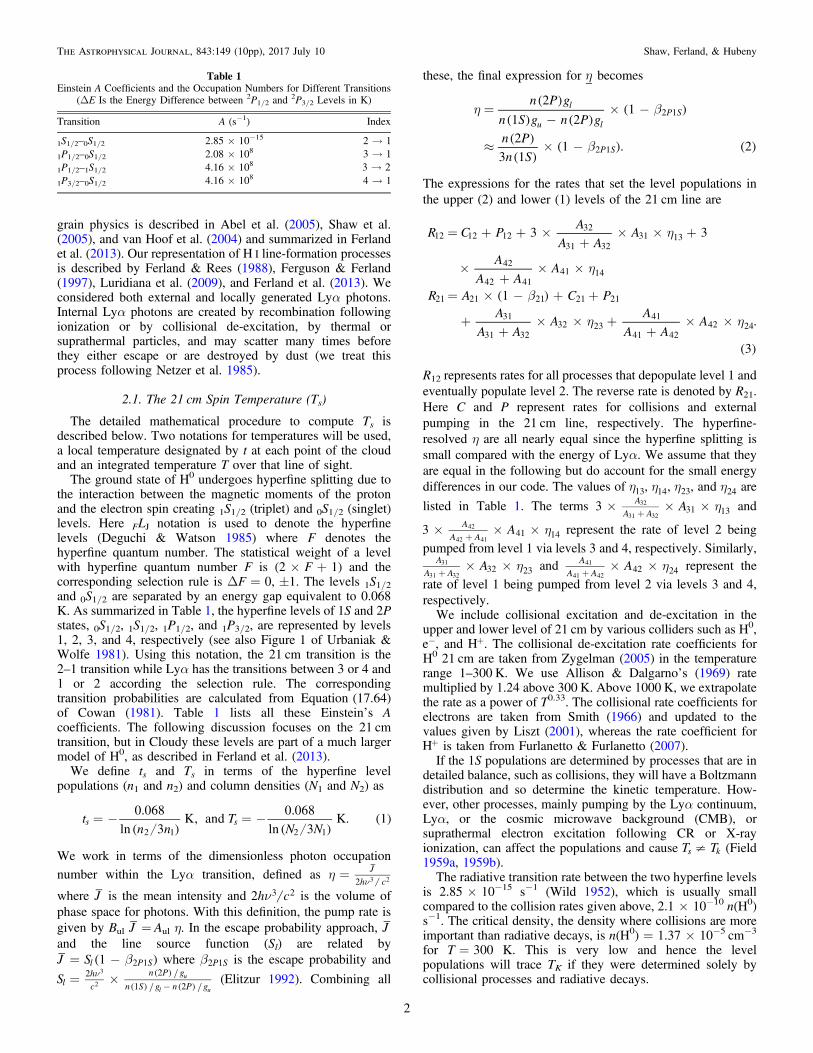
As a further test, we have recomputed the Baldwin et al. (1991)model of the Orion H II region, extending it into the PDR andstopping at an extinction of AV=10. We follow the proceduredescribed by Pellegrini et al. (2007) in blocking the stellar Lymanlines, with the exception that we now allow the lines to go intoemission (blocking factors >1).The results are shown inFigure 4.The parameters for the Orion H II region are quitedifferent from those for M17 and the results shown in the figurediffer too.The effects are modest for low blocking, although theybecome extreme if the Lyman lines are in emission.Theseresults, and those of Pellegrini, show that a wide range of effectsis possible.
3.3. M17
The Galactic H II region M17 is a relatively nearby massiveregion of star formation situated at a distance of 1.6±0.3 kpc(Nielbock et al. 2001). An overview of the geometry and thephysical conditions in the cloud is given in Pellegrini et al.(2007). Here we use the same geometry and physicalconditions. In contrast with the Orion region, the H II regionis created by a cluster of stars with a significant number ofmassive O stars. The ionizing radiation comes from a nearbydense cluster of O and B stars and an X-ray continuum.The southwestern (SW) part of M17 contains an obscuredionization front that is viewed nearly edge-on. It offers anexcellent opportunity to study the way gas changes from fullyionized to molecular as radiation from the ionizing starspenetrates into the gas. It is a classic example of a blister H IIregion where the ionization front is moving into the nearbymolecular region (Pellegrini et al. 2007).Pellegrini et al. (2007) derived a self-consistent model using
various ionic, atomic, and molecular lines and accounted forthe magnetic field in a magnetohydrostatic model. Their modelis time-steady. The force caused by the outward momentum instarlight is balanced by pressures present in the nebula,including gas, magnetic, and turbulent pressure. The [S II]λ6717, 6731 doublet ratio was used to measure the density inthe H II region. This star-forming region has a high magneticfield strength deduced from 21 cm circular polarization studies(Brogan et al. 1999; Brogan & Troland 2001) and the magneticpressure dominates over the gas pressure. Pellegrini et al.(2007) also included a high CR flux in their model as it wasnecessary to predict the observed line ratios of I([O I] λ146 μm)/I(Hβ) and the radio map of 330MHz synchrotronemission. An extinction value of AV=6.36 which is theobserved extinction internal to M17, AV=9 mag, multipliedby cos (45°) is used as the stopping criterion. Ts wasdetermined from the ratio of the neutral hydrogen columndensity N (H0) to the spin temperature=9×1019 cm−2 K−1,which was measured from the observed optical depth and theemission brightness temperature.
Figure 3. Importance of continuum Lyα pumping on ts. Various temperaturesare plotted as a function of cloud depth for the Orion Veil. The solid, dotted,and medium dashed lines represent ts, tlya, and tk, respectively, as before. Thecorresponding thick black, gray and thick gray lines show the effect of externalLyα continuum pumping with 0%, all in emission and 80% in emission,respectively. Black and thick gray lines overlap.
Figure 4. In real stars the Lyα line can be in absorption or in emission which isdenoted by the Lyα blocking factor. Shown is the effect of averaged spintemperature (solid) and kinetic temperature (medium dashed) as a function ofLyα blocking factor for the Orion H IIregion like environment. Averaged spintemperature is lower than the kinetic temperature for this model when this lineis in absorption.
5
The Astrophysical Journal, 843:149 (10pp), 2017 July 10 Shaw, Ferland, & Hubeny

Pellegrini et al. (2007) had used the theory presented here toderive spin temperatures but did not go into the detailedphysics. Figure 5 shows the computed H-ionization structure.Hydrogen is mostly H+ in the H II region; this is followed by aneutral region (the PDR). The electron density is highest in theH II region due to photoionization of hydrogen. The densityis nearly equal to the density of H+. The electron densitydecreases in the neutral region H0.
Figure 6 plots the various temperature indicators as afunction of depth from the illuminated face of the cloud. Thekinetic temperature is 1.5×10⁴ K at the illuminated face dueto photoionization by the very hot O stars. The ionization rateis high in the H II region and consequently both ηLyα and tLyαare high (Equation(7), Section2.2). As a result, ts is close totLyα although less than tK. However, tK decreases sharply acrossthe ionization front. The ionization rate decreases and theneutral hydrogen density increases across the PDR. As aresult, Lyα pumping is less than that in the ionized region(Section 2.2) and ts is less than that in the H II region. But itsvalue is still higher than tk. In this region, therefore, ts does nottrace tk. In these ways M17 is much like a scaled-up version ofthe Orion Veil discussed above.
3.4. Galactic ISM
This section discusses the kinetic and 21 cm spin temperaturesfor the Galactic ISM, which consists of the CNM and warmneutral medium (WNM). This is an important test since manyobservational results are available (Heiles & Troland 2003a,2003b; Murray et al. 2015 and references cited therein). Aparticular line of sight might contain both the CNM and WNM,but here we do not consider such a combination. To model thisenvironment, we make a grid of constant-density models withISM abundances, graphitic and astronomical silicate grains, andthe background ISM radiation field described by Black & vanDishoeck (1987). We vary the hydrogen volume density andtotal neutral hydrogen column density from 0.01 to 158 cm−3
and 1019 to 1022 cm−2, respectively.Results are presented in Table 2 and Figure 7. Tables 2(a)–(d)
lists our predicted average kinetic temperature and average21 cm spin temperature. These temperatures vary over a widerange. The average spin temperature varies from 3350 to 40 K.
Figure 7 shows the gas pressure as a function of hydrogendensity for various total neutral hydrogen column densities. Itshows that, in addition to CNM and WNM, thermally unstableregions also exist in the Galactic ISM. Our simulations show thatthe average 21 cm spin temperature is lower than the averagekinetic temperature for the WNM as collisions are much less inthis low-density region. In the high-density, low-temperatureCNM, the average kinetic temperature is less than or equal to theaveraged 21 cm spin temperature. In addition to these, we showthe 21 cm optical depths in Table 2. Our calculations show thatthe optical depth of 21 cm is less than that for the WNM of theclouds with N (H I)<1022 cm−2.
3.5. Effect of Metallicity on 21 cm Spin Temperature
This section examines the effects of metallicity and thebackground CR ionization rate on the 21 cm spin temperaturefor clouds similar to damped Lyα absorbers.We find that thespin and kinetic temperatures are only similar when the CRionization rate is low or the gas is dusty.These parametershave significant effects on the spin temperature.To model a DLA with in situ star formation, we begin with
parameters similar to the CNM of the ISM and later decreasethe metallicity and dust abundances to mimic such DLAs athigh redshift (Srianand et al. 2005). The hydrogen densityin the CNM is �10 cm−3 (Draine 2011). In Section 3.4 weshowed that temperature depends on hydrogen density. As asimplest model, we considered a plane-parallel geometry forthe gas cloud with hydrogen density 10 and 100 cm−3. This gascloud is irradiated by our standard ISM radiation field from oneside and bathed in a z=0 CMB. Earlier, Black & vanDishoeck (1987) had used this type of one-sided radiation fieldin their PDR models. Furthermore, we have assumed a CRionization rate of H0 of 10−17.3 s−1. This value is smaller thanthe current Galactic CR background rate (McCall et al. 2003).All the models stop at a neutral hydrogen column density1021 cm−2.Figures 8(a) and (b) show the difference between ts (solid
line) and the corresponding tK (dashed line) for varyingmetallicity and dust content in the range of standard ISM to0.01 ISM. Our simulation shows that, at the shielded face of thecloud, tK and ts are nearly equal. For a cloud with density100 cm−3, these two temperatures are less than that of a cloud
Figure 5. Solid (black), medium dashed, dotted and solid (gray) lines representthe H+, H0, H2, and e- densities as a function of depth into the cloud from itsilluminated face for M17. Hydrogen is mostly H+ in the H II region; this isfollowed by a neutral region (the PDR).
Figure 6. Various temperatures plotted as a function of cloud depth for M17.The solid, dotted, and medium dashed lines represent ts, tLya, and tk,respectively. This figure shows that tLya does not trace tk.
6
The Astrophysical Journal, 843:149 (10pp), 2017 July 10 Shaw, Ferland, & Hubeny

with density 10 cm−3. As the metallicity and dust contentdecreases, cooling by metal lines decreases and hence bothtemperatures increase, suggesting an anti-correlation betweenmetallicity and ts. This simulation has implications for high-redshift intervening clouds since it is observed that bothmetallicity and dust abundances decrease as a function of redshift.We point out that recently Kanekar et al. (2014) measured highspin temperatures (�1000 K) for a sample of 37 DLAs at highredshift and found that Ts is anti-correlated with metallicity.
For this same model, in Figures 9(a) and (b), we present a veryimportant consequence of CR rate on the difference between tsand tK. The solid and the dashed line represent ts and tK likethe previous figure. We varied the CR rate from 10−17.3 s−1 to10−15.3 s−1. The difference between these two temperaturesincreases as a function of the CR rate, but it is smaller for higherdensity. High-energy CRs produce secondary electrons which heat,
ionize, and excite H0. Shull & van Sternberg (1985) show theserates for a wide range of ionization fraction, and that the ionizationand excitation of H0 is comparable. The Lyα production increaseswith CR rate and hence the bigger difference between tKand ts. Itmight be erroneous to assume that ts traces tK in environmentswhere the CR rate is not known accurately. However, this fact canbe used as an advantage to constrain the CR rate and starformation rate.Furthermore, the 21 cm line optical depth is inversely
proportional to Ts, dv N f Ts21 H Iò t µ ´ [ ], where f is thecovering factor. For a given f, a high Ts suggests a smaller τ21.As a consequence, it would be hard to detect the 21 cm line inabsorption in environments with low density when the CR rateis very high or the metallicity is very low.
4. Conclusions
The aim of the current work is to present our treatment of themicrophysics of 21 cm line in Cloudy, and show whether ts andtLya trace tk in various astrophysical environments. A majoroutcome of this work is that the common assumption that theLyα excitation temperature (tLyα) will trace tk if the gas isoptically thick and the Lyα radiation field will drive Ts to Tk(Wouthuysen 1952; Field 1959a, 1959b; and most recentlyChen & Miralda-Escudé 2004) is not valid for all astrophysicalenvironments. tLyα depends on the ratio of populations of the 2Pto 1S terms of H0 and this ratio is mainly determined by thebalance between the creation of new Lyα photons followingradiative recombinations, Lyα pumping, and excitation bysuprathermal electrons, and their loss by collisional de-excitationand absorption by dust. These processes are not related by detailedbalance, so will not drive level populations to local thermo-dynamic equilibrium. Hence tLyα is often not equal to tK.We arrive at the following conclusions.
1. tlya does not trace tK since the 2P population is set by thebalance between radiative recombination and downward
Table 2Predicted Average Kinetic Temperatures and 21 cm Spin Temperatures
(a) Kinetic Temperature and 21 cm Spin Temperature for N (H I = 1019) cm−2
nH (cm−3) 0.01 0.03 0.05 0.1 0.2 0.5 1 2 5 10 20 100 158Av. Ts (K) 2840 3090 3160 3250 3330 3350 3230 2870 1690 877 438 113 87τ21 cm <10−4 <10−4 <10−4 <10−4 <10−4 <10−4 <10−4 <10−3 <10−3 0.002 0.004 0.03 0.04Av. Tk (K) 9530 7990 7410 6470 5480 4030 3160 2290 997 468 244 88 73
(b) Kinetic Temperature and 21 cm Spin Temperature for N (H I = 1020) cm−2
nH (cm−3) 0.01 0.03 0.05 0.1 0.2 0.5 1 2 5 10 20 100 158Av. Ts (K) 2810 2990 3040 3100 3120 2930 2430 1600 573 222 115 53 47τ21 cm <10−3 <10−3 <10−3 <10−3 0.001 0.002 0.004 0.01 0.04 0.12 0.27 0.77 0.9Av. Tk(K) 9890 8480 7730 6320 4760 2010 757 340 149 93 64 36 33
(c) Kinetic Temperature and 21 cm Spin Temperature for N (H I = 1021) cm−2
nH (cm−3) 0.01 0.03 0.05 0.1 0.2 0.5 1 2 5 10 20 100 158Av. Ts (K) 2660 2820 2930 3090 3110 2220 1410 895 307 205 114 45 40τ21 cm <10−2 <10−2 <10−2 <10−2 0.01 0.03 0.09 0.2 0.9 1.6 3.2 11.5 14.7Av. Tk (K) 9930 8570 7820 6410 4750 1340 374 170 86 60 45 28 26
(d) Kinetic Temperature and 21 cm Spin Temperature for N (H I = 1022) cm−2
nH (cm−3) 0.01 0.03 0.05 0.1 0.2 0.5 1 2 5 10 20 100 158Av. Ts (K) 2620 2800 2940 3100 2890 1760 1200 782 400 242 146 60 53τ21 cm <0.1 <0.1 <0.1 <0.1 0.14 0.6 1.3 2.54 6.3 11.9 21.7 59.2 67.7Av. Tk(K) 9940 8540 7740 6150 3570 501 229 139 86 66 55 46 45
Figure 7. Difference between 21 cm spin temperature (solid line) and thecorresponding kinetic temperature (dashed line) for various metallicities.Besides WNM and CNM, thermally unstable regions are also predicted (with anegative slope).
7
The Astrophysical Journal, 843:149 (10pp), 2017 July 10 Shaw, Ferland, & Hubeny

collisions which are not related to one another by detailedbalance (Figures 2, 3, and 6).
2. In metal-poor and dust-poor environments, tLya forces tsaway from tk (Figures 8(a), (b)).
3. None of the temperature indicators traces the kinetictemperature in the ionized and atomic regions in M17because of Lyα pumping (Figure 6).
4. The effect of Lyα continuum pumping on 21 cm spintemperature is important. In real stars the Lyα line can bein absorption or in emission. It is possible to predict thenature of the Lyα continuum in stellar atmospheres if wehave observed values of Ts and Tk (Figure 4).
5. The difference between ts and tk increases as a function ofCR which can be used in constraining the CR rate(Figures 9(a), (b)).
We thank Keith MacAdam, Phillip Stancil and R. Srianandfor useful discussions. G.J.F. acknowledges support by NSF(1108928, 1109061, and 1412155), NASA (10-ATP10-0053,10-ADAP10-0073, NNX12AH73G, and ATP13-0153),and STScI (HST-AR- 13245, GO-12560, HST-GO-12309,
GO-13310.002-A, and HST-AR-13914). We thank our anon-ymous referee for his/her thoughtful suggestions.
AppendixThe Wouthuysen–Field Effect
If Lyα pumping dominates the 21 cm level populations thenthe ratio of the populations of the upper and lower state of the21 cm line, and the resulting spin temperature, is determined bythe slope of the Lyα source function at the line center. Theliterature on this is quite large. Among many others, Deguchi &Watson (1985), (hereafter DW85) discuss this for the cold ISMand Hirata (2006) in the cosmological context. The slope of theLyα source function, and not the intensity, sets the 21 cm spintemperature when pumping dominates. In the calculationspresented in this paper, Lyα pumping was often the mostimportant process affecting the 21 cm populations.Three temperatures apply to H I Lyα in the ISM, a highly
non-equilibrium environment. The gas kinetic temperaturedescribes the thermal motions of particles in the gas. The Lyα
Figure 8. (a) Difference between ts (solid line) and the corresponding tK(dashed line) for varying metallicity and dust content in the range of standardISM to 0.01 ISM for a cloud with hydrogen density 10 cm−3. Black, thickblack, and gray curves represent ISM, 0.1 ISM, and 0.01 ISM metallicity,respectively. (b) Difference between ts (solid line) and the corresponding tK(dashed line) for varying metallicity and dust content in the range of standardISM to 0.01 ISM for a cloud with hydrogen density 100 cm−3. Curves areas in (a).
Figure 9. (a) Difference between 21 cm spin temperature (solid line) and thecorresponding kinetic temperature (dashed line) for a cloud with hydrogendensity 10 cm−3 for various cosmic ray ionization rates of H0 ranging from10−17.3 s−1 to 10−15.3 s−1. Black, thick black, and gray curves represent10−17.3, 10−16.3 s−1, and 10−15.3 s−1 CR rates, respectively. (b) Differencebetween 21 cm spin temperature (solid line) and the corresponding kinetictemperature (dashed line) for a cloud with hydrogen density 100 cm−3 forvarious cosmic ray ionization rates of H0 ranging from 10−17.3 s−1 to10−15.3 s−1. Curves are as in (a).
8
The Astrophysical Journal, 843:149 (10pp), 2017 July 10 Shaw, Ferland, & Hubeny
excitation temperature is determined by the 2p/1s levelpopulation ratio and the Boltzmann equation. The Lyα sourcefunction can be described in terms of these level populations,and is S h c n n g g n2 u l u l u
3 2n= ´ -n ( ) ( )/ / . Here l and urepresent the lower and upper levels, and the g are statisticalweights. From this definition, and the relationships between theEinstein A and B coefficients, it follows that the source functionnear the line center is given by the Planck function at theexcitation temperature. Finally, the Lyα color temperature canbe defined as the temperature of the Planck function thatdescribes the slope of the Lya source function at the line center.It is this color temperature that, through photoexcitation,strongly affects the 21 cm spin temperature when pumpingdominates.
The Lyα pumping of 21 cm is frequently referred to as theWouthuysen–Field effect, in recognition of the first two authorson the topic. The original Wouthuysen (1952) paper is theprinted summary of his oral contribution to the 1951 meeting ofthe American Astronomical Society in Cleveland, OH.Wouthuysen notes that, in the limit of an infinite number ofscatterings, the Lyα color temperature will go over to thekinetic temperature due to small changes in the photon energyproduced by recoil of the atom as the photon is absorbed.
This infinite-scattering limit cannot occur at finite densitiesbecause the 2P level will eventually be collisionally de-excited.In the limit of a very large number of scatterings collisionalexcitation and de-excitation will thermalize the 2P/1S levelpopulations and the Lyα excitation temperature will equal thegas kinetic temperature. So, in this limit, the Lyα color,excitation, and kinetic temperatures are all equal. Fieldʼstwo seminal papers (Field 1959a, 1959b), which consider thelarge-scattering case, confirms that the color and kinetictemperatures are equal.
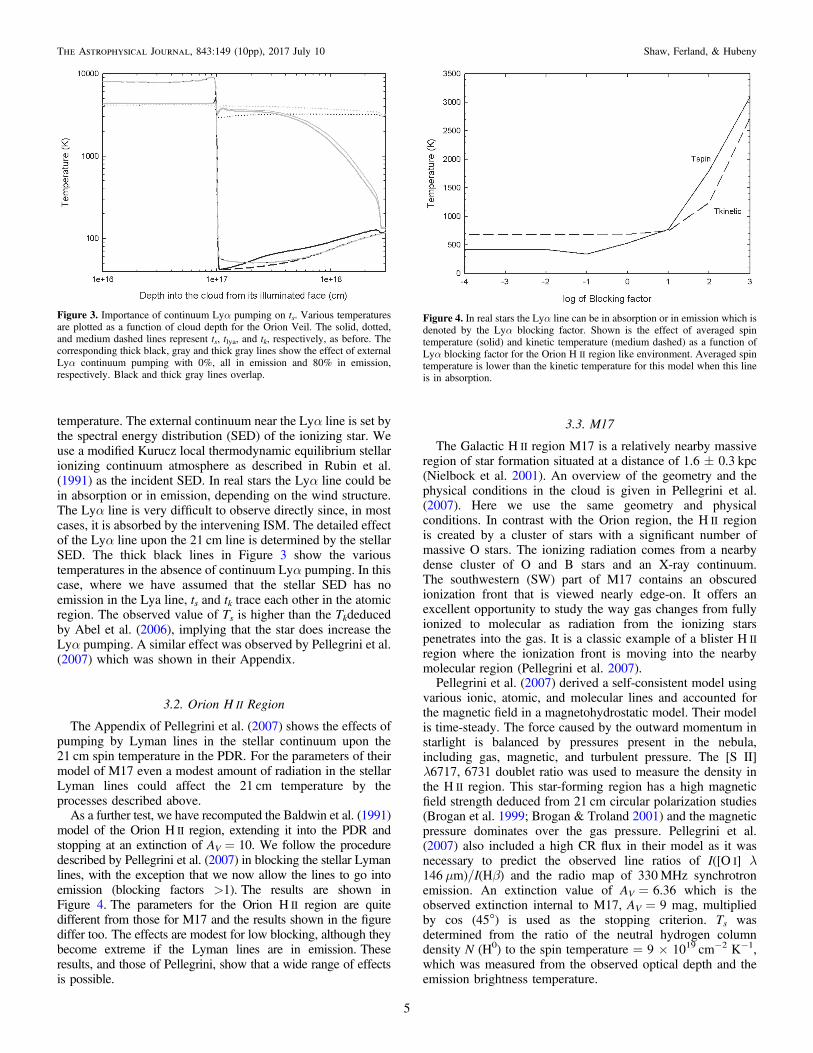
The ISM is far from equilibrium. The Lyα line is quiteoptically thick so line photons are mainly lost throughabsorption onto dust. The gas kinetic temperature for theCNM is low, usually well below 1000 K. As a result, thermalcollisional excitation and photopumping of Lyα are negligible,a major difference from the cosmological case. Instead, cosmicrays produce Lyα, both by direct excitation by suprathermalsecondary electrons (Spitzer & Tomasko 1968) and bycollisional ionization followed by recombination. The Lyαexcitation temperature is generally an order of magnitudehigher than the kinetic temperature, as Figure 10 shows.
We consider three cases for the color temperature. Thedefinition of the line source function, together with relation-ships between the Einstein A and B coefficients, make the linesource function equal to the Planck function at the Lyαexcitation temperature. In this thermodynamic limit the colortemperature will be equal to the excitation temperature. Thisis preferred by Elitzur & Ferland (1986), quoting Mihalas(1970, 1978). We refer to this as the excitation case.
Recoil might eventually bring the color temperature andkinetic temperature together, if enough scatterings occur, asargued by Wouthuysen & Field. We refer to this as thekinetic case.
Discussions of radiative transfer in the stellar atmospheres(Rutten 2003, Hubeny & Mihalas 2014) do not mention recoilas a significant process affecting line transfer or the line sourcefunction. Rather, in the case of complete redistribution, whichapplies in the core of the line, the source function isSν=constant. Hubeny & Mihalas (2014) review the general
picture in Section 10.1 and give an example in Section 15.6.Rutten (2003) gives this result in the discussion aroundEquation(2.73). The Lyα slope is non-thermal in theSν=constant case so cannot be described by a colortemperature. We refer to this as the constant case.Which case applies? Very few calculations of the Lyα
source function include recoil since the effect is so small. Field(1959b) studied time relaxation of a resonance line profilewithout transfer and confirmed Wouthuysenʼs statement in thelimit of many scatterings. Adams (1971) was the first study thatquantified how many scatterings are needed for recoil to affectLyα. Line photons receive a frequency shift of one Dopplerwidth in each scattering. The recoil shift is about 104 timessmaller than the Doppler shift, so a very large number ofscatterings is needed for the recoil energy shift to be significant.He concluded that recoil can be neglected when Lyα undergoesless than 5.6×10¹⁰ scatterings. His limit is never reached inour calculations, where dust absorbs Lyα after ∼106–107
scatterings.The later study by DW85 found that a much smaller optical
depth of 105–106, corresponding to roughly 106 scatterings,will bring the color temperature to the kinetic temperature.Their approach was adopted by Hirata (2006). However, thereare two main issues with their analysis that make anunambiguous application of their results questionable. Thefirst is the form of the redistribution function for the resonancescattering in the Lyα line, and the second is the behavior of thesolution of the radiative transfer equation.
Figure 10. Physical conditions and the resulting spin temperature for thesethree cases of Lyα source function.
9
The Astrophysical Journal, 843:149 (10pp), 2017 July 10 Shaw, Ferland, & Hubeny

The first point is that the actual redistribution function isalways given as a linear combination of the coherent scatteringin the atomʼs frame (leading to the RII redistribution function inthe laboratory frame), and complete redistribution in the atoms’frame (see, e.g., Hubeny & Mihalas 2014, Chap. 10). Thebranching ratio is given by a ratio of the elastic (or almostelastic) collision rate to the spontaneous emission rate. DW85implicitly assume that there is an equipartition of the upperstate of Lyα according to their statistical weights, which meansthat there must be a sufficient rate of collisions betweenthem, and therefore a non-negligible portion of completeredistribution.
The second point is that it must be recognized that thecritical issue that influences the spin temperature is the colortemperature in Lyα at large optical depths. It is well knownfrom radiative transfer studies that even for a pure RII without acontribution of the complete redistribution part of theredistribution function, the source function is constant withfrequency in the line core for line center optical depths in Lyαlarger than about 103, as first demonstrated by Hummer (1969);for a discussion see Hubeny & Mihalas (2014, S15.6). If aportion of complete redistribution is present the constancy ofthe line source function extends to larger distances from theline center. This argues for the constant case.
We will revisit this in a future paper, but for now make allthree options available in Cloudy, using the command “set Lya21 cm.” Cloudy has, through C17, assumed the excitation case.Figure 10 compares physical conditions and the resultingspin temperature for these three cases for an environmentsimilar to the CNM of the ISM with standard ISM metallicityand ISM radiation field. For this model, we considerhydrogen density=100 cm−3 and neutral hydrogen columndensity=1020 cm−2. The plots also show the gas kinetictemperature, typically ∼30 K, and the Lyα excitationtemperature, typically 3000 K, which are not affected bychanges in the slope of the source function. The predicted21 cm spin temperatures are more than 1 dex different. The spintemperature is close to the kinetic temperature in the kineticcase but is far higher than the kinetic temperature for the othertwo cases of the source function.
References
Abel, N. P., Ferland, G. J., O’Dell, C. R., Shaw, G., & Troland, T. H. 2006,ApJ, 644, 344
Abel, N. P., Ferland, G. J., Shaw, G., & van Hoof, P. A. M. 2005, ApJS,161, 65
Adams, T. F. 1971, ApJ, 168, 575Allison, A. C., & Dalgarno, A. 1969, ApJ, 158, 423Baldwin, J. A., Ferland, G. J., Martin, P. G., et al. 1991, ApJ, 374, 580Black, J. H., & van Dishoeck, E. F. 1987, ApJ, 322, 412Brogan, C. L., & Troland, T. H. 2001, ApJ, 560, 821Brogan, C. L., Troland, T. H., Roberts, D. A., & Crutcher, R. M. 1999, ApJ,
515, 304
Chen, X., & Miralda-Escudé, J. 2004, ApJ, 602, 1Chengalur, J. N., & Kanekar, N. 2000, MNRAS, 318, 303Cowan 1981, Theory of Atomic Structure and Spectra (Berkeley, CA: Univ.
California Press)Cui, J., Bechtold, J., Ge, J., & Meyer, D. M. 2005, ApJ, 633, 649Deguchi, S., & Watson, W. D. 1985, ApJ, 290, 578Draine, B. T. 2011, Physics of the Interstellar and Intergalactic Medium
(Princeton, NJ: Princeton Univ. Press)Elitzur, M., & Ferland, G. J. 1986, ApJ, 305, 35Elitzur, M. 1992, Astronomical Masers (Berlin: Springer)Ferguson, J. W., & Ferland, G. J. 1997, ApJ, 479, 363Ferland, G. J., Korista, K. T., Verner, D. A., et al. 1998, PASP, 110, 761Ferland, G. J., Porter, R. L., van Hoof, P. A. M., et al. 2013, RMxAA, 49, 137Ferland, G. J., & Rees, M. J. 1988, ApJ, 332, 141Field, G. B. 1959a, ApJ, 129, 536Field, G. B. 1959b, ApJ, 129, 551Furlanetto, S. R., & Furlanetto, M. R. 2007, MNRAS, 379, 130Griffiths, D. J. 1995, Introduction to Quantum Mechanics (1st ed.; Englewood
Cliffs, NJ: Prentice-Hall)Heiles, C., & Troland, T. 2003a, ApJS, 145, 329Heiles, C., & Troland, T. H. 2003b, ApJ, 586, 1067Heiles, C., & Troland, T. H. 2004, ApJS, 151, 271Hirata, C. M. 2006, MNRAS, 367, 259Hubeny, I., & Mihalas, D. 2014, Theory of Stellar Atmospheres (Princeton, NJ:
Princeton Univ. Press)Hummer, D. G. 1969, MNRAS, 145, 95Kanekar, N., Prochaska, J. X., Smette, A., et al. 2014, MNRAS, 438, 2131Liszt, H. 2001, A&A, 371, 698Luridiana, V., Simón-Díaz, S., Cerviño, M., et al. 2009, ApJ, 691, 1712McCall, B. J., Geballe, T. R., Oka, T., et al. 2003, Natur, 422, 500Mihalas, D. 1970, Stellar Atmospheres (1st ed.; San Francisco, CA: Freeman)Mihalas, D. 1978, Stellar Atmospheres (2nd ed.; San Francisco, CA: Freeman)Murray, C. E., et al. 2015, ApJ, 804, 89Netzer, H., Elitzur, M., & Ferland, G. 1985, ApJ, 299, 752Nielbock, M., Chini, R., Jütte, M., & Manthey, E. 2001, A&A, 377, 273O’Dell, C. R. 2001, ARA&A, 39, 99Osterbrock, D. E., & Ferland, G. J. 2006, Astrophysics of Gaseous Nebulae
and Active Galactic Nuclei (2nd ed.; Sausalito, CA: Univ. Science Books)Pellegrini, E. W., Baldwin, J. A., Brogan, C. L., et al. 2007, ApJ, 658, 1119Rubin, R., Simpson, J., Haas, M., & Erickson, E. 1991, ApJ, 374, 564Rutten, R. J. 2003, Radiative Transfer in Stellar Atmospheres, Utrecht
University lecture notes (8th ed.)Savage, B. D., Bohlin, R. C., Drake, J. F., & Budich, W. 1977, ApJ, 216,
291Shaw, G., Ferland, G. J., Abel, N. P., Stancil, P. C., & van Hoof, P. A. M.
2005, ApJ, 624, 794Shaw, G. 2005, PhD thesis, Univ. KentuckyShull, J. M., & van Sternberg, M. E. 1985, ApJ, 298, 268Smith, F. J. 1966, P&SS, 14, 929Spitzer, L., Jr. 1978, Physical Processes in the Interstellar Medium (1st ed.;
New York: Wiley)Spitzer, L., Jr., & Tomasko, M. G. 1968, ApJ, 152, 971Srianand, R., Shaw, G., Ferland, G. J., Petitjean, P., & Ledoux, C. 2005,
arXiv:0506556Tielens, A. G. G. M. 2005, The Physics and Chemistry of the Interstellar
Medium (1st ed.; Cambridge: Cambridge Univ. Press)Troland, T. H., Heiles, C., & Goss, W. M. 1989, ApJ, 337, 342Urbaniak, J. J., & Wolfe, A. M. 1981, ApJ, 244, 406van Hoof, P. A. M., Weingartner, J. C., Martin, P. G., Volk, K., &
Ferland, G. J. 2004, MNRAS, 350, 1330Wild, J. P. 1952, ApJ, 115, 206Wouthuysen, S. 1952, Phy, 18, 75Zygelman, B. 2005, ApJ, 622, 135
10
The Astrophysical Journal, 843:149 (10pp), 2017 July 10 Shaw, Ferland, & Hubeny