the use of the expanded health belief model (ehbm) to
TRANSCRIPT

Southern Illinois University CarbondaleOpenSIUC
Dissertations Theses and Dissertations
5-1-2016
The Use of the Expanded Health Belief Model(EHBM) To Evaluate Osteoporosis Attitudes,Knowledge, Beliefs and Self Efficacy of Nez PerceTribal and Non Nez Perce Tribal Members in NezPerce County, IDVictor Nollen WhiteSouthern Illinois University Carbondale, [email protected]
Follow this and additional works at: http://opensiuc.lib.siu.edu/dissertations
This Open Access Dissertation is brought to you for free and open access by the Theses and Dissertations at OpenSIUC. It has been accepted forinclusion in Dissertations by an authorized administrator of OpenSIUC. For more information, please contact [email protected].
Recommended CitationWhite, Victor Nollen, "The Use of the Expanded Health Belief Model (EHBM) To Evaluate Osteoporosis Attitudes, Knowledge,Beliefs and Self Efficacy of Nez Perce Tribal and Non Nez Perce Tribal Members in Nez Perce County, ID" (2016). Dissertations. Paper1199.

THE USE OF THE EXPANDED HEALTH BELIEF MODEL (EHBM) TO EVALUATE
OSTEOPOROSIS ATTITUDES, KNOWLEDGE, BELIEFS AND SELF-EFFICACY OF NEZ
PERCE TRIBAL AND NON NEZ PERCE TRIBAL MEMBERS IN NEZ PERCE COUNTY,
ID
By
Victor Nollen White
B.A., University of Illinois at Springfield, 1994
M.S.R.S., Midwestern State University, 2000
M.A., University of Illinois at Springfield, 2010
A Dissertation
Submitted in Partial Fulfillment of the Requirements for the
Doctor of Philosophy in Education Degree with a Concentration in Health Education
Department of Health Education
in the Graduate School
Southern Illinois University Carbondale
May 2016
DISSERTATION APPROVAL
THE USE OF THE EXPANDED HEALTH BELIEF MODEL (EHBM) TO EVALUATE
OSTEOPOROSIS ATTITUDES, KNOWLEDGE, BELIEFS AND SELF-EFFICACY OF NEZ
PERCE TRIBAL AND NON NEZ PERCE TRIBAL MEMBERS IN NEZ PERCE COUNTY,
ID
By
Victor Nollen White
A Dissertation Submitted in Partial Fulfillment of the Requirements
for the Degree of Doctor of Philosophy
in the field of Education with a concentration in Health Education
Approved by:
Dhitinut Ratnapradipa, PhD, Chair
Peggy Wilken, PhD
Robert Rados, PhD
Dale Ritzel, PhD
John Reeve, PhD
Graduate School
Southern Illinois University Carbondale
December 3, 2015

i
AN ABSTRACT OF THE DISSERTATION OF
VICTOR NOLLEN WHITE, for the Doctor of Philosophy degree in HEALTH EDUCATION,
presented On NOVEMBER 14, 2014, at Southern Illinois University Carbondale.
Title: THE USE OF THE EXPANDED HEALTH BELIEF MODEL (EHBM) TO EVALAUTE
OSTEOPOROSIS ATTITUDES, KNOWLEDGE, BELIEFS AND SELF-EFFICACY OF NEZ
PERCE TRIBAL AND NON NEZ PERCE TRIBAL MEMBERS IN NEZ PERCE COUNTY,
IDAHO.
Major Professor: Dr. Dhitinut Ratnapradipa
According to the State of Idaho, the National Osteoporosis Foundation, and the U.S.
Department of Health and Human Services, osteoporosis is a public health concern nationally
among non-Native American (NNA) and Native American (NA) populations. The purpose of
this research project is to obtain written survey data on osteoporosis attitudes, knowledge,
beliefs, and self-efficacy among male and female members of the Nez Perce Tribe (Nimiipuu)
and non-Tribal members, aged 18 and over via voluntary completion of a written survey
questionnaire based on the expanded health belief model (EHBM). The study was conducted in
Nez Perce County, ID. The research involved determining whether or not there is a statistically
significant difference in osteoporosis attitudes, knowledge, beliefs and self-efficacy among males
and females, aged 18 and over Nez Perce Tribal members as compared to Non-Tribal members
in Nez Perce County, ID. Non-Nez Perce tribal members are individuals whom are 1) Native
Americans who are not members of the Nez Perce Tribe and 2) all Non-Native Americans in the
research study.

ii
Exercise self-efficacy and gender seem to be the most significant variables showing evidence
against the null hypotheses and in favor of the research hypothesis (Null Hypothesis: H0: Native
American=Non-Native American. Research Hypothesis: H1: Native American ≠ Non-Native
American). Age also shows evidence against the null hypothesis and in favor of the research
hypothesis, but not as strongly as exercise and gender. Seriousness of osteoporosis was the most
concern to all respondents and female Native Americans perceived the greatest barrier to
preventing osteoporosis was being unable to access dietary calcium on a regular basis.

iii
DEDICATION
This research and dissertation is dedicated to Dr. Dhitinut Ratnapradipa, Committee
Chairperson and members of the dissertation committee, Dr. Robert Rados, Dr. John Reeve, Dr.
Dale O. Ritzel and Dr. Peggy Wilken, to whom I am forever grateful for their patience, kindness
and understanding.
I would also like to dedicate this dissertation to all study participants, Dr. Paul Sarvela, Ms.
Julia Shrout, Mrs. Deloris McVey, Mr. Robert G. White, Mr. Larry Armstrong, Dr. Steven B.
Dowd, Professor Charles Schweighauser, Dr. Bill Warren, Dr. John Munkirs, Dr. Anita
Zavodska, Dr. David Hey, Dr. Bill McKinley, Dr. Michael Lineberry, Dr. Michelle D’Arcy-
Evans, Matthew Evans, Michael Evans, C. Scott Sheeler, Paul Murrell and Andrea Decker, all
good friends and/or former teachers and professors whose support was instrumental in
completion of this research and dissertation.

iv
ACKNOWLEDGEMENTS
I would like to acknowledge members of the Nez Perce Tribe, members of the Nez Perce
Tribal Executive Committee, the Nimiipuu Health Executive Director and the Nimiipuu Health
Medical Director for their gracious assistance and permission to complete the research for this
dissertation.

v
TABLE OF CONTENTS
CHAPTER PAGE
ABSTRACT .................................................................................................................................... i
DEDICATION .............................................................................................................................. iii
ACKNOWLEDGEMENTS .......................................................................................................... iv
LIST OF TABLES……………………………………………………………………………….xii
LIST OF FIGURES……………………………………………………………………………...xv
CHAPTER1-INTRODUCTION…………………………………………………………..1
Background of the Problem .....................................................................................1
Theoretical Framework ..........................................................................................20
Data Collection .....................................................................................................20
Data Analysis .........................................................................................................21
Assumptions ...........................................................................................................21
Limitations .............................................................................................................22
Delimitations ..........................................................................................................23
Protection of Privacy and Confidentiality..............................................................23
Benefits and Risk Dichotomy ................................................................................24

vi
Definition of Terms...............................................................................................25
Summary. ..............................................................................................................28
CHAPTER 2- LITERATURE REVIEW………………………………………………...29
Purpose of Study ...................................................................................................29
Hypothesis: Null and Research .............................................................................29
Research Questions ................................................................................................30
Definition of Osteoporosis .....................................................................................31
General Risk Factors for Osteoporosis ..................................................................33
Descriptive Epidemiology of Osteoporosis ...........................................................34
Osteoporosis in Native Americans.........................................................................37
Native Men.............................................................................................................38
Native Adolescents ................................................................................................38
Osteoporosis in Nez Perce Tribal Members Compared to other Native
Americans ..............................................................................................................39
Nez Perce County, ID ............................................................................................39
Lapwai, ID .............................................................................................................40
Nez Perce Tribal Culture .......................................................................................40
Socioeconomic Status of the Nez Perce Tribe .......................................................42
vii
Difference in Native Americans as Compared to Non-Natives .............................43
Detection of Osteoporosis in Native Americans and Non-Native Americans ......44
Osteoporosis Detection Technologies....................................................................45
Quantitative Ultrasound ........................................................................................47
Dual Energy X-Ray Absorptiometry (DXA) ........................................................47
Comparison of QUS T Scores and DXA T Scores. .............................................. 48
Z Scores and Osteoporosis Screening ....................................................................50
T and Z Scores in DXA Databases. .......................................................................51
Bone Mineral Density and Bone. ...........................................................................52
Treating Osteoporosis. ...........................................................................................53
Use of Prescription Medications to Prevent Osteoporosis .....................................53
Non Clinical Methods for Treating Osteoporosis ..................................................56
The Importance of Vitamins Regarding Bone Health ...........................................57
Health Behavior Models and Osteoporosis............................................................58
Expanded Health Belief Model and Osteoporosis .................................................59
Health Belief Model ...............................................................................................59
Literature Review Summary ..................................................................................61

viii
CHAPTER 3-METHODS………………………………………………………………..63
Purpose of Study ....................................................................................................63
Hypothesis..............................................................................................................63
Research Questions ................................................................................................64
Research Design.....................................................................................................65
Independent and Dependent Variables ..................................................................66
EHBM Theory and OHBS Survey Instruments .....................................................68
Study Instrument Reliability ..................................................................................71
Administration of Survey .......................................................................................76
Data Collection Procedures ...................................................................................77
Study Consent ........................................................................................................78
Statistical Analysis .................................................................................................79
Statistical Technique ..............................................................................................80
Research Questions ................................................................................................82
Sample Size, Confidence Level and Confidence Interval .....................................88
Volunteer Notification ...........................................................................................88
Collaboration..........................................................................................................89

ix
Protection of Privacy and Confidentiality ..............................................................89
Benefits and Risk Dichotomy ...............................................................................90
Summary ................................................................................................................91
CHAPTER 4- RESULTS ...................................................................................................92
Purpose of Study ....................................................................................................92
Statistics .................................................................................................................92
Description of Sample............................................................................................92
Hypothesis Test Summary .....................................................................................94
CHI Square.............................................................................................................95
Analysis..................................................................................................................96
Mann-Whitney U ...................................................................................................96
Analysis..................................................................................................................99
Kruskall Wallis ....................................................................................................100
Correlations ..........................................................................................................103
Cramer’s V Analysis ............................................................................................104
Parametric Tests ...................................................................................................104
Levene’s Equality of Variance t Test ...................................................................104

x
Analysis................................................................................................................106
Results by Research Question 1-7 .......................................................................106
EHBM Categories, Survey Data and Research Questions...................................108
Multivariate Analysis ...........................................................................................120
Benefits and Barriers of Calcium Intake and Osteoporosis Prevention ...............128
Summary of Beliefs About Barriers and Benefits of Exercise ............................133
Multiple Regression Analysis ..............................................................................135
Multivariate Analysis of Variance (MANOVA) ................................................137
Results of Two Way Analysis of Variance (ANOVA) .......................................138
Interpretation of tests ...........................................................................................140
Summary ..............................................................................................................141
CHAPTER 5-DISCUSSION, CONCLUSIONS AND RECOMMENDATIONS ..........142
Purpose of Study ..................................................................................................142
Demographics ......................................................................................................143
Survey Questions Responses ...............................................................................143
Summary of Findings ...........................................................................................146
Conclusions ..........................................................................................................148
xi
Discussion ............................................................................................................150
Recommendations ................................................................................................160
Summary ..............................................................................................................161
REFERENCES ............................................................................................................................163
APPENDICES
Appendix 1………………………………………………………………………….…..174
Appendix 2………………………………………………………………………….…..175
Appendix 3……………………………………………………………….……………..176
Appendix 4……………………………………………………………….……………..177
Appendix 5…………………………………………………………………….………..178
Appendix 6…..……………………………………………………………….…………179
Appendix 7….…………………………………………………………………..............180
Appendix 8 .......................................................................................................................181
Appendix 9….……………………………………………………………………..........182
Appendix 10…………………………………………………………………….………183
Appendix 11…………………………………………………………………….............184
Appendix 12…………………………………………………………………….............189
Appendix 13…………………………………………………………………….............192
Appendix 14 .....................................................................................................................194
VITA ............................................................................................................................................195
xii
LIST OF TABLES
TABLE PAGE
Table 1: Factors that May Be Precursors to Osteoporosis ...............................................................2
Table 2: Facts About Osteoporosis ..................................................................................................3
Table 3: Individuals Whom Should Be Tested for Osteoporosis ....................................................4
Table 4: Internal Consistency for OHBS Calcium and Exercise Scales ........................................16
Table 5: World Health Organization (WHO) Osteoporosis Diagnosis Criteria ............................32
Table 6: Important Clinical Factors Regarding Osteoporosis Diagnosis .......................................33
Table 7: Imaging Methods to Detect Osteoporosis........................................................................46
Table 8: Foods Important Preventing Osteoporosis.......................................................................56
Table 9: Minerals, Vitamins and RDI’s Important in Preventing Osteoporosis ............................57
Table 10: Recommended Calcium Intake ......................................................................................58
Table 11: Internal Consistency for the OHBS Subscales (Calcium and Exercise)........................73
Table 12: OSE Item Loading on Exercise and Calcium Self-Efficacy Factors .............................74
Table 13: Statistical Tests (Non-Parametric) .................................................................................80
Table 14: Statistical Tests (Parametric) .........................................................................................81
Table 15: Research Questions, Statistics and EHBM Components ...............................................82

xiii
Table 16: Descriptive Statistics .....................................................................................................93
Table 17: Descriptive Statistics: Gender ........................................................................................93
Table 18: Descriptive Statistics: Ethnicity .....................................................................................94
Table 19: Descriptive Statistics: Total ...........................................................................................94
Table 20: Chi Square .....................................................................................................................95
Table 21: Mann-Whitney (Ethnicity) ............................................................................................97
Table 22: Mann-Whitney and Wilcoxon W (Ethnicity) ................................................................97
Table 23: Mann-Whitney U and Gender Analysis ........................................................................98
Table 24: Mann-Whitney U and Gender Analysis ........................................................................98
Table 25: Kruskall Wallis and Gender.........................................................................................100
Table 26: Kruskall Wallis and Gender ........................................................................................101
Table 27: Kruskall Wallis and Ethnicity ......................................................................................101
Table 28: Kruskall Wallis (Ethnicity) ..........................................................................................102
Table 29: Kruskall Wallis (Age) ..................................................................................................102
Table 30: Levene’s Equality of Variance and Mean’s t Test .......................................................105
Table 31: Summary of Knowledge (OKT) About Exercise and Osteoporosis Prevention .........107
Table 32: Summary of Knowledge About Nutrition and Osteoporosis Prevention ....................109

xiv
Table 33: Summary of Beliefs About Seriousness and Susceptibility to Osteoporosis ..............111
Table 34: Summary of Osteoporosis Self-Efficacy Scales (OSES) and Osteoporosis ................115
Table 35: Multivariate Analysis of Correct Vs. Incorrect Knowledge of Exercise Scales ..........118
Table 36: Multivariate Analysis of Correct Vs. Incorrect Knowledge of Nutrition Scales .........121
Table 37: Benefits and Barriers To Calcium Intake And Osteoporosis Prevention ....................128
Table 38: Summary of Beliefs About Barriers/Benefits of Exercise Osteoporosis Prevention ..133
Table 39: Multiple Regression Analysis ......................................................................................136
Table 40: Results of a MANOVA for EHBM Constructs ...........................................................137
Table 41: Results of a Two-Way ANOVA for the Interaction Effect of Gender & Ethnicity ....138
Table 42: Results of a Two-Way ANOVA for Perceived Barriers to Calcium Intake ................139
Table 43: Results of a Simple Main Effects t Test for Barriers to Calcium Intake .....................140

xv
LIST OF FIGURES
FIGURE PAGE
Fig 1: Health Belief Model (HBM) ...............................................................................................13
Fig 2: Components of the Expanded Health Belief Model (EHBM).............................................15
Fig 3: Relationship Between the OHBS Subscales (Calcium and Exercise) and EHBM .............66
Fig 4: EHBM Components, Survey Responses and Research Questions ......................................70
Fig 5: Interaction for Gender and Ethnicity on the DV (IE: Barriers to Calcium) ......................139
Fig 6: Relationship of the EHBM and the OHBS ........................................................................156

1
CHAPTER 1
INTRODUCTION
Background of the Problem
Osteoporosis is a metabolic disease in which bone density decreases, making bones extremely
brittle and prone to fracture (Merck, 1997, p.1 and Taber’s Cyclopedic Medical Dictionary,
2009, p. 1658). According to the World Health Organization (WHO) “Osteoporosis causes more
than 8.9 million fractures annually worldwide, of which more than 4.5 million occur in the
Americas and Europe. The lifetime risk for a wrist, hip or vertebral fracture has been estimated
to be in the order of 30% to 40% in developed countries. Osteoporosis is not only a major cause
of fractures, it also ranks high among diseases that cause people to become bedridden with
serious complications” (World Health Organization (WHO), 2004). “In the United States, over
10 million people have osteoporosis, and 18 million more are at risk of developing the disease.
Another 34 million Americans are at risk of osteopenia, or low bone mass, which can lead to
fractures and other complications” (American Academy of Orthopedic Surgeons, 2009).
Osteoporosis has been operationally defined on the basis of bone mineral density (BMD)
assessment. According to the WHO criteria, osteoporosis is defined as a BMD that lies 2.5
standard deviations or more below the average value for young healthy women (a T-score of <-
2.5 SD) (World Health Organization (WHO, 2004). Increased bone fragility leads to an increased
risk of extremity, spine, and rib fractures in men and women (Murphy, Attico, Rhodes, Dodge &
DeRoin, 2004, p. 1-2). Common osteoporosis risk factors include family history, being female,
being menopausal, being Caucasian or Asian heritage and being under 127 pounds.

2
Factors that may be precursors to osteoporosis and important facts about osteoporosis are
demonstrated in Tables 1 and 2 below:
Table 1
Factors That May Be Precursors to Osteoporosis
Family history of bone disease. Low body weight. Weight loss or more than 1% per year in the elderly. Late onset of sexual development. Unusual cessation of menstrual periods. Anorexia nervosa (often related to marked weight reduction). Athletic amenorrhea syndrome (related to intense physical activity). Patients being treated with drugs that affect bone metabolism (e.g., glucocorticoids). Patients with disease linked to secondary osteoporosis. High levels of serum calcium or alkaline phosphates in otherwise healthy patients. Hyperparathyroidism, hyperthyroidism, or treatment with high doses of thyroid hormone. Height loss or progressive spinal curvature.
Source: U.S. Department of Health and Human Services. (2004). Bone Health and Osteoporosis: A Report of the Surgeon General, p. 190.

3
Table 2
Facts About Osteoporosis
Over 10 million Americans have osteoporosis. 4 out of 5 of them are women. 18 million Americans are at risk of developing osteoporosis. More than 2 million men have osteoporosis in the United States. Osteoporosis is the cause of over 1.5 million fractures annually in the United States. The direct medical costs of osteoporosis and osteoporosis related fractures are $14 billion annually in the United States. It is estimated that, at age 50, 50% of women and 25% of men will have an osteoporosis related fracture in their lifetime. A women’s lifetime risk of hip fracture alone is equal to the combined risk of developing breast, uterine, and ovarian cancer. Approximately 50% of those who suffer a hip fracture never fully recover.
Source: American Academy of Orthopedic Surgeons, (2009), Merck, Inc., (1997). p.3, Murphy, N., Attico, N., Rhodes, C., Dodge, S., & DeRoin, D. (2004). National Indian Women’s Health Resource Center: Osteoporosis in American Indian/Alaska Native Women, p. 1, 2014).
Detection of osteoporosis has been available for years via ultrasound (US), x-ray, nuclear
medicine, and computed tomography (CT) methods (Bonnick, 1998, p. 1). Standard radiographs
were the initial imaging modality used to assess skeletal bone density. According to Bonnick
(1998) however, “plain skeletal radiographs have never been useful for quantifying bone density
[because] demineralization becomes visually apparent only after 40% or more of the bone
density has been lost (p. 1)”.
The development of treatment medications such as alendronate and risendronate (National
Institutes of Health, 2010), along with the use of estrogen and/or hormone replacement therapy
in some cases has made treatment of osteoporosis more effective than ever, yet accurate and
timely diagnosis must be made before treatment can be initiated.
Unfortunately, osteoporosis is a progressive disease that is not readily apparent and many
individuals do not know that they are susceptible to osteoporosis and hence do not seek diagnosis
4
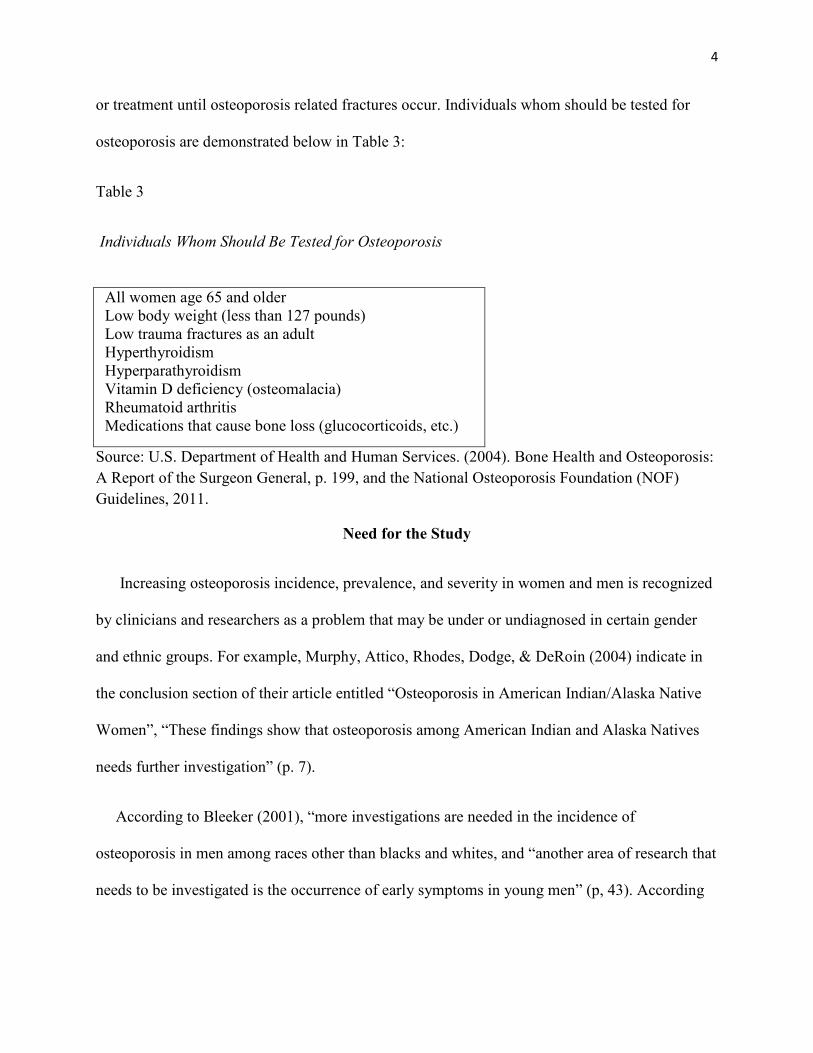
or treatment until osteoporosis related fractures occur. Individuals whom should be tested for
osteoporosis are demonstrated below in Table 3:
Table 3
Individuals Whom Should Be Tested for Osteoporosis
All women age 65 and older Low body weight (less than 127 pounds) Low trauma fractures as an adult Hyperthyroidism Hyperparathyroidism Vitamin D deficiency (osteomalacia) Rheumatoid arthritis Medications that cause bone loss (glucocorticoids, etc.)
Source: U.S. Department of Health and Human Services. (2004). Bone Health and Osteoporosis: A Report of the Surgeon General, p. 199, and the National Osteoporosis Foundation (NOF) Guidelines, 2011.
Need for the Study
Increasing osteoporosis incidence, prevalence, and severity in women and men is recognized
by clinicians and researchers as a problem that may be under or undiagnosed in certain gender
and ethnic groups. For example, Murphy, Attico, Rhodes, Dodge, & DeRoin (2004) indicate in
the conclusion section of their article entitled “Osteoporosis in American Indian/Alaska Native
Women”, “These findings show that osteoporosis among American Indian and Alaska Natives
needs further investigation” (p. 7).
According to Bleeker (2001), “more investigations are needed in the incidence of
osteoporosis in men among races other than blacks and whites, and “another area of research that
needs to be investigated is the occurrence of early symptoms in young men” (p, 43). According

5
to Smith, Leyva & Baker (2009), “There is not much information about osteoporosis risk in
Native Americans that may hinder access to treatment” (p. 1).
According to the Rhode Island Commission on Women (2003), “Current data are limited for
Native American and Mexican American populations, therefore making their level of risk
unknown. Given the available statistics and the scarcity of osteoporosis-related information on
Hispanic and Native American women, more research on ethnic differences related to bone
density and treatment is needed” (p. 2). The International Society of Clinical Densitometry
(ISCD) (2007) recommends “use of a single normative database (i.e.: not adjusted for ethnicity)
to calculate T-scores in non-White as well as White postmenopausal women, and use of a male
normative database to calculate T-scores for men” (p. 1). Additionally, it has been
recommended by the National Osteoporosis Foundation (NOF) (National Osteoporosis
Foundation, 2011) that men and Native Americans get tested for osteoporosis if they show
specific risk factors.
Researchers at the Northwest Portland Area Indian Health Board, 527 SW Hall Street, Suite
300, Portland, OR 97201-5296 in one of their behavioral risk factor surveillance system
(BRFSS) programs for monitoring health risk behaviors, along with the State of Idaho
Osteoarthritis and Bone Disease prevention programs and Idaho Physical Activity and Nutrition
(IPAN) program asked for this study to be conducted at Lapwai, ID under the general direction
of the Nez Perce Tribal Medical and Executive Director, respectively.
Dr. Valerie Fox, Medical Director of the Nez Perce Tribal Clinic, and an Ojibwe Native
American herself, worked for the Indian Health Service (IHS) and was a liaison with the
Portland IHS and a member of the Idaho IAN Committee. She asked me to complete this study.

6
Dr. Fox’s request. My interest in Native American Health and my role as a health education
doctoral student at SIUC compelled me to complete this research study. Dr. Fox approved the
intent and scope of the study after extensive consultation between myself and the Nez Perce
Tribe Executive Committee, Medical Advisory Board and Nez Perce Tribal Legal Counsel and
the Executive Director of the Nez Perce Tribal Clinic.
Based upon this request, my dissertation research will focus on the use of an Expanded Health
Belief Model (EHBM) based survey instrument to determine Nez Perce Tribal members and
non-tribal members, male and female, aged 18 and older osteoporosis attitudes, knowledge,
beliefs and self-efficacy concerning osteoporosis.
Dearth of Data on Osteoporosis and Native Americans
In spite of the availability of osteoporosis detection and treatment options, there remains
minimal data regarding the incidence, prevalence, and severity of osteoporosis among Native
Americans. “The Department of Health and Human Services, Office on Women’s Health has
identified osteoporosis as a priority health topic and the National Indian Women’s Health
Resources Center has also identified the need to increase knowledge of health care providers in
the standards of screening, diagnosis and treatment of osteoporosis” (Murphy, Attico, Rhodes,
Dodge & DeRoin, 2004, p. 1).According to the World Health Organization (WHO)(2004) and
the Rhode Island Commission on Women (2003), “…osteoporosis [is] the second largest public
health problem for women” (p.1). According to Duke University endocrinologist Tom Weber,
MD (2004), “two million men in this country have osteoporosis. The risk of hip fracture in men
will increase by 300% by 2050, more so than the increase that will occur in women. This sort of
information is needed to educate both the medical community and the lay public as to the

7
importance of identifying and treating men with osteoporosis [and] in some ways it’s more
serious for men” (Oskin, p.1-2). According to Eric S. Orwoll, MD (1999) “osteoporosis is a
devastating disease, especially to older men and women [and] we have studied its causes and
treatment in women, but we know little about it in men” (Orwoll, p. 1). According to Bleeker
(2001), “The occurrence of osteoporosis in men should be a concern worldwide because by the
year 2025, the number of hip fractures occurring in men, will be similar to what they are for
women now (1.2 million)” (p. 1).
Purpose of Study
The purpose of this study is to implement an EHBM based written survey to determine if there
is a difference in osteoporosis attitudes, knowledge, beliefs and self-efficacy among Nez Perce
Tribal members, male and female, age 18 and older as compared to non-Nez Perce Tribal
members residing in Nez Perce County, ID. Non-Nez Perce tribal members are individuals
whom are 1) Native Americans who are not members of the Nez Perce Tribe and 2) all Non-
Native Americans in the research study.
Null Hypothesis
There is not a difference in osteoporosis knowledge, attitudes, beliefs, and self-efficacy
among Nez Perce Tribal members and non-Nez Perce Tribal members, male and female,
aged 18 and older residing in Nez Perce County, ID as evidenced by completion of the
EHBM based osteoporosis survey instruments.
H0: Native American = Non-Native American
8
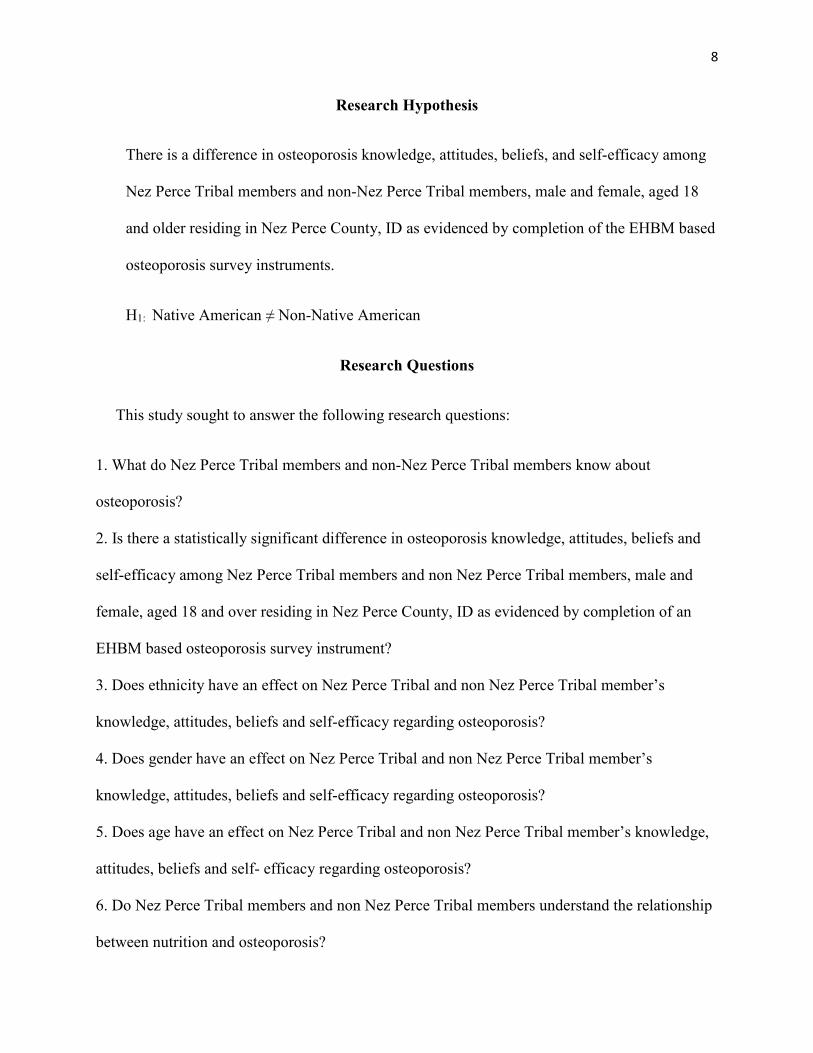
Research Hypothesis
There is a difference in osteoporosis knowledge, attitudes, beliefs, and self-efficacy among
Nez Perce Tribal members and non-Nez Perce Tribal members, male and female, aged 18
and older residing in Nez Perce County, ID as evidenced by completion of the EHBM based
osteoporosis survey instruments.
H1: Native American ≠ Non-Native American
Research Questions
This study sought to answer the following research questions:
1. What do Nez Perce Tribal members and non-Nez Perce Tribal members know about
osteoporosis?
2. Is there a statistically significant difference in osteoporosis knowledge, attitudes, beliefs and
self-efficacy among Nez Perce Tribal members and non Nez Perce Tribal members, male and
female, aged 18 and over residing in Nez Perce County, ID as evidenced by completion of an
EHBM based osteoporosis survey instrument?
3. Does ethnicity have an effect on Nez Perce Tribal and non Nez Perce Tribal member’s
knowledge, attitudes, beliefs and self-efficacy regarding osteoporosis?
4. Does gender have an effect on Nez Perce Tribal and non Nez Perce Tribal member’s
knowledge, attitudes, beliefs and self-efficacy regarding osteoporosis?
5. Does age have an effect on Nez Perce Tribal and non Nez Perce Tribal member’s knowledge,
attitudes, beliefs and self- efficacy regarding osteoporosis?
6. Do Nez Perce Tribal members and non Nez Perce Tribal members understand the relationship
between nutrition and osteoporosis?

9
7. Do Nez Perce Tribal members and non Nez Perce Tribal members understand the relationship
between exercise and osteoporosis?
Independent and Dependent Variables
Age (18 and over), gender (male/female) and race (Nez Perce Tribal member/Non-Nez
Perce Tribal member) are the independent variables, and osteoporosis knowledge, attitudes,
beliefs and self-efficacy are the dependent variables in this research study.
Nez Perce Tribe and Study Setting
The Nez Perce Tribal homelands are currently based in Lapwai and Kamiah, ID
respectively, but historically Nez Perce lands stretched from “…Southeastern Washington,
Northeastern Oregon with usual and accustomed areas in Western Montana and Wyoming.
The Nimiipuu aboriginal territory was approximately 17 million acres or approximately 70
thousand square kilometers or 27 thousand square miles; including the Clearwater River
Basin, the South and Middle Forks of the Salmon River Basin and their tributaries”(Accessed
on 01/30/2011 from www.nezperce.org/history/nimiipuu.htm.)
The French term nayz piers or nays piers (those with pierced noses), or the English
translation, Nez Perce, was used to describe the Nimiipuu by a French interpreter for Lewis
and Clark during their 1804-1806 cross country western expedition. This name stuck even
though the cultural practice of nose piercing was not routinely practiced by the Nimiipuu
(Accessed on January 28, 2011 from
http://www.mnsu.edu/emusuem/cultural/northamerica/nez_perce.html ). Nimiipuu is the
Native American word that members of the Nez Perce Tribe used to describe themselves.
10
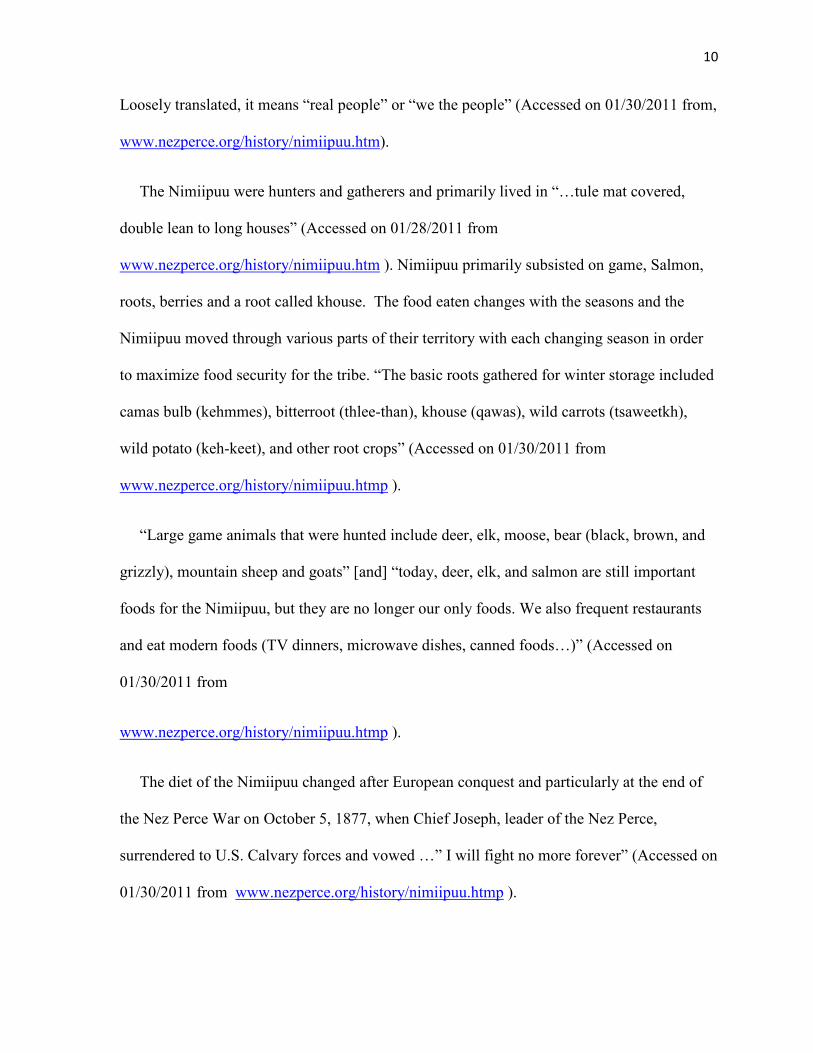
Loosely translated, it means “real people” or “we the people” (Accessed on 01/30/2011 from,
www.nezperce.org/history/nimiipuu.htm).
The Nimiipuu were hunters and gatherers and primarily lived in “…tule mat covered,
double lean to long houses” (Accessed on 01/28/2011 from
www.nezperce.org/history/nimiipuu.htm ). Nimiipuu primarily subsisted on game, Salmon,
roots, berries and a root called khouse. The food eaten changes with the seasons and the
Nimiipuu moved through various parts of their territory with each changing season in order
to maximize food security for the tribe. “The basic roots gathered for winter storage included
camas bulb (kehmmes), bitterroot (thlee-than), khouse (qawas), wild carrots (tsaweetkh),
wild potato (keh-keet), and other root crops” (Accessed on 01/30/2011 from
www.nezperce.org/history/nimiipuu.htmp ).
“Large game animals that were hunted include deer, elk, moose, bear (black, brown, and
grizzly), mountain sheep and goats” [and] “today, deer, elk, and salmon are still important
foods for the Nimiipuu, but they are no longer our only foods. We also frequent restaurants
and eat modern foods (TV dinners, microwave dishes, canned foods…)” (Accessed on
01/30/2011 from
www.nezperce.org/history/nimiipuu.htmp ).
The diet of the Nimiipuu changed after European conquest and particularly at the end of
the Nez Perce War on October 5, 1877, when Chief Joseph, leader of the Nez Perce,
surrendered to U.S. Calvary forces and vowed …” I will fight no more forever” (Accessed on
01/30/2011 from www.nezperce.org/history/nimiipuu.htmp ).

11
As the diet of the Nimiipuu changed and became more westernized over the years, and as
exercise activities diminished with a lack of travel over their territorial lands, many Nez
Perce Tribal members adopted modern conveniences and a sedentary lifestyle. Lack of
exercise and adoption of a non-Native, nutrient poor, calorie rich diet has led to increased
obesity, diabetes, and cardiovascular disease among many Native Americans including some
members of the Nez Perce Tribe.
This change in diet and diminished exercise capacity may have a negative impact on bone
density in members of the Nez Perce Tribe. It is possible that there may be diminished bone
density in some members of the Nez Perce Tribe, thereby increasing the incidence,
prevalence and severity of osteoporosis in this Native American group.
Socioeconomic Status of the Nez Perce Tribe
Members of the Nez Perce Tribe have a sovereign form of tribal government, but their
socioeconomic status is one of relative poverty and dependency on the United States
government, particularly the Bureau of Land Management (BLM), the Department of the
Interior, and Indian Health Services (HIS). Lapwai and Kamiah, ID, respectively, are both
small towns that are relatively isolated within the Northern to Mid-Idaho region.
Socioeconomic depression of members of the Nez Perce Tribe involves restricted access to
public transportation, and an inability for most tribal members to own a car. There is bus
transportation for members of the tribe to the Nez Perce Tribal casino nearby and to
Lewiston, ID and Clarkston, WA, 12 and 15 miles away, respectively, for shopping and
healthcare services, but the hours of operation are limited.

12
Members of the tribe have tribal health care services paid for by the Indian Health Service
(IHS) regional office in Portland, OR, but such services are only paid for if treatment is given
at a designated Native American clinic. Osteoporosis testing is not paid by IHS unless a
physician, nurse practitioner, or physician assistant employed by the clinic orders it and can
justify the order, which occurs only if the individual is already diagnosed with osteoporosis
and is also a female 60 years of age (YOA) or older. Other osteoporosis screening services
would have to be paid out of pocket or via other means.
Significance to Health Education
“Simonds (1976) defined health education as aimed at “bringing about behavioral changes in
individuals, groups, and larger populations from behaviors that are presumed to be detrimental to
health, to behaviors that are conducive to present and future health “(Glanz, 1997, p. 7). “In 1980
Green defined health education as “any combination of learning experiences designed to
facilitate voluntary adaptations of behavior conducive to health” (Glanz, 1997, p. 7). “Health
education includes not only instructional activities and other strategies to change individual
health behavior but also organizational efforts, policy directives, economic supports,
environmental activities, and community-level programs” designed to enhance health status
(Glanz, 1997, p. 8).
An important, if not seminal behavior model in health education is the health belief model
(HBM). The HBM was developed by U.S. Public Health Psychologists Victor Strecher, Irwin
Rosenstock and Godfrey Hochbaum in the 1950’s. The theory was developed as a result of
expectancy theory and concerns about the limited success of public health tuberculosis (TB) x-
ray screening programs (Glanz, 1997, p. 42-43). “Beginning in 1952, Hochbaum studied

13
probability samples of more than 1,200 adults in three cities that had conducted recent TB
screening programs in mobile X-ray units” (Glanz, 1997, p. 43). “He assessed these individual’s
readiness to obtain x-rays [and]…whether respondents believed that X-rays could detect
tuberculosis prior to the appearance of symptoms and whether they believed that early detection
and treatment would improve their prognosis” (Glanz, 1997, p. 43). Themes of the health belief
model include an individuals or groups perceived susceptibility to a certain illness, or condition,
the perceived seriousness of the illness or condition, socioeconomic and knowledge factors, (i.e.:
awareness of the disease, having medical insurance in order to pay for diagnosis and treatment of
to diagnose, etc.), the perceived threat of being diagnosed with the illness or condition, benefits
and barriers to action to get diagnosed and treated for the illness or condition, and cues to action
(i.e.; family support, physician access, treatment options, etc.). Further research led to model
refinements, with all components of the complete model listed in Fig. 1.
Age, Sex, Ethnicity,
Personality, Socioeconomic
Knowledge
Perceived Benefits Minus
Perceived Barriers
Perceived Susceptibility/Perceived
Severity
Perceived Threat
Fig 1. Health Belief Model (Glanz, K., Rimer, B.K., Lewis, F.M. & Wallace, L.S. (2002).
Likelihood of Behavior
Cues to Action

14
“For over four decades, the HBM has been one of the most widely used conceptual
frameworks in health behavior” (Glanz, 1997, p. 41). “In 1974, Health Education Monographs
devoted an entire issue to the HBM and personal health behavior (Becker, 1974, p. 1-8). That
issue summarized findings from research on the HBM to understand why individuals did or did
not engage in a wide variety of health-related actions, and it provided considerable support for
the model in explaining behavior pertinent to prevention and behavior in response to symptoms
or to a diagnosed disease” (Glanz, 1997, p. 48). “Summary results provide substantial empirical
support for the HBM, with finding from prospective studies at least as favorable as those
obtained from retrospective research “(Glanz, 1997, p. 49).
“Bandura’s inclusion of the concept of self-efficacy in the HBM in 1977 led to what is known
as the Expanded Health Belief Model (EHBM)” (Wallace, 2002, p. 164). Research by Horan,
Gendler, Kim, Froman, and Patel at Grand Valley State University in Allendale, MI from 1991-
2010 has demonstrated the value and utility of using the EHBM for osteoporosis inquiry and
research. Based upon the research of Horan, Gendler, Kim, Froman and Patel, I believe that the
EHBM is an appropriate and useful model for determining male and female, aged 18 and over,
Nez Perce Tribal and non-tribal member voluntary participant’s attitudes, knowledge, beliefs,
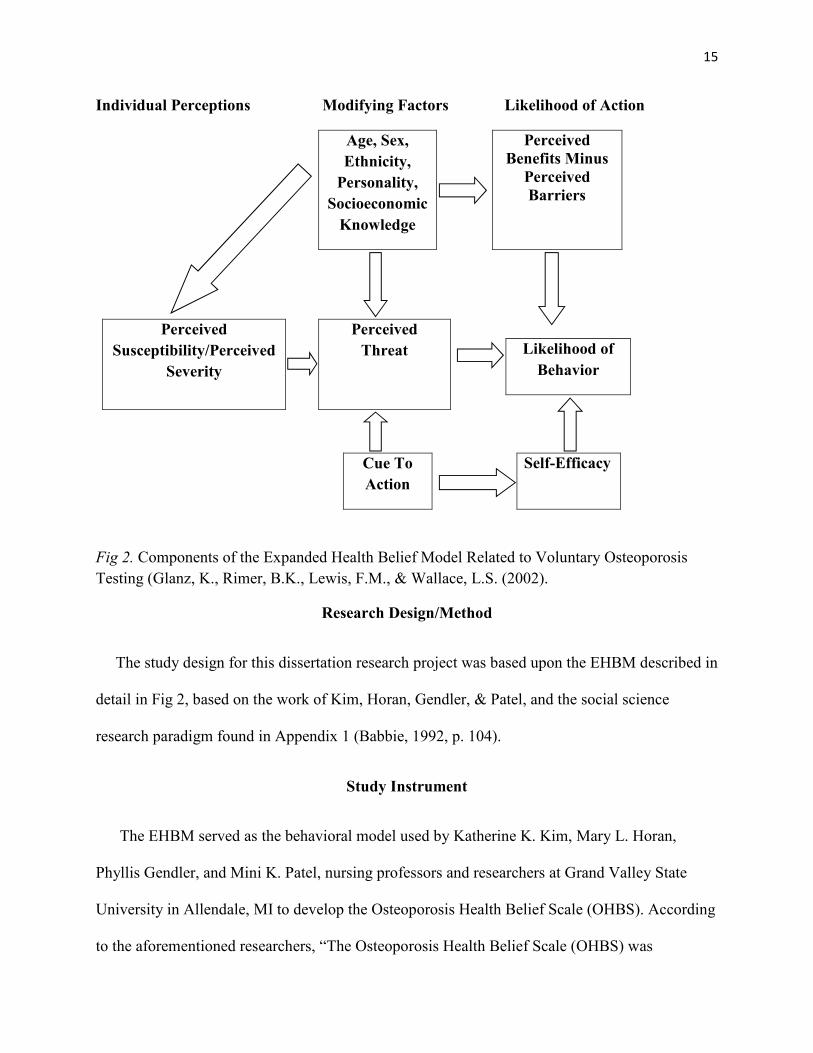
and self-efficacy regarding osteoporosis. The Expanded Health Belief Model (EHBM) is shown
in Fig 2 below:
15
Individual Perceptions Modifying Factors Likelihood of Action
Age, Sex,
Ethnicity,
Personality,
Socioeconomic
Knowledge
Perceived Benefits Minus
Perceived Barriers
Perceived
Susceptibility/Perceived
Severity
Perceived
Threat
Fig 2. Components of the Expanded Health Belief Model Related to Voluntary Osteoporosis Testing (Glanz, K., Rimer, B.K., Lewis, F.M., & Wallace, L.S. (2002).
Research Design/Method
The study design for this dissertation research project was based upon the EHBM described in
detail in Fig 2, based on the work of Kim, Horan, Gendler, & Patel, and the social science
research paradigm found in Appendix 1 (Babbie, 1992, p. 104).
Study Instrument
The EHBM served as the behavioral model used by Katherine K. Kim, Mary L. Horan,
Phyllis Gendler, and Mini K. Patel, nursing professors and researchers at Grand Valley State
University in Allendale, MI to develop the Osteoporosis Health Belief Scale (OHBS). According
to the aforementioned researchers, “The Osteoporosis Health Belief Scale (OHBS) was
Likelihood of
Behavior
Cue To
Action
Self-Efficacy

16
developed to measure health beliefs related to osteoporosis” (Kim, 1991, p. 155). The purpose of
developing the OHBS was to develop and test an instrument designed to measure personal
attitudes and beliefs related to the potential for developing osteoporosis” (Kim, 1991, p. 156).
The instrument that these researchers developed consisted of two additional risk reduction
behaviors; the barriers and benefits related to calcium intake and those related to physical
exercise” (Kim, 1991, p. 157). “The addition of these two measurements in the EHBM helps
“…demonstrate the importance of health motivation in influencing health related behavior” [and]
the developers of this model encourage further use and revision of the instrument and
recommend the inclusion of self-efficacy as an additional dimension (Kim, 1991, p. 161).
Reliability Coefficients of the OHBS
Table 4 demonstrates the reliability coefficients for the OHBS-Calcium Subscales and the OHBS
Exercise Subscales:
Table 4
Internal Consistency for the OHBS Subscales (Calcium and Exercise)
Subscale Number of Items Cronbach Alpha Calcium
Cronbach Alpha Exercise
Susceptibility 5 .80 .80 Seriousness 5 .65 .65 Health Motivation 5 .61 .61 Benefits 5 .68 .74 Barriers 5 .73 .72

17
Approval to Conduct the Study
Approval to conduct this study was granted by the SIUC Human Subjects Committee. The
signed approval documents also include SIUC HSC Form A, protocol # 13240 (Appendix 2) and
the USDHHS Office of Human Research Protection Assurance letter, # FWA00005334
(Appendix 3). The approval letter is dated August 9, 2013, signed by Jane L. Swanson, PhD,
Chair, Human Subjects Committee at SIUC in 2013. Research approval letters from Nimiipuu
Health addressed to Dr. Swanson, Dr. Ratnapradipa, and primary investigator (PI) Victor White
are contained in Appendix 4, 5 and 6. Appendix 7 contains the research script. The study consent
form is found in Appendix 8. The study brochure describing the nature of the study, date, time
and location of the study is found in Appendix 9.
Study Protocol
The study was quantitative and descriptive in nature. True randomization was not achievable
in this study because it is based on volunteer participation (i.e.: self-selection by participants)
regarding completion of a survey instrument that measures osteoporosis attitudes, knowledge,
beliefs, and self-efficacy of male and female, aged 18 and older, Nez Perce Tribal members and
Non Nez Perce Tribal members, aged 18 and older, residing in Nez Perce County, ID.
Instrument
The instruments used in conducting the survey research regarding osteoporosis attitudes,
knowledge, beliefs and self-efficacy of Nez Perce Tribal members as compared to Non Nez
Perce Tribal members are the Osteoporosis Knowledge Test (OKT), the Osteoporosis Health
Belief (OHBS) Scale, and the Osteoporosis Self Efficacy Scale (OSES). These are Likert scale
items, developed by Katherine Kim, PhD., Mary Horan, PhD., and Phyllis Gendler, PhD in 1991

18
at Grand Valley State University in Grand Rapids, MI. These instruments were revised by
Phyllis Gendler, PhD, Cynthia Coviak, PhD, Jean Martin, PhD, and Katherine Kim, PhD in 2010
and 2011.
The OKT (revised in 2011) has two subscales: Osteoporosis Knowledge Test Nutrition
(items 1-11 and 18-32) and Exercise (items 1-17 and 30-32). The OKT Nutrition (Revised 2011)
and OKT Exercise (Revised 2011) share 14 common items (items 1-11 and 30-32). The
reliability coefficients for internal consistency (KR 20) for the OKT (Revised 2011) are as
follows: 0.849 for the total scale, 0.83 for the Nutrition subscale, and 0.81 for the Exercise
subscale. Test-retest analysis resulted in Pearson Correlation of 0.872. Validity of the OKT was
evaluated by content validity by a panel of HBM and Osteoporosis experts. Questions were
examined for difficulty, effectiveness of distracters and discrimination (Horan, Kim, Gendler,
Froman & Patel, 1998).
The Osteoporosis Health Belief Scale (OHB) has five subscales; the Susceptibility subscale,
(questions 1-6), the Seriousness subscale, (questions 7-12), the Benefits of Exercise subscale
(questions 13-18), the Benefits Calcium Intake subscale (questions 19-24), the Barriers to
Exercise subscale, (questions 25-30), the Barriers to Calcium Intake, (questions 31-36) and the
Health Motivation subscale, (questions 37-42) (Horan, Kim, Gendler, Froman & Patel, 1998).
Validity of the OHBS was evaluated by factor analysis and discriminate function analysis
(Horan, Kim, Gendler, Froman & Patel, 1998).
The Osteoporosis Self-Efficacy Scale (OSES 21 items) has two sub scales: The Osteoporosis
Self-Efficacy Exercise Scale, which has 10 items (questions 1-10). The OSES Calcium Scale has
11 items (questions 11-21). Reliability coefficients for internal consistency (Cronbach alpha) of
19
both subscales are .90. Validity of the OSES was evaluated by factor analysis and discriminate
function analysis (Horan, Kim, Gendler, Froman & Patel, 1998).
Sample
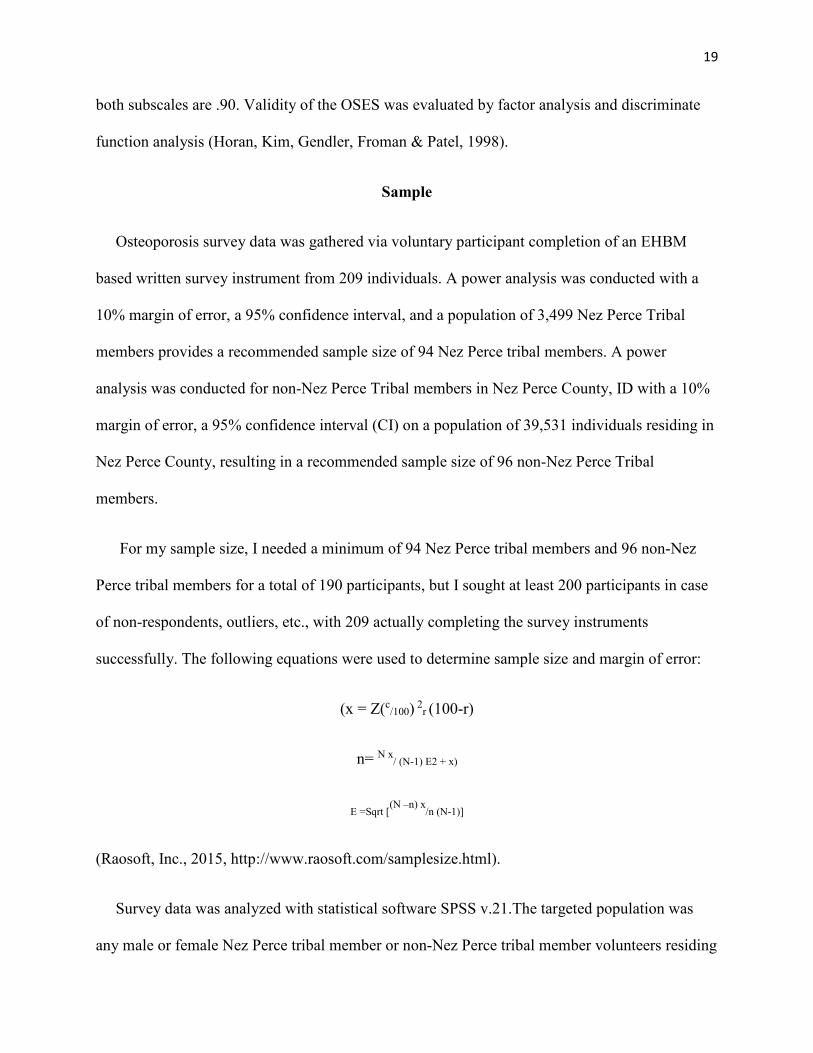
Osteoporosis survey data was gathered via voluntary participant completion of an EHBM
based written survey instrument from 209 individuals. A power analysis was conducted with a
10% margin of error, a 95% confidence interval, and a population of 3,499 Nez Perce Tribal
members provides a recommended sample size of 94 Nez Perce tribal members. A power
analysis was conducted for non-Nez Perce Tribal members in Nez Perce County, ID with a 10%
margin of error, a 95% confidence interval (CI) on a population of 39,531 individuals residing in
Nez Perce County, resulting in a recommended sample size of 96 non-Nez Perce Tribal
members.
For my sample size, I needed a minimum of 94 Nez Perce tribal members and 96 non-Nez
Perce tribal members for a total of 190 participants, but I sought at least 200 participants in case
of non-respondents, outliers, etc., with 209 actually completing the survey instruments
successfully. The following equations were used to determine sample size and margin of error:
(x = Z(c/100)
2r (100-r)
n= N x/ (N-1) E2
+ x)
E =Sqrt [(N –n) x
/n (N-1)]
(Raosoft, Inc., 2015, http://www.raosoft.com/samplesize.html).
Survey data was analyzed with statistical software SPSS v.21.The targeted population was
any male or female Nez Perce tribal member or non-Nez Perce tribal member volunteers residing

20
in Nez Perce County Idaho, aged 18 or above. The site where the EHBM based Osteoporosis
Survey was conducted is the Nimiipuu Health Clinic, P.O. Box 367, Lapwai, ID 83540. This site
was approved by Nimiipuu Health and the SIUC HSC Committee.
Theoretical Framework
The study design for this dissertation research project was partially based upon the EHBM
described in detail in Fig. 1, the work of Kim, Horan, Gendler, & Patel, and the social science
research paradigm found in Appendix 1 (Babbie, 1992, p. 104). The study was quantitative and
descriptive in nature. The study design was a convenience sample in which participants self-
select. True randomization was not possible (Isaac & Michael, 1997, p. 77-79 & 84-86).
Data Collection
Three EHBM based Likert scale survey questionnaires were filled out by each participant for
data collection purposes. The general consent form for this study is located in Appendix 8.
Appendix 9 is the information flyer describing the nature of the study, location, date and time of
the study. Appendix 10 is a scan of the permission letter from Phyllis Gendler, PhD of Grand
Valley State University in Grand Rapids, MI to use the Osteoporosis Knowledge Test (OKT)
(Appendix 11), Osteoporosis Health Belief Scale (OHBS) (Appendix 12), and the Osteoporosis
Health Efficacy Scale-21 (OHES) (Appendix 13). Participants completed the OKT, the OHBS
and the OHES. These survey instruments are based upon osteoporosis and EHBM research
completed by Phyllis Gendler, Ph.D. and associates surveying 201 women, 35 years of age or
older at Grand Valley State University in Allendale, MI from 1991 through 2010. The three
EHBM based surveys include questions regarding overall health status, gender, medication use,
smoking, vitamin intake, exercise, diet, and the diagnosis and treatment of osteoporosis (Kim,

21
Horan, Gendler, & Patel, 1991, p. 155-163 and Horan, Kim, Gendler, Froman, & Patel, 1998, p.
395-403, and Wallace, 2002, p. 163-172).
Data Analysis
Data was analyzed with statistical software, SPSS v. 21. Descriptive statistics generated
included age, ethnicity, frequencies, gender, means, standard deviations and ranges. Non
parametric tests used included Chi Square, chi coefficient, Mann-Whitney U and Kruskall
Wallis. Parametric tests included Levene’s equality of variances and means t test, hierarchical
linear regression, ANOVA and MANOVA.
Assumptions
Assumptions can be defined as the manner in which “…researchers approach their studies
with a certain paradigm or worldview, a basic set of beliefs or assumptions that guide their
inquiries. These assumptions are related to the nature of reality (the ontology issue), the
relationship of the researcher to that being researched (the epistemological issue), the role of
values in a study (the axiological issue), and the process of research (the methodological issue)”
(Creswell, 1998, p. 74). In this research project, the following assumptions are made:
1. Volunteer study participants responded to the EHBM based survey questions based upon their
actual perceptions.
2. EHBM survey items were interpreted by participants as the primary investigator intended for
them to be interpreted.
3. The EHBM surveys are valid and accurately measured each of the intended constructs.
4. The EHBM surveys are reliable.

22
5. SPSS statistical analysis was properly conducted and suitable for this research project and
dissertation.
6. Research results accurately correlate to the research question.
7. Participant’s response to the EHBM based survey questions were not altered or attenuated by
use of the EHBM survey instrument wording, which is at the 5th grade reading level (Kim, et.al.,
1991).
8. The researcher’s personal relationship to some of the volunteer subjects (i.e.: colleagues,
students, patients, and healthcare providers) did not skew the research participation or results.
Limitations
Study limitations are those factors which may limit the internal validity of a specific study.
The following known limitations of this study are identified below:
1. Transportation problems in getting to the Nez Perce Tribal Clinic.
2. There could have been significant variations in participant’s ability to remember and tabulate
exercise and dietary activities over a period of time.
3. EHBM osteoporosis survey participants perhaps were not representative of non-participants.
4. EHBM instrument length (I.e.: 3 forms) may have influenced responses of different
individuals.
6. EHBM readability may affect participant responses. The EHBM survey was at the 5th grade
reading level (Kim, et. al, 1991).
7. Participants may have had social bias and responded in an effort to enhance their likelihood of
participation in the EHBM Based Survey.
8. Relatively small sample size

23
Delimitations:
Study delimitations are those factors which may limit the external validity of a study. The
following are known delimitations of this study:
1. There was limited contact with the study participants and the survey instrument was kept
intentionally brief in order to facilitate survey instrument use.
2. Participation in this study was on a volunteer basis.
3. Participants were residents of Nez Perce County, ID.
4. Participant health behavior could not be controlled prior to and during this study.
5. Participants with insufficient survey data were excluded from this study.
6. Some Nez Perce Tribal and non-Tribal members were prevented from participating in this
study due to a variety of factors beyond the primary investigators control.
Protection of Privacy and Confidentiality
All individual participants had their identities kept confidential at all times. Participants were
able to decline to participate at any time with no penalty or restriction of care at the Nez Perce
Tribe clinic or any other health/medical facilities. All raw data was coded with reference to
demographic data of the voluntary participants of this study. Access to raw data was available
only to the primary investigator. All coded data was coded without reference to demographic
aspects of the study participants. Hard copy data was kept in a locked file cabinet located at
Victor Whites residence. Computer data was contained on a password protected, restricted
access computer at Victor Whites residence. All participant data was held in the strictest
confidence and adhered to all confidentiality requirements of the Nez Perce Tribe and SIUC
HSC.

24
In addition, primary investigator (PI) Victor N. White, MA, MSRS, RT(R), CHES completed
a National Institutes of Health (NIH) Human Participants Protection Education for Research
Teams seminar at the University of Idaho in Moscow, ID. A certificate of completion for this
seminar is contained in Appendix 14. Complete participant anonymity was unable to be ensured
because individual participants could have seen each other entering and leaving the Nez Perce
Tribal clinic. In addition, Idaho State law indicates that confidentiality may not be maintained
completely if there is a compelling legal reason to know participants in a research project, but
“much of the biomedical and behavioral research conducted in the United States is governed by
the rule (i.e.: Common Rule) entitled Federal Policy for the Protection of Human Subjects (HHS
Subpart A of Title 45 CFR, Part 46), which supersedes state law regarding protection of human
subjects in research projects” (National Institutes of Health, 2011, p. 1). In this study, there was
not a compelling legal reason to know any participant’s identity to anyone other than the PI, so
confidentiality was maintained.
Benefit and Risk Dichotomy
Potential Benefits to Volunteer Participants Include the Following:
1. Opportunity to learn more about osteoporosis.
2. Opportunity for osteoporosis mitigation and prevention strategies to be implemented on an
individual, tribal, and non-tribal basis.
3. Bone health benefits to individuals, Nez Perce Tribal members, the Nez Perce Tribe as a
group, and non-Nez Perce Tribal members.

25
Potential Risks to Volunteer Participants Include the Following
1. Small risk of disclosure of knowledge of study participants by physical “sightings” of
participants going to the Lapwai, ID clinic for completion of the EHBM based osteoporosis
survey instruments, mitigated by confidentiality precautions used to complete the study and store
data.
Definition of Terms
Important terms with accompanying definitions are indicated below. These terms and
definitions may be found throughout this dissertation.
Alendronate: “Trade name is Fosamax”. This is a medication used to treat osteoporosis
(National Institutes of Health, 2010, p. 1).
Expanded Health Belief Model (EHBM): “The EHBM includes self-efficacy (i.e.: ones
perceived confidence in carrying out the behavior), which was introduced by Bandura in 1977”
(Wallace, 2002, p. 164).
Health Belief Model: “The health belief model (HBM) is a conceptual belief framework used
to understand health behavior and possible reasons for non-compliance with recommended
health action” [and]” the HBM addresses four major components for compliance with
recommended health action: perceived barriers of recommended health action, perceived benefits
of recommended health action, perceived susceptibility of the disease, and perceived severity of
the disease” (Turner, Hunt, DiBrezzo, & Jones, 2004, p. 116).
Incidence: “The number of new cases of a disease in a population-at-risk during a particular
period of time (or per year)” (Greenhalgh, 2007, p. 50 and McKenzie & Pinger, 1999, p. 667).

26
Native-American: “…indigenous peoples of the America’s [and]…those living in a specific
country or sharing certain cultural attributes” (Native American, 2011.
http://www.tribaldirectory.net).
Nez Perce Tribe: “The Nez Perce (nays piers) actually represents many distinct tribes with
many cultural differences that all existed together peacefully, and for that reason they are usually
thought of as being one tribe” (Kittleson,
2011.http://www.mnsu.edu/emusuem/cultural/northamerica/nez_perce.htm).
Nimiipuu: “We the Nez Perce people call ourselves Nimiipuu, which means the “real people” or
“we the people”. The traditional homeland of the Nimiipuu (Nez Perce) is North Central Idaho,
including areas in Southeastern Washington, Northeastern Oregon with usual and accustomed
areas in Western Montana and Wyoming. The Nimiipuu aboriginal territory was approximately
17 million acres or 27 thousand square miles; including the Clearwater River Basin and the
South and Middle forks of the Salmon River Basin and their tributaries” (Nimiipuu,2011.
http://www.nezperce.org/history/nimiipuu.htm).
Osteoporosis: “loss of bone mass that occurs throughout the skeleton, predisposing patients to
fractures. Healthy bone constantly remodels itself by taking up structural elements from one area
and patching others. In osteoporosis, more bone is reabsorbed than laid down, and the skeleton
loses some of the strength that it derives from its intact trabeculation. Aging causes bone loss in
both men and women predisposing them to vertebral and hip fractures. This is called type II
osteoporosis. Type I osteoporosis occurs as a result of the loss of the protective effects of
estrogen on bone that takes place at menopause” (Taber’s Cyclopedic Medical Dictionary, 2009,
p. 1658). The World Health Organization (WHO) operationally defines osteoporosis as bone

27
density 2.5 or more S.D.’s (standard deviation as expressed via T scores) below the mean for
young adult white women (University of Michigan Health Sciences Osteoporosis Guidelines,
2010, p. 2).
Prevalence: “The overall proportion of the population (new and old cases) divided by the total
population” (Greenhalgh, 2007, p. 50 and McKenzie & Pinger & Kotecki, 1999, p. 66).
Risendronate: “Trade name is Actonel and/or Atelvia”. This is a medication used to treat
osteoporosis (National Institutes of Health, 2010, p. 1).
T-Score: “A type of standard score that relies upon the mean value and the standard deviation
(SD) for a set of numerical data” (Bonnick, 1998, p. 69). “T scores are standard scores with a
mean of 50 and a standard deviation of 10” (Glass & Hopkins, 1996, p. 87). “When an
individual’s bone mineral density (BMD) is compared to the mean BMD in a young healthy
population, this standard deviation measurement is referred to as a T-score. The T score is
calculated using the following formula:
Patients BMD-Young Normal Mean/Standard Deviation of Young Normal Mean”
(U.S. Department of Health and Human Services, 2004, p. 204).
t-Test: “”The three assumptions made in the mathematical derivation of the central t-distribution
(i.e., the sampling distribution of t-ratios when H0 is true) are as follows: (1) the Xi’s within each
of the two populations are normally distributed; (2) the two population variances, 12 and 2
2, are
equal; and (3) the individual observations, Xi ‘s, are independent” (Glass & Hopkins, 1996, p.
290).
28
Z-Score: “A Z score can be defined as a measure of how many standard deviation units away
from the mean a particular value of data lies” (Bone Density, 2009, p. 3). “In osteoporosis DXA
testing, a Z score is a comparison of your score to someone else of the same age, weight,
ethnicity, and gender. According to the international society of clinical densitometry (ISCD), Z
scores are used when evaluating premenopausal women and children for osteoporosis…” (U.S.
Department of Health and Human Services, 2004, p. 206).
Summary
The purpose of this study is to implement an EHBM based written survey to determine if there
is a difference in osteoporosis attitudes, knowledge, beliefs and self-efficacy among Nez Perce
Tribal members, male and female, age 18 and older as compared to non-Nez Perce Tribal
members residing in Nez Perce County, ID.
Osteoporosis is a significant public health problem that affects millions of Americans and has
a negative health and socioeconomic impact on Native Americans. However, with the advent of
safe, readily accessible US and DXA based densitometry units, behavior change from a diet and
weight-bearing exercise perspective, and the availability of various prescription medication, the
diagnosis, treatment, and outcomes of this disease can be greatly improved. The use of an EHBM
based survey instrument to learn more about Nez Perce Tribal members and Non-Nez Perce
tribal member’s attitudes, knowledge, beliefs and self-efficacy regarding osteoporosis is a valid
area of research and is worthy of further inquiry.

29
CHAPTER 2
LITERATURE REVIEW
Purpose of Study
The purpose of this study is to implement an EHBM based written survey to determine if there
is a difference in osteoporosis attitudes, knowledge, beliefs and self-efficacy among Nez Perce
Tribal members, male and female, age 18 and older as compared to non-Nez Perce Tribal
members residing in Nez Perce County, ID.
Null Hypothesis
There is not a difference in osteoporosis knowledge, attitudes, beliefs, and self-efficacy
among Nez Perce Tribal members and non-Nez Perce Tribal members, male and female,
aged 18 and older residing in Nez Perce County, ID as evidenced by completion of the
EHBM based osteoporosis survey instruments.
H0: Native American = Non-Native American
Research Hypothesis
There is a difference in osteoporosis knowledge, attitudes, beliefs, and self-efficacy among
Nez Perce Tribal members and non-Nez Perce Tribal members, male and female, aged 18
and older residing in Nez Perce County, ID as evidenced by completion of the EHBM based
osteoporosis survey instruments.
H1: Native American ≠ Non-Native American

30
Research Questions
This study sought to answer the following research questions:
1. What do Nez Perce Tribal members and non-Nez Perce Tribal members know about
osteoporosis?
2. Is there a statistically significant difference in osteoporosis knowledge, attitudes, beliefs and
self-efficacy among Nez Perce Tribal members and non Nez Perce Tribal members, male and
female, aged 18 and over residing in Nez Perce County, ID as evidenced by completion of an
EHBM based osteoporosis survey instrument?
3. Does ethnicity have an effect on Nez Perce Tribal and non Nez Perce Tribal member’s
knowledge, attitudes, beliefs and self-efficacy regarding osteoporosis?
4. Does gender have an effect on Nez Perce Tribal and non Nez Perce Tribal member’s
knowledge, attitudes, beliefs and self-efficacy regarding osteoporosis?
5. Does age have an effect on Nez Perce Tribal and non Nez Perce Tribal member’s knowledge,
attitudes, beliefs and self- efficacy regarding osteoporosis?
6. Do Nez Perce Tribal members and non Nez Perce Tribal members understand the relationship
between nutrition and osteoporosis?
7. Do Nez Perce Tribal members and non Nez Perce Tribal members understand the relationship
between exercise and osteoporosis?

31
Literature Review
This literature review addresses osteoporosis from a general Caucasian and Native American
perspective. The research will address osteoporosis from a Nez Perce Tribal and non Nez Perce
tribal perspective in Nez Perce County, ID.
Definition of Osteoporosis
Osteoporosis can be defined as “a systemic skeletal disease, characterized by low bone mass
and micro architectural deterioration of bone tissue with a consequent increase in bone fragility
and susceptibility to fracture” (Bonnick, & Lewis, 2002, p. 222). This definition was first
conceived in 1991 at a “consensus development conferences sponsored by the National
Osteoporosis Foundation, European Foundation for Osteoporosis and Bone Disease, and the
National Institute of Arthritis and Musculoskeletal and Skin Diseases” (Bonnick, & Lewis, 2002,
p. 222).
This definition was further refined in 1994 by the World Health Organization (WHO) (World
Health Organization (WHO), 2004) and is shown in Table 5.
32
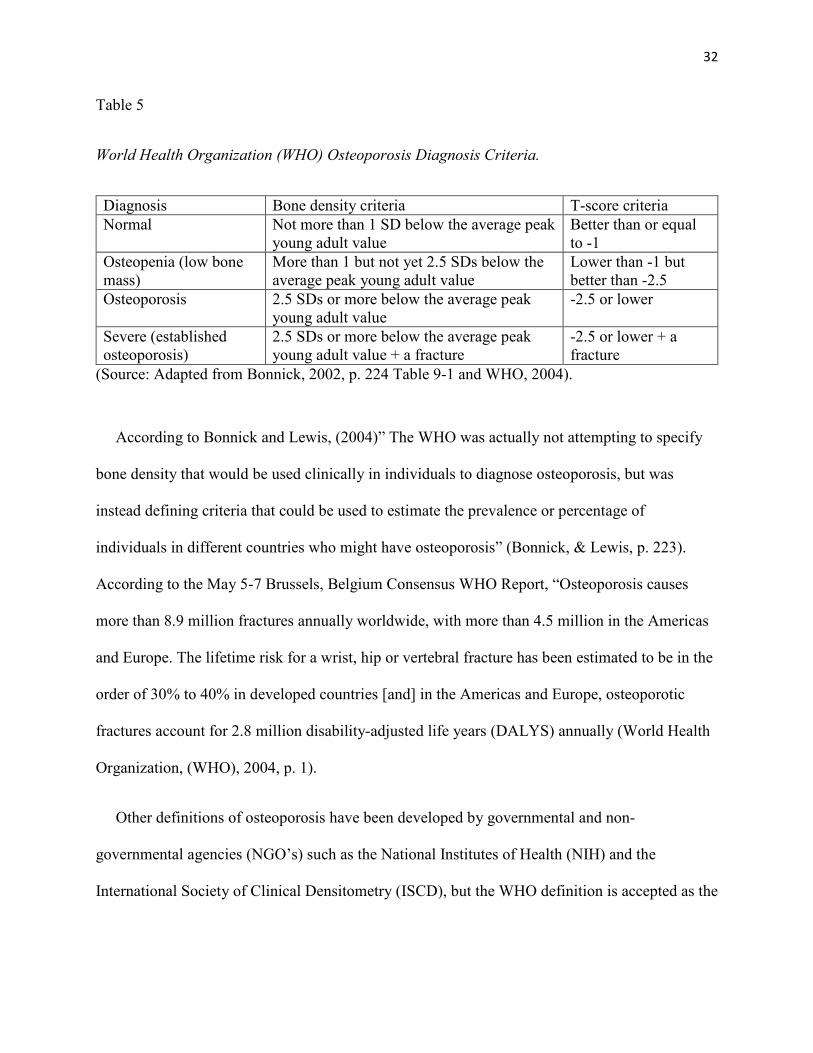
Table 5
World Health Organization (WHO) Osteoporosis Diagnosis Criteria.
Diagnosis Bone density criteria T-score criteria Normal Not more than 1 SD below the average peak
young adult value Better than or equal to -1
Osteopenia (low bone mass)
More than 1 but not yet 2.5 SDs below the average peak young adult value
Lower than -1 but better than -2.5
Osteoporosis 2.5 SDs or more below the average peak young adult value
-2.5 or lower
Severe (established osteoporosis)
2.5 SDs or more below the average peak young adult value + a fracture
-2.5 or lower + a fracture
(Source: Adapted from Bonnick, 2002, p. 224 Table 9-1 and WHO, 2004).
According to Bonnick and Lewis, (2004)” The WHO was actually not attempting to specify
bone density that would be used clinically in individuals to diagnose osteoporosis, but was
instead defining criteria that could be used to estimate the prevalence or percentage of
individuals in different countries who might have osteoporosis” (Bonnick, & Lewis, p. 223).
According to the May 5-7 Brussels, Belgium Consensus WHO Report, “Osteoporosis causes
more than 8.9 million fractures annually worldwide, with more than 4.5 million in the Americas
and Europe. The lifetime risk for a wrist, hip or vertebral fracture has been estimated to be in the
order of 30% to 40% in developed countries [and] in the Americas and Europe, osteoporotic
fractures account for 2.8 million disability-adjusted life years (DALYS) annually (World Health
Organization, (WHO), 2004, p. 1).
Other definitions of osteoporosis have been developed by governmental and non-
governmental agencies (NGO’s) such as the National Institutes of Health (NIH) and the
International Society of Clinical Densitometry (ISCD), but the WHO definition is accepted as the
33
current standard definition worldwide. Because of this, the WHO definition of osteoporosis will
be used in this study.
The WHO reference standard for which the T-score is calculated is taken from data of
Caucasian females regarding bone density found in the National Health and Nutrition
Examination (NHANES) Survey for White, female individuals aged age 20-29 years. NHANES
III occurred between 1988-1994, and “was conducted on a nationwide probability sample of
approximately 33, 994 persons. The survey was designed to obtain nationally representative
information on the health and nutritional status of the populations of the United States through
interviews and direct physical examinations” (Center for Disease Control & Prevention (CDC),
2010).
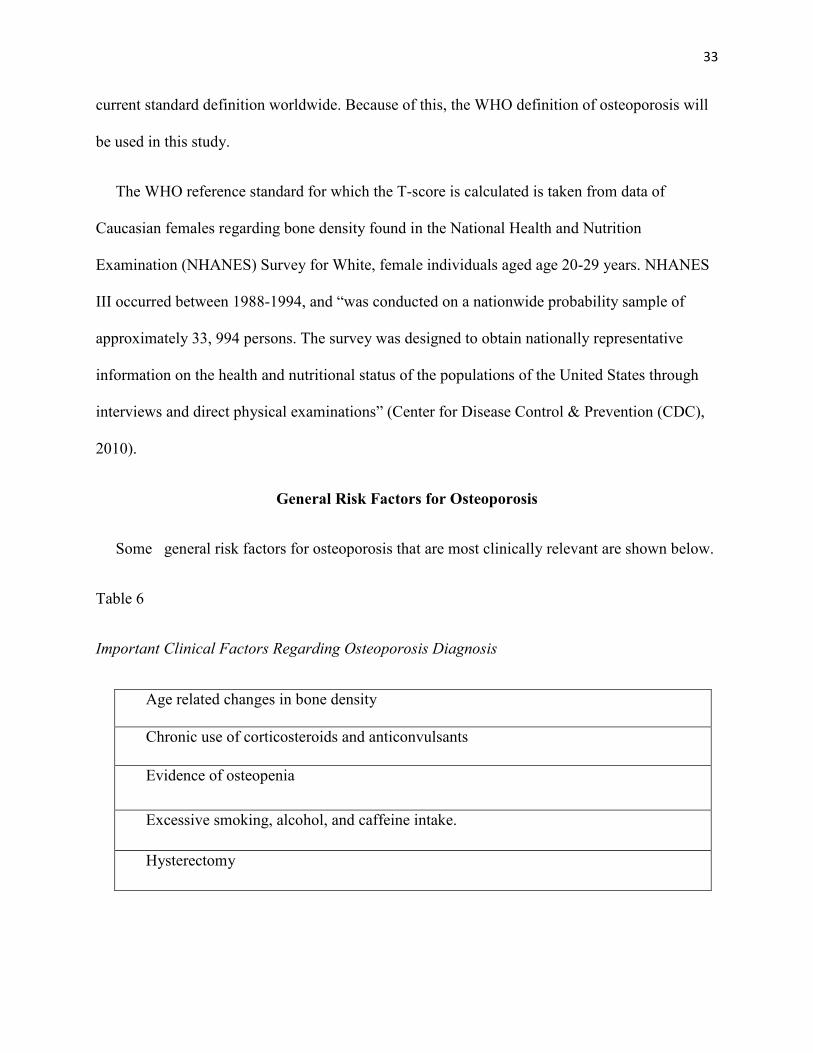
General Risk Factors for Osteoporosis
Some general risk factors for osteoporosis that are most clinically relevant are shown below.
Table 6
Important Clinical Factors Regarding Osteoporosis Diagnosis
Age related changes in bone density
Chronic use of corticosteroids and anticonvulsants
Evidence of osteopenia
Excessive smoking, alcohol, and caffeine intake.
Hysterectomy

34
Table 6 (Continued)
Lack of regular weight-bearing exercise
Lifelong low calcium intake
Males with hypogonadism and low testosterone levels and a history of alcohol abuse.
Menopause
Over age 65 years of age
Family History
Anatomic sites (e.g., vertebrae, wrist, hip, and pelvis) Prolonged immobilization (more than 6 weeks)
(Source: Based on data from Merck, Inc., (1997), p. 3 and Osteoporosis Clinics of America, (1997), p. 8, & Bonnick, (1998), p. 203).
Descriptive Epidemiology of Osteoporosis
Descriptive epidemiology can be defined as …” the occurrence, distribution, size, and
progression of health and disease in the population” (Dever, 2006, p. 40). Descriptive
epidemiology can also be used “to provide data that will contribute to the understanding of the
etiology of health and disease” [and] “to promote the utilization of the epidemiological concepts
to the management of health services” [by] “description of morbidity and mortality data: by
service area, by diagnosis related groups (DRGs)” (Dever, 2006, p. 41).“The epidemiological
method has been described as consisting of careful clinical observation, precise counts of well-
defined cases, and demonstration of relationships between cases and the characteristics of the
populations in which they occur”(Christoffel & Gallagher, 1999, p. 47).
In an epidemiological diagnosis, “decisions should be guided by the desires of the community
members themselves, with consideration given to health problems with the greatest impact, those

35
that have been previously underserved, and those for which solutions are realistically available”
(Glanz. P. 365.). Dr. Valerie Fox, who is a Native American, is the Chief Medical Officer at the
Nimiipuu Health Clinic in Lapwai, Idaho. Dr. Fox and the Director of Community Health have
an interest in osteoporosis and have formally asked me to conduct an osteoporosis research
project comparing osteoporosis knowledge beliefs, attitudes and self-efficacy of members of the
Nez Perce tribe as compared to non-Native Americans to see if there is a statistically significant
difference between the two groups.
According to Brewer (1998), “Osteoporosis is so common that it has been described as the
silent epidemic” (p. 7). “Researchers now know that osteoporosis develops when [bone]
remodeling activity becomes unbalanced so that too much bone is absorbed and not enough laid
down. This causes bones to become thin, brittle, and fracture more easily” (Brewer, 1998, p. 7-
8). The use of WHO criteria for osteoporosis has served as a useful guide, but according to
Bonnick (2002), “strictly speaking, then, the WHO criteria should be applied only to Caucasian
women” (p. 225). Also according to Bonnick (2002) “The WHO did note in 1994 that in the
absence of other criteria, it might not be inappropriate to apply the WHO criteria to mature
Caucasian men” (p. 225). James Norman, MD indicates that “Although these criteria [WHO
Osteoporosis criteria] are widely used, they were based on Caucasian females, so there will be
some differences when these levels are applied to non-Caucasian females or males in general.
Despite this flaw, BMD measurement is still the most common method used in all groups
(Norman, 2010). According to the 2004 U.S. Surgeon General’s Report entitled “Bone Health
and Osteoporosis: A Report of the Surgeon General, “Both the public and health care
professionals need to be aware of a number of known, easy to identify risk factors for
osteoporosis and other bone disease. These factors relate to either the intrinsic strength of bone

36
or the propensity to suffer injurious falls [and] “All individuals, young and old, should be
assessed to determine how many (if any) of these risk factors they have, and then those with a
sufficient degree of risk need to undergo further evaluation (often a BMD test) to determine the
appropriate next course of action (e.g., changes to lifestyle, pharmacologic treatment) (U.S.
Department of Health and Human Services Bone Health and Osteoporosis: A Report of the
Surgeon General, 2004, p. 188). According to the U.S. Surgeon General’s 2004 report, there are
a number of risk factors that might indicate the presence of osteoporosis.
A World Health Organization (WHO) meeting was held in Brussels, Belgium on May 5-7,
2004 in which osteoporosis experts from the WHO met in order to examine and update
osteoporosis diagnosis criteria. According to this WHO report, “The scope of the report is to
direct attention away from the sole use of BMD to determine who will receive treatment and to
shift towards the assessment of absolute fracture risk, whether this be determined by BMD
testing or other validated instruments” (World Health Organization (WHO), 2004, p. 5). New
osteoporosis diagnosis criteria recommended by the WHO now include reliance on a 10-year
probability of fracture risk on models developed in Sweden because the “hazard functions of
fractures and deaths in Sweden are used because of the robustness and extent of the
epidemiological data available in that country “(World Health Organization (WHO), 2004, p. 4).
Potential risk factors were examined by a series of meta-analyses using Poisson models for
each risk factor in each of the study cohorts and for each sex. Covariates examined included age,
sex, BMD, time since assessment and the covariate itself, e.g. to determine whether BMD or
body mass index (BMI) are equally predictive for fracture at different levels of BMD or BMI.
Results from the different studies were merged using the weighted ß- coefficients” (World
Health Organization (WHO) 2004, p. p. 4-5).
37
Osteoporosis in Native American’s
In spite of the availability of osteoporosis detection and treatment options, there remains
minimal data regarding the incidence, prevalence, and severity of osteoporosis among Native
Americans. “The Department of Health and Human Services, Office on Women’s Health has
identified osteoporosis as a priority health topic and the National Indian Women’s Health
Resources Center has also identified the need to increase knowledge of health care providers in
the standards of screening, diagnosis and treatment of osteoporosis” (Murphy, Attico, Rhodes,
Dodge & DeRoin, 2004, p. 1). According to the World Health Organization (WHO) (2004) and
the Rhode Island Commission on Women (2003), “…osteoporosis [is] the second largest public
health problem for women” (p.1). According to Smith, B.S., Leyva, M., and Baker, M.Z. (2009)
at the University of Oklahoma Health Science Center in Oklahoma City, OK, “ currently there is
not much information available about osteoporosis risk in Native Americans and factors that may
hinder access to treatment” [and] “…”to determine how common osteoporosis is in Native
American women who receive treatment at area Indian Health Clinics” (Accessed from the web
on 11/19/2009 at http://gcrc.ouhsc.edu/Smith0129.asp).
According to Nicholas and Chen (2002), “The impact of osteoporosis and its complications is
largely unknown among Native Americans” (Nicholas and Chen, 2002, p. 94). Preventing and
managing osteoporosis in the Native American population is somewhat more challenging than in
other populations due to research deficiencies and a lack of knowledge regarding osteoporosis
knowledge, attitudes, beliefs and self-efficacy amongst Native Americans. The purpose of this
dissertation is to examine these issues in the Nez Perce tribe.

38
Native Men
Even less information is known about the incidence and prevalence of osteoporosis among
Native American men as compared to Native American women or other groups. According to
Duke University endocrinologist Tom Weber, MD (2004), “two million men in this country have
osteoporosis. The risk of hip fracture in men will increase by 300 percent by 2050, more so than
the increase that will occur in women. This sort of information is needed to educate both the
medical community and the lay public as to the importance of identifying and treating men with
osteoporosis [and] in some ways it’s more serious for men” (Oskin, p.1-2).
According to Eric S. Orwoll, MD (1999) “osteoporosis is a devastating disease, especially to
older men and women [and] we have studied its causes and treatment in women, but we know
little about it in men” (Orwoll, p. 1). According to Bleeker (2001), “The occurrence of
osteoporosis in men should be a concern worldwide because by the year 2025, the number of hip
fractures occurring in men, will be similar to what they are for women now (1.2 million)” (p. 1).
Native Adolescents
Osteoporosis is less studied in adolescents then adult men and women. This dearth of research
is more exacerbated when investigating osteoporosis in Native American adolescents. Only
individuals 18 years of age or older will be allowed to participate in this study, thereby
precluding any further discussion of Native American adolescents with osteoporosis in this
dissertation.

39
Osteoporosis in Nez Perce Tribal Members Compared to Other Native Americans
The Nez Perce Tribe has been understudied in regards to osteoporosis incidence, prevalence,
and severity within the tribe. The purpose of this dissertation is to rectify this scenario. The
Medical Director of the Nez Perce Tribe wishes for this osteoporosis study to be conducted and
members of the Nez Perce Tribe and local non-tribal residents of Nez Perce County, Idaho have
a personal interest in being scanned for osteoporosis and finding treatment options. Even though
osteoporosis is not an immediate life threatening illness, it can still lead to greatly diminished
quality of life and increased morbidity due to fractures.
According to Gehrig (2010), “According to the U.S. Census Bureau (2008 data), an estimated
4.9 million American Indians and Alaska Natives (AI/AN) live in the United States. Information
on hip fracture prevalence among AIAN population is limited and relies on a few studies
conducted during the past 20 years. These studies seem to indicate that disparities exist and that
they may be increasing” (http://www.aaos.org/news/aaosnow/jan 10/research4.asp).
Knowledge about disparities regarding health care provision and outcomes in Native
American populations is relatively well known (Wietor, 2003) but obtaining more information
about the use of the Expanded Health Belief Model (EHBM) to examine Nez Perce Tribal
members understanding about osteoporosis, osteoporosis testing methodologies and participation
in a voluntary osteoporosis screening program will be examined in this dissertation.
Nez Perce County, ID
The 2013 population estimate for Nez Perce County, ID is 39, 531 individuals. Caucasians
make up 90.3% of the population, Native Americans make up 5.9% of the population, and
Native Hawaiian and other Pacific Islanders makes up 0.1% of the population in Nez Perce

40
County, ID. The land area of the Nez Perce Tribal reservations in Lapwai and Kamiah, ID,
respectively total 848.09 square miles, with 46.3 individuals per square mile. Female population
is 50.5%, or 20, 157 individuals. Male population is 49.5%, or 19, 757 individuals. Per capita
income in 2012 was $24, 130. Median household income in 2012 was $45, 587. Persons below
the poverty line in 2012 was 11.6%. (Retrieved August 19, 2014 from
http://quickfacts.census.gov/qfd/)
Lapwai, ID
According to the U.S. Census Bureau (2014), the population in Lapwai, ID was 3,499
individuals. Males made up 48.6% of the population and females made up 51.4% of the
population. Caucasians made up 21.8% of the population and Nez Perce tribal members made up
45.9% of the population. Per capita income in 2012 was $14, 509. Median household income in
2012 was $36, 723. Percentage of people below the poverty line in 2012 was 22.5%. (Retrieved
August 18, 2014, from http://www.city.data.com/city/Lapwai-Idaho.html).
Nez Perce Tribal Culture
The Nez Perce Tribe are currently based in Lapwai and Kamiah, ID respectively, but
historically Nez Perce lands stretched from “…Southeastern Washington, Northeastern Oregon
with usual and accustomed areas in Western Montana and Wyoming. The Nimiipuu aboriginal
territory was approximately 17 million acres or approximately 70 thousand square kilometers or
27 thousand square miles; including the Clearwater River Basin, the South and Middle Forks of
the Salmon River Basin and their tributaries”(Accessed on 01/30/2011 from
www.nezperce.org/history/nimiipuu.htm.)

41
The French term nays piers (those with pierced noses), or in English, Nez Perce, was used to
describe the Nimiipuu by a French interpreter for Lewis and Clark during their 1804-1806 cross
country western expedition. This name stuck even though the cultural practice of nose piercing
was not routinely practiced by the Nimiipuu (Accessed on January 28, 2011 from
http://www.mnsu.edu/emusuem/cultural/northamerica/nez_perce.html ). Nimiipuu is the Native
American word that members of the Nez Perce Tribe used to describe themselves. Loosely
translated, it means “real people” or “we the people” (Accessed on 01/30/2011 from,
www.nezperce.org/history/nimiipuu.htm)
The Nimiipuu were hunters and gatherers and primarily lived in “…tule mat covered, double
lean to long houses” (Accessed on 01/28/2011 from www.nezperce.org/history/nimiipuu.htm ).
Nimiipuu primarily subsisted on game, Salmon, roots, berries and a root called khouse. The
food eaten changes with the seasons and the Nimiipuu moved through various parts of their
territory with each changing season in order to maximize food security for the tribe. “The basic
roots gathered for winter storage included camas bulb (kehmmes), bitterroot (thlee-than), khouse
(qawas), wild carrots (tsaweetkh), wild potato (keh-keet), and other root crops” (Accessed on
01/30/2011 from www.nezperce.org/history/nimiipuu.htmp ).
“Large game animals that were hunted include deer, elk, moose, bear (black, brown, and
grizzly), mountain sheep and goats” [and] “today, deer, elk, and salmon are still important foods
for the Nimiipuu, but they are no longer our only foods. We also frequent restaurants and eat
modern foods (TV dinners, microwave dishes, canned foods…)” (Accessed on 01/30/2011 from
www.nezperce.org/history/nimiipuu.htmp ).

42
The diet of the Nimiipuu changes after European conquest and particularly at the end of the
Nez Perce War on October 5, 1877, when Chief Joseph, leader of the Nez Perce, surrendered to
U.S. Calvary forces and vowed …” I will fight no more forever” (Accessed on 01/30/2011 from
www.nezperce.org/history/nimiipuu.htmp ).
As the diet of the Nimiipuu changed and became more westernized over the years, and as
exercise activities diminished with a lack of travel over their territorial lands, many Nez Perce
Tribal members adopted modern conveniences and a sedentary lifestyle. Lack of exercise and
adoption of a non-Native, nutrient poor, calorie rich diet has led to increased obesity, diabetes,
and cardiovascular disease among many Native Americans including some members of the Nez
Perce Tribe.
This change in diet and diminished exercise capacity may have a negative impact on bone
density in members of the Nez Perce Tribe. It is possible that there may be diminished bone
density in some members of the Nez Perce Tribe, thereby increasing the incidence, prevalence
and severity of osteoporosis in this Native American group.
Socioeconomic Status of the Nez Perce Tribe
Members of the Nez Perce Tribe do have a sovereign form of tribal government, but their
socioeconomic status is one of poverty. The tribal base is in Lapwai, ID and Kamiah, ID
respectively. Both of these locations are small towns that are relatively isolated within the
Northern to Mid-Idaho region. Socioeconomic depression of members of the Nez Perce Tribe
involves restricted access to public transportation, and the inability to afford a car. There is bus
transportation for members of the tribe from Lapwai to the nearby Nez Perce Tribal casino and to

43
Lewiston, ID and Clarkston, WA, 12 and 15 miles away, respectively, for shopping and
healthcare services.
Members of the tribe have tribal health care services paid for by the Indian Health Service
(IHS) of Portland, OR, but such services are only paid for if treatment is given at a designated
Native American clinic. Osteoporosis testing is not paid by IHS unless a physician, nurse
practitioner, or physician assistant employed by the clinic orders it and can justify the order,
which occurs only if the individual is already diagnosed with osteoporosis and is also a female
60 years of age (YOA) or older. Other osteoporosis screening services would have to be paid
from a grant or via other means.
Difference between Osteoporosis Research in Native Americans as Compared to Non-
Natives
As indicated previously, there is very little osteoporosis research that has been done with
Native Americans as compared to other races and ethnicities. Reasons for this may be cultural,
socioeconomic, and limited access to osteoporosis testing facilities near or on the reservation.
According to Gehrig (2010), “controlled studies looking at hip fracture in the American Indian
and Alaskan American (AIAN) population are still in their infancy” [and]” uncovering the
prevalence of osteoporosis, hip fracture rate, and any unique characteristics or comorbidities
(such as diet, lifestyle, and effect of latitude) that affect bone metabolism and fracture risk would
enhance cultural competency within this population” (Accessed from the web on 03/01/2013 at
http://www.aaos.org/news/aaosnow/jan 10/research4.asp

44
Detection of Osteoporosis in Native Americans and Non-Native Americans
According to Bonnick (1998), “Two of the most common applications for bone densitometry
today are in the diagnosis of osteoporosis and the assessment of fracture risk. These applications
depend on comparisons of the absolute BMD to the reference data bases that are supplied by the
manufacturers of bone densitometry equipment” (Bonnick, 1998, p. 184).
Bonnick (1998) indicates that “it is logistically impossible to have every member of a
population in a given country undergo bone-density measurements in order to create a reference
database. Therefore, a sample of the population is studied to create this reference population.
From that sample, the average BMD value for the young adult, and for each age group, can be
calculated” [and]” fracture risk for an individual patient can then be calculated, based on the
knowledge of the number of SD’s below the peak young-adult BMD that the patients BMD lies”
(Bonnick, 1998, p. 184).
The problem is that the reference data bases for the young adults that everyone is compared to
in order to assess bone density does not include a statistically significant number of Native
Americans. NHANES III data was used, with a collection of data from “71,116 men and women
aged 20 and older, with a total of 3217 non-Hispanic whites, 1831 non-Hispanic Blacks and
1840 Mexican-Americans in this study population” (Bonnick, 1998, p. 186).
Although all three major U.S. manufacturers of DXA equipment contain extensive databases
of reference data, there is a paucity of Native American data. This can obviously influence scan
results and ultimately diagnosis and treatment of Native Americans for osteoporosis. This
dissertation involves collecting and analyzing osteoporosis survey data, but future research may
45
involve collection of DXA and QUS data from members of the Nez Perce Tribe that could then
be put into manufacturers DXA and QUS reference databases.
Osteoporosis Detection Technologies
For osteoporosis to be effectively treated, it must first be diagnosed properly. Imaging
technologies that are readily available, cost effective, and use no ionizing or minimal to moderate
ionizing radiation include quantified ultrasound (QUS) and dual–energy x-ray absorptiometry
(DXA).
The benefits of using QUS and DXA to detect osteoporosis stems from the following:
• Clinical history is an important reason for osteoporosis testing.
• Value of bone mass measurement /bone concentration in relationship to osteoporosis.
• Value of DXA testing for osteoporosis testing.
• Bone mass measurement can help predict future fracture risk.
The aforementioned technologies are accurate, reproducible and are superior to standard
radiographic imaging methods in detecting osteoporosis is various populations. In addition, these
Technologies are reimbursable by third party payers. Common osteoporosis testing methods,
amounts of radiation, and anatomic areas evaluated are indicated in Table 7.

46
Table 7
Imaging Methods to Detect Osteoporosis, Radiation Type, Dose and Location
Methods (Machine Type)
Radiation Type Radiation Dose (Millisieverts) (mSv)
Area of Body
Dual Energy X-Ray Absorptiometry (DXA)
X-Ray (Ionizing)
<0.1 mSv PA Spine Femoral Neck Total Hip Forearm
Single X-Ray Absorptiometry/Dual Energy X-Ray Absorptiometry (SXA)/(DXA)
X-Ray (ionizing)
<0.1 mSv Heel or wrist
Radiographic Absorptiometry X-Ray (ionizing)
<0.1 mSv Heel or wrist
QCT CT (ionizing) 0.1-1 mSv L-Spine Proximal Femur
pQCT CT (ionizing) <0.1 mSv Forearm
X-Ray
X-Ray (ionizing)
1-10 mSv
Spine or Hips
QUS
Ultrasound (non-ionizing)
None
Calcaneus (Heel)
(Source: Adapted from the American College of Radiology (ACR) 2012 & Radiologic Society of North America (RSNA) 2012 & Gemalmaz, Disagil & Ceylan, 2007).
Of the above osteoporosis testing methods, only QUS and DXA will be explored in further
detail because the portability, cost, ready availability and the use of non-ionizing and ionizing
radiation has allowed QUS and DXA to become the primary imaging methods used to detect
osteoporosis.

47
Quantitative Ultrasound (QUS)
Advantages of QUS as compared to bone densitometry detection technologies is that it is 1)
portable, 2) is non-ionizing and 3) is less costly to the patient, and 4) anyone can be properly
trained to operate this device in about 1 hour. Non-ionizing means that the ultrasound energy used
in QUS is unable to strip the orbital electrons away from the tissues of a patient’s body. According
to Hans & Krieg (2008) “Quantitative ultrasound (QUS) appears to be developing into an
acceptable, low cost and readily accessible alternative to dual x-ray absorptiometry (DXA)
measurements of bone mineral density (BMD) in the detection and management of osteoporosis.
Hans and Krieg further state that “Likely, QUS is most effective when combined with an
assessment of clinical risk factors (CRF); with DXA reserved for individuals who are not identified
as either low or high risk using QUS and CRF” (Hans & Krieg, 2008, p. s25-s26).
Dual Energy X-Ray Absorptiometry (DXA)
Dual energy x-ray absorptiometry (DXA) works using two different energy levels of x-rays a
set of detectors and a scanning arm that “sweeps” over the patient and can be used to scan the
total spine, lumbar spine, pelvis, bilateral hips and total body. DXA can distinguish x-ray
attenuation variations of different tissues such as bone, adipose tissue and muscle tissue, thereby
making it useful not just in detecting bone density but also in detecting the amount and density of
adipose and muscle tissue in any individual. DXA x-ray energy can potentially remove electrons
from the valence orbit of patient’s tissues being scanned, but in general, exposure levels are so
low with DXA that the technologist operating the unit does not have to monitor the radiation
exposure from the device. Table 7, which was previously shown, demonstrates the different
types and levels of energy used in bone densitometry.
48
In DXA, low energy x-ray photon (i.e.: 30-50 keV) absorption is subtracted from high
energy (i.e.: 70 keV) absorption by the DXA computer to form an isolated bone profile (Wilson,
2003, p. 21). The scan data from each patient is compared to the database of similar patients and
a standard normal patient, which results in calculated T and Z scores respectively (Wilson, 2003,
18).
Comparison of QUS T Scores and DXA T Scores
According to a study conducted by Gemalmaz, Discigil and Ceylan in 2007, “of 116
postmenopausal women according to DXA measurements, 34.5% of the women [in this study]
were considered osteoporotic and 49.1 % osteopenic. There were weak-moderate positive
correlations between QUS measurements and DXA T scores of lumbar spines and femoral necks
(r=0.231 and r=0.286, respectively, P <0.05). Using DXA as the gold standard, the cut-off value
of QUS T-Scores was -2.2 with 77.5% sensitivity and 50% specificity for osteoporosis”
(Gemalmaz, Discigil, & Ceylan, 2007, p. 303-309). Gemalmaz, Discigil & Ceylan’s research
indicates that prospective QUS cut off scores that correlate to DXA t-scores is statistically and
scientifically supported.
Use of T Scores in DXA Analysis
A T score can be defined as “a type of standard score that relies upon the mean value and the
standard deviation (SD) for a set of numerical data” (Bonnick, 1998, p. 69. “T scores are
standard scores with a mean of 50 and a standard deviation of 10” (Glass and Hopkins, 1996, p.
87). When an individual ‘s bone mineral density (BMD) is compared to the mean BMD score in
a young healthy population in the following manner;
Patients BMD - Young Normal Mean /Standard Deviation of Young Normal Mean
49
This standard deviation measurement is referred to as a T score. The T Score is calculated
using the following formula: (U.S. Department of Health and Human Services Bone Health and
Osteoporosis: A Report of the Surgeon General, 2004, p. 204).
t = [ − μ]/[/ () ]
t= t score
= mean sample mean
µ = population mean
s= standard deviation of sample
Sqrt= square root
N= sample size
T- scores are used in osteoporosis research because “any individual tested for osteoporosis
can, from a statistical perspective, fit on a normally distributed, symmetrical, unimodal, bell
shaped curve for comparison purposes (Glass and Hopkins, 1996, p. 95).Osteoporosis cut off T
scores for QUS is -1 SD or below for osteoporosis and the DXA T score ranges are BMD above
-1.0 standard deviation (SD) below young normal’s (normal range), BMD -1.0 to -2.5 below
young normal’s (osteopenic range), a BMD below -2.5 below young normal’s (osteoporotic
range) (Eisenberg & Johnson, 2003, p. 108) and established osteoporosis (osteoporosis with
existing fractures) per the World Health Organization
(www.who.int/entity/chp/topics/osteoporosis.pdf).
Even though T scores from QUS and DXA units can be compared clinically, it is critical to
note however that a T score derived from QUS data is not the same as a T score derived via the

50
use of DXA. This makes equivalent comparisons of T scores with different technologies
difficult. In fact, it is suggested by Wilson and others that comparison of T scores obtained with
different machines, machine model numbers or different technologies should not be done from a
scientific and statistical perspective (Wilson, 2003, p. 64). In spite of this recommendation, it is
still possible to use T scores garnered from different technologies as independent T score
measurements to accurately predict fracture risk due to osteoporosis in certain populations. In
other words, the QUS stiffness index and/or T Score and the DXA T score can be utilized by a
physician, in conjunction with other clinical risk factors, to provide a comprehensive skeletal
assessment (General Electric, 2004).
Z Scores and Osteoporosis Screening
Z scores are also used in osteoporosis testing. A z score can be defined as a measure of how
many standard deviations units away from the mean a particular value of data lies (Accessed
from the Web on 02/19/10 at: www.en.wiktionary.org/wiki/Z.score
The formula for a Z score is shown below:
z = x- µ/σ
z= Z score
x= raw score to be standardized
µ= mean of the population
σ= standard deviation of the population

51
In osteoporosis DXA testing, a Z score is a comparison of your score to someone else of the
same age, weight, ethnicity and gender. According to the ISCD, “Z scores are used when
evaluating premenopausal women and children for osteoporosis, and furthermore, the term
osteoporosis is not to be used in diagnosing children, “since the WHO criteria do not apply to
them” (Bone Health and Osteoporosis: A Report of the Surgeon General, 2004, Chap 8, p. 206).
A Z score is an observation [score] expressed in standard deviation units from the mean” [and]
“a z score tells us how many standard deviations the given score is above or below the mean”
(Glass and Hopkins, 1996, p. 83). Calculation of a z score from an osteoporosis perspective is as
follows: Z score= (patient’s BMD-expected BMD)/SD from the mean for matched individuals
(i.e.: age, gender and ethnicity). (Ott, S. Osteoporosis and Bone Physiology. Accessed from the
web on 12/02/09 at: http://courses.washington.edu/bonephys/opbmd.html.
“Z scores are not used for diagnosis because a person’s Z scores can remain constant
throughout life, even as BMD declines with age. However, the Z score is useful in determining
how an individual’s BMD compares with what is expected for a person of a given age and body
size” (Bone Health and Osteoporosis- A Report of the Surgeon General, 2004, p. 204, Chap. 8).
“Z scores are also useful in children to determine how their bone density compares to that of
their peers. Since they have not reached adult peak bone mass, T-scores should not be used for
children “(Bone Health and Osteoporosis-A Report of the Surgeon General, 2004, Chap 8, p.
204).
T and Z Scores in DXA Databases
Of note is the fact that T and Z scores for Caucasian women are found in the DXA machine
databases as the standard comparison model. This may introduce problems reliability and
52
validity concerning comparison of stored Caucasian female data with that of Nez Perce tribal
members (i.e.: men and women). One possible resolution to this statistical dilemma is the fact
that a Canadian panel of the ISCD “has developed guidelines for the diagnosis of osteoporosis in
men, premenopausal women, and children (Kahn et al. 2004). “This panel recommended that
BMD measurements be used only in patients with fragility fractures or major secondary causes
of bone loss. The panel also recommends that Z-scores, not T-scores, be used in children and
pre-menopausal women” (Bone Health and Osteoporosis; A Report of the Surgeon general,
2004, Chap 8, p. 206).
Bone Mineral Density and Bone Mass
Although a DXA scan is used to diagnostically confirm osteoporosis from an imaging
perspective, the DXA results should be used in tandem with other clinical indicators to actually
determine if a person is osteoporotic. The DXA unit uses x-rays to estimate bone mineral density
(BMD). Bone density can be defined as “the amount of bone tissue in a certain volume of bone
(g/cm 3). DXA units however usually express bone density in surface area rather than volume, or
(g/cm2)” (Accessed from the web on 12/02/09 at:
http://hypertextbook.com/facts/2002/AnnaYarusskaya.shtml.) unlike QCT units, which
demonstrate bone density three dimensionally in the x, y and z planes.
“Bone mineral density (BMD) [tests] measures the amount of calcium in a special region of
bones. From this information, an estimate of the strength of the bones can be made. BMD helps
predict the risk of a future fracture of the bone, measures the amount of bone mass, and also can
be used to monitor the effectiveness of treatment “(Accessed from the web on 12/02/09 at:
http://hyperteextbook.com/facts/2002/AnnaYarusskaya.shtml.)

53
According to Lohman, “estimated total bone mineral density for males is 3.88 g/cm2 and for
females 2.909 g/cm2” (Lohman, T., 1992, p. 32) and according to Ott, “using standardized bone
density measurements of the total hip, “normal” bone is greater than 833 mg/cm2, “osteopenia is
between 833 and 648 mg/cm2, “osteoporosis” is lower than 648 mg/cm2 and “severe”
osteoporosis is when there has been a fragility fracture” (Ott, S. 2002)
It is worth noting however, that although osteoporotic bone is lacking in bone mass density, it
still retains standard matrix and mineralization levels similar to normal bone (Sheldon, et.al.,
1992). According to Mekary, “Bone strength primarily implies the combination of bone matrix
(quality) [and] bone density, which is expressed as grams of mineral per surface (g/cm2) (i.e.:
DXA) or volume (g/cm3) (i.e.: QCT) (Mekary, 2005). In addition, as previously indicated, “The
World Health Organization (WHO) operationally defines osteoporosis as bone density 2.5 S.D.’s
(standard deviation as expressed via T scores) below the mean for young white adult women
(Mekary, 2005). T scores of Caucasian women is used because of the availability of T score data
and represents mean value of young adults at of the same gender at peak bone mass (Mekary,
2005).
Treating Osteoporosis
Use of Prescription Medications to Prevent or Treat Osteoporosis
Antiresorptive medications are used to prevent or treat osteoporosis. The way in which these
medications work is that they “inhibit bone loss rather than stimulate new bone formation”
(Bonnick, 2002, p.236).

54
Types of FDA approved antiresorptive osteoporosis medications include the following:
• Raloxifene (Evista)
• Calcitonin (Miacalcin)
Raloxifene (Evista)
Raloxifene was approved for use to prevent and treat osteoporosis in 1999. Compared to
their baseline bone density, women receiving 60 mg of raloxifene/day had an increase of
approximately 3% at the PA lumbar spine and 1% at the femoral neck. There was a 30%
reduction in the risk of new spine fractures in these women over the course of the 3-year
study” (Bonnick, 2002, p. 237).
Calcitonin (Miacalcin)
In the Prevent Recurrence of Osteoporotic Fractures (PROOF) 5-year study, “the women
receiving 200 I.U. of synthetic salmon calcitonin nasal spray had a 33% reduction in the risk
of new spine fractures” (Bonnick, 2002, p. 237).
Bisphosphonates
Bisphosphonates are the type of drug that helps prevent bone loss and are used to treat
osteoporosis and other diseases. Types of bisphosphonates include Alendronate (Fosamax),
risendronate (Actonel), and ibandronate (Boniva).
Alendronate (Fosamax)
According to Bonnick, “Alendronate is approved for the prevention and treatment of
osteoporosis in women as well as for the treatment of osteoporosis in men” (Bonnick, 2002,

55
p. 238). “In the 3-year Fracture Intervention Trial (FIT), women receiving 10 mg of
alendronate daily had a 51% reduction in the risk of hip fractures. Bone density at the PA
lumbar spine increased by more than 8% and at the femoral neck by approximately 3%
compared with baseline in women receiving alendronate over the 3-year study period”
(Bonnick, 2002, p. 238). “In a 2-year study of 241 men with osteoporosis, alendronate
administered at a dose of10 mg/day resulted in significant increases in bone density at the
spine and hip. The average increase from baseline at the PA lumbar spine was 7.1% and at
the femoral neck, 2.5%” (Bonnick, 2002, p. 239).
Risendronate (Actonel)
According to Bonnick, ‘the efficacy of risendronate in reducing spine fracture risk has
been demonstrated in two large clinical trials, collectively called the VERT trials. Both of
these trials were 3 year studies involving several thousand women with preexisting spine
fractures. In the U.S. trial, women who received 5 mg of risendronate had a 41% reduction in
the risk of new spine fracture. Bone density increased at the lumbar spine by 5.2% and at the
femoral neck by 1.6% compared with baseline over the 3-year study” (Bonnick, 2002, p.
239)
Boniva
Boniva is the trade name for a generic type of osteoporosis prevention/treatment
medication known chemically as ibandronate, a type of bisphosphonate. Bisphosphonate is a
medication that alters bone formation and breakdown in the body so that bone loss is
diminished and bone mass development is increased. Boniva is an injectable drug commonly
taken every three months, and for some individuals once a year.

56
The injectable form is for individuals whom are unable to take the drug orally. Oral
administration of Boniva can result in esophageal ulcers. An individual taking Boniva orally
must be able to sit upright or stand for at least 1 hour after taking this medication. Because of
this, many providers and patients prefer the injectable form.
Non-Clinical Methods for Treating Osteoporosis
A variety of dietary, pharmacological, and physiological methods/treatments for osteoporosis
are available to anyone who thinks they may be susceptible or have been clinically diagnosed
with osteoporosis. It is important to remember that each individual is ultimately responsible for
their own health and in consultation with a healthcare provider can lead to an effective treatment
plan that may involve beneficial changes in diet, exercise and vitamin use that may help prevent,
mitigate or treat osteoporosis. Table 8 shows types of foods that in the right amount may prevent
or mitigate osteoporosis.
Table 8
Foods Important in Preventing Osteoporosis
Essential Fatty Acids Nuts and seeds, dark green, leafy vegetables and oily fish (i.e.: mackerel, salmon, etc.)
Helps protein synthesis.
Fiber Nuts and seeds, complex carbohydrates, bran.
Allows for absorption of vitamins & minerals to prevent osteoporosis.
Saturated Fats Peanut Butter, oils, butter Helps with absorption of fat soluble vitamins A, D and E to help prevent osteoporosis.
Protein Meat, cereals, milk, fruits, vegetables, fish and eggs
Protein helps form the framework on which calcium and other salts are deposited.
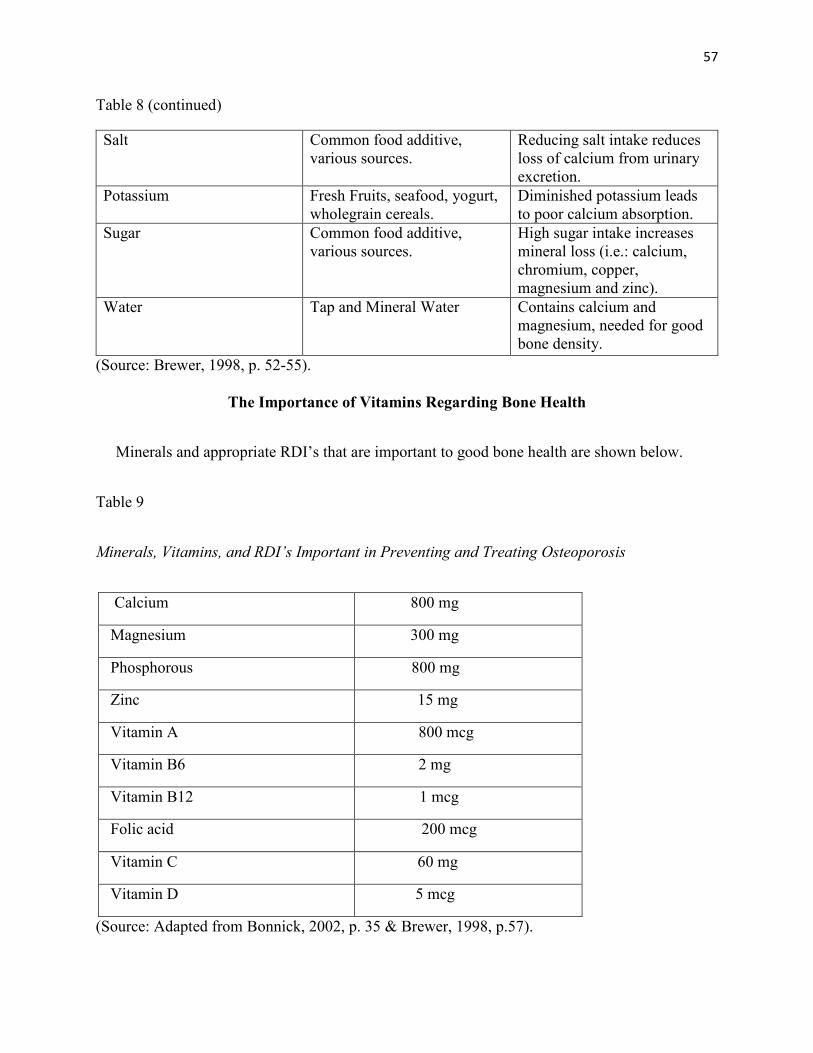
57
Table 8 (continued)
Salt Common food additive, various sources.
Reducing salt intake reduces loss of calcium from urinary excretion.
Potassium Fresh Fruits, seafood, yogurt, wholegrain cereals.
Diminished potassium leads to poor calcium absorption.
Sugar Common food additive, various sources.
High sugar intake increases mineral loss (i.e.: calcium, chromium, copper, magnesium and zinc).
Water Tap and Mineral Water Contains calcium and magnesium, needed for good bone density.
(Source: Brewer, 1998, p. 52-55).
The Importance of Vitamins Regarding Bone Health
Minerals and appropriate RDI’s that are important to good bone health are shown below.
Table 9
Minerals, Vitamins, and RDI’s Important in Preventing and Treating Osteoporosis
Calcium 800 mg
Magnesium 300 mg
Phosphorous 800 mg
Zinc 15 mg
Vitamin A 800 mcg
Vitamin B6 2 mg
Vitamin B12 1 mcg
Folic acid 200 mcg
Vitamin C 60 mg
Vitamin D 5 mcg
(Source: Adapted from Bonnick, 2002, p. 35 & Brewer, 1998, p.57).

58
Calcium is essential for bone health. Table 10 demonstrates RDI for calcium for individual of
different ages.
Table 10
Recommend Calcium Intake
Adolescents/Adults (both sexes) Recommended Calcium Intake (mg)
9-18 1300
19-50 1000
51 + 1200
Pregnant or nursing women 1300
(Source: Bonnick, 2002, p. 234).
According to Bonnick, “Over the counter calcium supplements are an acceptable means of
supplementing dietary calcium to ensure that the intake goals are met” (Bonnick, 2002, p. 234),
and “Calcium fortified foods and beverages are also useful in increasing dietary calcium intake”
(Bonnick, 2002, p. 234).
Health Behavior Models and Osteoporosis
Important health education/health promotion models such as the Theory of Reasoned Action,
Theory of Planned Behavior, Social Cognitive Theory, and Transtheoretical/Stages of Change
models will not be discussed in this prospectus since the EHBM is the model of choice for
completion of this dissertation.

59
Expanded Health Belief Model and Osteoporosis
My rationale for the use of the Expanded Health Belief Model as compared to other health
behavior models is based on the following premises:
1) Familiarity with the EHBM.
2) Historical context of the EHBM.
3) Cross applicability of the EHBM to a variety of health processes.
4) Utility of the EHBM.
5) Belief that the EHBM is better suited to this dissertation research than the HBM because
of the self-efficacy component found in the EHBM model.
Before discussing the expanded health belief model in detail, it is appropriate to discuss the
health belief model more thoroughly, since it is the foundational model that the EHBM is based
upon.
Health Belief Model
The Health Belief Model (HBM) is a foundational model of health education. The HBM was
developed by Godfrey Hochbaum, Stephen Kegels and Irwin Rosenstock, three health
psychologists working for the U.S. Department of Public Health in the 1950’s. This research
came about when these health psychologists wanted to determine why certain people willingly
got tested for Tuberculosis via portable chest radiography and why others did not choose to get
tested for TB via portable chest radiography (Glanz, 2002).

60
Expanded Health Belief Model
The Expanded Health Belief Model (EHBM) has the HBM as its foundation, but with the
addition of self-efficacy as proposed by Bandura in 1977 (Wallace, 2002, p. 164). The EHBM
served as the behavioral model used by Katherine K. Kim, Mary L. Horan, Phyllis Gendler, and
Mini K. Patel, nursing professors and researchers at Grand Valley State University in Allendale,
MI to develop the Osteoporosis Health Belief Scale (OHBS). According to the aforementioned
researchers, “The Osteoporosis Health Belief Scale (OHBS) was developed to measure health
beliefs related to osteoporosis” (Kim, 1991, p. 155).
The authors also state that “…knowledge and skills gained from health education do not
always translate into subsequent health behaviors. Therefore, it is important to consider the
influence of psychological variables in effecting behavior change” [and] “…the purpose of this
study was to develop and test an instrument designed to measure personal attitudes and beliefs
related to the potential for developing osteoporosis”(Kim, 1991, p. 156).The instrument that
these researchers developed consisted of two additional risk reduction behaviors; the barriers and
benefits related to calcium intake and those related to physical exercise” (Kim, 1991, p. 157). Of
this modification to the HBM, these two scales contained “…seven subscales; three of which are
common to both the OHB Calcium and Exercise scales, two that that relate only to OHB calcium
and two that relate only to OHB exercise” (Kim, 1991, p. 159). The addition of these two
measurements in the HBM helps “…demonstrate the importance of health motivation in
influencing health related behavior” (Kim, 1991, p. 161).
According to the authors, “The results of this study demonstrate the importance of health
motivation in influencing health related behaviors” (Kim, 1991, p. 161). Additionally, “The

61
authors encourage further use and revision of the instrument. Consideration should be given to
the inclusion of self-efficacy as an additional dimension” (Kim, 1991, p. 161-162).
Use of the Osteoporosis Health Belief Scale and the Expanded Health Belief Model, which
includes self-efficacy as proposed by Bandura in 1977 (Wallace, 2002, p. 163-172) is the key
underlying behavioral model that will be used for this dissertation. Researchers such as Kim,
K.et. al, (1991), who developed the Osteoporosis Health Belief Scale in 1991 have been using
the EHBM for years to investigate osteoporosis in women and men, Hispanic women and men
and Native American women and men. Wallace (2002) conducted research regarding
osteoporosis prevention in college women using the EHBM and Nicholas, J.S., & Chen, Z.
(2002) described osteoporosis in Native Americans. Hazavehei, S.M., Taghdisi, M.H., and Saidi,
M., (2007) examined application of the HBM to osteoporosis prevention in middle school girls in
Garmsar, Iran and Turner, L.W., et al. (2004) used the HBM to design and implement an
osteoporosis prevention program for women using the HBM.
In essence, the HBM and the EHBM has been one of the most widely used health behavior
models in the social sciences and has been used to study the likelihood of women conducting
breast self-exams, individuals choosing to quit smoking and drinking, and osteoporosis
prevention among junior high, high school and college aged women, among a long list of other
health related behaviors.
Literature Review Summary
The literature search was conducted using online databases. Some journal article and textbook
searches were conducted physically in person at the SIUC library, University of Idaho library,
Idaho State University library, and the Lewis-Clark State College library. The electronic

62
database search was conducted using key words such as osteoporosis, BMD, bone density, DXA,
QCT, QUS, t scores and z scores, Nez Perce Tribe, Nimiipuu, Nez Perce County, ID, Lapwai, ID
Health Belief Model (HBM), Expanded Health Belief Model (EHBM) and osteoporosis in native
Americans. Relevant literature was collected, evaluated and presented in Chap 2.
The WHO definition of osteoporosis was selected as the most appropriate with the most
utility for this study. Examination of individuals most susceptible to osteoporosis was discussed,
symptoms of osteoporosis, t and z scores, and the prevention of osteoporosis was discussed.
Medications, diets and exercise was evaluated as to their ability to treat and prevent osteoporosis.
Examination of Native American and Nez Perce Tribal culture was evaluated as compared to
Caucasian culture in Nez Perce County, ID. Use of the HBM and EHBM, OKT, OHBS and
OSES instruments were examined for validity and reliability and utility for use in this
dissertation. Evaluation of the research script, survey questionnaires, statistical tests, were
discussed in detail as they related to this study.

63
CHAPTER 3
METHODS
Overview
This chapter provides a detailed overview of the methods used in this study including purpose
of the study, null hypothesis, research hypothesis, research questions, research design, dependent
variables, independent variables, Expanded Health Belief Model (EHBM) theory, survey
responses, study instrument reliability and validity, recruitment of subjects, administration of
survey, data collection procedures, study consent, statistical analysis and technique, sample size,
confidence level, confidence interval, survey completion, volunteer notification, collaboration,
protection of privacy and confidentiality, benefit and risk dichotomy, and summary.
Purpose of Study
The purpose of this study is to implement an EHBM based written survey to determine if there
is a difference in osteoporosis attitudes, knowledge, beliefs and self-efficacy among Nez Perce
Tribal members, male and female, age 18 and older as compared to non-Nez Perce Tribal
members residing in Nez Perce County, ID.
Null Hypothesis
There is not a difference in osteoporosis knowledge, attitudes, beliefs, and self-efficacy
among Nez Perce Tribal members and non-Nez Perce Tribal members, male and female, aged 18
and older residing in Nez Perce County, ID as evidenced by completion of the EHBM based
osteoporosis survey instruments.
H0: Native American = Non-Native American

64
Research Hypothesis
There is a difference in osteoporosis knowledge, attitudes, beliefs, and self-efficacy among
Nez Perce Tribal members and non-Nez Perce Tribal members, male and female, aged 18
and older residing in Nez Perce County, ID as evidenced by completion of the EHBM based
osteoporosis survey instruments.
H1: Native American ≠ Non-Native American
Research Questions
This study sought to answer the following research questions:
1. What do Nez Perce Tribal members and non-Nez Perce Tribal members know about
osteoporosis?
2. Is there a statistically significant difference in osteoporosis knowledge, attitudes, beliefs and
self-efficacy among Nez Perce Tribal members and non Nez Perce Tribal members, male and
female, aged 18 and over residing in Nez Perce County, ID as evidenced by completion of an
EHBM based osteoporosis survey instrument?
3. Does ethnicity have an effect on Nez Perce Tribal and non Nez Perce Tribal member’s
knowledge, attitudes, beliefs and self-efficacy regarding osteoporosis?
4. Does gender have an effect on Nez Perce Tribal and non Nez Perce Tribal member’s
knowledge, attitudes, beliefs and self-efficacy regarding osteoporosis?
5. Does age have an effect on Nez Perce Tribal and non Nez Perce Tribal member’s knowledge,
attitudes, beliefs and self- efficacy regarding osteoporosis?
6. Do Nez Perce Tribal members and non Nez Perce Tribal members understand the relationship
between nutrition and osteoporosis?

65
7. Do Nez Perce Tribal members and non Nez Perce Tribal members understand the relationship
between exercise and osteoporosis?
Research Design
The study design for this dissertation research project was partially based upon the EHBM
described in detail in Fig. 1, the work of Kim, Horan, Gendler, & Patel, and the social science
research paradigm found in Appendix 1 (Babbie, 1992, p. 104). The study was a quantitative,
cross-sectional descriptive study involving evaluation of written survey data regarding
osteoporosis attitudes, knowledge, beliefs and self-efficacy (Issac & Michael, 1997). The written
survey was administered in person by the primary investigator (PI) to all participants and
involved a standard paper and pencil format. Advantages of the written survey involve low cost,
ease of administration, and the ability for the PI to answer participant questions on-site. The
written survey instruments are based on the EHBM. The survey instruments used were the 1)
Osteoporosis Knowledge Test (OKT), the 2) Osteoporosis Health Belief Scale (OHBS) and the
3) Osteoporosis Self-Efficacy Scale (OSES).
The theoretical health behavior model that all three survey instruments used in this study is
based upon is the Expanded Health Belief Model (EHBM). The constructs of the EHBM in this
study includes susceptibility, which refers to the perceived risk of developing osteoporosis,
seriousness, which is the perception of threat from having osteoporosis, including harmful
consequences in relation to personal physical health, role and social status, and the ability to
complete activities of daily living (ADL’s). Benefits focus on the belief in the effectiveness of
specific behaviors to prevent the occurrence of osteoporosis. Barriers are the beliefs about
negative components in the behaviors which would be undertaken to prevent the disease. Health

66
motivation relates to a general tendency for an individual to engage in health behaviors. Self -
efficacy is the belief that an individual can do something about preventing or getting diagnosed
and effectively treated for osteoporosis. The OHBS has a calcium subscale and an exercise
subscale. Fig 3 graphically demonstrates the relationship between the calcium and exercise
subscales as presented in the OHBS and as it relates to aspects of the EHBM.
OHBS Calcium Scale
Benefits-Calcium Intake
Barriers-Calcium Intake
EHBM Common Subscales
Susceptibility to Osteoporosis
Seriousness of Osteoporosis
Health Motivation
Self-Efficacy
OHBS Exercise Scale
Benefits-Exercise
Barriers-Exercise
Fig 3. Relationship between the Subscales and the EHBM
Independent and Dependent Variables
In the Chi Square, phi coefficient, Cramer’s V, Mann-Whitney U and Kruskall Wallis tests,
the dependent variables were knowledge of exercise, knowledge of nutrition, susceptibility to
osteoporosis, seriousness of osteoporosis, benefits of exercise, benefits of calcium, barriers to
exercise, barriers to calcium, self-efficacy for exercise, self-efficacy for calcium and health
motivation. Independent variables included age, ethnicity and gender.

67
In the hierarchical regression analysis (Table 37, p. 128), health motivation is the
dependent variable for all four models. The independent variables for each model
include the following:
Model 1: Age, gender, and ethnicity.
Model 2: Age, gender, ethnicity, knowledge of exercise, and knowledge of nutrition.
Model 3: Age, gender, ethnicity, knowledge of exercise, knowledge of nutrition,
susceptibility, seriousness, benefits of exercise, benefits of calcium, barriers to exercise,
and barriers to calcium
Model 4: Age, gender, ethnicity, knowledge of exercise, knowledge of nutrition,
susceptibility, seriousness, benefits of exercise, benefits of calcium, barriers to exercise,
barriers to calcium, self-efficacy for exercise, and self-efficacy for calcium
In the MANOVA (Table 38, p. 129), the dependent variables are knowledge of
exercise, knowledge of nutrition, susceptibility, seriousness, benefits of exercise,
benefits of calcium, barriers to exercise, barriers to calcium, self-efficacy for exercise,
and self-efficacy for calcium. The independent variables are gender, ethnicity, and the
interaction between gender/ethnicity were statistically significant, which meant that
further exploration of the interaction between gender/ethnicity on each of the
dependent variables was conducted because the MANOVA didn't specify exactly where
the interaction was occurring)

68
For the various two-way ANOVAs for the interaction of gender/ethnicity, the
dependent variables are knowledge of exercise, knowledge of nutrition, susceptibility,
seriousness, benefits of exercise, benefits of calcium, barriers to exercise, barriers to
calcium, self-efficacy for exercise, and self-efficacy for calcium. The independent
variables are gender and ethnicity with interaction effect.
For the single two-way ANOVA for the only significant effect of gender*ethnicity
on a dependent variable, the dependent variable is barriers to calcium and the
independent variable is gender and ethnicity with interaction effect.
Figure 5 on p.132 demonstrates shows the interaction for gender and ethnicity on the
dependent variable (i.e.: barriers to calcium).
Table 41 on p. 133 shows t-tests for simple main effects with the dependent variable
being barriers to calcium intake and the independent variables being (1) Native vs. non-
native American females, (2) Native vs. non-native American males, (3) Native
American females vs. Native American males and (4) Non-native American females vs.
non-native American males.
EHBM Theory and OHBS Survey Instruments
The EHBM has the Health Belief Model (HBM) as its foundation, but with the addition of
self-efficacy as proposed by Bandura in 1977 (Wallace, 2002, p. 164). The EHBM served as the
behavioral model used by Katherine K. Kim, Mary L. Horan, Phyllis Gendler, and Mini K. Patel,
nursing professors and researchers at Grand Valley State University in Allendale, MI to develop
the Osteoporosis Health Belief Scale (OHBS). According to the aforementioned researchers,

69
“The OHBS was developed to measure health beliefs related to osteoporosis” (Kim, 1991, p.
155). “The purpose of developing the OHBS was to develop and test an instrument designed to
measure personal attitudes and beliefs related to the potential for developing osteoporosis” (Kim,
1991, p. 156). The instrument that these researchers developed consisted of two additional risk
reduction behaviors; the barriers and benefits related to calcium intake and those related to
physical exercise” (Kim, 1991, p. 157). The addition of these two measurements in the HBM
helps “…demonstrate the importance of health motivation in influencing health related behavior”
(Kim, 1991, p. 161). Additionally, the authors encourage further use and revision of the
instrument and recommend inclusion of self-efficacy as an additional dimension (Kim, 1991).
Use of the OHBS and the EHBM, which includes self-efficacy as proposed by Bandura in
1977 (Wallace, 2002, p. 163-172) is the key underlying behavioral model that was used in this
dissertation research.
Fig 4 demonstrates the relationship between the EHBM, the OHBS instruments, and the research
questions used in this study.

70
Calcium Scales EHBM Common Subscales
Nutrition & Exercise
Exercise Scales
OKT (1-11) & (30-32)
Susceptibility to Osteoporosis
OHBS (1-6)
Research (1,2,3,4 & 5) Benefits-Calcium Intake
OHBS (19-24)
Research (6)
Benefits-Exercise
OHBS (13-18)
Research (7)
Seriousness of Osteoporosis
OHBS (7-12)
Research (1,2,3,4 & 5)
OKT (1-11) & (18-32)
OKT (1-17) & (30-32)
Barriers-Calcium Intake
OHBS (31-36)
Research (6)
Barriers-Exercise
OHBS (25-30)
Research (7)
Health Motivation
OHBS (37-42)
Research (1 & 2)
OSES Exercise (1-10)
Self-Efficacy
OSES Calcium (11-21)
Research (1,2,3,4 & 5)
Fig 4. EHBM Components, Survey Responses and Research Questions
71
Study Instrument Reliability (OKT/OHBS/OSES)
The instruments used in conducting survey research regarding osteoporosis attitudes,
knowledge, beliefs and self-efficacy of Nez Perce Tribal members as compared to Non Nez
Perce Tribal members is the Osteoporosis Knowledge Test (OKT), the Osteoporosis Health
Belief Scale (OHBS), and the Osteoporosis Self Efficacy Scale (OSES), developed by Katherine
Kim, PhD., Mary Horan, PhD., and Phyllis Gendler, PhD in 1991 at Grand Valley State
University in Grand Rapids, MI. These instruments were revised by Phyllis Gendler, PhD,
Cynthia Coviak, PhD, Jean Martin, PhD, and Katherine Kim, PhD in 2010 and 2011.
The OKT (revised in 2011) has two subscales: Osteoporosis Knowledge Test Nutrition (items
1-11 and 18-32) and Exercise (items 1-17 and 30-32). The OKT Nutrition (Revised 2011) and
OKT Exercise (Revised 2011) share 14 common items (items 1-11 and 30-32). The reliability
coefficients for internal consistency (KR 20) for the OKT (Revised 2011) are as follows: 0.849
for the total scale, 0.83 for the Nutrition subscale, and 0.81 for the Exercise subscale. Test-retest
analysis resulted in Pearson Correlation of 0.872. Validity of the OKT was evaluated by content
validity by a panel of HBM and Osteoporosis experts. Questions were examined for difficulty,
effectiveness of distracters and discrimination (Horan, Kim, Gendler, Froman & Patel, 1998).
The Osteoporosis Health Belief Scale (OHBS) has five subscales: the Susceptibility subscale,
(questions 1-6), the Seriousness subscale, (questions 7-12), the Benefits of Exercise subscale
(questions 13-18), the Benefits Calcium Intake subscale (questions 19-24), the Barriers to
Exercise subscale, (questions 25-30), the Barriers to Calcium Intake, (questions 31-36) and the
Health Motivation subscale, (questions 37-42) (Horan, Kim, Gendler, Froman & Patel, 1998).

72
The Osteoporosis Self-Efficacy Scale (OSES 21 items) has two sub scales: The Osteoporosis
Self-Efficacy Exercise Scale, which has 10 items (questions 1-10). The OSES Calcium Scale has
11 items (questions 11-21). Reliability coefficients for internal consistency (Cronbach alpha) of
both subscales are .90. Validity of the OSES was evaluated by factor analysis and discriminate
function analysis (Horan, Kim, Gendler, Froman & Patel, 1998).
Cronbach alpha (α) scores may range from negative infinity to 1, however only positive
values of α are generally used. Alpha coefficients are used to describe the reliability of factors
extracted from dichotomous variables (that is, questions with two possible answers) and/or scales
(i.e., rating scale: 1 = poor, 5 = excellent). Some statisticians insist on a reliability score of 0.70
or higher in order to demonstrate acceptable (fair) internal consistency (statistical reliability)
between variables (Retrieved on October 20, 2015, from https://explorable.com/crobachs-alpha).
Table 11 demonstrates the reliability coefficients for the OHBS Calcium Subscales and the
OHBS Exercise Subscales and Table 12 shows OSE Item Loading on Exercise and Calcium
Self-Efficacy Factors:

73
Table 11
Internal Consistency for the OHBS Subscales (Calcium and Exercise)
Subscale Number of Items Cronbach Alpha
Calcium
Cronbach Alpha
Exercise
Susceptibility 5 .80 .80
Seriousness 5 .65 .65
Health Motivation 5 .61 .61
Benefits 5 .68 .74
Barriers 5 .73 .72

74
Table 12
OSE Item Loading on Exercise and Calcium Self-Efficacy Factors
Item # Loading
Exercise Calcium
1. Begin a new or different exercise program .70
2. Change your exercise habits .77
3. Put forth the effort required to exercise .81
4. Do exercises even if difficult .74
5. Maintain a regular exercise program .75
6. Exercise for the appropriate length of time .83
7. Do exercise even if they are tiring .78
8. Stick to your exercise program .81
9, Exercise at least three times a week .75
10. Do the type of exercises you are supposed to do .74
11. Begin to eat more calcium-rich foods .79
12. Increase your calcium intake .66
13. Consume adequate amounts of calcium-rich foods .82
14. Eat calcium rich foods on a regular basis .86
15. Change your diet to include more calcium rich foods. .84
16. Eat calcium rich foods as often as you are supposed to .84
17.Select appropriate foods to increase your calcium intake .77
18. Stick to a diet which gives an adequate amount of calcium .78
19. Obtain foods that give an adequate amount of calcium .72
20. Remember to eat calcium rich foods .76
21. Take calcium supplements if you don’t get enough .38
Cronbach’s Alpha .94 .93

75
Study Instrument Validity
The validity of the OHB calcium and exercise subscales, OSE calcium and exercise subscales,
and the OKT subscales were evaluated by content validity, factor analysis and discriminate
function analysis (Kim, Horan & Gendler, 1991 & 1998). Questions on the survey instruments
were also evaluated for difficulty, effectiveness of distractors and discriminators by instrument
developers Kim, Horan and Gendler. “The construct validity of the OHB calcium subscale and
the OHB exercise subscale was determined by factor analysis. The percentages of variance
explained by susceptibility, barriers, benefits, seriousness and heath motivation were 14.4, 12.4,
9.1, 7.7, and 5.8, respectively. The percentages of variance for the OHB exercise subscale
accounted for susceptibility, benefits exercise, barriers exercise, seriousness, and health
motivation were 15.9, 12.1, 9.2, 6.4, and 5.7” (Endicott, 2013).
Recruitment of Subjects.
Flyers approved by the Southern Illinois University Human Subjects Committee (SIUC
HSC), the Nez Perce Tribal Executive Committee, Nez Perce Tribal Legal Counsel, the Nez
Perce Tribe Clinic Administrator, the Medical Director of Nimiipuu Health (NMPH) and the
Laboratory/Radiology Director of NMPH were posted on a bulletin board adjacent to the front
entrance of the NMPH Clinic, located at 111 Bever Grade Road, PO Drawer 367, Lapwai, ID
from August 19-30, 2013.
In addition, copies of the approved flyer were posted at the front registration desk, the X-Ray
and Laboratory Departments and each physician, nurse practitioner and physician assistant’s
office at NMPH. The study start date was August 19, 2013 and the study end date was August
30, 2013. 215 individuals consented to the study, but only 209 properly completed the forms.

76
Temporary office occupancy at the NMPH Clinic by PI Victor White was M-F from 11:00AM to
19:00PM and 10:00AM to 18:00PM on Saturdays. Appendix 9 shows a copy of the flyer.
PI Victor White and NMPH clinical staff recruited volunteers for this study verbally using the
script found in Appendix 7 and via distribution of the approved flyer when participants asked
about the study or were present at the clinic for routine medical procedures and expressed an
interest in participating in the study. Nez Perce tribal members and other Native Americans in
North Idaho receive care that is paid for by the Indian Health Services office based in Portland,
OR, but non Native Americans can receive care at the Nimiipuu Clinic, but they must pay for
such care via governmental (Medicare, Medicaid) or non-governmental third party payers
(private health insurance), or via self-pay.
All recruited individuals were Nez Perce Tribal members and/or Non-Nez Perce Tribal
Member volunteers, male and female, ages 18 and met all necessary qualifications to complete
the survey. The PI, Victor White, asked each participant to self-identify as a member of the Nez
Perce Tribe determined by tribal membership policy and their self-reported blood quantum or to
identify as a Non Nez Perce tribal member, respectively. Out of 215 initial volunteers, 209 self-
identified as tribal or non-Tribal members and also correctly filled out all three survey
instruments.
Administration of Survey
The survey was administered via written instrument at the Nimiipuu Health Clinic, P.O. Box
367, Lapwai, ID 83540. Telephone and/or cell phone surveys were not used because many Nez
Perce Tribal members do not own a cell phone or have home land line phone services. Computer
internet surveys were not conducted because many Nez Perce tribal members and some Non Nez

77
Perce tribal members lack home based or mobile internet service access. In addition, internet
computer surveys are frequently ignored and not completed. True randomization was not
achievable in this study because it was based on volunteer participation (i.e.: self-selection by
participants). Word of mouth by Nez Perce tribal health care providers, and discussion among
residents of the Nez Perce Tribe, Native and Non-Native residents of Nez Perce County, ID led
to general awareness of the survey research.
PI Victor White occupied an empty office at NMPH assigned by NMPH Laboratory/X-Ray
Administrator Constacio Cleto with the SIUC HSC approved flyer/brochure describing the
survey study posted on the front door of the office. Self-referred subjects whom read the flyers,
met the criteria and wished to take part in the survey were also included and were able to opt out
at any time without penalty as were all participants throughout the duration of the study.
Medical professionals of NMPH had the flyers posted at their desks and in each patient
treatment office. Any NMPH nursing or allied health medical professional; (i.e.: lab, x-ray,
nursing) or medical providers (i.e.: physicians, physician assistants, nurse practitioners, etc.)
were allowed to engage in self-referral and/or referred family members, friends and their patients
to the temporary office for completion of the survey instrument.
Data Collection Procedures
All consent forms and survey data forms were passed out by PI Victor White. Victor White
explained the purpose of the research; the survey instruments, how to complete the survey, and
answered any questions about the survey or osteoporosis that the volunteer participants had. The
survey was paper and pencil and all participants completed the survey on-site at NMPH in a
secure unoccupied office at the clinic. Each participant completed the survey instruments in

78
approximately 20-30 minutes, but were allowed to work on the survey until they completed it or
decided to opt out of completing the survey. Upon survey completion of the survey or non-
completion, PI Victor White collected 215 survey forms, with 209 being filled out completely
and correctly. Reasons why six of the surveys were not used include the following:
• Surveys were not completed or were incorrectly completed.
• No name, age, gender or ethnicity was put on the survey.
• Some participants refused to indicate their ethnicity.
• Some participants did not know or could not indicate their blood quantum/quartile
regarding Indian Ethnicity.
Study Consent
A general consent form to participate in the survey study was signed by 215 participants. A
copy of this consent form is found in Appendix 8. Data collection processes included having
volunteer participants fill out the OKT, OHBS and OSES.
Appendix 10 is a scan of the permission letter from Phyllis Gendler, PhD of Grand Valley
State University in Grand Rapids, MI to use the Osteoporosis Knowledge Test (OKT) (Appendix
11), the Osteoporosis Health Belief Scale (OHBS) (Appendix 12), and the Osteoporosis Health
Efficacy Scale-21 (OHES) (Appendix 13). Participants completed the OKT, the OHBS and the
OSES. These survey instruments are based upon osteoporosis and EHBM research completed by
Phyllis Gendler, Ph.D. and associates surveying 201 women, 35 years of age or older at Grand
Valley State University in Allendale, MI from 1991 through 2010. The three surveys include
questions regarding overall health status, gender, medication use, smoking, vitamin intake,
exercise, diet, and the diagnosis and treatment of osteoporosis (Kim, Horan, Gendler, & Patel,

79
1991, p. 155-163 and Horan, Kim, Gendler, Froman, & Patel, 1998, p. 395-403, and Wallace,
2002, p. 163-172).
Statistical Analysis
Descriptive statistic used in this study include counts, frequencies, averages, medians and
modes. The data from this dissertation is descriptive, non-parametric and parametric, consisting
of nominal and ordinal data. Non parametric means that random selection has not happened, so
the sample may not be representative of the population in question, variables are measured in a
manner that generates nominal or ordinal data, and the number of subjects in the sample is small.
The assumed distribution means that “in probability theory, the normal (or Gaussian) distribution
is a very common continuous probability distribution (central limit theorem)” [and] “are
important in statistics and are often assumed to be normal as used in the natural and social
sciences to represent real-value random variables whose distributions are not known”(Retrieved
on October 20, 2015, from https://en.wikipedia.org/wiki/Normal_distribution). Parts of the study
demonstrated a normal distribution, but other parts did not. Because of this, both non-parametric
and parametric tests were used to analyze the data in this study.
A Cramer’s V correlation was conducted to determine if there were relationships between
dependent and independent variables for all OKT, OHBS and OSES research questions.
Levene’s independent equality of variance and means t test was used to evaluate OKT, OHBS
and OSES questions with significance established at the p < 0.05 level. Multiple one-way
ANOVA’s were performed on the OKT, OHBS and OSES data, with a p < 0.05 significance
level. A MANOVA was conducted on the OKT, OHBS and OSES questions, with a p < 0.05
significance level. Hierarchical linear regression was conducted to determine which of the

80
independent variables (i.e.: ethnicity and gender) contributed the most to the dependent health
motivation variable at the p < 0.05 significance level.
Completed survey data was gathered via voluntary participant completion of an EHBM based
written survey instrument from 209 volunteer participants and was analyzed with statistical
software, SPSS v. 21 and SAS. Types of statistical tests used in this study, along with the
research questions, independent and dependent variables and EHBM questions can be found in
Tables 13 and 14.
Statistical Technique
Table 13
Considerations for Using Various Statistical Tests (Non-Parametric) Used in This Study.
Test Applied To Assumed Distribution
Test Use
Descriptive Nominal or Ordinal
Normal Methods used to examine data for measures of central tendency and
measures of variability or
dispersion Chi Square Nominal Binomial Testing the frequency of
occurrence of an attribute to see if it is due to chance
Mann-Whitney Ordinal Ordered categories, unequal intervals
Used to test the null hypothesis that two populations are the same against an alternative hypothesis.
Kruskall Wallis Ordinal Any Testing the significance of a difference between two group means
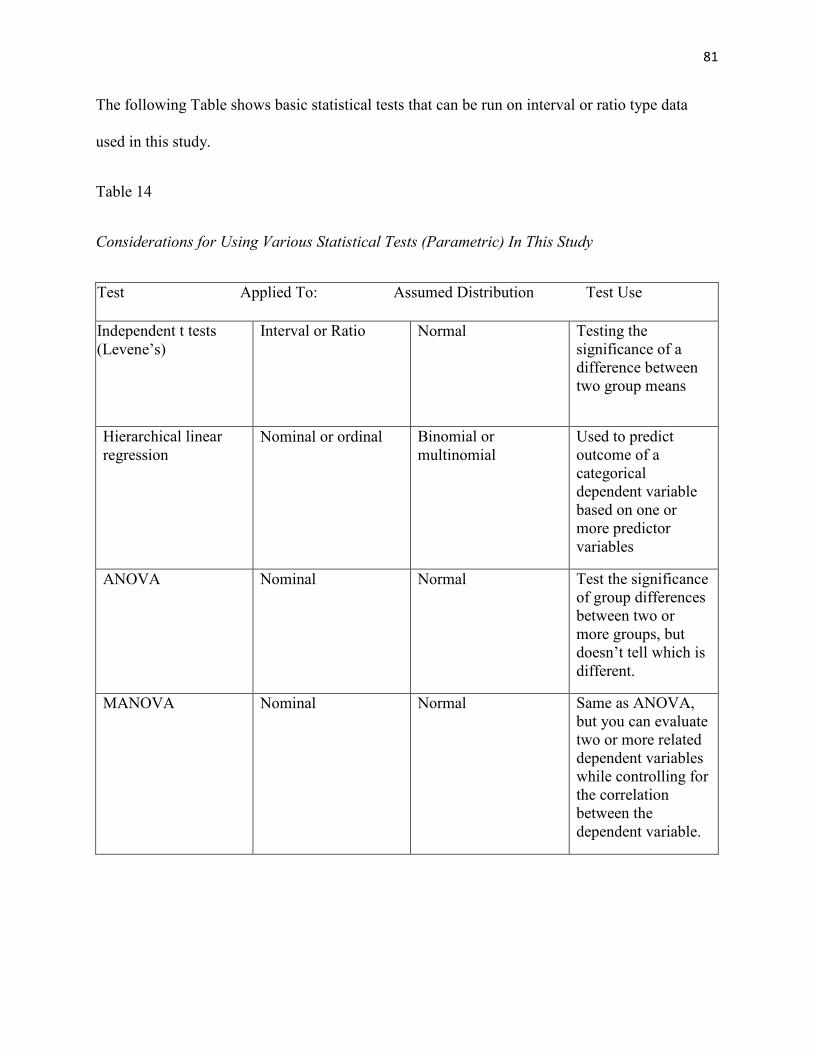
81
The following Table shows basic statistical tests that can be run on interval or ratio type data
used in this study.
Table 14
Considerations for Using Various Statistical Tests (Parametric) In This Study
Test Applied To: Assumed Distribution Test Use
Independent t tests (Levene’s)
Interval or Ratio
Normal Testing the significance of a difference between two group means
Hierarchical linear regression
Nominal or ordinal Binomial or multinomial
Used to predict outcome of a categorical dependent variable based on one or more predictor variables
ANOVA Nominal Normal Test the significance of group differences between two or more groups, but doesn’t tell which is different.
MANOVA Nominal Normal Same as ANOVA, but you can evaluate two or more related dependent variables while controlling for the correlation between the dependent variable.

82
Research Questions
Research Questions, survey items and the type of statistical analysis that was conducted for
each research question and data set in this study is demonstrated below in Table 15.
Table 15
Research Questions, Statistics and EHBM Components
Research Questions
Statistics Used EHBM Component and Survey Questions Independent Variables Dependent
Variables
1. What do Nez Perce Tribal members and Non Nez Perce Tribal members residing in Nez Perce County, ID know about osteoporosis?
Age, ethnicity/race, and gender
Osteoporosis knowledge,
attitudes, beliefs
and self-efficacy
Descriptive Stats: Counts, frequencies, median, mode, mean, range and standard deviation. Non Parametric: Chi Square, phi coefficient, Mann-Whitney U, Kruskall Wallis, Cramer’s V. Parametric: Levene's t test, hierarchical linear regression, ANOVA and MANOVA’s.
OKT (1-11) & (30-32). OHBS (1-6). OHBS (7-12). OHBS (37-42). OSES Calcium (11-21).

83
Table 15 (continued)
2. Is there a statistically significant difference in osteoporosis knowledge, attitudes, beliefs, and self-efficacy among Nez Perce Tribal members and Non Nez Perce Tribal Members, male and female, aged 18 and older residing in Nez Perce County, ID as evidenced by completion of an EHBM based osteoporosis survey instrument?
Age, ethnicity/race, and gender
Osteoporosis knowledge,
attitudes, beliefs
and self-efficacy
Descriptive Stats: Counts, frequencies, median, mode, mean, range and standard deviation. Non Parametric Chi Square, phi coefficient, Mann-Whitney U, Kruskall Wallis, Cramer’s V. Parametric Levene's t test, hierarchical linear regression, ANOVA and MANOVA’s.
OKT (1-11) & (30-32). OHBS (1-6). OHBS (7-12). OHBS (37-42). OSES Calcium (11-21).

84
Table 15 (continued)
3. Does ethnicity have an effect on Nez Perce Tribal and non Nez Perce Tribal member’s knowledge, attitudes, beliefs and self-efficacy regarding osteoporosis?
Age, ethnicity/race, and gender
Osteoporosis knowledge, attitudes, beliefs and self-efficacy
Descriptive Stats: Counts, frequencies, median, mode, mean, range and standard deviation. Non Parametric Chi Square, phi coefficient, Mann-Whitney U, Kruskall Wallis, Cramer’s V. Parametric Levene's t test, hierarchical linear regression, ANOVA and MANOVA’s.
OKT (1-11). OHBS (1-6). OHBS (7-12). OSES Calcium (11-21).

85
Table 15 (continued)
4. Does gender have an effect on Nez Perce Tribal and non Nez Perce Tribal member’s knowledge, attitudes, beliefs and self-efficacy regarding osteoporosis?
Age, ethnicity/race, and gender
Osteoporosis knowledge, attitudes, beliefs and self-efficacy
Descriptive Stats: Counts, frequencies, median, mode, mean, range and standard deviation. Non Parametric Chi Square, phi coefficient, Mann-Whitney U, Kruskall Wallis, & Cramer’s V. Parametric Levene's t test, hierarchical linear regression, ANOVA and MANOVA’s.
OKT (1-11). OHBS (1-6). OHBS (7-12). OSES Calcium (11-21).

86
Table 15 (continued)
5. Does age have an effect on Nez Perce Tribal and non Nez Perce Tribal member’s knowledge, attitudes, beliefs and self- efficacy regarding osteoporosis?
Age, ethnicity/race, and gender
Osteoporosis knowledge, attitudes, beliefs and self-efficacy
Descriptive Stats: Counts, frequencies, median, mode, mean, range and standard deviation. Non Parametric Chi Square, phi coefficient, Mann-Whitney U, Kruskall Wallis, & Cramer’s V. Parametric Levene's t test, hierarchical linear regression, ANOVA and MANOVA’s.
OKT (1-11). OHBS (1-6). OHBS (7-12). OSES Calcium (11-21).

87
Table 15 (continued)
6. Do Nez Perce Tribal members and non Nez Perce Tribal members understand the relationship between nutrition and osteoporosis?
Age, ethnicity/race, and gender
Osteoporosis knowledge, attitudes, beliefs and self-efficacy
Descriptive Stats: Counts, frequencies, median, mode, mean, range and standard deviation.
Non Parametric
Chi Square, phi coefficient, Mann-Whitney U, Kruskall Wallis, & Cramer’s V.
Parametric
Levene's t test, hierarchical linear regression, ANOVA and MANOVA’s.
OHBS (19-24). OHBS (31-36).
7. Do Nez Perce Tribal members and non Nez Perce Tribal members understand the relationship between exercise and osteoporosis?
Age, ethnicity/race, and gender
Osteoporosis knowledge, attitudes, beliefs and self-efficacy
Descriptive Stats: Counts, frequencies, median, mode, mean, range and standard deviation. Non Parametric Chi Square, phi coefficient, Mann-Whitney U, Kruskall Wallis, & Cramer’s V. Parametric Levene's t test, hierarchical linear regression, ANOVA and MANOVA’s.
OHBS (13-18). OHBS (25-30).

88
Sample Size, Confidence Level and Confidence Interval
The sample size for Nez Perce tribal members at the 95% confidence level with a confidence
interval of 10 is 94, out of a population of 3,499 Nez Perce tribal members living in Nez Perce
County, ID. The sample size for Non-Nez Perce tribal members at the 95% confidence level with
a confidence interval of 10 is 96, out of a population of 39,531 non-Nez Perce tribal members
living in Nez Perce County, ID.
Because of the data presented above, a minimum sample size of 100 Nez Perce tribal members
and 100 non-Nez Perce tribal members was sought. This sample size for both Nez Perce tribal
members and non-Nez Perce tribal members diminishes the likelihood of a type II error. Type I
error occurs when the researcher rejects the null hypothesis when it is true. The probability of a
Type I error is represented by alpha (α). Type II error occurs when the researcher accepts the null
hypothesis when it is false and the research hypothesis is true. The type II error is represented by
the symbol beta (β) (Ott, L., 1984, p. 110). The number of Native Americans in this study was
128 and the number of non-Native Americans was 81. The number of females in this study was
108 and the number of males in this study was 101, for a total of 209 participants.
Volunteer Notification
Flyers were posted at the Nez Perce Tribal Clinic in Lapwai, ID from August 19-30, 2013.
Healthcare providers, including physicians, nurse practitioners and physician assistants at NMPH
also had access to these flyers and were able to mention the date, time and location of the
educational program top interested patients, other healthcare workers, family and friends.

89
Collaboration
Local community groups that I collaborated with in this research include members of the
dissertation committee, the Nez Perce Tribe, non-Nez Perce Tribal members, study participants,
Nez Perce Tribal healthcare practitioners, and non-Nez Perce Tribal healthcare practitioners.
Approval for the study was given by the SIUC Human Subjects Committee (HSC).
Protection of Privacy and Confidentiality
All individual participants had their identities kept confidential at all times. Participants were
able to decline to participate at any time with no penalty or restriction of care at the Nez Perce
Tribe clinic or any other health/medical facilities. All raw data was coded with reference to
demographic data of the voluntary participants of this study. Access to raw data is available only
to the primary investigator. All coded data was coded without reference to demographic aspects
of the study participants. Hard copy data is kept in a locked file cabinet located at Victor Whites
residence. Computer data is contained on a password protected, restricted access computer at
Victor Whites residence. All participant data is held in the strictest confidence and adhered to all
confidentiality and human subject requirements of the three Nez Perce Tribe approval letters all
dated June 24, 2013. These letters are found in Appendices 4, 5 and 6. The Southern Illinois
University Carbondale (SIUC) Human Subjects Committee (HSC) Form A dated 08/09/13 is
found in Appendix 2 and the SIUC HSC Approval letter protocol# 13240 dated 08/09/13 is
found in Appendix 3.
In addition, primary investigator (PI) Victor N. White, MA, MSRS, RT(R), CHES has
completed a National Institutes of Health (NIH) Human Participants Protection Education for

90
Research Teams seminar at the University of Idaho in Moscow, ID. A certificate of completion
for this seminar is contained in Appendix 14.
Complete participant anonymity could not be ensured because individual participants could
have seen each other entering and leaving the Nez Perce Tribal clinic. In addition, Idaho State
law indicates that confidentiality may not be maintained completely if there is a compelling legal
reason to know participants in a research project, but “much of the biomedical and behavioral
research conducted in the United States is governed by the rule (i.e.: Common Rule) entitled
Federal Policy for the Protection of Human Subjects (HHS Subpart A of Title 45 CFR, Part 46),
which supersedes state law regarding protection of human subjects in research projects”
(National Institutes of Health, 2002, p. 1). For the aforementioned research, there was not a
compelling legal reason to know the participants in this study, so HHS Subpart A of Title 45
CFR, Part 46 was upheld in this study.
Benefit and Risk Dichotomy
Potential benefits to volunteer participants include the following:
1. Opportunity for osteoporosis mitigation and prevention strategies to be implemented on an
individual, tribal, and non-tribal basis.
2. Opportunity to learn more about osteoporosis by Nez Perce Tribal and Non Nez Perce tribal
members.
3. Bone health benefits to individuals, Nez Perce Tribal members, the Nez Perce Tribe as a
group, and non-Nez Perce Tribal members.

91
Potential risks to volunteer participants include the following:
1. Small risk of disclosure of knowledge of study participants by physical “sightings” of
participants going to the Lapwai, ID clinic for completion of the EHBM Survey instrument.
Summary
This study was designed to use EHBM based survey questions to determine study participant’s
knowledge, attitudes, beliefs and self-efficacy regarding osteoporosis. The two study groups
were Nez Perce Tribal members, male and female, age 18 and older as compared to non-Nez
Perce Tribal members residing in Nez Perce County, ID.
The three survey instruments (OKT, OHSB, and OSES) included questions concerning
respondent’s knowledge, prevention and mitigation of osteoporosis, age, dietary intake, exercise
level, ethnicity, gender, health status, medication use, smoking rate, vitamin and mineral use, and
knowledge concerning prevention, diagnosis, mitigation and treatment of osteoporosis.
This study sought to determine variations in osteoporosis knowledge, attitudes, beliefs and
self-efficacy among Nez Perce Tribal members and non Nez Perce Tribal members, male and
female, aged 18 and over residing in Nez Perce County, ID as evidenced by completion of an
EHBM based osteoporosis survey instruments. The study also was used to determine if age,
gender and ethnicity have an effect on Nez Perce Tribal and non Nez Perce Tribal member’s
knowledge, attitudes, beliefs and self-efficacy regarding osteoporosis. Finally, the study was
designed to determine whether or not Nez Perce Tribal members and non Nez Perce Tribal
members understood the relationship between exercise, nutrition (calcium intake) and
osteoporosis prevention.

92
CHAPTER 4
RESULTS
Purpose of the Study
The purpose of this study is to implement an EHBM based written survey to determine if there
is a difference in osteoporosis attitudes, knowledge, beliefs and self-efficacy among Nez Perce
Tribal members, male and female, age 18 and older as compared to non-Nez Perce Tribal
members residing in Nez Perce County, ID. This chapter includes an analysis of the research
questions and how the data derived in this study answers those questions.
Statistics
Descriptive statistics used in this study includes counts, frequencies, averages, medians
modes, ranges and standard deviation. Although there is a degree of normalcy for exercise
question responses, there was not a normal distribution for nutrition question responses. Because
of these mixed results, both non-parametric and parametric tests were used to analyze the data.
Non Parametric statistics used in this study include chi square, phi coefficient, Cramer’s V,
Mann-Whitney U and Kruskall Wallis. Parametric statistics used in this study include the
Levine’s equality of variance and means t test, ANOVA, MANOVA and hierarchical linear
regression.
Description of the Sample
The total number of participants in this study is was 209. The number of Native American
females was 65 (31.1%). The number of Non-Native females was 43 (20.6%). The number of
Native American males was 63 (30.1%). The number of Non-Native males was 38 (18.2%). The

93
mean age for all participants was 46.53 years of age (YOA). The minimum age of all participants
was 18 and the oldest participant was 92. The age range is 74 years. The age standard deviation
is 9.389 years. Tables 16, 17, 18 and 19 demonstrate descriptive statistics used in this study.
Table 16
Descriptive Statistics
Age Ethnicity Gender EG
N Valid 209 209 209 209 Missing 0 0 0 0
Mean 46.53 1.48 1.39 1.536 Std. Error of Mean
.649 .035 .034 .0339
Median 46.00 1.00 1.00 1.200 Mode 46 1 1 1.1 Std. Deviation 9.389 .501 .488 .4898 Variance 88.154 .251 .238 .240 Range 74 1 1 1.1 Minimum 18 1 1 1.1 Maximum 92 2 2 2.2 Sum 9725 310 290 321.0
Table 17
Descriptive Statistics: Gender
Frequency Percent Valid Percent
Cumulative Percent
Valid 1 108 51.7 51.7 51.7 2 101 48.3 48.3 100.0 Total 209 100.0 100.0

94
Table 18
Descriptive Statistics: Ethnicity
Frequency Percent Valid
Percent Cumulative
Percent
Valid 1 128 61.2 61.2 61.2 2 81 38.8 38.8 100.0 Total 209 100.0 100.0
Table 19
Descriptive Statistics: Total
Frequency Percent Valid
Percent Cumulative
Percent
Valid
Native American/Female
65 31.1 31.1 31.1
Native American/Male
63 30.1 30.1 61.2
NN American/Female 43 20.6 20.6 81.8 NN American/Male 38 18.2 18.2 100.0 Total 209 100.0 100.0
Non-Parametric Tests
Hypothesis Test Summary
For the Hypothesis Test Summary, Osteoporosis Knowledge Test (OKT) questions 3, 19 and
24 indicate retain the hypothesis and the remaining questions, ranging from 1-32 indicated reject
the null hypothesis. The significance level is .10. This data is found in Appendix 15. The
preponderance of evidence from this hypothesis test summary suggest the rejection of the null
hypothesis (H0: Native Americans = Non-Native Americans) and acceptance of the research
hypothesis (H1: Native Americans ≠ Non-Native Americans).

95
Chi Square
A Chi Square test is used to examine nominal data to see if the frequency of occurrence of an
attribute is due to chance. The dependent variable in the Chi Square tests is completion of the
survey. Chi Square was used to help answer research question 1 and 2.
Table 20
Chi Square Analysis
Age Gender Ethnicity Exercise Nutrition
Chi-Square 138.828a .234b 10.569b 56.005d 46.330e
df 23 1 1 5 11
Asymp. Sig.
.001 .628 .001 .001 .001
The Chi Square for age is 138.828 with a df of 23 and an asymp.sig (p value) of .001, which
is significant. Chi Square for gender is .234 with 1 df and an asymp.sig (p value) of .628, which
is not significant. Chi Square for ethnicity is 10.569 with 1 df and an asymp.sig (p value) of .001,
which is significant. Chi Square for exercise is 56.205 with a df of 5 and an asymp.sig (p value)
of .001, which is significant. Chi Square for nutrition is 46.330, with a df of 11 and an asymp.sig
(p value) of .001, which is significant.

96
Analysis
The only item not considered statistically significant in the above Chi square dataset was
gender, with a Chi square of .234, df of 1, and asymp. Sig (p value) of .628. I find this an
interesting outcome because the Chi square results for age, ethnicity, exercise and nutrition lends
support to the research hypothesis in these areas (Research Question 2) and demonstrate that
there is a statistically significant difference in participant responses to exercise and nutrition
questions on the EHBM survey. It is possible that through Nez Perce tribal healthcare providers
and non-Tribal providers have discussed osteoporosis diagnosis and treatment with their patients,
both female and male, thereby enhancing the health literacy of female and male Nez Perce Tribal
members regarding osteoporosis to a level similar to that of the Non-Native female and male
populations in Nez Perce County, ID.
Mann-Whitney U
The Mann-Whitney U test is used to test the null hypothesis that two populations are the same
against an alternative hypothesis. The Mann-Whitney U test was used to help answer research
questions 3, 4, 6 and 7.
Mann-Whitney U and Ethnicity
For research questions 3, 6 and 7, with ethnicity being the grouping variable, the Mann-
Whitney U for the exercise subscale value is 4,725.500, the Wilcoxon W is 12,981.500, the Z is
–1.106, and the asymp. sig (2 tailed) p value is .269, which is not statistically significant. The
nutrition subscale Mann-Whitney U is 5,008.500, the Wilcoxon W is 13,264.500, the Z is -.45
and the asymp.sig (2 tailed) is .678, which is not statistically significant. The Mann-Whitney U
with a grouping variable of ethnicity is higher for nutrition (5,008.500) than it is for exercise

97
(4,725.500). The mean rank for Native Americans (101.42) is lower than for Non-Native
Americans (110.66). The Z for exercise is -1.106, whereas the Z for nutrition is -.415, both of
which are below the group mean.
Table 21
Mann-Whitney Analysis of Ethnicity (Ranks of Exercise,
Nutrition and Total)
Ethnicity N Mean
Rank Sum of Ranks
Exercise 1 128 101.42 12981.50 2 81 110.66 8963.50 Total 209
Nutrition 1 128 103.63 13264.50 2 Total
81 107.17 8680.50 209
Total 1 128 102.34 13099.00 2 81 109.21 8846.00 Total 209
Table 22
Mann-Whitney and Wilcoxon W Analysis of Ethnicity
Exercise Nutrition Total Mann-Whitney U 4725.500 5008.500 4843.000
Wilcoxon W 12981.50
0 13264.500 13099.000
Z -1.106 -.415 -.809 Asymp. Sig. (2-tailed)
.269 .678 .418

98
Mann-Whitney U and Gender
For research questions 4, 6 and 7, with gender being the grouping variable, the Mann-
Whitney U test for the exercise subscale value is 3550.500, the Wilcoxon W is 9436.500, the Z is
-4.476, and the asymp.sig. (2 tailed) p value is .001, which is statistically significant at the 0.05
level. The nutrition subscale for Mann-Whitney U is 4831.500, the Wilcoxon W is 9436.500, the
Z = -1.434, and the asymp.sig (2 tailed) p value is .152, which is not statistically significant.
Table 23
Mann-Whitney U and Gender Analysis (Ranks of Exercise, Nutrition and Total)
Gender N Mean
Rank Sum of Ranks
Exercise
1 108 87.38 9436.50
2 101 123.85 12508.50
Total 209
Nutrition
1 108 99.24 10717.50
2 101 111.16 11227.50
Total 209
Total
1 108 97.38 10516.50
2 101 113.15 11428.50
Total 209
Table 24
Mann-Whitney U and Gender Analysis
Exercise Nutrition Total
Mann-Whitney U 3550.500 4831.500 4630.500
Wilcoxon W 9436.500 10717.500 10516.500
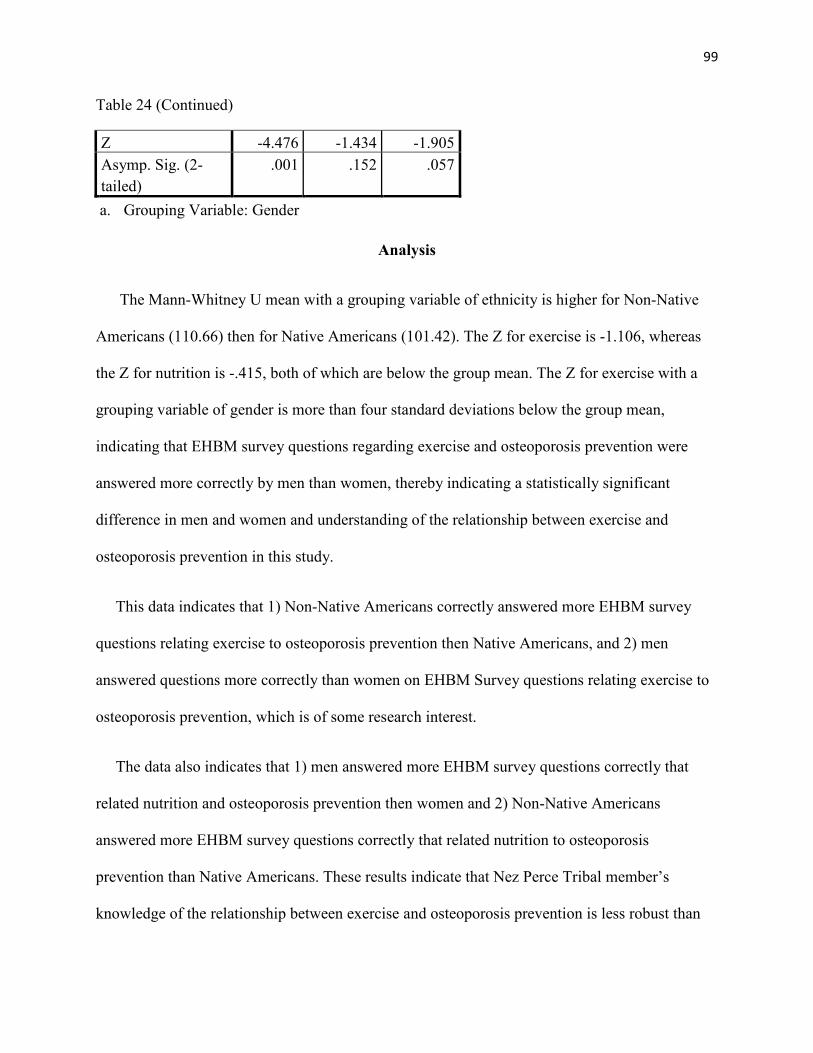
99
Table 24 (Continued)
Z -4.476 -1.434 -1.905
Asymp. Sig. (2-tailed)
.001 .152 .057
a. Grouping Variable: Gender
Analysis
The Mann-Whitney U mean with a grouping variable of ethnicity is higher for Non-Native
Americans (110.66) then for Native Americans (101.42). The Z for exercise is -1.106, whereas
the Z for nutrition is -.415, both of which are below the group mean. The Z for exercise with a
grouping variable of gender is more than four standard deviations below the group mean,
indicating that EHBM survey questions regarding exercise and osteoporosis prevention were
answered more correctly by men than women, thereby indicating a statistically significant
difference in men and women and understanding of the relationship between exercise and
osteoporosis prevention in this study.
This data indicates that 1) Non-Native Americans correctly answered more EHBM survey
questions relating exercise to osteoporosis prevention then Native Americans, and 2) men
answered questions more correctly than women on EHBM Survey questions relating exercise to
osteoporosis prevention, which is of some research interest.
The data also indicates that 1) men answered more EHBM survey questions correctly that
related nutrition and osteoporosis prevention then women and 2) Non-Native Americans
answered more EHBM survey questions correctly that related nutrition to osteoporosis
prevention than Native Americans. These results indicate that Nez Perce Tribal member’s
knowledge of the relationship between exercise and osteoporosis prevention is less robust than

100
that of Non Nez Perce Tribal members and that men’s knowledge of the relationship between
exercise, nutrition and osteoporosis prevention is better than women’s in this study. Perhaps
more education of Nez Perce Tribal members and women of both ethnicities could be conducted
by Nez Perce Tribal healthcare providers and non-reservation healthcare providers to improve
osteoporosis prevention knowledge of these groups. Based on this data, there is a difference in
osteoporosis knowledge between Nez Perce Tribal members and Non Nez Perce Tribal
members, and males and females, thereby answering research questions 1 and 2, and validating
the research hypothesis (i.e.: H1: Native Americans ≠ Non-Native Americans).
Kruskall Wallis
Kruskall Wallis is a distribution free alternative to ANOVA. It is a non-parametric method for
testing whether samples originate from the same distribution. It is used for comparing two or more
samples that are independent and may have different sample sizes.
Table 25
Kruskall Wallis and Gender Ranks
Gender N Mean
Rank
Exercise 1 108 87.38 2 101 123.85 Total 209
Nutrition 1 108 99.24 2 101 111.16 Total 209
Total 1 108 97.38 2 101 113.15 Total 209

101
For the Kruskall Wallis test with gender as the grouping variable, the exercise df is 1 and
the asymp. Sig (p value) is .001, which is statistically significant. For nutrition, the df is 1 and
the asymp.sig (p value) is .152, which is not statistically significant. For total, the df is 1 and the
asymp. Sig (p value) .057, which is nearly statistically significant. The exercise and total data
demonstrated above do show evidence against the null hypothesis, whereas, the nutrition means
do not show evidence against the null hypothesis with gender as the grouping variable.
Table 27
Kruskall Wallis and Ethnicity
Ranks
Ethnicity N Mean
Rank
Exercise 1 128 101.42 2 81 110.66 Total 209
Nutrition
1 128 103.63 2 81 107.17 Total 209
Total 1 128 102.34 2 81 109.21 Total 209
Table 26
Kruskall Wallis (Gender) Test Statisticsa,b
Exercise Nutrition Total Chi-Square 20.030 2.056 3.630 df 1 1 1 Asymp. Sig.
.001 .152 .057
a. Kruskall Wallis Test b. Grouping Variable: Gender

102
Table 28
Kruskall Wallis Test (Ethnicity)
Test Statisticsa,b
Exercise Nutrition Total Chi-Square 1.223 .172 .655 df 1 1 1 Asymp. Sig.
.269 .678 .418
a. Kruskall Wallis Test b. Grouping Variable: Ethnicity
With the Kruskall Wallis test using ethnicity as the grouping variable, the df for exercise is 1
and the asymp. Sig (p value) is .269, which is not statistically significant. For nutrition, the df is
1 and the asymp. Sig (p value) is .678, which is not statistically significant. For total, the df is 1
and the asymp. Sig (p value) .418, which is not statistically significant. Kruskall Wallis data
using ethnicity as the grouping variable does not show evidence against the null hypothesis for
exercise, nutrition and total means.
Table 29
Kruskall Wallis (Age)
Test Statisticsa,b
Exercise Nutrition Total
Chi-Square 152.643 166.543 157.375
df 23 23 23
Asymp. Sig.
.001 .001 .001
a. Kruskall Wallis Test b. Grouping Variable: Age
In the Kruskall Wallis test, with a grouping variable of age, the df is 23 for exercise and the
asymp. Sig (p value) for exercise is .001, which is statistically significant. For nutrition, the df is

103
23 and the asymp. Sig (p value) is .001, which is statistically significant. For total, the df is 23
and the asymp.sig (p value) is .001, which is statistically significant. The data does show
evidence against the null hypothesis. In other words, results from the Kruskall Wallis test do
show a difference between group means of exercise, nutrition and total, with a grouping variable
of age.
Correlations
Correlation is the relationship between two variables. Cramer’s V is a type of correlation that
expresses the degree of relationship (0 to +1) between two nominal variables, with 0 being no
relationship and +1 being a perfect relationship. Cramer V calculations were used to help answer
research questions 3 and 4.
In research question 3 with ethnicity as the test variable, the Cramer’s V for OKT Questions
1-32 is 0.0947, which demonstrates a weak relationship between ethnicity and OKT survey
question responses. The Cramer’s V for OHBS questions 1-42 is 0.2631, which demonstrates a
very strong relationship between ethnicity and OHBS survey question responses.
In research question 4 with gender as the test variable, the Cramer’s V for OKT questions 1-
32 is 0.0320, which shows no or a negligible relationship between ethnicity and OKT survey
question responses. The Cramer V for OHBS questions 1-42 is 0.1979, which demonstrates a
strong relationship between gender and OHBS survey question responses.

104
Cramer’s V Analysis
Correlation was strongest for ethnicity, gender and OHBS question responses as compared to
ethnicity, gender and OKT question responses. The OHBS questions deal more with current and
expected behavior regarding prevention, mitigation and treatment of osteoporosis, whereas the
OKT questions deal more with respondents knowledge about osteoporosis prevention and
treatment. Improvements in participant’s knowledge about osteoporosis could be brought about by
more formal education regarding osteoporosis conducted in a group setting. In addition, individual
providers could offer more patient specific counseling regarding osteoporosis prevention and
treatment in Nez Perce County, ID medical offices.
Parametric Tests
Levene’s Equality of Variance t Test
A Levene’s equality of variance t test “is an inferential statistic used to assess the equality of
variances for a variable calculated for two or more groups. If the resulting p-value of Levene's
test is less than some significance level (typically 0.05), the obtained differences in sample
variances are unlikely to have occurred based on random sampling from a population with equal
variances. Thus, the null hypothesis of equal variances is rejected and it is concluded that there is
a difference between the variances in the population” (Retrieved on January 22, 2015, from
https://en.wikipedia.org/wiki/Levene%27s_test).

105
Table 30
Levene’s Test for Equality of Variances and Equality of Means.

106
Analysis
The Levene’s equality of variance t test does demonstrate a statistically significant difference
between the mean number of exercise in individuals older than 50 YOA, (M=5.0400, S= 1,
27809) and younger than 50 YOA, (M=4.3881, S=1.49641), t (207) = 3.179, p=.002, alpha = .05.
This result rules against the null hypothesis, indicating that the research hypothesis (H1: Native
American ≠ Non-Native American) is correct.
The Levene’s test does demonstrate a statistically significant difference between the mean
number of nutrition in individuals older than 50 YOA, (M=9.96000, S=4.86421 and younger
than 50 YOA, (M=12.4552, S=4.42416), t (207) = -3.773, p= .000, alpha = .05. This result rules
against the null hypothesis (H0: Native Americans = Non-Native Americans), indicating that the
research hypothesis (H1: Native American ≠ Non-Native American) is correct.
Results by Research Question
Research Question 1
1. What do Nez Perce Tribal members and Non-Nez Perce Tribal members know about
osteoporosis?
Answer: Both groups have some limited knowledge about osteoporosis.
EHBM Categories, Survey Data and Research Questions
The EHBM categories that were examined include a summary of knowledge (OKT questions)
about exercise and osteoporosis prevention. Table 31 is a Summary of Knowledge about
Exercise and Osteoporosis Prevention.

107
Table 31
Summary of Knowledge (OKT) about Exercise and Osteoporosis Prevention
Responses
Scale Incorrect n (%)
Correct n (%)
Exercise subscale Eating diet low in dairy product 78 (37.3) 131 (62.7) Being menopausal 92 (44.0) 117 (56.0) Having parent or grandparent who has osteoporosis 104 (49.8) 105 (50.2) Being white or Asian woman 118 (56.5) 91 (43.5) Being elderly man 170 (81.3) 39 (18.7) Having ovaries surgically removed 131 (62.7) 78 (37.3) Taking cortisone for long time 131 (62.7) 78 (37.3) Being overweight 144 (68.9) 65 (31.1) Having eating disorder 131 (62.7) 78 (37.3) More than 2 alcoholic drinks per day 118 (56.5) 91 (43.5) Smoking daily 118 (56.5) 91 (43.5) Number of days a week to do exercise 183 (87.6) 26 (12.4) Exercise hard enough 52 (24.9) 157 (75.1) Best way to reduce osteoporosis : swim, walk, stretching 92 (44.0) 117 (56.0) Best way to reduce osteoporosis : bicycling , yoga, lift weights 131 (62.7) 78 (37.3) Best way to reduce osteoporosis: jogging, golfing, gardening 92 (44.0) 117 (56.0) Best way to reduce osteoporosis: bowling, doing laundry, aerobic dancing 65 (31.1) 144 (68.9)
Results: Summary of Knowledge about Exercise and Osteoporosis Prevention.
More respondents answered OKT questions correctly concerning exercise and osteoporosis in
the following areas: Being menopausal (56%), having parent or grandparent who has
osteoporosis (50.2%), exercises hard enough (75.1%), best way to reduce osteoporosis: swim,
walk, stretching (56%), best way to reduce osteoporosis jogging, golfing, gardening (56), and the
best way to reduce osteoporosis: bowling, doing laundry, aerobic dancing (68.9%).

108
Analysis: Summary of Knowledge about Exercise and Osteoporosis Prevention.
Respondents have a basic understanding of the relationship between exercise and
osteoporosis. Health education in a group format (community presentation) and/or individual
discussion with a healthcare provider could improve some respondents understanding about the
relationship between exercise and osteoporosis prevention.
EHBM Categories, Survey Data and Research Questions
The EHBM categories that were examined include a Summary of Knowledge (OKT
questions) About Nutrition and Osteoporosis Prevention. Table 32 is a Summary of Knowledge
about Nutrition and Osteoporosis Prevention

109
Table 32
Summary of Knowledge about Nutrition and Osteoporosis Prevention
Responses
Scale Incorrect n (%)
Correct n (%)
Nutrition Scale
Best source of calcium: apple, cheese, cucumber 39 (18.7) 170 (81.3)
Best source of calcium : peanut butter, turkey, canned sardines 104 (49.8) 105 (50.2)
Best source of calcium: Chicken, broccoli, grapes 65 (31.1) 144 (68.9)
Best source of calcium: Yogurt, strawberries, cabbage 39 (18.7) 170 (81.3)
Best source of calcium : ice cream, grapefruit, radishes 65 (31.1) 144 (68.9)
Recommended amount of calcium 118 (56.5) 91 (43.5)
Amount of milk to drink to meet recommended calcium 105 (50.2) 104 (49.8)
Best reason for taking a calcium supplement 52 (24.9) 157 (75.1)
Vitamin required absorb calcium 52 (24.9) 157 (75.1)
Best source of vitamin to absorb calcium 39 (18.7) 170 (81.3)
Best food source of vitamin to absorb calcium 169 (80.9) 40 (19.1)
Recommended amount of vitamin to absorb calcium 183 (87.6) 26 (12.4)
Best time to build strong bones 170 (81.3) 39 (18.7)
Osteoporosis diagnosis 52 (24.9) 157 (75.1)
Once have osteoporosis 78 (37.3) 131 (62.7)

110
Results: Summary of Knowledge about Nutrition and Osteoporosis Prevention
Respondents correctly answered OKT questions related to nutrition and osteoporosis
prevention in the following areas: Best source of calcium: apple, cheese, cucumber (81.3%), best
source of calcium: peanut butter, turkey, canned sardines (50.2%), best source of calcium:
chicken, broccoli, grapes (68.9%), best source of calcium: yogurt, strawberries, cabbage
(81.3%), best source of calcium: ice cream, grapefruit, radishes (68.9%), best reason for taking a
calcium supplement (75.1%), vitamin required to absorb calcium (75.1%), best source of vitamin
to absorb calcium (81.3%), osteoporosis diagnosis (75.1%), and once you have osteoporosis
(62.7%).
Analysis: Summary of Knowledge about Nutrition and Osteoporosis Prevention
Respondents have a good understanding of the relationship between sources of calcium as it
relates to osteoporosis diagnosis and treatment. Areas where respondents had incorrect
understanding regarding nutrition and osteoporosis prevention were recommended amounts of
calcium, amount of milk to drink to get adequate calcium, and the relationship between the
amount and sources of calcium need on a daily basis to prevent osteoporosis.
EHBM Categories, Survey Data and Research Questions:
The EHBM questions that were examined include OHBS question and responses.
Table 33 is a summary of study participant beliefs about the seriousness and susceptibility to
osteoporosis and health motivation.

111
Table 33
Summary of Beliefs (OHBS) about Seriousness and Susceptibility to Osteoporosis and Health
Motivation
Responses
Scale
Strongly
Disagree
n (%)
Disagree
n (%)
Neutral
n (%)
Agree
n (%)
Strongly
Agree
n (%)
Susceptibility
Chances of getting osteoporosis high 0 (0.0) 26 (12.4) 53 (25.4) 104 (49.8) 26 (12.4)
Body build likely to get osteoporosis 13 (6.2) 26 (12.4) 92 (44.0) 65 (31.1) 13 (6.2)
Extremely likely to get osteoporosis 0 (0.0) 78 (37.3) 79 (37.8) 39 (18.7) 13 (6.2)
Good chance will get osteoporosis 0 (0.0) 65 (31.1) 39 (18.7) 79 (37.8) 26 (12.4)
More likely than average person to get osteoporosis 13 (6.2) 66 (31.6) 52 (24.9) 78 (37.3) 0 (0.0
Family history makes it more likely will get osteoporosis
1 (0.5) 52 (24.9) 104 (49.8) 52 (24.9)
0 (0.0)
Seriousness
Thought of having osteoporosis scares me 0 (0.0) 27 (12.9) 65 (31.1) 78 (37.3) 39 (18.7)
If had osteoporosis would be crippled 13 (6.2)
131 (62.7) 52 (24.9) 0 (0.0) 13 (6.2)
Feeling about self would change if got depressed 0 (0.0) 66 (31.6) 65 (31.1) 78 (37.3) 0 (0.0)
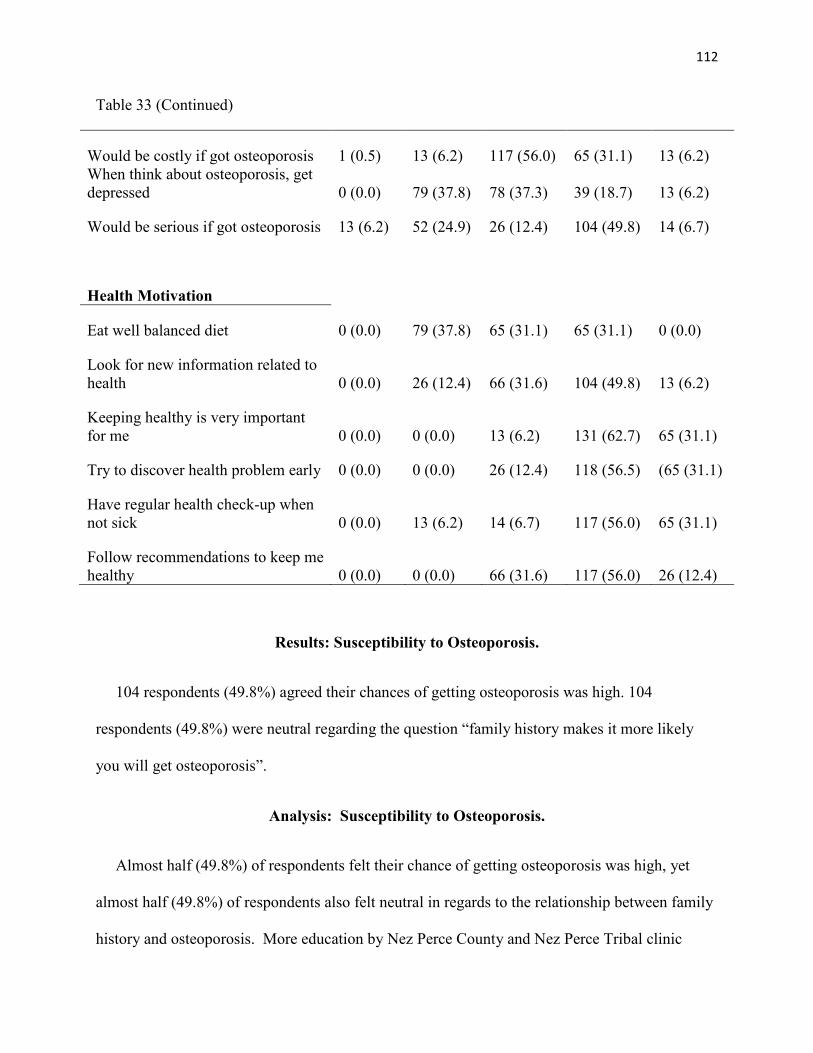
112
Table 33 (Continued)
Would be costly if got osteoporosis 1 (0.5) 13 (6.2) 117 (56.0) 65 (31.1) 13 (6.2) When think about osteoporosis, get depressed 0 (0.0) 79 (37.8) 78 (37.3) 39 (18.7) 13 (6.2)
Would be serious if got osteoporosis 13 (6.2) 52 (24.9) 26 (12.4) 104 (49.8) 14 (6.7)
Health Motivation
Eat well balanced diet 0 (0.0) 79 (37.8) 65 (31.1) 65 (31.1) 0 (0.0)
Look for new information related to health 0 (0.0) 26 (12.4) 66 (31.6) 104 (49.8) 13 (6.2)
Keeping healthy is very important for me 0 (0.0) 0 (0.0) 13 (6.2) 131 (62.7) 65 (31.1)
Try to discover health problem early 0 (0.0) 0 (0.0) 26 (12.4) 118 (56.5) (65 (31.1)
Have regular health check-up when not sick 0 (0.0) 13 (6.2) 14 (6.7) 117 (56.0) 65 (31.1)
Follow recommendations to keep me healthy 0 (0.0) 0 (0.0) 66 (31.6) 117 (56.0) 26 (12.4)
Results: Susceptibility to Osteoporosis.
104 respondents (49.8%) agreed their chances of getting osteoporosis was high. 104
respondents (49.8%) were neutral regarding the question “family history makes it more likely
you will get osteoporosis”.
Analysis: Susceptibility to Osteoporosis.
Almost half (49.8%) of respondents felt their chance of getting osteoporosis was high, yet
almost half (49.8%) of respondents also felt neutral in regards to the relationship between family
history and osteoporosis. More education by Nez Perce County and Nez Perce Tribal clinic

113
health educators and clinical staff should be conducted in groups (i.e.: community presentations)
or on an individual basis in provider’s offices as needed about the importance of family history
as it relates to susceptibility and seriousness of being diagnosed with osteoporosis.
Results: Seriousness of Osteoporosis
131 respondents (62.7%) did not agree with the survey question “if I had osteoporosis, I
would be crippled”. 117 respondents (56%) were neutral regarding the survey question “it would
be costly if I got osteoporosis”. 104 respondents (49.8%) agreed “it would be serious if I got
osteoporosis”.
Analysis: Seriousness of Osteoporosis
There was a belief by 62.7% of the respondents that having osteoporosis would not be
crippling. 56% of respondents were neutral in their belief that osteoporosis would be costly and
49.8% agreed that getting osteoporosis would be serious. Respondents seem worried about the
inability to ambulate freely and the cost of dealing with osteoporosis and its serious negative
effect on their health status. Responses to survey questions show respondents concern about
being able to work, and engage in normal activities of daily living (ADL’s) if they were
diagnosed with osteoporosis.
Results: Health Motivation and Osteoporosis
104 respondents (49.8%) agreed that they “would look for new information related to health
(osteoporosis)”. 131 respondents (62.7%) agreed that “keeping healthy is very important to me”.
118 respondents (56.5%) agreed “they would try to discover health problems early on
(osteoporosis)”. 117 respondents (56%) agreed they should “have a regular health check-up even

114
when not sick”. 117 respondents (56%) also afraid they would “follow provider
recommendations to keep healthy”.
Analysis: Health Motivation and Osteoporosis
From a health motivation perspective, anywhere from 49.8% to 62.7% of respondents felt that
finding new information about health, trying to discover health problems in their early stages,
getting regular health check-ups even when not sick and following provider health
recommendations were important to respondents. This bodes well for osteoporosis prevention
and treatment amongst respondents in Nez Perce County, ID.
Research Questions 2:
Is there a statistically significant difference in osteoporosis knowledge, attitudes, beliefs, and
self-efficacy among Nez Perce Tribal members and Non Nez Perce Tribal Members, male and
female, aged 18 and older residing in Nez Perce County, ID as evidenced by completion of an
EHBM based osteoporosis survey instrument?
Answer: Yes, there is some statistically significant differences.
The EHBM categories that were examined include OSES question responses, along with data
from Table 34, a summary of osteoporosis self-efficacy scale (OSES) examining the confidence
scores in performing activities to prevent osteoporosis.

115
Table 34
Summary of Osteoporosis Self-Efficacy Scale (OSES) Examining the Confidence Scores in
Performing Activities to Prevent Osteoporosis
Responses
Scale Mean (SD) Median (IQR)
Exercise scale
Begin a new or different exercise program 56.3 (25.4) 50.0 (39.0-78.0)
Change exercise habits 57.4 (23.7) 54.0 (45.0-70.0)
Put forth effort required to exercise 62.0 (22.9) 55.0 (51.0-78.0)
Do exercise even if they are difficult 59.8 (23.7) 64.0 (42.0-72.0)
Maintain regular exercise program 50.0 (26.3) 58.0 (27.0-65.0)
Exercise for appropriate length of time 53.7 (29.6) 58.0 (28.0-81.0)
Do exercise even if they are tiring 54.0 (28.8) 58.0 (34.0-70.0)
Stick to exercise program 45.8 (28.1) 45.0 (32.0-58.0)
Exercise at least three times a week 50.6 (27.1) 44.0 (31.0-70.0)
Do type of exercises that you are supposed to do 49.0 (27.8) 42.0 (28.0-66.0)
Calcium scale
Increase your calcium intake 60.2 (24.7 ) 60.0 (44.0-76.0)
Consume adequate amounts of calcium rich foods 58.2 (23.9) 62.0 (45.0-75.0)

116
Table 34 (continued)
Eat calcium rich foods on a regular basis 60.4 (25.7) 72.0 (46.0-80.0)
Change your diet to include more calcium rich foods
63.2 (25.3) 72.0 (46.0-80.0)
Eat calcium rich foods as often as you are supposed to do
63.4 (23.9 ) 68.0 (53.0-75.0)
Select appropriate foods to increase your calcium intake
63.8 (25.2) 68.0 (50.0-78.0)
Stick to diet which gives adequate amount of calcium
61.1 (26.3) 67.0 (38.0-80.0)
Obtain foods that give adequate amount of calcium
63.7 (24.9) 71.0 (45.0-78.0)
Remember to eat calcium rich foods 62.8 (25.0) 64.0 (43.0-78.0)
Take calcium supplements if don't get enough calcium from diet
63.6 (29.8) 64.0 (44.0-85.0)

117
Results: OSES Exercise Scale
The mean for the OSES exercise questions ranged from 45.8 to 62. The median for the same
question ranged from 42 to 64.
Analysis: OSES Exercise Scale
There is not a significant difference in means or medians for OSES exercise scale questions.
The data indicates that most respondents had self-efficacy or the ability to engage in exercise to
prevent osteoporosis.
Results: OSES Calcium Scale
The mean for the OSES nutrition questions ranged from58.2 to 63.8. The median ranged from
60 to 72.
Analysis: OSES Calcium Scale
The means and medians were higher for the OSES calcium scale as compared to the OSES
exercise scale. The ranges for the mean and median were less spread out for the calcium scale.
Self-efficacy is high for respondents in the nutrition (calcium) subscale, indicating that most
respondents feel able to obtain proper types and varieties of calcium rich foods, on a regular
basis.
Research Question 3:
3. Does ethnicity have an effect on Nez Perce Tribal and non Nez Perce Tribal member’s
knowledge, attitudes, beliefs and self-efficacy regarding osteoporosis?
Answer: Yes.

118
EHBM Categories, Survey Data and Research Questions
The EHBM categories that were examined included incorrect versus correct knowledge (OKT
questions) about exercise and nutrition in relationship to osteoporosis prevention.
Table 35 is a multivariate analysis of determinants of responses to incorrect vs. correct
knowledge of exercise scales and osteoporosis prevention based on gender, ethnicity and age.
Table 36 is a multivariate analysis of determinants of responses of incorrect vs. correct
knowledge of nutrition scales and osteoporosis prevention based on gender, ethnicity and age.
Table 35
Multivariate Analysis of Determinants of Responses to Incorrect Versus Correct Knowledge of
Exercise Scales and Osteoporosis Prevention.
Exercise subscaleΩ
Characteristics
Being overweight
OR (P-values)
Having eating
disorder OR (P-values)
> 2 Alcoholic drinks per
day OR (P-values)
Low dairy productⱡ OR (P-values)
Exercise hard
enough OR (P-values)
Gender Female (Ref) Male
-
0.77 ( 0.478)
-
1.14 (0.671)
-
0.72 (0.275)
-
0.48 (0.028)
-
1.73 (0.104)
Ethnicity Native American (Ref) Non Native American
-
0.18 (< 0.0001)
-
0.56 (0.053)
-
0.59 (0.077)
-
0.91 (0.749)
-
0.46 (0.020)

119
Table 35 (continued)
Age group (yrs) <= 49 (Ref) >=50
-
0.08 (<0.0001)
-
2.87 (0.004)
-
3.70 (0.0003)
-
2.93 (0.001)
-
0.75 (0.448)
ΩResponses to the knowledge of exercise to prevent osteoporosis were incorrect and correct Odds ratio (OR), p-value less than 0.05 is significant ⱡEating diet low in dairy product

120
Analysis of Table 35: Multivariate Analysis of Determinants of Responses to Incorrect
Versus Correct Knowledge (OKT) of Exercise Scales and Osteoporosis Prevention.
Ethnicity
For being overweight, Non-Native Americans respondents answered this question more
correctly (0.18) than Native American respondents (reference) (1.00).
For having eating disorder, Non-Native American respondents answered this question more
correctly (0.56) than Native American respondents (reference) (1.00).
For > 2 alcoholic drinks per day, Non-Native American respondents answered this question
more correctly (0.59) than Native American respondents (reference) (1.00).
For low dairy product, Non-Native Americans answered this question more correctly (0.91)
than Native Americans (reference) (1.00).
For exercise hard enough, Non-Native American respondents answered this question more
correctly (0.46) than Native Americans (reference) (1.00).

121
Table 36
Multivariate Analysis of Determinants of Responses of Incorrect Versus Correct Knowledge of
Nutrition Scales and Osteoporosis Prevention
Nutrition ScaleΩ
Characteristics
Recommended calciumⱡ
OR (P-values)
Calcium supplement∏
OR (P-values)
Osteoporosis diagnosis OR (P-values)
Strong bones∞ OR (P-values)
Vitamin requiredƍ OR (P-values)
Gender Female (Ref) Male
-
2.82 (0.005)
-
0.98 (0.948)
-
0.44 (0.056)
-
0.30 (0.003)
-
0.68 (0.281)
Ethnicity Native American (Ref) Non Native American
-
4.70 (< 0.0001)
-
2.49 (0.011)
-
1.02 (0.960)
-
0.12 (< 0.0001)
-
0.81 (0.522)
Age group (yrs) <= 49 (Ref) >=50
-
0.11 (< 0.0001)
-
0.03 (0.001)
-
11.4 (< 0.0001)
-
0.48 (0.105)
-
2.37 (0.013)
ΩResponses to the knowledge of nutrition to prevent osteoporosis were incorrect and correct ∞ Best time to build strong bones ƍVitamin required to absorb calcium ∏Best reason for taking a calcium supplement ⱡRecommended amount of calcium Odds ratio (OR), p-value less than 0.05 is significant

122
Analysis of Table 36: Multivariate Analysis of Determinants of Responses of Incorrect
Versus Correct Knowledge (OKT) of Nutrition Scales and Osteoporosis Prevention.
Ethnicity
For recommended calcium, Non-Native Americans answered 4.70 times more incorrectly as
compared to Native Americans (reference) (1.00).
For calcium supplement, Non-Native Americans answered 2.49 times more incorrectly as
compared to Native Americans (reference) (1.00).
For osteoporosis diagnosis, Non-Native Americans answered 1.02 times more incorrectly as
compared to Native Americans (reference) (1.00).
For strong bones, Native Americans answered incorrectly (1.00) more often than Non-Native
Americans (0.12).
For vitamin required, Native American’s answered incorrectly (1.00) more often than Non-
Native Americans (0.81).
Overall Analysis for Table 35 and 36:
Non-Native respondents have a better understanding of the relationship between exercise and
osteoporosis prevention than Native American respondents, but Native American respondents
have higher self-efficacy concerning the willingness and ability to exercise. Native American
respondents also have a better understanding between diet and osteoporosis prevention as
compared to Non-Native respondents, but Non-Native respondents had a better understanding
between strong bones, vitamins and osteoporosis prevention than Native Americans. Health
education in a group format (community presentation) and/or individual discussion with a
healthcare provider can ameliorate some of the misunderstanding about the relationship of the
above categories and osteoporosis in the survey respondents.

123
Research Question 4:
4. Does gender have an effect on Nez Perce Tribal and non Nez Perce Tribal member’s
knowledge, attitudes, beliefs and self-efficacy regarding osteoporosis?
Answer: Yes.
For data regarding multivariate analysis of determinants of responses to incorrect vs. correct
knowledge of exercise scales and osteoporosis prevention and nutrition scales and osteoporosis
prevention, see Table 35 and 36, respectively.
EHBM Categories, Survey Data and Research Questions:
The EHBM Categories that were examined include OKT questions about gender, exercise and
nutrition in relationship to osteoporosis.
Results: Multivariate Analysis of Nutrition and Gender
For recommended calcium, males were 2.82 times more likely to answer incorrectly than
females.
For calcium supplements, males answered 0.98 incorrectly. Since 0.98 is less than 1.00, these
results indicated that females were more likely to answer incorrectly for calcium supplements
than males, which is of research interest.
For osteoporosis diagnosis, males answered 0.44 incorrectly. Since 0.44 is less than 1.00, this
results indicates that females were more likely to answer incorrectly for osteoporosis diagnosis
than males, which is of research interest.
For strong bones, males (0.30) answered this question more correctly than females (reference)
(1.00). This is of some research interest.
124
For vitamin required, males answered this question more correctly (0.68) than females
(reference) (1.00). This is of some research interests.
Results: Multivariate Analysis of Exercise and Gender
For being overweight, male respondents answered this question more correctly (0.77) than
female respondents (reference) (1.00).
For having an eating disorder, male respondents answered this question more incorrectly
(1.14) than female respondents (reference) (1.00).
For > 2 alcoholic drinks per day, male respondents answered this question more correctly
(0.72) than female respondents (reference) (1.00).
For low dairy product, males answered this question more correctly (0.48) than female
respondents (reference) (1.00).
For exercise hard enough, males answered this question more incorrectly (1.73) than female
respondents (reference) (1.00).
Analysis of Nutrition, Exercise and Gender
Male respondents had a better understanding of weight, alcohol consumption and low dairy
product in relation to osteoporosis prevention, and women had a better understanding of how an
eating disorder and exercising hard enough related to osteoporosis prevention.
Research Question 5:
5. Does age have an effect on Nez Perce Tribal and non Nez Perce Tribal member’s knowledge,
attitudes, beliefs and self- efficacy regarding osteoporosis?
Answer: Yes.

125
EHBM Categories, Survey Data and Research Questions:
The EHBM Categories examined include OKT and OHBS questions about age, exercise and
nutrition in relationship to osteoporosis prevention. To examine survey responses for research
question 5, please see Table’s 35 and 36.
Results: Multivariate Analysis of Exercise and Age
Table 35 Responses:
For being overweight, respondents 50 YOA or older answered this question more correctly
than respondents 49 YOA or younger (reference) (1.00).
For having eating disorder, respondents 50 YOA or older answered this question more
incorrectly (2.87) than did respondents 49 YOA or younger (reference) (1.00)
For > 2 alcoholic drinks per day, respondents 50 YOA or older answered this question more
incorrectly (3.70) than did respondents 49 YOA or younger (reference) (1.00)
For low dairy product, respondents 50 YOA or older answered this question more incorrectly
(2.93) than did respondents 49 YOPA or younger (Reference) (1.00).
For exercise hard enough, respondents 50 YOA or older answered this question more
correctly (0.75) than did respondents 49 YOA or younger (reference) (1.00).
Results: Multivariate Analysis of Nutrition and Age
Table 36 Responses
For recommended calcium, respondents 50 YOA (years of age) or older answered more
correctly (0.11) than respondents 49 YOA or less (reference) (1.00).
For calcium supplements, respondents 50 YOA or older answered more correctly (0.03) than
respondents 49 YOA or less (reference) (1.00).
126
For osteoporosis diagnosis, respondents 50 YOA or older answered significantly less
correctly (11.4) then respondents 49 YOA or less (reference) (1.00). This is quite a variation that
requires further evaluation.
For strong bones, respondents 50 YOA or older answered more correctly (0.48) that
respondents 49 YOA or less (reference) (1.00).
For vitamin required, respondents 50 YOA or older answered more correctly (0.48) than
respondents 49 YOA or younger (reference) (1.00).
Analysis
Respondents 50 years of age (YOA) and older had a better understanding of nutrition
(calcium intake) and strong bones in regards to osteoporosis prevention, whereas respondents 49
years of age (YOA) and younger had a better understanding of weight, eating disorder, alcohol
and dairy consumption in relationship to osteoporosis prevention.
Research Question 6:
6. Do Nez Perce Tribal members and non Nez Perce Tribal members understand the relationship
between nutrition and osteoporosis?
Answer: Yes.
The EHBM categories that were examined include OKT, OHBS and OSES questions that are
found in Table 31, p. 103, Table 32, p. 105, Table 33, p. 107, Table 34, p. 111, Table 35, p. 114,
Table 36, p. 116, Table 37, p. 123 and Table 38, p. 127.
Results: Knowledge about Nutrition and Osteoporosis Prevention
Respondents correctly answered OKT questions related to nutrition and osteoporosis
prevention in the following areas: Best source of calcium: apple, cheese, cucumber (81.3%), best
source of calcium: peanut butter, turkey, canned sardines (50.2%), best source of calcium:

127
chicken, broccoli, grapes (68.9%), best source of calcium: yogurt, strawberries, cabbage
(81.3%), best source of calcium: ice cream, grapefruit, radishes (68.9%), best reason for taking a
calcium supplement (75.1%), vitamin required to absorb calcium (75.1%), best source of vitamin
to absorb calcium (81.3%), osteoporosis diagnosis (75.1%), and once you have osteoporosis
(62.7%).
Analysis: Knowledge about Nutrition and Osteoporosis Prevention
Respondents have a good understanding of the relationship between sources of calcium as it
relates to osteoporosis diagnosis and treatment. Areas where respondents had incorrect
understanding regarding nutrition and osteoporosis prevention were recommended amounts of
calcium, amount of milk to drink to get adequate calcium, and the relationship between the
amount and sources of calcium need on a daily basis to prevent osteoporosis. Table 37
demonstrates participant’s perspective on the benefits and barriers to calcium intake in order to
prevent osteoporosis.
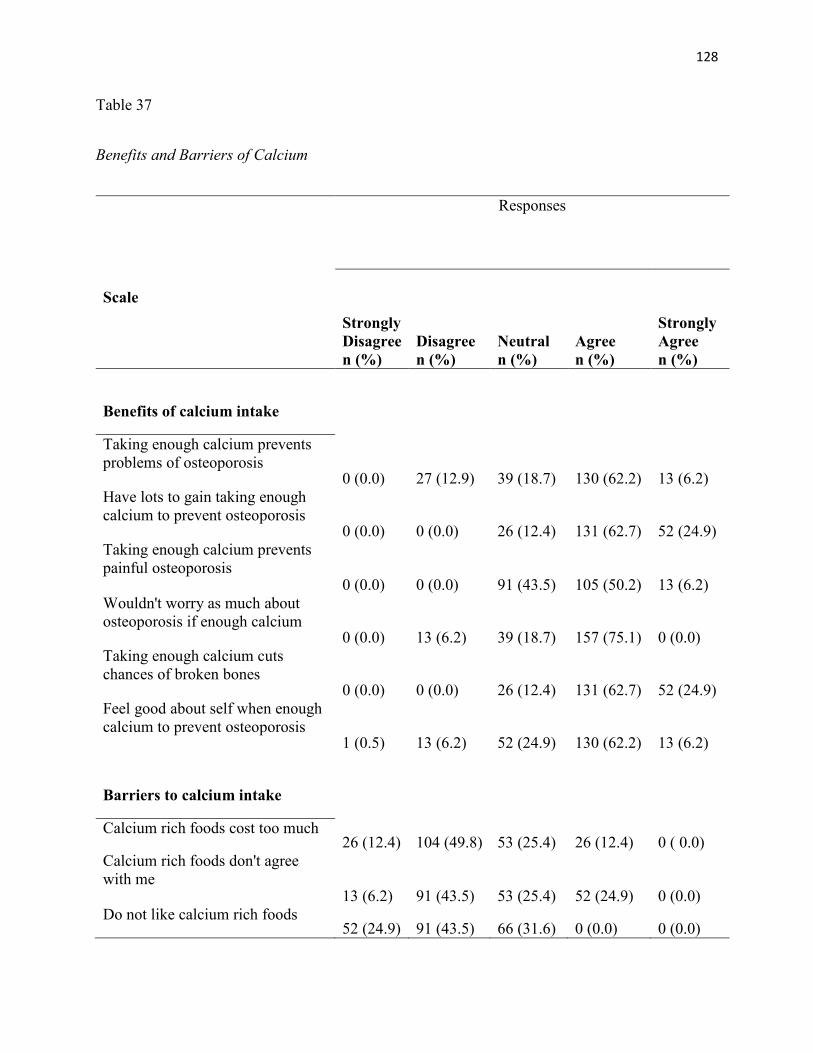
128
Table 37
Benefits and Barriers of Calcium
Responses
Scale
Strongly Disagree n (%)
Disagree n (%)
Neutral n (%)
Agree n (%)
Strongly Agree n (%)
Benefits of calcium intake
Taking enough calcium prevents problems of osteoporosis
0 (0.0) 27 (12.9) 39 (18.7) 130 (62.2) 13 (6.2) Have lots to gain taking enough calcium to prevent osteoporosis
0 (0.0) 0 (0.0) 26 (12.4) 131 (62.7) 52 (24.9) Taking enough calcium prevents painful osteoporosis
0 (0.0) 0 (0.0) 91 (43.5) 105 (50.2) 13 (6.2) Wouldn't worry as much about osteoporosis if enough calcium
0 (0.0) 13 (6.2) 39 (18.7) 157 (75.1) 0 (0.0) Taking enough calcium cuts chances of broken bones
0 (0.0) 0 (0.0) 26 (12.4) 131 (62.7) 52 (24.9) Feel good about self when enough calcium to prevent osteoporosis
1 (0.5) 13 (6.2) 52 (24.9) 130 (62.2) 13 (6.2)
Barriers to calcium intake
Calcium rich foods cost too much
26 (12.4) 104 (49.8) 53 (25.4) 26 (12.4) 0 ( 0.0) Calcium rich foods don't agree with me
13 (6.2) 91 (43.5) 53 (25.4) 52 (24.9) 0 (0.0) Do not like calcium rich foods
52 (24.9) 91 (43.5) 66 (31.6) 0 (0.0) 0 (0.0)

129
Table 37 (continued)
Eating calcium rich foods diet changes hard to do
13 (6.2) 117 (56.0) 53 (25.4) 26 (12.4) 0 (0.0) To eat more calcium foods have to give up other I like
27 (12.9) 143 (68.4) 39 (18.7) 0 (0.0) 0 (0.0) Calcium rich foods have too much cholesterol
26 (12.4) 91 (43.5) 79 (37.8) 13 (6.2) 0 (0.0

130
Results: Benefits to Calcium Intake and Osteoporosis Prevention
130 respondents (62.2%) agree that taking enough calcium prevents problems with
osteoporosis. 131 respondents (62.7%) agree that there are benefits to taking calcium to prevent
osteoporosis. 105 respondents (50.2%) agree that taking enough calcium prevents osteoporosis
that that is painful (i.e.: spinal compression fractures, hip and forearm fractures, etc.), 157
respondents (75.1%) agree that if they eat enough calcium and it was absorbed properly, they
would not care as much about osteoporosis. 131 respondents (62.7%) agreed enough calcium can
help prevent fractures. 130 respondents (62.7%) agree that they feel good about themselves when
they obtained enough calcium to prevent osteoporosis.
Analysis: Benefits to Calcium Intake and Osteoporosis Prevention
Anywhere from 50.2% to 75.1% of respondents know that they can prevent or mitigate
osteoporosis and osteoporosis related fractures if they get enough calcium that can be absorbed.
This demonstrates good knowledge about the relationship between calcium intake and the
prevention of osteoporosis. Educating all respondents in Nez Perce County, ID (Native American
and Non-Native Americans) about what types of calcium to take, how much to take each day,
where to get calcium rich foods, and how it is absorbed in the body could be beneficial to these
individuals.
Results: Barriers to Calcium Intake and Osteoporosis Prevention
104 respondents (49.8%) did not agree that “calcium rich foods cost too much”. 117
respondents (56%) disagreed that “eating a calcium rich diet is hard to do”. 143 respondents
(68.4%) did not agree that "to eat more calcium foods, I would have to give up foods I like”.

131
Analysis: Barriers to Calcium Intake and Osteoporosis Prevention
Anywhere from 49.8% to 68.4% of the respondents indicated that they would not have
trouble purchasing and eating calcium rich foods. Community health education efforts and
individual providers can reinforce this knowledge regarding the relationship between obtaining
and eating calcium rich foods on a regular basis to prevent osteoporosis. Look at Table 34 on p.
111 for a summary of Osteoporosis Self-Efficacy Scale (OSES) Examining the Confidence
Scores in Performing Activities to Prevent Osteoporosis
Results: OSES Calcium Scale
The mean for the OSES nutrition questions ranged from58.2 to 63.8. The median ranged from
60 to 72.
Analysis: OSES Calcium Scale
The means and medians were higher for the OSES calcium scale as compared to the OSES
exercise scale. The ranges for the mean and median were less spread out for the calcium scale.
Self-efficacy seems good for respondents in the nutrition (calcium) subscale, indicating that most
respondents are likely to obtain proper types and varieties of calcium rich foods, on a regular
basis. Exercise self-efficacy is high for respondents, indicating that they are able or willing to
exercise regularly to prevent osteoporosis.
Research Question 7:
7. Do Nez Perce Tribal members and non Nez Perce Tribal members understand the relationship
between exercise and osteoporosis?
Answer: Yes.

132
EHBM Categories, Survey Data and Research Questions
The EHBM categories that were examined include OKT, OHBS and OSES questions. Table
31 on p. 104 is a summary of knowledge (OKT) about exercise and osteoporosis prevention.
Table 34 on p. 111 is a summary of osteoporosis self-efficacy scales (OSES) examining the
confidence scores in performing activities to prevent osteoporosis. Table 38 on p. 127 is a
summary of beliefs (OHBS) about barriers and benefits for exercise and osteoporosis prevention.
Results: Knowledge About Exercise and Osteoporosis Prevention
More respondents answered OKT questions correctly concerning exercise and osteoporosis in
the following areas: Being menopausal (56%), having parent or grandparent who has
osteoporosis (50.2%), exercises hard enough (75.1%), best way to reduce osteoporosis: swim,
walk, stretching (56%), best way to reduce osteoporosis jogging, golfing, gardening ((56), and
the best way to reduce osteoporosis: bowling, doing laundry, aerobic dancing (68.9%).
Analysis: Knowledge about Exercise and Osteoporosis Prevention
Respondents have a correct understanding of the relationship between exercise and
osteoporosis, but an incorrect understanding between 1) diet, 2) gender, 3) ethnicity, and 4) age
in relationship to osteoporosis. Health education in a group format (community presentation)
and/or individual discussion with a healthcare provider can ameliorate some of the
misunderstanding about the relationship of the above categories and osteoporosis in the survey
respondents. Table 38 demonstrates participant’s beliefs on the benefits and barriers of exercise
to prevent osteoporosis.
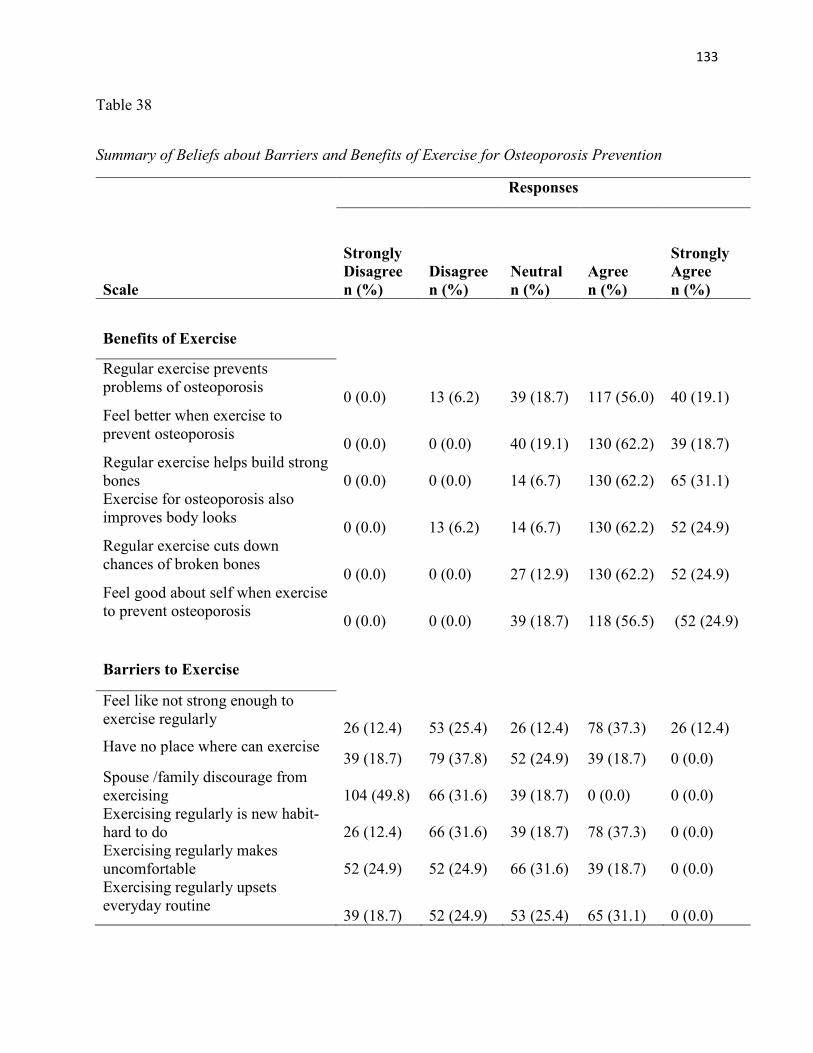
133
Table 38
Summary of Beliefs about Barriers and Benefits of Exercise for Osteoporosis Prevention
Responses
Scale
Strongly Disagree n (%)
Disagree n (%)
Neutral n (%)
Agree n (%)
Strongly Agree n (%)
Benefits of Exercise
Regular exercise prevents problems of osteoporosis
0 (0.0) 13 (6.2) 39 (18.7) 117 (56.0) 40 (19.1) Feel better when exercise to prevent osteoporosis
0 (0.0) 0 (0.0) 40 (19.1) 130 (62.2) 39 (18.7) Regular exercise helps build strong bones 0 (0.0) 0 (0.0) 14 (6.7) 130 (62.2) 65 (31.1) Exercise for osteoporosis also improves body looks
0 (0.0) 13 (6.2) 14 (6.7) 130 (62.2) 52 (24.9) Regular exercise cuts down chances of broken bones
0 (0.0) 0 (0.0) 27 (12.9) 130 (62.2) 52 (24.9) Feel good about self when exercise to prevent osteoporosis
0 (0.0) 0 (0.0) 39 (18.7) 118 (56.5) (52 (24.9)
Barriers to Exercise
Feel like not strong enough to exercise regularly
26 (12.4) 53 (25.4) 26 (12.4) 78 (37.3) 26 (12.4) Have no place where can exercise
39 (18.7) 79 (37.8) 52 (24.9) 39 (18.7) 0 (0.0) Spouse /family discourage from exercising 104 (49.8) 66 (31.6) 39 (18.7) 0 (0.0) 0 (0.0) Exercising regularly is new habit-hard to do 26 (12.4) 66 (31.6) 39 (18.7) 78 (37.3) 0 (0.0) Exercising regularly makes uncomfortable 52 (24.9) 52 (24.9) 66 (31.6) 39 (18.7) 0 (0.0) Exercising regularly upsets everyday routine
39 (18.7) 52 (24.9) 53 (25.4) 65 (31.1) 0 (0.0)

134
Results: Benefits of Exercise:
117 respondents (56%) agreed that “regular exercise prevents problems with osteoporosis”.
130 respondents (62.2%) agreed that they “feel better when they exercise to prevent
osteoporosis”. 130 respondents (62.2%) agreed that “regular exercise builds strong bones”. 130
respondents (62.2%) agreed that “exercise for osteoporosis also improves body looks". 130
respondents (62.2%) agreed that “regular exercise cuts down on chances of broken bones”. 118
respondents (56.5%) agreed that they “feel good about themselves when exercising to prevent
osteoporosis”.
Analysis: Benefits of Exercise:
Anywhere from 56% to 62.2% of respondents agreed that engaging in regular exercise to
reduce the likelihood of osteoporosis, exercising to reduce the likelihood of fractures due to
osteoporosis, exercising to make themselves look better physically and to feel better about
themselves emotionally, and exercising to prevent osteoporosis indicates a good understanding
of the relationship between regular exercise and osteoporosis prevention.
Results: Barriers to Exercise
104 respondents (49.8%) strongly disagreed with the question “spouse/family discourages one
from exercising”. This was the most significant response statically and empirically.
Analysis: Barriers to Exercise
The respondents did not identify any significant barriers to exercise as ascertained by
examination of the above survey responses and had good self-efficacy regarding the ability to
exercise to prevent osteoporosis. Look at Table 34 on p. 111 for a summary of Osteoporosis Self-

135
Efficacy Scale (OSES) Examining the Confidence Scores in Performing Activities to Prevent
Osteoporosis
Results: OSES Exercise Scale
The mean for the OSES exercise questions ranged from 45.8 to 62. The median for the same
question ranged from 42 to 64.
Analysis: OSES Exercise Scale
There is not a significant difference in means or medians for OSES exercise scale questions.
The data indicates that most respondents had self-efficacy or the ability to engage in exercise to
prevent osteoporosis.
Multiple Regression Comparing All Independent Variables (IV) to Health Motivation as
the Dependent Variable (DV)
A multiple regression analysis was conducted using the independent variables of age, gender,
ethnicity, knowledge of exercise, knowledge of nutrition, susceptibility to osteoporosis,
seriousness of osteoporosis, benefits of exercise, benefits of calcium, barriers to exercise, barriers
to calcium, self-efficacy exercise and self-efficacy calcium with health motivation as the
dependent variable. The results are shown below in Table 39.

136
Table 39
Unstandardized OLS Coefficients for Predictors of Health Motivation Based on the
EHBM MULTIPLE REGRESSION ANALYSIS
Predictor Model 1 Model 2 Model 3 Model 4 Constant 20.069 *** 23.085 *** 47.953 *** 65.854 *** Age 0.049 * 0.002 0.075 *** 0.040 *** Gender 0.533 0.297 0.371 0.554 ** Ethnicity 0.540 –0.035 –0.525 * –0.165 Knowledge Exercise 0.572 *** 1.016 *** 1.504 *** Knowledge Nutrition –0.437 *** –0.584 *** –0.827 *** Susceptibility 0.175 *** –0.025 Seriousness 0.251 *** 0.232 *** Benefits Exercise –0.345 *** –0.876 *** Benefits Calcium –1.197 *** –1.225 *** Barriers Exercise 0.248 *** 0.542 *** Barriers Calcium –0.439 *** –0.839 *** Self-Efficacy Exercise 0.098 *** Self-Efficacy Calcium –0.069 *** Note. * < 0.05, ** < 0.01, *** < 0.001. Model 1 R2 = 0.035. Model 2 R2 = 0.219. Model 3 R2 = 0.829. Model 4 R2 = 0.878.
• DV = "Health Motivation" for all 4 models • IVs = • Model 1: Age, gender, and ethnicity • Model 2: Age, gender, ethnicity, knowledge of exercise, and knowledge of
nutrition • Model 3: Age, gender, ethnicity, knowledge of exercise, knowledge
of nutrition, susceptibility, seriousness, benefits of exercise, benefits of calcium, barriers to exercise, and barriers to calcium
• Model 4: Age, gender, ethnicity, knowledge of exercise, knowledge of nutrition, susceptibility, seriousness, benefits of exercise, benefits of calcium, barriers to exercise, barriers to calcium, self-efficacy for exercise, and self-efficacy for calcium

137
Table 40
Results of a Multivariate Analysis of Variance (MANOVA) for EHBM Constructs
MULTIVARIATE ANALYSIS OF VARIANCE
Sequence: MANOVA Two-Way ANOVA for all DVs Two-Way ANOVA for sig. DV
t-tests for simple main effects
Effect Λ F df1 df2 p Gender 0.850 3.139 11 195 0.000632 Ethnicity 0.554 14.254 11 195 < 0.0001 Gender*Ethnicity 0.645 9.749 11 195 < 0.0001 Note. Wilk’s lambdas were used for the multivariate tests
• DVs = Knowledge of exercise, knowledge of nutrition, susceptibility, seriousness, benefits of exercise, benefits of calcium, barriers to exercise, barriers to calcium, self-efficacy for exercise, and self-efficacy for calcium
• IVs = Gender, ethnicity, and the interaction between gender/ethnicity.

138
Table 41
Results of Two-Way Analysis of Variance (ANOVA) Tests for the Interaction Effect of Gender
and Ethnicity on EHBM Constructs
Dependent Variable
Type III Sum of Squares
df
Mean Square
F
p
Knowledge Exercise 0.750 1 0.750 0.390 0.844
Knowledge Nutrition 0.101 1 0.101 0.004 0.948
Susceptibility 53.537 1 53.537 3.410 0.066
Seriousness 15.926 1 15.926 1.070 0.302
Benefits Exercise 8.903 1 8.903 1.007 0.317
Benefits Calcium 25.179 1 25.179 3.939 0.048
Barriers Exercise 0.554 1 0.554 0.029 0.864
Barriers Calcium 76.761 1 76.761 9.441 0.002
Self-Efficacy Exercise 4,362.236 1 4,362.236 7.769 0.006
Self-Efficacy Calcium 1,479.006 1 1,479.006 2.635 0.106
Health Motivation 20.082 1 20.082 2.140 0.145
Note. All p-values were evaluated at a Bonferroni adjusted per-comparison alpha level of 0.0045 (i.e., 0.05 family-wise alpha ÷ 11 tests = 0.0045)
• DVs (separately) = Knowledge of exercise, knowledge of nutrition, susceptibility, seriousness, benefits of exercise, benefits of calcium, barriers to exercise, barriers to calcium, self-efficacy for exercise, and self-efficacy for calcium
• IVs = gender and ethnicity with interaction effect

139
• DV=Barriers to calcium. • IV’s=Gender and ethnicity with interaction effect.
• Figure 5. Interaction for Gender and Ethnicity on the DV (i.e., barriers to
calcium).
Table 42
Results of a Two-Way ANOVA for Perceived Barriers to Calcium Intake
Source
Type III Sum of
Squares
df
Mean Square
F
p
Gender 47.871 1 47.871 5.888 0.016 Ethnicity 438.875 1 438.875 53.979 < 0.0001 Gender*Ethnicity 76.761 1 76.761 9.441 0.002 Error 1,666.757 205 8.131 Total 43,364.000 209 Note. R2 = 0.289

140
Table 43
Main Effects-Results of Simple Main Effects t-tests for Barriers to Calcium Intake
Mean Difference
df t p
1. Females: Native American – Non-Native American
4.22344
126
8.007
< 0.0001
2. Males: Native American – Non-Native American
1.73256
79
2.962
0.0040
3. Native American: Females – Males
2.22898
106
3.473
0.0007
4. Non-Native American: Female – Males
–0.26190
99
–0.548
0.5850
Note. All p-values were evaluated at a Bonferroni adjusted per-comparison alpha level of 0.0125 (i.e., 0.05 family-wise alpha ÷ 4 tests = 0.0125)
o DV = Barriers to calcium intake o IVs =
(1) Native vs. non-native American females (2) Native vs. non-native American males (3) Native American females vs. native American males (4) Non-native American females vs. non-native American males
Interpretation of t-Tests
1. Among females only, Native Americans perceived more barriers to calcium intake than
Non-Native Americans.
2. Among males only, Native Americans perceived more barriers to calcium intake than
Non-Native Americans
3. Among Native Americans only, females perceived more barriers to calcium intake than
males.
4. Among Non-Native Americans only, there was no significant difference in perceived
barriers to calcium intake between males and females.
5. Therefore, female Native Americans perceived the greatest barriers to calcium intake.

141
Summary
Correlation was strongest for ethnicity, gender and OHBS question responses as compared to
ethnicity, gender and OKT question responses. The OHBS questions deal more with current and
expected behavior regarding prevention, mitigation and treatment of osteoporosis, whereas the
OKT questions deal more with respondent’s knowledge about osteoporosis prevention and
treatment. Female Native Americans perceived the greatest barriers to calcium intake of any of
the groups, whereas exercise self-efficacy, barriers to calcium and benefits of calcium were
statistically significant for ethnicity and gender in the two-way ANOVA analysis.
Regarding OSES questions, Native American respondents have better self-efficacy for
exercise and osteoporosis prevention than for nutrition and osteoporosis prevention. Non-Native
American respondents have a good basic understanding of nutrition and osteoporosis prevention,
but both ethnic groups lack specific knowledge of how much, what types and how often to take
calcium, which is somewhat disconcerting.
Both ethnic and gender group respondents have a good understanding of what osteoporosis is
and what effect it will have on one’s life (seriousness). In addition, this study helped get a better
understanding of how likely respondents were to getting osteoporosis (susceptibility) and how
diet, calcium intake, vitamin intake, and proper exercise can reduce the likelihood and/or severity
of osteoporosis.
142
CHAPTER 5
DISCUSSION, CONCLUSIONS AND RECOMMENDATIONS
This chapter examines the purpose of the study, a summary of findings, conclusions,
discussion, limitations, and recommendations for future study and a final overarching summary
of this study.
Purpose of Study
This study sought to answer the following research questions:
1. What do Nez Perce Tribal members and non-Nez Perce Tribal members know about
osteoporosis?
2. Is there a statistically significant difference in osteoporosis knowledge, attitudes, beliefs and
self-efficacy among Nez Perce Tribal members and non Nez Perce Tribal members, male and
female, aged 18 and over residing in Nez Perce County, ID as evidenced by completion of an
EHBM based osteoporosis survey instrument?
3. Does ethnicity have an effect on Nez Perce Tribal and non Nez Perce Tribal member’s
knowledge, attitudes, beliefs and self-efficacy regarding osteoporosis?
4. Does gender have an effect on Nez Perce Tribal and non Nez Perce Tribal member’s
knowledge, attitudes, beliefs and self-efficacy regarding osteoporosis?
5. Does age have an effect on Nez Perce Tribal and non Nez Perce Tribal member’s knowledge,
attitudes, beliefs and self- efficacy regarding osteoporosis?
6. Do Nez Perce Tribal members and non Nez Perce Tribal members understand the relationship
between nutrition and osteoporosis?

143
7. Do Nez Perce Tribal members and non Nez Perce Tribal members understand the relationship
between exercise and osteoporosis?
Using the research questions previously stated, this study examined whether or not there were
any differences in osteoporosis knowledge, attitudes, beliefs and self-efficacy between male and
female, aged 18 and over, Nez Perce Tribal members as compared to Non Nez Perce Tribal
members residing in Nez Perce County, ID. This was primarily a descriptive survey study.
Demographics
There were a total of 209 individuals completing the study successfully. 215 participants
began the study, but 6 subjects either failed to note their respective ethnicity or to complete the
survey instruments. There were 65 Native American females, 43 Native American males, 43
Non-Native American females and 38 Non-Native American males in the study. Age of the
participants ranged from 18 to 92.
Survey Question Responses
Nez Perce Tribal members answered more survey questions correctly than Non Nez Perce
Tribal members regarding nutrition and osteoporosis prevention in the following areas:
• Best source of calcium: (73.1% correct vs 65.4%, p = 0.002).
• Best food source of vitamin to absorb calcium: (20.4% correct vs. 17.8%, p = 0.640).
• Recommended amount of vitamin to absorb calcium: (13.9% correct vs 10.9%, p =
0.512).
• Once you have osteoporosis (77.8% correct vs 46.5, p < 0.0001).
• Recommended amount of calcium (59.3% correct vs 26.7%, p < 0.0001).

144
• Amount of milk to drink to meet recommended calcium levels (55.6% correct vs 43.6%,
p = 0.083).
• Best reason for talking calcium supplement (84.3% correct, vs 65.4%), p = 0.002).
For questions regarding the association between ethnicity and knowledge of exercise to
prevent osteoporosis, Non-Native Americans answered survey questions more correctly than
Native Americans.
For questions related to an association between gender and knowledge of nutrition to prevent
osteoporosis, females answered the following questions more correctly than males:
• Best source of calcium: apple, cheese, cucumber (85.2% correct vs 75.3%, p = 0.075).
• Best source of calcium: chicken, broccoli, grapes (72.85 correct vs 66.4%, p = 0.328).
• Best source of calcium: yogurt, strawberries, cabbage (84.8% correct vs 76.5%, p =
0.157).
• Best source of calcium: ice cream, grapefruit, radishes (69.5% correct vs 67.9%, p =
0.804).
• Recommended amount of calcium: (53.9% correct vs 27.2%, p < 0.0001).
• Amount of milk to drink to meet recommended calcium (57.0% correct vs 38.3%, p =
0.008).
• Best reason for taking a calcium supplement (77.3% correct vs 71.6%, p = 0.350).
Men answered the following questions relating to nutrition and osteoporosis prevention more
correctly than females:

145
• Vitamin required to absorb calcium (81.5% correct vs 71.1%, p = 0.091).
• Best source of vitamin to absorb calcium (92.6% correct vs 74.2%, p < 0.0001).
• Best food source of vitamin to absorb calcium (25.9% correct vs 14.8%, p = 0.047).
• Best time to build strong bones (27.2% correct vs 13.3%, p = 0.012).
• Osteoporosis diagnosis (87.7% correct vs 67.2%, p = 0.001).
• Once you have osteoporosis (63% correct vs 62.5%)
For questions related to an association between gender and knowledge of exercise to
prevent osteoporosis, men answered the following questions most correctly:
• Having parent or grandparent who has osteoporosis (63.0% correct vs 42.2%, p =
0.003).
• Taking cortisone a long time (46.9% correct vs 31.3%, p = 0.023).
• > 2 alcoholic drinks per day (51.9% correct vs 38.3%, p = 0.054).
• Smoking daily (51.9% correct vs 38.3%, p = 0.054).
• Best way to reduce osteoporosis: swim, walk, stretching (58.0% correct vs 54.7%, p =
0.636).
• Best way to reduce osteoporosis (45.7% correct vs 32.0%, p = 0.047).
For questions relating exercise to osteoporosis prevention, women answered these questions
more correctly than males.
• Being white or Asian woman (43.8% correctly vs 43.2%, p = 0.939).
• Being an elderly man (25.8% correct vs 7.4%, p = 0.001).
• Being overweight (33.6% correct vs 27.2%), p = 0.328).
• Having eating disorder (36.7% correct vs 27.2%, p = 0.821).

146
• Number of days per week to do exercise (17.2% correct vs 4.9%, p = 0.009).
• Exercise hard enough (79.7% correct vs 67.9%, p = 0.055).
• Best way to reduce osteoporosis: jogging, golfing, gardening (56.3% correct vs 55.6%, p
= 0.922).
• Best way to reduce exercise: bowling, doing laundry, aerobic dancing (70.3% correct vs
66.7%, p = 0.579).
Summary of Findings
Nez Perce tribal members answered survey questions more correctly than Non Native
Americans on nutrition and osteoporosis prevention questions in the areas of best source of
calcium, best food source of vitamins to absorb calcium, recommended amounts of vitamins to
absorb calcium, recommended amount of calcium, amount of milk to drink and reason to take
calcium supplements. Non-Native Americans answered more survey questions relating exercise
and osteoporosis prevention more correctly than Native Americans.
Males answered survey questions relating nutrition to osteoporosis prevention more correctly
than females in the areas of vitamins best to build strong bones, what to do once you have
osteoporosis and an osteoporosis diagnosis. Females answered survey questions relating nutrition
to osteoporosis, more correctly in areas of all best food sources for calcium, recommended
amount of calcium and best reasons for taking calcium supplements.
Males answered survey questions relating exercise to osteoporosis prevention more correctly
in areas of having parent or grandparent with osteoporosis, taking cortisone a long period of
time, drinking more than 2 alcoholic drinks per day, smoking, and best way to reduce
osteoporosis: swim, walk, stretching and the best way to reduce osteoporosis: bicycling, yoga,

147
lift weights. Women answered survey questions relating exercise to osteoporosis prevention
more correctly in the areas of being a white or Asian woman, being an elderly man, being
overweight, having an eating disorder, number of days per week to exercise, exercising hard
enough, best way to reduce osteoporosis: jogging, golfing, gardening, and the best way to reduce
osteoporosis: bowling, doing laundry, aerobic dancing.
Nez Perce Tribal members essentially have the same diet as Non Nez Perce Tribal members
and do not participate anymore in the historical ways of capturing and preparing food (i.e.:
salmon and eating camas roots, etc.). Economic and geographic access to store bought calcium
laden foods is readily available on and off the Nez Perce reservation. Exercise levels are
diminished in members of the Nez Perce Tribe overall because buses transport everyone to the
grocery store, to the clinic and casinos on the reservation. If scheduled on the community bus
service, Nez Perce Tribal members can even be driven to Lewiston, ID and Clarkston, WA for
medical appointments. Because Nez Perce tribal members do not frequently walk or ride bicycles
on the reservation, and many work nearby at the adjacent reservation casinos, there is a minimal
effort or necessity to engage in regular, weight bearing exercise that could diminish the
likelihood of Nez Perce tribal members getting osteoporosis.
Non-Native Americans not living on the reservation tend to ride a bicycle and to walk more
along the Snake and Columbia Rivers because there are safe, well-lit trails in Lewiston and
Clarkston, but such trails are not found in Lapwai, ID. It is less safe to walk along the river on
the reservation and there is more gun violence and altercations on the reservation then off the
reservation. This has a negative impact on regular weight-bearing exercise by Nez Perce tribal
members, but the recent opening of a free, 24-hour access health and fitness center has increased

148
Nez Perce Tribal member exercise self-efficacy for those individuals whom live on the
reservation in Lapwai, ID.
Conclusions
Self-Efficacy and Health Motivation
Knowledge of Nutrition and Osteoporosis = Health Motivation:
Health motivation was elevated even in cases were knowledge of nutrition was low.
Respondents had a good understanding of the relationship between sources of calcium as it
relates to osteoporosis, diagnosis and treatment. Areas where respondents had incorrect
understanding regarding knowledge of nutrition and osteoporosis were recommended amounts of
calcium, amount of milk to drink to get adequate calcium, and the relationship between the
amount of and source of calcium needed on a daily basis to prevent osteoporosis. Perhaps
knowledge of exercise is enough to produce motivation to prevent osteoporosis. Individuals with
low levels of nutrition knowledge still have motivation to reduce their risk for osteoporosis.
Knowledge of exercise was the greatest predictor of health motivation (Model 4: 1.504).
Susceptibility to Osteoporosis = Health Motivation:
Even though overall participants didn’t think that they were very susceptible to osteoporosis,
some respondents still thought that osteoporosis could negatively affect their health (I.e.: the
“seriousness” variable). So, even though there was low perceived susceptibility to osteoporosis,
respondents still had a high level of motivation to prevent osteoporosis because they were fearful
of developing osteoporosis which could interfere with their activities of daily living (ADL’s).

149
Benefits to Exercise to Prevent Osteoporosis and Calcium Intake to Prevent Osteoporosis =
Health Motivation:
Some study participants mostly had low to moderate levels of knowledge about the benefits
of exercise and calcium in the prevention of osteoporosis, but because of other variables, such as
exercise self-efficacy, they were motivated to prevent osteoporosis.
Barriers to Exercise to Prevent Osteoporosis = Health Motivation:
Whiles some study participant’s perceived barriers to exercise, there was also high self-
efficacy for exercise. This means that these respondents are hopeful about the opportunity to
exercise and would engage in exercise activities in the future. The Nez Perce Tribal Clinic, to
which all Nez Perce Tribal members have access, had a new fitness constructed next to the
clinic. This fitness center is open twenty-four hours a day, year round. The fitness center is
frequently used by most tribal member not just as an exercise facility, but as a social gathering
place, particularly in the winter. Free, twenty-four-hour access to this fitness center may account
for increased exercise self-efficacy among many of the Nez Perce tribal respondents.
Self-Efficacy Calcium = Barriers to Calcium:
This was not a large problem for the study participants, so access is not the issue. It is
possible however, that some study participants did not view calcium rich foods as being a part of
their diet, therefore, they didn’t think they could easily integrate these type of foods into their
diet or lifestyle. However, because of the other positive beta coefficients, these respondents still
had high health motivation to prevent osteoporosis.

150
Study Instrument Factors
The survey instruments are designed to be read at the 5th grade reading level. It is possible
that some study participants could not or did not read the survey instruments at this level, and
therefore comprehension of the questions were skewed by this lack of comprehension.
In addition, there were (3) survey instruments, with a total of 95 questions. It is possible that
study participants underwent questionnaire fatigue and hurried through the surveys without
answering all questions in a correct or truthful manner.
Discussion
Existing literature regarding use of the EHBM and Osteoporosis among Native Americans
men and women was examined in this section. A comparison of the findings of this research
study was made with findings of other studies dealing with osteoporosis. Filner (2001) found in
his study of Alaska natives that Alaska Natives consumed less calcium than Caucasians due to a
higher incidence of lactose intolerance in indigenous peoples on average. Nobmann (1992) found
that Alaska native’s women consumed 516 mg/day of calcium compared to 597 mg/day for
Caucasian females in the NHANES II study (Nicholas and Chen, 2002).
Sunlight exposure is less in Northern Idaho than near the equator. Sunlight is important in
minimizing osteoporosis because it is essential for converting 7-dehydrocholesterol into
previtamin D3, which is needed to allow calcium absorption in the skeletal system (Bleeker,
2001). Since Nez Perce Tribal members and Non Nez Perce Tribal members living in North
Idaho are exposed to less sunlight because of distance from the equator, both groups may have a
higher incidence of osteoporosis than others located in different parts of the world.

151
According to Bleeker (2001), “a gender bias in osteoporosis research exists that is comparable
to women in cardiac research “Such a bias may also exist in osteoporosis research, with men and
non-Caucasians as the understudied groups. According to Bleeker (2001), predisposing factors
for osteoporosis in men included advanced age, excessive alcohol intake, cigarette smoking,
inadequate calcium intake, sedentary lifestyle, medication history (glucocorticosteroid use), and
medical history (hypogonadism, calcium malabsorption). These factors were evaluated in this
study via completion and evaluation of the EHBM Survey results.
According to the American Academy of Orthopedic Surgeons (AAOS), …”although more
commonly seen in women, the burden of osteoporosis in men remains underdiagnosed and
underreported” [and] ”there is little information available regarding racial difference in
osteoporosis in men” (Retrieved February 14, 2014, from
http://www.aaos.org/about/papers/position/1113.asp )
Calcium and Physical Activity
Survey questions regarding the relationship between calcium intake and physical activity are
important because “the reason why the survey questions ask about whether or not respondents
know about their calcium intake and physical activity levels is because approximately 35% of
mineralized bone is made of calcium and physical activity enhances calcium deposition into the
skeletal system” (Furlow, 2006, p. 230).
Native Americans and Osteoporosis
There is a lack of research and study data evaluating osteoporosis knowledge and incidence,
prevalence and severity of osteoporosis in Native American populations in the United States.
“According to the U.S. Census Bureau (2008), an estimated 4.9 million American Indians and

152
Alaska Natives live in the United States” [yet] “uncovering the prevalence of osteoporosis, hip
fracture rate, and any unique characteristics or comorbidities (such as diet, lifestyle) that affect
bone metabolism and fracture risk would enhance cultural competency with this population”
(American Academy of Orthopedic Surgery. Retrieved January 2014, from
http://www.aaos.org/news/aaosnow/jan10/research4.asp)
Calcium Intake and Vitamin D
Although this research study demonstrated a good understanding of the need for adequate
calcium and vitamin D intake to prevent osteoporosis, “The second National Health and
Nutritional Examination Survey (NHANES II) [indicated that] calcium intake in Native
Americans was below the average range (561 -679 mg/day). The large amount of lactose
intolerance reported among Native Americans may also account for low intake of calcium in
dairy products of Native Americans (Nicholas & Chen, 2002, p. 95).
Sedentary Lifestyle and Low Body Mass Index (BMI)
Sedentary lifestyle is associated with low BMD. The 1997 Behavioral Risk Factor
Surveillance System (BRFSS) and the U.S. Determinants study reported Native Americans
participate in little or no leisure time (exercise, recreation or physical activities, such as running,
native dances, calisthenics, gardening, or walking that are not performed as part of regular job
duties. In the Northwest, out of 136 females and 108 males. It was found in surveys that 52.6%
of individuals 18-29, 59.8% of individuals 30-39, and 60.6% of individuals 49 and older were
not physically active (no participation in physical activity for > 20 mins > 3 times per week in
the past month (Nicholas & Chen, 2002, p.97). Chen et. al., found weight and body mass index

153
(BMI) to be significant predictors of bone mineral density (BMD) in Native Americans women
(Nicholas & Chen, 2002, p. 98).
Overall, BMI is higher for Native Americans and regular physical activity levels are lower
among Native Americans than Non-native Americans. In this study however, Nez Perce Tribal
members, possibly due to regular, unfettered access to the new 24-hour recreation facility had
high self-efficacy for maintaining a regular exercise program.
Smoking
Smoking is predominant among Native Americans and influences bone density. Forty-three
percent of Native American men and 54% of Native American women smoke in the Pacific
Northwest, with approximately 42% of Native Americans smokers in Idaho and Montana
(Nicholas & Chen, 2002, p. 98). Smoking interferes with calcium metabolism and deposition
into the skeletal system via blood circulation.
Use of the Expanded Health Belief Model (EHBM) For This Study
An important, if not seminal behavior model in health education is the health belief model
(HBM). The HBM was developed by U.S. Public Health Psychologists Victor Strecher, Irwin
Rosenstock and Godfrey Hochbaum in the 1950’s. The theory was developed as a result of
expectancy theory and concerns about the limited success of public health tuberculosis (TB) x-
ray screening programs (Glanz, 1997, p. 42-43). Themes of the health belief model include an
individuals or groups perceived susceptibility to a certain illness, or condition, the perceived
seriousness of the illness or condition, socioeconomic and knowledge factors, (i.e.: awareness of
the disease, having medical insurance in order to pay for diagnosis and treatment of to diagnose,
etc.), the perceived threat of being diagnosed with the illness or condition, benefits and barriers

154
to action to get diagnosed and treated for the illness or condition, and cues to action (i.e.; family
support, physician access, treatment options, etc.). Bandura’s inclusion of the concept of self-
efficacy in the HBM in 1977 led to what is known as the Expanded Health Belief Model
(EHBM)” (Wallace, 2002, p. 164). Research by Horan, Gendler, Kim, Froman, and Patel at
Grand Valley State University in Allendale, MI from 1991-2010 has demonstrated the value and
utility of using the EHBM for osteoporosis inquiry and research.
Study Instrument
The EHBM served as the behavioral model for this research study. According to Katherine
K. Kim, Mary L. Horan, Phyllis Gendler, and Mini K. Patel, nursing professors and researchers
at Grand Valley State University in Allendale, MI “The Osteoporosis Health Belief Scale
(OHBS) using the EHBM as its foundation was developed to measure health beliefs related to
osteoporosis” (Kim, 1991, p. 155). The purpose of developing the OHBS was to develop and test
an instrument designed to measure personal attitudes and beliefs related to the potential for
developing osteoporosis” (Kim, 1991, p. 156). The instrument that these researchers developed
consisted of two additional risk reduction behaviors; the barriers and benefits related to calcium
intake and those related to physical exercise” (Kim, 1991, p. 157). “The addition of these two
measurements in the EHBM helps “…demonstrate the importance of health motivation in
influencing health related behavior” [and] the developers of this model encourage further use and
revision of the instrument and recommend the inclusion of self-efficacy as an additional
dimension (Kim, 1991, p. 161).
Based upon the research recommendations of Horan, Gendler, Kim, Froman and Patel, I
believe that the EHBM is an appropriate and useful model for determining male and female,

155
aged 18 and over, Nez Perce tribal member and Non-Tribal Members voluntary participant’s
attitudes knowledge, beliefs and self-efficacy regarding osteoporosis prevention. The
relationship between the EHBM, the OHB Scale and the osteoporosis research conducted for this
dissertation is indicated in Fig 6 below:

156
Fig.6. Relationship of the Expanded Health Belief Model (EHBM) and the Osteoporosis Health
Belief Scale (OHBS) (White, 2014. Unpublished prospectus).
Study Results: EHBM and Osteoporosis Knowledge
According to Wallace (2002), “on average, women were able to correctly answer 65% of the
questions used to assess osteoporosis knowledge” (p. 169). Most women consumed below the
recommended 1200 mg/day of calcium. According to Wallace (2002), “in this sample, many
women did not realize or understand the importance of many nonmodifiable (e.g.: race/ethnicity)
EHBM & Participant Osteoporosis
Attributes
Will I get osteoporosis?
Is osteoporosis serious?
Should I get tested?
I can’t get tested
Physician/NP/PA support
Family support
Friend support
I know I can do this!
Obtain order
Find facility
Drive to facility
Get tested
EHBM & Kim, Horan, Gendler, & Patel EHBM
Osteoporosis Model (1991 & 1998)
Common Subscales
Susceptibility
Seriousness
Health Motivation
Expanded Health Belief Model
Perceived Susceptibility
Perceived Severity
Perceived Benefits
Perceived Barriers
Cues To Action
Self-Efficacy
Be
ne
fits
-Ca
lciu
m /
Ba
rrie
rs-C
alc
ium
Be
ne
fits-Ex
ercise
/ Ba
rriers-E
xe
rcise

157
or modifiable (e.g.: cigarette smoking, alcohol consumption) risk factors associated with
increased risk for osteoporosis” (p. 170).
Unfortunately, osteoporosis knowledge has been shown to be a non-predictor of osteoporosis
prevention behavior (Wallace, 2002, p. 170). According to Wallace, “The finding indicate that
women differ substantially in both the osteoporosis protective behaviors and beliefs regarding
osteoporosis as defined by the EHBM” (Wallace, 2002, p. 171). Osteoporosis knowledge and
perceived susceptibility were not considered preventive of osteoporosis in the studies in which
women either felt that osteoporosis was a minor health problem (50%), they were not susceptible
to osteoporosis (14%) and that it was a problem only for older women (32%) (Hazavehei,
Taghdisi & Saidi, 2007).
Calcium poor diets, lack of exercise and a disconnect between knowledge of osteoporosis and
behaviors needed to diminish or prevent it are the cause of osteoporosis and related skeletal
health problems in men, women and individuals of varying ethnicities.
EHBM Osteoporosis Survey Instrument
The two key factors of the EHBM instrument used in this study (exercise and nutrition
(calcium) are not redundant (10% question redundancy, 90% independent). The EHBM based
survey questions used in this study are effective in accurately predicting self-efficacy in
relationship to osteoporosis prevention. Respondents in this study appear to be intellectually
associating behaviors (exercise, sufficient calcium intake etc.) with prevention of osteoporosis.
Examination of differences in osteoporosis knowledge, attitudes, beliefs and self-efficacy
between the Native Americans and Non-Native Americans residing in Nez Perce County, ID
using the EHBM instrument was conducted in this study. Life on and off the reservation was

158
examined with particular analyses of diet, exercise, osteoporosis knowledge and self-efficacy to
prevent or mitigate osteoporosis. Study data indicated that gender was not that significant in any
of the grouping variables except for female Native Americans perceiving the greatest barriers to
calcium intake. It is possible that men and women’s attitudes, knowledge and beliefs about
osteoporosis may be similar. Both groups have good general knowledge about osteoporosis.
Physicians, Physician Assistants, and Nurse Practitioners and other providers in Nez Perce
County, ID may discuss among male and female, Native and Non-Native patient’s osteoporosis
prevention, diagnosis and treatment. Nez Perce County, ID and the Nez Perce reservation are
relatively underpopulated with a large amount of daily interaction between Nez Perce Tribal
members and Non Nez Perce Tribal members. Informal sharing of general population health
information also occurs among the healthcare providers, many of which work at the tribal clinic
and off the reservation in other parts of Nez Perce County, ID.
Answers on the survey questions may have been discussed by participants, may be too
generalized, and may not be structured to accurately determine if there is any gender or ethnicity
based differences concerning Native American and Non Native American attitudes about
osteoporosis. Wrong statistical analysis, data entry errors, and/or ineffective use of the survey
instruments may also partially account for data results (possible Type II error).
Almost half (49.8%) of respondents felt their chance of getting osteoporosis was high, yet
almost half (49.8%) of respondents also felt neutral in regards to the relationship between family
history and osteoporosis. More education by Nez Perce County and Nez Perce Tribal clinic
health educators and clinical staff should be conducted in groups (i.e.: community presentations)
or on an individual basis in provider’s offices as needed about the importance of family history
as it relates to susceptibility and seriousness of being diagnosed with osteoporosis.

159
Exercise self-efficacy, exercise, nutrition and ethnicity seem to be the most significant
variables showing evidence against the null hypotheses and for the research hypothesis. Nutrition
and age also show evidence against the null hypothesis and for the research hypothesis, but not
as strongly as exercise and ethnicity.
H0: Native American=Non-Native American (Incorrect for this study).
H1: Native American ≠ Non-Native American (correct for this study).
Study Limitations
Study limitations are those factors which may limit the internal validity of a specific study.
The following known limitations of this study are identified below:
1. Transportation problems in getting to the Nez Perce Tribal Clinic.
2. There could have been significant variations in participant’s ability to remember and tabulate
exercise and dietary activities over a period of time.
3. EHBM osteoporosis survey participants perhaps were not representative of non-participants.
4. EHBM instrument length (I.e.: 3 forms) may have influenced responses of different
individuals.
6. EHBM readability may affect participant responses. The EHBM survey was at the 5th grade
reading level (Kim, ET. Al., 1991).
7. Participants may have had social bias and responded in an effort to enhance their likelihood of
participation in the EHBM Based Survey.
8. Relatively small sample size
9. This study needs replication in other Native American population centers.
10. Replicate the study in other rural areas if possible.

160
11. Replicate the study in urban areas if possible.
12. Replicate the study using individuals who meet different osteoporosis criteria if possible.
Recommendations
The purpose of this study was not to actually measure osteoporosis incidence prevalence and
severity, but this could be accomplished in a future study. This study needs replication in other
Native American population centers and in other rural areas if possible.
This study should be replicated in an urban area if possible and finally, this study should be
replicated using individuals who meet different osteoporosis criteria if possible.
An ecological model showing how people are influenced by their physical and sociocultural
surroundings developed by used by Evans and Taylor (Evans & Taylor, 2006, p.451) to evaluate
osteoporosis in Hispanic Women. Such a model can be used in future osteoporosis studies in
Native Americans.
An ecological approach can be used to study the likelihood of osteoporosis in Nez Perce
Tribal members and other Native Americans. The relationship between Native Americans and
osteoporosis is not well understood and may vary from that of other ethnicities and populations.
This lack of understanding was one reason why this study was conducted.
Follow-up studies should involve the use of a pre-survey osteoporosis educational plan. That
was to have been completed in this study, but was not completed due to logistical reasons outside
the researcher’s control. Participants and providers felt that it was unfortunate that QUS and/or
DXA scanning were not available to actually measure bone matrix and bone density of the
participants. It is recommended that in future studies, QUS and DXA be available as a screening

161
tool for those found to be likely to have osteoporosis in order to better scientifically document
osteoporosis incidence, prevalence and severity among study participants.
Summary
In this study, the null hypothesis is rejected and the research hypothesis is accepted. The two
key factors in the survey (exercise and nutrition) are redundant in only 10% of the questions,
with 90% of the questions being independent of each other. This study was particularly effective
in accurately predicting exercise self-efficacy in relationship to osteoporosis prevention. Study
participants appeared from their survey responses to be intellectually associating behaviors
(exercise, sufficient calcium consumption, etc.) with aiding in osteoporosis prevention. Native
Americans had better knowledge relating nutrition to osteoporosis prevention (Nez Perce =
53.34% vs Non Nez Perce = 46.66%) and Non-Native American had better knowledge relating
exercise to osteoporosis prevention (Nez Perce = 0.11% and Non Native Americans = 89%). For
men compared to women, it was more equivalent regarding the relationship between nutrition
and osteoporosis prevention (men= 46.60% and women + 53.40%) and exercise related to
osteoporosis prevention (men =52.90% and women= 47.10%). A MANOVA and TWO-WAY
ANOVA analyses led to t-Tests results, indicating that female Native Americans perceived the
greatest barriers to calcium intake for preventing osteoporosis as compared to other groups in the
study.
While exercise self-efficacy is very high and calcium self-efficacy is good for most study
participants, there is some lack of understanding about how much exercise and how much and
what types of calcium to consume to mitigate or prevent osteoporosis. This is of concern for this
study and future research may be developed to more thoroughly address this deficiency.

162
Ultimately, osteoporosis prevention relies on respondent’s ability and willingness to consume 1) enough
calcium, 2) the right types of calcium, 3) engage in regular, weight-bearing exercise on a consistent basis,
and 4) seek diagnostic and therapeutic medical advice and treatment when needed to prevent bone loss
and/or to enhance bone density.

163
REFERENCES
American Academy of Orthopedic Surgeons (AAOS). American Indians: Overlooked Again.
Retrieved March 01, 2013, from http://www.aaos.org/news/aaosnow/jan 10/research4.asp
American Academy of Orthopedic Surgeons. Position Statement: Osteoporosis/Bone
Health in Adults as a National Public Health Priority. Retrieved August 16,
2014, from http://www.aaos.org/about/papers/position/1113.asp
American College of Radiology (ACR). ACR Appropriateness Criteria: Osteoporosis and Bone
Mineral Density. Retrieved December 31, 2012, from
http://www.acr.org/~/media/ACR/Documents/AppCriteria/Diagnostic/OsteoporosisAnd
BoneMineralDensity.pdf
Babbie, E. (1992). The practice of social research. Belmont, CA: Wadsworth Publishing
Company.
Becker, M. (1974). The health belief model and personal health behavior. Health Education
Monographs, 2, 1-8.
Bleeker, J. (2001). Osteoporosis in men. Arkansas Association for Health, Physical Education,
Recreation and Dance Journal, 36, 43.

164
Bone Density. (2009). Retrieved December 2, 2009, from
http://hypertextbook.com/facts/2002/annayarusskaya.shtml.
Bone Health for Life. (2010). Retrieved April 25, 2012, from
http://www.bonehealthforlife.org.au/content/view/35/424.
Bonnick, S. (1998.) Bone densitometry in clinical practice. Totawa, NJ: Humana Press.
Bonnick, S., & Lewis, L. (2002). Bone densitometry for technologists. Totawa, NJ: Humana
Press.
Brewer, S. (1998). The osteoporosis prevention guide. New York, NY: Barnes and Noble Books.
Center for Disease Control. (2010). NHANES III. Retrieved April 24, 2010, from
http://www.cdc.gov/nchs/products/elec prods/subject/nhanes3.htm.
Christoffel, T. & Gallagher, S.S. (1999). Injury prevention and public health: Practical
knowledge, skills, and strategies. Gaithersburg, MD: Aspen Publications.
Cresswell. J.W. (1998). Qualitative inquiry and research design: Choosing among five
traditions. Thousand Oaks, CA: Sage Publications.
Cronbach’s Alpha. (2015). Retrieved October 20, 2015, from https://explorable.com/cronbachs-
alpha).
Dever, G.E. (2006). Managerial epidemiology: Practice, methods and concepts. Sudbury, MA:
Jones and Bartlett.

165
Eisenberg, R., & Johnson, N. (2003). Comprehensive radiographic pathology. St. Louis, MO:
Mosby.
Endicott R. (2013). Knowledge, health beliefs, and self-efficacy regarding osteoporosis in
perimenopausal women,” Journal of Osteoporosis, doi:10.1155/2013/853531
Evans, K., & Taylor, C. (2006). Understanding osteoporosis prevalence in Hispanic women.
Radiologic Technology, 77(6), 451.
Filner, J. (2001).” Risk factors for osteoporosis in Alaska native women: a cross-sectional
Survey” Scholar Archive. Paper 3247.
Furlow, B. (2006). Osteoporosis in men. Radiologic Technology, 77(3), 226-235.
Gemalmaz, A., Discigil, G., & Ceylan, C. (2007). Diagnostic performance of QUS for
identifying osteoporosis in postmenopausal Turkish women. Turk J Med Sci : 37(5): 303-309.
General Electric. (2004). Achilles operator’s manual. Waukesha, WI: GE Healthcare.
Glanz, K. (1997). Health behavior and health education. San Francisco, CA: Jossey-Bass.
Glanz, K., Rimer, B.K., & Lewis, F.M. (2002). Health behavior and health education: Theory,
research and practice. San Francisco: Wiley & Sons.
Glass, G., & Hopkins, K. (1996). Statistical methods in education and psychology. Boston, MA:
Allyn and Bacon.

166
Greenhalgh, T. (2006). How to read a paper: The basics of evidence based medicine. Oxford:
Blackwell Publishing.
Greenhalgh, T. (2007). Primary health care: Theory and practice. Oxford: Blackwell Publishing.
Hans, D., Krieg, M.A. (2008). Quantitative ultrasound for the detection and management of
osteoporosis. Salud publica de México/vol. 51, suplemento 1 de 2009, p. s25-s26.
Hazavehei, S.M., Taghdisi, M.H., & Saidi, M. (2007). Application of the health belief model for
osteoporosis prevention among middle school girl students, Garmsar, Iran. Education for
Health, 20(1), 1-11.
Horan, M.L., Kim, K.K., Gendler, P. Froman, R.D., & Patel, M.D. (1998). Development and
evaluation of the osteoporosis self-efficacy scale. Research in nursing and health, 21, 395-
403.
International Society for Clinical Densitometry (2007). Retrieved May 13, 2011, from
http://www.iscd.org/Visitors/positions/OP.Index.cfm.
Isaac, S., & Michael, W. (1997). Handbook in research and evaluation. San Diego, CA:
EdITS/Educational and Industrial Testing Services.

167
Kahn, A., Bachrach, L., Brown, J., Hanley, D., Josse, R., Kedler, D., Leibe, E., Lentle, B.,
Leslie, W., Lewiecki, M. (2004). Canadian panel of the international society of clinical
densitometry. Standards and guidelines for performing central dual energy x-ray
absorptiometry in premenopausal women, men and children. Journal of Clinical
Densitometry, 7(1), 51-64.
Kim, K, Horan, M., Gendler, P. Refinements of the Osteoporosis Health Belief Scale. Poster
presented at Sigma Theta Tau International Research Conference, May 1991, Columbus, OH.
Kim, K.K., Horan, M.L., Gendler, P., & Patel, M.D. (1991). Development and evaluation of the
osteoporosis health belief scale. Research in nursing and health, 14, 155-163.
Kittleson, A. (2011). Minnesota State University, Mankato. Nez Perce Tribe. Emuseum.
Retrieved January 28, 2011, from
http://www.mnsu.edu/emuseum/cultural/northamerica/nez_perce.html.
Lapwai, ID Census Data. Retrieved August 18, 2014, from http://ww.city.data.com/city/Lapwai-
Idaho.html
Levene’s t test (2015). Retrieved January 22, 2015, from
https://en.wikipedia.org/wiki/Levene%27s_test).
Literature Review. (2011). Retrieved November 27, 2011, from
www.deakin.edu.au/library/findout/research/litrev.php.

168
Lohman, T. G. (1992). Advances in body competition assessment. University of Arizona.
McKenzie, J.F., Pinger, R.R., & Kotecki, J.E. (1999). An introduction to community health.
Sudbury, MA: Jones and Bartlett.
Mekary, R. A. (2005). Osteoporosis and osteopenia management in women: Survey, case-
referent study and interventional exercise trial. (URN# etd-07112005-140541). Louisiana
State University Electronic Thesis and Dissertations database. Retrieved April 13, 2011,
from http://etd.lsu.edu/docs/available/etd-07112005-140541/
Merck and Company, Inc. (1997). Osteoporosis pamphlet. St. Louis, MO: Merck, Inc.
Murphy, N., Attico, N., Rhodes, C., Dodge, S., & DeRoin, D. (2004). National Indian Women’s
Health Resource Center. Osteoporosis in American Indian/Alaska native women. Retrieved
November 21, 2010, from
http://www.ihs.gov/MedicalPrograms/MCH/W/documents/OsteoporosisNIWHR4104.doc.
National Indian Women’s Resource Health Center: Osteoporosis in American Indian/Alaska
Native Women. Retrieved August 18, 2014, from http://www.niwhrc.org
National Institutes of Health. (2010). Alendronate and risendronate. Retrieved February 17,
2011, from http://www.ncbi.nlm.nih.gov/pubmedhealth/PMH0000018.

169
National Institutes of Health. (2011). Federal policy for the protection of human subjects.
Retrieved January 25, 2011, from http://privacyruleandresearch.nih.gov.
National Osteoporosis Foundation. (2011). Osteoporosis. Retrieved March 23, 2011, from
http://www.nof.org.
Native American. Retrieved January 28, 2011, from http://www.tribaldirectory.net.
Nayak, S., Olkin, I., Liu, H., Grabe, M., Gould, M., Allen, E., Owens, D., & Bravata, D. (2006).
Meta-analysis: Accuracy of quantitative ultrsound for identifying patients with
osteoporosis. Ann Intern Med., 144(11).
Nguyen, N.D., Pongchaiyakul, C., Centerer, J.R., Eisman, J.A., & Nguyen, T.V. (2005).
Abdominal fat and hip fracture risk in the elderly: The DUBBO osteoporosis epidemiology
study. BMC Muskuloskeletal Disorder, 6, 11.
Nicholas, J., & Chen, Z. (2002). Osteoporosis in Native Americans. The IHS Primary Care
Provider Journal, 27(5): 94.
Nimiipuu. Retrieved July 13, 2011, from www.nezperce.org/history/nimiipuu.htm.
Nobman, E.D., Byers, T., Lanier, A.P., Hankin, J.H., & Jackson, M.Y. (1992). The diet of
Alaska Native adults: 1987-1988. Am J Clin Nutr, 5, 1024-32.

170
Normal Distribution. (2015). Retrieved October 20, 2015, from
https://en.wikipedia.org/wiki/normal_distribution.
Norman, J. (2010). Bone Mass Density. (2010). Retrieved February 22, 2010, from
http://www/endocrineweb.com/osteoporosis/diagnosis.html.
Orwoll, E. (1999). Male osteoporosis research at OHSU. Retrieved December 20, 2009, from
http://www.ohsu.edu/news/archive/1999/101599osteo.html.
Oskin, B. (2004). Duke health brief: Men also at risk for osteoporosis. Retrieved December 20,
2009, from http://dukemednews.org/global/print.php/context=52Fnews5Farticle.php/id.
Osteoporosis Clinics of America (1997). Osteoporosis: What a patient needs to know.
Educational brochure/pamphlet. Effingham, IL. Clinic now defunct.
Ott, L. (1984). An introduction to statistical methods. Boston, MA: Duxbury Press.
Ott, S. (2009). Osteoporosis and bone physiology. Retrieved December 2, 2009, from
http://courses.washington.edu/bonephys/opbmd.html.
Purpose of literature review. (2011). Retrieved November 27, 2011, from
www.library.arizona.edu/help/feedback/index.php.

171
Radiologic Society of North America (RSNA) (2012). Patient safety and radiation dose.
Retrieved December 31, 2012, from
http://www.radiologyinfo.org/en/safety/index.cfm?pg=sfty_xray
Raosoft, Inc. Sample size and margin of error formulas (2015). Retrieved October 20, 2015,
from http://www.raosoft.com/samplesize.html.
Rhode Island Commission on Women (2003). Retrieved December 20, 2009, from
www.ricw.ri.gov/papers/PDFs/Osteoporosis.pdf.
Sheldon, T.A., Freemantle, N., Ibbotson, S., Pollock, C., Mason, J., & Long, A.F. (1992).
Population screening for osteoporosis to prevent fractures. Quality in Health Care, 1, 77-80.
Smith, B., Leyva, M., & Baker, Z. (2009). Oklahoma Native American women’s osteoporosis
screening study. Retrieved December 29, 2009, from http://gcrc.ouhsc.edu/Smith0129.asp.
T-scores. (2010). Retrieved February 19, 2010, from http://www.google.com
Taber’s cyclopedic medical dictionary. (2009). Philadelphia, PA: F.A. Davis Company.
Turner, L., Hunt, S., DiBrezzo, R., & Jones, C. (2004). Design and implementation of an
osteoporosis prevention program using the health belief model. American Journal of Health
Studies, 19(2), 115-121.
University of Michigan Health System (2010). Osteoporosis treatment and prevention guidelines
for clinical care. Ann Arbor, MI: Regents of the University of Michigan.

172
U.S. Census Bureau. (2014). Quick facts: Nez Perce County, Id. Retrieved August 19, 2014,
from http://quickfacts.census.gov/qfd/
U.S. Department of Health and Human Services. (2004). Bone health and osteoporosis: A report
of the Surgeon General. Rockville, MD: U.S. Department of Health and Human Services,
Office of the Surgeon General.
Wallace, L.S. (2002). Osteoporosis prevention in college women: Application of the expanded
health belief model. American Journal of Health Behavior; 26(3), 163-172.
White, V. (2013). Expanded health belief model and osteoporosis research with QUS and
DXA diagram. Unpublished dissertation prospectus.
Wietor, B. (2010). Knowledge of Osteoporosis among a Convenience Sample of Mid-Western
Native Americans. Poster presented at the 2003 Midwest Nursing Research Society,
Allendale, MI. Retrieved March 01, 2013, from http://hdl.handle.net/10755/160470
Wilson, C.R. (2003). Essentials of bone densitometry for the medical physicist. Milwaukee, WI:
Medical College of Wisconsin.
Wilson, C.R. (2003). The essentials of bone densitometry. Milwaukee, WI: Medical Technology
Medical Institute.

173
World Health Organization (2004). WHO scientific group on the assessment of osteoporosis at
primary health care level. Retrieved March 22, 2011, from
www.who.int/entity/chp/topics/osteoporosis.pdf.
Z score. (2008). Retrieved July 13, 2011, from
http://courses.washington.edu/bonephys/opbmd.html.
Z scores. (2010). Retrieved February 19, 2010, from www.en.wiktionary.org/wiki/z.

APPENDICES

174
Appendix 1: Social Science Research Paradigm/Process.
Source: Babbie, E. (1992). The Practice of Social Research. Belmont, CA: Wadsworth Publishing Company. P. 104.

175
Appendix 2. SIUC Form A

176
Appendix 3. SIUC HSC Form an Approval Letter

177
Appendix 4. Research Permission Letter (NMPH)

178
Appendix 5: Research Permission Letter (NMPH)

179
Appendix 6. Research Permission Letter (NMPH)

180
Appendix 7. Research Script
Hello, my name is Victor White. I am currently a doctoral candidate at Southern Illinois
University Carbondale am completing my dissertation, which involves the use of a 30 minute
Expanded Health Belief Model written survey, an 1 hour osteoporosis educational program, and
a free bone assessment screening project to determine whether the incidence, prevalence, and
severity of osteoporosis as determined by dual energy x-ray absorptiometry (DXA) and heel
ultrasonography (US) is similar in members of the Nez Perce Tribe, 21 years of age and older,
male and female, to Non-Tribal members of the same age and gender.
During this study, if you wish to participate, you will attend a free educational seminar about
osteoporosis, and receive a free dual energy x-ray absorptiometry (DXA) and heel ultrasound
(US) scan to determine your bone density. Both of these tests are considered safe and non-
invasive. (i.e.: approximately 166.8 micro Gray of radiation exposure for Spine, Dual Femur, and
Total Body studies).
Also, as part of this study, you will be required to fill out an informed consent form and
health, diet, medication, and exercise questionnaire, and you may be asked to complete a food
record. Participation in this study is completely voluntary and you may withdraw from this
study at any time if you so desire.
If you would like to participate, please stay after this introduction. If you have any question
(at any time) please feel free to contact Victor White, MA, MSRS, RT (R) CHES at
[email protected] or the Southern Illinois University Institutional Review Board (IRB) at
(618) 453-4533.
Thanks for your consideration and time to participate in this study.

181
Appendix 8: General Study Informed Consent Form
The purpose of this study is to develop an osteoporosis screening program comparing the
incidence, prevalence, and severity of members of the Nez Perce Tribe male and female, twenty-one years
of age and older as compared to non-tribal members. You have been asked to participate in this study
because you have attended the osteoporosis educational seminar(s), are a member of the Nez Perce Tribe,
and/or have a desire to participate in this osteoporosis screening program.
Your participation in this research study is strictly voluntary, and all reasonable steps will be taken
in order to protect your privacy. Your name will not be connected to your survey responses in any
way. Your name on the informed consent provides a way to keep track of individual responses, but
will not be used to identify you. You may decide not to participate in this study at any time without
penalty.
Your task will be to respond questions about your perceptions about osteoporosis and to undergo
an osteoporosis educational program; you will be asked to fill out a survey based on your impressions
about osteoporosis and your diet, exercise, and medication history that relates to osteoporosis. You will
also receive an ultrasound heel (QUS) and dual energy x-ray absorptiometry (DXA) scan. As you fill out
this survey instrument, there may be several questions that you have about osteoporosis. You address
these questions by writing them down in the final assessment section at the end of the survey. Also, you
may add or elaborate on any item of the survey. There will be several items on this survey that inquire
about your personal perceptions or activities regarding being tested for osteoporosis, use of medications,
weight bearing exercise, etc.
You may refuse to answer any item on this survey without penalty. Your participation in this
research project is entirely voluntary. No payment is being offered to study participants.
Any inquiries about this study or any concerns you may have should be directed to Victor White,
MA, MSRS, RT (R), CHES Principle Investigator at (208) 305-1323 or via email at
[email protected]. You may also contact the Institutional Review Board (IRB) at Southern Illinois
University at Carbondale at (618) 453-4533.
I have read the material above, and any questions regarding this study have been answered to my
satisfaction. By continuing, I have agreed to participate in this research, realizing that I may
withdraw without penalty at any time.
Participant Name: ____________________________________________Date: __________________
Researcher Name: ____________________________Date: _________________

182
Appendix 9. Research Announcement
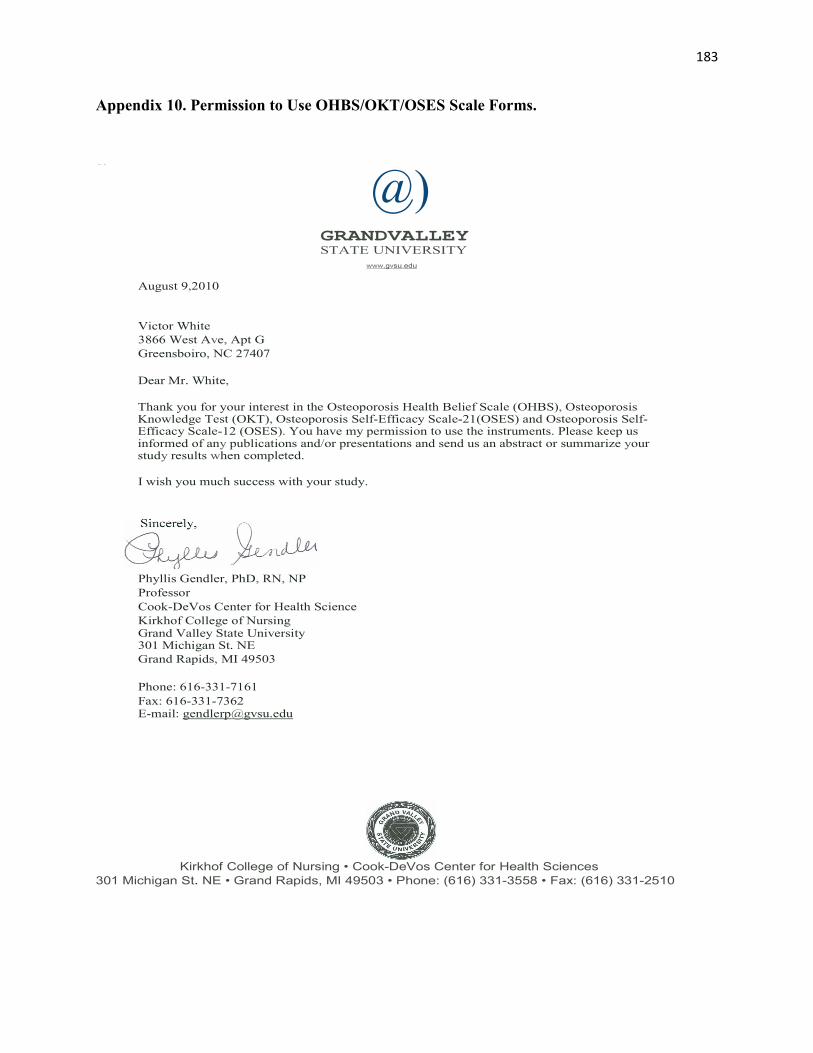
183
Appendix 10. Permission to Use OHBS/OKT/OSES Scale Forms.
1.
@) GRANDVALLEY STATE UNIVERSITY
www.gvsu.edu
August 9,2010
Victor White 3866 West Ave, Apt G Greensboiro, NC 27407
Dear Mr. White,
Thank you for your interest in the Osteoporosis Health Belief Scale (OHBS), Osteoporosis Knowledge Test (OKT), Osteoporosis Self-Efficacy Scale-21(OSES) and Osteoporosis Self- Efficacy Scale-12 (OSES). You have my permission to use the instruments. Please keep us informed of any publications and/or presentations and send us an abstract or summarize your study results when completed.
I wish you much success with your study.
Phyllis Gendler, PhD, RN, NP Professor Cook-DeVos Center for Health Science Kirkhof College of Nursing Grand Valley State University 301 Michigan St. NE Grand Rapids, MI 49503
Phone: 616-331-7161 Fax: 616-331-7362 E-mail: [email protected]
Kirkhof College of Nursing • Cook-DeVos Center for Health Sciences
301 Michigan St. NE • Grand Rapids, MI 49503 • Phone: (616) 331-3558 • Fax: (616) 331-2510

184
Appendix 11: Osteoporosis Knowledge Test (Revised 2011).
MORE LIKELY TO GET OSTEOPOROSIS, or
LESS LIKELY TO GET OSTEOPOROSIS, or
NEUTRAL, IT HAS NOTHING TO DO WITH GETTING OSTEOPOROSIS, or DON'T KNOW.
When you read each statement, circle ONE of the 4 choices for your answer.
ML = MORE LIKELY
LL = LESS LIKELY
NT = NEUTRAL
OK = DON'T KNOW
1. Eating a diet LOW in dairy products ML LL NT OK
2. Being menopausal; "change of life" ML LL NT OK
3. Having a parent or grandparent who has osteoporosis ML LL NT OK
4. Being a white or Asian woman ML LL NT OK
5. Being an elderly man ML LL NT OK
6. Having ovaries surgically removed ML LL NT OK
7. Taking cortisone (steroids e.g. Prednisone) for long time ML LL NT OK
8. Being overweight ML LL NT OK
9. Having an eating disorder ML LL NT OK
10. Consuming more than 2 alcoholic drinks per day ML LL NT OK
11. Smoking on a daily basis ML LL NT OK
1
Osteoporosis (os-te-o-po-ro-sis) is a condition in which the bones become very brittle and weak so that they break easily.

185
For the next group of questions, circle one answer from the 4 choices. Be sure to circle ONLY
ONE answer. If you think there is more than one correct answer, choose the BEST answer. If
you are not sure, circle D. Don't know.
12. To strengthen bones, it is recommended that a person exercise at a moderately intense
level for 30 minutes a day at least
A. 3 days a week
B. 4 days a week C. 5 days a week
D. Don't know
13. Exercise makes bones strong, but it must be hard enough to make breathing
A. Just a little faster
B. Much faster, but talking is possible
C. So fast that talking is not possible
D. Don't know
14. Which of the following activities is the best way to reduce a person's chance of getting
osteoporosis?
A. Swimming
B. Walking briskly
C. Stretching
D. Don't know
15. Which of the following activities is the best way to reduce a person's chance of getting
osteoporosis?
A. Bicycling
B. Yoga
C. Lifting weights
D. Don't know
16. Which of the following activities is the best way to reduce a person's chance of getting
osteoporosis?
A. Jogging or running
B. Golfing using golf cart C. Gardening
D. Don't know
17. Which of the following activities is the best way to reduce a person's chance of getting
osteoporosis?
A. Bowling
B. Doing laundry C. Aerobic dancing
D. Don't know
2

186
For the next group of questions, circle one answer from the 4 choices. Be sure to circle ONLY
ONE answer. If you think there is more than one correct answer, choose the BEST answer. If
you are not sure, circle D. Don't know.
18. Which of these is the best source of calcium?
A. Apple
B. Cheese
C. Cucumber
D. Don't know
19. Which of these is the best source of calcium?
A. Peanut Butter
B. Turkey
C. Canned Sardines
D. Don't know
20. Which of these is the best source of calcium?
A. Chicken
B. Broccoli
C. Grapes
D. Don't know
21. Which of these is the best source of calcium?
A. Yogurt
B. Strawberries C. Cabbage
D. Don't know
22. Which of these is the best source of calcium?
A. Ice cream
B. Grape fruit C. Radishes
D. Don't know
23. Which of the following is the recommended amount of calcium intake for an adult?
A. 600 mg - 800 mg daily
B. 1000 mg - 1200 mg daily C. 1400 mg - 1600 mg daily
D. Don't know
24. How much milk must an adult drink to meet the recommended amount of calcium?
A. 1 glass daily
B. 2 glass daily C. 3 or more glasses daily
D. Don't know
3

187
For the next group of questions, circle one answer from the 4 choices. Be sure to circle ONLY
ONE answer. If you think there is more than one correct answer, choose the BEST answer. If
you are not sure, circle D. Don't know.
25. Which of the following is the best reason for taking a calcium supplement?
A. If a person skips breakfast B. If a person does not get enough
calcium from diet C. If a person is over 45 years old
D. Don't know
26. Which vitamin is required for the absorption of calcium?
A. Vitamin A
B. Vitamin C C. Vitamin D
D. Don't know
27 . Which is the best source of the vitamin required for the absorption of calcium?
A. Carrots
B. Oranges C. Sunlight
D. Don't know
28. Which is the best food source of the vitamin required for the absorption of calcium?
A. Spinach
B. Cheese C. Salmon
D. Don't know
29. Which of the following is the recommended amount of the vitamin required for the
absorption of calcium for an adult, 50 years old and older?
A. BOO-1000 IU daily B. 1200-1400 IU daily C. 1600-1BOO IU daily
D. Don't know
30. When is the best time to build strong bones?
A. Childhood
B. Adolescence C. Young adulthood
D. Don't know
31. Osteoporosis can be diagnosed by
A. Blood test
B. DXA scan C. Symptoms
D. Don't know
4

188
For the next question, circle one answer from the 4 choices. Be sure to circle ONLY ONE
answer. If you think there is more than one correct answer, choose the BEST answer. If you are
not sure, circle D. Don't know.
32. Once you have osteoporosis
A. There is nothing you can do about it D. Don't know B. You can take medication to treat it C. You must be careful lifting objects
Thank you for completing the survey.
Please check to be sure you answered all of the questions
Developed by Katherine Kim PhD, Mary Horan PhD, and Phyllis Gendler PhD (1991). Grand
Valley State University, with support from the Grand Valley State University Research Grant-in-
Aid. Revised by Phyllis Gendler PhD, Katherine Kim PhD, Cynthia Coviak PhD, and Jean Martin
PhD (2010). Question 28 was developed as an addition to the Osteoporosis Knowledge Test by
Pamela von Hurst (2006).
Reproduction without authors' express written consent is not permitted. Permission to use this
scale may be obtained from Phyllis Gendler at Grand Valley State University, Grand Rapids, MI
49503.
5

189
NO: _________________
Appendix 12: Osteoporosis Health Belief Scale.
Osteoporosis (os-te-o-po-ro-sis) is a condition in which the bones become excessively thin (porous) and weak so that they are fracture prone (they break easily).
Below are some questions about your beliefs about osteoporosis. There are no right or wrong answers. We all have different experiences which will influence how we feel. After reading each statement, circle if you STRONGLY DISAGREE, DISAGREE, are NEUTRAL, AGREE, or STRONGL Y AGREE with the statement.
It is important that you answer according to your actual beliefs and not according to how you feel you should believe or how you think we want you to believe. We need the answers that best explain how you feel.
Read each statement. Circle one best option that explains what you believe.
SD = STRONGLY DISAGREE
D=DISAGREE
N=NEUTRAL
A=AGREE
SA = STRONGLY AGREE
SD D N A SA 1. Your chances of getting osteoporosis are high.
SD D N A SA 2. Because of your body build, you are more likely to develop
osteoporosis.
SD D N A SA 3. It is extremely likely that you will get osteoporosis.
SD D N A SA 4. There is a good chance that you will get osteoporosis.
SD D N A SA 5. You are more likely than the average person to get osteoporosis.
SD D N A SA 6. Your family history makes it more likely that you will get
osteoporosis.
SD D N A SA 7. The thought of having osteoporosis scares you.
SD D N A SA 8. If you had osteoporosis you would be crippled.
K. Kim, M. Horan, P. Gendler, 1991. Reproduction without authors' express written consent is not
permitted. Permission to use this scale may be obtained from Phyllis Gendler at Grand Valley State University, Grand Rapids, MI 49503.
OHBSself-admin.doc copyright
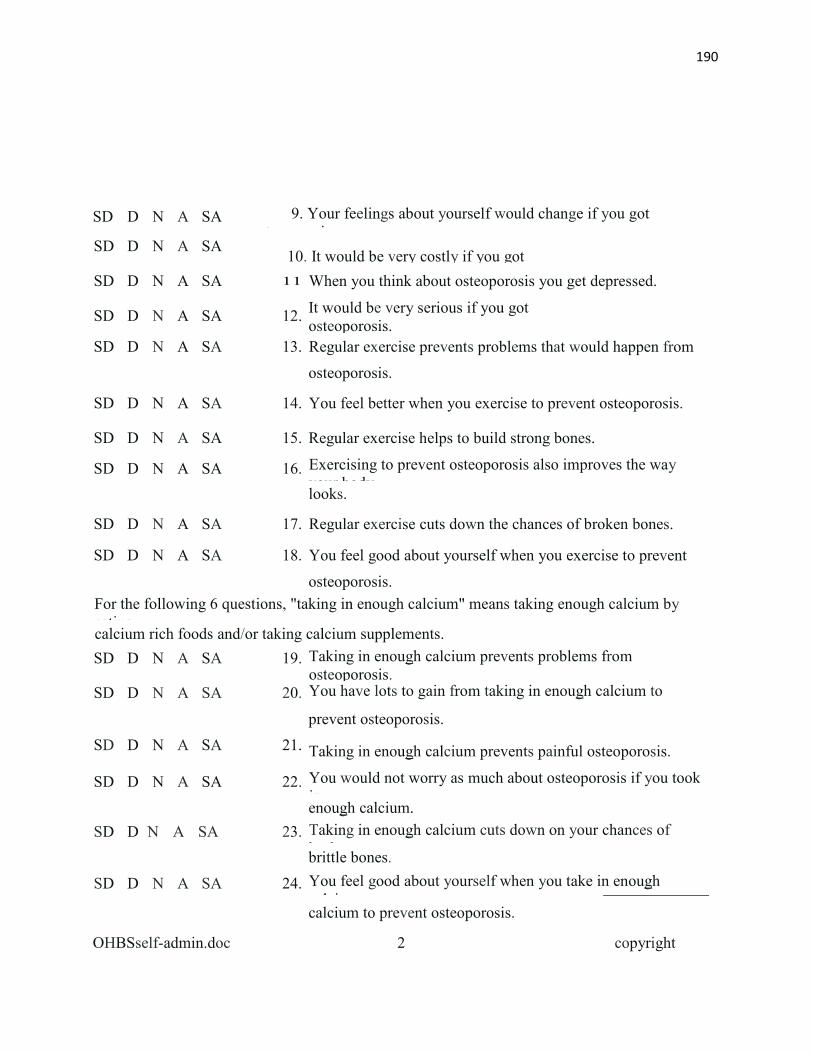
190
SD D N A SA 9. Your feelings about yourself would change if you got osteoporosis.
SD D N A SA 10. It would be very costly if you got
SD D N A SA 11 When you think about osteoporosis you get depressed.
SD D N A SA 12. It would be very serious if you got osteoporosis.
SD D N A SA 13. Regular exercise prevents problems that would happen from
osteoporosis.
SD D N A SA 14. You feel better when you exercise to prevent osteoporosis.
SD D N A SA 15. Regular exercise helps to build strong bones.
SD D N A SA 16. Exercising to prevent osteoporosis also improves the way your body
looks.
SD D N A SA 17. Regular exercise cuts down the chances of broken bones.
SD D N A SA 18. You feel good about yourself when you exercise to prevent
osteoporosis.
For the following 6 questions, "taking in enough calcium" means taking enough calcium by eating calcium rich foods and/or taking calcium supplements.
SD D N A SA 19. Taking in enough calcium prevents problems from osteoporosis.
SD D N A SA 20. You have lots to gain from taking in enough calcium to prevent
prevent osteoporosis.
SD D N A SA 21. Taking in enough calcium prevents painful osteoporosis.
SD D N A SA 22. You would not worry as much about osteoporosis if you took in enough calcium.
SD D N A SA 23. Taking in enough calcium cuts down on your chances of
broken brittle bones.
SD D N A SA 24. You feel good about yourself when you take in enough calcium to
calcium to prevent osteoporosis.
OHBSself-admin.doc 2 copyright

191
OHBSself-admin.doc
3
SD = STRONGLY DISAGREE
D=DISAGREE
N=NEUTRAL
A=AGREE
SA = STRONGLY AGREE
SD D N A SA 25. You feel like you are not strong enough to exercise regularly.
SD D N A SA 26. You have no place where you can exercise
SD D N A SA 27. Your spouse or family discourages you from exercising.
SD D N A SA 28. Exercising regularly would mean starting a new habit which is hard
for you to do.
SD D N A SA 29. Exercising regularly makes you uncomfortable.
SD D N A SA 30. Exercising regularly upsets your every day routine.
SD D N A SA 31. Calcium rich foods cost too much.
SD D N A SA 32. Calcium rich foods do not agree with you.
SD D N A SA 33. You do not like calcium rich foods.
SD D N A SA 34. Eating calcium rich foods means changing your diet which is hard
to do.
SD D N A SA 35. In order to eat more calcium rich foods you have to give up other
foods that you like.
SD D N A SA 36. Calcium rich foods have too much cholesterol
SD D N A SA 37. You eat a well-balanced diet.
SD D N A SA 38. You look for new information related to health.
SD D N A SA 39. Keeping healthy is very important for you.
SD D N A SA 40. You try to discover health problems early.
SD D N A SA 41. You have a regular health check-up even when you are not sick.
SD D N A SA 42. You follow recommendations to keep you healthy.
Please check to see that you have answered all items.
copyright

192
Appendix 13: Osteoporosis Self Efficacy Scale. ID #: _____________
We are interested in learning how confident you feel about doing the following activities. We all have different experiences, which will make us more or less confident in doing the following things. Thus, there is no right or wrong answers to this questionnaire. It is your opinion that is important. In this questionnaire, EXERCISE means activities such as walking, swimming, golfing, biking, aerobic dancing. Place your” X” anywhere on the answer line that you feel best describes your confidence level.
1. Begin a new or different exercise program.
Not at all confident ________________________________________________Very Confident
2. Change your exercise habits.
Not at all confident ________________________________________________ Very Confident
3. Put forth the effort required to exercise.
Not at all confident ________________________________________________ Very Confident
4. Do exercises even if they are difficult.
Not at all confident ________________________________________________ Very Confident
5. Maintain a regular exercise program.
Not at all confident ________________________________________________ Very confident
6. Exercise for the appropriate length of time.
Not at all confident ________________________________________________ Very confident
7. Do exercises even if they are tiring.
Not at all confident ________________________________________________ Very confident
8. Stick to your exercise program.
Not at all confident ________________________________________________ Very confident
9. Exercise at least three times per week.
Not at all confident _______________________________________________ Very confident
10. Do the type of exercises that you are supposed to do.

193
Not at all confident _____________________________________________ Very confident
11. Begin to eat more calcium rich foods.
Not at all confident _____________________________________________ Very confident
12. Increase your calcium intake.
Not at all confident _____________________________________________ Very confident
13. Consume adequate amounts of calcium rich food.
Not at all confidant _____________________________________________ Very confident
14. Eat calcium rich food.
Not at all confident _____________________________________________ Very confident
15. Change your diet to include more calcium rich foods.
Not at all confident _____________________________________________ Very confident
16. Eat calcium rich foods as often as you are supposed to do.
Not at all confident _____________________________________________ Very confident
17. Select appropriate foods to increase your calcium intake.
Not at all confident _____________________________________________Very confident
18. Stick to a diet which gives an adequate amount of calcium.
Not at all confident ____________________________________________ Very Confident
19. Obtain foods that give adequate amount of calcium.
Not at all confident ___________________________________________ Very confident
20. Remember to eat calcium rich foods.
Not at all confident __________________________________________ Very confident
21. Take calcium supplement if you don’t get enough calcium from your diet.
Not at all confident ____________________________________________ Very confident
Source: Horan, M., Kim, K., Gendler, P. (1991). Osteoporosis Self-Efficacy Scale. Grand Rapids, MI: Grand Valley State University.

194
Appendix 14. Human Subjects Protection Certificate

195
VITA
Graduate School Southern Illinois University
Victor N. White [email protected] University of Illinois-Springfield Bachelor of Arts, Health Administration, May 1994 Midwestern State University, Wichita Falls Master of Science, Radiologic Sciences, December 2000 University of Illinois-Springfield Master of Arts, Environmental Studies, December 2010 Dissertation Title:
“The Use of the Expanded Health Belief Model (EHBM) To Evaluate Osteoporosis, Attitudes, Knowledge, Beliefs and Self-Efficacy of Nez Perce Tribal Members and Non-Nez Perce tribal members in Nez Perce County, ID”
Major Professor: Dr. Dhitinut Ratnapradipa Publications: Co-author of a peer reviewed article entitled: “The Risk of Exposure to Non-Ionizing Radiation from Cell Phone Usage” published in the Spring 2014, Vol 3, No. 1 edition of The Quest.
White, V. (2013). Risk behaviors: Physical inactivity. In D. Wiley, & A. Cory (Eds.), Encyclopedia of school health. (Vol. 15, pp. 506-509). Thousand Oaks, CA: SAGE Publications, Inc. doi: http://dx.doi.org/10.4135/9781452276250.n204
White, V. (2013). Education content areas: Body systems. In D. Wiley, & A. Cory (Eds.),
Encyclopedia of school health. (Vol. 15). Thousand Oaks, CA: SAGE Publications, Inc. doi: http://dx.doi.org/10.4135/9781452276250.n204
Co-author of a peer reviewed article entitled “The 2011 Japanese Earthquake: An Overview of Environmental Health Impacts” published electronically in the July/August 2011 Journal of
Environmental Health.