the use of novel nanoscale materials for …€¦ · the use of novel nanoscale materials for...
TRANSCRIPT
Energy Research and Development Div is ion FINAL PROJECT REPORT
THE USE OF NOVEL NANOSCALE MATERIALS FOR SLUDGE DEWATERING A Field Demonstration
JULY 2014CEC ‐500 ‐2014 ‐081
Prepared for: California Energy Commission Prepared by: Kennedy/Jenks Consultants

Prepared by: Primary Author: Rajagopalan Ganesh Kennedy/Jenks Consultants 3210 El Camino Real, Suite 150 Irvine, CA 92602 Phone: 949-261-1577 | Fax: 949-261-2134 http://www.kennedyjenks.com Contract Number: PIR-10-008 Prepared for: California Energy Commission Paul Roggensack Contract Manager Virginia Lew Office Manager Energy Efficiency Research Office Laurie ten Hope Deputy Director RESEARCH AND DEVELOPMENT DIVISION Robert P. Oglesby Executive Director
DISCLAIMER This report was prepared as the result of work sponsored by the California Energy Commission. It does not necessarily represent the views of the Energy Commission, its employees or the State of California. The Energy Commission, the State of California, its employees, contractors and subcontractors make no warranty, express or implied, and assume no legal liability for the information in this report; nor does any party represent that the uses of this information will not infringe upon privately owned rights. This report has not been approved or disapproved by the California Energy Commission nor has the California Energy Commission passed upon the accuracy or adequacy of the information in this report.

i
ACKNOWLEDGEMENTS
The project team would like to thank California Energy Commission for the opportunity to demonstrate a novel concept in wastewater sludge dewatering through this study. The project team would like to convey its thanks to Mr. Robert Morton and Mr. James Barry of Los Angeles County Sanitation District (LACSD) and their entire biosolids group staff for their immense help throughout this study. Their knowledge and experience in performing field dewatering demonstrations and their willingness to assist with this project above and beyond their commitment was key to the successful completion of this project. The team also thanks Mr. Lory Larson of Southern California Edison for assistance with Methods Verification during field demonstration. Kennedy/Jenks expresses its thanks to Dr. Mathew Higgins, professor at Bucknell University for the lab work and field demonstration help. Finally, Kennedy/Jenks thanks Dr. Ganesh Skandan and Dr. Mohit Jain of NEI Corporation for tailoring the nanoadditives for effective dewatering of LACSD sludge.

ii
PREFACE
The California Energy Commission Energy Research and Development Division supports public interest energy research and development that will help improve the quality of life in California by bringing environmentally safe, affordable, and reliable energy services and products to the marketplace.
The Energy Research and Development Division conducts public interest research, development, and demonstration (RD&D) projects to benefit California.
The Energy Research and Development Division strives to conduct the most promising public interest energy research by partnering with RD&D entities, including individuals, businesses, utilities, and public or private research institutions.
Energy Research and Development Division funding efforts are focused on the following RD&D program areas:
• Buildings End‐Use Energy Efficiency
• Energy Innovations Small Grants
• Energy‐Related Environmental Research
• Energy Systems Integration
• Environmentally Preferred Advanced Generation
• Industrial/Agricultural/Water End‐Use Energy Efficiency
• Renewable Energy Technologies
• Transportation
The Use of Novel Nanoscale Materials for Sludge Dewatering is the final report for grant number PIR‐10‐008, conducted by Kennedy/Jenks Consultants. The information from this project contributes to Energy Research and Development Division’s Industrial, Agriculture and Water End‐Use Efficiency Research Program.
For more information about the Energy Research and Development Division, please visit the Energy Commission’s website at www.energy.ca.gov/research/ or contact the Energy Commission at 916‐327‐1551.

iii
ABSTRACT
Waste water treatment plants in California are estimated to consume 2,000 million kilowatt hours each year. A significant amount of this energy is spent in sludge treatment and disposal. This study demonstrated a novel nanoadditive technology to lower the energy use for sludge dewatering in wastewater treatment plants.
Mechanical dewatering devices such as centrifuges and belt filter presses currently used for sludge dewatering are very energy‐intensive. Polymers are added to improve dewatering efficiency and reduce energy use, but current understanding of polymer‐sludge interaction is incomplete. For example, similar wastewater treatment plants in the same geographical location may require different types of polymers for dewatering.
A major limitation may be the lack of understanding the role of nanoscale size sludge particles and polymer additives in enhancing dewatering efficiency. The recent emergence of nanotechnology has provided the opportunity to address these interactions. Nanotechnology is the study and use of nanoscale (1 to 100 nanometer) size particles. In this study, the terms nanoscale additives, nanoadditives, nanomaterials and nanoparticles are used interchangeably.
This study demonstrated using tailored nanoscale additives to conserve energy and improve dewatering efficiency during sludge dewatering. Nanoadditives of different types were evaluated for sludge dewatering. Field demonstrations were performed at Los Angeles County Sanitation District wastewater treatment plant at Carson, California. Thirty‐two different operating conditions were evaluated in the field trials. The trials demonstrated that the energy demand for dewatering can be reduced up to 25 percent by lowering the shear force required for the dewatering process through addition of nanoadditives. Overall sludge treatment costs were reduced as well.
The projected annual energy conservation estimate for California is approximately 18 million kilowatt hours. The annual savings in sludge treatment cost is estimated to be $10.5 million. This includes energy, disposal, polymer and nanoadditive costs.
Keywords: Nanoadditive, Sludge Dewatering, polymer‐aids, energy conservation, biosolids, odor control
Please use the following citation for this report:
Ganesh, Rajagopalan. (Kennedy/Jenks Consultants). 2013. The Use of Novel Nanoscale Materials for Sludge Dewatering: A Field Demonstration. California Energy Commission. Publication number: CEC‐500‐2014‐081.

iv
TABLE OF CONTENTS
ACKNOWLEDGEMENTS ....................................................................................................................... i
PREFACE ................................................................................................................................................... ii
ABSTRACT .............................................................................................................................................. iii
TABLE OF CONTENTS ......................................................................................................................... iv
LIST OF FIGURES ................................................................................................................................. vii
LIST OF TABLES ..................................................................................................................................... ix
EXECUTIVE SUMMARY ........................................................................................................................ 1
Introduction ........................................................................................................................................ 1
Background ......................................................................................................................................... 1
Limitations in Existing Approach .................................................................................................... 1
Proposed Technology ........................................................................................................................ 2
Screening Studies ............................................................................................................................... 2
Bench Scale Studies ............................................................................................................................ 2
Field Demonstration .......................................................................................................................... 3
Estimated Benefits .............................................................................................................................. 3
CHAPTER 1: Introduction ..................................................................................................................... 4
1.1 Background ................................................................................................................................. 4
1.2 State of the Art and Problems with Current Dewatering Practices .................................... 5
1.2.1 Summary of Current Practices ......................................................................................... 5
1.2.2 Limitations in Existing Practices ...................................................................................... 6
1.3 Opportunity to Improve Dewatering Efficiency ................................................................... 7
1.4 Objective ...................................................................................................................................... 7
CHAPTER 2: Review of Current Dewatering Practices Using Nanoadditives ........................... 8
2.1 Current Use of Nanoadditives for Dewatering ..................................................................... 8
2.1.1 Dewatering in Paper Industry .......................................................................................... 8
2.1.2 Dewatering of Refinery Sludge ........................................................................................ 8
2.2 Prior Project Studies by the Project Team ............................................................................... 8

v
2.2.1 Improving Energy Efficiency of Dewatering Process Using Nanoadditives ............ 8
2.2.2 Increase in Percent Solids in Dewatered Cake ............................................................... 9
2.2.3 Reduction of Organic Constituents in the Dewatered Supernatant ......................... 10
2.2.4 Removal of Biogenic Nanoscale Particles in the Supernatant for Odor Control .... 11
2.2.5 Polymer Dose Reduction Using Nanoscale Additives ............................................... 11
CHAPTER 3: Project Approach .......................................................................................................... 13
3.1 Overall Study Approach ......................................................................................................... 13
3.1.1 Screening Tests ................................................................................................................. 14
3.1.2 Bench Scale Studies .......................................................................................................... 15
3.1.3 Field Demonstration at LACSD Wastewater Treatment Plant at Carson, California 15
3.1.4 Methods Verification ....................................................................................................... 15
3.1.5 Economic Evaluation ....................................................................................................... 15
CHAPTER 4: Initial Screening Studies ............................................................................................. 16
4.1 Objective .................................................................................................................................... 16
4.2 Methodology for Screening Tests .......................................................................................... 16
4.3 Summary ................................................................................................................................... 20
CHAPTER 5: Bench Scale Dewatering Studies Using Nanoadditives and LACSD Sludge .. 21
5.1 Objective .................................................................................................................................... 21
5.2 Experimental Plan and Approach ......................................................................................... 21
5.2.1 Bench Scale Dewatering Studies .................................................................................... 21
5.2.2 Capillary Suction Time .................................................................................................... 22
5.2.3 Optimum Polymer Dose ................................................................................................. 23
5.2.4 Dewatered Cake Solids Analyses .................................................................................. 23
5.2.5 Filtrate Analyses ............................................................................................................... 23
5.2.6 Odor Production .............................................................................................................. 23
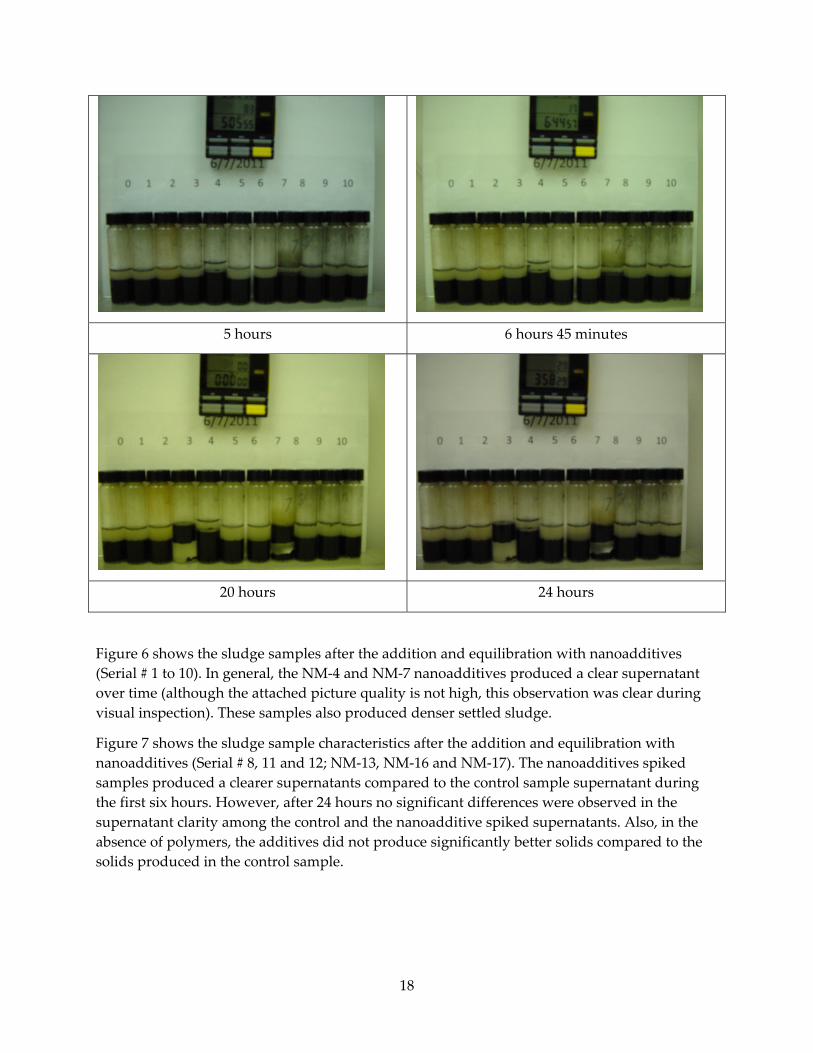
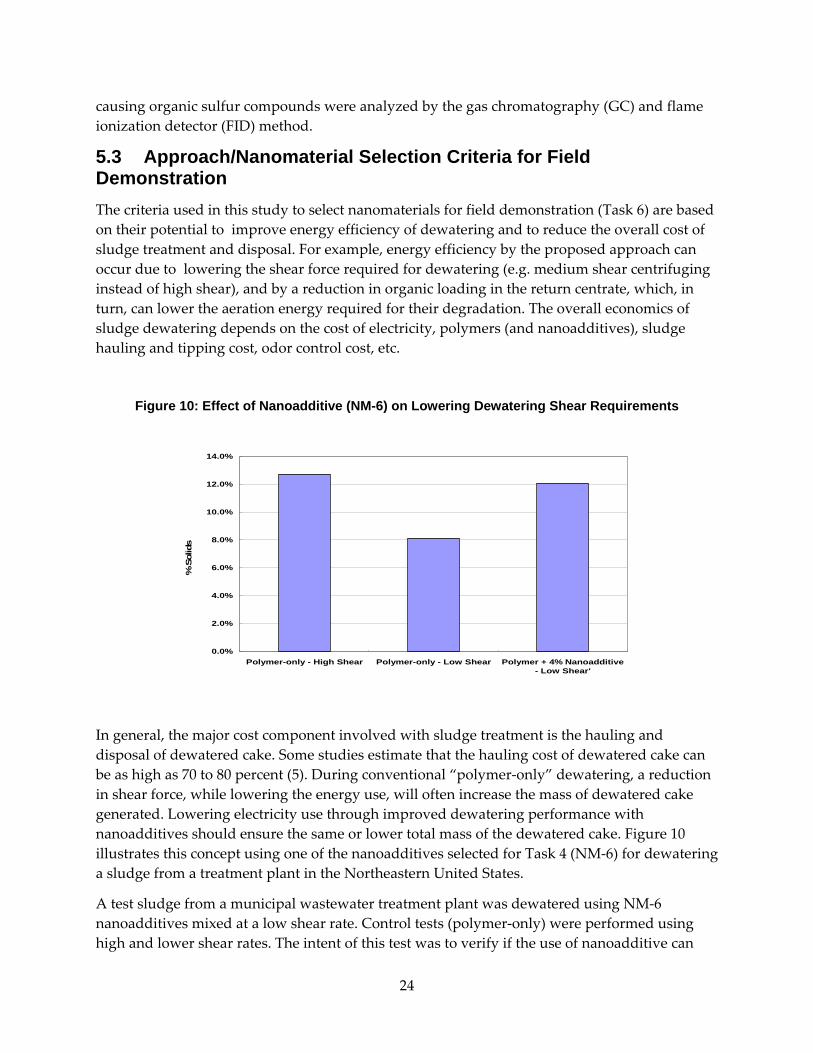
5.3 Approach/Nanomaterial Selection Criteria for Field Demonstration .............................. 24
5.4 Results and Discussion ............................................................................................................ 25
5.4.1 Evaluation of Six Nanoadditives (NM‐5, NM‐6, NM‐7, NM‐13, NM‐14, NM‐15) . 25
vi
5.4.2 Evaluation of Nanoadditives NM‐13, NM‐14 and NM‐15 Dosing on Dewatering Efficiency ........................................................................................................................................... 28
5.4.3 Evaluation of Nanoadditives NM‐16 and NM‐17 for Dewatering ........................... 30
5.4.4 Effect of NM‐17 on Biosolids Odor Production ........................................................... 36
5.5 Selection of Nanoadditive for Field Demonstration ........................................................... 38
CHAPTER 6: Field Demonstration of Sludge Dewatering ........................................................... 39
6.1 Demonstration Site Description and Field Test Set Up ...................................................... 39
6.1.1 Site Description................................................................................................................. 39
6.1.2 Pilot Test Configuration .................................................................................................. 39
6.1.3 Pilot Dewatering Equipment .......................................................................................... 40
6.1.4 Sludge Flow Rate .............................................................................................................. 41
6.1.5 Polymer for Dewatering .................................................................................................. 41
6.1.6 Nanoadditive for Dewatering ........................................................................................ 42
6.1.7 Nanoadditives Mixing Time ........................................................................................... 43
6.1.8 Control of Energy Use during Dewatering .................................................................. 43
6.1.9 Analytical Methods .......................................................................................................... 44
6.1.10 Energy Estimates .............................................................................................................. 44
6.2 Key Goals of the Pilot Study ................................................................................................... 45
6.3 Results and Discussions .......................................................................................................... 45
6.3.1 Summary of Test Runs .................................................................................................... 45
6.3.2 Energy Use at Different Bowl Shears ............................................................................ 47
6.3.3 Dewatered Cake Mass ..................................................................................................... 48
6.3.4 Impact of Nanoadditive on Polymer Dose Requirements ......................................... 50
6.3.5 Impact of Nanoadditive Contact Time during Dewatering ....................................... 51
6.3.6 Odor Reduction ................................................................................................................ 52
6.3.7 Filtrate Quality .................................................................................................................. 54
CHAPTER 7: Methods Verification ................................................................................................... 55
7.1 Background ............................................................................................................................... 55
7.2 M&V Testing ............................................................................................................................. 55

vii
7.3 Conclusion ................................................................................................................................ 56
CHAPTER 8: Production Readiness Plan ......................................................................................... 57
CHAPTER 9: Energy Conservation and Economic Evaluation .................................................... 59
9.1 Background and Approach .................................................................................................... 59
9.2 Economic Analyses .................................................................................................................. 61
9.3 Energy Conservation Estimates due to the Proposed Application ................................... 63
CHAPTER 10: Summary and Recommendations ........................................................................... 66
10.1 Summary ................................................................................................................................... 66
10.2 Recommendations .................................................................................................................... 67
GLOSSARY .............................................................................................................................................. 68
REFERENCES .......................................................................................................................................... 70
APPENDIX A: Report Of WERF Study (U3r08) To Improve Dewatering From Sludges Other Than LACSD Sludge Pledged As Task 4 ......................................................................................... A‐1
APPENDIX B: Raw Data Collected For Measurement & Verification by Southern California Edison ...................................................................................................................................................... B‐1
APPENDIX C: List of California WWTPS Using Mechanical Dewatering for Sludge Treatment ................................................................................................................................................ C‐1
LIST OF FIGURES
Figure 1: Percent Solids in the Dewatered Return Activated Cake Treated with Polymer alone or “Polymer + 1.5% Nanoadditive ................................................................................................................ 9 Figure 2: COD Levels in Anaerobic Sludge Filtrate Dewatered with and Without Nanoscale Additives (4% NM‐6) ............................................................................................................................... 10 Figure 3: Submicron Particles in Dewatered Anaerobic Sludge Treated with Nanoscale Additives (4% NM‐6) ............................................................................................................................... 11 Figure 4: Capillary Suction Time of Sludge Dewatered with and without Nanoscale Additives (4% NM‐6) ................................................................................................................................................. 12 Figure 5: Approach Used to Study the Interactions of Nanomaterials with Polymer and Sludge Constituents during Dewatering and Odor Control ........................................................................... 14 Figure 6: Sludge Samples after Addition of Nanoadditives (Serial #s 1‐10) .................................... 17 Figure 7: Sludge Samples after Addition of Nanoadditives (NM‐13, NM‐16 and NM‐17) ........... 19 Figure 8: Mixing Protocol for Chemical Addition for Low Shear Experiments .............................. 22 Figure 9: Mixing Protocol for Chemical Addition for High Shear Experiments............................. 22 Figure 10: Effect of Nanoadditive (NM‐6) on Lowering Dewatering Shear Requirements .......... 24

viii
Figure 11: Effect of Various Nanoadditives on Capillary Suction Time .......................................... 25 Figure 12: Effect of Various Nanoadditives on Total Suspended Solids in the Filtrate during Dewatering of LACSD Sludge ............................................................................................................... 26 Figure 13: Effect of Various Nanoadditives on Filtrate Turbidity .................................................... 26 Figure 14: Effect of Various Nanoadditives on Filtrate UV‐Visible Absorbance ............................ 27 Figure 15: Effect of Various Nanoadditives on Percent Solids in the Dewatered Cake ................. 27 Figure 16: Effect of NM‐13 on CST during Dewatering of LACSD Sludge ..................................... 28 Figure 17: Effect of NM‐14 on CST during Dewatering of LACSD Sludge ..................................... 28 Figure 18: Effect of NM‐15 on CST during Dewatering of LACSD Sludge ..................................... 29 Figure 19: Effect of NM‐13 on Percent Solids in the Dewatered during Dewatering of LACSD Sludge ........................................................................................................................................................ 29 Figure 20: Effect of NM‐14 on Percent Solids in the Dewatered during Dewatering of LACSD Sludge ........................................................................................................................................................ 30 Figure 21: Effect of NM‐15 on Percent Solids in the Dewatered during Dewatering of LACSD Sludge ........................................................................................................................................................ 30 Figure 22: Effect of NM‐13 Addition on CST during Dewatering of LACSD Sludge .................... 31 Figure 23: Effect of NM‐16 on CST during Dewatering of LACSD Sludge ..................................... 31 Figure 24: Effect of NM‐17 on CST during Dewatering of LACSD Sludge ..................................... 32 Figure 25: Effect of NM‐13 Addition on Filtrate Absorbance during Dewatering of LACSD Sludge ........................................................................................................................................................ 32 Figure 26: Effect of NM‐16 Addition on Filtrate Absorbance during Dewatering of LACSD Sludge ........................................................................................................................................................ 33 Figure 27: Effect of NM‐17 Addition on Filtrate Absorbance during Dewatering of LACSD Sludge ........................................................................................................................................................ 33 Figure 28: Effect of NM‐13 Addition on Percent Solids in LACSD Dewatered Cake .................... 34 Figure 29: Effect of NM‐16 Addition on Percent Solids in LACSD Dewatered Cake .................... 34 Figure 30: Effect of NM‐17 Addition on Percent Solids in LACSD Dewatered Cake .................... 35 Figure 31: Effect of Nanomaterials Addition (NM‐13, NM‐16 and NM‐17) on Percent Solids in LACSD Dewatered Cake......................................................................................................................... 35 Figure 32: Estimated Mass of Nanomaterials (NM‐13, NM‐16 and NM‐17) in the Dewatered Cake ........................................................................................................................................................... 36 Figure 33: Total Wet Mass of Cake Mass Generated (NM‐13, NM‐16 and NM‐17) through Nanomaterials‐aided Treatment Relative to Conventional Polymer‐only Treatment ................... 36 Figure 34: Effect of NM‐17 Addition in Control of Odor Causing Compound Production from Dewatered LACSD Sludge ..................................................................................................................... 37 Figure 35: Effect of NM‐17 Addition in Headspace Methane Production from Dewatered LACSD Sludge .......................................................................................................................................... 37 Figure 36: Simplified Schematic of Pilot Test Configuration ............................................................. 40 Figure 37: Picture of Pilot Demonstration Set Up ............................................................................... 40 Figure 38: Picture of ALSYS 45 Pilot Demonstration Unit ................................................................. 41 Figure 39: Nanoadditives (NM‐17 @ 10%) Shipped in 15 Gallon Sealed Containers ..................... 42 Figure 40: Nanoadditives Metering and Injection Set Up .................................................................. 43 Figure 41: Hoppers to Collect Dewatered Cake .................................................................................. 44
ix
Figure 42: Average Electricity Consumption by ALSYS 45 at Various Dewatering Bowl Shears 48 Figure 43: Percent Solids in the Dewatered Cake at a Polymer Dose of 14 lb/DT with and without NM‐17 Addition ........................................................................................................................ 48 Figure 44: Amount of Dewatered Cake Generated at a Polymer Dose of 14 lb/DT with and without NM‐17 Addition ........................................................................................................................ 49 Figure 45: Mass of Dewatered Cake Generated at Bowl Shear of 3,600 rpm with and without NM‐17 Addition ....................................................................................................................................... 50 Figure 46: Relationship Between Polymer Dose and Mass of Dewatered Cake Generated at Bowl Shear of 3,600 rpm with and without NM‐17 Addition ..................................................................... 51 Figure 47: Impact of Nanoadditive Mixing Time on Dewaterability of LACSD Sludge ............... 52 Figure 48: Odor Production from Dewatered Cake ............................................................................ 53 Figure 49: Effect of Shear and NM‐17 Dose on Odor Production from Dewatered Cake ............. 53 Figure 50: COD of Centrate Samples when Centrifuge was Operated at a Bowl Shear of 3,600 rpm ............................................................................................................................................................. 54 Figure 51: COD of Centrate Samples when Centrifuge was Operated at a Polymer Dos of 14 lb/DT .......................................................................................................................................................... 54 Figure 52: Data Logger for Recording Energy Use during Dewatering ........................................... 56 Figure 53: Schematics of Manufacturing Process for Production of Nanoadditives to Enhance Sludge Dewatering .................................................................................................................................. 57 Figure 54: Nanoadditive Requirement at Lower Shear Dewatering to Produce Sludge Mass Comparable To High Shear Polymer‐only Treatment ........................................................................ 59
LIST OF TABLES
Table 1: Specific Resistance to Filtration (SRF) With and Without Nanoadditives .......................... 9 Table 2: List of Nanomaterials Used in the Screening Studies .......................................................... 16 Table 3: Technical Details of ALSYS 45 Pilot Dewatering Unit ......................................................... 41 Table 4: Summary of 32 Field Dewatering Studies Performed at LACSD ....................................... 45 Table 5: Estimated Cost and Profit Margin for NM‐17 Additive ...................................................... 58 Table 6: Operational Parameters and Dosing Used to Develop Dewatering Cost Estimates Using Nanoadditives .......................................................................................................................................... 60 Table 7: Assumptions Used for Operations Cost Estimates with and without the Use of Nanoadditives .......................................................................................................................................... 61 Table 8: Summary of Economic Evaluation for Nanoadditives‐Based Dewatering ....................... 61 Table 9: Summary of Dewatering Operations in California WWTPs ............................................... 64
1
EXECUTIVE SUMMARY
Introduction This study demonstrated using novel or unique nanoparticles in enhancing the energy efficiency of sludge dewatering in wastewater treatment plants, and also reducing the overall sludge treatment cost.
Approximately 2,000 million kilowatt hours of electricity are consumed annually in wastewater treatment plants in California and about 10 to 40 percent of this energy is used for various sludge handling processes. The sludge generated during wastewater treatment is typically thickened, digested, and then dewatered (removing water) prior to offsite disposal. The solid content of the thickened sludge is about three to five percent, which is ultimately increased to more than 20 to 25 percent by mechanical dewatering units such as belt filter presses, screw presses and centrifuges. Centrifuges consume about 30,000 kWh/yr per million gallons per day. Belt filter presses typically consume about 2,000‐6,000 kWh/yr per million gallons per day.
In many instances the dewatered sludge (which is typically about 20 to 30 percent solids or 70 to 80 percent water) is dried by thermal processes to further remove more water. A significant amount of natural gas or electricity is used during thermal drying process. Increasing the solid content (i.e. increasing the amount of water removed) of the cake during mechanical dewatering will lower the energy demand for subsequent t thermal drying process.
Background Wastewater treatment plants use a variety of polymers to improve the efficiency of mechanical dewatering processes. Polymers of various configuration (straight chained, branched), charge, and functional groups are used for dewatering. Even though polymer‐aided dewatering has been used by the wastewater industry for a long time, significant limitations exist in this practice. For example, even within the same geographical area, using a similar type of wastewater treatment process, the type and dose of polymers used for sludge dewatering varies from one wastewater treatment plant to another. Because of the large variations that exist in the polymer use industry, experts describe the dewatering process as “a little bit of science and a little bit of art.” This approach limits the process and energy efficiency of current sludge dewatering processes.
Limitations in Existing Approach Despite a large number of research studies performed to date on sludge dewatering, one major area that has not been adequately addressed is the role of sub‐micron and nanoparticles. This includes naturally occurring (biogenic) suspended solids in nanoscale size ranges in the sludge, and the nanoscale dewatering aids to improve sludge conditioning. However, the recent nanotechnology has provided tools to monitor nanoscale particles in sludge as well as design dewatering aids in nanoscale size ranges that can potentially improve sludge dewatering efficiency.

2
Proposed Technology This study demonstrated a new concept using nanoparticle additives for improving dewatering and reducing biosolids odor. Nanoparticles are innovative materials with unique physical and chemical properties. They are extremely small size (1 to 100 nanometers) and significantly high surface area compared to conventional micron‐sized particles of the same chemical composition. At the nanoscale size, many materials have been demonstrated to be more reactive than conventional materials. Also, in many cases the mechanisms of nanoscale material reactions are different than those of their micron‐sized counterparts. Because of their unique properties, nanoscale materials have recently replaced their dissolved/micron‐sized counterparts in several industrial/commercial products. Nanoparticles, therefore, may hold promise for improving dewatering by complementing polymers in effective interactions with sludge components, and reducing odor production in biosolids by adsorbing (accumulating molecules on the surface) odor‐causing chemicals or their precursors.
The major energy demand in sludge dewatering is associated with the shear force applied by mechanical dewatering devices (e.g. centrifuges, belt filter presses). A higher shear force equals higher energy demand, but removes more water from the sludge and produces a smaller mass of cake for disposal. A lower shear requires a lower amount of energy but produces a larger cake mass for disposal. Another energy demanding component of the dewatering process is the organic content of the centrate or supernatant (usually clear liquid overlying material deposited by settling, precipation or centrifuge) stream. This centrate stream is often returned to the head works of the treatment plant for treatment. A higher organic content in the centrate will require higher (aeration) energy for treatment. For this reason, during implementing the proposed nanoadditive program, it is essential to evaluate its impact on both components.
In addition, it is important that the proposed nanoadditive program should not only reduce energy demand, but also lower the overall sludge treatment cost. For example, in California the dewatered cake is often hauled over hundreds of miles to the disposal site (land farms, landfills). Approximately 70 to 75 percent of the sludge treatment cost is disposing of the dewatered cake and about 10 to 20 percent of the cost of sludge dewatering is polymer cost. The success of the proposed technology depends on its overall impact on the sludge treatment cost.
Screening Studies As part of the current study, laboratory screening studies were performed using 12 nanoparticles of different compositions and configurations. The nanoparticles were synthesized with chemicals used in water and wastewater treatment or other benign chemicals. Anaerobically digested sludge from the Los Angeles County Sanitation District wastewater treatment plant at Carson, California was used in these dewatering studies. In these screening tests, sludge was added with nanoadditives of sludge solids, vibrated using a vortex, and allowed to settle. The quality of settled sludge and supernatant were visually inspected for selection of sludge for bench scale studies.
Bench Scale Studies Detailed bench scale studies were performed using eight of the twelve nanoadditives from the screening studies. The polymer currently used at the plant was used in these studies.
3
Five of the eight nanoadditives did not improve dewatering during the bench scale evaluation. Only one of the nanoadditives reduced the dewatered cake mass and organic content sufficiently to be selected for the field demonstration.
Field Demonstration The field demonstration of the nanoadditive‐aided sludge dewatering was performed at the Los Angeles County Sanitation District wastewater treatment plant at Carson, California. The energy use during dewatering was measured by Southern California Edison as part of its measurement and verification protocol and staff of Alfa Laval (pilot dewatering unit). Thirty‐two dewatering tests were performed covering a wide range of operating conditions.
The demonstration indicated that nanoadditives can be effective in reducing the shear force, and lowering the energy required for dewatering, without compromising the overall sludge treatment cost. Furthermore, the nanoadditives lowered the polymer demand by approximately 20 percent. Adding one percent nanoadditive lowered the polymer demand to even more. Finally, the energy use for dewatering decreased by 12.5 percent when the dewatering shear was lowered by reducing centrifuge speed.
Estimated Benefits The project analyses indicated that approximately nine California wastewater treatment plants using high shear centrifuge dewatering (treating 1,600 million gallons per day (MGD) wastewater) can benefit from the proposed technology. The estimated energy savings for California wastewater treatment plants is 18 million kilowatt hours per year. Nationally the estimated energy conservation is about 55 million kilowatt hours per year. These estimates do not include energy conservation for dewatering in drinking water treatment plants and that used for drying the dewatered sludge in many water and wastewater treatment facilities. Assuming a 40 percent electricity reduction from industrial and drinking water dewatering and wastewater sludge drying operations, the total energy conservation in U.S. could be about 75 million kilowatt hours and $10.5 million per year from nanoadditive aided dewatering. Assuming the global market for sludge dewatering to be about three times the market of the United States, the global energy savings from the proposed application is about 225 million kilowatt hours and $100 million annually.

4
CHAPTER 1: Introduction 1.1 Background Recent surveys of wastewater operators have shown that sludge dewatering and odor production are top concerns during wastewater treatment (1, 2). Up to 50 percent of the cost of wastewater treatment is spent on sludge management (e.g. dewatering and sludge odor control). A 2004 estimate by California Energy Commission indicates that the total energy consumed for wastewater treatment in California is about 2,000 million kilowatt hours (kWh) annually. Approximately 10 to 40 percent of the energy for wastewater treatment is used for various sludge handling processes (3).
Sludge generated during wastewater treatment is typically thickened, digested, and then dewatered prior to offsite disposal. The solids content of the thickened sludge is about three to five percent, which is ultimately increased to more than 20 to 25 percent after sludge dewatering/drying activities (4). Centrifuge and belt filter press that are often used for dewatering are very energy‐intensive. Centrifuges and belt filter presses typically consume about 30,000 and 2000‐6000 kWh/yr per MGD, respectively. In 2007, approximately 29 and 13 million wet tons of digested sludge (often referred to as biosolids), were treated by centrifuges and belt filter presses, respectively, in the United States.
In many instances, the dewatered sludge (which is typically about 20 to 30 percent solids or 70 to 80 percent water), is dried by thermal processes to further remove the water content. A significant amount of natural gas or electricity is used during this thermal drying process. For example, for a typical dewatered sludge that contains one ton of dry solids (@ 25 percent solids), nearly 0.6 Million British thermal units is required to lower the water content by one percent. Evaluation by Dolak et al. indicated a 30 percent reduction in energy required for sludge drying for a five percent increase in solids content of the dewatered sludge.
The dewatered sludge is often hauled to an offsite location for ultimate disposal. The sludge hauling cost can constitute over 50 to 70 percent of the overall sludge treatment/disposal cost (5). Furthermore, trucking of sludge involves a large amount of fuel demand and vehicular emissions. In recent years, the sludge hauling/disposal problem has been further aggravated by urban and rural sprawl, along with encroachment of agricultural lands where the dewatered sludge is often land‐applied. Between 1994 and 1997, more than two million acres of agricultural land was converted for residential use (6). This trend in agricultural land conversion is expected to continue into the future. As a result, the agricultural area available to municipal wastewater treatment facilities for land application of dewatered sludge has significantly shrunk in recent years. Additionally, public complaints from these new residential areas have significantly increased due to the odor from neighboring agricultural land. All of these factors have forced utilities to truck the dewatered sludge farther and farther away from the treatment facilities. For example, dewatered sludge from the Los Angeles County Sanitation
5
Districts (LACSD) is currently trucked hundreds of miles away to San Joaquin Valley and Arizona for land application.
To reduce the carbon footprint associated with trucking of dewatered sludge, more and more treatment plants are using mechanical dewatering devices such as belt filter presses and centrifuges. These mechanical dewatering devices effectively lower the water content of the sludge, thereby lowering the mass of sludge that must be transported. A recent survey by North East Biosolids and Residuals Association (NEBRA) indicated that more than 900 municipal wastewater treatment plants in the United States now use mechanical dewatering devices, which process more than 1.3 million tons of biosolids per year (4). To enhance the process/energy efficiency of mechanical dewatering processes, various cationic polymers, polyelectrolytes and other chemicals (e.g. ferric chloride) are often added to the sludge.
While mechanical dewatering devices help to lower the sludge mass that requires disposal, there are significant limitations exist in their use. For example, a large amount of energy is required for operating dewatering devices and this energy demand increases with the shear force required for dewatering. Even after decades of use, the factors affecting dewatering operations (particularly, the polymer‐sludge interactions) are still not well understood limiting the extent of dewatering achieved in the dewatering operations. This impacts the energy demand for thermal drying and/or trucking requirement for dewatered sludge disposal. Recent studies have shown that high shear centrifuges release more bioavailable protein from sludge solids during the dewatering process (7, 8). The bioavailable proteins are a major source of odor‐causing compounds in land‐applied sludge because they are biodegraded to volatile organic sulfur and volatile aromatic compounds(9, 10). Such odor production further complicates the sludge disposal process due to the urban and rural sprawl issues discussed earlier.
The wastewater industry is urgently requires a dewatering process that is energy efficient, economical and can significantly increase the percent solids in the dewatered sludge. At the same time, the process should release the minimum amount of odor causing proteins.
1.2 State of the Art and Problems with Current Dewatering Practices 1.2.1 Summary of Current Practices In most wastewater treatment plants (WWTP) a main goal of the dewatering process is to remove as much water in the digested sludge as possible and obtain the smallest possible amount of dewatered cake solids. This, in turn, lowers the cost of sludge reuse (land farms) or disposal (landfills).
Dewatering is often accomplished using mechanical dewatering devices such as belt filter press, screw presses, or centrifuges. The shear force and hence, energy demand, required for these devices vary. In general, the advantages of using a belt filter press (a low shear dewatering process) include lower capital cost, lower energy demand, low polymer requirement and low maintenance cost. As a result the smaller utilities tend to prefer belt filter press for dewatering. The advantages of centrifuge dewatering (high shear device) include drier (hence, lower mass of) sludge production and lower frequency of maintenance. Due to these features, larger

6
utilities favor using centrifuges for dewatering. While high shear centrifuges produce a lower volume of dewatered sludge, studies indicate that high shear also releases a large amount of odor‐causing proteins.
Typical energy consumption for operation of centrifuges range from 25,000 to 30,000 kWh/yr MGD of sludge treated. The energy use is approximately 2,000 to 6,000 kWh/yr per MGD for belt filter presses. In typical WWTPs, energy use for various sludge handling activities is the second highest energy use after aerating secondary treatment processes.
A variety of polymers and polyelectrolytes have long been used to improve efficiency of mechanical sludge dewatering processes. The efficiency of polymer‐aided sludge dewatering is significantly influenced by sludge constituents, sludge conditioning techniques, polymer characteristics, and type of dewatering equipment (7, 8). Typical sludge constituents that affect dewatering efficiency include soluble organics, proteins, polysaccharides, dissolved metals as well as percent sludge solids. The polymers of different configurations (e.g. straight chain versus branched), functionality, charge density, molecular weight and hydrophobicity are often used for dewatering. Polymer aging, mixing sequence, time and shear can also influence mechanical dewatering efficiency. Various mechanisms such as charge neutralization, bridging, rigid pore structure formation during ‘polymer – sludge’ interactions are reported to affect the dewatering process (11).
The typical polymer demand varies from 15 lb/dry ton sludge to 25 lb/dry ton of sludge mass. As a rule of thumb, belt filters and centrifuges operated for dewatering aeration process sludge use straight chain polymers (12,13). Branched chain polymers yield better dewatering for centrifuges that dewater anaerobically digested sludge. The polymer cost for sludge treatment represents about 10 to 20 percent of the overall dewatering and disposal cost (14).
Finally, the dewatered sludge (percent solids of 20 to 30 percent or water content of 70 to 80 percent), is often hauled to off‐site locations for land application or to landfills. The overall cost of sludge hauling varies with the water content and distance of the disposal site. For example, the average sludge hauling cost for WWTPs is approximately $50 to $60 per wet ton of sludge hauled. The hauling cost of dewatered sludge may be about 70 to 80 percent of the total sludge disposal cost (14).
1.2.2 Limitations in Existing Practices Despite decades of studies performed, the practice of sludge dewatering is largely empirical. For example, within the same geographical area and using similar type of wastewater treatment process, the type and dose of polymers used for sludge dewatering varies from WWTP to WWTP. Because of the large variations that exist in the polymer use industry, experts describe dewatering process as “a little bit of science and a little bit of art” (15). One possible explanations for why this knowledge gap exists is not understanding nanoscale particles (nanoscale sludge components and nanoscale dewatering additives) during dewatering. For example, digested sludge contains not only particles that are micron size or larger scale, but also particles that are smaller i.e., sub‐micron or nanoscale size particles. While, studies have monitored micron or larger size particles in sludge, no systematic studies have been performed

7
to date to understand the role of sub‐micron/nanoscale size particles on effective dewatering. Similarly, while a variety of polymer aids have been used to improve dewatering, no systematic approach has been made to develop nanoscale size additives with defined physical/chemical characteristics to enhance dewatering efficiency.
1.3 Opportunity to Improve Dewatering Efficiency Nanotechnology is the study of synthesizing and using materials in extremely small (< 100 nanometer [nm]) size. Particles in nanoscale size have been observed to possess unique physical and chemical characteristics (16). The emergence of nanotechnology has provided an opportunity to improve sludge dewatering techniques. Nanotechnology is defined as the synthesis and use of materials in nanoscale size (1 to 100 nm) (16). For many materials, as their size is reduced to nanoscale size range their physical and chemical characteristics change. Often times, particles in nanoscale size, are significantly more reactive than the same material in bulk size (e.g. nano silver vs. silver salt) (17). Furthermore, nanotechnology tools facilitate structuring the particles with desired characteristics for variety of applications (18).
To date, no systematic efforts have been made to design and use manufactured nanomaterials to improve polymer aided dewatering. Nanomaterials, due to their unique characteristics, can supplement polymers currently used to improve dewatering efficiency. The ability to engineer the materials to have a desired shape, size and functionality provides an opportunity develop designer additives to improve polymer aided dewatering and more importantly, enhance the energy efficiency of sludge dewatering process. Further, anecdotal evidence in literature as well as bench scale studies by the project team indicate that nanoscale constituents and additives can play a significant role in improving the dewatering processes.
1.4 Objective This study demonstrated improved energy efficiency and lowered the carbon footprint during biosolids (sludge) treatment in wastewater treatment plants using innovative nanoscale material additives. With this application of nanoscale material technology, energy use can be reduced and result in WWTP improvements in the dewatering processes. Additionally greenhouse gas emissions can be reduced by lowering the mass of sludge transported for offsite disposal.

8
CHAPTER 2: Review of Current Dewatering Practices Using Nanoadditives This section presents available information in literature on the use of nanoadditives for industrial dewatering processes, wastewater treatment, and summarizes data developed by the project team for dewatering municipal and industrial sludge.
2.1 Current Use of Nanoadditives for Dewatering 2.1.1 Dewatering in Paper Industry Studies to evaluate the use of nanoscale additives, have been carried out to a certain extent in the pulp and paper industry where retention of fibers and generation of high quality pulp stock are achieved through dewatering. The mechanisms of fiber retention and drainage during paper manufacturing are similar to those of sludge dewatering during wastewater treatment. Similar to sludge dewatering, a variety of cationic polymers, starch and other retention aids are used for pulp dewatering. The industry has evaluated the effectiveness of nanoscale additives, such as colloidal silica and bentonite for enhancing retention and dewatering (19, 20). These additives are used in association with cationic polymers or starch. In general, use of nanoscale additives appears to improve the drainage as well as retention characteristics of pulp materials. Charge neutralization and formation of tighter microflocs in the presence of nanoscale additives appear to improve the pulp dewatering process. One study using colloidal silica indicated that the charge density, silica size and the sequence of addition (polymer addition followed by colloidal silica addition) were key to improving dewatering efficiency (21). Significant energy savings in subsequent paper drying has also been estimated (~ 4 to 5 percent reduction in drying load corresponding to one percent increase in solids content) due to the use of nanoadditives.
2.1.2 Dewatering of Refinery Sludge Some refinery dewatering studies have evaluated the use of fly ash (which typically has some nanoscale size fractions) as a “skeleton builder” found improvement in polymer‐aided dewatering (22). However, no attempt has been made to use nanoparticles specifically by this industry.
2.2 Prior Project Studies by the Project Team The project team has earlier performed bench‐scale studies to improve sludge dewatering and control of biosolids odor using a wide range of nanoscale additives also called nanoadditives (23, 24). The data from these studies indicated that nanoadditives can improve efficiency of dewatering and control odor production from biosolids. Key findings of these studies are summarized in the following sections.
2.2.1 Improving Energy Efficiency of Dewatering Process Using Nanoadditives Laboratory dewatering studies were performed using sludge from a municipal wastewater treatment facility in Pennsylvania using protocols described elsewhere (23). Briefly,

9
nanoadditives, along with polymers were added to the digested sludge and paddle mixed at a predetermined speed and duration to impart shear energy to facilitate interaction of the additives, polymer and sludge constituents. The “conditioned” sludge was then subjected to a variety of tests to evaluate dewatering efficiency. One of the key performance parameter that was measured to evaluate sludge dewatering efficiency is specific resistance to filtration (SRF). The SRF analyses measures the filtrate flow rate normalized to the pressure applied per unit area of the filter. The energy for sludge dewatering (and hence, the energy conservation) has a proportional relationship with the SRF. Data from a study is shown in Table 1 as an example. The study using one of the nanoadditives (along with polymers) indicated that, addition of this additive lowered the SRF of the sludge by 30 to 50 percent (25).
Table 1: Specific Resistance to Filtration (SRF) With and Without Nanoadditives
Treatment Optimum Polymer Dose SRF Polymer Only 27.4 Kg/Ton 5.6 X 10¹¹ m/Kg
Polymer + Nanoadditive
20.5 Kg/Ton 3.8 to 3.9 X 10¹¹ m/Kg
2.2.2 Increase in Percent Solids in Dewatered Cake Another dewatering performance parameter measured in the laboratory studies is the percent solids in the dewatered cake. The percent of solids in the cake is a measure of the amount of water removed from the sludge. A higher percent of solids in the dewatered cake indicates higher removal of water from the sludge and is a key parameter with respect to reducing energy demand for thermal drying of dewatered sludge as well as lowering carbon foot‐print related to hauling of sludge to disposal site. Figure 1 shows the percent solids data of the polymer‐aided dewatered cake with and without nanoadditives.
Figure 1: Percent Solids in the Dewatered Return Activated Cake Treated with Polymer alone or “Polymer + 1.5% Nanoadditive
0
2
4
6
8
10
12
14
16
0.0 2.0 4.0 6.0 8.0 10.0 12.0 14.0
Polymer Dose (lb/Dry Ton)
Perc
ent S
olid
s
Polymer Only Polymer + Nanoadditive

10
As shown in Figure 1, addition of 1.5 percent of nanoadditive significantly increased the percent solids of the dewatered cake. For example, at a polymer dose of about 19.5 milligrams per kilogram (mg/Kg) of dry solids (DS), the percent solids for the polymer‐only and “polymer + 1.5 percent additive” cakes were 5.3 and 8.1 percent, respectively. Similarly, at a polymer dose of 26.5 mg/Kg DS the percent samples for these treatments were 6.8 and 10.5 percent respectively. Subsequently, a mass balance analyses was performed for the nanoadditives by measuring its concentration in the filtrate and filtered cake. The data indicated that more than 75 percent improvement in percent solids was due to higher sludge solids capture in the presence of nanoscale additives.
2.2.3 Reduction of Organic Constituents in the Dewatered Supernatant Once the sludge is dewatered, the supernatant water (centrate) is returned to the head works of the treatment plant. The quality (e.g. organic content), of the dewatered supernatant is important for energy conservation in two aspects. First, the supernatant that is returned to the head works of the wastewater treatment process is subjected to aeration and other treatment. Lowering organic content in the supernatant will lower the (aeration) energy demand for the treatment of this stream. Secondly, capturing the organic constituents into the sludge mass during dewatering will increase the energy content of the dewatered sludge.
Figure 2, shows the concentration of organic content (measured as chemical oxygen demand [COD]), in the dewatered centrate from control (‘polymer only’ treatment) and nanoadditive added samples. The COD of the centrate from the control samples was approximately 400 milligrams per liter (mg/l) at a polymer dose of 14 pounds per dry ton (lb/Dry Ton). The COD decreased to below 250 mg/l at a polymer dose of approximately 16 lb/Dry Ton or above. In the nanoadditives added samples the COD was below 250 mg/l even at a polymer dose of 10 lb/Dry Ton. This data shows the effectiveness of nanoadditives in binding organic compounds in the sludge and improving dewatering efficiency.
Figure 2: COD Levels in Anaerobic Sludge Filtrate Dewatered with and Without Nanoscale Additives (4% NM-6)
150
200
250
300
350
400
450
5.0 10.0 15.0 20.0 25.0Polymer Dose (lb/Dry Ton)
Polymer Only
Polymer + Nanoadditive (NM-6 @ 4%)
11
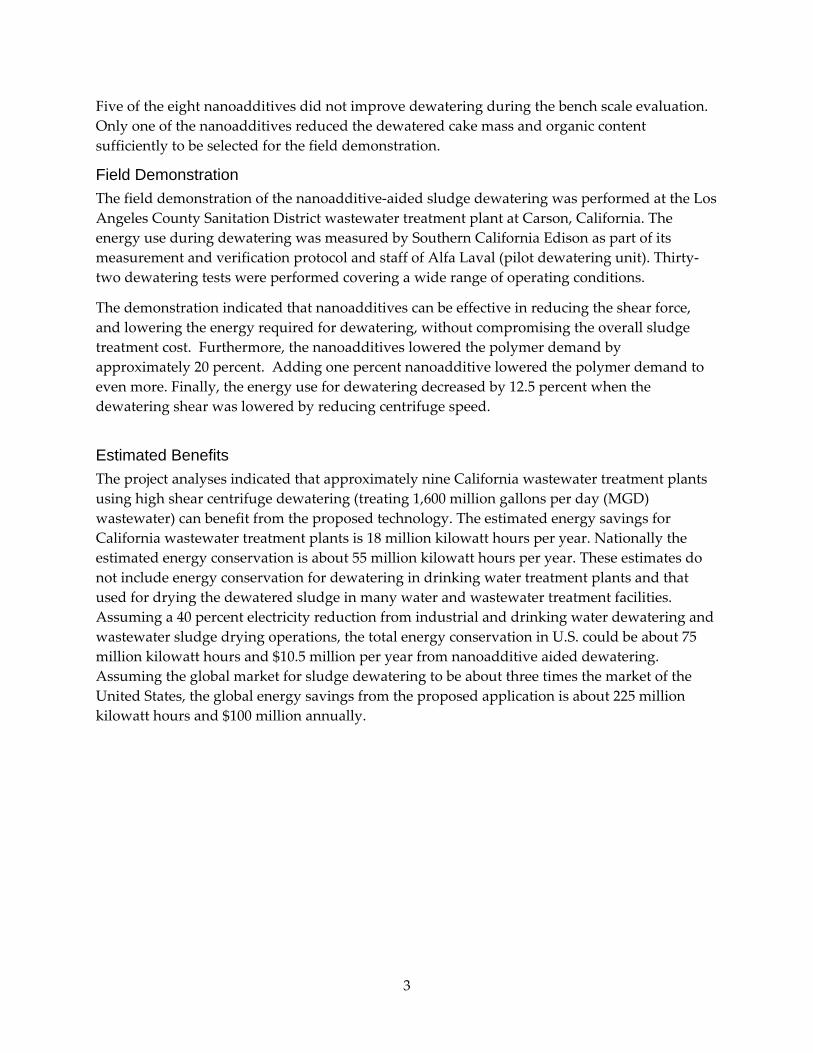
2.2.4 Removal of Biogenic Nanoscale Particles in the Supernatant for Odor Control In another test to evaluate the quality of the dewatered centrate biogenic submicron (0.45 micrometers [μm]), particle count in the centrate was measured using a Beckman Coulter N4 Plus Particle Size Analyzer (Figure 3). The average number of particles in the untreated sludge filtrate was about 5.3 X 10⁶ per unit volume. The total number of particles decreased to 1.8 X 10⁶ when polymer alone was used for dewatering. In the polymer + nanoadditive (4 percent) treated samples the number of submicron particles in the filtrate decreased to 2 X 10⁵ per unit volume, which is about 90 percent lower than the number of sub‐micron particles in the polymer treated samples.
The results described above are consistent with the clear supernatant observed in the nanoadditive added samples. This indicated that the nanoadditives were significantly more effective in removing the nanoscale suspended particles that are not typically removed by conventional polymer‐only treatment. Previous studies performed by Dr. Mathew Higgins suggested that most of these sub‐micron particles are likely to have high protein content (26). As discussed in Section 1.1, these protein molecules are the precursors for odor production in sludge. Based on these results, it can be hypothesized that the smaller nanoadditives can adsorb (bind) the protein molecules in the sludge, and will then reduce their availability for biodegradation and odor production.
Figure 3: Submicron Particles in Dewatered Anaerobic Sludge Treated with Nanoscale Additives (4% NM-6)
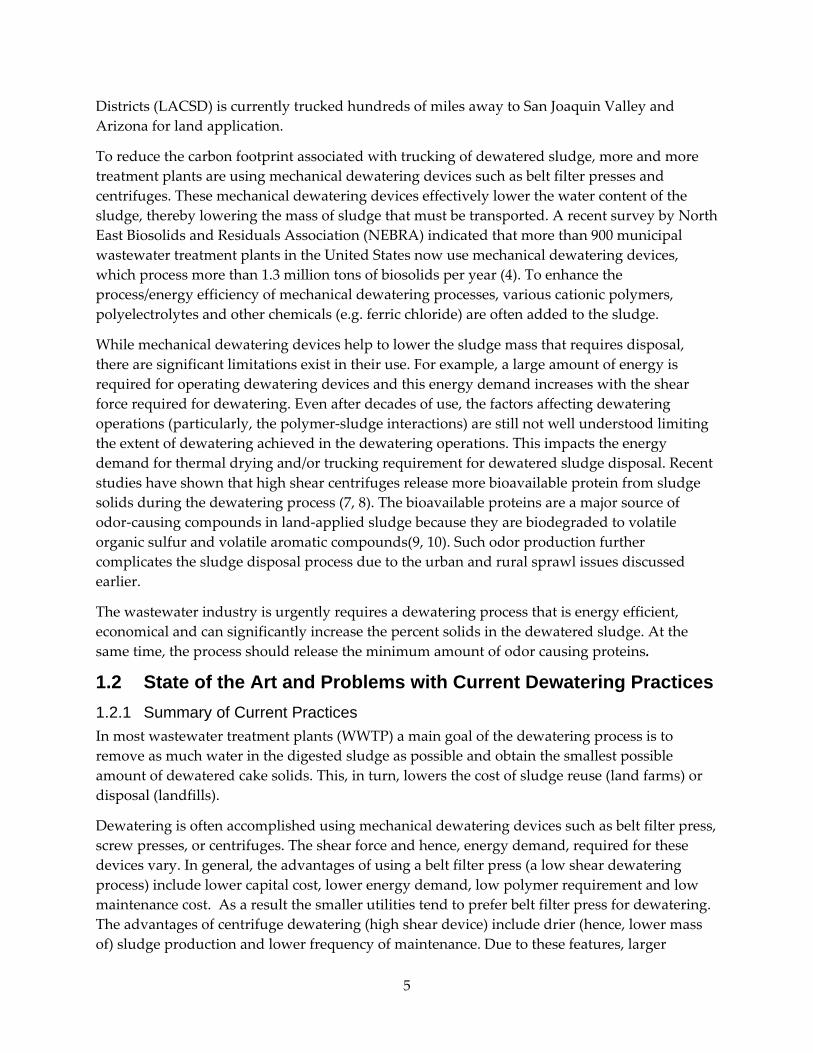
2.2.5 Polymer Dose Reduction Using Nanoscale Additives Optimum polymer dose required for dewatering is defined as the dose that yields the lowest capillary suction time (CST), a measure of filtration time of the polymer treated sludge. Figure 4 shows the capillary suction time data during dewatering of anaerobically digested sludge from the Selinsgrove, Pennsylvania wastewater treatment plant. One of the nanoscale additives (at 4 percent dose) was first mixed with the sludge for 30 seconds at 200 rotations per minute (rpm), and then the polymer was added and mixed for 30 seconds at 200 rpm and 90 seconds at 45rpm.
0.E+00
1.E+06
2.E+06
3.E+06
4.E+06
5.E+06
6.E+06
Untreated SludgeFltrate
Polymer-only TreatedFiltrate
Polymer + NanoAdditive
Nan
osca
le P
artic
le C
ount
(<0.
45 u
m)
12
Figure 4: Capillary Suction Time of Sludge Dewatered with and without Nanoscale Additives (4% NM-6)
The data indicated that the optimum polymer dose decreased from 16 pounds (lb) of active polymer/Dry ton of sludge in polymer‐only treated samples to about 11 lb active polymer/Dry ton of sludge in the presence of 4 percent nanoscale additives (Figure 4). Further, even at the lower than optimum polymer doses, the CST of nanoscale additive added samples were significantly lower than the polymer‐only samples.
0
150
300
450
600
5.0 10.0 15.0 20.0 25.0
Polymer Dose (lb/Dry Ton)
CST
(Sec
)Polymer only
Polymer + Nanoadditive (NM-6 @ 4%)
OPD OPD

13
CHAPTER 3: Project Approach 3.1 Overall Study Approach Figure 3‐1 illustrates the overall approach used in this study to demonstrate the role of nanoscale additives in improving energy efficiency of polymer‐aided dewatering. First, screening tests were performed to evaluate the performance of twelve nanoadditives on LACSD sludge. Eight of the twelve nanoadditives were then selected for subsequent bench scale studies. The bench scale studies evaluated the interactions of nanoadditives and polymers used in LACSD, for dewatering on various performance parameters. These include polymer demand, dewatered cake mass, biosolids odor and supernatant quality. Simultaneously, dewatering studies were also performed using nanoadditives on sludge from WWTPs other than LACSD. Finally, one nanoadditive that provided significant benefit was selected for a field demonstration at LACSD WWTP at Carson, California. Energy use and conservation during the field demonstration was measured by Southern California Edison. Finally, data from the field demonstration was used to estimate statewide energy as well as overall treatment cost benefits due to implementation of the proposed technology.

14
Figure 5: Approach Used to Study the Interactions of Nanomaterials with Polymer and Sludge Constituents during Dewatering and Odor Control
3.1.1 Screening Tests Screening tests were performed to obtain preliminary interactions of nanoadditives with sludge constituents. Sludge from LACSD was used in conjunction with twelve nanoadditives of different configuration and composition. Nanoadditives were added to 20 milliliters (ml) of sludge samples and allowed to settle over several hours. Supernatant and settled sludge characteristics were visually inspected over several hours to evaluate the performance.
15
3.1.2 Bench Scale Studies Based on observation from screening studies, eight nanoscale additives were selected for detailed bench scale evaluations. Nanoadditives and polymer were added to LACSD and other WWTP sludge, and mixed at different speed and duration to impart different shear force for dewatering. First, bench scale studies were performed using LACSD sludge (Task 3). In addition, bench scale studies were performed using sludge from six other treatment plants (Task 4). This Task (Task 4) was funded by Water Environment Research Foundation (WERF) to study the benefits of nanoadditives on improving dewatering and controlling biosolids odor. Six of the nanoadditives used in Task 3 are the same used in Task 4. The combined results from Tasks 3 and 4 were used in the selection of nanoadditive for field demonstration at LACSD. Results from Task 4 (WERF study) are included in Appendix A of this report.
3.1.3 Field Demonstration at LACSD Wastewater Treatment Plant at Carson, California Field demonstration was performed at LACSD wastewater facility at Carson, California using one nanoadditive selected from bench scale studies. An Alfa Laval pilot demonstration unit (ALSYS 45) was operated at a sludge flow rate of 50 gallons per minute (gpm) for this demonstration. Various operating parameters (e.g. bowl shear, polymer dose, nanoadditive dose, mixing time) were varied to demonstrate the effect of nanoadditive for dewatering to obtain data for the energy and economic analyses conducted in this study.
3.1.4 Methods Verification During field demonstrations, Southern California Edison verified energy use at various operating conditions. Electricity use for pilot operations was recorded automatically at five‐minute intervals. Simultaneously, other operating parameters such as polymer dose, nanoadditive dose, bowl shear and sludge flow rate were recorded by Alfa Laval staff, LACSD staff and Kennedy/Jenks Consultants staff.
3.1.5 Economic Evaluation The data from field studies were used in conjunction with other relevant information to develop economic benefits estimates for the proposed technology. First, the United States Environmental Protection Agency’s (USEPA) Clean Water Needs Survey (CWNS) data was used to evaluate the type and number of dewatering units in California WWTPs. The dewatering units were then grouped into various categories based on size (i.e. flow rate) and shear (e.g. high/low shear centrifuge, belt filter press). Then, overall sludge treatment cost for the categories were prepared using field test data for conventional polymer‐only treatment and for nanoadditive‐added scenarios. Note that the treatment cost estimations not only evaluated electricity use, but also estimated polymer dose and cost, dewatered cake disposal cost and other operational parameters. It was assumed that the proposed nanoadditive treatment was a viable option when proven that the overall treatment cost (not just the electricity cost), was more economical than polymer‐only treatments. Finally, the electricity conservation estimates and overall treatment costs were estimated for each scenario and the number and type of dewatering units estimated from the USEPA CWNS database.

16
CHAPTER 4: Initial Screening Studies 4.1 Objective Under this Task, screening was performed to facilitate selection of nanoadditives for detailed bench‐scale studies. Twelve nanoadditives of different composition and configurations were synthesized for testing under this Task.
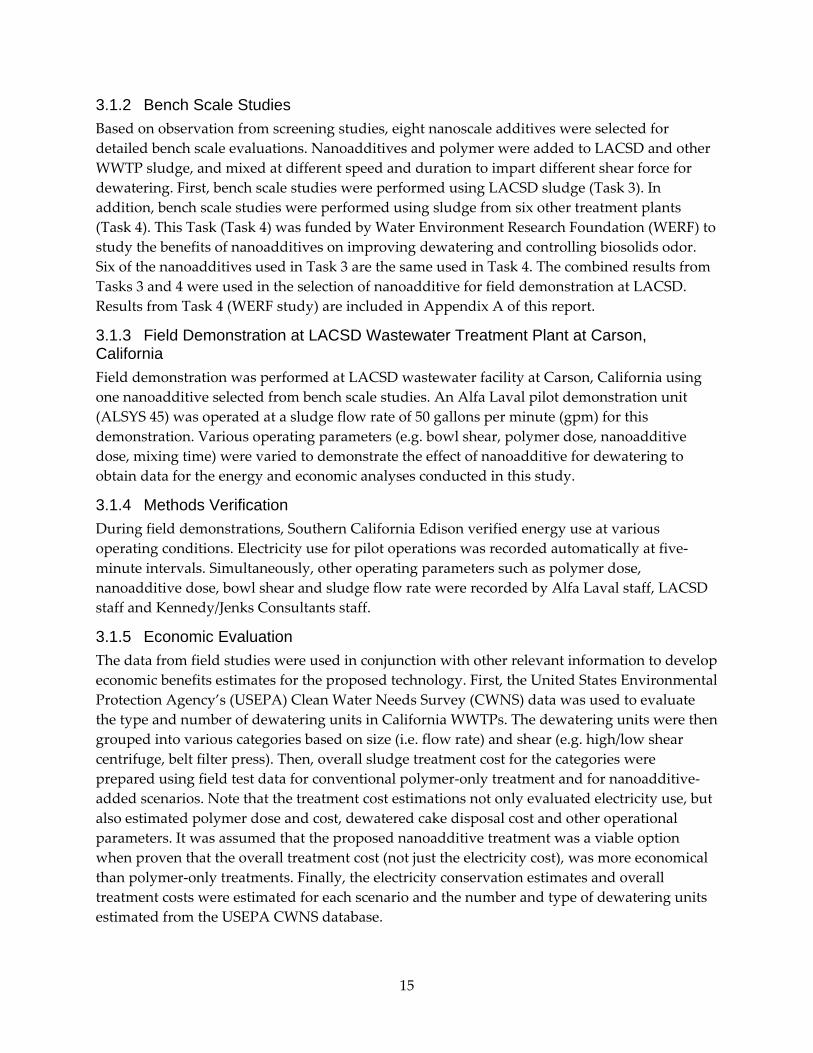
4.2 Methodology for Screening Tests In these screening tests, 20 ml vials containing 10 grams (g) of sludge were spiked with various nanoscale additives. Table 2 presents the list of nanoadditives used in this test. The amounts of nanoparticles added were calculated so that they were approximately 4 percent of the solid sludge, assuming a 4 percent solid content of the sludge. The vials were vibrated using the vortexer for a few seconds and were allowed to settle. The sludge settling characteristics, supernatant and solids quality were visually observed and through images taken at different time intervals.
Table 2: List of Nanomaterials Used in the Screening Studies
Sample No. Nanomaterial 0 Control (No Nanoadditive) 1 NM-1 2 NM-4 3 NM-5 4 NM-6 5 NM-7 6 NM-8 7 NM-11 8 NM-13 9 NM-14
10 NM-15 11 NM-16 12 NM-17

17
Figure 6: Sludge Samples after Addition of Nanoadditives (Serial #s 1-10)
0 hours 11 minutes
31 minutes 1 hours
2 hours 4 hours
18
Figure 6 shows the sludge samples after the addition and equilibration with nanoadditives (Serial # 1 to 10). In general, the NM‐4 and NM‐7 nanoadditives produced a clear supernatant over time (although the attached picture quality is not high, this observation was clear during visual inspection). These samples also produced denser settled sludge.
Figure 7 shows the sludge sample characteristics after the addition and equilibration with nanoadditives (Serial # 8, 11 and 12; NM‐13, NM‐16 and NM‐17). The nanoadditives spiked samples produced a clearer supernatants compared to the control sample supernatant during the first six hours. However, after 24 hours no significant differences were observed in the supernatant clarity among the control and the nanoadditive spiked supernatants. Also, in the absence of polymers, the additives did not produce significantly better solids compared to the solids produced in the control sample.
5 hours 6 hours 45 minutes
20 hours 24 hours

19
Figure 7: Sludge Samples after Addition of Nanoadditives (NM-13, NM-16 and NM-17)
0 hours 21 minutes
30 minutes 1 hours
2 hours 30 minutes 4 hours
5 hours 30 minutes 6 hours

20
4.3 Summary The screening tests, overall, produced inconclusive results. Nanoadditives NM 4, 7, 13, 16 and 17 appear to produce a clear supernatant and/or better quality solids in the screening tests. A major drawback in the screening test procedure is the inability to predetermine the polymer dose requirement and produce the right amount of shear force for the sludge to interact with the additives. Hence, it was decided to use eight of the twelve nanoadditives that showed some improvements in the supernatant or in the sludge characteristics for the bench scale studies. These nanoadditives include NM 5, 6, 7, 13, 14, 15, 16 and 17) for detailed dewatering studies under Task 4 of this study.
6 hours 30 minutes 22 hours

21
CHAPTER 5: Bench Scale Dewatering Studies Using Nanoadditives and LACSD Sludge 5.1 Objective The objective of this Task is to perform bench‐scale studies using LACSD sludge and nanoadditives selected from Task 3. The goal of this task is to select nanoadditives most suited for dewatering sludge from LACSD and develop operating conditions to be used during the field study at LACSD Carson plant. As indicated in Section 4, eight nanoadditives (NM‐5, ‐6, ‐7, ‐13, ‐14, ‐15, ‐16, and ‐17), were used in bench‐scale studies. Anaerobically digested sludge samples from LACSD were used. Various tests performed to evaluate dewatering efficiency include estimation of CST, optimum polymer dose, percent solids in the dewatered cake, filtrate absorbance, and turbidity. The effectiveness of the nanoadditives to control odor production from biosolids was evaluated by monitoring the release of methyl mercaptans and dimethyl sulfide (Total Volatile Organic Sulfur compounds [TVOSC]) from the dewatered cake.
5.2 Experimental Plan and Approach 5.2.1 Bench Scale Dewatering Studies As the overall objective of this study was to improve energy efficiency during sludge dewatering, the nanoadditives were tested for their dewatering efficiency at a lower shear force. The details of various tests are described below.
Standard dewatering tests that have been used in previous WERF‐funded research on sludge dewatering and odors were used in this research project (26, 27). The step‐by‐step procedure for conditioning and dewatering is provided below.
Conditioning with Chemical Addition: The first step in the dewatering process is conditioning the sludge with chemical (i.e. nanoadditives and polymers). During conditioning, the nanoparticles were added before the addition of cationic polymer. The polymer currently used by LACSD for sludge dewatering was used throughout this study. Known volume (500 ml in most studies) of solids was placed in a baffled reactor, and polymer was added to the solution. The sludge was mixed at a predefined mixing intensity and time to achieve a given energy input or shear. Two mixing regimes were used, a “low” shear and a “high” shear as explained below.
For the “low” shear experiments, the chemical was added and mixed for 30 seconds at 200 rpm at which time the polymer was added to the solution and mixed for another 30 seconds at 200 rpm then 50 rpm for 90 seconds. The mixing was done with a Lightnin’ Lab Mixer and an integrated torque meter. Shear was derived from the mixing torque converted to mean velocity gradient (G), and the time (t) that mixing shear was imparted, to calculate Gt, the shear parameter.

22
The mixing regimes for each scenario are shown in Figures 8 and 9. For low shear conditions the Gt value for the mixing regime was approximately 30,000.
Figure 8: Mixing Protocol for Chemical Addition for Low Shear Experiments
Figure 9: Mixing Protocol for Chemical Addition for High Shear Experiments
For the “high” shear mixing test, nanoparticles were added at the beginning of the mixing process with a mixing speed of 564 rpm which is equivalent to a G of 1000/s. After several seconds the polymer was added, and the sample was mixed for 100 s. This provides a total Gt of 100,000.
Dewatering for Odor Testing: The sludge conditioned with the optimum polymer dose was placed in 250 ml centrifuge bottles and dewatered using a laboratory centrifuge (3000 g, for 10 minutes). After centrifuging, the supernatant was removed (this centrate was analyzed for different constituents as well). Typically, about 200‐300 g of wet cake was generated from multiple tubes, with solids contents around 25 percent.
5.2.2 Capillary Suction Time As indicated in the previous section, detailed dewatering studies were performed using an optimum polymer dose that yielded the most effective dewatering. Prior to that, screening tests were performed using various doses of polymer, and CST of the conditioned sludge was used as the indicator to select optimum polymer dose. The capillary suction time is a measure to evaluate the rate of sludge dewatering. During this test a pre‐determined volume of the polymer added and conditioned sludge was added to the funnel of a CST apparatus which, in turn, was placed on a filter paper. The rate at which the free water from the conditioned sludge permeates through the filter paper varies depending on the condition of the sludge and the

23
filterability of the cake formed on the filter paper. The CST is the time required for the filtered water front to pass between two electrodes placed at a standard interval from the funnel. A Triton‐Type 165 CST apparatus and Whatman # 17 Chromatography paper was used in the CST test according to Method 2710G of Standard Methods (28).
5.2.3 Optimum Polymer Dose The optimum polymer dose (OPD) is defined as the polymer dose that produced minimum CST under identical mixing conditions (29). The OPD of conventional “polymer‐only” dewatering was compared with that of “polymer+nanoadditive” treatment to evaluate the efficiency of the nanoadditives to lower the (optimum) polymer dose requirements for dewatering LACSD sludge.
5.2.4 Dewatered Cake Solids Analyses Cake solids collected from the filtration tests were placed on a pre‐weighed aluminum pan, and immediately weighed to reduce the moisture loss. Samples were then dried at 105 degree Celsius for 2 hours, desiccated and weighed again. The difference in the mass between the two measurements yielded the moisture content (and hence, the percentage of solids) of the dewatered sludge cake.
In addition to measuring percent solids in the cake, tests were also performed to determine the net mass of the dewatered cake during dewatering. In these tests, a known volume of digested sludge was added with various amounts of polymer (and nanoadditives) and dewatered using the protocol described above. Then the total mass of the dewatered sludge was collected and weighed to estimate the efficiency of sludge dewatering.
5.2.5 Filtrate Analyses The filtrate quality from various dewatering studies was determined by turbidity, absorbance and COD analyses. Turbidity of the centrate samples were analyzed using a Hach turbidimeter. COD was measured using the USEPA approved Hach Method with digestion tubes. Total suspended solids (TSS) and volatile suspended solids (VSS), were analyzed using Method 2540D and 2540E, respectively, in Standard Methods (2004).
5.2.6 Odor Production This experiment was performed to determine the effect of nanomaterial dosage on controlling odor production dewatered cake. Methods developed as part of previous WERF funded projects were used for evaluation of odor production (27). The samples for the odor tests were prepared by dewatering the sludge using OPD. Then the nanoadditives were added to the cake at the prescribe dosage and mixed for 40 s in a standard bench mixer as described by North et al., (2008) (30) to assure complete mixing. A control sample was also mixed for 40 s without chemical addition to eliminate the mixing variable. The samples (10 g) were then placed in the serum bottles at 25 °C and headspace gases were analyzed over time (~ 15 days) for various odor causing constituents. The headspace odor causing chemicals analyzed included methyl mercaptan, dimethyl sulfide and methanethiol. Furthermore, methane production was also measured to monitor potential inhibition to methanogenic bacteria by the nanoadditives. Odor‐
24
causing organic sulfur compounds were analyzed by the gas chromatography (GC) and flame ionization detector (FID) method.
5.3 Approach/Nanomaterial Selection Criteria for Field Demonstration The criteria used in this study to select nanomaterials for field demonstration (Task 6) are based on their potential to improve energy efficiency of dewatering and to reduce the overall cost of sludge treatment and disposal. For example, energy efficiency by the proposed approach can occur due to lowering the shear force required for dewatering (e.g. medium shear centrifuging instead of high shear), and by a reduction in organic loading in the return centrate, which, in turn, can lower the aeration energy required for their degradation. The overall economics of sludge dewatering depends on the cost of electricity, polymers (and nanoadditives), sludge hauling and tipping cost, odor control cost, etc.
Figure 10: Effect of Nanoadditive (NM-6) on Lowering Dewatering Shear Requirements
In general, the major cost component involved with sludge treatment is the hauling and disposal of dewatered cake. Some studies estimate that the hauling cost of dewatered cake can be as high as 70 to 80 percent (5). During conventional “polymer‐only” dewatering, a reduction in shear force, while lowering the energy use, will often increase the mass of dewatered cake generated. Lowering electricity use through improved dewatering performance with nanoadditives should ensure the same or lower total mass of the dewatered cake. Figure 10 illustrates this concept using one of the nanoadditives selected for Task 4 (NM‐6) for dewatering a sludge from a treatment plant in the Northeastern United States.
A test sludge from a municipal wastewater treatment plant was dewatered using NM‐6 nanoadditives mixed at a low shear rate. Control tests (polymer‐only) were performed using high and lower shear rates. The intent of this test was to verify if the use of nanoadditive can
0.0%
2.0%
4.0%
6.0%
8.0%
10.0%
12.0%
14.0%
Polymer-only - High Shear Polymer-only - Low Shear Polymer + 4% Nanoadditive- Low Shear'
% S
olid
s
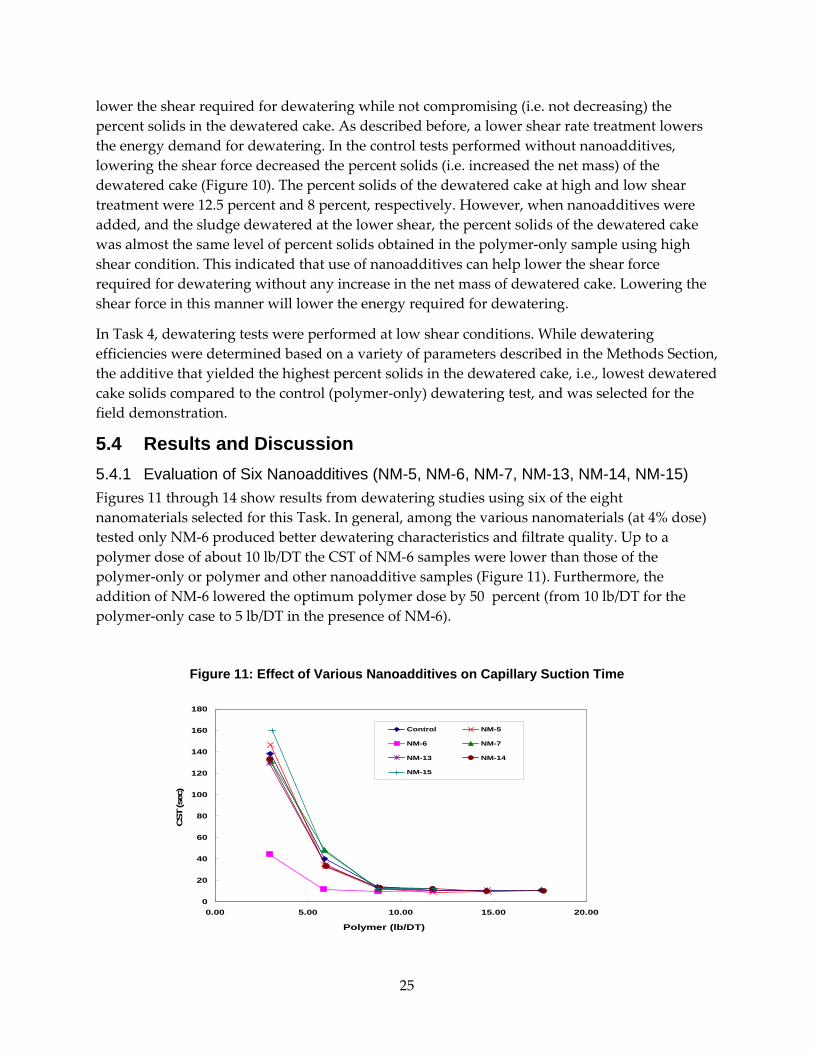
25
lower the shear required for dewatering while not compromising (i.e. not decreasing) the percent solids in the dewatered cake. As described before, a lower shear rate treatment lowers the energy demand for dewatering. In the control tests performed without nanoadditives, lowering the shear force decreased the percent solids (i.e. increased the net mass) of the dewatered cake (Figure 10). The percent solids of the dewatered cake at high and low shear treatment were 12.5 percent and 8 percent, respectively. However, when nanoadditives were added, and the sludge dewatered at the lower shear, the percent solids of the dewatered cake was almost the same level of percent solids obtained in the polymer‐only sample using high shear condition. This indicated that use of nanoadditives can help lower the shear force required for dewatering without any increase in the net mass of dewatered cake. Lowering the shear force in this manner will lower the energy required for dewatering.
In Task 4, dewatering tests were performed at low shear conditions. While dewatering efficiencies were determined based on a variety of parameters described in the Methods Section, the additive that yielded the highest percent solids in the dewatered cake, i.e., lowest dewatered cake solids compared to the control (polymer‐only) dewatering test, and was selected for the field demonstration.
5.4 Results and Discussion 5.4.1 Evaluation of Six Nanoadditives (NM-5, NM-6, NM-7, NM-13, NM-14, NM-15) Figures 11 through 14 show results from dewatering studies using six of the eight nanomaterials selected for this Task. In general, among the various nanomaterials (at 4% dose) tested only NM‐6 produced better dewatering characteristics and filtrate quality. Up to a polymer dose of about 10 lb/DT the CST of NM‐6 samples were lower than those of the polymer‐only or polymer and other nanoadditive samples (Figure 11). Furthermore, the addition of NM‐6 lowered the optimum polymer dose by 50 percent (from 10 lb/DT for the polymer‐only case to 5 lb/DT in the presence of NM‐6).
Figure 11: Effect of Various Nanoadditives on Capillary Suction Time
0
20
40
60
80
100
120
140
160
180
0.00 5.00 10.00 15.00 20.00
Polymer (lb/DT)
CST
(sec
)
Control NM-5
NM-6 NM-7
NM-13 NM-14
NM-15
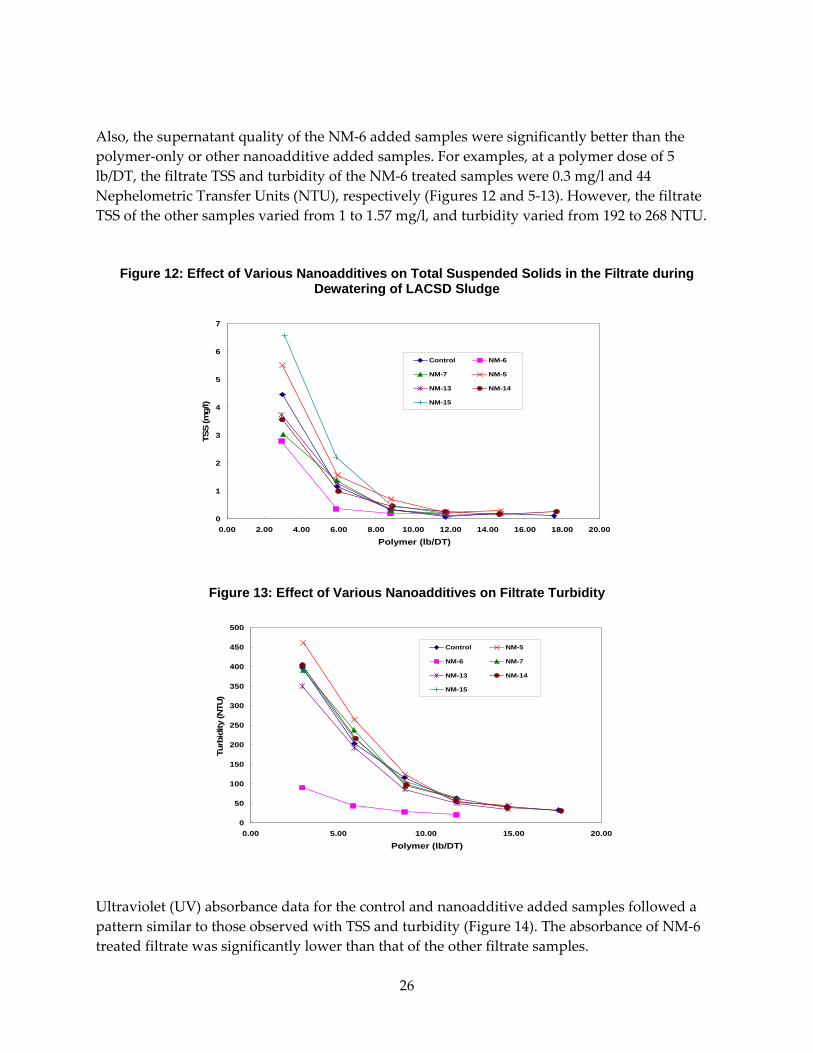
26
Also, the supernatant quality of the NM‐6 added samples were significantly better than the polymer‐only or other nanoadditive added samples. For examples, at a polymer dose of 5 lb/DT, the filtrate TSS and turbidity of the NM‐6 treated samples were 0.3 mg/l and 44 Nephelometric Transfer Units (NTU), respectively (Figures 12 and 5‐13). However, the filtrate TSS of the other samples varied from 1 to 1.57 mg/l, and turbidity varied from 192 to 268 NTU.
Figure 12: Effect of Various Nanoadditives on Total Suspended Solids in the Filtrate during Dewatering of LACSD Sludge
Figure 13: Effect of Various Nanoadditives on Filtrate Turbidity
Ultraviolet (UV) absorbance data for the control and nanoadditive added samples followed a pattern similar to those observed with TSS and turbidity (Figure 14). The absorbance of NM‐6 treated filtrate was significantly lower than that of the other filtrate samples.
0
1
2
3
4
5
6
7
0.00 2.00 4.00 6.00 8.00 10.00 12.00 14.00 16.00 18.00 20.00
Polymer (lb/DT)
TSS
(mg/
l)
Control NM-6
NM-7 NM-5
NM-13 NM-14
NM-15
0
50
100
150
200
250
300
350
400
450
500
0.00 5.00 10.00 15.00 20.00
Polymer (lb/DT)
Turb
idity
(NTU
)
Control NM-5
NM-6 NM-7
NM-13 NM-14
NM-15

27
Figure 14: Effect of Various Nanoadditives on Filtrate UV-Visible Absorbance
Although NM‐6 improved the dewatering rate and filtrate quality, it did not lower the dewatered cake mass significantly compared to the conventional polymer‐only treatment (Figure 15). No consistent differences were observed between the “polymer‐only” and “polymer+nanoadditive” treated sludge in the percent solids data. Both the control and polymer treated samples contained percent solids of approximately 21 to 26 percent at various polymer doses. This suggested that, the use of NM‐6 may not lower the net mass of dewatered cake and hence, will not lower the cost of hauling and disposing the sludge. While the use of NM‐6 may lower the energy use (by lowering the shear requirement) it may not significantly lower the cost of overall sludge treatment.
Figure 15: Effect of Various Nanoadditives on Percent Solids in the Dewatered Cake
0
0.05
0.1
0.15
0.2
0.25
0.3
0.35
0.4
0.45
0.00 2.00 4.00 6.00 8.00 10.00 12.00 14.00 16.00 18.00 20.00Polymer (lb/DT)
Abs
orba
nce
Control NM-5
NM-6 NM-7
NM-13 NM-14
NM-15
10
15
20
25
30
35
2.00 4.00 6.00 8.00 10.00 12.00 14.00 16.00 18.00 20.00Polymer (lb/DT)
%So
lids
Control NM-5
NM-6 NM-7
NM-13 NM-14
NM-15

28
5.4.2 Evaluation of Nanoadditives NM-13, NM-14 and NM-15 Dosing on Dewatering Efficiency Subsequently, dewatering studies were performed using nanoadditives (NM‐13, NM‐14 & NM‐15) by varying the additive doses to 0.5, one and two percent of dry sludge solids mass. The CST data indicated no significant differences between the control (polymer‐only) treatment and those using any of the three nanoadditives (Figures 16 to 18). Also, no significant improvements were observed with the solids content of the dewatered cake due to nanoadditive addition.
Figure 16: Effect of NM-13 on CST during Dewatering of LACSD Sludge
Figure 17: Effect of NM-14 on CST during Dewatering of LACSD Sludge
0.0
10.0
20.0
30.0
40.0
50.0
60.0
70.0
80.0
0.00 2.00 4.00 6.00 8.00 10.00 12.00
Polymer (lb/DT)
CST
(sec
)
Control
NM-13 @ 0.5% Dosage
NM-13 @ 1% Dosage
NM-13 @ 2% Dosage
0.0
10.0
20.0
30.0
40.0
50.0
60.0
70.0
80.0
0.00 2.00 4.00 6.00 8.00 10.00 12.00
Polymer (lb/DT)
CST
(sec
)
Control
NM-14 @ 0.5% Dosage
NM-14 @ 1% Dosage
NM-14 @ 2% Dosage
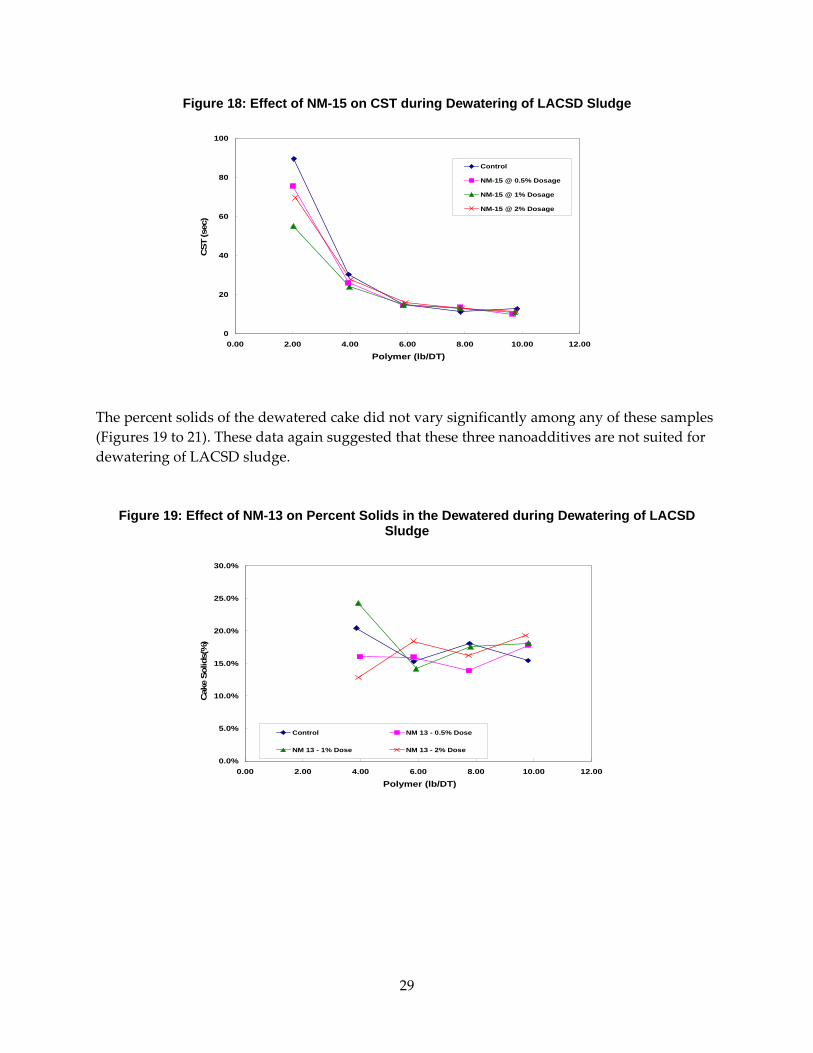
29
Figure 18: Effect of NM-15 on CST during Dewatering of LACSD Sludge
The percent solids of the dewatered cake did not vary significantly among any of these samples (Figures 19 to 21). These data again suggested that these three nanoadditives are not suited for dewatering of LACSD sludge.
Figure 19: Effect of NM-13 on Percent Solids in the Dewatered during Dewatering of LACSD Sludge
0
20
40
60
80
100
0.00 2.00 4.00 6.00 8.00 10.00 12.00
Polymer (lb/DT)
CST
(sec
)
Control
NM-15 @ 0.5% Dosage
NM-15 @ 1% Dosage
NM-15 @ 2% Dosage
0.0%
5.0%
10.0%
15.0%
20.0%
25.0%
30.0%
0.00 2.00 4.00 6.00 8.00 10.00 12.00
Polymer (lb/DT)
Cak
e So
lids(
%)
Control NM 13 - 0.5% Dose
NM 13 - 1% Dose NM 13 - 2% Dose
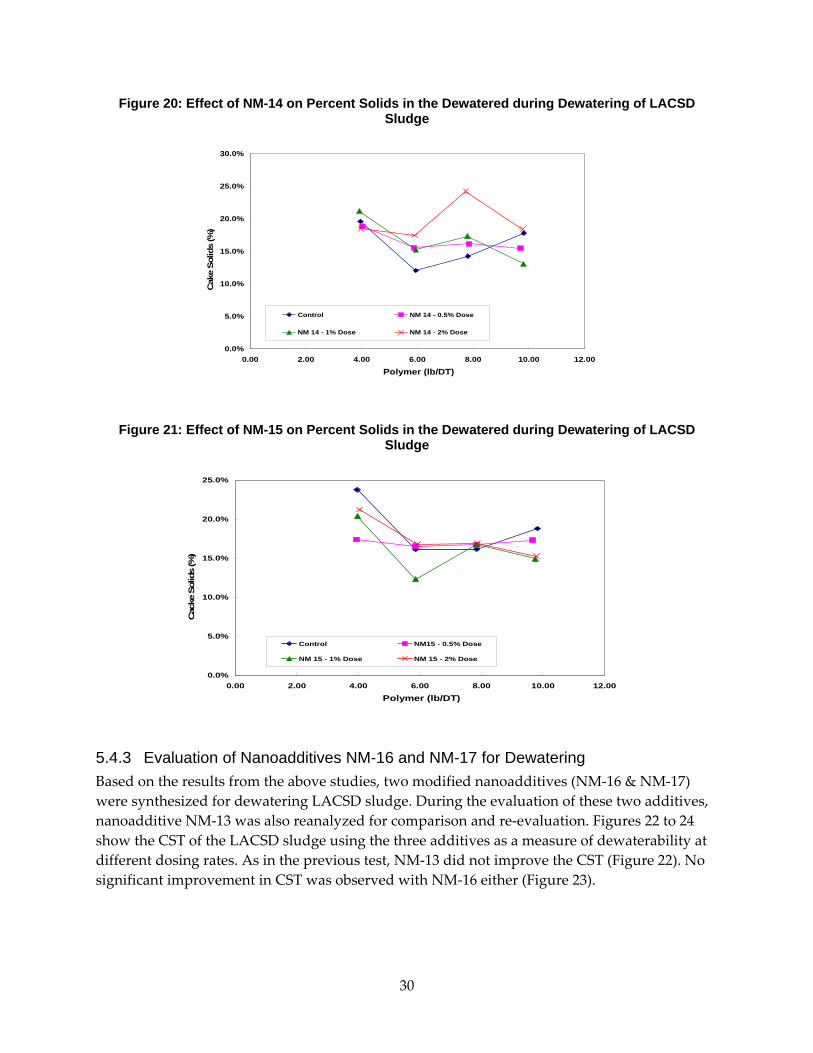
30
Figure 20: Effect of NM-14 on Percent Solids in the Dewatered during Dewatering of LACSD Sludge
Figure 21: Effect of NM-15 on Percent Solids in the Dewatered during Dewatering of LACSD Sludge
5.4.3 Evaluation of Nanoadditives NM-16 and NM-17 for Dewatering Based on the results from the above studies, two modified nanoadditives (NM‐16 & NM‐17) were synthesized for dewatering LACSD sludge. During the evaluation of these two additives, nanoadditive NM‐13 was also reanalyzed for comparison and re‐evaluation. Figures 22 to 24 show the CST of the LACSD sludge using the three additives as a measure of dewaterability at different dosing rates. As in the previous test, NM‐13 did not improve the CST (Figure 22). No significant improvement in CST was observed with NM‐16 either (Figure 23).
0.0%
5.0%
10.0%
15.0%
20.0%
25.0%
30.0%
0.00 2.00 4.00 6.00 8.00 10.00 12.00
Polymer (lb/DT)
Cak
e So
lids
(%)
Control NM 14 - 0.5% Dose
NM 14 - 1% Dose NM 14 - 2% Dose
0.0%
5.0%
10.0%
15.0%
20.0%
25.0%
0.00 2.00 4.00 6.00 8.00 10.00 12.00
Polymer (lb/DT)
Cac
ke S
olid
s (%
)
Control NM15 - 0.5% Dose
NM 15 - 1% Dose NM 15 - 2% Dose

31
Figure 22: Effect of NM-13 Addition on CST during Dewatering of LACSD Sludge
However, some improvements in CST were observed with NM‐17 at 0.8 and 1.6 percent dosing rate (Figure 24). The optimum polymer dose (i.e. point of inflection for CST) for NM‐17 at these dosing rates occurred at a polymer dosing rate of 18 lb/DT. With the polymer‐only and at a NM‐17 dose of 0.4 percent, the OPD for dewatering was approximately 22.5 lb/DT.
Figure 23: Effect of NM-16 on CST during Dewatering of LACSD Sludge
0
10
20
30
40
50
60
70
0.00 5.00 10.00 15.00 20.00 25.00 30.00 35.00
Polymer (lb/DT)
CST
(Sec
)
Control
NM-13 0.41% Dosage
NM-13 0.8% Dosage
NM-13 1.58% Dosage
0.0
5.0
10.0
15.0
20.0
25.0
30.0
35.0
40.0
0.0 5.0 10.0 15.0 20.0 25.0 30.0 35.0
Polymer (lb/DT)
CST
(sec
)
Control
NM-16 0.41% Dosage
NM-16 0.8% Dosage
NM-16 1.58% Dosage

32
Figure 24: Effect of NM-17 on CST during Dewatering of LACSD Sludge
Figures 25 through 27 show the filtrate quality during these tests. It appeared that all the three nanoadditives improved the filtrate quality as indicated by the reduction in absorbance compared to the polymer‐only treatment. NM‐13 and NM‐16 lowered the absorbance by approximately 10 to 25 percent at various nanoadditive doses. The improvement in filtrate quality was more pronounced (20 to 50 percent decrease in absorbance) using NM‐17.
Figure 25: Effect of NM-13 Addition on Filtrate Absorbance during Dewatering of LACSD Sludge
0
5
10
15
20
25
30
35
40
0.0 5.0 10.0 15.0 20.0 25.0 30.0 35.0
CST (
sec)
Polymer (g)
Control
NM-17 - 0.41% Dosage
NM-17 - 0.80% Dosage
NM-17 - 1.58% Dosage
0.000
0.050
0.100
0.150
0.200
0.250
0.300
0.0 5.0 10.0 15.0 20.0 25.0 30.0 35.0
Polymer (lb/DT)
Abs
orba
nce
Control
NM-16 - 0.41% Dosage
NM-16 - 0.80% Dosage
NM-16 - 1.58% Dosage

33
Figure 26: Effect of NM-16 Addition on Filtrate Absorbance during Dewatering of LACSD Sludge
Figure 27: Effect of NM-17 Addition on Filtrate Absorbance during Dewatering of LACSD Sludge
The improvement in filtrate quality indicated that the nanoadditives removed organic and other suspended materials effectively, thereby potentially reducing the energy demand for treatment of return centrate.
Figures 28 to 30 show the percent solids in the dewatered cake using the three nanoadditives. Again, NM‐13 did not improve the solids content up to a polymer dose of 30 lb/DT. NM‐16 appear to improve the cake quality in some cases as indicated by the increase in percent solids. For example, at polymer doses of 22 to 27 lb/DT, the percent cake solids in NM‐16 added cakes were one to three percent higher than that of cake dewatered using polymer‐only treatment. The improvement in cake solids content was more pronounced using NM‐17. Compared to polymer‐only treatment, the percent solids using NM‐17 was approximately two to five percent higher at all polymer doses used. Since, the nanoadditives NM‐16 & NM‐17 appear to improve
0.000
0.050
0.100
0.150
0.200
0.250
0.300
0.0 5.0 10.0 15.0 20.0 25.0 30.0 35.0
Polymer (lb/DT)
Abs
orba
nce
Control
NM-16 - 0.41% Dosage
NM-16 - 0.80% Dosage
NM-16 - 1.58% Dosage
0.000
0.050
0.100
0.150
0.200
0.250
0.300
0.0 5.0 10.0 15.0 20.0 25.0 30.0 35.0Polymer (lb/DT)
Abs
orba
nce
Control
NM-17 - 0.41% Dosage
NM-17 - 0.80% Dosage
NM-17 - 1.58% Dosage
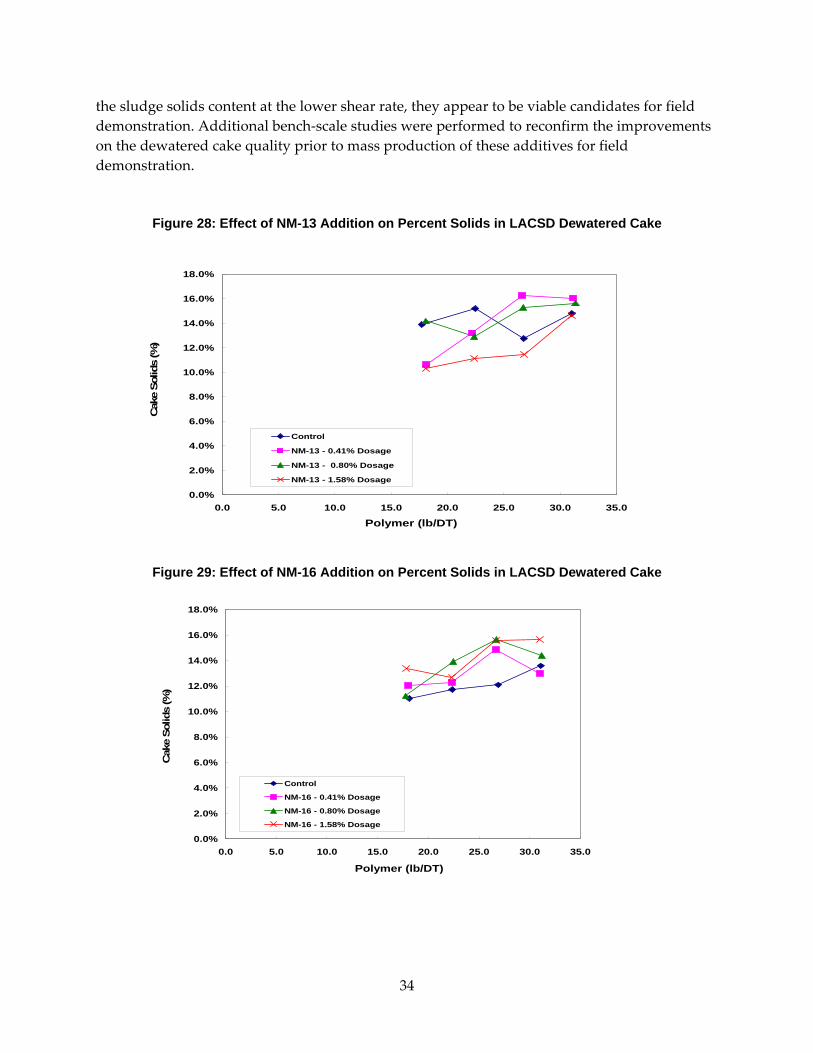
34
the sludge solids content at the lower shear rate, they appear to be viable candidates for field demonstration. Additional bench‐scale studies were performed to reconfirm the improvements on the dewatered cake quality prior to mass production of these additives for field demonstration.
Figure 28: Effect of NM-13 Addition on Percent Solids in LACSD Dewatered Cake
Figure 29: Effect of NM-16 Addition on Percent Solids in LACSD Dewatered Cake
0.0%
2.0%
4.0%
6.0%
8.0%
10.0%
12.0%
14.0%
16.0%
18.0%
0.0 5.0 10.0 15.0 20.0 25.0 30.0 35.0
Polymer (lb/DT)
Cak
e So
lids
(%)
Control
NM-13 - 0.41% Dosage
NM-13 - 0.80% Dosage
NM-13 - 1.58% Dosage
0.0%
2.0%
4.0%
6.0%
8.0%
10.0%
12.0%
14.0%
16.0%
18.0%
0.0 5.0 10.0 15.0 20.0 25.0 30.0 35.0
Polymer (lb/DT)
Cak
e So
lids
(%)
Control
NM-16 - 0.41% Dosage
NM-16 - 0.80% Dosage
NM-16 - 1.58% Dosage
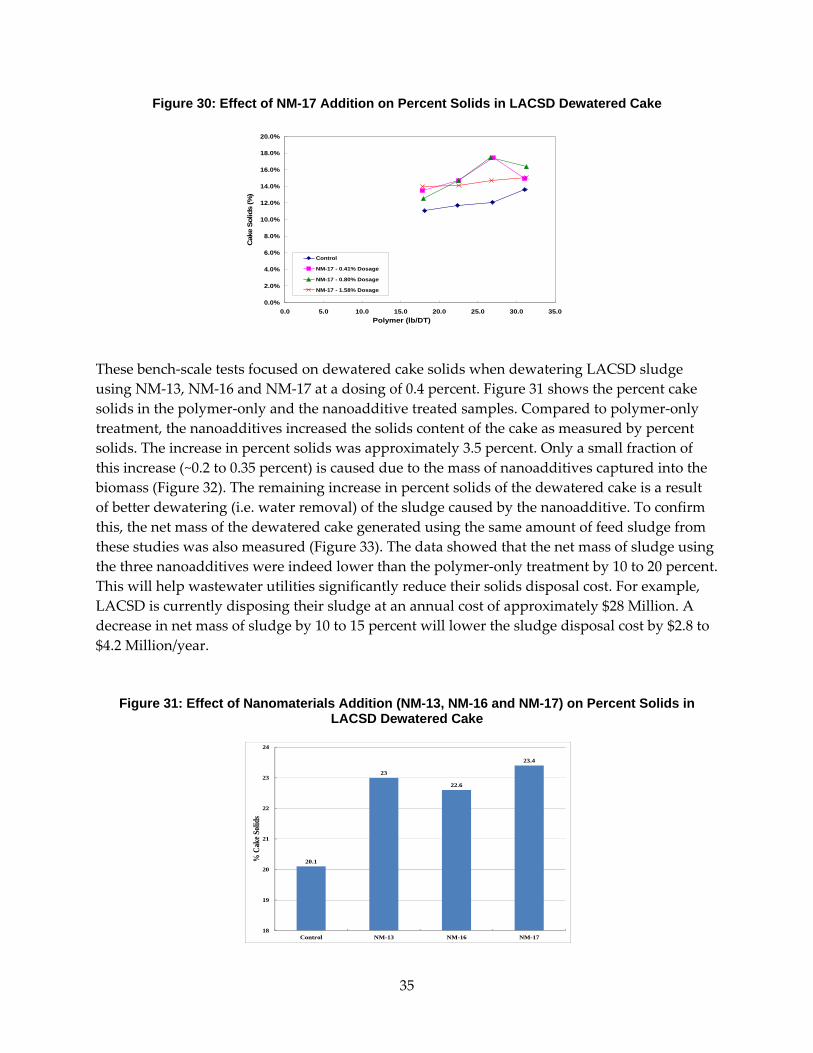
35
Figure 30: Effect of NM-17 Addition on Percent Solids in LACSD Dewatered Cake
These bench‐scale tests focused on dewatered cake solids when dewatering LACSD sludge using NM‐13, NM‐16 and NM‐17 at a dosing of 0.4 percent. Figure 31 shows the percent cake solids in the polymer‐only and the nanoadditive treated samples. Compared to polymer‐only treatment, the nanoadditives increased the solids content of the cake as measured by percent solids. The increase in percent solids was approximately 3.5 percent. Only a small fraction of this increase (~0.2 to 0.35 percent) is caused due to the mass of nanoadditives captured into the biomass (Figure 32). The remaining increase in percent solids of the dewatered cake is a result of better dewatering (i.e. water removal) of the sludge caused by the nanoadditive. To confirm this, the net mass of the dewatered cake generated using the same amount of feed sludge from these studies was also measured (Figure 33). The data showed that the net mass of sludge using the three nanoadditives were indeed lower than the polymer‐only treatment by 10 to 20 percent. This will help wastewater utilities significantly reduce their solids disposal cost. For example, LACSD is currently disposing their sludge at an annual cost of approximately $28 Million. A decrease in net mass of sludge by 10 to 15 percent will lower the sludge disposal cost by $2.8 to $4.2 Million/year.
Figure 31: Effect of Nanomaterials Addition (NM-13, NM-16 and NM-17) on Percent Solids in LACSD Dewatered Cake
0.0%
2.0%
4.0%
6.0%
8.0%
10.0%
12.0%
14.0%
16.0%
18.0%
20.0%
0.0 5.0 10.0 15.0 20.0 25.0 30.0 35.0Polymer (lb/DT)
Cak
e So
lids
(%)
Control
NM-17 - 0.41% Dosage
NM-17 - 0.80% Dosage
NM-17 - 1.58% Dosage
20.1
23
22.6
23.4
18
19
20
21
22
23
24
Control NM-13 NM-16 NM-17
% C
ake S
olid
s
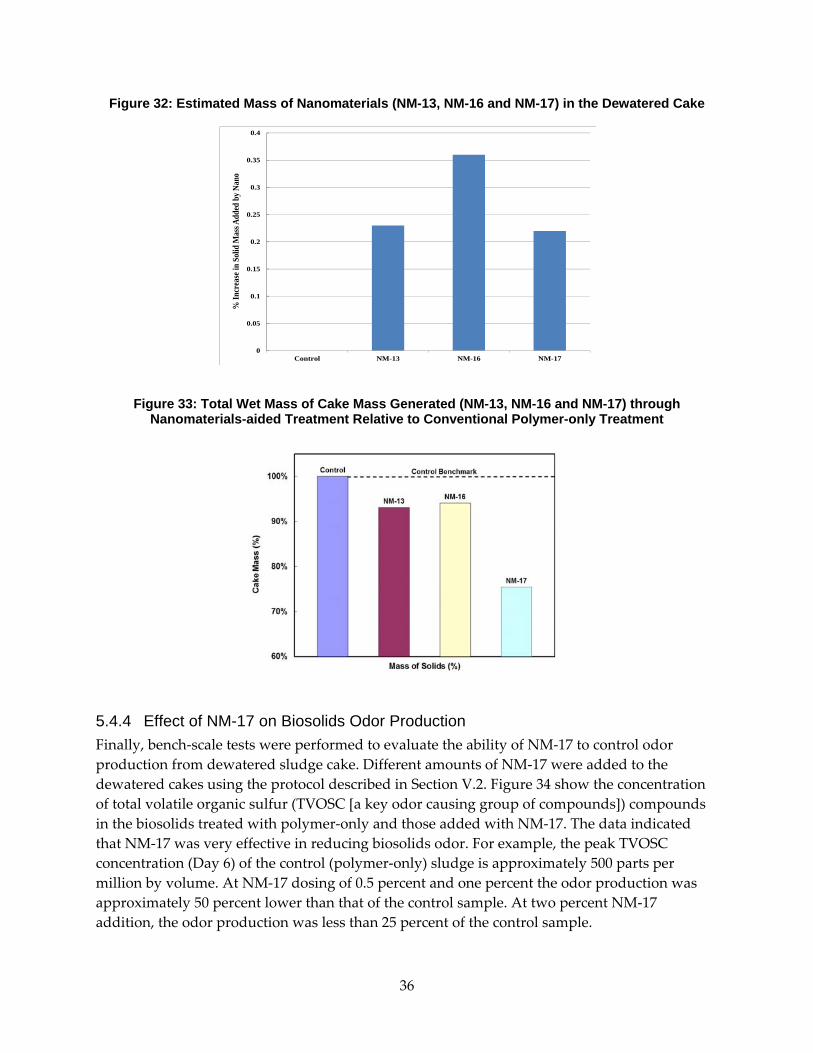
36
Figure 32: Estimated Mass of Nanomaterials (NM-13, NM-16 and NM-17) in the Dewatered Cake
Figure 33: Total Wet Mass of Cake Mass Generated (NM-13, NM-16 and NM-17) through Nanomaterials-aided Treatment Relative to Conventional Polymer-only Treatment
5.4.4 Effect of NM-17 on Biosolids Odor Production Finally, bench‐scale tests were performed to evaluate the ability of NM‐17 to control odor production from dewatered sludge cake. Different amounts of NM‐17 were added to the dewatered cakes using the protocol described in Section V.2. Figure 34 show the concentration of total volatile organic sulfur (TVOSC [a key odor causing group of compounds]) compounds in the biosolids treated with polymer‐only and those added with NM‐17. The data indicated that NM‐17 was very effective in reducing biosolids odor. For example, the peak TVOSC concentration (Day 6) of the control (polymer‐only) sludge is approximately 500 parts per million by volume. At NM‐17 dosing of 0.5 percent and one percent the odor production was approximately 50 percent lower than that of the control sample. At two percent NM‐17 addition, the odor production was less than 25 percent of the control sample.
0
0.05
0.1
0.15
0.2
0.25
0.3
0.35
0.4
Control NM-13 NM-16 NM-17
% In
crea
se in
Sol
id M
ass A
dded
by N
ano

37
Figure 34: Effect of NM-17 Addition in Control of Odor Causing Compound Production from Dewatered LACSD Sludge
It is essential that, while the nanoadditive helps to contain biosolids odor, it should not inhibit the growth of key microbial communities (e.g. methanogenic bacteria) that are responsible for stabilization of biosolids. In order to determine possible inhibitory effects, the levels of methane produced by methanogenic bacteria in the biosolids were also monitored. If the nanoadditive were inhibitory to methanogenic bacteria the amount of methane produced will be significantly lower than that of the control samples. Figure 35 shows the methane production in the control and NM‐17 added samples. The methane concentrations in the NM‐17 added samples were, in fact, higher than that produced in the control samples. This indicated that while NM‐17 is effective in controlling biosolids odor, it did not inhibit beneficial microbial community.
Figure 35: Effect of NM-17 Addition in Headspace Methane Production from Dewatered LACSD Sludge
0
100
200
300
400
500
600
0 2 4 6 8 10 12
Days
TVO
SC (p
pmv)
Control
0.5% NM-17
1% NM-17
2% NM-17
Total Volatile Organic Sulfur Production
0
20,000
40,000
60,000
80,000
100,000
120,000
140,000
160,000
180,000
200,000
0 2 4 6 8 10 12
Days
Met
hane
(ppm
v)
Control0.5% NM-171% NM-172% NM-17

38
5.5 Selection of Nanoadditive for Field Demonstration Since, NM‐17 consistently lowered the mass of dewatered LACSD sludge compared to the current polymer only treatment, and it was effective in controlling biosolids odor, NM‐17 was chosen as the nanomaterial of choice for the field demonstration.

39
CHAPTER 6: Field Demonstration of Sludge Dewatering 6.1 Demonstration Site Description and Field Test Set Up 6.1.1 Site Description Field demonstration of the proposed dewatering technology was performed at LACSD’s Carson wastewater treatment plant. This plant currently treats their wastewater by pure oxygen activated sludge processes. Sludge from a secondary treatment plant is digested in mesophilic anaerobic digesters at a sludge retention time of approximately 20 days. The digested sludge contains a solids content of about two percent. The sludge is then dewatered using a number of high shear centrifuges (including 4 Alfa Laval G2‐115 units (300 gpm capacity), one Alfa Laval DS‐1006 centrifuge (770 gpm), two Humbolt/Andritz 600 gpm centrifuge, one Flottweg centrifuge (400 gpm). In addition, approximately 25 Humbolt medium shear centrifuges (100 gpm) are also available to meet LACSD’s dewatering needs. Typical solids content of the dewatered cake is approximately 27 to 28 percent. On average, the plant generates approximately 1,400 wet tons of dewatered cake per day that is subsequently hauled to land fills at an average cost of approximately $60 per wet ton.
6.1.2 Pilot Test Configuration Figure 36 shows the schematic of the pilot set up. The feed sludge for the test was pumped from LACSD digesters to a 2,500 gallon storage tank. The sludge was then pumped through four 12 feet long, 4” diameter hoses connected in series to the pilot centrifuge. Connections for chemical feed were installed after the first and second (12 feet) hoses from the centrifuge, which would provide a mixing time of 19 and 38 seconds at 25 gpm feed rate, and 9.5 and 19 seconds at 50 gpm feed rate. Figure 37 shows the actual picture of the pilot site and equipment at the LACSD Carson facility.

40
Figure 36: Simplified Schematic of Pilot Test Configuration
Figure 37: Picture of Pilot Demonstration Set Up
6.1.3 Pilot Dewatering Equipment An Alfa Laval ALSYS‐45 pilot dewatering unit was used for field demonstration (Figure 38). The unit is fitted with a 77 horsepower (HP) motor. The pilot unit can be operated at a sludge feed rate of 10 to 110 gpm. Table 3 provides additional information for this equipment.
Feed Sludge Tank
Nano Suspension
Polymer
Solids Collection Drum
On-line MixersCentrifuge
Feed Sludge Tank
Nano Suspension
Polymer
Solids Collection Drum
On-line MixersCentrifuge
Feed Sludge Tank
Nano Suspension
Polymer
Solids Collection Drum
On-line MixersCentrifuge
Feed Sludge Tank
Nano Suspension
Polymer
Solids Collection Drum
On-line Mixers
Feed Sludge Tank
Nano Suspension
Polymer
Solids Collection Drum
On-line MixersCentrifuge
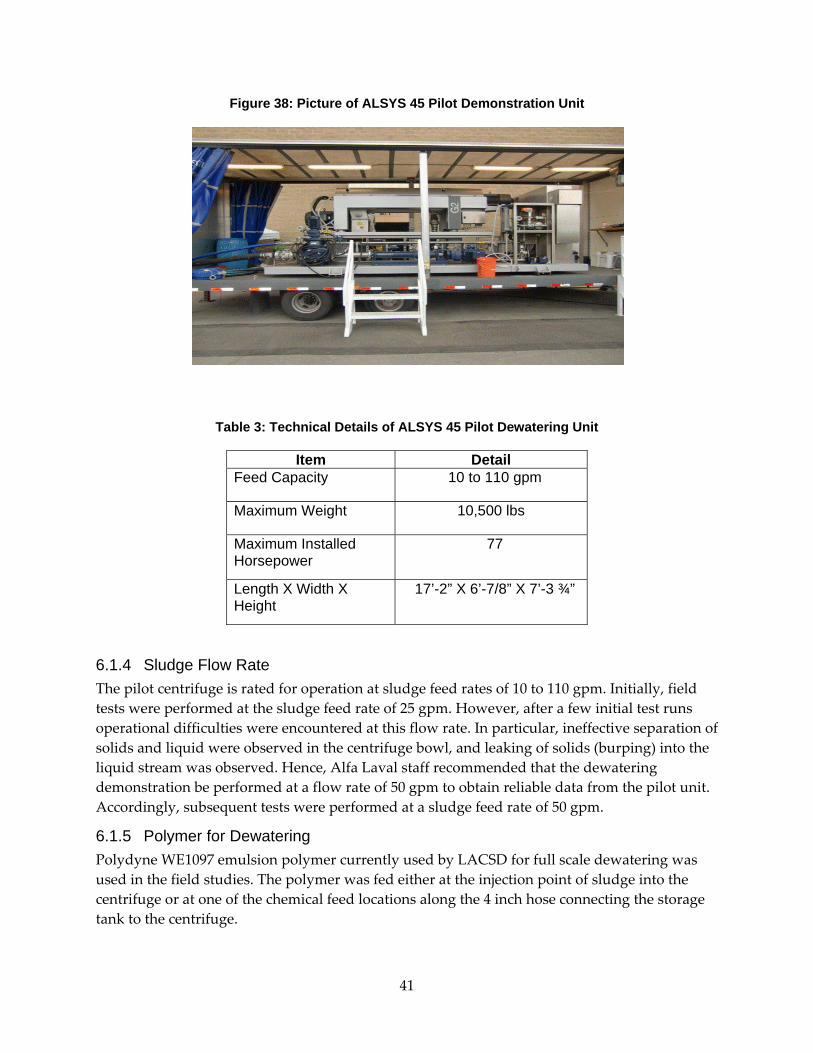
41
Figure 38: Picture of ALSYS 45 Pilot Demonstration Unit
Table 3: Technical Details of ALSYS 45 Pilot Dewatering Unit
Item Detail Feed Capacity 10 to 110 gpm
Maximum Weight 10,500 lbs
Maximum Installed Horsepower
77
Length X Width X Height
17’-2” X 6’-7/8” X 7’-3 ¾”
6.1.4 Sludge Flow Rate The pilot centrifuge is rated for operation at sludge feed rates of 10 to 110 gpm. Initially, field tests were performed at the sludge feed rate of 25 gpm. However, after a few initial test runs operational difficulties were encountered at this flow rate. In particular, ineffective separation of solids and liquid were observed in the centrifuge bowl, and leaking of solids (burping) into the liquid stream was observed. Hence, Alfa Laval staff recommended that the dewatering demonstration be performed at a flow rate of 50 gpm to obtain reliable data from the pilot unit. Accordingly, subsequent tests were performed at a sludge feed rate of 50 gpm.
6.1.5 Polymer for Dewatering Polydyne WE1097 emulsion polymer currently used by LACSD for full scale dewatering was used in the field studies. The polymer was fed either at the injection point of sludge into the centrifuge or at one of the chemical feed locations along the 4 inch hose connecting the storage tank to the centrifuge.

42
Part of the economic benefit of using nanoscale additives are potential savings in polymer requirements during dewatering. Hence, field dewatering studies were performed by varying polymer dose from 12 to 19 lb/DT of LACSD sludge. Performance of polymer‐only dewatering operation was compared with ‘polymer + nanoadditive’ treatment to estimate reduction in polymer dose requirements. Again, data from these trials were intra/ extrapolated to obtain polymer dose requirements for other utilities.
6.1.6 Nanoadditive for Dewatering The nanoadditive NM‐17 was used for field demonstration. Stock suspensions of nanoadditives were prepared at 10 percent concentration by NEI Corporation and shipped in 15 gallon containers for the pilot study (Figure 39). They were used without further dilution during the field demonstration. A peristaltic pump was used to deliver the additives. A static mixer was used to keep the additives in a well‐mixed suspension while dosing. The nanoadditives feed rates were adjusted to vary their dosing from 0.5 to one percent of dry solids during the pilot study.
Figure 39: Nanoadditives (NM-17 @ 10%) Shipped in 15 Gallon Sealed Containers

43
6.1.7 Nanoadditives Mixing Time
Figure 40: Nanoadditives Metering and Injection Set Up
Sludge from the feed tank was delivered to the centrifuge using four 12 feet long, 4inch diameter hoses connected in series. Chemical feed points were installed after the first and the second tube from the centrifuge (i.e. 12 and 24 feet from the centrifuge feed point). Figure 40 shows a chemical feed connection set up. At a sludge feed rate of 25 gpm, the residence (mixing) time in each tube is approximately 19 seconds. At 50 gpm feed rate, the residence time reduces to 9.5 seconds and so the feed points provided mixing times of 19 and 38 seconds at 25 gpm, and 9.5 and 19 seconds at 50 gpm. For most studies, the nanoadditives were added at the feed point located at the end of the second hose, thereby providing a mixing time of approximately 19 seconds at the sludge feed rate of 50 gpm.
6.1.8 Control of Energy Use during Dewatering The electricity use for dewatering is often dictated by the shear force applied by the dewatering unit. Typically, centrifuges impart a higher shear force than screw presses or belt filter presses during dewatering. The centrifuges facilitate dewatering by applying centrifugal shear force on the sludge. This force is created in a conical‐cylinder bowl that rotates at high speed. The higher the speed of rotation (rpm), the higher the shear force imparted on the sludge for solid‐liquid separation. Ideally, treatment plants would prefer to operate their centrifuges at a shear force high enough to get good water removal to lower cake mass, but low enough to minimize energy use, odor production and microbial regrowth.
The pilot Alfa Laval unit used for this study can be operated at a wide range of shear force. During the pilot study most of the dewatering tests were performed at bowl speeds of 3,600, 3,900 and 4,200 rpm. From an operational perspective, the pilot unit used is identical to the full‐scale Alfa Laval G2‐115 dewatering unit used by LACSD. The full‐scale G2‐115, is operated at a bowl speed of 2,925 rpm to generate a g‐force of approximately 3,100 units. According to Alfa Laval staff, the pilot centrifuge unit (G2‐45), at a bowl speed of 4,200 rpm generates a g‐force of 3,550 units and generates cake solids of similar characteristics. When operated at 3,600 and 3,900
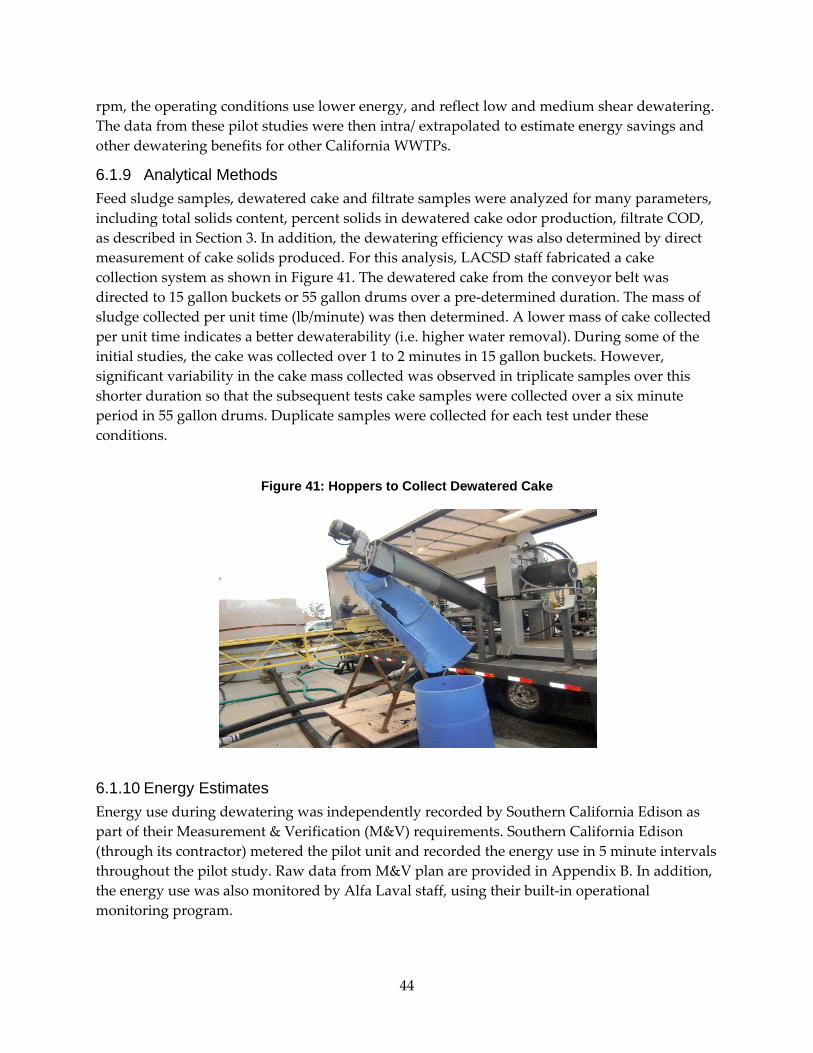
44
rpm, the operating conditions use lower energy, and reflect low and medium shear dewatering. The data from these pilot studies were then intra/ extrapolated to estimate energy savings and other dewatering benefits for other California WWTPs.
6.1.9 Analytical Methods Feed sludge samples, dewatered cake and filtrate samples were analyzed for many parameters, including total solids content, percent solids in dewatered cake odor production, filtrate COD, as described in Section 3. In addition, the dewatering efficiency was also determined by direct measurement of cake solids produced. For this analysis, LACSD staff fabricated a cake collection system as shown in Figure 41. The dewatered cake from the conveyor belt was directed to 15 gallon buckets or 55 gallon drums over a pre‐determined duration. The mass of sludge collected per unit time (lb/minute) was then determined. A lower mass of cake collected per unit time indicates a better dewaterability (i.e. higher water removal). During some of the initial studies, the cake was collected over 1 to 2 minutes in 15 gallon buckets. However, significant variability in the cake mass collected was observed in triplicate samples over this shorter duration so that the subsequent tests cake samples were collected over a six minute period in 55 gallon drums. Duplicate samples were collected for each test under these conditions.
Figure 41: Hoppers to Collect Dewatered Cake
6.1.10 Energy Estimates Energy use during dewatering was independently recorded by Southern California Edison as part of their Measurement & Verification (M&V) requirements. Southern California Edison (through its contractor) metered the pilot unit and recorded the energy use in 5 minute intervals throughout the pilot study. Raw data from M&V plan are provided in Appendix B. In addition, the energy use was also monitored by Alfa Laval staff, using their built‐in operational monitoring program.

45
6.2 Key Goals of the Pilot Study The pilot study was performed to test if the dewatering performance observed during bench‐scale tests can be translated to a large‐scale field demonstration.. In particular, the pilot test evaluated:
i) If nanoadditives can be effective in large dewatering systems that currently yield dewatered cake with higher percent solids (approximately 27 to 28 percent) using polymer‐only treatment. (Note that, most laboratory tests in our study yielded cake solids of approximately 20 percent during polymer‐only testing);
ii) Translation of the shear force‐based data to corresponding energy use estimate during dewatering;
iii) Identification of the polymer dose, mixing time requirements under field operating conditions; and
iv) Use of the above data for estimation of energy and economic benefits to California water treatment facilities from dewatering using nanoadditives
6.3 Results and Discussions 6.3.1 Summary of Test Runs A total of 32 trials were performed during the field demonstration. For each trial, upon adjusting the operational parameters, approximately 30 to 45 minutes was allowed for the process to stabilize prior to collecting samples for analyses. Including the time for duplicate (or triplicate) sludge cake collection, an average run lasted about 1 hour to 1 hour and 15 minutes. The start and end time of each run was independently recorded by Alfa Laval, Kennedy/Jenks and LACSD staff. These run times were then matched with the energy data recorded by Southern California Edison to determine energy demand under each operational condition. Table 4 provides a summary of the dewatering trials performed.
Table 4: Summary of 32 Field Dewatering Studies Performed at LACSD
Test # Date Time1 RPM Sludge Flow Rate
(gpm)
Polymer Dose
(lb/DT)
Nano Dose (% of DT)
Feed Position
Average lb/min
of solids
Cake Collection Equipment
1 2/27/2012 8:20 AM
4200 25 18 0 Internal 12.38
15 gallon containers @ ~ 45 sec
2 2/27/2012 10:48 AM
3800 25 18 0 Internal 11.98
3 2/27/2012 12:50 PM
3800 25 18 1% Internal 17.76
4 2/27/2012 2:00 PM
3800 25 18 0 Internal 11.30
5 2/27/2012 2:42 PM
3800 25 12 1% Internal 13.57
6 2/28/2012 8:40 4200 50 18 0 Internal 38.53

46
Test # Date Time1 RPM Sludge Flow Rate
(gpm)
Polymer Dose
(lb/DT)
Nano Dose (% of DT)
Feed Position
Average lb/min
of solids
Cake Collection Equipment
AM per container. Triplicate samples per run.
7 2/28/2012 9:30 AM
4200 50 16 0 Internal 25.62
8 2/28/2012 10:10 AM
4200 50 14 0 Internal 28.85
9 2/28/2012 11:00 AM
4200 50 12 0 Internal 27.67
10 2/28/2012 11:50 AM
4200 50 12 0.50% Internal 30.31
11 2/28/2012 12:42 PM
4200 50 12 1% Internal 27.31
12 2/28/2012 1:28 PM
4200 50 14 1% Internal 26.25
13 2/28/2012 2:15 PM
4200 50 16 1% Internal 27.08
14 2/28/2012 3:30 PM
4200 50 16 0% Internal 26.30
15 2/29/2012 8:45 AM
3600 50 16 0% Internal 27.05
55 gallon drums @ ~ 6 minutes per drum. Duplicate samples per run.
16 2/29/2012 9:35 AM
3600 50 14 0% Internal 29.32
17 2/29/2012 10:10 AM
3600 50 12 0% Internal 27.97
18 2/29/2012 11:40 AM
3600 50 12 1% Internal 27.29
19 2/29/2012 2:30 PM
3600 50 16 0% Internal 27.13
20 2/29/2012 3:40 PM
3600 50 16 1% Internal 25.80
21 3/1/2012 9:50 AM
3600 50 14 0% Internal 28.66
22 3/1/2012 10:35 AM
3600 50 14 1% Internal 26.68
23 3/1/2012 11:35 AM
3600 50 14 0.5% Internal 28.39
24 3/1/2012 12:25 PM
4200 50 14 0% Internal 25.08
25 3/1/2012 1:05 PM
4200 50 14 0.5% Internal 26.58
26 3/1/2012 2:10 PM
4200 50 14 1% Internal 26.70
27 3/1/2012 3:16 PM
3900 50 14 0.0% Internal 28.73
28 3/1/2012 4:09 PM
3900 50 14 1% Internal 26.81
29 3/2/2012 8:30 AM
3900 50 14 0.0% Internal 27.99
30 3/2/2012 9:20 AM
3900 50 24 0% External 28.43
31 3/2/2012 9:58 AM
3900 50 24 1.0% External 29.74

47
Test # Date Time1 RPM Sludge Flow Rate
(gpm)
Polymer Dose
(lb/DT)
Nano Dose (% of DT)
Feed Position
Average lb/min
of solids
Cake Collection Equipment
32 3/2/2012 10:40 AM
3900 50 14 1% Internal 26.16
6.3.2 Energy Use at Different Bowl Shears Figure 42 shows the energy use for these tests at various bowl shears. For the pilot unit used in this test, average energy use at bowl speeds of 4,200, 3,900 and 3,600 rpm were 14.7, 12.8, and 11 kWh, respectively. Lowering the bowl shear by 300 rpm resulted in reduction in energy use by about 12.5 percent. The energy use at 3,600 rpm bowl shear was approximately 25 percent lower than that at 4,200 rpm. This energy use is independent of other operational variables such as polymer feed location, polymer dosing, or nanoadditive dosing.

48
Figure 42: Average Electricity Consumption by ALSYS 45 at Various Dewatering Bowl Shears
6.3.3 Dewatered Cake Mass As discussed in earlier sections, a key economic consideration during dewatering in most California WWTPs is the cost of disposing the dewatered cake. For most treatment plants, lowering the bowl speed through the use of nanoadditives must concur with producing equal or lower mass of dewatered cake that is current best practice.
In most traditional (polymer‐only) dewatering studies, the quality of dewatered cake produced is determined by the percent solids measured. A higher percentage of solids in the cake indicates lower water content and less cake mass to haul. This method is however, an indirect method of measuring the dewatering efficiency. In this study, since the nanoadditive may potentially add to the mass of the cake and skew the percent solids data, the total mass of the solids produced per unit time was collected and measured. This approach provides direct evidence of dewatering performance under the testing conditions.
Figure 43: Percent Solids in the Dewatered Cake at a Polymer Dose of 14 lb/DT with and without NM-17 Addition
0.0
4.0
8.0
12.0
16.0
3500 3600 3700 3800 3900 4000 4100 4200 4300
Bowl Speed (rpm)
Elec
tric
ity C
onsu
mpt
ion
(kW
h)
0.19
0.2
0.21
0.22
0.23
0.24
0.25
0.26
3600 3900 3900 - Day 2 4200
Bowl Speed (rpm)
% S
olid
s in
Dew
ater
ed C
ake
Polymer Only (14 lb/DT) Polymer + 0.5% Nano Polymer + 1% Nano

49
Figure 43 shows the percent solids in the dewatered cake at a polymer dose of 14 lb/DT at different doses of nanoadditives. At a lower shear force (3,600 rpm), the percent solids in the cake increased gradually with an increase in nanoadditive dose. The trends observed during 3,900 rpm operation were not very clear. In one set of data (Day 1), the percent solids in the presence of a nanoadditive was not significantly different than that in the polymer‐only test. In the next set of studies the percent solids in the presence of nanoadditives was significantly higher than the polymer only test. At the highest shear (4,200 rpm), the percent solids did not vary significantly with addition of nanoadditives. In summary, measuring percent solids in the dewatered cake did not yield consistent information regarding dewatering efficiency in the field trials.
Figure 44 shows the mass of cake solids collected per unit time from the same set of studies. As discussed before, this is a direct measure of the dewatering efficiency, where a smaller mass collected per unit time would indicate a better dewatering performance. As shown in Figure 44, for the traditional, polymer‐only, treatment the amount of solids produced decreased with an increase in shear. The difference was less pronounced between 3,600 and 3,900 rpm. However, the mass of cake produced was significantly lower at 4,200 rpm.
Figure 44: Amount of Dewatered Cake Generated at a Polymer Dose of 14 lb/DT with and without NM-17 Addition
At 3,600 and 3,900 rpm, the nanoadditives improved dewatering significantly and lowered the mass of cake produced. At 3,600 rpm, the mass of cake produced under polymer‐only, polymer + 0.5 percent and polymer + one percent treatment were 28.7, 28.4 and 26.7 lb/min, respectively. At 3,900 rpm, the mass of cake produced at ‘polymer only’ and ‘polymer +one percent nanoadditive’ treatment are 28.4 and 26.3 lb/min, respectively, indicating an improvement in dewatering performance in the presence of nanoadditives. More importantly, at a bowl shear of 3,600 rpm, addition of nanoadditives produced lower mass of cake solids than that achieved at 3,900 rpm bowl shear under conventional, polymer‐only, dewatering conditions.
At 4,200 rpm, the nanoadditives had a negative effect on dewatering. The cake mass in the polymer‐only treatment (28.43 lb/DT) was lower than that (29.76 lb/DT) in the presence of
23
24
25
26
27
28
29
30
3600 3900 - Day 1 3900 - Day 2 4200
Bowl Speed (rpm)
Tota
l Cak
e So
lids
(lb/m
in)
Polymer Only (14 lb/DT) Polymer (14 lb/DT) + 0.5% Nano Polymer (14 lb/DT) + 1% Nano
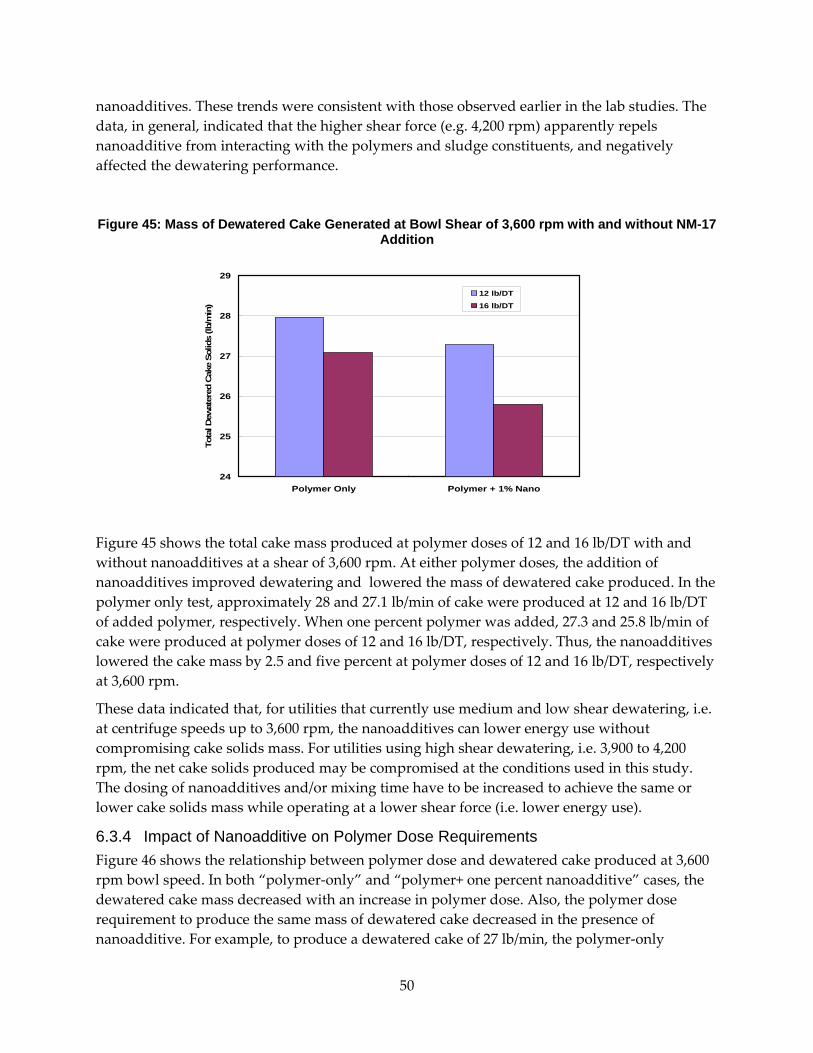
50
nanoadditives. These trends were consistent with those observed earlier in the lab studies. The data, in general, indicated that the higher shear force (e.g. 4,200 rpm) apparently repels nanoadditive from interacting with the polymers and sludge constituents, and negatively affected the dewatering performance.
Figure 45: Mass of Dewatered Cake Generated at Bowl Shear of 3,600 rpm with and without NM-17 Addition
Figure 45 shows the total cake mass produced at polymer doses of 12 and 16 lb/DT with and without nanoadditives at a shear of 3,600 rpm. At either polymer doses, the addition of nanoadditives improved dewatering and lowered the mass of dewatered cake produced. In the polymer only test, approximately 28 and 27.1 lb/min of cake were produced at 12 and 16 lb/DT of added polymer, respectively. When one percent polymer was added, 27.3 and 25.8 lb/min of cake were produced at polymer doses of 12 and 16 lb/DT, respectively. Thus, the nanoadditives lowered the cake mass by 2.5 and five percent at polymer doses of 12 and 16 lb/DT, respectively at 3,600 rpm.
These data indicated that, for utilities that currently use medium and low shear dewatering, i.e. at centrifuge speeds up to 3,600 rpm, the nanoadditives can lower energy use without compromising cake solids mass. For utilities using high shear dewatering, i.e. 3,900 to 4,200 rpm, the net cake solids produced may be compromised at the conditions used in this study. The dosing of nanoadditives and/or mixing time have to be increased to achieve the same or lower cake solids mass while operating at a lower shear force (i.e. lower energy use).
6.3.4 Impact of Nanoadditive on Polymer Dose Requirements Figure 46 shows the relationship between polymer dose and dewatered cake produced at 3,600 rpm bowl speed. In both “polymer‐only” and “polymer+ one percent nanoadditive” cases, the dewatered cake mass decreased with an increase in polymer dose. Also, the polymer dose requirement to produce the same mass of dewatered cake decreased in the presence of nanoadditive. For example, to produce a dewatered cake of 27 lb/min, the polymer‐only
24
25
26
27
28
29
Polymer Only Polymer + 1% Nano
Tota
l Dew
ater
ed C
ake
Solid
s (lb
/min
)
12 lb/DT
16 lb/DT
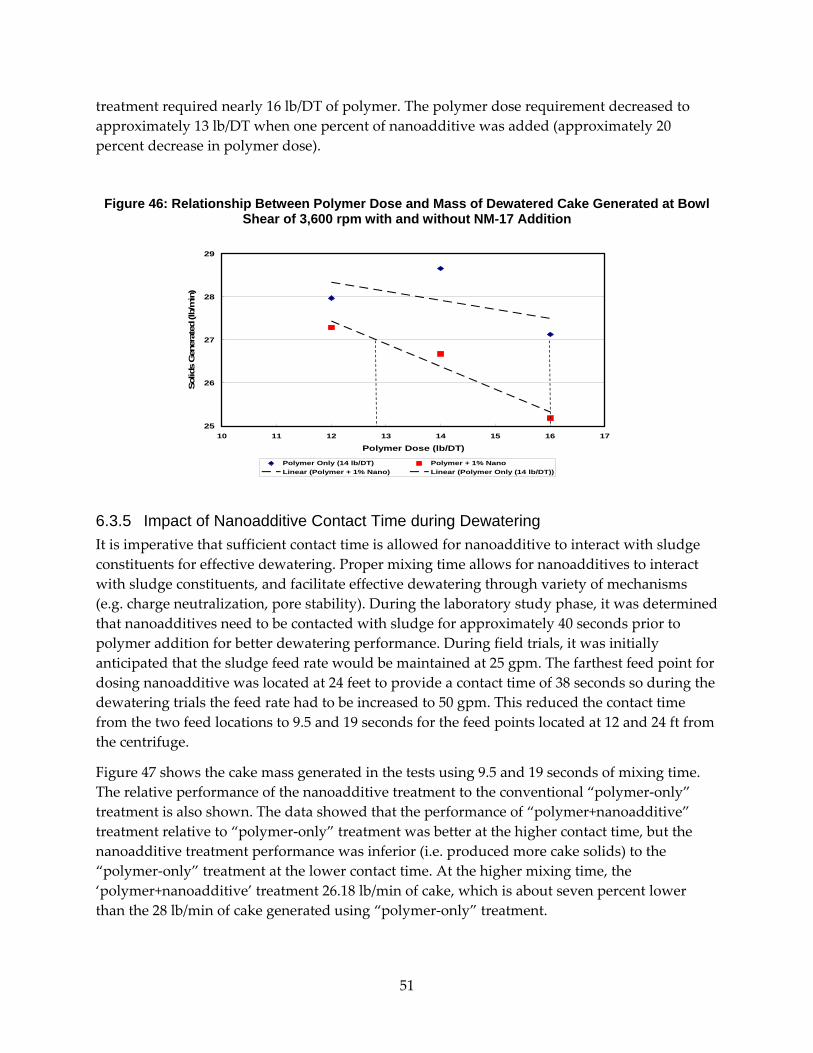
51
treatment required nearly 16 lb/DT of polymer. The polymer dose requirement decreased to approximately 13 lb/DT when one percent of nanoadditive was added (approximately 20 percent decrease in polymer dose).
Figure 46: Relationship Between Polymer Dose and Mass of Dewatered Cake Generated at Bowl Shear of 3,600 rpm with and without NM-17 Addition
6.3.5 Impact of Nanoadditive Contact Time during Dewatering It is imperative that sufficient contact time is allowed for nanoadditive to interact with sludge constituents for effective dewatering. Proper mixing time allows for nanoadditives to interact with sludge constituents, and facilitate effective dewatering through variety of mechanisms (e.g. charge neutralization, pore stability). During the laboratory study phase, it was determined that nanoadditives need to be contacted with sludge for approximately 40 seconds prior to polymer addition for better dewatering performance. During field trials, it was initially anticipated that the sludge feed rate would be maintained at 25 gpm. The farthest feed point for dosing nanoadditive was located at 24 feet to provide a contact time of 38 seconds so during the dewatering trials the feed rate had to be increased to 50 gpm. This reduced the contact time from the two feed locations to 9.5 and 19 seconds for the feed points located at 12 and 24 ft from the centrifuge.
Figure 47 shows the cake mass generated in the tests using 9.5 and 19 seconds of mixing time. The relative performance of the nanoadditive treatment to the conventional “polymer‐only” treatment is also shown. The data showed that the performance of “polymer+nanoadditive” treatment relative to “polymer‐only” treatment was better at the higher contact time, but the nanoadditive treatment performance was inferior (i.e. produced more cake solids) to the “polymer‐only” treatment at the lower contact time. At the higher mixing time, the ‘polymer+nanoadditive’ treatment 26.18 lb/min of cake, which is about seven percent lower than the 28 lb/min of cake generated using “polymer‐only” treatment.
25
26
27
28
29
10 11 12 13 14 15 16 17
Polymer Dose (lb/DT)
Solid
s G
ener
ated
(lb/
min
)
Polymer Only (14 lb/DT) Polymer + 1% NanoLinear (Polymer + 1% Nano) Linear (Polymer Only (14 lb/DT))
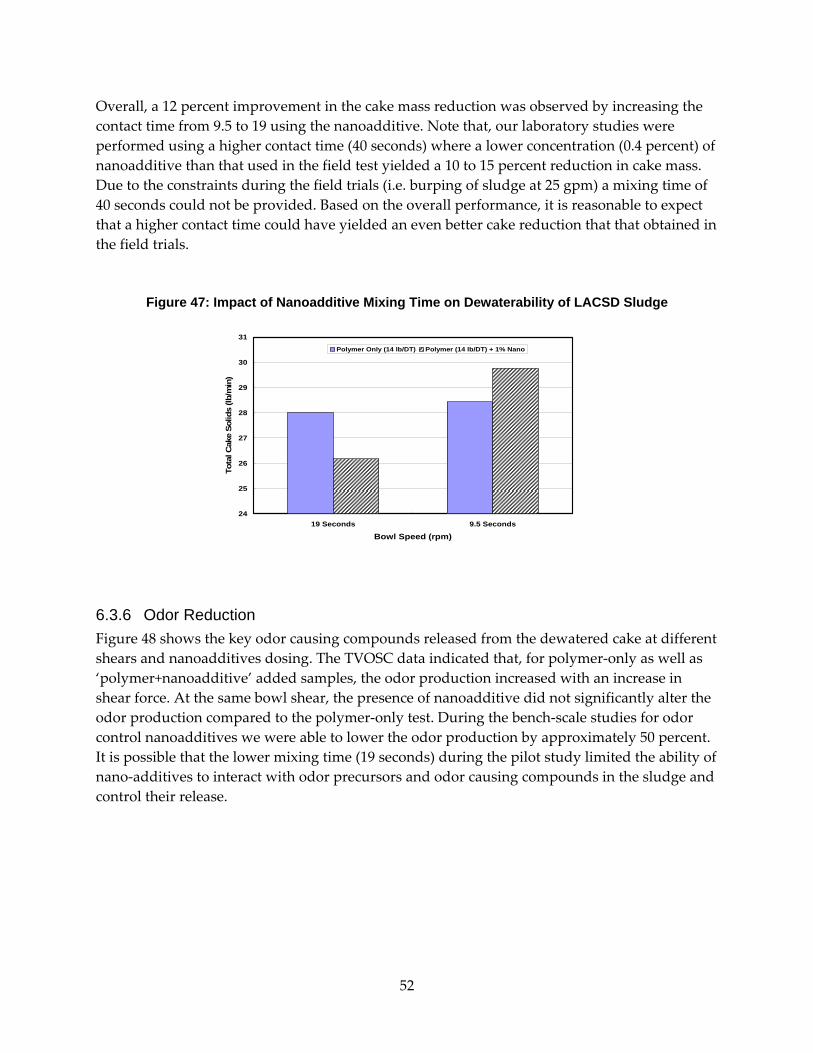
52
Overall, a 12 percent improvement in the cake mass reduction was observed by increasing the contact time from 9.5 to 19 using the nanoadditive. Note that, our laboratory studies were performed using a higher contact time (40 seconds) where a lower concentration (0.4 percent) of nanoadditive than that used in the field test yielded a 10 to 15 percent reduction in cake mass. Due to the constraints during the field trials (i.e. burping of sludge at 25 gpm) a mixing time of 40 seconds could not be provided. Based on the overall performance, it is reasonable to expect that a higher contact time could have yielded an even better cake reduction that that obtained in the field trials.
Figure 47: Impact of Nanoadditive Mixing Time on Dewaterability of LACSD Sludge
6.3.6 Odor Reduction Figure 48 shows the key odor causing compounds released from the dewatered cake at different shears and nanoadditives dosing. The TVOSC data indicated that, for polymer‐only as well as ‘polymer+nanoadditive’ added samples, the odor production increased with an increase in shear force. At the same bowl shear, the presence of nanoadditive did not significantly alter the odor production compared to the polymer‐only test. During the bench‐scale studies for odor control nanoadditives we were able to lower the odor production by approximately 50 percent. It is possible that the lower mixing time (19 seconds) during the pilot study limited the ability of nano‐additives to interact with odor precursors and odor causing compounds in the sludge and control their release.
24
25
26
27
28
29
30
31
19 Seconds 9.5 Seconds
Bowl Speed (rpm)
Tota
l Cak
e So
lids
(lb/m
in)
Polymer Only (14 lb/DT) Polymer (14 lb/DT) + 1% Nano

53
Figure 48: Odor Production from Dewatered Cake
Figure 49: Effect of Shear and NM-17 Dose on Odor Production from Dewatered Cake
In our proposed approach, using nanoadditives, the energy savings for dewatering will be achieved through lower bowl shear. Accordingly, Figure 49 shows odor profile at a lower shear in the presence of nanoadditive (which represents the proposed approach) and that is at a higher shear from the polymer‐only treatment (which represents the conventional approach). Similarly, Figure 49 shows odor production from polymer‐only treatment at 4,200 rpm and that from polymer+nanoadditive treatment at 3,900 rpm. In both instances, the odor production in the nanoadditive treated samples is about 20 percent lower.
These data suggested that the ability of nanoadditives to achieve better dewatering at lower bowl speed also has the potential to lower odor production from the dewatered sludge.
0
40 0
80 0
120 0
160 0
0 1 2 3 4 5 6 7 8 9D a ys
TVO
SC
(p
pm
RPM = 3 600; P olym er On ly RPM = 390 0; Polyme r O nly RPM = 42 00; Po lym er On lyRPM = 3 600; P oly+1% Nano RPM = 390 0; Poly+1 % Na no RPM = 42 00; Po ly+1% Nano
0
400
800
1200
1600
0 1 2 3 4 5 6 7 8 9Days
TVOS
C (pp
mv)
RPM = 3900; Polymer Only RPM = 3600; Poly+1% Nano
0
400
800
1200
1600
0 1 2 3 4 5 6 7 8 9Days
TVOS
C (pp
mv)
RPM = 4200; Polymer Only RPM = 3900; Poly+1% Nano
0
400
800
1200
1600
0 1 2 3 4 5 6 7 8 9Days
TVOS
C (pp
mv)
RPM = 3900; Polymer Only RPM = 3600; Poly+1% Nano
0
400
800
1200
1600
0 1 2 3 4 5 6 7 8 9Days
TVOS
C (pp
mv)
RPM = 4200; Polymer Only RPM = 3900; Poly+1% Nano
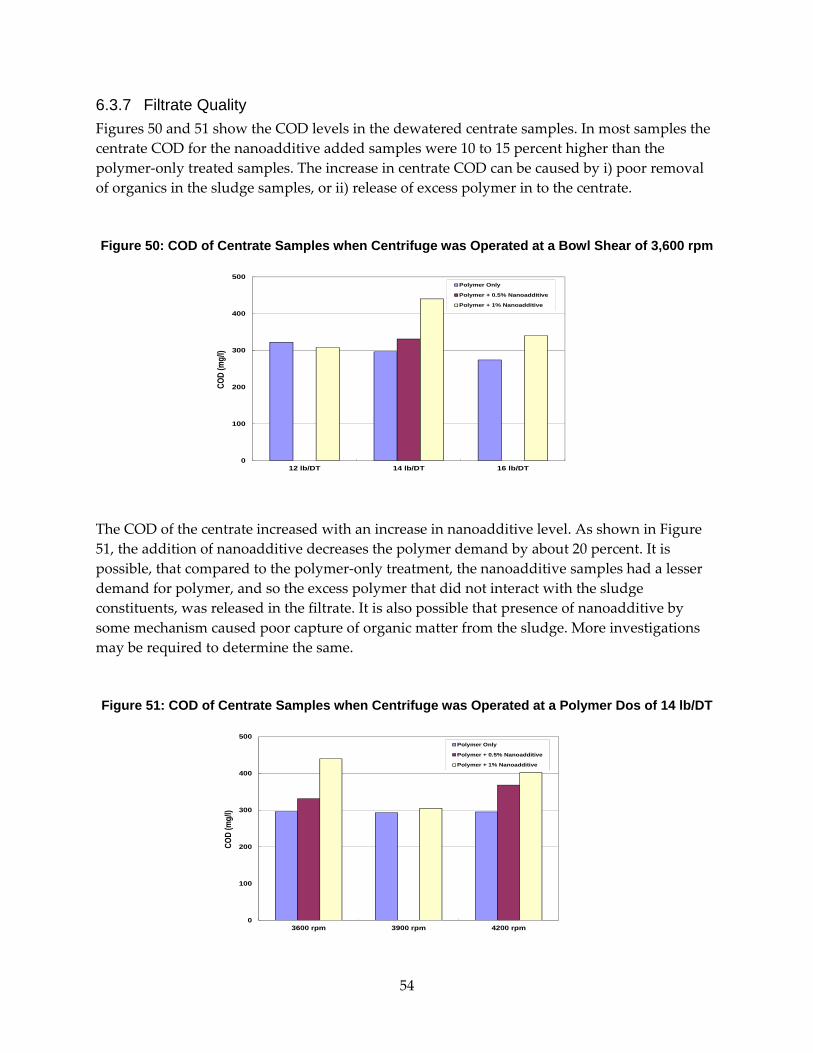
54
6.3.7 Filtrate Quality Figures 50 and 51 show the COD levels in the dewatered centrate samples. In most samples the centrate COD for the nanoadditive added samples were 10 to 15 percent higher than the polymer‐only treated samples. The increase in centrate COD can be caused by i) poor removal of organics in the sludge samples, or ii) release of excess polymer in to the centrate.
Figure 50: COD of Centrate Samples when Centrifuge was Operated at a Bowl Shear of 3,600 rpm
The COD of the centrate increased with an increase in nanoadditive level. As shown in Figure 51, the addition of nanoadditive decreases the polymer demand by about 20 percent. It is possible, that compared to the polymer‐only treatment, the nanoadditive samples had a lesser demand for polymer, and so the excess polymer that did not interact with the sludge constituents, was released in the filtrate. It is also possible that presence of nanoadditive by some mechanism caused poor capture of organic matter from the sludge. More investigations may be required to determine the same.
Figure 51: COD of Centrate Samples when Centrifuge was Operated at a Polymer Dos of 14 lb/DT
0
100
200
300
400
500
12 lb/DT 14 lb/DT 16 lb/DT
COD
(mg/
l)
Polymer Only
Polymer + 0.5% Nanoadditive
Polymer + 1% Nanoadditive
0
100
200
300
400
500
3600 rpm 3900 rpm 4200 rpm
COD
(mg/
l)
Polymer Only
Polymer + 0.5% Nanoadditive
Polymer + 1% Nanoadditive

55
CHAPTER 7: Methods Verification Southern California Edison Company performed M&V during the field demonstration at LACSD. The following Memorandum was submitted by Southern California Edison staff which summarizes the Methodology and Findings. The energy use data recorded by data logger is provided in Appendix B.
Task 7 Memorandum
Methods and Verification of Energy Consumption of a Project to Improve Energy Efficiency of Dewatering of Sewage Sludge Using Nano Particles
7.1 Background Kennedy Jenks managed the project, funded by the California Energy Commission (CEC), to validate the bench scale testing results achieved from an earlier project. Kennedy Jenks contracted with a supplier to lease a pilot scale sewage sludge dewatering facility housed in a portable trailer. The trailer was installed at the Carson Wastewater Treatment Facility, which is owned and operated by the Los Angeles County Sanitation District. The pilot facility was operated by staff from the Carson Wastewater Treatment Facility under the direction of Kennedy Jenks. A 77 HP (or kW) motor installed in the pilot unit is used to compress the sludge for the purpose of removing as much water as possible to reduce the moisture content of the sludge prior to transporting the sludge to a landfill or other locations. The pilot facility had internal instrumentation for measuring and recording electrical load on the motor used to dewater the sewage sludge.
7.2 M&V Testing The CEC required Kennedy Jenks to contract with the local electric utility to perform independent M&V testing during the entire data collection of the project. This independent M&V testing is typically done on pilot and full commercial projects to verify the accuracy and provide independent measurements of the energy consumed by the motor or other electrical equipment. Southern California Edison (SCE) is the local utility serving Los Angeles County where the Carson Wastewater Treatment Facility is located.
The pilot testing was conducted from February 27, 2012 to March 2, 2012. SCE subcontracted with ASW Engineering Consultants (ASW), which is one of the companies that perform M&V work for SCE. Personnel from ASW and SCE were on site periodically during the pilot testing of sludge dewatering with and without nano particles to observe the testing procedures and verify the recording equipment was working as designed.
A PowerSight Power Analyzer was installed prior to the testing program and removed after the completion of the sludge dewatering pilot testing. The PowerSight PS3500 Power Analyzer measures voltage, current, KW, KVA, KVAR, true power factor, displacement power factor, KWh, Hz, elapsed and estimated cost and duty cycle. The PS3500 is capable of long term data
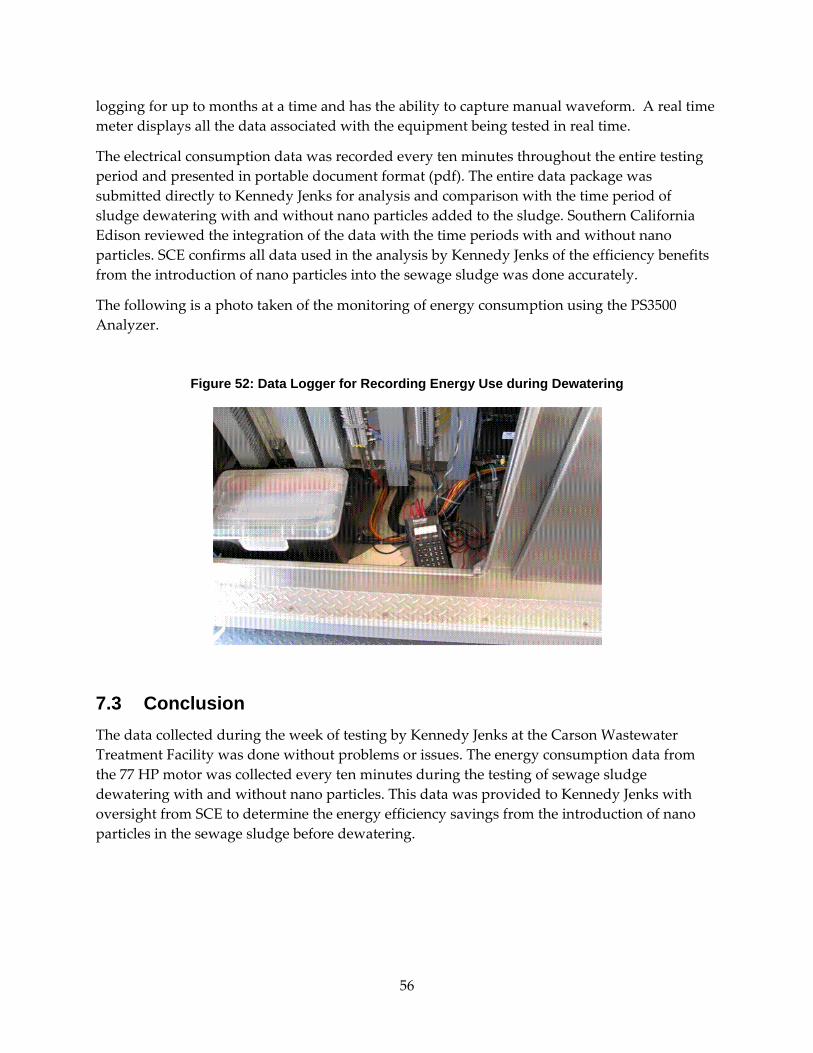
56
logging for up to months at a time and has the ability to capture manual waveform. A real time meter displays all the data associated with the equipment being tested in real time.
The electrical consumption data was recorded every ten minutes throughout the entire testing period and presented in portable document format (pdf). The entire data package was submitted directly to Kennedy Jenks for analysis and comparison with the time period of sludge dewatering with and without nano particles added to the sludge. Southern California Edison reviewed the integration of the data with the time periods with and without nano particles. SCE confirms all data used in the analysis by Kennedy Jenks of the efficiency benefits from the introduction of nano particles into the sewage sludge was done accurately.
The following is a photo taken of the monitoring of energy consumption using the PS3500 Analyzer.
Figure 52: Data Logger for Recording Energy Use during Dewatering
7.3 Conclusion The data collected during the week of testing by Kennedy Jenks at the Carson Wastewater Treatment Facility was done without problems or issues. The energy consumption data from the 77 HP motor was collected every ten minutes during the testing of sewage sludge dewatering with and without nano particles. This data was provided to Kennedy Jenks with oversight from SCE to determine the energy efficiency savings from the introduction of nano particles in the sewage sludge before dewatering.

57
CHAPTER 8: Production Readiness Plan The process to manufacture nanoadditives for sludge treatment uses standard mixing, filtration and drying equipment. The critical production process is introducing the desired functional groups on the surface of the nanoparticles. The manufacturing of the nanoadditives can be performed using polymer drums with overhead mixers, ribbon blenders or V‐blenders, centrifuge and drying ovens.
The industry is sensitive to price, since wastewater treatment usually represents a cost to the company without a return. This is changing as efforts are underway to reuse reclaimed and produced water (31), and to find beneficial uses for the sludge. The approximate cost to the end‐user for a pound of nanoadditive dewatering aid is $1.40.
A preliminary first order cost analysis shows there is ample margin. Note that the key to produce low cost nanoscale material is to use a carbon‐based particle as a high surface area template with a thin coating of the active material. (As mentioned before, we have successfully used this strategy to develop sorbents for mercury removal from both the gas phase in a power plant, and from contaminated water bodies – to date, hundreds of pounds have been produced and field tested). Figure 53 shows a process flow diagram to manufacture the product. Each unit process is a well‐established industrial process, and does not require the use of specialized equipment. The total raw material cost has been estimated from bulk pricing figures. For example, the total raw material cost is $0.92/lb of nanoscale additive. We estimate that the manufacturing cost will be $0.20/lb, which is based upon our prior experience in producing the above mentioned sorbents, leading to cost of goods sold (COGS) of $1.12 per pound. Even at a selling price of $1.40, there is adequate margin for selling, general and administrative expenses (SG&A) and profit. Table 5 outlines the different elements contributing to the cost of the nanoadditive.
Figure 53: Schematics of Manufacturing Process for Production of Nanoadditives to Enhance Sludge Dewatering
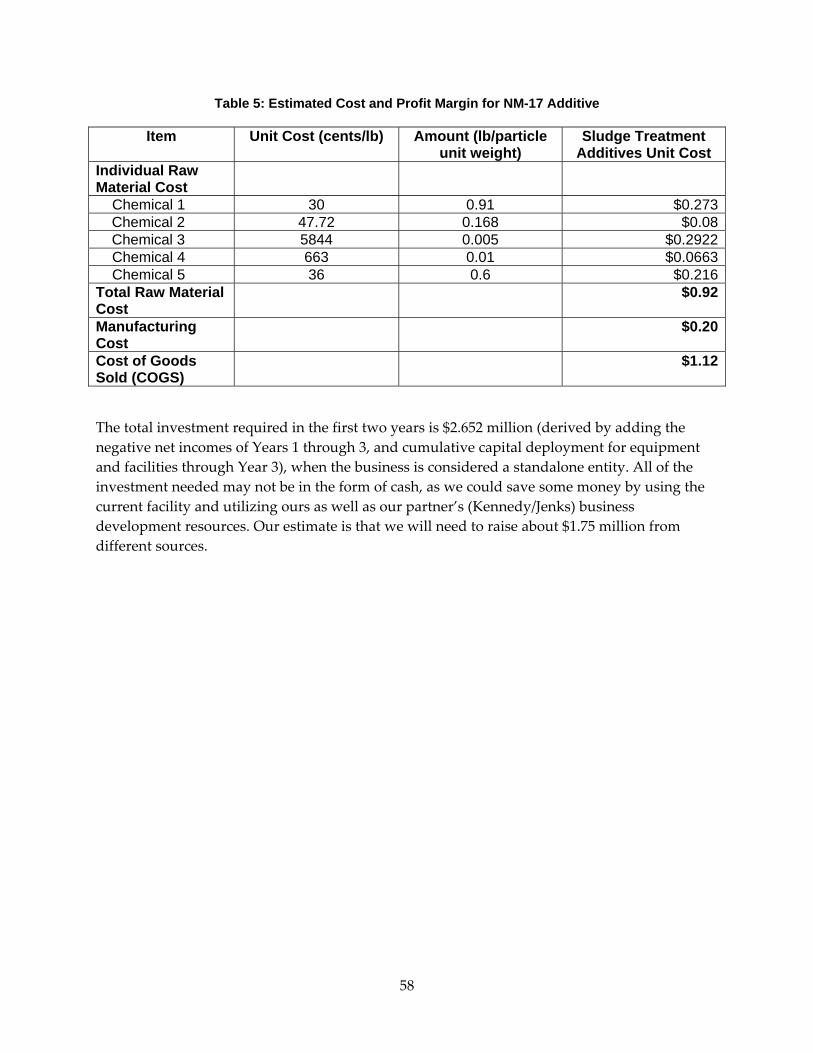
58
Table 5: Estimated Cost and Profit Margin for NM-17 Additive
Item Unit Cost (cents/lb) Amount (lb/particle unit weight)
Sludge Treatment Additives Unit Cost
Individual Raw Material Cost
Chemical 1 30 0.91 $0.273 Chemical 2 47.72 0.168 $0.08 Chemical 3 5844 0.005 $0.2922
Chemical 4 663 0.01 $0.0663 Chemical 5 36 0.6 $0.216Total Raw Material Cost
$0.92
Manufacturing Cost
$0.20
Cost of Goods Sold (COGS)
$1.12
The total investment required in the first two years is $2.652 million (derived by adding the negative net incomes of Years 1 through 3, and cumulative capital deployment for equipment and facilities through Year 3), when the business is considered a standalone entity. All of the investment needed may not be in the form of cash, as we could save some money by using the current facility and utilizing ours as well as our partner’s (Kennedy/Jenks) business development resources. Our estimate is that we will need to raise about $1.75 million from different sources.
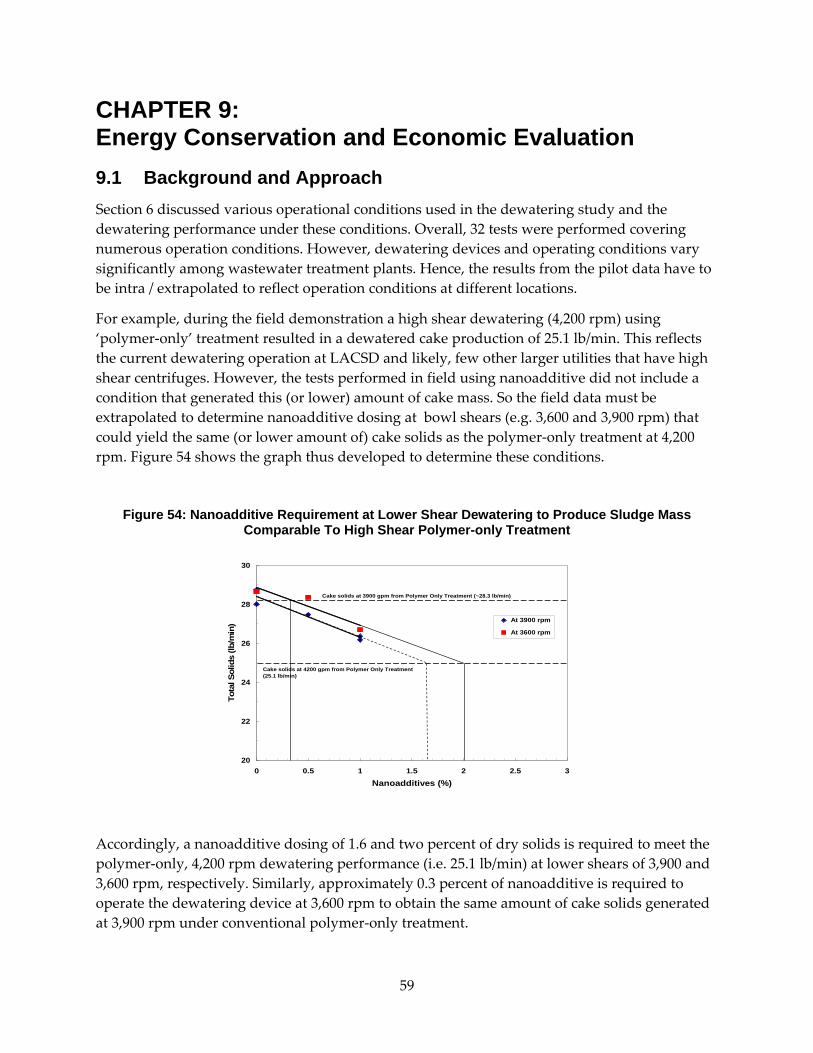
59
CHAPTER 9: Energy Conservation and Economic Evaluation 9.1 Background and Approach Section 6 discussed various operational conditions used in the dewatering study and the dewatering performance under these conditions. Overall, 32 tests were performed covering numerous operation conditions. However, dewatering devices and operating conditions vary significantly among wastewater treatment plants. Hence, the results from the pilot data have to be intra / extrapolated to reflect operation conditions at different locations.
For example, during the field demonstration a high shear dewatering (4,200 rpm) using ‘polymer‐only’ treatment resulted in a dewatered cake production of 25.1 lb/min. This reflects the current dewatering operation at LACSD and likely, few other larger utilities that have high shear centrifuges. However, the tests performed in field using nanoadditive did not include a condition that generated this (or lower) amount of cake mass. So the field data must be extrapolated to determine nanoadditive dosing at bowl shears (e.g. 3,600 and 3,900 rpm) that could yield the same (or lower amount of) cake solids as the polymer‐only treatment at 4,200 rpm. Figure 54 shows the graph thus developed to determine these conditions.
Figure 54: Nanoadditive Requirement at Lower Shear Dewatering to Produce Sludge Mass Comparable To High Shear Polymer-only Treatment
Accordingly, a nanoadditive dosing of 1.6 and two percent of dry solids is required to meet the polymer‐only, 4,200 rpm dewatering performance (i.e. 25.1 lb/min) at lower shears of 3,900 and 3,600 rpm, respectively. Similarly, approximately 0.3 percent of nanoadditive is required to operate the dewatering device at 3,600 rpm to obtain the same amount of cake solids generated at 3,900 rpm under conventional polymer‐only treatment.
20
22
24
26
28
30
0 0.5 1 1.5 2 2.5 3
Nanoadditives (%)
Tota
l Sol
ids
(lb/m
in) At 3900 rpm
At 3600 rpm
Cake solids at 4200 gpm from Polymer Only Treatment (25.1 lb/min)
Cake solids at 3900 gpm from Polymer Only Treatment (~28.3 lb/min)

60
Furthermore, it must be noted that the mixing time for nanoadditive with the feed sludge during the field studies were nearly 50 percent of the mixing time provided in the laboratory. Field data showed that mixing time affected nanoadditive performance during dewatering (Figure 47). Sufficient mixing time is required for nanoadditive to properly disperse and interact with sludge constituents. For example, compared to polymer‐only treatment, a 10 percent reduction in the cake mass was obtained using 0.4 percent dosing of nanoadditive during the laboratory studies (Figure 33). However, one percent nanoadditive dosing was required to obtain similar reduction during the field study.
It is reasonable to assume that, among other factors, the lower mixing time during the field study may also have contributed to this difference. Hence, a factor of 0.5 was applied to the nanoadditive dose estimate from Figure 54 for statewide impact on energy use due to the proposed technology. Accordingly, 0.8 percent and one percent of nanoadditives will be required to operate the dewatering devices at 3,900 and 3,600 rpm, respectively, to obtain the same low cake mass obtained by polymer‐only treatment at 4,200 rpm. About 0.15 percent of nanoadditive is required to operate the device at 3,600 rpm and achieve the same amount of solids as in polymer‐only dewatering at 3,900 rpm.
Table 6 summarizes the parameters and dosing rates thus developed for different operating conditions. This will be used in conjunction with the list of dewatering facilities to estimate statewide energy savings.
Table 6: Operational Parameters and Dosing Used to Develop Dewatering Cost Estimates Using Nanoadditives
Polymer Only Treatment Target Dewatering shear using
Nanoadditive (rpm)
Treatment Goal for Cake Solids
Required Nanoadditive Dosing (%)
RPM Cake Solids Achieved (lb/min)
4200 25.1 lb/min 3900 25.1 0.822.55 (10% less) 1.4
20.1 (20% less) 23600 25.1 1.0
22.55 (10% less) 1.6520.1 (20% less) 2.25
3900 28.3 lb/min 3600 28.3 0.1525.47 (10% less) 0.8522.64 (20% less) 1.60
3300 28.3 0.325.47 (10% less) 122.64 (20% less) 1.8
3600 28.76 lb/min 3300 28.76 0.1525.8 (10% less) 0.5022.9 (20% less) 1

61
9.2 Economic Analyses The electricity use at 4,200, 3,900 and 3,600 rpm determined from the pilot study (Figure 42) was used for determining energy consumption in high, medium and low shear dewatering operations, respectively. Subsequently, economic analyses were performed to compare annual operations and maintenance (O&M) cost for conventional polymer‐only treatment with that of nanoadditive added dewatering. Table 7 shows the various assumptions used in the evaluations.
Table 7: Assumptions Used for Operations Cost Estimates with and without the Use of Nanoadditives
Item Unit Cost Polymer Cost 2 $/lb Polymer Dose for high, medium and low shear operations
20, 15 and 13 lb/dry ton of sludge, respectively
Electricity cost 13 ¢/kWh Electricity use for high, medium and low shear dewatering operations
81.02, 70.9 and 60.75 kWh/MG of wastewater treated, respectively
Nanoadditive dose Details in Table 6 Nanoadditive cost $1.40/lb (Pl. see Section 8, Production planning
report for details) Sludge Disposal Cost $60/wet ton
Table 8 summarizes the annual O&M costs under the current (polymer‐only) operation conditions and the altered operating conditions due to the addition of nanoadditives for dewatering. For each current operating condition a number of alternate operating conditions using nanoadditives were evaluated. These include different centrifuge shears as well as nanoadditives and polymer dosing. The annual electricity use/cost as well as overall operating costs are also provided in this Table.
Table 8: Summary of Economic Evaluation for Nanoadditives-Based Dewatering
Current operating
shear
Proposed shear with
nanoadditive
Electricity Use (kWh/MG)
Target dewatered cake mass production (WT/Day)
Annual operating cost ($)
Dewatering using nano beneficial?
High Shear (4,200 rpm)
Baseline (as is)
81.02 28.85 $780,000 NA
Medium Shear (3,900
rpm)
70.9 (12.5 % Reduction)
28.85 (0% Reduction in
solids)
$746,000 Yes
25.96 (10% $792,000 No

62
Current operating
shear
Proposed shear with
nanoadditive
Electricity Use (kWh/MG)
Target dewatered cake mass production (WT/Day)
Annual operating cost ($)
Dewatering using nano beneficial?
Reduction in solids)
23.08 (20% Reduction in
solids)
$775,000 Yes
Low Shear (3,600 rpm)
60.75 (25 % Reduction)
28.85 (0% Reduction in
solids)
$745,000 Yes
25.96 (10% Reduction in
solids)
$795,000 No
23.08 (20% Reduction in
solids)
$778,000 Yes
Medium Shear (3900 rpm)
Baseline (as is)
70.9 32.61 $830,000 NA
Low Shear (3,600 rpm)
60.75 (12.5 % Reduction)
32.61 (0% Reduction in
solids)
$753,000 Yes
29.35 (10% Reduction in
solids)
$807,000 Yes
26.09 (20% Reduction in
solids)
$793,000 Yes
Low Shear (3,300 rpm)
53.17 (25 % Reduction)
32.61 $751,000 NA
29.35 (10% Reduction in
solids)
$805,000 Yes
26.09 (20% Reduction in
solids)
$795,000 Yes
Low Shear (3600 rpm)
Baseline (as is)
60.75 37.50 $921,000 NA
Low Shear (3,300 rpm)
53.17 (12.5 % Reduction)
37.50 (0% Reduction in
solids)
$836,000 Yes
33.75 (10% $863,000 Yes

63
Current operating
shear
Proposed shear with
nanoadditive
Electricity Use (kWh/MG)
Target dewatered cake mass production (WT/Day)
Annual operating cost ($)
Dewatering using nano beneficial?
Reduction in solids)
30.00 (20% Reduction in
solids)
$819,000 Yes
* - A 10 MGD plant was assumed for this evaluation.
The economic analyses indicated that in many cases operating dewatering units at a lower shear due to the addition of nanoadditives can not only lower electricity use by up to 25 percent, but also will lower the overall O&M cost for the utilities. For example, for a dewatering system operating at high shear conditions (4,200 rpm), performing dewatering at lower shear conditions (3,600 rpm, approximately 25 percent electricity savings), nanoadditive dosing can reduce the overall annual operating cost by up to 4.5 percent. For a dewatering system operating at medium shear conditions (3,900 rpm), performing dewatering at lower shear conditions through nanoadditive dosing can reduce the overall annual operating cost by up to 9.5 percent. In summary, the data indicated that, under the conditions assumed, dewatering using nanoadditives can lower the electricity use as well as overall operating costs for the utilities.
9.3 Energy Conservation Estimates due to the Proposed Application Subsequently, a list of dewatering facilities in California, types of units and treatment capacity was obtained from US EPA CWNS database. While the CWNS database provides information on the type of dewatering device used, it does not provide details on the magnitude of shear used in dewatering or the percent solids achieved in dewatered cake solids. Hence, for the purpose of this study, the following assumptions were made:
• Plants larger than 50 MGD treatment capacity were assumed to have high shear (4,200 rpm equivalent) centrifuge for dewatering
• Plants with 10 to 50 MGD treatment capacity were assumed to have medium shear (3,900 rpm equivalent) centrifuge for dewatering
• Plants with less than 10 MGD treatment capacity were assumed to operate low shear dewatering
• Plants using belt filter press for dewatering were assumed to have low shear dewatering operation
Accordingly, there are 9 treatment plants in California with a total wastewater flow of 1,600 MGD that use high shear centrifuge (Table 9). The number of medium shear installations and flow rate are 15 and 325 MGD, respectively. The number of low shear installations and flow rate are 47 and 225 MGD, respectively. It is possible that, while CWNS database provides a reasonable estimate of mechanical dewatering operations, it does not provide accurate number

64
of installations in California and elsewhere. The list of individual treatment facility and the flow rate are provided in Appendix C.
Table 9: Summary of Dewatering Operations in California WWTPs
Current Dewatering
High Shear Dewatering
Medium Shear Dewatering
Low Shear Dewatering
Proposed Dewatering Shear
Low Shear (3,600 rpm equivalent)
Lower Shear (3,300 rpm equivalent)
Lower Shear (3,300 rpm equivalent)
No. of Facilities 9 15 47 Flow Rate (MGD) 1,600 325 225 Current Energy Use (M KWh/Yr)
56.2 10 5.8
Energy Use After Proposed Application (M KWh/Yr)
42.2 7.4 4.4
Energy Conserved (M KWh/Yr)
14 2.6 1.4
Treatment Cost Reduction ($/Year)
$5.8 Million $2.4 Million $2.3 Million
1. Data from CWNS database
The energy use of these dewatering systems under the current “polymer‐only” operations were estimated using the flow rate provided in the CWNS database and the electricity use estimated during the field demonstration at different shears (Figure 42). Based on the results from the economic analyses, a 25 percent reduction in energy use was applied to each unit due to the incorporation of nanoadditive‐aided dewatering. Note that, the dewatering unit used in the field demonstration at the LACSD facility is a new state of the art unit designed to use lower energy for dewatering. However, dewatering units in many treatment facilities are older models that typically use more energy for operations and so potential energy savings due to nanomaterials addition for these units can actually be significantly higher.
The energy use reduction thus estimated for dewatering in California wastewater treatment plants is a total of about 18 million kWh per year (14 million kWh/yr for those using high shear centrifuges; 2.6 million kWh/yr for medium shear; and 1.4 million kWh/yr for low shear) . Nationally, assuming a three‐fold use as in California, the estimated energy conservation is about 55 million kWh per year. These estimates do not include energy conservation in drinking water treatment plants and that used for subsequent drying of dewatered sludge in many treatment facilities. Assuming a 40 percent electricity conservation due to industrial and drinking water dewatering and wastewater sludge drying operations, the total energy conservation in the United States is about 75 Million kWh per year. Assuming the global market to be about three times the United States market, the global energy conservation due to the proposed application is about 225 million kWh due to nanoadditive aided dewatering.
65
In addition to lowering the energy use the proposed treatment approach will lower the overall treatment cost by a total of $10.5 million per year for wastewater treatment plants in California alone. These reductions are due to reduction in energy use, polymer demand and solids disposal cost. Approximately $5.8 million are from large wastewater treatment plants using high shear centrifuges, $ 2.4 million are from wastewater treatment plants using medium shear centrifuges and another $2.3 million are from wastewater treatment plants using low shear centrifuges for dewatering. The estimated global energy cost savings is approximately $100 million per year.

66
CHAPTER 10: Summary and Recommendations 10.1 Summary
♦ This study demonstrates the use of novel nanomaterials polymer additives to lower energy use for sludge dewatering in wastewater treatment plants. These nanoadditives are designed to enhance the performance of current “polymer‐aided” mechanical dewatering (e.g. centrifuge, belt filter press) processes typically used in WWTPs.
♦ Most of the energy used during sludge treatment occurred due to i) the shear force applied during mechanical dewatering (e.g. centrifuge), ii) energy required to further dry the dewatered cake and iii) organic content from the centrate (dewatered supernatant) when they are returned to the head works.
♦ Los Angeles County Sanitation District (LACSD) wastewater treatment facility at Carson, CA provided sludge for laboratory studies. Subsequent field demonstration was also performed at LACSD.
♦ Initially, twelve different nanoadditives were synthesized and used in screening studies.
♦ Eight nanoadditives were selected from screening studies for subsequent bench scale studies. These additives were tested under a range of conditions for their ability to lower energy use, polymer dose and net mass of cake produced. Ability of nanoadditives to control biosolids odor was also evaluated.
♦ Based on bench scale study test data, one nanoadditive (NM‐17) was selected for field demonstration. NM‐17, at 0.4 percent (of sludge dry solids), lowered dewatered cake solids by 10 to 15 percent, polymer dose by 10 to 25 percent. These benefits were observed at a lower shear operation than that of conventional “polymer‐only” dewatering, which indicated the potential to lower energy use for dewatering. Also, NM‐17 lowered the biosolids odor (Total Volatile Organic Sulfur Compounds) by approximately 60 percent.
♦ Field demonstration was performed at LACSD wastewater treatment plant at Carson, California. An Alfa Laval pilot centrifuge (ALSYS 45) was used. Effect of bowl shear (energy use), polymer dose and mixing time on dewatering efficiency were evaluated. Thirty test runs covering a number of variables were evaluated.
♦ Energy use/conservation during field demonstration was measured by Southern California Edison as part of their Measurement and Verification Plan.
♦ Data from the field demonstration indicated that the proposed technology (adding appropriate nanoadditives) can help lower the energy use of sludge dewatering while lowering the overall sludge treatment cost. For example, the amount of net solids produced at a lower energy (3,600 rpm bowl shear) in the presence of one percent nanoadditive (26.7 lb/min at 50 gpm sludge flow rate) was significantly lower than the

67
achieved at a higher energy operation (3,900 rpm bowl shear; 28.4 lb/min and 50 gpm sludge flow rate). Overall, a 25 percent energy savings is estimated for mechanical sludge dewatering activities. Also, the polymer requirement for dewatering and biosolids odor production decreased by approximately 20 percent in the presence of nanoadditives.
♦ The pilot data was then intra/extrapolated to estimate energy savings using the proposed technology for wastewater treatment plants in California. Treatment plant information was obtained from USEPA Clean Water Needs Survey (CWNS) database. The evaluation indicated an annual conservation of 18 million kWh for dewatering in wastewater treatment plants in California alone. Assuming 40 percent electricity conservation due to industrial and drinking water dewatering and wastewater sludge drying operations, the total energy conservation is about 25 million kWh per year in California.
♦ Nationally, assuming a three‐fold demand compared to California, the estimated energy conservation due to the proposed technology is approximately 75 million kWh. Global estimate for energy conservation is estimated at 225 million kWh.
10.2 Recommendations ♦ The results suggest that the addition of nanoparticles can help improve dewatering.
However, initial screening/bench scale studies had to be performed to identify the characteristics of nanoadditives best suited for dewatering LACSD sludge. Since, sludge characteristics vary significantly among treatment plants, additional studies to understand the relationship and interactions of nanoadditives and sludge can be beneficial.
♦ The time for mixing and reaction of nanoadditives with sludge during the pilot scale (9 and 19 seconds) were significantly lower than that used in the laboratory studies. The lower mixing time in the field occurred due to the requirement of the pilot centrifuge to be operated at a minimum of 50 gpm feed rate instead of the planned 25 gpm. The mixing time had some effect on the efficiency of dewatering operation, including centrate organic content. Hence, additional studies are required to understand and adjust nanoadditive dosing for enhanced dewatering efficiency.

68
GLOSSARY
μm micrometer
ASW ASW Engineering Consultants
CEC California Energy Commission
COD chemical oxygen demand
COGS Cost of Goods Sold
CST capillary suction time
CWNS Clean Water Needs Survey
DMS dimethyl sulfide
DMDS dimethyl disulfide
DS dry solids
FID flame ionization detector
G mean velocity gradient
GC gas chromatography
Gpm gallons per minute
HP Horse Power
HSCSP high solids centrifuge simulation procedure
Kg kilogram
KVA Kilo Watt Ampere
KVAR Kilo Watt Ampere Reactive
kWh Kilo Watt Hour
LACSD Los Angeles County Sanitation District
Lb/Min Pound per Minute
Lb/DT Pound per Dry Ton
L liter
m meter
mg milligram
ml mililiter
MGD million gallons per day
MT methyl mercaptan or methanethiol
M&V measurement and verification
Nanometer nm
NEBRA North East Biosolids and Residuals Association
NTU Nephelometric Turbidity Unit
69
O&M Operations and Maintenance
OPD optimum polymer dose
RPM Rotations per Minute
SCE Southern California Edison
SG&A Selling, General and Administrative Expenses
SRF specific resistance to filtration
t time
TSS total suspended solids
TTF time to filter
TVOSC total volatile organic sulfur compounds (mainly MT and DMS)
USEPA United States Environmental Protection Agency
UV ultraviolet
VOSC volatile organic sulfur compounds
VSS volatile suspended solids
WERF Water Environment Research Foundation
WWTP Wastewater Treatment Plant

70
REFERENCES
1. Adams, G., et al. (2003) Identifying & Controlling Odor in the Municipal Wastewater Environment: Phase II. Water Environment Research Foundation Report No. 00‐HHE‐5, Alexandria, VA.
2. Dixon, L. G.; Field, P. (2004) Proceedings from the Biosolids Research Summit. Water Environment Research Foundation Project Report 03‐HHE‐1; Water Environment Foundation Project Report: Alexandria, Virginia.
3. Smith, D.A. 1995. New York State Energy Research and Development Authority. Contract No. 2034‐ERTER‐MW‐93.
4. Dolak, I., Murthy, S. and Bauer, T. 2001. Proceedings of the WEF Joint Residuals and Biosolids Management Conference.
5. Bechtel, D. 2009. Centrifuge Dewatering Advances. Proceedings of the CWEA Biosolids Dewatering Specialty Conference, Carson, CA, January
6. Kremer, K.S. (2005) Encroachment and Historically Agricultural Areas. J. Appl. Poult. Res. 14:378–386.
7. Higgins, M.J., K. Hamel, Y.C. Chen, S.N. Murthy, E.J. Barben, A. Livadaros, M. Travis, N.A. Maas. (2005) Part II of Field Research: Impact of Centrifuge Torque and Polymer Dose on Odor Production from Anaerobically Digested Biosolids. Proceedings of WEF/AWWA Joint Residuals and Biosolids Management Conference. Nashville, Tennessee.
8. Murthy, S. N.; Higgins, M. J.; Chen, Y. C., Covert, K.; Maas, N. A.; Toffey, W. (2003). The impact of dewatering equipment on odorant production from anaerobically digested biosolids. Proceedings of WEF Annual Conference (WEFTEC03). Los Angeles, California.
9. Kim, H.; Murthy, S. N.; Peot, C.; Ramirez, M.; Strawn, M.; Park, C. H; McConnell, L. L. (2003) Examination of mechanisms for odor compound generation during lime stabilization. Water Environ Res. 75,121‐125.
10. Chen, Y.; Higgins, M. J.; Murthy, S. N.; Maas, N. A.; Covert, K. J.; Toffey, W. E. (2006) Production of odorous indole, skatole, p‐cresol, toluene, styrene, and ethylbenzene in biosolids. J. Residual Sci. Technol. 3, 193‐202.
11. Plache, P. 2009. Polymer Conditioning for Improved Dewaterability. CWEA Biosolids Dewatering Specialty Conference. Carson, CA. 27th January.
12. Higgins, M.J., Y.C. Chen, N.A. Maas, J. Troxell, S.N. Murthy. (2004) WERF Phase 1: Factors affecting conditioning during dewatering: Sludge and Polymer Characteristics. Proceedings of Water Env. Fed. 77th Annual Conf., New Orleans
13. Higgins, M.J., Y.C. Chen, N.A. Maas, J. Troxell, S.N. Murthy. (2004) WERF Phase 1: Factors affecting conditioning during dewatering: Sludge and Polymer Characteristics. Proceedings of Water Env. Fed. 77th Annual Conf., New Orleans
71
14. Bachtel, D. 2009. Reducing Solids Handling and Disposal Cost through Dewatering System Optimization – Centrifuge Dewatering Advances. CWEA Biosolids Dewatering Specialty Conference. Carson, CA. 27th January.
15. Bishop, J. 2006. Water Environment Technology. Special Section: 75‐83.
16. National Nanotechnology Initiative. 2013. www.nano.gov
17. Rolison, D.R. (2003), Catalytic Nanoarchitectures – the Importance of Nothing and the Unimportance of Periodicity. Catalysis. 299: pp. 1698 – 1701.
18. USEPA. 2007. Nanotechnology White Paper. Office of the Science Advisor. EPA 100/B‐07/001 http://www.epa.gov/osainter/pdfs/nanotech/epa‐nanotechnology‐whitepaper‐0207.pdf
19. Jean‐Francois, B. and Begin, B. 1994. Experience of a Microparticle Retention System. Tappi Journal. 77(11): 217‐224.
20. Knudson, M.I. 1993. Bentonite In Paper: The Rest of the Story. Papermakers Conference. TAPPI Proceedings.
21. Andersson, K. et al. 1996. Important Properties of Colloidal Silica in Microparticulate Systems. Nordic Pulp and Paper Research Journal No. 1. Page 15‐21.
22. Tay, J. ad Jayaseelan, S. 1993. Conditioning of Oily Sludges with Municipal Solids Waste Incinerator Fly Ash. Water Science and Technology. 35(8): 231‐ 238.
23. Ganesh, R. 2007. Improving Sludge Dewatering and Conditioning Using Nanomaterials, Southern California Edison. Project Performed for Southern California Edison. Contract # V2047906.
24. Ganesh, S., et al. 2010. Develop Nanoadditives to Improve Dewatering and Control Odor Production from Industrial Sludges. National Science Foundation, SBIR Phase I Study. Contract #. 0945199.
25. Wang, Z.S., Hung, M.T. and Liu, J.C. 2007. Water Science & Technology. 56(8): 125 – 132.
26. Higgins, M.J.; Hamel, K.; Chen, Y.C.; Murthy, S.N.; Barben, E.J.; Livadaros, A.; Travis, M.; Maas, N.A. 2005. Part II of Field Research: Impact of Centrifuge Torque and Polymer Dose on Odor Production from Anaerobically Digested Biosolids. Proceedings of WEF/AWWA Joint Residuals and Biosolids Management Conference. Nashville, Tennessee.
27. Adams, G.M.; Witherspoon, J.R.; Erdal, Z.K.; Forbes, R.H.; Hargreaves, J.R.; Higgins, M.J.; McEwen, D.W.; and Novak, J.T. 2007. Identifying and Controlling the Municipal Wastewater Odor Environment Phase 3: Biosolids Processing Modifications for Cake Odor Reduction. Water Environment Research Foundation, Report No.03‐CTS‐9T, Alexandria, VA.
72
28. American Public Health Association 1998. Standard Methods for Examination of Water and Wastewater; 20th Edition. Eds. Clesceri, L.S.; Greenberg,E.; and A.D. Eaton. American Public Health Association, Washington, D.C.
29. Novak J T and Lynch D P. 1990. The effect of shear on conditioning: Chemical requirements during mechanical sludge dewatering. Wat Sci Tech. Vol 22, No 12, pp. 117 ‐ 124.
30. North, J.M.; Becker, J.G.; Seagren, E.A.; Seagren, M.; Ramirez, M.; Peot, C. 2008. Methods for Quantifying Lime Incorporation into Dewatered Sludge. I: Bench‐Scale Evaluation. J. Envir. Engrg. 134, p. 750.
31. NEI Corporation has an effort underway in this regard, another strategic partnership with K/J.
A‐1
APPENDIX A: Report Of WERF Study (U3r08) To Improve Dewatering From Sludges Other Than LACSD Sludge Pledged As Task 4

B‐1
APPENDIX B: Raw Data Collected For Measurement & Verification by Southern California Edison
C‐1
APPENDIX C: List of California WWTPS Using Mechanical Dewatering for Sludge Treatment