the use of heresthetics on the electoral contexts: do ... · ... is the political strategy with...
TRANSCRIPT

The use of heresthetics on the electoral contexts: do parties
change the dimensionality of their offer for strategic reasons?
Berta Barbet Porta
Paper presented at the ECPR Conference- Working Progress Comments Welcome
Glasgow 2014
As Riker’s concept of heresthetics shows, no good understanding of the electoral dynamics can
be reached without understanding the processes by which new issues appear in the agenda and
the role parties and their strategic considerations have in determining them. However, no big
effort has been made to understand in a comprehensive and dynamic way the process by which
parties change the issues they discuss and the strategic considerations behind them. This paper
does so. First it presents an empirical strategy to measure changes in the issues parties’ discuss
and describes how common are they. Second, it proves that, at least for big western European
parties, being a loser does indeed increase the chances of a party changing the dimensionality of
its offer as Riker’s theory predicted.
In his study about parties’ strategies, Riker (1986) defined a kind of heresthetic move which
consisted in breaking majorities by introducing a new issue that cuts across the existing
alignments, dividing the social support of the electoral winner and, consequently, improving the
situation of the electoral losers. Although other strategies were identified too, change of
dimensionality, as Carmines and Stimson (1989, 7) say, is the political strategy with most
permanent and radical results, as it is the only strategy that can radically reshape the situation.
However, none of the existing theories have successfully incorporated changes of issues in its
study (Barbet-Porta 2013). They have whether ignored the problem and taken issues as
exogenously determined, as spatial or sociological theories (Downs 1957; Adams, Merrill, and
Grofman 2005) have; or have taken too simplistic conceptions of how issues work which do not
consider how voters and parties make sense of the issues neither the role of context on defining
such strategic considerations, as directional or ownership theories (Rabinowitz and MacDonald
1989; Petrocik 1996).
The study of heresthetic strategies should help to shed light on the understanding of electoral
behaviour and can work as a complement for the existing theories of party competition.
Nonetheless, in the electoral context, the study of heresthetics has been limited to the study of
the alteration of rules of the game such as electoral law (Kaminski 2002; Stoll 2011), or, when
focused on the manipulation of dimensions, on the analysis of case studies in which changes in

the dimensions of competition are studied separately and without considering counterfactual
cases that would help to understand which was the actual role that parties have in shaping the
situations (McLean 2001; Nagel 1993; Tzelgov 2012; Dellepiane-Avellaneda 2012; Heppell
2013; Edwards 2004). There has not been, to the extent of my knowledge, any attempt to study
heresthetic moves in a comparative and extensive way. Hence we do not much about them yet.
This paper is a first step in the study of change of dimensionality as heresthetic devices in the
electoral context. It starts with a brief description of heresthetics’ theory and the hypothesis that
can be derived from it. Then it moves to the measurement strategy and a description of the main
figures of the dependent variable. Finally, it proves that strategic reasons do indeed play a role
in explaining those changes, at least for the cases studied here.
1. Heresthetic moves and electoral strategies
Riker described heresthetics as an art not a science. Opportunities to reshape situations in a way
that improves chances to win can arise from different sources and in different ways, so
heresthetic moves can be very varied and unexpected. However, in order to develop a theory
about heresthetics, we need to define a concrete concept of the heresthetic manoeuvre that
allows for empirical analysis. Here, a heresthetic move will be defined as an increase of the
saliency attached to a new issue or conflict in the electoral arena made by one party. Or more
specifically, the decision by one party to change the importance attached to a conflict, giving it
enough saliency to make it relevant for the vote (Netjes and Binnema 2007, 40).
There is nothing in Riker’s definition of heresthetics that implies that herestheticians are
introducing the issue out of the nothing without taking into consideration public’s concerns. For
example, it would be really hard to assume that Lincoln himself brought about public concern
with slavery (Riker 1986, 1–10). However, we do need to differentiate active, strategic,
heresthetic moves made by parties from their responses to external pressures. Showing that
parties change the issues they discuss is not enough proof of heresthetic moves existing, as they
might do so just because the context changes and they need to adapt to it, without any further
intention than that. In order to prove that parties do indeed attempt to perform heresthetic moves
we need to prove that strategic reasons play a role in explaining those changes.
In that line and according to Riker there are two strategic actions in terms of manipulating the
dimensions of the election. If the politician or heresthetician expects to win with the existing
dimensions, he has to fix the dimensionality avoiding a new dimension to appear and divide
his/her existing majority (Riker 1986, 66–76). Alternatively, if the heresthetician expects to lose
under the existing dimensions of the election, he has to try to increase dimensionality (Riker
1986, 1–9). That is, he has to try to include a new dimension, or issue, and link it to the
decision.
Hence, we can predict parties that are losers on the existing dimension of conflict to be the ones
more inclined to reshape the arena. According to spatial models (Downs 1957), in order to win
parties need to be close to the mean voter on the dimension. Consequently, parties further away
from the mean voter on the main dimension of conflict should be losers on the election, giving
them an incentive to reshape the situation and introduce new issues that could break the
dimensions in order to win. Consequently we can predict that:
H1: The further away a party is from the mean position on the dominant dimension the party
is, the more likely it will be to introduce new issues on the debate.
That effect will probably vary depending on the parties’ situation. For example, if the goal of
parties is to win votes to win votes, it seems likely that those that are losing votes will be more
inclined to engage in electoral strategies to improve their situation (Janda et al. 1995).
Consequently, Hypothesis’ one effect will be moderated by the electoral performance of the
party at the election.
H2: the bigger the lost in share of vote a party suffers, the more likely it will be to introduce
new issues on the debate.
Furthermore we can expect the two measures to complement each other. In a way that, the more
the two are present the more clear it would be for the party leaders that they are cannot win in
the existing scenario and, hence, that they should try to redefine it. At the end, the more
radically negative the situation is for a party, the more likely it will have big incentives to
change it. Hence, as Amat (2013) predicted
H3: The bigger the lost in share of vote a party suffers, the bigger the impact of the distance
to the mean voter.
Finally, we know from previous research that not all parties care about being close to the mean
voter (T. M. Meyer and Wagner 2013; Adams et al. 2006). Small and niche parties do not
incentives to seek for the mean voter in their strategies. As small parties’ appeals are usually not
directed to the overall population but to a small public. That would mean that, for those parties
being far away from the mean voters should not have the same impact as for mainstream ones.
H4: hypothesis 1 to 3 only apply to mainstream and big parties but not to traditionally small
and niche ones.
2. Measuring the dimensionality of parties’ offer
2.1. Sources of party’s strategies
As Benoit and Laver say, we cannot directly observe parties’ strategies which means that we
need to focus on its manifestations or second-hand sources (2006, 89). From all the possibilities
the Comparative Manifestos Project (CMP) data has been chosen as the best data to measure
parties’ strategies. The CMP is a project that attempts to code the policy preferences of every
relevant party in the countries of study (Werner, Lacewell, and Volkens 2011). In order to do so,
they focus on the content of the different party manifestos or “text issued by political actors on
the occasion of elections in order to raise internal and/or external support” (Werner, Lacewell,
and Volkens 2011). As their focus of party preferences is based on issue saliency theories, the
codification of the content is based on the number of quasi-sentences that the manifestos place
dedicate to a set of predefined categories(Werner, Lacewell, and Volkens 2011). The data
source provides estimates for about 50 countries over the last 60 years (Thomas M. Meyer 2013,
29), hence is an extraordinary source in terms of temporal and cross-sectional coverage.
That approach to the study of manifestos makes it particularly suitable for the study of changes
in saliency of this project. The data source has been consistently coded in an extensive number
of countries and during a long period of time which allows for good and reliable comparative
work. As Geminis claims “The CMP is a unique and potentially valuable source of data on
political parties” (2013, 18). Not only that, the fact that coding scheme is constant across time
and space implies that the measure can be confidently assumed to be comparable (Thomas M.
Meyer 2013, 33) and that the meanings of the measure are clear and constant across all
observations (Budge 2000 cited in Stoll 2004, 36). Besides, despite the limitations, they have
been proved to be a valid measure of parties’ issues’ saliency as they correlate quite well with
voters’ perceptions, and more importantly, it seems to come from the same construct as other
related measures (Netjes and Binnema 2007, 42–47). Furthermore, they are a good measure in
terms of strategic saliency, at least in terms of face-validity. As Marks and his colleagues said,
“Manifestos are strategic documents designed to put a party in a positive light during an
electoral campaign. Manifestos are therefore unlikely to provide information that is tactically
unimportant or an electoral liability” (Marks et al. 2007, 26–27).
Beyond those already identified (Gemenis 2013), parties’ manifestos present another important
limitation very relevant for the study of heresthetics: they are only released when the election
comes, hence they do not provide information about what happens between elections. They are
then, not useful to understand the moment when the party started to emphasize the issue and
whether or not it might have been a response to an external event. That characteristic implies
that only moves that are successfully sustained until an election will be analysed. Hence the
most unsuccessful moves, those parties quickly dismiss because they are not catching voters’
attention, will be missed. The purpose of a heresthetic move is to reshape the electoral scenario;
hence, it makes sense to focus, at least for now, on the electoral context. However, that focus on
heresthetics moves that are sustained until election moves might be problematic when analysing
the impact of those moves on voters’ behaviour, as its likely that moves that are sustain by until

election are different than those that are not sustained, and hence problems of selection bias
might arise (Heckman 1979). That is, is probable that by analysing only those moves that are
performed at election we are only focusing on moves that are more likely to succeed and hence
our estimators will be biased. However, for purpose of space, scope and data, that is a limitation
that can only be acknowledge but not solved in this project.
From all the cases available at the CMP data source, the selection of cases is limited to Western
Europe for several reasons. Europe presents the opportunity to study cases that are
geographically, economically and institutionally close which means that external shocks should
be usually similar, while, at the same time, have very different internal dynamics and clearly
differentiated political systems. Besides, West-Europe presents a nice combination of a stable
and durable context with competitive democracies which means comparatively stable political
parties with enough stability at the system (Litton 2013) to be able to distinguish stability from
change.
From those, Malta and Cyprus have been discarded due to the small temporal duration of their
data period for the CMP. Also Italy has been dropped as previous studies have shown that CMP
data does not capture Italian political dynamics properly (Pelizzo 2003 cited in Thomas M.
Meyer 2013, 136).
Furthermore, as the analysis here is on how issues of the electoral offer change, we need to take
into account that in some of these countries, not all citizens are offered the same political offer.
First, Belgium has a clearly separated political system in the two regions; political parties in the
Flemish and Walloon part have independent manifestos and hence might be presenting a
different offer to their citizens. For that reason Belgian parties have been divided into two party
systems: Flemish Wallonia1 and French Flanders
2 (Deschouwer 2009). Parties that run in the
two constituencies3, back on the early years have been added to both party systems.
Also Great Britain and Spain have regionally specific parties that can only be voted by citizens
of some regions. The problem is that in those cases, parties have not been systematically
1 FDF Francophone Democratic Front, PSC Christian Social Party, RW Walloon Rally , PLP Party of
Liberty and Progress, PL Liberal Party, PLDP Liberal Democratic and Pluralist Party, PRLW
Francophone Liberals, ECOLO Francophone Ecologists, PS Francophone Socialist Party, PRL
Francophone Liberals, PRL-FDF Liberals - Francophone Democratic Front, PRL-FDF-MCC Liberals -
Democratic Front - Citizens' Movement , cdH Humanist Democratic Centre 2 Flemish Christian People's Union, CVP Christian People's Party, PVV Party of Liberty and Progress ,
PL Liberal Party, BSP Flemish Socialist Party, VB Flemish Bloc, AGALEV Live Differently, SP Flemish
Socialist Party VU People's Union, VLD Flemish Liberals and Democrats, VU-ID21 People's Union-
ID21, N-VA New Flemish Alliance, Green!, Socialist Party Different – Spirit, Social, Progressive,
International, Regionalist, Integrally Democratic and Forward-Looking , Open Flemish Liberals and
Democrats ,List Dedecker, Flemish Interest. 3 BSP/PSB Socialist Party, LP/PL Liberal Party , PSC/CVP Christian Social/Christian People's Party ,
BSP/PSB Socialist Party, LP/PL Liberal Party, PVV/PLP Party of Liberty and Progress, PLDP Liberal
Democratic and Pluralist Party
included on the data; hence it is hard know whether changes observed are due to real changes in
the strategies or to changes on the decision to include or exclude parties by the researchers.
Considering all these limitation is better not to consider those regional systems.
Summing up, countries included on the analysis are Sweden, Denmark, Belgium-Wallonia,
Belgium-Flanders, Netherlands, Luxembourg, France, Spain, Greece, Portugal, Germany,
Austria, Great Britain, Switzerland, Norway, Iceland and Finland
2.2. The Specification of issues
As it has been said, a heresthetic move is the introduction of a new conflict that cross-cuts the
existing alliances. The problem is that, as Stoll says:
“individuals can be divided by criteria ranging from their favourite colour to their shoe
size to their taste in alcohol to their desire to engage in trade with other countries, ad
nauseam”. (Stoll 2004, 40)
In other words, conflicts might arise from very different places, and listing all possible conflicts
that might be used, is a controversial process as the number of ways in which a population can
be divided is almost infinite. Even the most limited characteristic of an issue might be used to
perform a heresthetic move (Tzelgov 2012) . As Stoll says, listing dimensions of conflict before
starting the analysis means incorrectly seeing conflicts as exogenous to the political system.
However, in order to analyse in a quantitative and systematic way if conflicts of the electoral
decision change, it is necessary to establish a list of possible conflict that may appear. As Stoll
herself recognizes later, this is the only possible option, as endogenizing them is very
problematic (Stoll 2004, 56)..
Consequently, if we want to proceed we need to define issues in a way that not only allows us to
analyse heresthetic moves but also that can be done using CMP data, (Stoll 2004, 91). That
does not mean, nonetheless, that only the issues identified can be used as heresthetic tools.
Luckily, several attempts have already been made to group CMP categories into dimensions of
conflict (Bäck, Debus, and Dumont 2011; Stoll 2011; Stoll 2010). From all the proposed
frameworks those with detailed issue specifications have been preferred because, as happens
with Stoll’s study (2004, 94–104), if the dimensions are too broad, some of the categories might
have to be changed depending on the time period, something that should be avoided as those
changes could also be interpreted as heresthetics. In that sense, both König Marbach and
Mortiz’s (2013) and Lowe and his colleagues (2011, 136) focus precisely on how the meaning
of the dimension might change by using very detailed issues specification. Their specifications
will be used as a basis from the analysis here.

Categories included in both articles4 will be included. From the others, those that have a clear
meaning have been included too5. In the cases when the specification of categories was
different, the specification that had greater measurement validity has been chosen6
(see
appendix section 1 for validity test results). That leaves in total 16 categories that are
summarized in table 1.
Two variables are defined by each category, one relating to the space dedicated to the issue
capturing the overall emphasis put on it in the manifesto; the second one capturing the position
taken by the party on the issue and calculated using the difference between sentences in the
categories at the defined two ends of the dimensions. Previous research has shown that the
CMP data are not good at capturing positions (Dinas and Gemenis 2009; Laver, Benoit, and
Garry 2003; Benoit and Laver 2007; Gabel and Huber 2000). However, that literature usually
refers to the ability of the CMP data to capture the overall left-right dimension. One of the
causes of that difficulty arises from the fact that the meaning of left-right dimension might
change across countries and time (König, Marbach, and Osnabrügge 2013). Hence, the fact that
the categories here are limited to specific conflicts instead of overall dimensions should make it
easier to capture position validly. Position variables will be divided by the overall attention the
issue receives (or emphasis’ measure). As Meyer proposes (2013, 40) that step is a good way to
deal with the problem arisen due to the fact that if an issues occupies a lot of sentences of the
manifesto, a difference in the number of sentences gives less information, than if the issue does
not occupy a lot of space (Lowe et al. 2011). As some of the issues might have an emphasis
lower than 1, the value in the denominator (emphasis) has been transformed by adding 1. That
way none of the denominators is lower than 1 and hence, the operations can be done without
problems.
4 European Integration (Per108-Per110), Protectionism (per406-per407), Macro-Economics (per409-
per414 named Keynesian policy in Lowe et alt’s document but containing the same categories),
Traditional Morality (per603-per604), Multiculturalism (per607-per608), Nationalism (per601-per602
national way of life in König et al’s articles), Internationalism (per107-per109) and Militarism (per104-
per105). 5 Education spending, decentralization, constitutionalism, labour groups, freedom and quality of have
been added too. The categories special foreign alliances and administration have no clear meaning, at
least from a comparative point of view, so they have been discarded. Also Target Groups has not been
included. The reason for this is that, using Rae and Taylor’s categorization of conflicts, target groups,
would be an ascriptive or trait based cleavage, concretely based on socioeconomic status, while the rest of
the cleavages are attitudinal or opinion cleavages (cited in Maor 1997, 20). Although the relationship
between the two types of cleavage might be relevant, is better not to confound them and for that reason it
has been decided to leave it outside. 6 In the case of market and enterprise dimensions, the categories are clearly closely related to whether or
not the market should be regulated hence it makes no sense to differentiate them as the difference
between the two would be very small, so they have been added up to a category named market and
enterprise. The category social justice will be added to the measurement of the welfare dimension, as
Lowe and his colleagues did, because validity tests have shown this is a better measure. Also for reasons
of validity, the category democracy (per202) has been removed from the dimension freedom.

Table 1: Issue Specification List
Category Name CMP Categories
1- European
Integration
Emphasis Measure: per108 European community/union positive, per110
European community/union negative
Position Measure: per108-per110
2-Education
Spending
Emphasis Measure: per506 education expansion, per507 education
limitation
Position Measure: per506-per507
3-Welfare State
Emphasis Measure: per503 social justice, per504 welfare state expansion,
per505 welfare state limitation,
Position Measure: per503+per504 -per505
4-Protectionism
Emphasis Measure: per406 protectionism positive, per407 protectionism
negative
Position Measure: per406- per407
5-Macro
Economics
Emphasis Measure: per409 Keynesian demand management, per414
economic orthodoxy
Position Measure: per409 -per414
6-Market and
enterprise
Emphasis Measure: per401 free enterprise, per412 controlled economy,
per413 nationalisation, per402 incentives, per403 market regulation
Position Measure: per413+per412+per403-per401- per402
7-Labour groups
Emphasis Measure: per701 labour groups positive, per702 labour groups
negative
Position Measure: per701-per702
8-Freedom
Emphasis Measure: per605 law and order, per201 freedom and human
rights
Position Measure: per201 -per605
9-Traditional
morality
Emphasis Measure: per603 traditional morality positive, per604 traditional
morality negative
Position Measure: per604-per603
10-
Multiculturalism
Emphasis Measure: per607 multiculturalism positive , per608
multiculturalism negative
Position Measure: per607 - per608
11-National way
of life
Emphasis Measure: per601 national way of life positive per602 national
way of life negative
Position Measure: per602- per601
12-
Internationalism
Emphasis Measure: per107 internationalism positive, per109
internationalism negative
Position Measure: per109- per107
13-Military
Emphasis Measure: per104 military positive, per105 military negative,
per106 peace
Position Measure: per105+ per106- per104
14-Quality of life
Emphasis Measure: per416 anti-growth economy, per410 Productivity,
per501 environmental protection
Position Measure: per416+ per501- per410
15-
Decentralization
Emphasis Measure: per301 Decentralization, per302 centralization
Position Measure: per301-per302
16-
Constitutionalism
Emphasis Measure: per203 constitutionalism positive per204
constitutionalism negative
Position Measure: per204- per203

2.3. The measure of conflict saliency
Netjes and Binnema say, define saliency “as the extent to which the party leadership considers
an issue as vital for its electoral appeal” (2007, 40). In this sense, the first thing that needs to be
considered when trying to measure the saliency attached to an issue is the space dedicated to it.
As Stoll says,
“The more space in its manifesto that a party devotes to discussing issues related to an
ideological cleavage, the more salient the cleavage to the party. Similarly, the more
space devoted by all parties in their manifestos for a given election to an ideological
cleavage, the more salient the cleavage in the polity at that period in time” (Stoll 2004,
94).
Hence the number of claims dedicated to an issue compared to the overall number of claims
made by the party will be used as the basis of the measure. As the CMP data is already coded in
relative terms, no transformation of the saliency measure is needed and the emphasis that the
party attaches to an issue will be measured using the sum of all the sentences dedicated to it in
comparison with the total number of sentences, which is equivalent to the emphasis measure on
the previous section. The emphasis an issue receives in a manifesto will be expressed as .
However, the overall emphasis an issue receives is an incomplete measure of saliency. In order
for an issue to be salient and determine the voting decision, we should not only be concerned
with emphasis, but also “with the extent to which it creates (potential) conflict” (Netjes and
Binnema 2007, 40). Hence, the level of polarization that a party creates, , should be also seen
as a necessary for a party to give more importance to that issue (Ginsberg 1972, 611–614).
The level of conflict is measured as the distance between the party’s position on the conflict and
the position of other parties. Hence, the measure of other parties’ position will be similar to that
used by de Vries and Hobolt (2012) in their study about issue entrepreneurship which basically
computes the distance between the parties’ position and the weighted mean position of all the
other parties in the system. It is important to notice that with this measure a party could be
perceived to have made a movement to create conflict on a dimension even if the party has
stayed at the same place but the weighted mean position has moved. That would not be a big
problem if the weighted mean had move because the rest of the parties had move and the party
of study had not, it is also a way of create conflict not to move when everyone else seems to be
moving probably due to external causes. The measure is standardized to its absolute value as the
direction of the difference is not relevant for the measure. Summing up, the level of polarization
a party is creating around an issue is defined by:

Where, is the position defended by party j and is an adjusted weighted mean that does not
include party j. That is, is the mean position of all the parties in the system but the one
considered in that particular time, also expressed as:
∑
Where, , is the weight given to party measured by its electoral share or percentage of vote in
the previous two elections. Weighting the mean position by the electoral strength of the party
takes account of the fact that not all the parties of the system have the same importance and that
taking a different position from the small parties does not have the same effect as taking a
different position from the big ones. Taking the vote share at the previous elections is justified
based on the idea that the previous election is actually the one that set the scenario where the
parties are interacting when the election approach. The decision of taking two electoral periods
instead of just one avoids very contextual specific swings of votes to have an effect. The
weights are adjusted so that the sum of weights of the first part of the equation is always equal
to 1.
To calculate the overall saliency an issue receives in a particular election, de Vries and Hobolt
(2012) use the result of the interaction between saliency and polarization. This measure has the
problem that if an issue has very low polarization, because most of the parties are mainly
ignoring it, the saliency is very low. In a multiplication, if one of the measures is zero or close
to zero, the result of the interaction will be zero or close to this. That seems unfortunate as
probably the party will be trying to give a lot of saliency to the issue and will be probably be
giving visibility to the conflict, even if not that much with the other parties’ position at least in
terms of priorities (Egan 2013).7 For that reason it has been assumed that it is better to combine
the two measures by simply adding them, instead of multiplying them. In that way, creating
conflict is just another way to increase the attention an issue receives. Furthermore, validity
measures seem to show that the additive measure might indeed work slightly better than the
multiplicative one (see appendix).
Summing up, the overall measure of dimension’s saliency of the system will be equal to:
3. Do parties change the dimensionality of their electoral offer?
3.1. Defining dimensionality’s change
7 Thanks to Ignacio Jurado for pointing to that issue

Once we have developed a good measure of how much salience parties give to the different
conflicts we can develop a measure of when this saliency changes and a heresthetic move is
potentially made.
Here it will be considered that a party has changed the emphasis on a particular conflict if there
is a change in the rank order it has. A change in rank might take place for two reasons. First, and
most obvious, an issue that was receiving some attention at previous elections becomes more
relevant at the current one, surpassing the saliency other issues had and changing its rank order.
However, a second type of change of rank could be conceived which deals with the entrance of
issues that were not on the agenda at the previous election and that are introduce in it. In order
to take that into consideration we need to have a definition of what it means for an issue to be
on the agenda. Of course we could think that any issue mentioned on the manifesto is on the
parties’ agenda and hence assume that only not mentioned issues are not on it. However that
conception would not take into account that the capacity of the agenda is limited and that not all
issues that are mentioned can be considered to be on it. Only those that receive enough attention
to reach people’s attention should be.
Determining how many dimensions are relevant is not easy though. Several approaches have
been developed, most of them based on Laakso and Taagepera’s measure of relevant parties
(1979). The problem of those measures is that they try to capture an overall number that
describes the system in a condensed way. However, the intention here is not so much to
describe the system as to determine whether or not the different issues or conflicts are
emphasized enough to be able to have an impact. For that reason, the number of conflicts will
be defined with a formula inspired in Stoll’s adaptation of Lijphart’s measure (Stoll 2004, 106–
107). They define the impact of a dimension based on the ratio of salience as compared with the
most emphasized conflict.
Where is, once again, the salience of issue s in a particular manifesto and is the salience
that the most salient, or dominant, conflict of the manifesto receives (Stoll 2004, 107). This
approach has the advantage that if one issue is overwhelmingly emphasized and hence receives
a lot of attention, then very few issues will also be able to be relevant on the agenda as the
debate will probably focus massively on the most emphasized issue. By contrast, in cases where
none of the issues clearly stand out, secondary conflicts have the opportunity of having an
impact and more issues can be considered. Stoll’s definition of the measure defines two
thresholds. First, for conflicts with a ratio of salience between 2/3 and 1, the value is 1. Second,
those whose ratio falls between 1/3 and 2/3 the value is 0.5, leaving those whose ratio falls

below 1/3 are equal to 0. Here, however, a two-step definition is problematic, as we need a
clearer conception distinguishing whether or not an issues has been introduced at the agenda. As
we are looking for issues that are salient enough to reshape the situation and it makes sense to
set a high threshold, so only issues with ratios equal or bigger to ⁄ will be considered to
receive attention by the party.
In order to avoid confounding noise typical of any data source with real changes of rank some
margin of error needs to be defined. Otherwise very small changes in variables very close to the
threshold or to another variable may make it look as though there has been a radical change in
the dimensionality when actually they are only responding to normal variation with little or no
substantive meaning. Hence, in order to consider that a variable has changed its ranked
effectively, it will be necessary, in addition to the observed change of rank, that it has increased
its saliency at least more than 0.5 points, or that the threshold has drop at least 0.5 points,
ensuring that the change is big enough to be meaningful.
3.2. How common are changes of dimensionality?
Once the measurement is clear, the first question that needs to be answered is whether parties’
offer changes in terms of the conflicts to which they give saliency. And the answer is a clear
yes. The data show up to 1250 cases of changes in the saliency parties attach to conflicts from
one election to the other. Even taking into account only the number of manifestos that include
changes of saliency (some manifestos include more than one change of saliency) we find 810
cases. So changes on the issues parties discuss are very common among western European
parties.
The percentage of manifestos that include changes varies depending on the country. For
example as graph 1 shows countries like Norway, Denmark and Great Britain have the highest
rates of moves by manifesto, with more than 60% per of the manifestos containing at least some
change in the relevant issues. While in Wallonia and the Netherlands we observe changes in less
than 50% of the manifestos (44,2% and 48,94% respectively). There does not seem to be a clear
pattern that explains those differences at first glance.

In terms of the issues entered, graph 2 shows that traditional economic conflicts around market
regulation and welfare state development have a very high number of changes in their
importance. This is probably due to the fact that they are almost always on the agenda, but do
not always have the same importance which means that their rank changes very often, while
other issues might just see their rank changed in the rare occasions when they are included on
the agenda. Issues linked to what Inglehart (1971) called the postmaterialist conflict, such as
Quality of life or freedom, are among the most commonly susceptible to being introduced on
the agenda too. Less numerous, but also relatively common are changes in the importance of
other economic conflicts such as education spending, macro-economy or labour groups, and
around conflicts related to international relations such as militarism, internationalism and the
European Integration process. On the other hand, the importance of protectionism,
constitutionalism or national way of life does change very often. It is important to notice here,
that changes are only counted when the dimension is gaining saliency not when losing it. So
whether or not the change is punctual or relatively permanent is not considered.
0,2
,4,6
,8
me
an
of
he
resth
eticsu
m
Swed
en
Nor
way
Den
mar
k
Finland
Icelan
d
Net
herla
nds
Luxe
mbo
urg
Franc
e
Spa
in
Gre
ece
Por
tuga
l
Ger
man
y
Aus
tria
Switz
erland
Gre
at B
ritain
Ireland
Belgium
-Fland
ers
Belgium
-Wallonia
Graph 1: Average number of moves by country

3.3. The strength of the changes
Considering the high number of moves observed it could be interesting to analyse the strength
of the changes as they might vary greatly in terms of their size and impact.
0
100
200
300
Graph 2: Number of moves by issue
European Union Education Spending Welfare State
Protectionism Macro Economics Market and enterprise
Labour groups Freedom Traditional morality
Multiculturalism National way of life Internationalism
Military Quality of life Decentralization
Constitutionalism
02
04
06
08
01
00
perc
en
t
Eur
opea
n Union
Edu
catio
n Spe
nding
Welfa
re S
tate
Pro
tectionism
Mac
ro E
cono
mics
Mar
ket a
nd e
nter
prise
Labo
ur g
roup
s
Freed
om
Traditio
nal m
orality
Multic
ultu
ralis
m
Nat
iona
l way
of life
Inte
rnat
iona
lism
Milit
ary
Qua
lity of
life
Dec
entra
lizat
ion
Con
stitu
tiona
lism
Graph 3: Previous Status of the issues used
Issue was not included on the agenda at the previous election
Issue had some space on the agenda at the previous election but not enough to be relevant
Issue was already relevant at the previous election
For example, as mentioned before there are two types of changes analysed here: those that
imply a change in rank among already relevant issues, and those that imply the introduction of a
brand new issue in the agenda. As the graph 3 shows, radical changes from issues moving from
not even mentioned in the manifesto to being relevant are not common hence most of the
change takes place between already mentioned issues.
As expectable, there is a set of issues that very often just change their rank among relevant but
almost never fall below the threshold of relevance, like market and enterprise, welfare state,
quality of life or freedom. On the other hand, issues like protectionism and constitutionalism,
have an important percentage of cases where a drastic change happens and the conflict goes
from not even being mentioned to being relevant from one election to the other (it is important
to remember, however, that number of observations in that case is very low). Also conflicts
related to identity or moral conflicts such as the multiculturalism and national way of life have a
higher percentage of drastic changes than the rest. However,
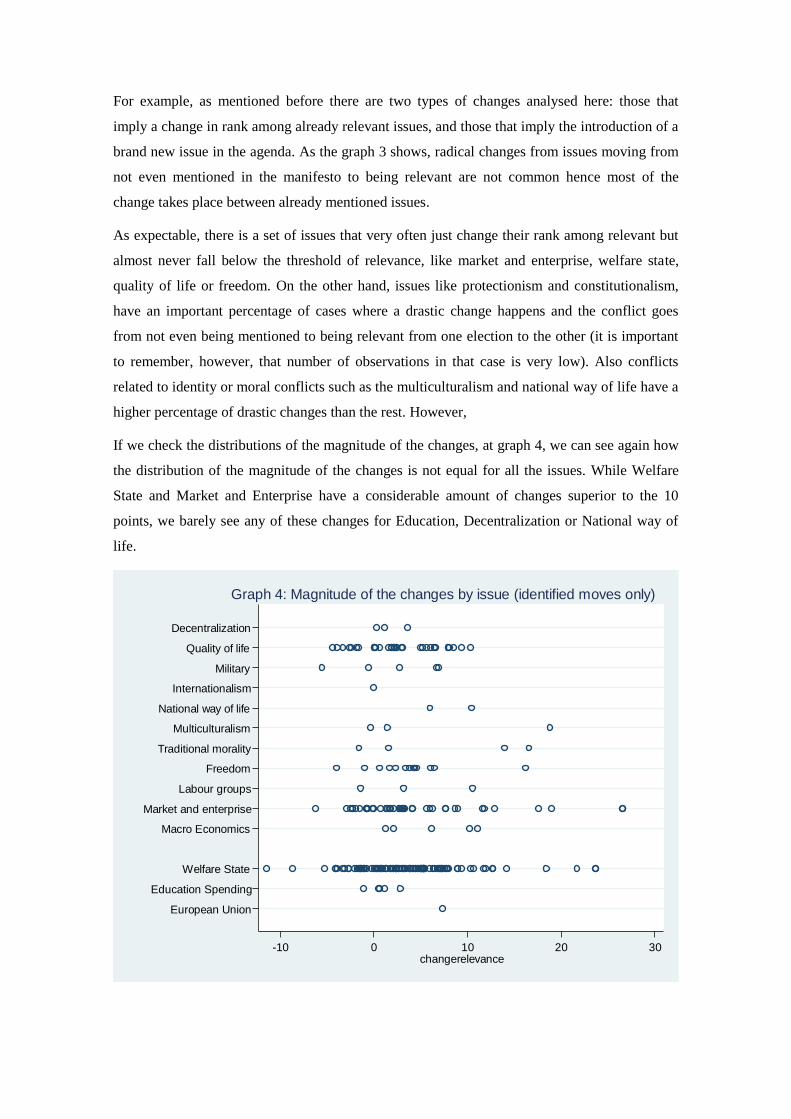
If we check the distributions of the magnitude of the changes, at graph 4, we can see again how
the distribution of the magnitude of the changes is not equal for all the issues. While Welfare
State and Market and Enterprise have a considerable amount of changes superior to the 10
points, we barely see any of these changes for Education, Decentralization or National way of
life.
European Union
Education Spending
Welfare State
Macro Economics
Market and enterprise
Labour groups
Freedom
Traditional morality
Multiculturalism
National way of life
Internationalism
Military
Quality of life
Decentralization
issue
-10 0 10 20 30changerelevance
Graph 4: Magnitude of the changes by issue (identified moves only)
Some of the changes on dimensionality observed imply actually very small changes on the
overall attention that the issue receives, negative even. That is due to the fact that in some cases
the change might be due to a considerable lowering of the threshold of attention which leaves
space for new issues to appear even without any increase on the saliency they receives.
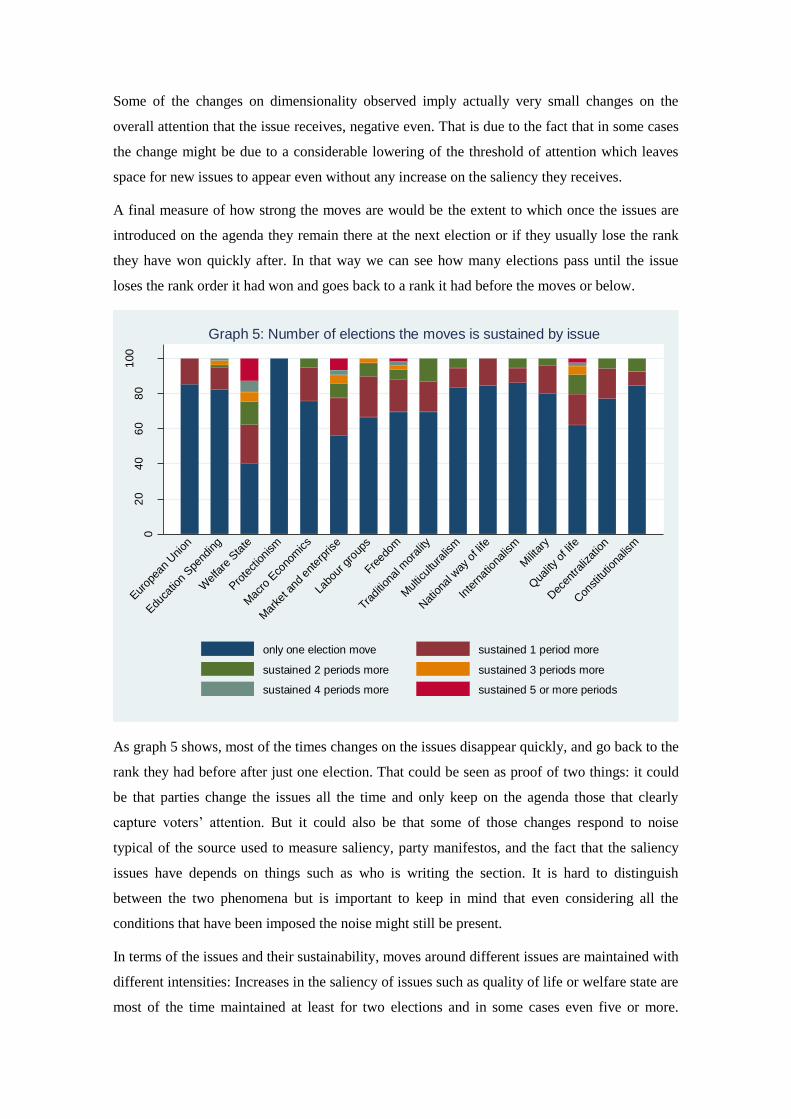
A final measure of how strong the moves are would be the extent to which once the issues are
introduced on the agenda they remain there at the next election or if they usually lose the rank
they have won quickly after. In that way we can see how many elections pass until the issue
loses the rank order it had won and goes back to a rank it had before the moves or below.
As graph 5 shows, most of the times changes on the issues disappear quickly, and go back to the
rank they had before after just one election. That could be seen as proof of two things: it could
be that parties change the issues all the time and only keep on the agenda those that clearly
capture voters’ attention. But it could also be that some of those changes respond to noise
typical of the source used to measure saliency, party manifestos, and the fact that the saliency
issues have depends on things such as who is writing the section. It is hard to distinguish
between the two phenomena but is important to keep in mind that even considering all the
conditions that have been imposed the noise might still be present.
In terms of the issues and their sustainability, moves around different issues are maintained with
different intensities: Increases in the saliency of issues such as quality of life or welfare state are
most of the time maintained at least for two elections and in some cases even five or more.
02
04
06
08
01
00
perc
en
t
Eur
opea
n Union
Edu
catio
n Spe
nding
Welfa
re S
tate
Pro
tectionism
Mac
ro E
cono
mics
Mar
ket a
nd e
nter
prise
Labo
ur g
roup
s
Freed
om
Traditio
nal m
orality
Multic
ultu
ralis
m
Nat
iona
l way
of life
Inte
rnat
iona
lism
Milit
ary
Qua
lity of
life
Dec
entra
lizat
ion
Con
stitu
tiona
lism
Graph 5: Number of elections the moves is sustained by issue
only one election move sustained 1 period more
sustained 2 periods more sustained 3 periods more
sustained 4 periods more sustained 5 or more periods

Contrary, issues like European Integration or the constitution usually disappear after one
election, two at the most.
4. The strategic component of the changes
In order to test whether those changes are explained by strategic reasons, all the changes
observed in the previous section have been collapsed into a dummy variable that measures
whether or not there has been a change in the issues discussed by the party in that election.
Collapsing the issues in one single measure is necessary, in order to avoid confounding the
decision by a party to introduce another issue, from the 15 possible, to the agenda, with a lack of
changes on the parties’ offer and hence a lack of responsiveness of the party to its strategic
incentives. The dummy variable will be the dependent variable to be explained by the model.
As the dependent is constructed using the difference between issues discussed at two different
elections, which means that captures the difference between one period and the previous. Hence
a first-differences logistic model has been chosen. Those models regress changes on the panel
data instead of absolute values avoiding, in that way, the problems typical of regular estimators
on panel data (Wooldridge 2008, 445–70). In order to do so, the independent variable of
distance to the mean and electoral performances must also be recoded into the difference
between one year and the previous.
The electoral performance has been calculated by the difference in percentage of vote that the
party had at the previous election as provided by the CMP data. Hence, the difference between
the percentage of vote at the previous election and the percentage of vote two elections before
has been computed. The measures are lagged, that is the measure taken is the one from the
previous election, because the expectation is that the results that will affect parties’ strategies
are those from the previous election and not from the one that has not yet happened when the
parties define its strategy. Furthermore that also helps to avoid endogeneity and prove causality,
as is very unlikely that the issues that manifesto dimensionality at the previous election affects
the electoral performance of the party several years before or that there is anything affecting the
two elements.
Measuring the distance between the mean voter and the party at the previous elections’ main
dimension of conflict is less straightforward. First a measure of dominant dimension of conflict
on the previous election has to be defined. Here, it will be assumed that the structure of the
debate is structured by the parties and that the debate at the political arena is nothing more than
the sum of parties’ behaviours. In that way and following the logic applied to the measurement
of parties’ saliencies, the saliency a conflict has at an election will be the result of the
multiplication of the emphasis and the polarization parties give to it. Here the two indicators
will indeed be multiplied as, at the system level, it makes sense to assume that, without conflict

between parties, it is impossible for the issue to be a dimension of conflict as voters would not
be able to base their vote on parties’ position on it.
The saliency an issue receives will be measured by adding up the pondered emphasis attached to
the issue by all parties:
∑
Where is the emphasis place on the conflict by the parties at the election, J is the number of
parties running at a particular election, the emphasis put by parties on the issue at that
election, and the electoral weight parties had, as calculated by the percentage of vote
received in an index that runs from o to 1. The formula is comparable to Stoll’s measure of
saliency (2004, 104) with the only change that weights are included to avoid giving all the
parties the same weight. The level of polarization around the issue will be computed using the
formula used by Lachat (2008) which basically computes the sum of the squared weighted
distances between each parties’ position and the weighted mean of all the parties in the system
∑
Where is the level of polarization of the system in that election and is the weighted mean
of the position of the parties at the election calculated with the formula,
∑
The decision to weight parties by their weight can easily be justified if we take into account that
not all parties will have the power to shape the agenda of the political system. Firstly because
some parties receive more attention than others by the media (Lefevere and Dandoy 2011), but
also because voters usually rely on the most visible parties to structure their vote (Popkin 1991,
91–93).
Once the main dimension of conflict at the previous election has been defined, the extent to
which a party is a loser on that dimension will be computed by calculating the difference
between party’s position on it and the weighted mean position of all the parties in that
dimension, which theoretically should capture the mean voters’ position. The parties’ position is
measured as defined in section 2.3 and the weighted mean position on that dimension computed
by averaging the position taken by the parties that run at that election weighted by their share of
vote on it. Obviously, that definition of distance to the mean implies a lot of assumptions about

the ways party competition is structured that might not be true, however, and without good
information about voters’ perceptions and behaviours it seems a good proxy.
With the four measures of interest, several logistic models have been constructed with the
dummy measuring whether or not there has been a changed as dependent variable. In order to
test hypothesis 1 and 2, the lagged distance with the mean voter and the lagged electoral
performance have been used as explicative measures.
To test hypothesis 3, the same model is run with an interaction between distance to the mean
and lost vote has been included in a second model.
Finally, in order to test whether or not there are important differences between different parties,
the two models have been run twice: first for the whole sample of parties, and then only parties
that had a mean share of vote higher than 10% were small. As it has been assumed that for those
parties, the ones that usually have a high share of vote, it will be more important to be close
from the mean voter.
To avoid problems of heteroskedasticity, the model has been estimated using the Eicker-Huber-
White standard errors (White 1980). Results of the models are shown below.
Table 2: Summary of the models
Model 1
(all parties)
Model 2
(all parties)
Model 3
(big parties)
Model 4
(big parties)
Lagged distance to
the mean voter
0,198
(0,293)
0,201
(0,293)
0,929*
(0,501)
0,982*
(0,507)
Lagged electoral
performance
-0,033
(0,021)
-0,034
(0,021)
-0,027
(0,024)
-0,027
(0,024)
Interaction 0,061
(0,073)
0,173*
(0,103)
Constant 0,341***
(0,095)
0,349***
(0,096)
0,519***
(0,132)
0,561***
(0,136)
N 464 464 257 257
Pseudo R2 0,0051 0,0063 0,0169 0,0259
As the table 2 shows, hypothesis 1, 3 and 4 are mainly confirmed while hypothesis 2 is clearly
not. That is, the model works considerably better for big parties than for small ones. Both, the
pseudo R2 and the coefficients are higher in models 3 and 4 than models 1 and 2, where small
parties have been included too which indicates that the strategic hypothesis tested here apply
mainly to big mainstream parties.
If we consider only models 3 and 4, the distance to the mean and the interaction between
distance to the mean and electoral performance have the expected coefficients. The further away
from the mean position on the main dimension a party is, the more likely it is that a party will
change the issues discussed. Also that effect is increased the higher the lost in vote suffered by
the party in the previous election is. Furthermore the two coefficients are significant at the 10%
level. However, changes on electoral performance do not seem to have any impact on
explaining whether or not a party changes the issues it discusses. Consequently, electoral
performance only pushes parties to change the issues they discuss if it’s accompanied by
distance from the mean voter on the main dimension of conflict, not on its own. That is in a
way, not surprising.
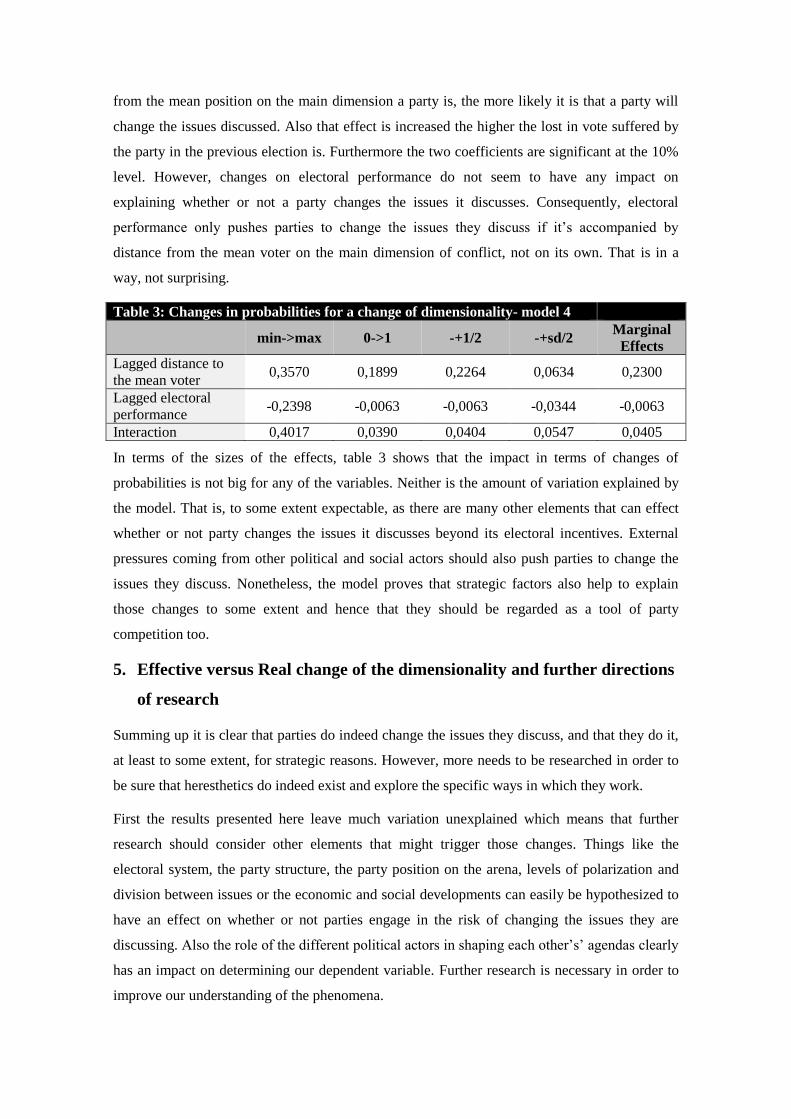
Table 3: Changes in probabilities for a change of dimensionality- model 4
min->max 0->1 -+1/2 -+sd/2 Marginal
Effects
Lagged distance to
the mean voter 0,3570 0,1899 0,2264 0,0634 0,2300
Lagged electoral
performance -0,2398 -0,0063 -0,0063 -0,0344 -0,0063
Interaction 0,4017 0,0390 0,0404 0,0547 0,0405
In terms of the sizes of the effects, table 3 shows that the impact in terms of changes of
probabilities is not big for any of the variables. Neither is the amount of variation explained by
the model. That is, to some extent expectable, as there are many other elements that can effect
whether or not party changes the issues it discusses beyond its electoral incentives. External
pressures coming from other political and social actors should also push parties to change the
issues they discuss. Nonetheless, the model proves that strategic factors also help to explain
those changes to some extent and hence that they should be regarded as a tool of party
competition too.
5. Effective versus Real change of the dimensionality and further directions
of research
Summing up it is clear that parties do indeed change the issues they discuss, and that they do it,
at least to some extent, for strategic reasons. However, more needs to be researched in order to
be sure that heresthetics do indeed exist and explore the specific ways in which they work.
First the results presented here leave much variation unexplained which means that further
research should consider other elements that might trigger those changes. Things like the
electoral system, the party structure, the party position on the arena, levels of polarization and
division between issues or the economic and social developments can easily be hypothesized to
have an effect on whether or not parties engage in the risk of changing the issues they are
discussing. Also the role of the different political actors in shaping each other’s’ agendas clearly
has an impact on determining our dependent variable. Further research is necessary in order to
improve our understanding of the phenomena.

But maybe more importantly, further research should be conducted taking into account the
extent to which those changes are indeed able to reshape the situation. Change on the
dimensions of conflicts that appear on the parties offer is, as it has been shown, common in all
countries. Nonetheless, the measure defined here is not enough as in order for a change of
dimensionality to work as a strategic device, a third condition is necessary: alliances around the
new issue should differ from those of the previously dominant one. Even if the issues most
discussed changed it could be that they all follow the same logic, and hence, they cannot be
used as heresthetics devices.
Introducing an issue that just extends the agenda without altering the alliances might be easier
for parties, as they do not risk internal divisions (Odmalm and Super 2013a; Odmalm and Super
2013b). Issues that follow a different logic, those necessary in order to alter the competition,
might be harder to introduce as they might come with some high costs. Hence we could expect
that a great deal of the variability we have observed in the previous section will disappear when
we consider the difference between raw and effective changes of dimensionality (Nyblade
2004). Good measures considering this characteristic should be developed and included in the
analysis.

Bibliography
Adams, James, Michael Clark, Lawrence Ezrow, and Garrett Glasgow. 2006. “Are Niche
Parties Fundamentally Different from Mainstream Parties? The Causes and the Electoral
Consquences of Western European Parties’ Policy Shifts 1976-8199.” American Journal
of Political Science 50 (3): 513–529.
Adams, James, Samuel Merrill, and Bernard Grofman. 2005. A Unified Theory of Party
Competition. New York: Cambridge University Press.
Amat, Francesc. 2013. “Redistribution in Parliamentary Democracies : The Role of Second-
Dimensional Identity Politics”. Oxford: Unpublished.
Bäck, Hanna, Marc Debus, and Patrick Dumont. 2011. “Who Gets What in Coalition
Governments? Predictors of Portfolio Allocation in Parliamentary Democracies.”
European Journal of Political Research 50 (4) (June 16): 441–478. doi:10.1111/j.1475-
6765.2010.01980.x.
Bakker, Ryan, Catherine E. de Vries, Erica Edwards, Liesbet Hooghe, Seth Jolly, Gary Marks,
Jonahtan Polk, Jan Rovny, Marco R. Steenbergen, and Milada A. Vachudova. 2010.
“Measuring Party Positions in Europe_ The Chapel Hill Expert Survey Trend File, 1999-
2010.”
Barbet-Porta, Berta. 2013. “Towards a Comprehensive Theory of Party Competition and
Electoral Change: From Party Identification to Riker’s Theory of Heresthetics and
Rhetoric.” In Politics in Crisis, edited by University of Nottingham- School of Politics.
Benoit, Kenneth, and Michael Laver. 2006. Party Policy in Modern Democracies. Routledge.
———. 2007. “Estimating Party Policy Positions: Comparing Expert Surveys and Hand-Coded
Content Analysis.” Electoral Studies 26 (1) (March): 90–107.
doi:10.1016/j.electstud.2006.04.008.
Carmines, Edward G., and James A. Stimson. 1989. Issue Evolution: Race and the
Transformation of American Politics. New Jersey: Princenton University Press.
De Vries, Catherine E., and Sara B. Hobolt. 2012. “When Dimensions Collide: The Electoral
Success of Issue Entrepreneurs.” European Union Politics 13 (2) (May 23): 246–268.
doi:10.1177/1465116511434788.
Dellepiane-Avellaneda, Sebastian. 2012. “Gordon Unbound: The Heresthetic of Central Bank
Independence in Britain.” British Journal of Political Science 43 (July 25): 263–293.
doi:10.1017/S0007123412000221.
Deschouwer, Kris. 2009. The Politics of Belgium: Governing a Divided Society. New york:
Palgrave Macmillan.
Dinas, E., and K. Gemenis. 2009. “Measuring Parties’ Ideological Positions With Manifesto
Data: A Critical Evaluation of the Competing Methods.” Party Politics 16 (4) (December
3): 427–450. doi:10.1177/1354068809343107.
Downs, Anthony. 1957. An Economic Theory of Democracy. New York: Harper and Row.

Edwards, D. 2004. “Divide and Conquer: Heresthetic in the Antipodes.” Political Science 56 (2)
(December 1): 65–74. doi:10.1177/003231870405600208.
http://pnz.sagepub.com/cgi/doi/10.1177/003231870405600208.
Egan, Patrick J. 2013. Partisan Priorities: How Issue Ownership Drives and Distorts American
Politics. New York: Cambridge University Press.
Gabel, Matthew J., and John D. Huber. 2000. “Putting Parties in Their Place: Inferring Party
Left-Right Ideological Positions from Party Manifestos Data.” American Journal of
Political Science 44 (1): 94–103.
Gemenis, Kostas. 2013. “What to Do (and Not to Do) with the Comparative Manifestos Project
Data.” Political Studies 61 (April 18): 3–23. doi:10.1111/1467-9248.12015.
http://doi.wiley.com/10.1111/1467-9248.12015.
Ginsberg, Benjamin. 1972. “Critical Elections and the Substance of Party Conflict: 1844-1968.”
Midwest Journal of Political Science 16 (4): 603–625.
Heckman, James J. 1979. “Sample Selection Bias as a Specification Error.” Econometrica 47
(1): 153–161.
Heppell, Tim. 2013. “The Conservative Party Leadership of David Cameron: Heresthetics and
the Realignment of British Politics.” British Politics (March) (March 4): 1–25.
doi:10.1057/bp.2013.6.
Inglehart, Ronald. 1971. “The Silent Revolution in Europe : Intergenerational Change in Post-
Industrial Societies.” The American Political 65 (4): 991–1017.
Janda, Kenneth, Robert Harmel, Christine Edens, and Patricia Goff. 1995. “Changes in Party
Identity: Evidence from Party Manifestos.” Party Politics 1 (2): 171–196.
Kaminski, M. M. 2002. “Do Parties Benefit from Electoral Manipulation? Electoral Laws and
Heresthetics in Poland, 1989-93.” Journal of Theoretical Politics 14 (3) (July 1): 325–358.
doi:10.1177/095169280201400303.
http://jtp.sagepub.com/cgi/doi/10.1177/095169280201400303.
König, Thomas, Moritz Marbach, and Moritz Osnabrügge. 2013. “Estimating Party Positions
across Countries and Time- A Dynamic Latent Variable Model for Manifesto Data.”
Political Analysis 21: 468–491.
Laakso, Markku, and Rein Taagepera. 1979. “The ‘Effective’ Number of Parties: ‘A Measure
with Application to West Europe.’” Comparative Political Studies 12 (1): 3–27.
Lachat, Romain. 2008. “The Impact of Party Polarization on Ideological Voting.” Electoral
Studies 27 (4) (December): 687–698. doi:10.1016/j.electstud.2008.06.002.
Laver, Michael, Kenneth Benoit, and John Garry. 2003. “Extracting Policy Positions from
Political Texts Using Words as Data.” The American Political Science Review 97 (2):
311–331.
Lefevere, Jonas, and Régis Dandoy. 2011. “Candidate Choice in Political Advertising: What
Determines Who Gets Attention?” World Political Science Review 52 (1): 335–352.

Litton, Krystyna. 2013. “Party Novelty: Conceptualization and Measurement of Party Change.”
Party Politics (September 18). doi:10.1177/1354068813499866.
http://ppq.sagepub.com/cgi/doi/10.1177/1354068813499866.
Lowe, Will, Kenneth Benoit, Slava Mikhaylov, and Michael Laver. 2011. “Scaling Policy
Preferences from Coded Political Texts.” Legislative Studies Quarterly 36 (1) (February
7): 123–155. doi:10.1111/j.1939-9162.2010.00006.x. http://doi.wiley.com/10.1111/j.1939-
9162.2010.00006.x.
Maor, Mashor. 1997. Political Parties & Party Systems: Comparative Approaches & the British
Experience. London: Routledge.
Marks, Gary, Liesbet Hooghe, Marco R. Steenbergen, and Ryan Bakker. 2007. “Crossvalidating
Data on Party Positioning on European Integration.” Electoral Studies 26 (1) (March): 23–
38. doi:10.1016/j.electstud.2006.03.007.
McLean, Iain. 2001. Rational Choice & British Politics: An Analysis of Rhetoric and
Manipulation From Peel to Blair. New York: Oxford University Press.
Meyer, T. M., and M. Wagner. 2013. “Mainstream or Niche? Vote-Seeking Incentives and the
Programmatic Strategies of Political Parties.” Comparative Political Studies 46 (10) (July
2): 1246–1272. doi:10.1177/0010414013489080.
http://cps.sagepub.com/cgi/doi/10.1177/0010414013489080.
Meyer, Thomas M. 2013. Constraints on Party Policy Change. Colchester: ECPRPress.
Nagel, Jack H. 1993. “Populism, Heresthetics and Political Stability: Richard Seddon and the
Art of Majority Rule.” British Journal of Political Science 23 (2): 139–174.
Netjes, Catherine E., and Harmen A. Binnema. 2007. “The Salience of the European Integration
Issue: Three Data Sources Compared.” Electoral Studies 26 (1) (March): 39–49.
doi:10.1016/j.electstud.2006.04.007.
Nyblade, Benjamin. 2004. “The ‘Effective’ Number of Issue Dimensions: A Measure with
Application to West Europe”. Chicago.
Odmalm, Pontus, and Betsy Super. 2013a. “Getting the Balance Right? Conflicting Ideological
‘ Pulls’, and Party Competition, on Immigration in Britain and Sweden.”
———. 2013b. “If the Issue Fits, Stay Put: Cleavage Stability, Issue Compatibility and Drastic
Changes to Parties’ Manifesto Positions on ‘the Immigration Issue.”
Petrocik, John R. 1996. “Issue Ownership in Presidential Elections, with a 1980 Case Study.”
American Journal of Political Science 40 (3): 825–850.
Popkin, Samuel L. 1991. The Reasoning Voter: Communication and Persuasion in Presidential
Campaigns. 2nd Editio. Chicago: The University of Chicago Press.
Rabinowitz, George, and Stuart E. MacDonald. 1989. “A Directional Theory of Issue Voting.”
The American Political Science Review 83 (1): 93–121.
Riker, William H. 1986. The Art of Political Manipulation. New Haven: Yale University Press.

Ruedin, Didier, and Laura Morales. 2012. “Obtaining Party Positions on Immigration from
Party Manifestos.”
Stoll, Heather. 2004. “Social Cleavages, Political Institutions and Party Systems: Putting
Preferences Back into the Fundamental Equation of Politics”. Palo Alto.
———. 2010. “Elite-Level Conflict Salience and Dimensionality in Western Europe: Concepts
and Empirical Findings.” West European Politics 33 (3) (May): 445–473.
doi:10.1080/01402381003654494.
http://www.tandfonline.com/doi/abs/10.1080/01402381003654494.
———. 2011. “Dimensionality and the Number of Parties in Legislative Elections.” Party
Politics 17 (3) (July 9): 405–429. doi:10.1177/1354068809346263.
Tzelgov, E. 2012. “Damned If You Do and Damned If You Don’t: Rhetorical Heresthetic in the
Israeli Knesset.” Party Politics (December 9): 1–51. doi:10.1177/1354068812462926.
Volkens, Andrea. 2007. “Strengths and Weaknesses of Approaches to Measuring Policy
Positions of Parties.” Electoral Studies 26 (1) (March): 108–120.
doi:10.1016/j.electstud.2006.04.003.
Werner, Annika, Onawa Lacewell, and Andrea Volkens. 2011. “Manifesto Project Database.”
Coding Handbook.
https://manifestoproject.wzb.eu/information/documents?name=handbook_v4.
White, Halbert. 1980. “A Heteroskedasticity-Consistent Covariance Matrix Estimator and a
Direct Test for Heteroskedasticity.” Econometrica 48 (4): 817–838.
Wooldridge, Jeffrey M. 2008. Introductory Econometrics: A Modern Approach. fourth. Mason:
South-Western Cengage Learning.
Appendix
In order to test the validity of the measure data from the Chapel Hill expert survey of the years
2006 and 2010 will be used (Bakker et al. 2010).
Table A1: Party list
Party name CMP
Code
CH
Code Party name CMP
Code
CH
Code Party name CMP
Code
CH
Code Unity Red List-
Green alliance
(DK)
13229 213 Socialist’s People’s Party (DK)
13230 206 Social Democrats (DK)
13320 201
Radical Left- Social Liberal
Party (DK)
13410 202 Venstre, Liberal
Party of Denmark 13420 211
Conservative
People’s Party (DK) 13620 203
Danish People’s Party (DK)
13720 215 Ecolo (BE) 21111 104 Agalev, Green (BE) 21112 105
Different- Spirit
(BE) 21221 103 Socialist Party (BE) 21322 102
Flemish Liberal and
Democrats (BE) 21421 107
Liberal Reformist Party- (BE)
21426 106 Christian People’s Party (BE)
21521 109 Christian Social Party- (BE)
21522 108
Flemish Bloc-
Flemish Interest
(BE)
21914 112
People’s Union-
New Flemish
Alliance (BE)
21916 110 Gren Party (FR) 31110 605
French Communist
Party (FR) 31220 601 Socialist Party (FR) 31320 602
Union for French
Democracy (FR) 31624 613
Rally for the
Republic- (FR) 31626 609 National Front (FR) 31720 610 United Left (ESP) 33220 504
Spanish Socialist 33320 501 People’s Party (ESP) 33610 502 Convergence and 33611 505

Workers’ Party (ESP)
Unity (ESP)
Basque Nationalist
Party (ESP) 33902 506
Basque Solidarity
(ESP) 33903 507
Republican Left of
Catalonia (ESP) 33905 511
Coalition Canarias (ESP)
33907 517 Galician Nationalist Bloc (ESP)
33908 513 Aragoneses Council (ESP)
33909 520
Left Bloc (POR) 35211 1208
Unitarian
Democratic Coalition (POR)
35229 1201 Socialist Party
(POR) 35311 1205
Social Democratic
Party (POR) 35313 1206
Democratic and
Social Centre-
People’s Party (POR)
35520 1202 Labour Party (UK) 51320 1102
Liberal Democratic
Party (UK) 51421 1104
Conservative Party
(UK) 51620 1101
Scottish National
Party (UK) 51902 1105
United Kingdom
Independence
Party (UK)
51951 1108 Alliance 90- The Greens (GE)
41113 304
Party Democratic
Socialism- Left
Party (GE)
41222 306
Social Democratic
Party (GE) 41320 302
Free Democratic
Party (GE) 41420 303
Christian Democratic Union
(GE)
41521 301
Green Party (IRL) 53110 705 Labour (IRL) 53320 703 Progressive
Democrats (IRL) 53420 706
Fine Gael (IRL) 53520 702 Fianna Fail (IRL) 53620 701 Sinn Fein (IRL) 53951 707
Green Left (NL) 22110 1005 Socialist Party (NL) 22220 1014 Labour Party (NL) 22320 1002
Democrats 66 (NL) 22330 1004
People’s Party for
Freedom and Democracy (NL)
22420 1003
Christian
Democratic Appeal (NL)
22521 1001
Christian Union
(NL) 22526 1016
Party for Freedom
(NL) 22722 1017
The Austrian Green
Party (AUS) 42110 1304
Social Democratic Party (AUS)
42320 1301 Freedom Party of Austria (AUS)
42420 1303 Liberal Forum(AUS)
42421 1306
Austrian People’s
Party (AUS) 42520 1302
Alliance for the
Future (AUS) 42710 1307 Green League (FIN) 14110 1408
Left Alliance
(AUS) 14223 1404
Social Democratic Party of Finland
(FIN)
14320 1401 Finish Christian League- Christian
Democrats (FIN)
14520 1409
National Coalition Party (AUS)
14620 1402 Finnish Center Party (FIN)
14810 1403 True Finns (FIN) 14820 1405
Swedish People’s
Party 14901 1406
Environmental Party
the Greens (SV) 11110 1607 Left Party (SV) 11220 1601
Worker’s Party-
Social Democrats
(SV)
11320 1602 Liberal People’s
Party (SV) 11420 1604
Christian-
Democrats (SV) 11520 1606
Moderate Party (SV)
11620 1605 Liberal People’s Party (SV)
11810 1603
Table A2: List of years
Country CH-2006 CH2010 Country CH-2006 CH2010
Sweden 2006-09 2010-09 Denmark 2007-11 2011-09
Finland 2007-03 2011-04 Belgium 2007-06 2010-07
Netherlands 2006-11 2010-06 France 2007-06 No data
Spain 2004-03 2008-03 Portugal 2005-02 2009-09
Germany 2005-09 2009-09 Austria 2006-10 2008-09
Great Britain 2005-05 2010-05 Ireland 2007-05 2011-02
Additive versus Multiplicative measure
Table A3: List of issues compared
CMP Defined
Category Chapel Hill Question
CMP Defined
Category Chapel Hill Question
Issue1- European union
European integration overall:
salience2 (06)- eu_salience(10) Issue3- Welfare State
Public Spending: pubserv_sal (06)-
spendvtax_salience (10)
Issue 6- Market and
enterprise
Deregulation: dereg_sal (6)-
dereg_salience (10) Issue8- Freedom
Civic liberties vs law and order:
civlib_sal (6)- civlib_salience (10)
Issue9- Social Style issues: lifestyle_sal Issue 10- Integration of immigrants and

Traditional
morality
(06)- social_salience (10) Multiculturalism asylum seekers: multicult_sal (06)-
immigrant_asylum (10)
Issue 13-
Militarism
International security and
peacekeeping
missions: international_salience
(10)
Issue 14-
Quality of life
Environment: enviro_salience (10)
not asked in 2006
Issue 15- Decentralization
Political decentralization to
regions/localities: decentral_sal
(06)- region_salience (10)
Table A4: Correlation between different measures by issue
Correlati
ons
Issue1
EU
Issue3
Public
Spending
Issue6
Market Regulation
Issue8
Civic
Liberties
Issue9
Life
Style
Issue10
Multicul
turalism
Issue 13
Militarism Issue14 Quality
of life
Issue15
Decentr
alization
Simple
Emphasis
Measure
0,2618 0,1681 0,1907 0,3961 0,2179 0,4157 -0,1717 0,5914 0,2071
Interactive
version 0,2437 0,2787 0,0846 0,3902 0,2823 0,4565 -0,1287 0,5110 0,1775
Additive
version 0,2680 0,1721 0,1946 0,4172 0,2448 0,4317 -0,1699 0,5949 0,2133
Issue specifications: testing the optimal specification
Table A5: List of specifications compared
Name Simplified Alternative
Welfare per504 +per505 per503+per504 +per505
Multiculturalism per607 + per608 per607 +per608+per705
Market and Enterprise per403+per402 per413+per412+per403+per401+per402
Freedom per201 +per605 per201 +per605+per202
Militarism per105+ per104 per105+ per106+ per104
Quality of Life per501+per410 per416+ per501+per410
Table A6: Pearson’s Correlations
Simplified (2 categories)
Alternative (more than two
categories)
Welfare: Simple emphasis 0,0774 0,1681
New salience measure 0,0870 0,1721
Multiculturalism Simple emphasis 0,4157 0,3682
New salience measure 0,4317 0,3851
Market Simple emphasis 0,1785 0,1907
New salience measure 0,1715 0,1946
Freedom Simple emphasis 0,3961 0,3701
New salience measure 0,4172 0,3827
Quality of life Simple emphasis 0,5130 0,5257
New salience measure 0,5190 0,5329
Militarism Simple emphasis -0,1586 -0,1717
New salience measure -0,1593 -0,1699