the use of eucalyptus in agroforestry systems of southern
TRANSCRIPT

The use of Eucalyptus in agroforestry systems of southern
Rwanda: to integrate or segregate?
Canisius Patrick Mugunga

ii
Thesis committee
Promotors
Prof. Dr. G.M.J. Mohren
Professor of Forest Ecology and Forest Management
Wageningen University
Prof. Dr. K. E. Giller
Professor of Plant Production Systems
Wageningen University
Other members
Prof. Dr N.P.R. Anten, Professor of Crop and Weed Ecology, Wageningen University
Prof. Dr C.K. Ong, Chief Research Officer, Crops for the Future (CFF)
Dr V.J. Ingram, Forest and Nature Conservation Policy Group, Wageningen University
Dr J.B. Evers, Centre for Crop Systems Analysis, Wageningen University
This research was conducted under the auspices of the C.T. de Wit (PE & RC) Graduate
School for Production Ecology and Resource Conservation

iii
The use of Eucalyptus in agroforestry systems of southern
Rwanda: to integrate or segregate?
Canisius Patrick Mugunga
Thesis
submitted in fulfillment of the requirements for the degree of doctor at Wageningen
University
by the authority of the Rector Magnificus
Prof. Dr A.P.J. Mol,
in the presence of the
Thesis Committee appointed by the Academic Board
to be defended in public
on Monday 20 June 2016 at 4 pm in the Aula.

iv
Canisius Patrick Mugunga
The use of Eucalyptus in agroforestry systems of southern Rwanda: to integrate or segregate?
162 pages.
PhD thesis, Wageningen University, Wageningen, NL (2016)
With references, with summary in English
ISBN: 978-94-6257-753-4
DOI: http://dx.doi.org/10.18174/375484

v
TABLE OF CONTENTS
TABLE OF CONTENTS ........................................................................................................................ v
ABSTRACT .......................................................................................................................................... vii
ACKNOWLEDGEMENTS ................................................................................................................... ix
CHAPTER 1: General introduction ........................................................................................................ 1
CHAPTER 2: Above ground biomass prediction in coppice and planted stands of Eucalyptus saligna
.............................................................................................................................................................. 17
CHAPTER 3: Tree-crop interactions in maize-eucalypt woodlot agroforestry systems ...................... 39
CHAPTER 4: Edge affects both maize and Eucalyptus trees in maize-eucalypt woodlot agroforestry
systems .................................................................................................................................................. 59
CHAPTER 5: Water use by short rotation Eucalyptus woodlots in southern Rwanda ......................... 79
CHAPTER 6: SYNTHESIS ................................................................................................................ 103
REFERENCES ................................................................................................................................... 131
SUMMARY ........................................................................................................................................ 155

vi

vii
ABSTRACT
Eucalyptus tree species widely grown in the tropics and subtropics predominate in the
Rwandan landscape and primarily serve to supply the firewood and charcoal, timber and
other non-timber forest products that are in high demand. They also play a significant role in
the conservation of the environment by protecting soils against the erosion and landslides that
are common in the study area. The trees are managed in woodlots of varying sizes owned by
farmers, private institutions and local governments. The scattered rural households
countrywide influence the distribution of eucalypt woodlots and cropped fields, creating a
mosaic distribution of the two landuse types. This results in an intimate interaction between
annual crops and the woodlot trees next to the fields.
Eucalyptus trees are known to be very competitive, suppressing crops in such settings to the
extent that crops fail in the field zones nearest the woodlots. On the other hand, farmers get
firewood, timber and other wood products as well as income from sales of timber and
firewood and prefer to retain these very competitive trees on their fields. Controversy about
Eucalyptus in other areas led to policymakers restricting the growing Eucalyptus, especially
near wet areas. This thesis aimed to study the interaction between Eucalyptus woodlot trees
and crops in fields next to the woodlots in southern Rwanda.
General allometric equations were developed relating tree diameter and height to total and
component aboveground tree biomass in coppice and planted stands and these were used to
quantify aboveground tree biomass. A competition experiment was run in Huye and Gisagara
district (southern Rwanda) to investigate competition between woodlots and crops, with
maize as the example field crop. Environmental resources of soil moisture, soil nutrients and
solar radiation were assessed in a spatial gradient from tree–crop interface. Variation of the
resources with distance from the tree–crop interface was also assessed. This was related to
maize growth and grain yield at the different distances from the tree–crop interface. Using the
resulting biomass equations, woodlot biomass production was quantified and an economic
evaluation was done using the net present value approach to make trade-offs of growing
combinations of Eucalyptus woodlot for producing timber, poles and firewood and maize,
considering varying area proportions and growing sole maize. Extra woodlot biomass
produced as a result of the edge effect was estimated and compared to the loss in grain yield
due to competition.
Eucalyptus water use was estimated using the leaf area–tree diameter allometric relationship
and the rate was compared to that of Eucalyptus reported in other areas and that of key crops
grown in the area. General equations were derived for predicting aboveground total and
component tree biomass. It was found that soil moisture, nutrients and light were
significantly reduced in the crop fields next to the woodlots in a zone of up to 10.5 m width.
Here, grain yield was 80% lower. However, the affected zone represents 10.5% of a 1 ha
cropped field and when the loss is spread over the whole crop field area, the actual grain yield
loss per hectare falls to 8.4%. Trees growing within 8 m of the perimeter of the woodlots had
17.8% bigger diameter at breast height and 34.5% more aboveground biomass than trees
further away from the perimeter. Combining maize cropping with eucalypt woodlots was

viii
more profitable than solely cultivating maize, and revenue from extra wood gains due to edge
effects exceeded the corresponding revenue losses in maize yield.
Crop field size and orientation were very important. The smaller the field the more the edge
effects since the proportion of the total field affected becomes more significant as the field
size decreases. Rectangular crop fields will suffer more when longer sides adjoin woodlots.
Woodlots, especially if small, also suffered from edge effects. Farmers with bigger
landholdings are likely to benefit more than those with very small landholdings and they are
likely to prioritise maize production (a less profitable option) over woodlots, for food security
reasons. Recorded potential tree transpiration (3 mm d-1
) was 10% below local annual
precipitation. The observed dry month water deficit could be covered by reductions in leaf
area, stomatal closure and changes in soil water storage. A sensitivity analysis showed that
50% leaf area reduction corresponded to a 32.8 mm decline of potential tree transpiration.
The moderate eucalypt water use rate observed may be a function of trees’ small size and low
tree stocking. The observed eucalypt water use rate is smaller than the range reported for
eucalypts in Africa and was also smaller than that of key annual crops in the study area.
It is concluded that Eucalyptus woodlots are worth maintaining in the study area to ensure the
supply of firewood and charcoal, timber and non-timber forest products, and for soil erosion
and landslide control, as well as for generating income for the local communities. They
should, however, be managed as woodlots, since managing them as single trees in cropland
may lead to severe tree–crop competition. The current practice of not planting Eucalyptus
trees in the major catchment areas in the country should be maintained. This should be
extended to riparian zones and near wetland zones, since eucalypt water use is reported to
increase with water availability. Managing woodlots as short rotations and increasing initial
tree spacing may contribute to resolving issues related to catchment hydrology associated
with eucalypt plantations. This could be enhanced by planting mixed stands of Eucalyptus
and other tree species, preferably N-fixing, as these would also be useful in improving soils
and woodlot productivity.
It is also recommended that eucalypt species be selected to allow for undergrowth
development in the woodlots that improves soil erosion control and biodiversity. Finally, a
holistic, integrated planning and management approach involving different stakeholders in
natural resource management is recommended, to achieve agricultural production that is more
compatible with the protection of ecosystems without impairing farmers’ livelihoods.

ix
ACKNOWLEDGEMENTS
I would like to express my sincere gratitude to my promoters Professors GMJ Mohren and
KE Giller for all the support they provided during the whole period of studies. The scientific
guidance, freedom and working environment you provided made me mature enough to
complete this very important task in my life. I sincerely thank you. I am indebted to thanking
the late Professor Esron Munyanziza for his very important and friendly guidance as my
supervisor sometime at the middle of my work in Rwanda. He was appointed my supervisor
but his untimely death was a great shock to me. However, his contribution was significant
and is highly appreciated. May his soul rest in eternal peace.
I am thankful to the Netherlands Organization for International Cooperation in Higher
Education (NUFFIC) for funding this study through the partnership between Wageningen
University and the University of Rwanda under the NPT/RWA/061 Project. I also thank my
employer, the University of Rwanda for according me the opportunity to study and the
provision of a study leave while retaining my employment.
I am very appreciative of the contribution of all co-authors of different manuscripts based on
the research of this thesis. I also recognise the contribution of three Master students whom I
worked with on different chapters of this thesis. These include: Dilia Kool who was studying
at Wageningen University and did her internship with me while doing my field work in
Rwanda. Munyengabe Jean Marie Vianney and Oreste Nsanzimana were doing their studies
at the University of Rwanda.
I am grateful to Professors Frans Bongers and Lourens Porters of Wageningen University
(The Netherlands) and Doctor Cesar Cruzado of Göttingen University (Germany) for reading
and commenting on some manuscripts developed from chapters of this thesis.
I am highly indebted to thanking my beloved wife Yvonne and children Patrick, Lisa and
Linda, who encouraged and supported me morally and physically during my stay at home
which was >80% of all my study period. They were involved in one way or another in
assisting with my field work. I sincerely thank them for tolerating my many years of not
being fully available for them as it would be expected.
I kindly thank all people of the Forest Ecology and Forest Management Chair Group at
Wageningen university and special thanks go to my colleague students for sympathy,
friendship and assistance in many different ways. Special thanks also are due to Ms Joke
Jansen for her tireless assistance in logistical issues during my whole study period.
I would like to sincerely thank all persons, groups of people or organisations who/which in
one way or another, gave a helping hand of any kind which contributed to the successful
completion of my study. May the Lord richly bless you all.

x

1
CHAPTER 1: General introduction

2

3
General introduction
Agroforestry: its history and naissance as a scientific field
Agroforestry is a relatively young term for an old age practice, the practice probably dating
back to the beginning of humanity on this earth. Cultivation of trees and crops together has
been practiced throughout the world since the beginning of agriculture (Nair, 1993).
Literature reports that agroforestry have been practiced in Europe since the Middle Ages
(King, 1987). The practice is still ongoing in Europe today and the main combinations of
most of agroforestry practices used nowadays are mainly found in two categories: silvoarable
and silvopastoral areas (Rigueiro-Rodriguez et al., 2009). Cork oak agroforestry is a common
practice in Spain (Campos et al., 2009). Silvoarable systems as hedgerows are seen in
Brittany (bocages), Normandy, Ireland, the Knicks and Walhecken in Germany (Rigueiro-
Rodriguez et al., 2009). Dispersed oak trees exist in dehesas systems in Spain or Portugal,
and parkland systems in the UK, and zoned systems including the planting of olive in 5–10 m
rows with cropped areas in between, and the use of shelterbelts for livestock in Northern
Europe (Eichhorn et al., 2006). Riparian strips and line planting (hedgerows, shelterbelts, and
windbelts) defined as trees outside forests (MCPE 2003) are classified as agroforestry (Long
and Nair 1999). Silvopastoral system can be found in the Mediterranean region (Eichhorn et
al. 2006). Forest farming, an agroforestry system where non woody forest products such as
mushrooms, medicinal plants etc. are harvested (Lange and Schippmann 1997; Lange 1998)
exist in countries like Albania, Bulgaria, Hungary and Spain (Rigueiro-Rodriguez et al.,
2009).
This practice was also reported in America (Ares et al., 2006; Wilken, 1977) and Asia
(Conklin, 1957), specifically in India in 1890 (Raghavan, 1960). It is said to have been
“introduced” in South Africa in 1877 (Hailey, 1957) and in Nigeria in early 20th
century
(Forde, 1937; Ojo, 1966). Yet agroforestry is reported to be an ancient practice in sub-
Saharan Africa where farmers deliberately retain and integrate trees into their farmland
(Bucagu et al., 2013).
As a modern scientific study, the term ‘agroforestry’ appeared first in a review published by
Bene et al. (1977). More importantly, it gave a breakthrough in recognizing the key concepts
that trees and shrubs grown on farmlands played distinctive and valuable roles (Young,
1997). It was born from other agricultural sciences in 1970-80s (Torquebiau, 2000) and in the
early 1980s, agroforestry research focused on conceptual issues such as the definition and
classification of its different types (Young, 1997); the inventory of existing agroforestry
systems (Nair, 1989) and soils research (Mongi and Huxley, 1979). It depended on
information drawn from the fields from which it was born: agriculture, forestry and soil
science (Young, 1997).
Agroforestry is defined as any form of land use where trees and agricultural crops and/or
animals are combined, either in some form of spatial mixture or sequence in one production
unit. While classifying agroforestry practice is as complex as the systems themselves, several
attempts have been made to identify and name different systems. Examples include

4
simultaneous systems (e.g. alley cropping, savannah parklands, and multi-storey gardens)
with direct interactions and sequential or rotational systems (e.g. the old shifting cultivation,
improved fallows, and rotational woodlots) with indirect interactions or residual effects
between trees and crops (Nair, 1993). Different classes are also recognized based on the
agroforestry components, including: agrosilvicultural (crops and trees such as in alley
cropping, homegardens, etc.), silvopastoral (trees and animals as in pastures) and agro-
silvopastoral (crops, trees and animals as in zero grazing).
According to Radersma (2002), classification of agroforestry is a complex undertaking and
its definitions range from purely physical and scientific to more “political” ones, the latter
including aims of the system(s) such as ecological, social and economic gains. Such ‘aim
containing’ definitions may not apply to unsuccessful agroforestry systems (Radersma,
2002), although the latter are likely to occur. Unsuccessful agroforestry systems may occur
when there are wrong choices of species combinations, management practices, and lack of
peoples' motivation and understanding (Nair, 1993) and when trees become invasive and hard
to control.
Tree-crop interactions
Tree-cropping systems fall within a range between complete segregation and complete
integration of trees in a landscape as two extremes of a spatial pattern perpendicular axis of
deforestation/afforestation (van Noordwijk et al., 2012). Along this continuum, agroforestry
is associated with more integrated systems, while a coarse mosaic of tree and crop
monocultures form an alternative system. However, tree-cropping systems will be considered
as agroforestry even when the components are segregated, as long as the components of the
mosaic interact and the interaction influences the productivity of individual components,
either positively in which case they are facilitative, or negatively when they are competitive.
The interaction between trees and crops when the two are grown together or in close
proximity has been a subject of interest since the start of agroforestry as a scientific field.
Initially, scientists thought trees in agroforestry systems could improve these systems and
therefore improve crop yields directly (Kidd and Pimentel, 1992). It is however, not an easy
and direct process how trees and crops on farmland interact and provide expected outputs
because environmental conditions interact with plant and population traits to determine
outcomes (Sheley and James, 2014). Relative plant size may be an essential factor needed to
predict the outcome of plant-plant interactions. Variation in plant size creates size
asymmetric interactions where larger individuals (trees) may pre-empt resources by acquiring
them while they are unavailable to smaller individuals (annual crops) (Weiner and Damgaard,
2006). These interactions are among the strongest drivers of dynamics in tree-crop systems
because they set the limits within which organisms can live and function (Lin et al., 2013).
Accounts on how trees and crops interact in multi-cropping systems and their farmers’
benefits and shortfalls in relation to monocrops in different cropping conditions and
environments exist. In their account on resource capture and crop productivity under different
rainfall and management conditions in the agroforestry system in the Sahel, Coulibaly et al.

5
(2014) observed that more water did not in all cases lead to a better sorghum grain
production. They conclude also that under the study conditions, increasing tree density does
not negatively affect sorghum growth if crown pruning is applied. On the other hand, Bayala
et al. (2015) also studied the processes in soil-tree-crop interactions in the parkland systems
in west Africa. They conclude that, an over-all understanding of the functioning of the
complex agroforestry systems is still lacking because no published studies have addressed
possible interactions that take place at the same time in such systems. Garcia-Barrios & Ong
(2004) and Ong et al. (2004) explain the interspecific interaction and facilitation between
plants, how these interact under different environmental resource conditions and how this
impose trade-offs, biophysical limitations and management requirements in tree-crop
mixtures. They state that, introducing trees in croplands to promote low-input sustainable
agroforestry systems is a challenging undertaking due to some reasons: (a) trees provide
useful products for smallholders and strongly facilitate crops, but can also exert stronger
competitive effects than previously expected; b) practices aimed at increasing trees’
beneficial effects can sometimes also enhance trees’ competitiveness; c) the interplay
between positive and negative effects of trees change – sometimes significantly – from one
environment to another. This makes it difficult to predict the consequences of extending
successful agroforestry practices to new environments having different resource levels and
resource balances.
In an intercrop, component crops differ in terms of patterns of resource use, which may lead
to a more efficient exploitation of resource than when grown in monocultures (Willey, 1990;
Francis, 1989). Environmental resources may be more completely absorbed and used to build
crop biomass by intercropping (Amini et al., 2013). This is a consequence of differences in
the component species capacity to compete for growth resources between them (Amini et al.,
2013; Anil et al., 1998). This may imply that, the components are not competing for the same
ecological niches and that interspecies competition is weaker than intra-specific competition
for a given factor (Vandermeer, 1989). The same would occur if resource requirements of the
component species are separated in space or in time (Cannell et al., 1996).
Agroforestry systems are designed to optimise the use of physical resources either spatially or
temporally, by maximising positive interactions (facilitation) and minimising negative ones
(competition) among the components (Jose et al., 2000) as well as to diversify products (Kidd
and Pimentel, 1992). Successful management of agroforestry systems will essentially require
the understanding of complex biophysical processes and mechanisms involved in the
allocation of resources so as to get systems that are ecologically sound, economically feasible
and socially acceptable (Ong et al., 1996; Rao et al., 1998). This has to be in commensurate
with the central agroforestry hypothesis which states that “the benefits of growing trees with
crops will occur only when the trees are able to acquire resources of water, light and nutrients
that the crops would not otherwise acquire” (Cannell et al., 1996).
Ecologically as Jose et al. (2004) states, productivity of an agroforestry system is comparable
to that in natural environments, and is the net result of positive and negative interactions
among the components. Interactions occur as component species exploit growth resources

6
above- and belowground (Ong et al., 1996). The intensity of interaction, both inter- and intra-
specific is size and density dependent and will increase when individuals per species increase
per unit area and vice versa. Two or more species will co-exist until one or more of the
resources they share spatially or temporally turn insufficient or limiting for one or both
species.
The mechanism of co-existence and competition among species was illustrated by several
scientists such as De Wit (1960) and Amstrong and McGhee (1980). The mechanisms are
used to assess interference, niche differentiation, resource utilisation and productivity in
simple mixture of species (Jolliffe, 2000). A standard replacement series involves at least two
species mixed and their yield is compared per unit area and the results can be presented
graphically as in Figure 1.1. To study competition in mixtures of two species, the proportion
of each of the two species is varied while keeping constant the overall density. Replacement
diagrams are used to interpret the results by showing relative yields of each individual in
relation to the relative frequency. The relative yield total (RYT) is the index of resource
competition and is calculated as:
RYT =YAB
YAA+
YBA
YBB
where YAB and YBA are yields of species A and B per unit area when grown in mixtures, and
YAA and YBB the yields of the two species when grown in pure stands. When RYT=1, it
means the species compete for same resources; when RYT>1, it means there is resource
complementarity.
Yield
1 YAB
RYA RYB
0
0 YA:YB Relative density 1
Figure 1.1. Replacement diagram in showing trends in total (YA+B) and component
yields (YA = yield of species A and YB = yield of species B) (in say, dry matter, in
units per unit area).

7
The components are mixed and a selected measure of yield of each component per unit area
(e.g. biomass) is assessed while the proportions of individual components in the mixture vary
from 0 to 100%. This very simplified situation is more suited to agro-ecosystems with similar
component species having similar rooting architecture, expected to exhibit similar
physiological needs and to respond to fulfilling the needs in a similar manner (Jose et al.,
2004). The situation in agroforestry systems is far more complicated and component species
differ in many various ways: species combinations, life forms and structure, resource needs in
quantity, quality, spatial and temporal dimensions, etc.
Since agroforestry systems are deliberately established and managed, the idea would be to
choose species combinations that will, in one way or another, ensure reduced competition and
whenever possible, opt for species that will eventually lead to facilitative or complementary
systems. Complementary species will be expected to use resources more effectively either by
using a different niche as, for example, when the annual crop is shallow rooted while a
companion tree is deep rooted, or by changing its phenology to exhibit different temporal
resource use. Differences in structure and behaviour of species therefore may allow for better
species combinations that may allow for better capture of environmental resources, leading to
better system productivities (Ashton, 2000; Garcia-Barrios and Ong, 2004). For example,
Senna siamea and Leucaena leucocephala were intercropped with maize in semiarid
Machakos, Kenya. L. leucocephala reduced maize yield in the intercrop by 16% compared to
the sole maize while S. siamea did not reduce the intercropped maize yield (Jama et al.,
1995). Compared with the sole-crop systems, L. leucocephala intercropping did not affect
land equivalent ratio (LER) (competitive situation), whereas LER increased by 28% with S.
siamea intercropping (a complementary situation). The capture of growth resources by trees
and crops can be grouped into three broad categories to show competitive, neutral or
complementary interactions. In the neutral or trade-off category, trees and crops exploit the
same pool of resources, so that increases in capture by one species result in proportional
decreases in capture by the associated species (Ong and Shallow, 2003). If trees were able to
tap resources unavailable to crops (Cannell et al., 1996), then the overall capture would be
increased, i.e. complementary use of resources. In the third category, negative interactions
between the associated species could result in serious reduction in the ability of one or both
species to capture growth resources. It is important to bear in mind that tree-crop interactions
may change from one category to another depending on the age, size and population of the
dominant species, as well as the supply and accessibility of the limiting growth resources
(Ong and Swallow, 2003).
A simplified schematic representation of complementarity in resource use in agroforestry is
shown in Fig. 1.2a as illustrated by Wojtkowaki (1998) and as modified by Jose et al. (2004).
The line A1-B1 shows how the total yield of species A and B as the proportion of each in
sole cropping varies in a given area. The trajectory A+B represents the over-yielding
compared with either of the sole crop yields of one possible mixture of species A and B.
Unfortunately, this presents an ideal situation which can seldom be attained in nature. The
situation is more complicated by the fact that agroforestry systems are dynamic and temporal
changes occur across the rotation of one cycle. A hypothetical illustration of how situations

8
can change over time is presented in Fig. 1.2b (Jose et al., 2004; Wojtkowski, 1998).
Changing of species needs and physical structure affect the degree of resource sharing,
leading to alternating complementarity and competition. When the latter predominates,
management intervention may be applied to reverse the situation so as to ensure better co-
existence and productivity. The response of tree-crop mixtures to the effects of management
of the trees is illustrated in Figure 1.2b.
Ong and Swallow (2003) summarise resource capture in tree-crop combination systems in
three categories to show neutral, complementary or competitive interactions. In the neutral or
trade-off category, trees and crops exploit the same pool of resources, so that increases in
capture by one species result in proportional decreases in capture by the associated species. If
trees were able to tap resources unavailable to crops, then the overall capture would be
increased, i.e. complementary use of resources. This could be possible for example, through
spatial differences in resource capture strategies shown by different species. Trees mainly
depending on resources captured underground lower than crop roots can reach; or by
increasing aboveground zone where light is captured from near the ground level by annual
crops to 30 m above ground for tall trees. Light that escapes upper storey trees are then
captured by shorter plants with the overall increase in the amount of light captured by the
intercrop. In the third category, negative interactions between the associated species could
result in serious reduction in the ability of one or both species to capture growth resources. It
is important to bear in mind that tree-crop interactions may change from one category to
another depending on the age, size and population of the dominant species, as well as the
supply and accessibility of the limiting growth resources.
In practice, extension agents advise farmers on tree species to grow in their fields. This may
not favour adoption because it may be against farmers’ preferences. Wajja-Musukwe et al.
(2008) suggest that farmers be allowed to select tree species they prefer, and then apply tree
management practices such as root and shoot pruning to reduce tree competition. Wajja-
Musukwe et al. (2008) reported very little to no competitive effects in Grevillea robusta and
Markhamia lutea with crops while Casuarina equisetifolia and Maesopsis eminii affected
crops significantly. This may be a result of the widely spreading canopy of G. robusta
(Wajja-Musukwe et al., 2008) and the fact that coppice roots in G. robusta grow downwards
and do not spread in the rooting zone (Wajja-Musukwe, 2003). Such less competitive species
could lead to over-yielding since almost all tree products will add to the slightly reduced or
non-affected crop yields if the two were grown together. Another example of over yielding
was reported with A. acuminata where larger crop yields were recorded near tree lines than
far from the tree. This observation was reported in south western Uganda (Okorio et al.,
1994) and in northern Rwanda (Ukozehasi, 2006). Over yielding may be attributed to the
downward growth of coppice roots in this species (Wajja-Musukwe, 2003) and its narrow and
less compact canopy which seems to facilitate light penetration to the understorey crop.
Compared with other tree species, A. acuminana and G. robusta also had small root number:
trunk volume ratios (Okorio et al., 1994) which may also contribute to explain the less
competition. A. acuminata interacted positively with maize in Thika, Kenya, and this was

9
attributed to its ability to fix nitrogen (Muthiri et al., 2005). Similar observations have been
reported in Uganda (Peden et al., 1993) and in India (Sharma and Sharma, 1997).
Figure 1.2. The production possibility curves for two species, A and B. (a) Points
A1 and B1 represent the maximum production potential if species A and B were
grown in monocultures. Line A1 to B1 represents the proportional yield of
species A and B when grown in mixtures. (b) A hypothetical temporal production
possibility surface for species A and B (modified from Wojtkowski 1998). As
time progresses competition becomes more intense, thus resources become
limiting, over-yielding gives away to under-yielding, but a timely management
intervention (e.g., root pruning of trees) alleviates competitive interactions,
thereby resulting in over-yielding again.
Appropriate agroforestry systems are often assumed to provide the environmental functions
needed to ensure sustainability and maintain microclimatic and other favourable influences,
and it is assumed that such benefits may outweigh the disadvantages of a more complicated
management (Sanchez, 1995). Again, it is also assumed that agroforestry might be a practical
way to mimic the structure and function of natural ecosystems, since components of the latter

10
result from natural selection towards sustainability and the ability to adjust to perturbations
(Van Noordwijk and Ong, 1999). Natural ecosystems are known to have greater biodiversity
and the latter is known to be a major determinant of community and ecosystem dynamics and
functioning, and greater diversities lead to greater ecosystem stability, greater resistance to
invasion by exotic species, and lower disease incidence (Tilman et al., 2014). Previous
agroforestry reviews have highlighted several unexpected but substantial differences between
intensive agroforestry systems and their natural counterparts that would limit their adoption
for solving some of the critical land-use problems in the tropics (Ong and Leakey, 1999; van
Noordwijk and Ong, 1999). Denison and McGure (2015) also observe that higher diversity
may not necessarily lead to better performance of agroecosystems and that mimicry of natural
ecosystems may have little value in agriculture.
Spatial arrangement of individuals in tree-crop systems differ from place to place depending
on environment, farmers’ preferences and traditional cultural practices. Common
arrangements include: trees dispersed in the crop fields at varying tree densities; line
plantings (as in alley cropping, border plantings, contour plantings and windbreaks); complex
mixtures as in homegardens; or rotational or simultaneous woodlot systems. The varied
arrangement structures lead to complex systems which complicate the understanding of the
system performance. In west African parkland system alone, Bayala et al. (2015) identify
multiple interacting components: different tree species and crop varieties with variations at
field, watershed and landscape levels. There are also diverse management practices and
diverse spatial and temporal scales. All these factors influence resource capture and system
productivity in many different ways, and may contribute to the success or failure of the
system.
This study
The current study described Eucalyptus woodlot-agricultural crop system using maize as an
example. This system is common in areas that are characterised by high population densities
with small household landholdings and where tree woodlots are an integral part of the
farming systems. Rwanda is a typical example of areas where this type of tree-crop farming is
dominant. Trees are grown to supply fuelwood which is the main source of domestic energy
for cooking (Ndayambaje and Mohren, 2011) and wood for construction (Nduwamungu,
2011a). This field setting is such that, pure stands of eucalypt woodlots and pure maize fields
are growing next to each other. The system complies with the coarse mosaics of tree and crop
monocultures described by Van Noordwijk et al., 2012), hence it contains elements of
segregation as well as integration. It is a typical agroforestry system because plant
components in the two subsystems interact and influence each other’s growth and
reproduction. A system in this case is defined as – a structure consisting of interrelated
elements which interact (directly or indirectly). Usually it has boundaries that are usually
defined by the system observer. An agricultural system is an assemblage of components
which are united by some form of interaction and interdependence and which operate within
a prescribed boundary to achieve a specified agricultural objective on behalf of the
beneficiaries of the system (McConnell and Dillon, 1997). Depending on the scale of the

11
analysis, a farming system can encompass a few dozen or many millions of households.
Eucalyptus woodlots and maize crop make the components of our system and the interaction
between them is the focus in this study.
The tree species studied, Eucalyptus saligna, is one of the eucalypt species commonly
planted in Rwanda, especially in farming systems in the southern Province where it serves to
supply firewood to the local community (Nduwamungu et al., 2008).While pointing out that
there is information gap on fuelwood consumption rate data in Rwanda, Ndayambaje and
Mohren (2011) report that 92.2% of the population in rural areas and 93.5% in urban areas
rely on firewood and charcoal as the sources of domestic energy. An estimated 72% of this
comes from eucalypts (MINERENA, 2013). In addition, the soils of the study region are
known to be very poor, and together with hilly topography drive farmers to undertake some
soil erosion control practices. Among these, tree planting is very important and farmers in
Nyamagabe area, southern Rwanda, use eucalypt leaves and branches as mulch to reduce soil
loss by reducing kinetic energy of rain drops and nutrient losses through litter decomposition
(Nzeyimana et al., 2013).
The urgency of tree planting coupled with small landholdings per household, make the
conditions unavoidable to grow crops near woodlots, irrespective the fact that farmers are
aware that these trees compete with their crops. The subject of this study was to evaluate the
tree-crop interface in this setting as described later in the next sections of this thesis, by
evaluating tree growth, tree-crop interaction and their trade-offs; and tree water use since
these aspects are interrelated and contribute substantially to the farmers’ livelihoods in the
area.
The study site
The study was carried out in the southern part of the central plateau agro-ecological zone in
southern Rwanda (Delepierre, 1975), corresponding to the southern central zone according to
agro-ecological classification by Clay and Dejaegher (1987) in Huye and Gisagara districts
(Fig. 1.3). In this zone, Eucalyptus saligna is one of the most dominant plantation tree
species. According to the classifications, the zone is characterised by a bimodal rainfall
(March-May and September-December) and the mean annual rainfall is about 1200 mm.
Monthly means of daily temperature maxima range from 28.5 °C (April) to 32 °C
(September) and corresponding minima from 10 °C (April) to 9 °C (September). The soils are
derived from granitic rocks and are classified as oxisols or ultisols on the hills (Birasa et al.,
1990; Champelle, 1985).
Problem description
About 1,369,576 ha, equivalent to 52% of the total Rwandan surfaced area is arable land.
According to the countrywide forest inventory done in 2007, Eucalyptus plantations covered
63,600 ha and coppice woodlots on 39,200 ha (MINIRENA/CGIS-NUR, 2008). In 2010, new
eucalypt plantings plus the coppice woodlots covered 62,700 ha , making total eucalypt cover
to be 126,300 ha (Nduwamungu, 2011a). This inventory however, excluded <0.05 ha

12
woodlots and any forest whose cover was <10% and trees with DBH <7 cm. According to
FAO (2010), small woodlots and trees outside forests (including minor quantities of non-
Eucalyptus species) covered about 6.6% of the country area, equivalent to 173,830 ha.
Eucalyptus contributes 90% of the woodlots and trees outside forests (Ndayambaje et al.,
2014), leading to 156,447 ha, making a total eucalypt coverage of 282,747 ha, equivalent to
about 21% of the total arable land. In the past, tree planting on peoples’ fields were facilitated
by such factors as: 1. Community works practice locally called Umuganda; 2. Readily
availability of free planting material and 3. A tree tenure system which allowed growers to
own trees they planted (GTZ, 2008).
Figure 1.3. Rwanda map showing the study sites (marked with a red star)
Household eagerness to be self-sufficiency in tree resources to meet demand for firewood and
for other wood products led to growing trees on every land available, sometimes including
the best available land for food production. Land fragmentation as a function of population
growth led to progressive decline in land size per household, the latter being reported to have
decreased from 3 ha in 1960’s to <1 ha today (Verdoodt and Van Ranst, 2006). Mpyisi et al.
(2003) report average landholdings per household to be 0.5 ha in 2002. To meet household
food and wood requirements necessitated intercropping food crops with trees. This resulted in
intensive agroforestry practices where trees are either directly mixed with, or grown in very
close proximity to crops. For the same number of trees, a decrease in farmland size following
fragmentation means increased tree density and therefore a more intense tree-crop
competition. An inverse relationship between farm size and the amounts of woody biomass

13
was reported in Rwanda, where more average wood biomass per farm was observed in the
lower average farm size, high altitude region than in the higher farm size, low altitude region
(Ndayambaje et al., 2014). Similar relationships between farm size and on-farm tree biomass
production were observed in other areas as well (e.g. Chand et al., 2011; Thapa, 2007).
Under such circumstances, farmers’ possible strategy becomes to shift from woodlots to
growing fewer trees along lines or single trees scattered on crop field.
Intercropping trees with crops is known to reduce crop yield severely, especially in water
scarce areas (Ong and Leakey, 1999; Rao et al., 1998; Cooper et al., 1996). An expected
tendency would be the use of non- or less competitive tree species in such agroforestry
systems (Schroth, 1995). Farmers sometimes integrate under certain conditions, surprisingly
fast growing and presumably very competitive tree species in their agroforestry systems
(Schaller et al., 2003). Examples include the use of extremely fast growing Paraserianthes
falcataria (L) I.C. Nielsen and Eucalyptus deglupta Blume in coffee plantations in Indonesia
and Costa Rica respectively (Schaller et al., 2003), and Eucalyptus species in Rwanda. When
trees provide higher economic advantages for example, framers usually ignore tree
competitiveness and integrate them with crops. This has been observed in a range of study
conditions across countries and continents. Examples include in Africa: Rwanda
(Ndayambaje et al., 2014), Ethiopia (Zerihun and Kaba 2011) and Ghana (Isaac et al. 2009);
in Asia: China (Tang et al. 2012) and India (Banyal et al., 2011; Palsaniya et al., 2010), and
Europe: France (Mary et al. 1998). Eucalyptus urophylla was rated as very good by farmers
in Kageyo area (northern Rwanda) owing to its wood characteristics but very poor in terms of
compatibility with crops, yet 50% of all farmers grew the species (Bucagu et al., 2013).
Eucalyptus trees are reported to affect the environment negatively (Lemenih et al., 2004), to
suppress crops in the farming systems (Forrester et al., 2010) and to impart allelopathic
effects to crops growing in their vicinity (Hartemink, 2003).
Rwandan policy makers, based on allegations on eucalypts raised elsewhere that they use
much water and dry sites, suggested that the spp. should be eliminated from marshlands and
near other water bodies, and restricted their use in reforestation in the country (Gahigana,
2006). They are concerned with water availability for the irrigation of rice fields and for
hydropower generation.
Despite the alleged negative effects of eucalypt on water discharge and biodiversity, some
studies appraise eucalypts and report that growing them improve soil structure, organic
matter content and soil nutrients (Parrotta et al., 1997). The species are further reported to
improve native biodiversity restoration on degraded lands (Senbeta and Tekatay, 2001; Yirdaw, 2002).
With such contradictory reports on the effects of eucalypts, there is a need to conduct studies
to bridge the knowledge gaps for policy makers to make sound decisions to solve locally
specific problems rather than basing on exotic information which may not be appropriately
suited. Scanty information on the effects of eucalypts on the environment in Africa
complicates further the situation. The lack of information becomes even poorer in eastern
African region as revealed by Dye (1996). In the whole of Africa, only few studies have been

14
done in South Africa (Dye, 1996), in Ethiopia (Dessie and Erkossa, 2011) and in the Congo
(Bernhard-Reversat, 2001). No such studies have been done in Rwanda and in the east
African region. The aim of the present study is to contribute to the knowledge on eucalypt
growth, their effects on crop yields and thus on food security and their water relations as well
as the contribution to the livelihoods of rural farmers as income generators.
Research objectives and hypotheses
The main objective of this research is to contribute to the knowledge on the growth of
eucalypts under local conditions, and its effects on crop productivity and the environment.
The availability of this information and its dissemination will enable different stakeholders to
improve land use management practices for the sound environment. To this end, the
following series of specific objectives and hypotheses were put forward:
Objectives
To develop a general equation for the estimation of aboveground tree biomass
applicable to both planted and coppice stands of Eucalyptus saligna in the study area
To quantify the extent to which the competition for environmental resources manifest
itself in maize grain yield and how this varies with distance from Eucalyptus woodlots
along a line perpendicular to the tree-crop interface under the conditions of the study
site
To determine the area of maize field/eucalypt woodlot affected by the edge and the
extent of maize grain loss or gain in aboveground biomass, and the trade-offs between
the two components in an agroforestry system
To estimate the water use rate of eucalypt woodlots and compare this to the local
precipitation to learn if eucalypts transpire much water than the rain supplies
Hypotheses
The central agroforestry hypothesis by Cannell et al. (1996) is the overall hypothesis of our
study. It states that “benefits of growing trees with crops will occur only when the trees are
able to acquire resources of water, light and nutrients that the crops would not otherwise
acquire”. Under this, we further hypothesize that:
Coppice shoots and stems in coppice and planted stands of eucalypts differ
significantly in size yet total aboveground tree biomass estimation in both stand types
can be done by using a common general allometric equation
Eucalypt woodlots negatively affect crops grown in adjacent fields and both crops
and biophysical resources spatially differ with distance from the woodlots
Financial losses due to crop yield reduction in farmlands next to eucalypt woodlots
can be compensated for by extra biomass production in woodlot periphery trees to
maintain an overall system productivity beneficial to farmers
Trees in short rotation eucalypt woodlots use much water as to affect catchment water
balance negatively

15
Methodological Approach
The aim of this thesis was to evaluate this tree-crop combination biophysically to see if the
system benefits smallholder farmers practicing it. The field setting of the experiment
involved two apparently monoculture components, which would fall under the category of
fields + forests, as defined by Van Noordwijk et al. (2012). Due to an intense competition
between the eucalypt woodlots and maize crop in these mosaics, we consider the mosaic to
constitute an agroforestry system of our interest. What makes the two components one system
is the interaction between them, which was our main subject of investigation. The approach is
explained further in the next section, the thesis outline and more precisely under respective
chapters.
Thesis outline
This thesis is made up by six chapters outlined below. After Chapter one which introduces
the whole study, chapter two deals with the growth of eucalypt trees and develops a general
equation for use in predicting above ground tree biomass in both the coppice and the planted
stands of Eucalyptus saligna, a species most dominant in the study area among the eucalypts.
Separate equations have also been developed for the different tree components of stem,
branch leaves. Component models are useful in determining component biomass since in
practice; different biomass components represent different market commodities. Tree growth
reflects its capacity to capture and use resources, therefore its competitive power with other
plants. Chapter three evaluates the interaction between the maize as a representative annual
crop and the eucalypt woodlots. An analysis of tree-crop competition is made by examining
woodlot effects on soil physical (particle distribution) and chemical (nutrients), soil moisture
and solar radiation and how these change with distance from the tree-crop interface, and also
how soil pH, soil nutrients and soil moisture change with soil depth from the surface to 80 cm
below ground. These were consequently related to maize plant growth and grain yield.
Chapter four is also about tree growth and tree effects on maize crop. A comparison is made
on interspecific competition in the woodlot trees looking into the growth of individual trees at
the woodlot centre and those at its edge. The intraspecific competition (on the woodlot trees)
is combined with the interspecific competition observed in the previous chapter (the effects
of woodlot trees on maize crop) to evaluate the edge effects. A trade-off analysis is provided
on the eucalypt woodlot-maize agroforestry system by comparing in monetary terms, the
gains or extra biomass of the edge trees in the woodlots and the losses in maize yield when
the two components comprise a cropping system, and show whether the losses are
compensated for by the gains in this type of agroforestry system.
In Chapter five, eucalypt woodlot water relations is investigated at catchment scale. The tree
or woodlot capacity to capture water is an index of its competitive capacity. Tree water use
was estimated based on tree leaf area index relationship with tree diameter. A monthly water
balance was developed for two representative catchments in the study area whose main land
use is mixed crop production and eucalypts woodlot management. A comparison of the water

16
use by eucalypts was made with that of key crops in the area and also with that of eucalypts
in other areas worldwide.
The last chapter provides the general discussion and synthesises the main findings of this
study. Basing on the findings, conclusions and recommendations related to eucalypt growing
in relation to food crop yield and environmental protection are given.

17
CHAPTER 2: Above ground biomass prediction in coppice and planted stands of
Eucalyptus saligna
CP Mugunga KE Giller
& GMJ Mohren
Submitted

18

19
Above ground biomass prediction in coppice and planted stands of Eucalyptus saligna
CP Mugunga KE Giller
& GMJ Mohren
Abstract
We derived general equations to predict total tree and tree component aboveground biomass
for planted and coppice stands of Eucalyptus saligna in Southern Rwanda. The equations
were developed using data collected from 14 coppice and planted stands across the region.
Diameter alone or diameter and height were regressed against biomass and the best fitting
general allometric equations were selected. Variance was observed to increase with tree
diameter, necessitating the use of non-linear regression and Cunia’s regression weight of D4.
Biomass did not differ significantly between coppice and planted stands. Site differences
observed were attributed to cattle grazing practised in the past. Existing equations were not
applicable because they combined several eucalypt species, developed from a small sample
from a small area or were developed for other sites characteristically different from those of
the study region. While using both height and diameter only slightly improved the equation
precision, using both parameters in biomass equation development is recommended since this
usually allows for equation application to other regions. It is easy to measure height in this
species stands and errors associated with height measurement in this species may be minimal
due to bole straightness and light crowns.
Key words: Allometric equations, model performance, total tree above ground biomass, tree
component biomass, short rotation coppice systems
Introduction
Eucalyptus species are grown in Rwanda mainly as a source of firewood but also for the
supply of timber and other wood products (Nduwamungu et al., 2008). The trees are either
managed as short rotation (5-7 years) coppice or long rotation (≥20 years) stands for firewood
and timber production respectively. The eucalypt plantations typically belong to a variety of
owners from farmers through different private groups to the government (Nduwamungu,
2011b). The ownership pattern, among other factors affect planting and harvesting regimes,
leading to changes in stocks over time. Standing volume and aboveground biomass (WAGB)
are two main measures of forest stocking that are typically considered within the framework
of sustainable forest management and for carbon accounting purposes (Brandeis et al., 2006).
Accurate estimations of tree volume and forest biomass is crucial for assessing expected
yields from commercial and subsistence harvesting (Mwakalukwa et al., 2014). It is also
important for carbon storage assessments in relation to global climate change mitigation
measures (Husch et al., 2003; Freer-Smith et al., 2007). For this purpose, allometric estimates
of forest biomass can be applied to estimate carbon stocks and carbon fluxes when measured
repeatedly, thus providing means for estimating the amount of carbon dioxide released into or
removed from the atmosphere.
The basic principle of allometry can be used to predict a tree variable (typically its biomass)
from another dimension (e.g. its diameter), and an allometric equation quantitatively

20
formalizes this relationship (Picard et al., 2012). For instance, the proportions between height
and diameter, between crown height and diameter, between biomass and diameter, etc. follow
rules that are the same for all trees, big or small, as long as they are growing under the same
conditions (Bohlman & O’Brien, 2006; Dietze et al., 2008).
Furthermore, guidelines have been published in forest inventory for setting up permanent
plots, counting trees correctly (Sheil, 1995; Condit, 1998), and for estimating above ground
biomass stocks and changes, from these data (Clark et al., 2001; Philips et al., 2002; Chave et
al., 2004). However, one of the largest source of uncertainty in all estimates of carbon stocks
in planted and natural tropical forests is the lack of standard models to convert tree
measurements to biomass estimates (Chave et al., 2005).
A general practice has been to estimate volume and biomass from tree dendrometric
characteristics such as diameter and height, using established, general, or site-specific
allometric equations (De Gier, 2003; Navar, 2010). The selection of an appropriate allometric
equation is a key element in the accurate estimation of forest yield and stand productivity as
well as carbon stocks and changes in stocks from basic variables such as diameter and height
(De Ridder et al., 2010). Combining tree allometry and stand based inventory is probably the
most accurate technique to detect the biomass change in short to medium term and are often
used to validate model outputs and remotely sensed spatial predictions of biomass (Burrows et
al., 2000).
Allometric models have been used in estimating tree biomass in Eucalyptus for different areas
(Saint-Andre et al., 2005; Montagu et al., 2005; Williams et al., 2005). The equations can be
species specific when applied to one species, or general when developed for more species as
in forests or woodlands of mixed species (Williams et al., 2005). Very few allometric
equations exist for sub-Saharan Africa (Henry et al., 2011). The equations have only been
very rarely used in agroforestry systems where biomass from trees grown in crop fields is
estimated (Lott et al., 2003). Even in forestry, such equations are usually used on trees
managed under planted systems and are less applied to trees from coppice stands (Antonio et
al., 2007).
Unfortunately, allometric equations often produce biased results when applied outside the
forest area or region where they were developed (Litton, 2008; Mwakalukwa et al., 2014).
Direct measurement of plant biomass is by destructive sampling and is a tedious and time-
consuming process. If high accuracy is required, it is recommended to develop local biomass
and volume equations or at least to harvest and measure a few trees, representing the range of
tree sizes typically found in the forest, and use these to check the validity of the applied
equation under local conditions (Brown, 2002; Henry et al., 2011). Once an allometric model
is developed, biomass estimation will only need a set of few sample trees for validation so as
to apply it in a given area.
Although eucalypts are very important in agroforestry and plantation forestry in Rwanda, no
readily available models exist locally that can be used to estimate biomass. Only a limited
number of species specific volume equations were developed for different eucalypt species

21
but these were based on data collected from a few 0.25ha plots from one small, experimental
location, Ruhande Arboretum (Burren, 1995). This paper presents allometric models for
estimating whole tree and tree component biomass from both coppice and planted stands of E.
saligna in southern Rwanda, where this species dominates. Specific objectives were: a) to
develop allometric model(s) for use in predicting total tree and tree component biomass
applicable to both coppice and planted stands of Eucalyptus saligna; b) to explore if the
variance increases with tree diameter; c) to study if there are any differences between coppice
and planted stands or among sites; and d) to explore ways to improve the model(s).
Materials and methods
Study site
The study was carried out in the southern part of the central plateau agro-ecological zone in
southern Rwanda (Delepierre, 1975), where Eucalyptus saligna is one of the dominant
plantation tree species. According to the classification, the zone is characterised by a bimodal
rainfall (March-May and September-December) and the mean annual rainfall is about 1200
mm. Monthly means of daily temperature maxima range from 28.5 °C (April) to 32 °C
(September) and corresponding minima from 10 °C (April) to 9 °C (September).
Data sources and biomass estimation
Tree measurements and biomass harvests were taken from woodlots owned by farmers,
private organisations and local governments. Due to diverse ownership, it was not possible to
get exact information on individual stand background as regards to the establishment (and
therefore, the age) and management practices carried out on most of the study woodlots.
However, different size classes were ensured during sample selection which assumed to
cover a range of age classes available in the area; for the woodlots whose age was known, it
ranged from 6-22 years.
Descriptive data for the stands used in this study are summarised in Table 2.1. Destructive
sampling was done for all sample stems, with diameter at breast height (D) and total tree
height (H) measured prior to felling. Tree cutting was done as close to the ground as possible,
but in coppice stands, this was sometimes as high as 20 cm above the ground, depending on
the heights of the previous cuttings. All sample trees were separated into stem, branch, bark
and leaf components based on the procedure by Montagu et al. (2005), and immediately
measured for fresh weight using a spring balance. For each sample tree, sub-samples of each
component were taken for dry matter determination in the laboratory at the Faculty of
Agriculture of the University of Rwanda, Huye Campus, where they were oven-dried at
100oC until the mass remained constant. To estimate the mean ratios estimator R per site and
biomass for a given sample were calculated as follows:
22
1
1
th
th
where = the dry weight of the sample within site of component
= the fresh weight of the sample within
j
j
n
ci
icj n
ci
i
ci
ci
Wdrys
R
Wfrs
Wdrys i j c
Wfrs i site of component
= the number of samples per component within site j
j c
n j
1
With this ratio, the tree component dry weights were estimated as:
th
th
ˆ ˆ
ˆ where = the dry weight of component of the tree within site
= the fresh weight of component of the tree wit
cij cj cij
cij
cij
Wdry R Wfr
Wdry c i j
Wfr c i
hin site
ˆ the mean Ration for component between dry weight and
fresh weight within site (estimated with Formula 1)
cj
j
R c
j
2
For simplicity, the dry weight for whole tree will here-in-after denoted as WAGB and that of
different tree components of stem, branch, bark and leaf as WST, WBR, WBA and WLF
respectively.
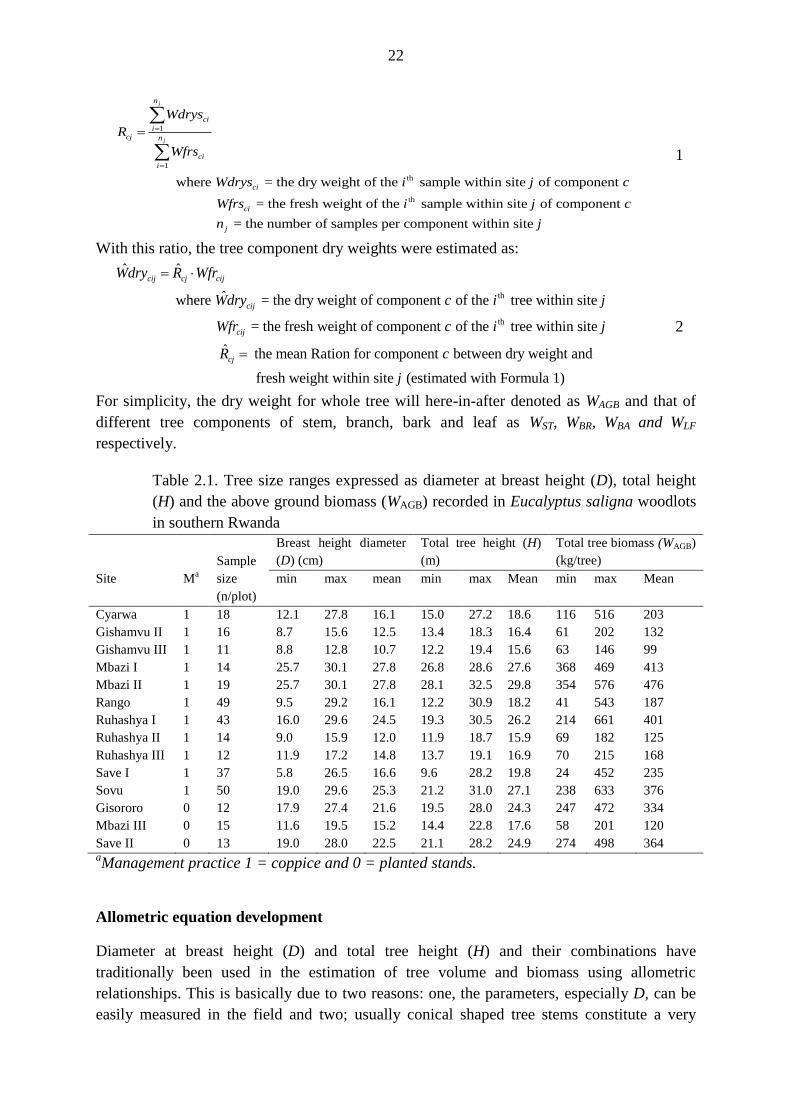
Table 2.1. Tree size ranges expressed as diameter at breast height (D), total height
(H) and the above ground biomass (WAGB) recorded in Eucalyptus saligna woodlots
in southern Rwanda
Site Ma
Sample
size
(n/plot)
Breast height diameter
(D) (cm)
Total tree height (H)
(m)
Total tree biomass (WAGB)
(kg/tree)
min max mean min max Mean min max Mean
Cyarwa 1 18 12.1 27.8 16.1 15.0 27.2 18.6 116 516 203
Gishamvu II 1 16 8.7 15.6 12.5 13.4 18.3 16.4 61 202 132
Gishamvu III 1 11 8.8 12.8 10.7 12.2 19.4 15.6 63 146 99
Mbazi I 1 14 25.7 30.1 27.8 26.8 28.6 27.6 368 469 413
Mbazi II 1 19 25.7 30.1 27.8 28.1 32.5 29.8 354 576 476
Rango 1 49 9.5 29.2 16.1 12.2 30.9 18.2 41 543 187
Ruhashya I 1 43 16.0 29.6 24.5 19.3 30.5 26.2 214 661 401
Ruhashya II 1 14 9.0 15.9 12.0 11.9 18.7 15.9 69 182 125
Ruhashya III 1 12 11.9 17.2 14.8 13.7 19.1 16.9 70 215 168
Save I 1 37 5.8 26.5 16.6 9.6 28.2 19.8 24 452 235
Sovu 1 50 19.0 29.6 25.3 21.2 31.0 27.1 238 633 376
Gisororo 0 12 17.9 27.4 21.6 19.5 28.0 24.3 247 472 334
Mbazi III 0 15 11.6 19.5 15.2 14.4 22.8 17.6 58 201 120
Save II 0 13 19.0 28.0 22.5 21.1 28.2 24.9 274 498 364 aManagement practice 1 = coppice and 0 = planted stands.
Allometric equation development
Diameter at breast height (D) and total tree height (H) and their combinations have
traditionally been used in the estimation of tree volume and biomass using allometric
relationships. This is basically due to two reasons: one, the parameters, especially D, can be
easily measured in the field and two; usually conical shaped tree stems constitute a very

23
significant portion of the whole tree biomass. Basal area alone, or in combination with height
therefore, can explain most of the variation in total above ground volume or biomass of a
tree. Basically, the models tested in this study were based on those developed many years
back by Berkhout (1920); Schumacher and Hall (1933); Hohenadl (1936). These are in line
with those used in other places for the same purpose, example, those used by Zianis et al.
(2005). The models are of the form:
2
(Berkhout, 1920)
(Schumacher and Hall, 1933)
(Hohenadl, 1936)
b
b c
a D
V a D H
a b D c D
3
conforming also to the model types used by Whitesell et al. (1988) in Hawaii and Faunweban
and Haullier (1997) in Cameroon, and by Burren (1995) and Nduwamungu et al. (2008) in
Rwanda, and by Fantu et al. (2010) in Ethiopia.
The following research questions were posed: which model performs best for E. saligna
WAGB estimation?; does variation increase with increasing tree diameter in which case a
regression weight is needed?, and is there any difference(s) between planted and coppice
stands or between sites?
Data analysis
Data were analysed using IBM SPSS 22 software. The data set comprised of 323 stems and
coppice shoots from 11 and 3 coppice and planted stands respectively. The following five
models were fitted to the data.
2
2 1
2
2 2
1
1
2
1 2
1
1 1
model 1
model 2
model 3
model 4
model 5
b
b c
b
b
AGB
AGB
AGB
AGB
AGB
c
b D
b D H
a b D
W
W
b D
a b
W
W
W
D
a b D c H
where WAGB = above ground biomass for the whole tree (kg/tree), D = tree breast height
diameter (cm) and H = total tree height (m). The models were used for both the total
aboveground biomass (WAGB) and for the different tree component biomass of stem (WST),
branches (WBR), bark (WBA) and leaf (WLF). About 20% of the leaf component was made of
flowers, fruits and twigs which were considered as part of the leaf component. When applied
to the components, WAGB in the models was then replaced by a specific tree biomass
component being tested.
Model testing
All models were judged basing on the coefficient of determination (R2), but because not all
models had the same number of parameters the R2adj was used. For the analyses, the IBM
SPSS 22 software was used. The parameters were estimated in this package by finding
parameters under the condition that the sum of the residues is 0 and the sum of the squares of

24
the residues is minimal. But these conditions give no guarantee that there is no bias within the
data range of D and H. This means that problems may arise when extrapolating the function
for trees with different dimensions. So an additional criterion is needed and the following
model was used to control the diameter related bias.
th
th
ˆ
where = the biomass observation the tree
ˆ = the model prediction for the biomass for the tree
i i i i
i
i
residual W W a b D
W i
W i
4
For a good model, a and b do not significantly differ from 0. Also, residuals were plotted
against diameter to examine the goodness of fit of the models.
To calculate the model parameters appropriately assumptions had to be made whether equal
or unequal variance is expected. Cunia (1964) stated that all biomass equations are
heteroscedastic and he advised to use a regression weight, rgw = D4. Thus,
2
4 2 2
model error
where error standard error
the standard error has expectation = 0 and variance = 1
the variance of
i i i
i i i
W
D
W D rgw
5
The analysis of the models 1 to 5 was done in the following five steps:
Step 1. First the models were fitted with the data set without any regression weight. To check
if there is heteroscedacity, model residuals were plotted against D. By doing this for model 1
in a preliminary analysis a regression weight (rgw) = D3.3
was found, the estimated value of
the exponent was 3.3 but Cunia’s value 4 was within the confidence interval. For the other
models, comparable results were found. Since it is not recommended to calculate a regression
weight in the same study data set as it will be applied to, Cunia’s 4rgw D was adopted.
Step 2. The models were again fitted with a rgw of D4.
Step 3. The relationship between the residuals of models 1 and 2 was examined as a linear
function in D.
Step 4. Site factor was introduced to the predicted value of model 2. In addition, quadratic
mean diameter (dq), the mean height (hm) and the coppice factor, were incorporated in the
analysis for coppice stands.
As will be seen in the results section, some sites were more similar than others and in general,
two site groups were observed. By splitting the data in the two groups, parameters for the
models per group could be calculated. But in that case, it was difficult to judge if the
parameters per group really differ. With the help of the auxiliary variable group, it was
possible to estimate the parameters in one analysis per model. In Formula 6 this is
demonstrated for model 1. If the parameters b11 and/or b21 are significant, the groups have
different parameter sets.
2
1
1 10 11
2 20 21
1. Model 1 new :
where
1 for sites of Mbazi I, Mbazi II, Mbazi III and So
bW b D
b b b group
b b b group
group
vu
0 for other sites
6

25
In Formula 7, the same procedure for model 2 was done:
2 1
1
1 10 11
2 20 21
1 10 11
2. Model 2 new :
where
for
b cW b D H
b b b group
b b b group
c c c group
g
see Formula 6roup
7
For the models 3 to 5 comparable adaptations could be made.
Step 5. Bias correction was done by using the following non-linear model:
ˆ
ˆ where the predicted value for in a certain group in Formula 6 and 7
W cor W
W W
8
Analysis of tree biomass components
Tree biomass components of stem, branch, bark and leaf were analysed in the same manner
and all the steps above were followed. However, the sum of unbiased estimates of the four
components will be unequal to the unbiased estimate of the total dry biomass (as calculated
before). Therefore, a much simpler procedure was followed by estimating the fraction of each
component with a simple linear fit in D:
where fraction of the biomass component
dry weight of component
the combined total dry weight of the four biomass components.
c
c
F W W a b D
F
W c
W
9
As for the total tree biomass, the site effect was analysed for the different biomass
components.
Results
Tree variation and relationship between W and predictor variables
The variation in tree size in the study area was very high and differences were significant
between sites but not between management systems. Size ranges for D, H and WAGB were
presented in Table 2.1 and tree D ranged from 5.8 to 30.1 cm, H from 9.6 to 32.5 m and W
from 24.0 to 633.0 kg/tree.
Model performance comparisons
Plots of total tree biomass as related to tree D and the predicted and observed total tree
biomass are presented in Fig. 2.1 and 2.2 respectively. In step 1 of model analysis, it is clear
that there is heteroscedacity in the data as observed in the plot of residuals against D for
model 1 (Fig. 2.3).

26
Figure 2.1. Observed total tree biomass as related to tree diameter at breast height
in Eucalyptus saligna woodlots in southern Rwanda
Figure 2.2. Predicted total tree biomass plotted against the observed total tree
biomass in Eucalyptus saligna woodlots in southern Rwanda
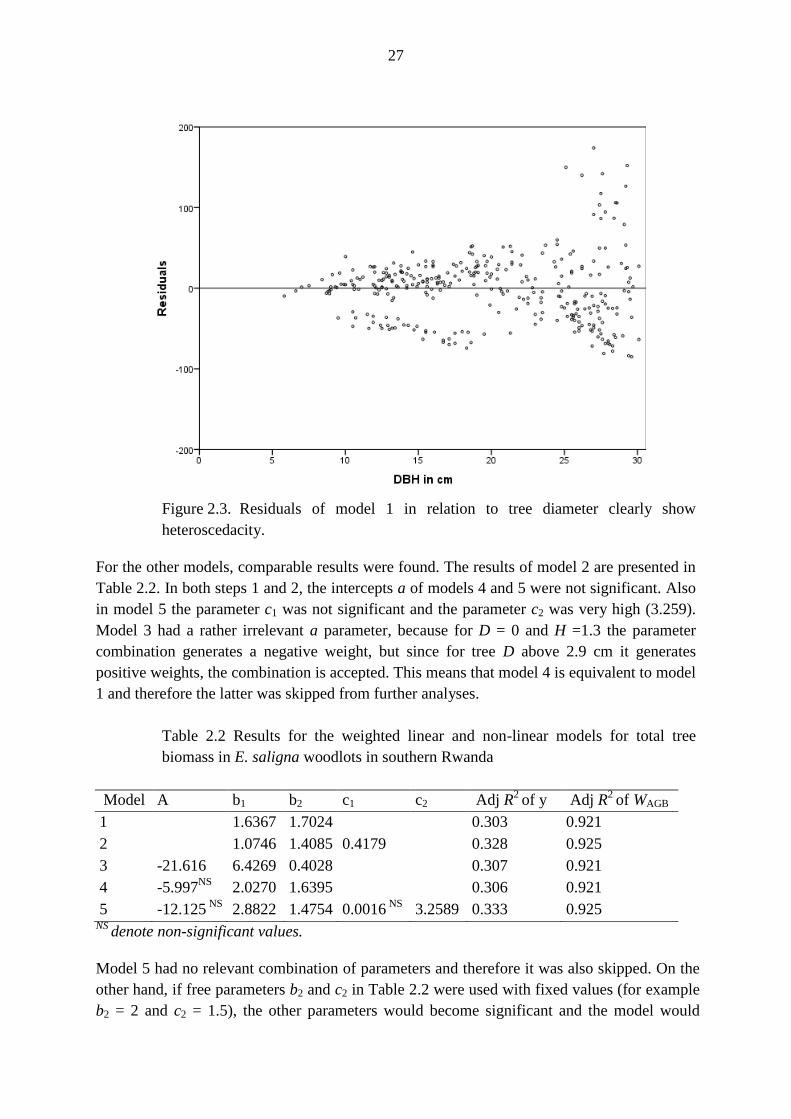
27
Figure 2.3. Residuals of model 1 in relation to tree diameter clearly show
heteroscedacity.
For the other models, comparable results were found. The results of model 2 are presented in
Table 2.2. In both steps 1 and 2, the intercepts a of models 4 and 5 were not significant. Also
in model 5 the parameter c1 was not significant and the parameter c2 was very high (3.259).
Model 3 had a rather irrelevant a parameter, because for D = 0 and H =1.3 the parameter
combination generates a negative weight, but since for tree D above 2.9 cm it generates
positive weights, the combination is accepted. This means that model 4 is equivalent to model
1 and therefore the latter was skipped from further analyses.
Table 2.2 Results for the weighted linear and non-linear models for total tree
biomass in E. saligna woodlots in southern Rwanda
Model A b1 b2 c1 c2 Adj R2
of y Adj R2
of WAGB
1 1.6367 1.7024
0.303 0.921
2 1.0746 1.4085 0.4179 0.328 0.925
3 -21.616 6.4269 0.4028
0.307 0.921
4 -5.997NS
2.0270 1.6395
0.306 0.921
5 -12.125 NS
2.8822 1.4754 0.0016 NS
3.2589 0.333 0.925 NS
denote non-significant values.
Model 5 had no relevant combination of parameters and therefore it was also skipped. On the
other hand, if free parameters b2 and c2 in Table 2.2 were used with fixed values (for example
b2 = 2 and c2 = 1.5), the other parameters would become significant and the model would

28
therefore be suitable for this study. In this case however, the adjusted R2 (= 0.921) is lower
than that obtained in model 2 (R2 = 0.925). The R
2 for all models was rather low since in most
biomass studies the R2 is 0.95 or higher. Model 2 performed best for models that combine D
and H but model 1 was the best of the tested models when only D was used. In step 3 the bias
as a function of tree diameter (the relationship between the residuals of model 1 and 2) is
presented in Fig. 2.4 and was not significantly different from the x-axis.
Figure 2.4. Residuals for model 2 (left) and model 3 (right) as a function of the
diameter. The bold straight line is the linear fit, the hatched line is a Loes
smoothing curve with 50% of the data and an Epanechnikov kernel Smoother in
SPSS Graph.

29
Likewise, a smoothing curve drawn to the data showed the lack of fitness as there was no
difference between model 1 and 2. But the curving below and above the x-axis can be related
to other factors, such as site effects. The incorporation of site effect in model 2 gave very
significant results and the adjusted R2 was raised to about 0.944. The incorporation of the
quadratic mean diameter (dg) and the mean height (hm) for coppice stands gave significant
outcomes but the adjusted R2 was only slightly improved (from 0.925 to 0.929) (Table 2.3).
Table 2.3. ANOVA of Test Between-Subjects Effects when model 2 includes site,
quadratic mean D, mean H and coppice effects in Eucalyptus saligna woodlots in
southern Rwanda.
Source Type III Sum of
Squares Df Mean Square F Sig.
Model 31,607,322 5 6,321,464 4,029.39 0.000
Coppice 498 2 249 0.16 0.853
WAGB_2b 2,312,457 1 2,312,457 1,473.99 0.000
dg 13,552 1 13,552 8.64 0.004
hm 6,565 1 6,565 4.18 0.042
Error 498,891 318 1,569
Total 32106214 323 bPredicted tree biomass using model 2
However, this improvement is not good enough to necessitate the use of complicated models
with dg and hm. The coppice factor did not give significant results (Table 2.4). Biomass
prediction basing on site effect gave more than one group in all the sites, and generally, two
groups were observed namely: group I. Mbazi and Sovu sites and group II. the other sites
(Fig. 2.5 & 2.6). This procedure raised the adjusted R2 of model 1 from 0.921 to 0.938 when
D alone was used in the model and from 0.925 to 0.944 when both D and H were applied.
With this procedure, separate values for the parameters of both models for both groups were
calculated and they are given for the parameters b2 and c1 (Tale 2.4). The values for b1
(corrected to avoid bias through weighted non-linear regression) are also presented in Table
2.4.
Table 2.4. Total tree biomass calculated using models 1 and 2 with and without site
grouping by location in Eucalyptus saligna woodlots in southern Rwanda
model Group b1 b2 c1 Adjusted
R2 of y
Adjusted R2
of WAGB σy σW
1 Mbazi & Sovu 0.3438 2.1584 0.467 0.938 0.1017 0.1017·D
2
Other sites 1.4750 1.7527
All sites 1.6367 1.7024 0.301 0.921 0.1165 0.1165·D2
2 Mbazi & Sovu 0.2526 1.8551 0.3917 0.488 0.944 0.0997 0.0997·D
2
Other sites 0.9703 1.4851 0.3917
All sites 1.0746 1.4085 0.4179 0.322 0.925 0.1146 0.1146·D2

30
Figure 2.5. Error bar with 95 % confidence interval for residuals with model 2 by
site.
Figure 2.6. Total tree dry biomass as function of the diameter at breast height with
the curves of model 1 (the hatched line is for Mbazi & Sovu).

31
Analysis for the weights of the tree components
The relationship of the different tree biomass components and tree diameter at breast height
obtained by applying step 5 above are presented in Figures 2.7a-d while the plots of the
observed against predicted values for the same components are presented in Figures 2.8a-d
below. In figure 2.9, the observation and the regression line are drawn for the bark
component. Also the group effect tried out in an earlier version of equation 9 for total tree
biomass was not significant. For this reason, only the means were presented as percentage for
the four tree component biomass (Fig. 2.10) and there is hardly any difference when either
equation 9 or the means are used to determine total tree biomass. Stem contributed
significzntly to the total tree above ground biomass production, accounting for about 80%
with the remaining proportion being shared among the other tree components.

32
Figure 2.7. Relationship between dry biomass for the stem (a), branch (b), bark (c) and leaf
components and tree diameter at breast height in E. saligna woodlots in southern Rwanda
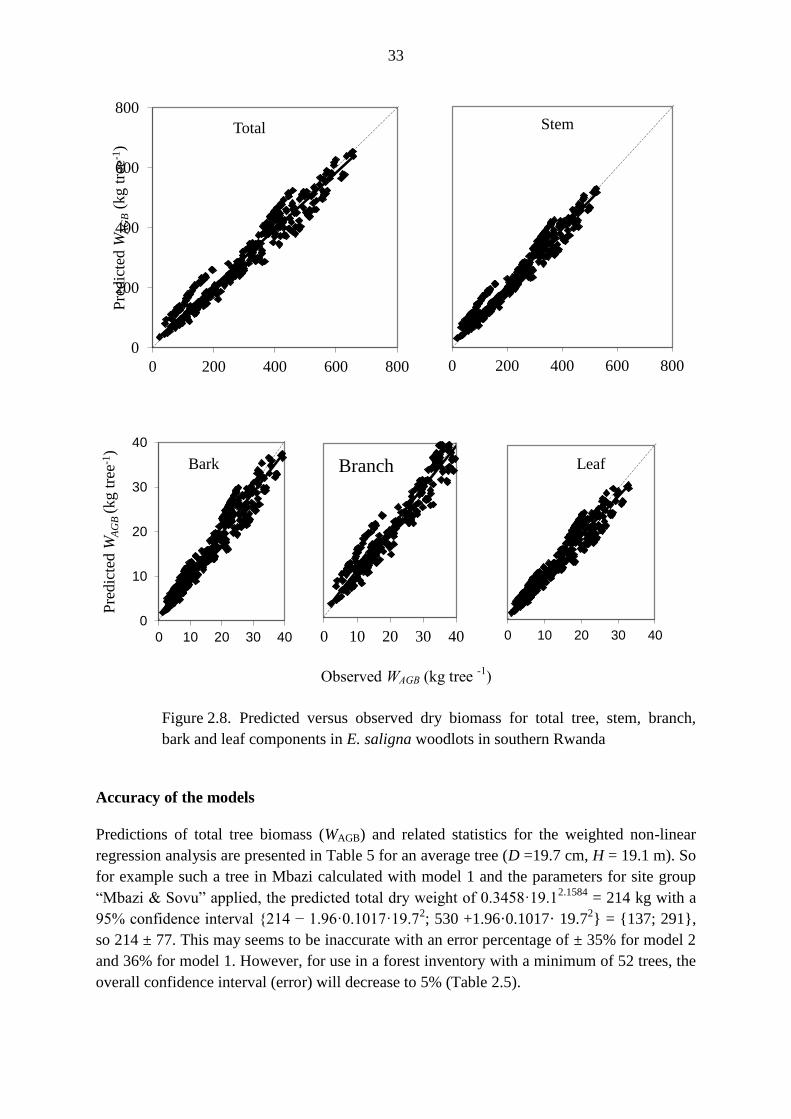
33
Figure 2.8. Predicted versus observed dry biomass for total tree, stem, branch,
bark and leaf components in E. saligna woodlots in southern Rwanda
Accuracy of the models
Predictions of total tree biomass (WAGB) and related statistics for the weighted non-linear
regression analysis are presented in Table 5 for an average tree (D =19.7 cm, H = 19.1 m). So
for example such a tree in Mbazi calculated with model 1 and the parameters for site group
“Mbazi & Sovu” applied, the predicted total dry weight of 0.3458·19.12.1584
= 214 kg with a
95% confidence interval {214 − 1.96·0.1017·19.72; 530 +1.96·0.1017· 19.7
2} = {137; 291},
so 214 ± 77. This may seems to be inaccurate with an error percentage of ± 35% for model 2
and 36% for model 1. However, for use in a forest inventory with a minimum of 52 trees, the
overall confidence interval (error) will decrease to 5% (Table 2.5).
0
200
400
600
800
0 200 400 600 800
Pre
dic
ted W
AG
B (
kg t
ree-1
) Total
0 200 400 600 800
Stem
0
10
20
30
40
0 10 20 30 40
Pre
dic
ted W
AG
B (
kg t
ree-1
)
Bark
0 10 20 30 40
Branch
0 10 20 30 40
Leaf
Observed WAGB (kg tree -1
)

34
Figure 2.9. Relationship between bark fraction biomass and tree diameter at breast
height in E. saligna short rotation woodlots in southern Rwanda.
Figure 2.10. Percentage partitioning of total tree biomass by components
0
10
20
30
40
50
60
70
80
90
Stem Branch Bark Leaf
Com
ponen
t tr
ee b
iom
ass
(%)

35
Discussion
The present study was done on a variety of trees from both planted and coppiced stands. The
observed range in tree size is expected, since the age of trees and coppice shoots also varied.
Although no site quality and its effect on tree growth was evaluated, variation is expected to
be high due to such differences in topography, position of stands on the hillside, soil types
and quality, etc. which varied in different stands in the study area. This variation in
environmental factors is reflected in growth and biomass production of Eucalyptus (Eldridge
et al., 1994; Bouvet et al. 2005).
Table 2.5. Predicted biomass and related statistic values for an average tree with D
= 19.7 cm and H = 22.1 m in Eucalyptus saligna woodlots in southern Rwanda.
Model Group W σW 95% confidence interval Error
% n (5% error)
1 Mbazi & Sovu 214 39 {137,291} 36% 52
Other sites 274 39 {197,351} 28% 32
All sites 262 45 {137,350} 34% 46
2 Mbazi & Sovu 214 39 {138,290} 35% 50
Other sites 273 39 {197,349} 28% 31
All sites 261 44 {174,348} 33% 45
The observed variation in tree dimensions in the study woodlots where some coppice stands
had shoots bigger than some trees from planted stands may reflect, in addition to tree age and
site differences, the varied and changing management objectives. Some managers may
establish eucalypts primarily for fuelwood production. Later in the process, they may decide
to change management objectives to timber production depending on the market situation or
household wealth status or financial needs. This leads to increasing coppice rotation longer
than normal and thus, larger coppice shoots. This fact may have contributed to the observed
lack of significant differences in biomass production between coppice shoots and planted
stand stems. Harrington and Fownes (1993) found that the allometry of woody biomass and
leaf area did not differ between planted and coppice stands all studied tree species namely:
Acacia auriculiformis, Eucalyptus camaldulensis, Gliricidia sepium and Leucaena
diversifolia.
Nduwamungu et al. (2008) report that about 75-80% of all eucalypt woodlots in the country
are managed as short rotation stands. Precise allometric models have been developed using
fewer trees than those used from planted stands in this study (Dudley and Fownes, 1992). In
agroforestry systems, some authors report the successful application of a total of as few as 12
trees in developing allometric models for biomass estimation (Dossa et al., 2008). A sample
size of ≥50 trees in plantation forestry is considered large enough to provide accurate
parameter estimates by Coomes and Allen (2009) while Saint-Andre et al. (2005) considers as
low as 12 trees to be enough for this purpose. While the data from planted stands for model
development used in this study is less than that from coppice stands, it is about four times the
acceptable minimum number reported by Saint-Andre et al. (2005) and Dossa et al. (2008).

36
The main objective of this study was to develop a general allometric model that would be
applied to both coppice and planted stands of E. saligna in southern Rwanda. The observed
site effects and consequent subgroups is not unexpected since species and site specific models
are known to be more accurate and efficient predictors of tree biomass than general models
combining more than one species or sites. Why the data separates into two subgroups is
unclear. All woodlots in Group I (Sovu and Mbazi group) showed consistently lower WAGB
than trees in the other group at the same D. Group I sites are geographically located closer to
each other compared to the remaining sites and therefore, site conditions may be similar.
Again, the woodlots in these sites belonged to Benedictine and Franciscan nuns and were
commonly used for free cattle grazing in the past, which may have contributed to the observed
similarity in biomass production. This needs further investigation.
High variability in site conditions, stand management, age and tree density negatively
influence the precision of a model to predict biomass (Lin et al., 2001). To reduce errors in
our study, we opted to apply non-linear regression because it is better suited to data which is
likely to have heteroscedacity (Xiao et al., 2011). Heteroscedacity is known to be high for
individual trees with large diameter in a population (Litton, 2008). The obtained models in the
current study are reasonably accurate irrespective the high variability in site conditions, stand
management, age and cutting cycle for short rotation coppice stands. This, according to
Medhurst et al. (1999), may imply fitness and the power of the predictive capacity of a model
in question.
Using quadratic mean diameter (dg) and quadratic mean height (hm) only improved the model
efficiency very slightly and thus does not necessitate the use of such complicated procedure to
estimate tree WAGB. In our study therefore, only D or the combination of D and H remained
the choice parameters to be used. Combining the two parameters however, gave better results
than when D alone was used. The two traits are routinely used to predict above ground tree
biomass in forestry (De Gier, 2003; Navar, 2010).
Several studies have concluded that the use of D alone for estimating tree WAGB is reasonable
since D is the easiest parameter to measure and accounts for most of the variation (Williams et
al., 2005). In addition, the use of D alone avoids errors associated with height measurements,
which may be up to 10-15% (Landsberg and Waring, 1997; Verwijst & Telenius, 1999;
Brown, 2002). Sometimes the use of height as a predictor variable to develop a general
allometric model results in an underestimation compared to when D alone is used (Montagu et
al., 2005). On the other hand, other authors have found a significant improvement of model
fitting when H is also used as a predictor variable (Reed & Tome, 1998; Monserud &
Marshall, 1999). Ketterings et al. (2001) suggest the use of height as a predictor variable
irrespective the fact that it is tedious to measure and may not explain more of the variance at
the sites where the data has originated. The authors justify the incorporation of H saying that
it has the advantage of increasing the equation’s potential applicability to other sites, as height
is usually correlated with site quality. This is supported by the fact that the residuals are
usually reduced when both D and H are combined compared to when D alone is used.

37
Prediction of biomass in the different tree components of stem, branch, bark and leaf were
reasonably and accurately predicted by using the same equations as the ones used to estimate
total tree biomass. The use of one model for the different tree components makes biomass
prediction much easier. Tree component biomass obtained in this study is within the range
reported in other places for E. saligna (Fantu et al., 2010). This proportionality in biomass
production by different tree components seems to be similar in different Eucalyptus species as
reported by others (Zewdie et al., 2008; Akindele et al., 2010; Razakamanarivo et al., 2012).
Similar findings have been reported in terms of sequestered carbon (Montagnini and Nair,
2004; Ryan, 2010; Campoe et al., 2012) assuming carbon sequestration to be 50% of total tree
dry biomass (Nair, 2012).
The combination of D and H has been reported to be more important for WAGB estimations in
stem-wood than in other tree biomass components. Tree height was reported to improve the
accuracy of the stem models but not of the crown models (Lambert et al., 2005; Bi et al.,
2004). Pitt and Bell (2004) also found large increases in model predictive capacity for stem
biomass estimates but the addition of H was not necessary for estimating needle and branch
biomass. It has been argued that the H variable can take into account the effects of stand age,
density, and site quality (e.g., Ter-Mikaelian and Parker, 2000). Antonio (2007) reports a
similar observation and the same may apply in the present study.
Several models developed in this study generally behaved in a similar manner through
different evaluation and validation tests of fitness. The accuracy observed in the prediction of
WAGB in total tree and stem component was similar to that reported in other studies (Fantu et
al., 2010). The observed under- or over-estimation of WAGB in some models is not surprising
as this is also reported in other studies (Akindele et al., 2010) and is known to vary with stand
age (Fantu et al., 2010). Precision of carbon stock estimates were observed to decline with
plantation age reflecting the variation of tree growth across an estate that occur in its early
stages than at older ages (Specht and West, 2003). This may be more expected when dealing
with coppice stands, especially when the number of cutting cycles increases (Zewdie et al.,
2008).
The application of models developed by others in the study area or elsewhere was not
successful. Reasons for this may be that 1) the model by Burren (1995) was developed using
data collected from a few trees harvested from a very limited area and was for application in
planted stands only without considering coppice shoots; 2) the model by Nduwamungu et al.,
(2008) was developed from a comparatively larger number of trees specifically for use in
planted stands of several eucalypt species and 3) the model by Fantu et al. (2010) was
specifically for E. saligna planted stands but in an environment (Ethiopia) different from the
current study area. Equations from harvests of small numbers of trees may produce good
estimates for a given site, but these equations may not extrapolate satisfactorily to other sites
(Dudley and Fownes, 1992).
38
Conclusion
The biomass estimation of Eucalyptus saligna in southern Rwanda from both coppice and
planted stands using a general allometric model was possible with an adjusted R2 for the best
model of 0.944. The incorporation of quadratic mean diameter and mean height for coppice
stands gave significant outcomes but the adjusted R2 was only slightly improved (from 0.925
to 0.929) and did not justify the use of a more complex model. The variance increased with
increasing diameter and this was addressed by applying non-linear regression approach for
data analysis and using Cunia’s regression weight (rgw) of D4. Site differences were observed
and stratifying the study site into two subgroups lead to an increase in the adjusted R2
from
0.921 to 0.938 when D alone was used and from 0.925 to 0.944 when both D and H were
applied. With this procedure, separate values for the parameters of both models and for both
groups were calculated. The prediction of WAGB of the different tree components of stem,
branch, bark and leaf was also possible across the region using the same general models for
WAGB in coppice and planted stands. This tool may be very useful in the valuation of tree and
tree products since different tree components may present independent market commodities
at different periods. While the use of D and H only slightly improved the model precision in
biomass predictions, it is advised that, both parameters be used in WAGB estimation for two
reasons: 1) due to trees’ straight boles and light crowns in E. saligna pure stands, tree height
measurements is easy and the errors associated with the measurement may be minimal. 2)
The use of D and H is reported to be more important when the model is applied to a range of
sites including those from outside the area where the model was developed. This may
increase the possibility of applying the models developed in this study to parts of the country
other than the study area.

39
CHAPTER 3: Tree-crop interactions in maize-eucalypt woodlot agroforestry systems
CP Mugunga, KE Giller and GMJ Mohren
Submitted

40

41
Tree-crop interactions in maize-eucalypt woodlot agroforestry systems
CP Mugunga, KE Giller and GMJ Mohren
Abstract
We studied the interaction between Eucalyptus saligna woodlots and maize crop in southern
Rwanda. Three sites were selected and in each, a eucalypt woodlot with mature trees and a
suitable adjoining crop field of 12.75 m × 30 m was selected. This was split into two plots of
6 m × 12 m and further subdivided into nine sub-plots running parallel to the tree-crop
interface. Maize was grown in both 6 m × 12 m plots and one of these received fertiliser. Soil
moisture, nutrients and solar radiation were significantly reduced near the woodlot,
diminishing grain yield by 80% in the 10.5 m crop-field strip next to the woodlot. This
reduction however affects only 10.5% of the maize crop field, leaving 89.5% unaffected.
Spreading the loss to a hectare crop field, leads to an actual yield loss of 0.21 t ha-1
,
equivalent to 8.4%.. Expressing yield loss in tree-crop systems usually presented as a
percentage of yield recorded near the trees to that obtained in open areas may be misleading.
Actual yields should be reported with corresponding crop field areas affected. Coincidentally,
soil moisture, soil N and K increased from the woodlot-maize interface up to 10.5 m and
thereafter, remained similar to the values in open areas. Harvest index in unfertilised maize
exceeded that in the fertilised treatment reflecting the crop’s strategy to allocate resources to
grain production under unfavourable conditions. Solar radiation continued to increase with
distance up to 18 m from the woodlot-maize interface. Fertilisation increased maize yield
from 1.3-2.6 t ha-1
but the trend in the woodlot effects on maize remained unaltered.
Key words Eucalyptus woodlots, environmental resources, agroforestry system, tree-crop
interface
Introduction
Steady population growth in the tropics has led to an increased demand for agricultural
products and for timber and fuelwood. In the eastern and central African highlands, this wood
demand has bypassed the capacity of forest to supply wood, and has resulted into the
degradation of many natural forests (Burnett, 1985; Thorhaug and Miller, 1986). A possible
means to reduce pressure on natural forests and meet the wood and food demand is to include
trees in the farming systems (Chamshama, 2011). To provide fuelwood and timber,
establishment of eucalypt plantations was promoted since the colonial era (Munyarugerero,
1985). Eucalyptus was widely adopted, and in 2008, 64% of the total plantation area (102,800
ha) in Rwanda was covered by eucalypts (Nduwamungu et al., 2008). Most of the plantations
are owned by local governments (65% of the area), followed by smallholder farmers (26%)
and private institutions (9%). The plantations mainly consist of small woodlots and occur in
all ecological zones, with more plantations in the southern and western Provinces
(Nduwamungu et al., 2008).

42
Food production is limited by the availability of land for annual crops (Hauser, 2006). A
continuous growing population led in Rwanda to land fragmentation and small average land
holdings per household of around 0.5 ha (Bucagu et al., 2014; Mpyisi et al., 2003). The urge
to be self-sufficient in wood products drives farmers to grow trees on their farms. As a result,
small crop fields and eucalypt woodlots are intermixed in a mosaic in the landscape. Because
of the proximity of crops and trees, and the tree-crop interactions, this can be classified as an
agroforestry system, containing some features of short-rotation woodlots.
In agroforestry systems, trees and crops are commonly grown in different spatial
arrangements where trees provide various benefits to the crops. Windbreaks for example are
beneficial to crops, especially in dry areas where they are useful for the control of wind
erosion, soil conservation, and the amelioration of the microclimate (König, 1992; Mayus et
al., 1999). Trees grown in hedgerow intercropping systems may improve soil conditions
through nitrogen fixation and increase crop yield (Akyeampong et al., 1995). However, trees
also compete with crops for environmental resources and their negative effects may outweigh
the potential benefits (Rowe et al., 2005).
Eucalyptus trees may be such a mixed blessing; they are fast growing even on marginal sites,
produce a wide range of valuable products in short periods, are easy to manage and can be
coppiced several times giving several yields at one planting (Casson, 1997). They are
however, known to be especially competitive, and to significantly reduce productivity of
companion plants. They may severely compete with crops for soil moisture (Kidanu, 2005)
and soil nutrients (Harrison et al., 2000), and are thought to have allelopathic effects on crops
growing in their vicinity (Lisanework and Michele, 1993).
Low crop yields are common on the highly weathered and nutrient poor soils of the study
area (Rushemuka et al., 2014), constraining food production and food security. Although
food security has been improving significantly in Rwanda, 21% of households were still food
insecure in 2012 (WFP, 2012). The dominance of eucalypt woodlots in the agricultural
landscape calls for a need to better understand the effects of the trees on crop production and
food insecurity. The woodlots are expected to influence crop production in the agroforestry
systems. Relevant studies have been done in tropical countries (Kidanu et al., 2005;
Sudmeyer et al., 2015). However, these studies evaluated the effects of the spatial
arrangement of tree lines rather than the effects of the woodlots. The latter is the most
common in Rwandan farming systems.
The aim of this study is to analyse the eucalypt woodlot-maize system, and to quantify how
resource availability (water, nutrients and light) and crop performance (height growth, stover
production and grain yield) vary with the distance from the eucalypt woodlots. Fertilization
was added to analyse whether eucalypts and maize mainly compete for nutrients, and whether
fertilization can mitigate for the negative woodlot effects.

43
Methods
Site description
Three sites were selected in southern Rwanda, with two (Cyarwa and Mukura) located in the
periphery of Butare town, Huye district, and the other (Save) in the neighbouring district of
Gisagara. More specifically, Cyarwa is located at 2.61591S and 29.76660E at 1655 m asl
elevation; Mukura at 2.64804S and 29.73008E with the altitude of 1667 m asl and Save at
2.57384S and 29.77603E and 1694 m elevation. According to the agro-ecological
classification defined by Delepierre (1975), the sites are located in the central plateau and
hills zone of Rwanda. The area has a mean annual rainfall of 1200 mm y-1
; mean annual
temperature of 21oC and the soils are derived from granitic rocks and are classified as
ferralsols in the hills (Birasa et al., 1990).
The choice of sites and study woodlots was based on the presence of a woodlot with mature
trees of Eucalyptus saligna, with an adjacent crop field. One woodlot was selected in each of
the three sites. To ensure representative coverage of the study zone, the three sites used were
located at least five km apart.
Maize Katumani variety was grown in the crop fields adjacent to Eucalyptus woodlots. The
woodlot was located on the eastern side of the crop fields in two sites (Cyarwa and Mukura)
and on the northern side of the crop field in the Save site.
Experimental design and field procedures
The experiment was conducted in three consecutive seasons, that is, from January-May and
September-December 2007 and January-May 2008. Characteristics of the woodlots used are
provided in Table 3.1. In each of the three experimental sites, three crop field replications
adjoining one E. saligna woodlot were selected and crop plots of 12.75 m × 30 m were pegged.
Each replication was split into two smaller plots of 6 m × 30 m separated by 0.75 cm, a space
equal to the interline spacing; and further subdivided into subplots with the following
dimensions running parallel to the tree-crop interface into the farmland: 0-2, 2-4, 4-6, 6-9, 9-12,
12-16, 16-20, 20-25 and 25-30 m (Fig. 3.1). One of the two 6 m × 30 m plots received NPK
composite fertiliser at a rate of 300 kg ha-1
, equivalent to 51 kg of N, 22.2 kg of P and 42.3 kg
of K per hectare. Sites were tilled manually and sown with maize on 25 February 2007 in the
first season, on 30 September 2007 in the second season and on 26 January 2008 in the third
season.
Abnormally little and erratic rains in the first season led to poor establishment and the
experiments were replanted at the end of March 2007. The spacing was 0.5 m between plants
and 0.75 m between lines. Three maize seeds were sown per hole and these were later thinned
to leave two plants per hole. The plots that received fertiliser at sowing were top dressed with
an N based urea (46%) at the rate of 100 kg ha-1
(MINAGRI, 2000). To avoid edge effects,
two guard (outer perimeter) rows were not considered for assessment, leaving the six
innermost maize rows in each subplot for evaluation. It was assumed that the effect of trees
did not extend as far as 25 m from the tree-crop interface; the farthest sub-plot located at 25-
30 m from eucalypt woodlot was therefore taken as a control.

44
Table 3.1. Tree sizes in terms of diameter at breast height, total tree height and the
above ground biomass recorded in the three Eucalyptus saligna woodlots in
eucalypt-maize agroforestry systems in southern Rwanda
Site
Densit
y
(Stems
ha-1
)
Breast height
diameter (cm) Total tree height (m) Total biomass (kg tree-1
)
min max mean Min max mean min Max Mean
Cyarwa 970 15.1 24.8 19.8 15.0 23.2 18.6 116.5 376.4 203.0
Mukura II 773 8.7 15.6 12.5 13.4 18.3 16.4 61.0 202.0 132.0
Save I 1005 5.8 26.5 16.6 9.6 28.2 19.8 24.0 452.0 235.0
0 2 4 6 9 12 16 20 25 30m
30 m
Figure 3.1. Field layout (not drawn to scale) of the eucalypt-maize experiment in
Butare, southern Rwanda. F and C denote fertilised and non-fertilised treatments
respectively; numbers 0- 30 refer to subplot distances (m) from eucalypt-maize
interface
Data collection and analyses
Maize traits studied included growth (height and biomass) and grain yield. Field procedures
for each item are described below but in principle, all measurements were done in the nine
subplots explained above. For solar radiation, an extra location was added at 5 m inside the
woodlot from the tree-crop interface to capture the light intensity under the woodlot canopy.
Soil properties and soil nutrients
Soil samples were collected only once at the beginning of the growing season. According to
Schroth and Sinclair (2003), soil properties change most rapidly closer to trees and therefore,
it is advisable to collect samples at smaller distance intervals here and increase the intervals
with increasing tree distance. For this reason, samples were collected from the crop fields
using a graduated auger at the midpoints of each of the nine sampling points corresponding to
12.5m
Eucalypt
woodlot
F
F
F
F
F
F
F
F
F 6 m
0.75m
C
C
C
C
C
C
C
C
C 6 m

45
1, 3, 5, 7.5, 10.5, 14, 18, 22.5 and 27.5 m from tree-crop line respectively. Simultaneously,
soil samples were taken in each sampling location at four soil depths of 10, 30, 50, and 70 cm
representing 0-20, 20-40, 40-60 and 60-80 cm respectively below the soil surface. The soils
were later analysed for macronutrients (N, P and K), particle size distribution and pH using
standard procedures (Okalebo et al., 2002).
Soil moisture
Soil moisture was assessed three times per season: at the beginning, at the mid-season and at
the end and was repeated for three consecutive seasons. Soil moisture was determined at the
nine sampling points by gravimetric method. Samples for soil moisture assessment were
taken at the same four soil depths explained above. Soil cores were taken at every assessment
occasion using steel cylinders of uniform size. The cylinders were forced into an intact soil
profile at the point of sampling, completely filled with soil and immediately removed and
wrapped in an aluminium foil to conserve moisture. The samples were labelled and moisture
contents determined in the laboratory after drying samples to constant mass at 105 oC.
Light measurements were assessed by using LI-COR quantum sensors (Li-COR 1000). At
every measurement occasion, one sensor was placed in each of the nine subplots. Data were
recorded every 30 minutes from 6.30 am to 6.30 pm in terms of photosynthetically photon
flux density (PPFD) (μmol m-2
s-1
). At the beginning of the season when maize seeds were
not germinated or when maize plants were still very young and very short, sensors were
placed on the ground. Later after the maize plants grew taller, sensors were placed on wooden
sticks above the maize plants to avoid any shading other than from eucalypt trees.
Light measurements
Maize growth
Maize plants were measured for total height once in every season at approximately 50%
tasselling time which corresponded to the end of vegetative growth. For this purpose, three
sample plants selected randomly from the innermost rows in each subplot were measured.
Height was measured from root collar to the tip of the sample plant by using a graduated
measuring staff.
Maize stover
Above ground biomass was estimated from the same maize plants which were sampled for
the assessment of total height since the sampling. Above ground parts for the sample plants
were carefully detached from below ground parts in the field at root collar by using a sharp
machete. Each sample plant was chopped carefully and immediately wrapped in an
aluminium foil for oven dry weight determination in the laboratory where sample plants were
oven dried at 65oC to constant weight.

46
Grain yield
Maize grain yield were obtained only during the second and third season since season one
was severely affected by the halt of rains experienced during the period. Maize were
harvested from all plots after they were fully mature and had started drying. Cobs were
collected, separated from all leaves and air dried. Grain was separated from cobs using a
threshing machine and was weighed using an electronic balance at the Faculty of Agriculture
laboratory, the University of Rwanda, Huye Campus. The yield was recorded for each
subplot. Harvesting index was then computed as the ratio of the grain dry weight to the dry
weight of grain yield plus stover. Air dried grain yield was converted to dry matter by
multiplying by a factor of 0.85.
Data analysis
Data were analysed using IBM SPSS 22 software where one way ANOVA was used to study
the differences between treatments and LSD test was used to separate statistically different
means. Pairwise comparisons using t-tests were used to study the effect of fertilisation
because only two levels of fertiliser were used in this experiment. Similarly, grain yield data
were available for seasons two and three only, as the poor rainfall in the first season
prevented any harvest.
Results
Maize height, stover and grain yield varied significantly (P<0.001) with distance from
eucalypt woodlots, fertilization, and often with season, but they did not vary significantly
(P>0.05) with site or crop field (Table 3.2; Fig. 3.2a-c). Maize harvest index varied only
significantly with distance from the woodlots and not between sites or seasons. Maize height
growth, stover, grain yield and the harvesting index in the 9-12 m subplot (10.5 m) from the
woodlot increased by 65.7, 74.1, 97.2 and 81.5 % respectively compared to the values at 1 m
(in the 0-2 m). On average, grain yield in this zone (10.5 × 12 m2 next to the woodlot) was
0.0063 t while that in the remaining crop field (19.5 × 12 m2) was 0.0585 t. These yields are
equivalent to 0.5 and 2.5 t ha-1
for the crop zones affected and that not affected by eucalypt
woodlot respectively, making the edge effect prone zone to produce only 20% of the yield
obtained in the open areas (27.5 m away). Beyond 10.5 m, the effect of the woodlot ceased to
be evident, and maize performance did not differ significantly from the values in open areas
anymore. Harvest index for the unfertilised maize was higher than that obtained in fertilised
treatments in all three sites (Fig. 3.2c). Maize height was strongly and positively correlated
with grain yield and this was observed to be similar in all the three sites (Fig. 3.3). The
addition of fertiliser doubled maize growth and the grain yield (Fig. 3.2) but did not alter the
trend in the eucalypt woodlot effects on maize performance.

47
Table 3.2. Probability values of ANOVA procedure for the test of significance for
maize growth in a maize-eucalypt woodlot cropping system in three sites in
southern Rwanda. Distance in the Table below refers to distance from eucalypt
woodlots.
Source of
variation
Maize performance
Height (m) Stover (m) Grain yield (Mg ha-1
) HI
Site ns Ns Ns Ns
Season * *** ns Ns
Crop field ns Ns Ns Ns
Fertiliser dose *** *** *** Ns
Distance (m) *** *** *** ***
(a)
(b)
0
1
2
3
4
0 5 10 15 20 25 30
Gra
in y
ield
(t
ha-1
)
0.0
0.5
1.0
1.5
2.0
2.5
3.0
3.5
4.0
0 5 10 15 20 25 30
Sto
ver
(t
ha-1
)
Site 1
Site 2
Site 3

48
(c)
Figure 3.2. Three seasons average variation of Katumani maize variety in stover
(a), grain yield (b) and harvest index (c) with distance from Eucalyptus saligna
woodlots a eucalypt-maize cropping system in three sites in southern Rwanda.
Empty and filled marks denote fertilized and unfertilized treatments respectively.
Figure 3.3. Relationship between maize grain yield and maize height observed in a
eucalypt woodlot-maize cropping system in three sites in southern Rwanda.
Both solar radiation and soil moisture varied significantly with distance from eucalypt
woodlots as well as between sites (Figs. 3.4 & 3.5), and often with seasons and dates of
measurements (Table 3.3). Moisture content and solar radiation were 18 and 68%
respectively lower near the woodlots compared to the values in open areas. Soil nutrients
varied significantly (P<0.001) and increased with distance from eucalypt woodlot (Fig. 3.6).
Concentrations near the woodlot were smaller than those recorded in the open areas by 38%
for N, 27% for P and 38% for K. Significant effects of the woodlot were detected up to 7.5 m
for soil P, 10.5 m for soil N and K and soil water; and 18 m for solar radiation.
0.0
0.1
0.2
0.3
0.4
0 5 10 15 20 25 30
Har
ves
t in
dex
Distance (m)
0.0
0.5
1.0
1.5
2.0
2.5
3.0
0.0 0.2 0.4 0.6 0.8 1.0 1.2 1.4
Gra
in y
ield
(t
ha-1
)
Maize height (m)
Site 1
Site 2
Site 3

49
Figure 3.4. Variation of solar radiation (photosynthetic photon flux density)
with distance from Eucalyptus saligna woodlots in a eucalypt-maize cropping
system in three sites in southern Rwanda.
Figure 3.5. Variation of soil moisture in maize crop fields with distance from
Eucalyptus saligna woodlots in a eucalypt-maize cropping system in their sites in
southern Rwanda.
Soil pH was 4.67 at the woodlot edge and increased significantly with distance from eucalypt
woodlot, reaching 4.88 at 27.5 m away from the woodlot. However, the difference was only
4% (Fig. 3.7). Clay concentration increased with distance from eucalypt woodlot as did the
sand proportion, although only slightly, while silt concentration decreased with distance from
the woodlot (Fig. 3.8). Clay and sand proportions near the woodlots were 30 and 4%
respectively smaller near the woodlot than in the open areas, while silt was 9% higher near
the woodlot than in the open areas. However, the variations found in soil particle distribution
may not have been influenced by the woodlot but rather the site characteristics. Soil nutrients,
0
200
400
600
800
1000
1200
0 5 10 15 20 25 30
Sola
r ra
dia
tion (
μ m
ol
m-2
s-
1)
Distance (m)
Site 1
Site 2
Site 3
0
2
4
6
8
10
12
14
0 5 10 15 20 25 30
Soil
mois
ture
(%
)
Distance (m)
Site 1
Site 2
Site 3

50
soil particle size distribution and soil pH varied significantly (P<0.001) between sites and soil
moisture, soil nutrients and soil pH did so with soil depth (Table 3.4). Soils near the woodlots
were therefore slightly more acidic and nutrient-poor, and contained less water than soils far
away. Probability values of ANOVA procedure for the test of significance for the different
parameters and the interaction between them are presented in Table 3.5. Mostly, there were
no interactions between different parameters.
Table 3.3. Variation of soil moisture and solar radiation between seasons and dates
of measurements in a eucalypt-maize cropping system in three sites in southern
Rwanda.
Season Date
Jan-May
2007
Sep-Dec
2007
Jan-May
2008
Beginning
of season
Mid-
season
End of
season
Soil moisture (%) 10.8 13.5 13.8 12.6 12.8 12.7
Significance level *** **
Solar radiation (umol m-2
s-1
) 756.1 794.5 699.8 789.7 711.4 749.2
Significance level *** ***
** and *** denote significance differences between means at P<0.001 and P <0.0001)
respectively
Figure 3.6. Variation of soil nutrients with distance from Eucalyptus saligna
woodlot in a eucalypt-maize cropping system in three sites in southern Rwanda.
0.00
0.05
0.10
0.15
0.20
0.25
0.30
0 5 10 15 20 25 30
Pota
ssiu
m (
cmol
kg
-1)
Distance (m)

51
Table 3.4. Site variation in soil nutrients, particle size distribution and soil pH; and
variation of soil nutrients, soil moisture and soil pH with soil depth in a eucalypt-
maize agroforestry system in three sites in southern Rwanda.
Soil Nutrients
Particles (%) pH
(a) Site
N
(%)
P (mg
kg-1
)
K
(cmol kg-1
) Clay Silt Sand
Save 0.06 5.05 0.22
23.0 65.4 11.6 4.7
Mukura 0.08 5.90 0.18
27.1 61.7 11.2 4.9
Cyarwa 0.05 5.79 0.16
20.3 67.7 12.0 4.6
Significance level * *** ***
*** *** ns ***
Soil depth(cm)
Soil moisture
(% by volume) pH
0-20 0.09 7.23 0.24
11. 6 4.9
20-40 0.08 6.12 0.22
12. 3 4.8
40-60 0.07 5.01 0.16
13. 1 4.7
60-80 0.05 3.95 0.12
13. 7 4.6
Significance level *** *** ***
*** ***
(a)
(b)
0.00
0.02
0.04
0.06
0.08
0.10
0.12
0 5 10 15 20 25 30
Nit
rogen
(%
)
Site 1
Site 2
Site 3
0
1
2
3
4
5
6
7
0 5 10 15 20 25 30
Phosp
hooru
s (m
g k
g-1
)

52
(c)
Figure 3.6. Variation of soil nutrients: (a) Nitrogen, (b) Phosphorus and (c)
Potassium with distance from Eucalyptus saligna woodlot in a eucalypt-maize
cropping system in three sites in southern Rwanda.
Table 3.5. Probability values of ANOVA procedure for the test of significance for
soil characteristics and solar radiation in a maize-eucalypt woodlot cropping
system in three sites in southern Rwanda. Distance in the Appendix below refers to
the location of cropping zones of 0-2, 2-4, 4-6, 6-9, 9-12, 12-16, 16-20, 20-25 and
25-30 m from Eucalyptus saligna woodlots. Four soil depths were used: 0-20, 20-
40, 40-60 and 60-80 cm below the ground.
Source of variation Particl
e size
pH Moisture Nutrients Solar
radiation
(μmol m-2
s-1
)
N
(%)
P
(ppm)
K
(mg kg-1
)
Site *** *** * *** * *** ***
Season - - *** - - - ***
Crop field ns * ns ns ns ns -
Distance (m) *** *** *** *** *** *** ***
Soil depth (cm) - *** *** *** *** *** -
Site * Farm ns ns ns ns ns ns Ns
Site * Distance ns ns ns ns ns ns Ns
Farm * Distance ns ns ns ns ns ns Ns
Site * Crop-field*
Distance
ns ns ns ns ns ns Ns
ns denotes non-significant while * significant differences at P<0.05 level and *** P<0.001
0.00
0.05
0.10
0.15
0.20
0.25
0.30
0 5 10 15 20 25 30
Pota
ssiu
m (
cmol
kg
-1)
Distance (m)
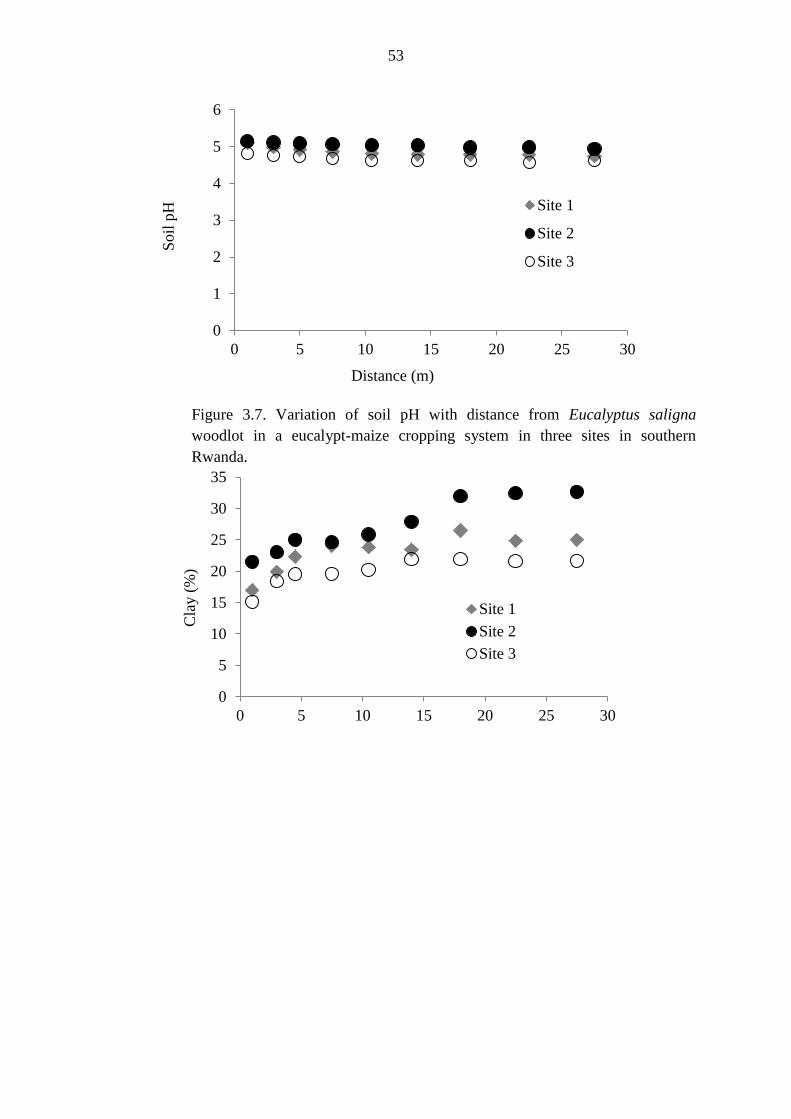
53
Figure 3.7. Variation of soil pH with distance from Eucalyptus saligna
woodlot in a eucalypt-maize cropping system in three sites in southern
Rwanda.
0
1
2
3
4
5
6
0 5 10 15 20 25 30
Soil
pH
Distance (m)
Site 1
Site 2
Site 3
0
5
10
15
20
25
30
35
0 5 10 15 20 25 30
Cla
y (
%)
Site 1
Site 2
Site 3
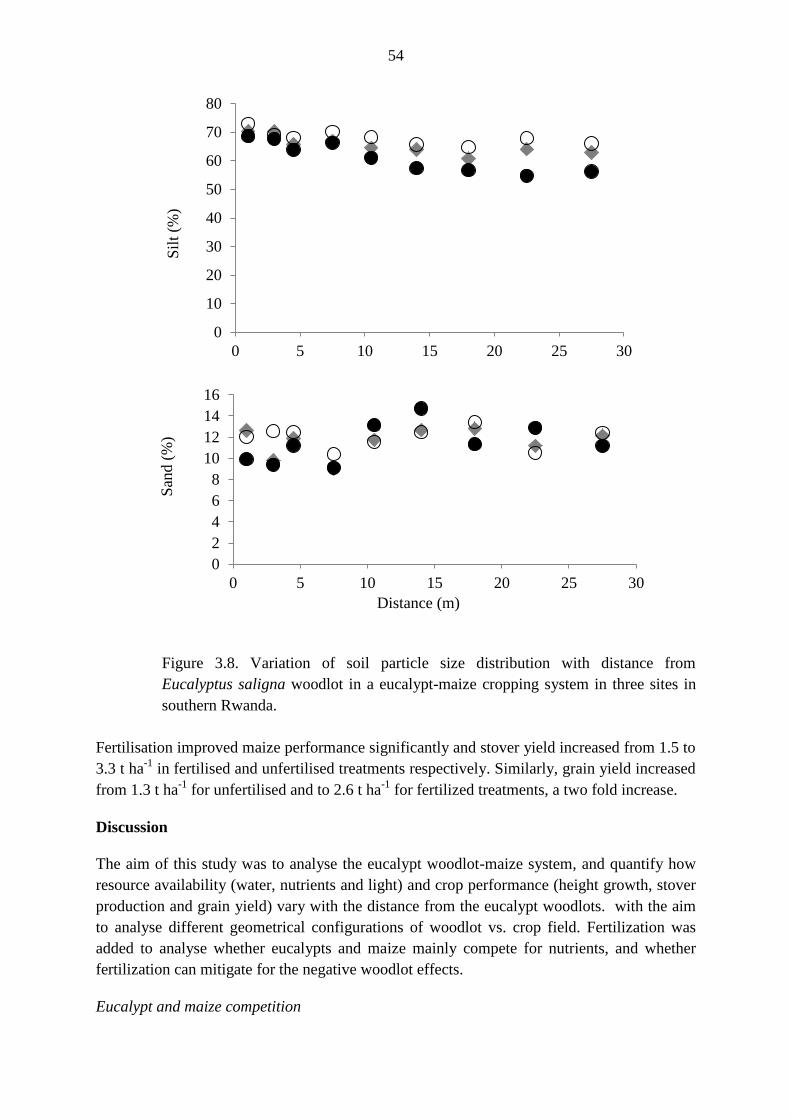
54
Figure 3.8. Variation of soil particle size distribution with distance from
Eucalyptus saligna woodlot in a eucalypt-maize cropping system in three sites in
southern Rwanda.
Fertilisation improved maize performance significantly and stover yield increased from 1.5 to
3.3 t ha-1
in fertilised and unfertilised treatments respectively. Similarly, grain yield increased
from 1.3 t ha-1
for unfertilised and to 2.6 t ha-1
for fertilized treatments, a two fold increase.
Discussion
The aim of this study was to analyse the eucalypt woodlot-maize system, and quantify how
resource availability (water, nutrients and light) and crop performance (height growth, stover
production and grain yield) vary with the distance from the eucalypt woodlots. with the aim
to analyse different geometrical configurations of woodlot vs. crop field. Fertilization was
added to analyse whether eucalypts and maize mainly compete for nutrients, and whether
fertilization can mitigate for the negative woodlot effects.
Eucalypt and maize competition
0
10
20
30
40
50
60
70
80
0 5 10 15 20 25 30
Sil
t (%
)
0
2
4
6
8
10
12
14
16
0 5 10 15 20 25 30
San
d (
%)
Distance (m)

55
The crop field zone affected by the woodlot was 10.5 × 12 m2 which makes 35% of the total
crop zone (30 × 12 m2), leaves out 19.5 × 12 m
2 crop field unaffected by the woodlots. The
affected zone produced grain yield at the rate of 0.5 t ha-1
which is only 20% of the yield
recorded in the open areas. By comparing these two yields, we would conclude that the
woodlot competition reduced maize grain yield by 80%. However, this competition with the
trees affects only a small part (35%) of the crop field. By spreading the maize grain loss over
the 30 × 12 m2 plot, the loss reduces from 80 to only 28%. The proportion of the crop field
that will be affected will depend on the size of both the crop field and the woodlot; and the
length of the tree-crop interface. If we consider a square hectare plot crop field which has one
side adjoining a eucalypt woodlot, only a strip of 10.5 m wide and 100 m long next to the
woodlot would be affected by the latter, the remaining 89.5 × 100 m2 being free from
woodlot effects. In this case, the affected crop field zone would only be 10.5% of the whole
crop field.
This means that, the 10.5% of the whole crop field area will give grain yield at the rate of 0.5
t ha-1
, and 89.5% at 2.5 t ha-1
; equivalent to 0.0525 and 2.2375 t ha-1
respectively. This adds
to 2.29 t ha-1
, which is 0.21 t (8.4%) less compared to the yield of unaffected hectare crop
field.
Many reports on crop yields as affected by trees when these are grown next to each other are
usually presented as percentages or yields ha-1
relating values nearest to trees and those in
open areas, far away from the trees (Sudmeyer and Hall, 2015; Tadele and Teketay, 2014;
Chanie et al., 2013). This is very informative since it does not show actual proportional sizes
of crops fields affected and those not affected, and the percentages are usually high, giving a
wrong impressions to the readers of the magnitude of tree effects. It would be better if the
rates of yield reduction are given together with the sizes of crop fields affected and those
unaffected to give a clear picture of the magnitude of the overall effect.
Reductions in crop growth and corresponding yield losses are known to occur when eucalypts
and crops are grown in close proximity. Eucalyptus are known to have high water uptake
which is primarily a strategy enabling them to grow even under harsh environmental
conditions (Akhter et al., 2005). This high water uptake capacity enables them to outcompete
other plants occurring in their vicinity. The suppressive effects by eucalypts in agroforestry
systems have been reported in other studies (Sudmeyer et al., 2015; Kidanu et al., 2005;
Malik and Sharma, 1990). The species rooting pattern consists of deep and far reaching
lateral roots so as to cover a bigger soil volume to capture more resources. Depending on the
environment, rooting depth for Eucalyptus spp. may reach 20-30 m (Akinnifesi et al., 2004)
while lateral roots were observed to spread as far as 20 m in the adjacent crop fields (Kidanu
et al., 2005).
The general low yield observed in our study is not unexpected since low crop yields are
common on highly weathered and nutrient depleted soils in east Africa, mainly the acrisols,
ferralsols, nitisols and alfisols (Woomer and Muchena, 1996). Maize biomass produced in
this study was comparable to that reported by Tittonell et al. (2007) for the outfield farmer

56
managed sites in Kenya. It was also comparable to that reported in the study area
(Muberantwari et al., 2009) and was 1.6 fold higher than the average maize grain yield
reported for entire Africa (Baligar et al., 2001).
Soil moisture, soil nutrients and solar radiation decreased significantly near eucalypt
woodlots in this study (Figs. 3-5). However, it is generally assumed that competition for soil
moisture and soil N are more important in eucalypt-crop systems (Sudmeyer and Hall, 2015;
Ong et al., 1999; Sudmeyer, et al., 2002). Water and nitrogen (N) are reported to be the most
limiting factors for maize grain yield in the tropics (Moser et al., 2005). Radiation is reported
to be rarely the most limiting growth resource in the tropics (Ong and Black, 1994), and
belowground competition between perennial and annual crops is known to be severer than the
above-ground (Nissen et al., 1999).
Fertilization had influenced plant growth and biomass production but did not change the
trend in tree-crop competition and the effect on crop biomass production and grain yield (Fig.
3.2). The increase in yield in the fertilized treatment may be due to the added nutrients N, P
and K on the soils in the experiment, that are known to be very unproductive. These results
are consistent with those revealed by Lisuma et al. (2006) in Tanzania who concluded that in
Sub-Saharan Africa, application of fertilizer can increase maize yields up to three times. The
higher grain production in relation to the total biomass (harvest index) observed in
unfertilized treatments over the fertilized one (Fig. 3.1c) could be an indication of more
allocation of assimilates in favour of developing grains. Some crops have the capacity to
preferentially allocate assimilates to grains at the expense of the biomass under unfavourable
conditions. This was reported in some variety of sorghum especially under low soil moisture
conditions (Wenzel et al., 2000). The precedence of the harvest index of unfertilized
treatment over the fertilized one being persistent in open areas may be attributed to the
general poor soil state of the study sites as earlier stated.
Eucalypt woodlots reduce water availability
Lower soil moisture values observed nearest to the woodlots than far away may suggest the
increased moisture uptake by the tree roots. Crop suppression by Eucalyptus trees is reported
even in young stands. Ceccon (2007) reported a crop decrease in rice and beans intercropped
with young E. urophylla in Minas Gerais state of Brazil. Lateral roots in E. saligna were
observed to be concentrated in the top 61 cm soil layer (Skolemann, 1974). This may be a
common phenomenon in eucalypts since similar results were found in other eucalypt species
(Kidanu, 2005). A high density of fine and medium-sized roots were reported in E. urophylla
in the first 20 cm of the upper soil, and a marked decrease of the root density in the lower soil
layers (Cohen et al., 1997), which may explain the reduced crop yield due to competition for
soil water. It should be noted here that clay particle distribution in the soil increased with
distance from eucalypt woodlots. Less clay near the woodlots may have contributed to the
observed less soil water since the coarser texture may lead to increased water drainage.
Eucalypt woodlots reduce soil nutrient levels

57
Poor and variable soil fertility was reported in Rwandan soils by Verdoodt and Van Ranst
(2006). These soils are known to originate from granites mixed with mica schist and quartzite
(Steiner, 1998). The soils derived from these parent materials are highly acidic, deficient in
basic nutrients, have a high level of exchangeable aluminium and therefore are not productive
(Bourleigh and Yamoah, 1997; Sanchez et al., 2003). The observed small concentrations of
soil nutrients close to the trees is commensurate with literature and may be a function of the
increased capacity of the eucalypt trees to take up nutrients in their vicinity (Kidanu, 2005;
Sudmeyer, 2002). Eucalyptus species are reported to be efficient miners of soil nutrients,
thereby suppressing other vegetation that grows underneath or near them (Harrison et al.,
2000). Sang et al. (2013) reported that E. urophylla plantations were associated with lower
soil C levels and observe that these results indicate that unfertilised E. urophylla plantations
in short rotations are both ineffectual soil rehabilitators and potentially unsustainable in the
longer term. This corroborates previous conclusions (Behera and Sahani 2003). The small
nutrient concentrations are at odds with the fact that eucalypts produce high amounts of litter
expected to enrich soils through nutrient recycling. This may however be a consequence of
local management practice where leaf litter from the woodlots is collected together with
branches and used as fuel (Ndayambaje and Mohren, 2011) or as mulch for soil conservation
(Nzeyimana et al., 2013) due to critical needs of firewood and soil erosion control
respectively.
Soil nutrient concentrations decreased with soil depth (Table 4). Soil organic matter contents
which are usually higher at the topsoil are responsible for the retention and release of
nutrients, and nutrients added to soil by litter fall and fertilization usually accumulate at the
topsoil (Lehmann, 2003). Subsoil nitrogen was observed to decrease under natural and
Sesbania fallows compared to the sole maize and uncultivated bare soil in Kenya (Hartemink
et al., 2000). Phosphorus and potassium were observed to concentrate near the soil surface
compared to the subsoil (Jobbágy and Jackson, 2001).
Below ground competition may be explained by the hypothesis that roots grow only as deep
as needed to fulfil tree resource requirements (Schenk and Jackson, 2002). Trees prefer to
root shallowly since (a) energy costs for construction, maintenance and resource uptake are
lower for shallow roots (Adiku et al., 2000); (b) oxygen is usually likely to be less deficient
in shallow soil layers (Hillel, 1998); and (c) the concentration of nutrients is often greater in
the upper soil layers (Jobbágy and Jackson 2001). The soils of the study site were generally
acidic. Soil pH was only slightly higher near the woodlot compared to open areas, and thus,
in agreement with other studies pH (Jobbagy and Jackson, 2003).
Eucalypt woodlots reduce light availability
The three season average PPFD recorded at the woodlot flow (279.7 µmol m-2
s-1
) and in the
crop field in this experiment (499.9-933.8 µmol m-2
s-1
), even at points furthest from the
woodlots, is lower than the normal range for full light which ranges from 1200-2000 µmol m-
2 s
-1 (Berlin and Cho, 2000). The normal range is usually reduced to lower values under the
forest canopy to values around 800 µmol m-2
s-1
(Berlin and Cho, 2000). The lower values
recorded here are therefore not surprising since the amount of light received was measured in
58
the crop fields which are variably shaded by eucalypt woodlots. The amount of light received
by vegetation has several influencing factors including altitude, canopy structure, clouds,
latitude, time of the year, time of the day and topography (Jones, 1992). Morphological
factors such as leaf orientation, shape, pubescence, thickness, etc. also affect the amount of
light received by plants (Berlin and Cho, 2000). The mount of solar radiation received in the
crop fields were higher than the usual values received at the forest canopy because the
amount of shade cast by E. saligna woodlots is not very intense. This may partly be attributed
to the species leaf area index which is low and partly to the dropping nature of the species’
leaves. Leaf area index of E. saligna was reported to be among the smallest in several exotic
and indigenous tree species investigated in the study area (Nsabimana et al., 2008).
Conclusions
Eucalyptus woodlots significantly reduced environmental resources in the crop field strip
adjoining the woodlots. Significant effects of the woodlot were detected up to 7.5 m distance
from the woodlots for soil P, 10.5 m for soil N and K and soil water; and 18 m for solar
radiation. Soil moisture and solar radiation were reduced near the woodlots by 18 and 68%
compared to the values in open areas. Soil nutrient levels recorded near the woodlots were
lower than those in the open areas by 37,5 for N, 27% for P and 38% for K. In the this study,
10.5% of the crop field nearest to the woodlot (10.5 m wide) produced grain yield of 0.5 t ha-
1 while the remaining field (89.5%) produced 2.5 t ha
-1. The grain loss in the 10.5 m strip
therefore was 80% less than the yield in open areas, which is equivalent to an average yield
loss of 0.21 t ha-1
. Since tree competition affects only 10.5% of a 1 ha crop field, expressing
this as the loss over the whole field becomes a yield reduction of only 8.4%. Reporting grain
yield losses need to be quantified by actual yield values and corresponding crop field area
affected rather than using percentages alone since the latter may be misleading. The
magnitude of grain yield loss will depend on the size of the crop field and Eucalyptus
woodlot and the length of tree-crop interface since these will determine the crop field
proportions that will be affected/not affected by the edge. Maize harvest index was relatively
higher in the unfertilised than in the fertilised treatment, reflecting the crop’s capacity to
preferentially allocate resources to grain production when growing under harsh environments.
While fertilisation increased grain yield from 1.3 to 2.6 t ha-1
, it did not change the trend in
the effect of eucalypt woodlot on maize growth and performance.

59
CHAPTER 4: Edge affects both maize and Eucalyptus trees in maize-eucalypt woodlot
agroforestry systems
CP Mugunga, GMJ Mohren and KE Giller
Submitted

60

61
Edge affects both maize and Eucalyptus trees in maize-eucalypt woodlot agroforestry
systems
CP Mugunga, GMJ Mohren and KE Giller
Abstract
Agriculture is the hub of livelihoods in the east African highlands and in Rwanda. Firewood
shortage and the need of wood for construction drove people to grow trees; consequently
eucalypt woodlots are found interspersed with annual crops on the hilly landscape across the
country. This study aimed at characterising the tree-crop interface between eucalypt woodlots
and maize as a representative field crop. The specific objectives were: i) to quantify the crop
field area affected by woodlot trees and yield losses of maize crops; ii) to quantify the
differential growth and biomass production in eucalypt woodlot edge trees vis-à-vis those at
the woodlot centre; iii) to quantify the area of the woodlot subject to edge effects and effects
on tree biomass; and iv) to evaluate the trade-offs of crop yield losses in relation to the gains
of wood production. Maize was grown adjacent to three eucalypt woodlots and three
additional woodlots were sampled, the tree edge effect was evaluated for all six. Maize grain
yield within 10.5 m of the woodlots was 0.5 t ha-1
against 2.5 t ha-1
in open areas. Grain yield
loss increased with tree-crop interface length. Field orientation was very important in none
square crop fields and smaller fields suffer more from edge-effects when longer sides
adjoined woodlots. Trees in the outer eight meters of the woodlots had 17.8% bigger diameter
at breast height and 34.5% more aboveground biomass than interior trees. Woodlots were
affected by the edge and small woodlots were more affected. Combined maize-wood
products were more profitable than sole systems and revenue from extra wood gains due to
edge effects exceeded corresponding revenue losses in maize yield. However, land shortage
may limit farmers to grow Eucalyptus woodlots.
Key words: Short rotation eucalypt woodlots, intra-specific competition, inter-specific
competition, trade-off analysis
Introduction
Agriculture forms the mainstay of the economy in the East African highlands. In Rwanda,
90% of the population lives in rural areas with agriculture practiced on 52% of the land
overall (MINITERE, 2004). Rapid population growth has led to intense pressure on land for
agriculture and forestry. In 2012, Rwanda had 10,515,973 people with a growth rate of 2.6%
(NISR, 2014). The average population density of about 407 inhabitants km-1
(Bucagu et al.,
2014) makes Rwanda the most highly populated country in Africa (Warnest et al., 2011).
Natural forests declined by 65% in area between 1960 and 2007 (MFM, 2010). This renders
Rwanda strongly dependent on growing trees on-farm for the supply of fuelwood, timber and
poles. In 2007, forests contributed 80% of total national domestic energy as firewood (57%)
and charcoal (23%) (MFM, 2010).
62
Tree planting is seen as a solution to the problem of firewood and shortage of other wood
products (Ndayambaje and Mohren, 2011). In Rwanda and other countries of East Africa,
there has been widespread planting of fast-growing eucalypt species. In 2008, 64% of the
total plantation area in the country was covered by eucalypts with ownership of 65%, 26%
and 9% for the local governments, smallholder farmers and private institutions respectively
(Nduwamungu et al., 2008). On-farm tree planting is mainly in the form of woodlots ranging
from very small to large stands which are scattered countrywide, though most are found in
the southern and the western Provinces (Nduwamungu et al., 2008).
Given that very small fields are devoted to crop production and are intermixed with woodlots
of fast-growing eucalypt tree species, competition between woodlot trees and field crops at
the tree-crop interface assumes major importance. Competition between trees and annual
crops is key to understanding the benefits of agroforestry. Trees compete with crops for light,
water and nutrients reducing crop yields significantly (Rowe et al., 2005). Eucalyptus spp. are
known to be particularly competitive trees that significantly reduce crop growth due to severe
competition for soil moisture (Kidanu, 2005), nutrients (Okorio et al., 1994) and light
(Bertomeu, 2012). Some trees may exert allelopathic effects on crops growing in their
vicinity (Lisanework and Michele, 1993).
Apart from the competition between food crops and woodlot trees, trees in mono-specific
plantations compete among themselves thereby reducing tree growth within a stand as
illustrated by the larger size of trees at the edge of plantations compared with those at the
centre. Differential growth between trees at stand edges and in the inner zones has been
observed in agroforestry systems (van Noordwijk, 1999), in forest plantations (McJannet and
Vertessy, 2000) and in natural forests (McDonald and Urban, 2004). The growth of dominant
trees in a forest plantation results from superior resource use-efficiency that leads to greater
tree growth (Harris, 2007). However, the additional tree growth exhibited by edge trees in
plantations results from the extra resources gained from crop fields adjoining them (Weathers
et al., 1997). This effect may be due to differences in microclimate (Voicu and Comeau,
2006) and light (Dignan and Bren, 2003), which influence nutrient exchange (Sanou et al.,
2012) thereby enhancing growth of trees on the edge compared with those in the interior
(Wright et al., 2011).
Exploitation of interactions between woody and non-woody components is the key to the
success of agroforestry systems (Rao et al., 1998). This necessitates understanding of the role
of inter- and intra-species competition at the tree crop interface. We studied interactions
between eucalypt woodlots and maize as a representative field crop. The specific objectives
were: i) to quantify the differential growth and biomass production in Eucalyptus saligna
edge trees in relation to those at the woodlot centre; ii) to quantify the crop field area affected
by woodlot trees and yield losses of maize crops; iii) to quantify the area of the woodlot
subject to edge effects and effects on tree biomass; and iv) to evaluate the trade-offs of crop
yield losses in relation to the gains of wood production.
63
Materials and methods
Site description
Site description was fully presented in chapter 3, and is only briefly summarized here. The
maize experiment was conducted in three sites where there were E. saligna woodlots and
adjacent crop fields. Two sites, Cyarwa and Gishamvu were located in Huye district and one,
Save, in Gisagara district, southern Rwanda. Maize (Katumani variety) was grown in crop
fields adjacent to Eucalyptus woodlots. The woodlot and cropland together comprise an
agroforestry system with woodlot and crop fields as subsystems. The edge effects on both
components as expressed in tree sizes and maize biomass production and yield, and the
profitability of the products were the main focus of this study.
Experimental design and field procedures
The field procedure and experimental design are described in detail in chapter 3. The
experiment commenced during the Jan-May 2007 season and ran for three consecutive
cropping seasons. The maize experiment was done on three sites and in each of these, three
crop fields belonging to farmers were used. To ensure representative coverage of the study
zone, the three sites used were located at least five km apart. Fields incorporating woodlots
with trees of E. saligna were selected and experimental plots of 12.5 m × 30 m marked by
pegging. In all sites, the tree-crop interface was along the 12.75 m side of the crop field
length and the sides of the woodlots were longer. Woodlot sizes were 60 x 70 m for Save site,
50 x 50 for Cyarwa and 60 x 65 m for Mukura. Each crop field was divided into subplots
running parallel to the tree-crop line and away into the farmland with the following
dimensions: 0-2, 2-4, 4-6, 6-9, 9-12, 12-16, 16-20, 20-25 and 25-30 m. Site characterisation
for soil pH and soil particle size distribution were presented in chapter 3. Soil pH ranged
from 4.67-4.88, clay from 20.1-26.3, clay from 62.2-68.9 and sand from 10.9-11.5. Katumani
maize variety was sown in the crop plots adjacent to the woodlots after site preparation by
manual tillage. The planting was done at a spacing recommended at the time of experiment
by Rwanda Agriculture Board (RAB), of 0.5 m between plants and 0.75 m between lines,
with three seeds planted per hole, later thinned to leave two plants per hole. Land preparation
was done by hand hoe and plots were hand weeded three times during the season to avoid
weed competition.
Data collection and analyses
For biomass and grain yield determination, the inner 2 × 2 m area was demarcated in each of
the nine plots after the maize were fully mature and had started drying. Six plants were
harvested from this area and the above ground parts of each were cut at the root collar by
using a sharp machete. For each plant, the parts were labelled, oven dried at 65oC to constant
weight and weighed. All cobs from this inner plot were dried under full sunshine for 20
consecutive days. Grain was separated from cobs by using a threshing machine and weighed
using an electronic balance in the faculty of agriculture laboratory at the University of

64
Rwanda. The air dry grain weight was reduced to dry weight by multiplying with a factor of
0.85.
Six woodlots were used to quantify tree growth in terms of diameter at breast height (DBH)
and biomass (W) and the reduction of these traits in relation to distance from the woodlot
edge. These included the three woodlots Cyarwa, Save and Mukura that were used to
investigate the interaction between woodlot trees and maize crop, and an additional three
(ARI, AR
II and AR
III) woodlots sampled from the Ruhande Arboretum (Butare, southern
Rwanda). Woodlots ARII and Save were planted, while the rest were coppice stands. For tree
biomass estimation, DBH was measured and recorded by tree rows. From each woodlot,
twelve consecutive tree rows from the edge running parallel to the tree-crop interface towards
the woodlot centre were selected. From each of the 12 tree rows in the three sites, thirteen
trees were selected and measured for DBH. Tree spacing was 2 × 2 m, and the measurements
extended from the woodlot edge to 22 m inside the woodlot. The DBH of the surviving trees
were recorded and total biomass per tree (W, kg tree-1
) of each tree measured for DBH was
estimated using an allometric equation developed for the species in the study area (Mugunga
et al., submitted). Differences in DBH and W between edge trees (from the four outer lines of
the woodlots) and the average for four innermost trees inside the woodlots (assumed to be
free from the edge effect) were taken as the DBH and W gains due to edge effect. Tree weight
was converted to a hectare basis based on tree density. Average annual biomass increment
per ha was then deduced from total biomass by dividing by stand age.
To analyse the trade-off between maize yield (including stover biomass) and wood
production, maize stover and grain yield obtained in one season were extrapolated to annual
values by multiplying by two as there are two cropping seasons in the study area, with the
remaining months consisting of the dry season. Basing on our observation on maize growth
and grain yield, the crop field was divided into two zones: zone A, the one affected by the
woodlot edge and zone B, the one not affected (Fig. 4.1). Losses in maize stover and grain
yield in zone A were computed as differences between stover and grain yield in this zone and
corresponding values in zone B. For the woodlots, a similar zonation was made such that the
edge affected or the outer part of the woodlot closest to the woodlot-crop interface was
denoted as zone C while the one not affected was zone D (Fig. 4.1).
Data were statistically analysed by using IBM SPSS 22 software. One way analysis of
variance was used to determine significant differences between treatments and means were
separated by using least significant difference method (P<0.05).
In addition to the effects on biomass increment, the long term economic feasibility of maize
and E. saligna woodlots was addressed using a net present value (NPV) approach based on
the work of Whittock et al. (2004). The NPV shows the total amount of surplus (profit) or
loss that a given project or enterprise is expected to generate over its lifetime and a positive
NPV indicates a profit since the expected net cash inflows over the total project lifetime are
higher than the cost of financing the project (van Eijck et al., 2012). Costs of the different
activities and commodity prices for revenue estimations were based on those provided by the
Rwandan Agriculture Board (RAB), Ruhande Arboretum station located in the study area.
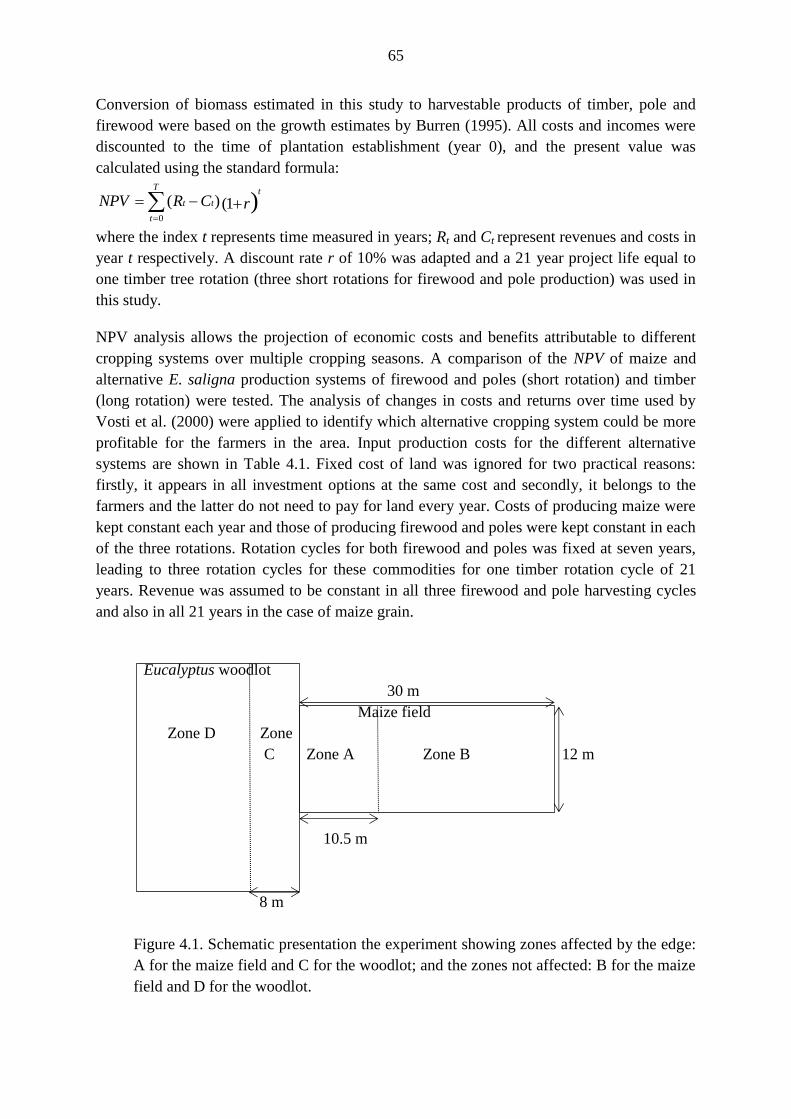
65
Conversion of biomass estimated in this study to harvestable products of timber, pole and
firewood were based on the growth estimates by Burren (1995). All costs and incomes were
discounted to the time of plantation establishment (year 0), and the present value was
calculated using the standard formula:
)1()(0
rCRNPVt
T
t
tt
where the index t represents time measured in years; Rt and Ct represent revenues and costs in
year t respectively. A discount rate r of 10% was adapted and a 21 year project life equal to
one timber tree rotation (three short rotations for firewood and pole production) was used in
this study.
NPV analysis allows the projection of economic costs and benefits attributable to different
cropping systems over multiple cropping seasons. A comparison of the NPV of maize and
alternative E. saligna production systems of firewood and poles (short rotation) and timber
(long rotation) were tested. The analysis of changes in costs and returns over time used by
Vosti et al. (2000) were applied to identify which alternative cropping system could be more
profitable for the farmers in the area. Input production costs for the different alternative
systems are shown in Table 4.1. Fixed cost of land was ignored for two practical reasons:
firstly, it appears in all investment options at the same cost and secondly, it belongs to the
farmers and the latter do not need to pay for land every year. Costs of producing maize were
kept constant each year and those of producing firewood and poles were kept constant in each
of the three rotations. Rotation cycles for both firewood and poles was fixed at seven years,
leading to three rotation cycles for these commodities for one timber rotation cycle of 21
years. Revenue was assumed to be constant in all three firewood and pole harvesting cycles
and also in all 21 years in the case of maize grain.
Eucalyptus woodlot
30 m
Maize field
Zone D Zone
C Zone A Zone B 12 m
10.5 m
8 m
Figure 4.1. Schematic presentation the experiment showing zones affected by the edge:
A for the maize field and C for the woodlot; and the zones not affected: B for the maize
field and D for the woodlot.

66
Table 1 Input cost of maize and E. saligna products in eucalypt woodlot-maize agro-ecosystem in southern Rwanda – calculations based on 1 ha
smallholder land area
A. Maize B. E. saligna woodlot
Item/activity Unit Quantity Cost (US $/year) Item/activity Unit Quantity Cost (US $)**
Unit Total Unit Total
1. Seed purchase kg 30 0.83 25 1. Seedling production Number 2,500 0.08 208
2. Land preparation Person days 150 1.67 250 2. Site preparation Person day 80 1.67 133
3. Sowing 75 1.67 125 3. Field planting Person day 55 1.67 92
4. Fertiliser purchase 4. Weeding Person day 45 1.67 75
4.1 NPK (17%) kg 300
0.67 200
5. Thinning - timber
production*
Person day 1,215
1.67 2,025
4.2 Urea (45%) kg 100 0.70 70
5. Fertiliser application Person days 66 1.67 110 5. Harvesting Person day 2,945 1.67 4,908
6. Weeding Person days 105 1.67 175 5.1 Timber Person day 300 1.67 500
7. Harvesting Person days 90 1.67 150 5.2 Firewood Person day 350 0.08 208
8. Drying & processing Person days 60 1.67 100 5.3 Poles
Total 1,205 7,942
*combines cost of three thinnings, **1 US $ = 600 Rwandan Francs (FRW)

67
An analysis was done to study whether revenues from additional tree growth due to edge
effects compensate for the crop loss due to edge effects. For the case of maize grain, the loss
in revenue was taken as the difference between the revenue obtained from maize grown in
open areas (zone B) and the average obtained from maize in the area close to the woodlot
(zone A). Likewise, the average gains in the different wood production alternatives were
simply the difference in average revenue between the products obtained from trees in zone C
and those in zone from zone D. A trade off analysis was made by comparing revenues
obtained from both maize and woodlot sole cropping and from the combined maize-woodlot
production alternatives (of timber, pole and firewood). A comparison was also made on
revenues obtained from edge tree gains (i.e., revenue obtained from extra biomass in zone C)
and revenue losses incurred in maize yield (i.e., revenue losses obtained due to yield decline
in zone A).
Results
The results on maize growth and grain yield, and the crop field area affected by the woodlot
referred to here are fully reported in a different paper (Mugunga et al., submitted). The
proportion of the crop field affected by the woodlot, zone A, was observed to be a crop field
strip whose width perpendicular to the tree-crop interface is 10.5 m. In the whole maize field
of 12 × 30 m therefore, the edge affected area is equivalent to 10.5 × 12 m (35% of the total
maize field) and the remaining portion, zone B, of 19.5 m × 12 m was free from woodlot
effect, and represents the open area as illustrated in Fig. 4.1 above.
Maize stover and grain yield in zone A declined significantly (P<0.001) nearest to the
eucalypt woodlots as a result of inter-specific competition (Fig. 4.2). The average stover and
grain yield recorded in this zone was 1 t ha-1
for stover and 0.5 t ha-1
for grain yield while
respective values recorded in open areas were 3.3 and 2.6 t ha-1
. The yield in zone A therefore
was only about one third for stover and one fifth for grain yield of the values in open areas.
Characteristics of woodlots used in this study are presented in Table (2). The average heights
of trees in the woodlots were: 17 m for site ARI, 22.7 m for AR
II, 18.5 m for AR
III, 18.6 m for
Cyarwa, 16.4 m for Mukura and 24.9 m for Save sites. Tree survival rate ranged from 56% for
Mukura site to 88.5% for ARI site. Intra-specific competition was also evident within the
eucalypt woodlots where the edge trees were much larger than those at the centre of the
woodlot (Fig. 3a & b). Tree sizes differed significantly (P<0.001) between woodlots and more
so with distance from woodlot edge. Older woodlots where trees had thicker trunks seemed to
be more affected than the younger ones with smaller DBH. Generally, the edge effect was
observed in the outer six to eight m band of the woodlots closest to the tree-crop interface
(zone C) irrespective the size of the woodlot.

68
Table 4.2. Characteristics and growth of 12 outer tree lines in six Eucalyptus saligna
woodlots used to study the edge effects in southern Rwanda
Woodlot Stems ha-1
DBH (cm) Height (m) Biomass (kg tree-1
) Biomass (t ha-1
)
*ARI 1209 13.4 13.8 141.7 171.3
ARII 560 23.8 22.6 360.3 201.8
*ARIII
1152 13.8 14.9 147. 7 170.2
*SAVE 1005 16.6 19.8 235.0 236.2
*CRWA 1205 16.1 15.0 203.0 244.6
*MUKU 1376 12.5 16.4 132.0 181.6
*Coppice stands; ARI, AR
II and AR
III denote eucalypt woodlots from Ruhande Arboretum
while SAVE, CRWA = Cyarwa and MUK = Mukura woodlots belonged to the farmers
together with the maize fields.
Figure 4.2. Variation in maize stover and grain yield with distance from Eucalyptus
saligna woodlots and maize interface at three sites (Save, Cyarwa and Mukura sites
in Table 4.1) in southern Rwanda). Horizontal axis indicates the position of maize
sampling for yield determination as distance from tree-crop interface. The standard
error of the mean (SE) ranged from 0.02-0.8, n = 9. Figure adapted from chapter 3.
On average, tree DBH and above ground biomass in zone C were respectively 17.8% and
34.5% larger than at the woodlot centre (zone D). For a woodlot of 50 × 50 m, zones C and D
would have respective sizes of 8 × 50 and 43 × 50 m. Zone C therefore is equivalent to 18.6%
of the whole woodlot. This estimation however considers only the woodlot side located close
to the crop field for the purpose of this study, but the effect could actually be up to four times
if the whole woodlot perimeter was not adjoined by other tree stands.
0.0
0.5
1.0
1.5
2.0
2.5
3.0
3.5
0 5 10 15 20 25 30
Sto
ver
/Gra
in y
ield
(t
ha-1
)
Distance (m)
Stover
Grain yield

69
(a)
(b)
Figure 4.3. Variation in tree diameter at breast height (a) and above ground tree
biomass (b) with distance from the woodlot edge in six Eucalyptus saligna stands
in southern Rwanda.
The area of the crop and the woodlot impacted by the edge effect (zones A and C
respectively) depend on the size of the two sub-components of the maize-woodlot agro-
ecosystem. In general, the two increase with the area occupied by the two components since
the length of the tree-crop interface increased as the two sub-systems increase in size.
Logically, a farmer would locate a woodlot at the corner of her/his plot and not at the centre,
amidst the crop so as to minimise the tree-crop interface and the associated crop yield. To
0
5
10
15
20
25
30
35
0 2 4 6 8 10 12 14 16 18 20 22
Aver
age
DB
H
Distance (m)
0
100
200
300
400
500
600
0 2 4 6 8 10 12 14 16 18 20 22Aver
age
aboveg
round b
iom
as (
kg t
ree-1
)
Distance (m)
ARI
ARII
ARIII
Cyarwa
Mukura
Save
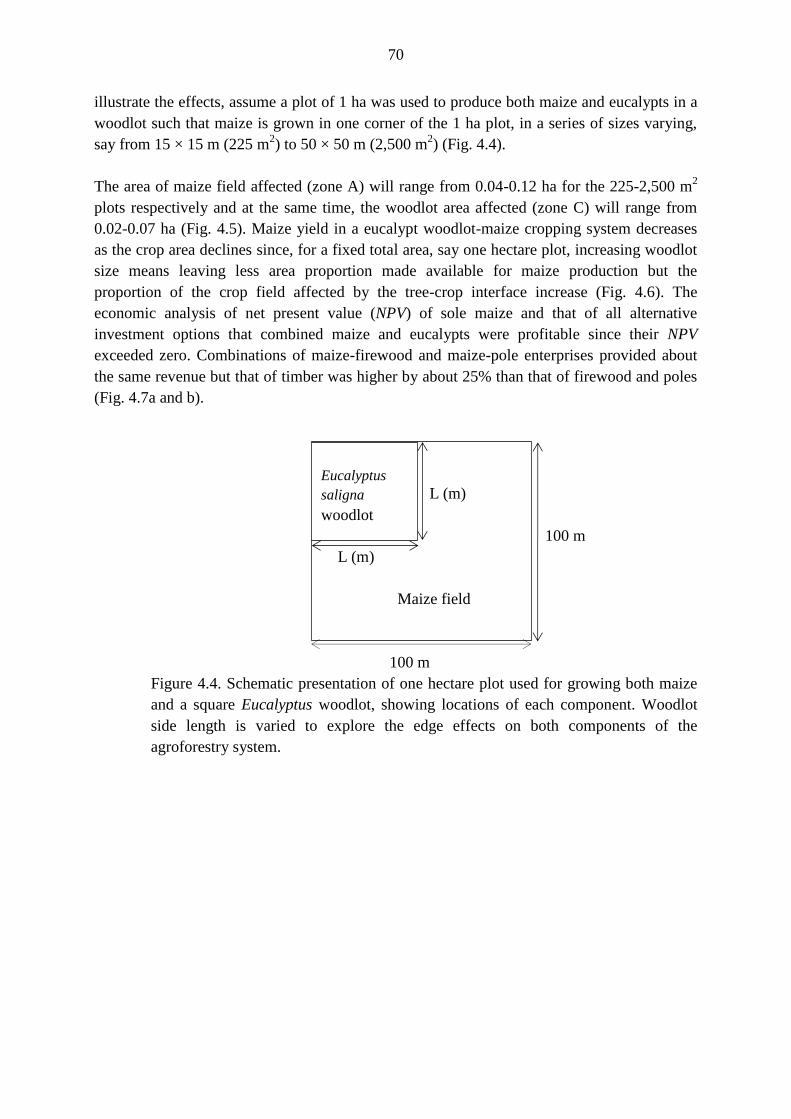
70
illustrate the effects, assume a plot of 1 ha was used to produce both maize and eucalypts in a
woodlot such that maize is grown in one corner of the 1 ha plot, in a series of sizes varying,
say from 15 × 15 m (225 m2) to 50 × 50 m (2,500 m
2) (Fig. 4.4).
The area of maize field affected (zone A) will range from 0.04-0.12 ha for the 225-2,500 m2
plots respectively and at the same time, the woodlot area affected (zone C) will range from
0.02-0.07 ha (Fig. 4.5). Maize yield in a eucalypt woodlot-maize cropping system decreases
as the crop area declines since, for a fixed total area, say one hectare plot, increasing woodlot
size means leaving less area proportion made available for maize production but the
proportion of the crop field affected by the tree-crop interface increase (Fig. 4.6). The
economic analysis of net present value (NPV) of sole maize and that of all alternative
investment options that combined maize and eucalypts were profitable since their NPV
exceeded zero. Combinations of maize-firewood and maize-pole enterprises provided about
the same revenue but that of timber was higher by about 25% than that of firewood and poles
(Fig. 4.7a and b).
L (m)
100 m
L (m)
Maize field
100 m
Figure 4.4. Schematic presentation of one hectare plot used for growing both maize
and a square Eucalyptus woodlot, showing locations of each component. Woodlot
side length is varied to explore the edge effects on both components of the
agroforestry system.
Eucalyptus
saligna
woodlot
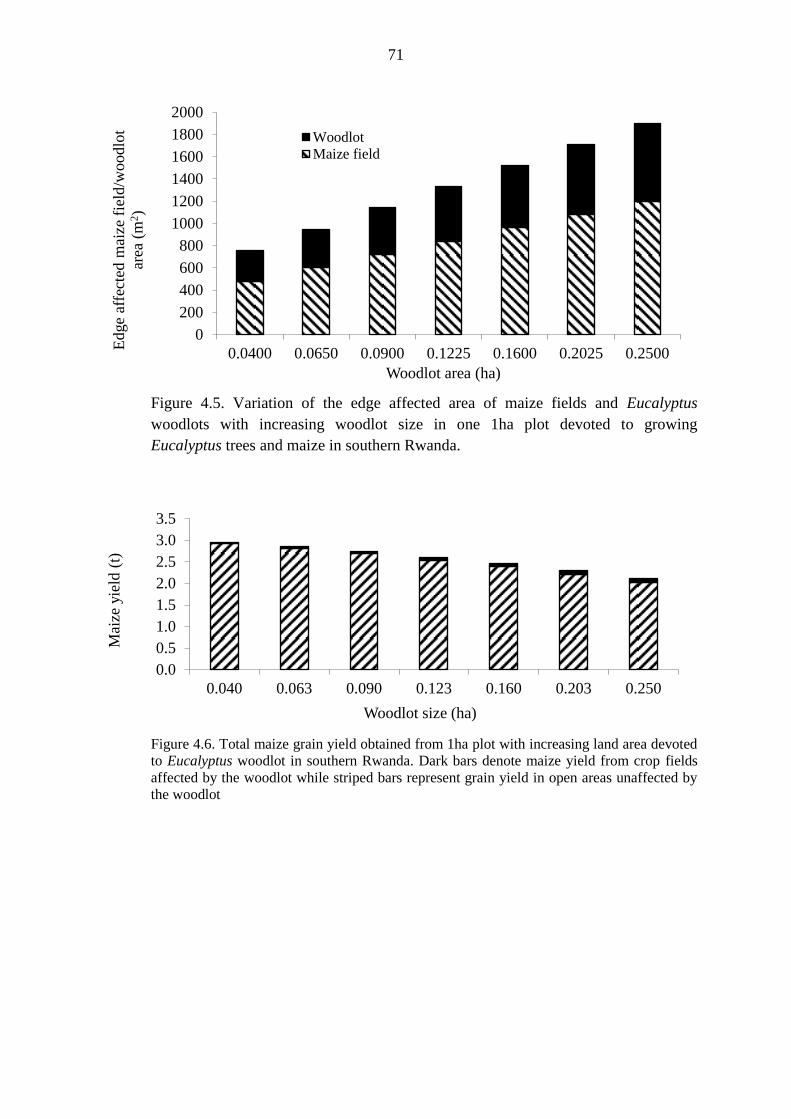
71
Figure 4.5. Variation of the edge affected area of maize fields and Eucalyptus
woodlots with increasing woodlot size in one 1ha plot devoted to growing
Eucalyptus trees and maize in southern Rwanda.
Figure 4.6. Total maize grain yield obtained from 1ha plot with increasing land area devoted
to Eucalyptus woodlot in southern Rwanda. Dark bars denote maize yield from crop fields
affected by the woodlot while striped bars represent grain yield in open areas unaffected by
the woodlot
0
200
400
600
800
1000
1200
1400
1600
1800
2000
0.0400 0.0650 0.0900 0.1225 0.1600 0.2025 0.2500
Edge
affe
cted
mai
ze f
ield
/woodlo
t
area
(m
2)
Woodlot area (ha)
Woodlot
Maize field
0.0
0.5
1.0
1.5
2.0
2.5
3.0
3.5
0.040 0.063 0.090 0.123 0.160 0.203 0.250
Mai
ze y
ield
(t)
Woodlot size (ha)

72
(a)
(b)
Figure 4.7. Revenue from three alternative production options of maize-firewood,
maize-pole and maize-timber in a woodlot-maize system in southern Rwanda spread
over a 20 year timber rotation period. (a) net revenue (US$) (b) percent increase in
revenue over sole maize of three different wood end use production options. The
grey line denotes maize-timber; dark, broken line maize-pole and the grey, dotted
line maize-firewood options.
0
20,000
40,000
60,000
80,000
100,000
120,000
140,000
160,000
180,000
0.00 0.05 0.10 0.15 0.20 0.25 0.30 0.35 0.40
Rev
enue
(US
$)
Woodlot size (ha)
Maize+ Fwood
Maize+Pole
Maize+Timber
0
10
20
30
40
50
60
70
80
0.00 0.05 0.10 0.15 0.20 0.25 0.30 0.35 0.40
% i
ncr
ease
in n
et r
even
ue
Woodlot size (ha)
Maize+Fwood
Maize+Pole
Maize+Timber
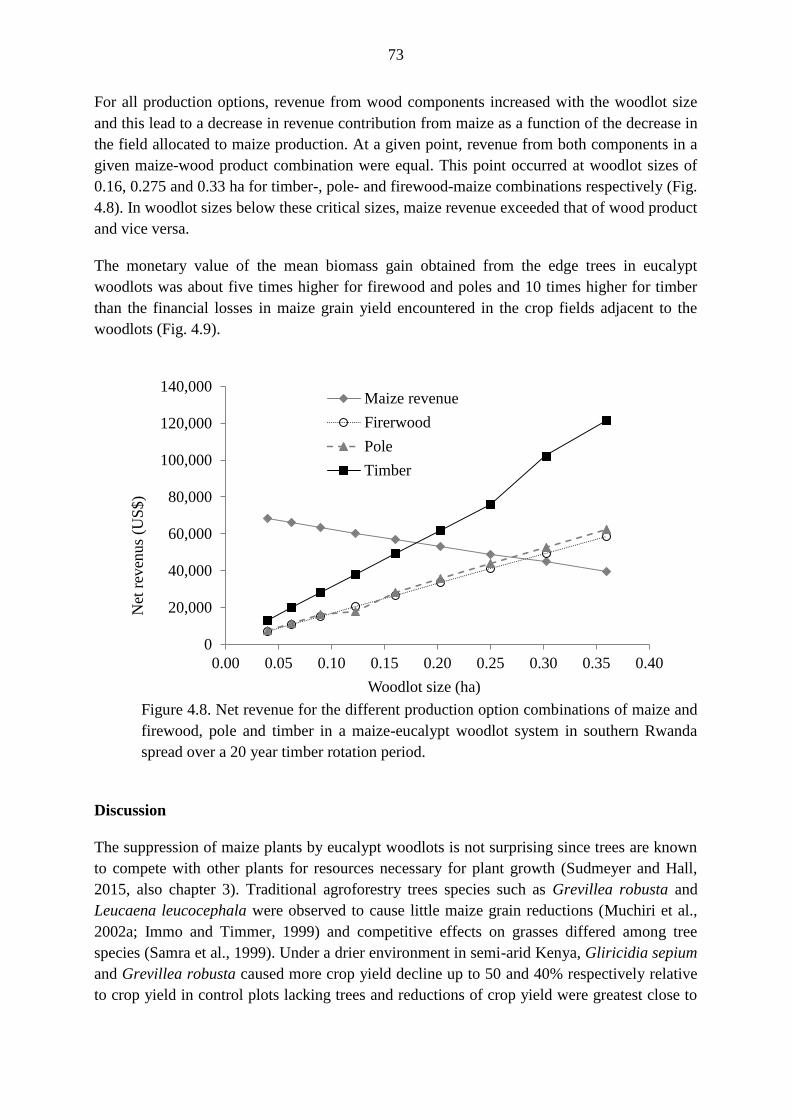
73
For all production options, revenue from wood components increased with the woodlot size
and this lead to a decrease in revenue contribution from maize as a function of the decrease in
the field allocated to maize production. At a given point, revenue from both components in a
given maize-wood product combination were equal. This point occurred at woodlot sizes of
0.16, 0.275 and 0.33 ha for timber-, pole- and firewood-maize combinations respectively (Fig.
4.8). In woodlot sizes below these critical sizes, maize revenue exceeded that of wood product
and vice versa.
The monetary value of the mean biomass gain obtained from the edge trees in eucalypt
woodlots was about five times higher for firewood and poles and 10 times higher for timber
than the financial losses in maize grain yield encountered in the crop fields adjacent to the
woodlots (Fig. 4.9).
Figure 4.8. Net revenue for the different production option combinations of maize and
firewood, pole and timber in a maize-eucalypt woodlot system in southern Rwanda
spread over a 20 year timber rotation period.
Discussion
The suppression of maize plants by eucalypt woodlots is not surprising since trees are known
to compete with other plants for resources necessary for plant growth (Sudmeyer and Hall,
2015, also chapter 3). Traditional agroforestry trees species such as Grevillea robusta and
Leucaena leucocephala were observed to cause little maize grain reductions (Muchiri et al.,
2002a; Immo and Timmer, 1999) and competitive effects on grasses differed among tree
species (Samra et al., 1999). Under a drier environment in semi-arid Kenya, Gliricidia sepium
and Grevillea robusta caused more crop yield decline up to 50 and 40% respectively relative
to crop yield in control plots lacking trees and reductions of crop yield were greatest close to
0
20,000
40,000
60,000
80,000
100,000
120,000
140,000
0.00 0.05 0.10 0.15 0.20 0.25 0.30 0.35 0.40
Net
rev
enus
(US
$)
Woodlot size (ha)
Maize revenue
Firerwood
Pole
Timber

74
trees (Odhiambo et al., 2001). Forest trees (Cupressus lusitanica and Pinus patula) in a
taungya system in Kenya reduced yield in adjacent crops up to 41 and 48% respectively when
trees were two years old in a deep soil and from 16-26% respectively in a shallow site (Imo,
2008).
Figure 4.9. Losses in net revenue of maize (dark bars) and respective gains in timber
(dark grey bars), pole (black and white with horizontal line bars) and fuel wood
(black and white with vertical line bars) production alternative options as a result of
edge effects in the crop field and eucalypt woodlots in southern Rwanda.
Eucalyptus trees being very fast growing would be expected to be more competitive than
many other tree species. Their suppressive effects on maize was observed (chapter 3), to be
primarily due to severe competition for soil moisture, soil nutrients. Similar results have been
reported in other studies elsewhere (Bertomeu, 2012; Kidanu et al., 2005; Okorio et al., 1994).
Root concentration of eucalypts is reported to be highest in the upper soil layers and this
would be expected to explain the observed species’ severe competition for soil moisture
(Grant et al., 2012). However, Radersma and Ong (2004) indicate that there is a lack of a clear
relation between root length density and water extraction near Grevillea robusta tree lines and
conclude that the competition can be explained by a decrease in water-potential gradient
between root and soil at increasing distance from the tree base. Smaller grain yield observed
closest to the trees not only resulted from trees’ competitive capacity but also from the crop’s
tendency to use available energy and water for survival rather than for seed production at the
tree-crop competition front (Oliver et al., 2005).
The proportion of the crop field affected by trees in woodlot-cropping systems may depend on
the species, size and age of the woodlot, field orientation and the local climate among other
factors (Kidanu et al., 2005). To illustrate the effect of plot orientation, with the field layout in
Fig. 1a, zone A, the maize field affected by the edge is 10.5 × 12 m (which is equivalent to
35% of the total maize field) while the remaining 65% (19.5 × 12 m) was edge effect free. By
-10,000
-5,000
0
5,000
10,000
15,000
20,000
25,000
30,000
0.04 0.06 0.09 0.12 0.16 0.20 0.25 0.30 0.36
Woodlot size (ha)
Lo
ss/g
ain
in
net
rev
enu
e (U
S$
/ha)

75
changing the maize field orientation such that the longer maize crop side (30 m) adjoins the
woodlot, zone A would increase by 2.5 times to 10.5 × 30 m, equal to 87.5%. This means the
total loss in maize grain yield per plot would be 2.5 times higher. On the woodlot side, extra
wood will be produced in the outer perimeter of 8 m width surrounding the woodlot.
Assuming that all four sides of a woodlot are affected, that is, the woodlot is not surrounded
by other woodlots or tree stands, small woodlots up to 16 × 16 m2 will be completely prone to
the edge effects. Square woodlots of 17 m length will have only one square metre unaffected
but this will have no tree since the spacing is commonly 2 × 2 m. Woodlots of 20 × 20 m2 will
have 16 m2 unaffected, which is only 4% by area. The woodlot area affected by the edge will
increase linearly with the increasing size and will reach 50% for a woodlot of 54 × 54 m2
(about 0.3 ha) (Fig. 4.10). Timber increase due to edge effect will therefore increase with the
woodlot size and will be that of unaffected woodlot area plus that of woodlot affected, the
latter being 34.5% higher than the former for an equal size proportion.
Figure 4.10. Woodlot area affected by the edge area in relation to the woodlot size.
Square woodlots of lengths of 16 m will be 100% totally be prone to the edge effect
and thereafter, edge affected area will increase linearly until it is 50% by area when a
woodlot has 54 m × 54 m2.
Some authors report tree effects on crops in fields adjacent to trees to extend to a distance
equal to/or several times higher than the tree heights from the tree-crop interface (Pinto et al.,
2005; Chanie et al., 2013). In this study, the effect of woodlots on maize yield was limited to
a distance about half the average woodlot tree height. This could probably (Carberry et al.,
2007; Hou et al., 2003) and for eucalypts, the common range was observed be attributed to the
distance to which the shade extends to. The edge effect distance from tree-crop interface
differ between species and sites to be 12 m in Ethiopian highlands (Kidanu et al., 2005) and
up to 44 m in Australia (Sudmeyer et al., 2004). The crop field area prone to woodlot tree
suppression observed in this study (zone A) is slightly lower than this range. The differential
growth rate observed in this study between trees at the woodlot edge and those at the woodlot
centre are the result of intraspecific competition. Competition in plant communities occurs
when individuals use resources that would otherwise have been used by their neighbour had
0
10
20
30
40
50
60
0 5 10 15 20 25 30 35 40 45 50 55 60 65
Edge
pro
ne
woodlo
t ar
ea a
s %
of
the
tota
l
Woodlot side length (m)

76
they not been present (Donald, 1963; Cannell et al., 1996). The onset of competition is usually
hastened by greater initial plant population densities and, in the case of light competition, by
greater stand growth rates due to better site quality (Weiner, 1986), leading to earlier crown
closure. The development of structural variation within even-aged plant populations is
considered to be due to a hierarchy of exploitation following the onset of intra-specific
competition (Harper, 1967; Weiner, 1986), whereby larger plants are able to capture a
relatively greater ratio of resources than smaller plants, resulting in greater relative growth
rates for larger plants (Ford 1975; Weiner, 1986).
Intraspecific competition has been recognised as a key factor in variation of growth rates,
leading to variation in tree sizes within stands (Weiner et al., 2001). Trees in zone D
experience severer competition than those in zone C and resources gained from crop fields
adjoining the woodlots (Weathers et al., 1997; Pinto et al., 2005). In agroforestry systems
where N2-fixing tree species are usually grown, the extra growth of border trees may not
simply be seen as a positive effect of N-fixation (Van Noordwijk, 1999) since this could be a
result of additional resources obtained from adjacent fields, which could otherwise be used by
the crops if trees were not there (Cannell et al., 1996). This has been observed to be the case
in fallow systems under which below ground resource capture was observed to extend up to
10 m in the crop field from the fallow edge or even beyond in older trees (Van Noordwijk et
al., 1996). Roots of some plantation species may extend even further in the crop fields
compared to traditional agroforestry fallow species. For example, the lateral extent of tree
roots was observed to range from 10 m for Eucalyptus kochii to 44 m for Pinus pinaster
(Sudmeyer et al., 2004).
Woodlot size influences its proportion that is prone to the edge effect. Although the area of
the woodlot affected by the edge increases with increasing woodlot size, smaller woodlots are
more susceptible than the big ones. A bigger proportion of stems in woodlots with areas of
0.05 ha for example will be highly affected by the edge, and in fact, woodlot sizes of 14.1 ×
14.1 m (approximately ≤0.02ha) will show 100% edge effects. Most woodlot sizes commonly
owned by farmers in the study area fall under this category. Estimation of woodlot biomass in
these woodlots without considering edge trees would not be possible. This is not uncommon
in small scale agroforestry systems and Van Noordwijk (1999) observes that biomass
production of a fallow plot will depend on the fraction of border trees in the plot as a whole.
Economic and financial analyses of agroforestry systems in most cases have revealed greater
benefits when trees are incorporated in the cropping systems compared to the sole crops. This
was observed in eastern Africa with Eucalyptus trees where household income were increased
by far over sole crops in Ethiopia (Jagger and Pender, 2000; Kidanu et al., 2005; Kebebew
and Ayele, 2010) and in Kenya (Peralta and Swinton, 2009). Kebebew and Ayele for example
reported that eucalypts contributed 50% of household income relative to major agricultural
crops and by allocating 12% of available land to eucalypts, returns were increased from the
same unit of land by 90%. They further report a reduction in the returns from the land of 127
and 34% for teff and barley respectively when eucalypt contribution was not considered.
Similar results were also reported in the region when eucalypts and another tree species
(jatropha) gave superior income compared to crops (cassava) (van Eijck et al., 2012). In
77
financial terms, the tree component in these systems were observed to adequately compensate
for crop yield reductions and even generate additional income (Kidanu et al., 2005). In
addition to generating much income, Eucalyptus is less sensitive to changes in wages and has
yields more than the other crops and can be highly profitable for smallholders (van Eijck et
al., 2012). Contradicting observations were made in the Philippines, where maize
monocropping was more profitable over timber-maize intercropping (Bertomeu, 2006) while
the reverse was true in a study by Magcale-Macandog et al. (2006) in the same country.
Bertomeu (2006) however realises that this is not expected and attribute this to a widespread
planting of a few fast growing tree species which has led to oversupply and drastic decline in
the price of home-grown timber.
Long rotation cycles is another issue in making investment choices by farmers in tree-crop
enterprises in high potential areas where landholdings are very small. Annual crops provide
yield and income only within three to four months after planting and thereafter two to three
times every year while early returns from trees may take at least five years. Farmers in the
central highlands of Kenya for example decided to cultivate almost all their farmland with
maize and not Grevillea robusta alone or grevillea-maize intercrops because of this problem,
irrespective their great need for firewood and construction material (Muchiri et al., 2002b).
The observation by Muchiri et al. (2002b) which holds true in our study area also is that,
although pure tree or tree-crop combinations may be economically more viable than sole
crops, farmers are likely to opt for the sole crop alternative because this option provides
insurance as far as food security is concerned.
Conclusions
In the crop close to the woodlot (zone A), yield was reduced to 0.5 t ha-1
due to inter-specific
competition between Eucalyptus saligna woodlots and maize compared to the yield of 2.6 t
ha-1
observed in zone B. Beyond 10.5 m away, the maize yield was not significantly affected
by the woodlots. The grain yield increased with the tree-crop interface and therefore with
increasing size of woodlot and maize field. The orientation of a crop field is very important
and in rectangular plots, the proportion affected by the edge effect may be very significant,
especially in very small fields. Intra-specific competition was observed to be high in eucalypt
woodlots as evidenced by bigger individual trees in zone C compared to those in zone D. Tree
DBH and biomass in zone C were 17.8% and 34.5% higher respectively compared to the
values of trees in zone D. In small woodlots of 0.05 ha, 40% will be affected by the edge
while those of 0.02 ha will be 100% affected. The effect seemed to be more apparent in older
woodlots with bigger individual stems than those with younger, smaller stems. Ignoring edge
effects in forest inventories as it is traditionally done in standard forest inventory practice may
lead to significant under-estimation in small woodlots. The area of the crop field (and that of
the woodlot) subject to the edge effect increased with the size of the woodlot as a result of the
increased length of tree-crop interface.
Trade-off analysis showed that, while investing in growing sole maize is profitable (NPV>0),
integrating maize and woodlots is far more profitable with the profit increasing with the
woodlot area. Average revenue gained from positive tree biomass increments resulting from

78
edge effects compensated for the corresponding revenue losses due to grain yield decline
resulting from the edge effects in these systems. Basing solely on this criterion, integration of
maize and eucalypt woodlots is justifiable. However, the seemingly viable option of income
generation through combined eucalypt woodlot-annual crop combination may be hampered
by the constraint of land availability which is a serious issue in the study area. Farmers who
own larger plots are more likely to adopt the crop-eucalypt woodlot combination and
therefore more likely to obtain the benefits associated with the practice and vice versa.

79
CHAPTER 5: Water use by short rotation Eucalyptus woodlots in southern Rwanda
CP Mugunga, D Kool, MT Van Wijk, GMJ Mohren, KE Giller
Published as:
C. P. Mugunga, D. Kool, M. T. Van Wijk, G. M. J. Mohren & K. E. Giller (2015). Water use
by short rotation Eucalyptus woodlots in southern Rwanda. Agroforest Syst (2015) 89:1119-
1139, DOI 10.1007/s10457-015-9843-5.

80
81
Water use by short rotation Eucalyptus woodlots in southern Rwanda
CP Mugunga, D Kool, MT Van Wijk, GMJ Mohren, KE Giller
Abstract
Eucalyptus is abundant in Rwanda, mainly planted in short rotation woodlots, scattered in
small clusters over the hilly landscape. A study was done in Butare and Busoro catchments,
southern Rwanda from May-November 2007 to estimated water use of eucalypts in
representative catchments in Rwanda, establishing a monthly water balance. We compared
eucalypt water use to water use of other key crops in the study area and to that of eucalypts
elsewhere. The woodlots had small coppice shoots ranging from 2-36 cm breast height
diameter and potential tree transpiration recorded was 3 mm d-1
. The annual potential tree
transpiration was 10% below annual precipitation. Dry month water deficit observed could be
covered by reductions in leaf area, stomatal closure and changes in soil water storage. A
sensitivity analysis showed that 50% leaf area reduction corresponded to potential tree
transpiration decline of 32.8 mm. The deficit may not impact tree growth negatively since dry
seasons are usually not active for tree growth. The moderate eucalypt water use rate observed
in this study may be a function of trees’ small size and low tree stocking since such woodlots
had less potential transpiration. The observed eucalypt water use rate is smaller than the range
reported for eucalypts in Africa and was also smaller than that of key annual crops in the
study area. Managing woodlots as short rotations and increasing initial tree spacing may
contribute to resolving issues related to catchment hydrology associated with eucalypt
plantations.
Key words: Leaf area index; potential tree transpiration; catchment water balance; Busoro
catchment; Butare catchment
1. Introduction
The genus Eucalyptus (Myrtaceae) comprises more than 700 species and an unknown number
of hybrids and varieties (Boland et al., 2006). Only a few of these have potential in industrial
plantations (FAO, 2000). Eucalyptus species occur naturally in Australia and in the
Philippines, Papua New Guinea, Indonesia and Timor. They grow in diverse ecological
conditions with some hardy species growing in semi-arid areas, while others are able to grow
on marshy and swampy sites. Owing to their wide ecological adaptation, Eucalyptus species
are among the most widely cultivated forest trees in the world. In the late 1990s, Eucalyptus
plantations were estimated to cover at least 12 million ha throughout the tropical zone, 90% of
which had been established since 1955 (Turnbull, 1999). There are now >20 million hectares
of Eucalyptus plantations around the world and interestingly, more than 50% of these
plantations occur only in three countries: Brazil (4.2 M ha), India (3.9 M ha) and China (2.6
M ha) (Iglesias-Trabado and Wilstermann, 2008).
In Africa, there is little quantitative information on the planting of Eucalyptus. Several
Eucalyptus species were introduced to the continent in the second half of the nineteenth

82
century. South Africa has the largest area under Eucalyptus plantations of about half a million
hectares (Turnbull, 1999). Their first planting included introductions to botanical gardens and
private arboreta and once in cultivation, their potential was recognized and they were taken to
many parts of the world and planted for ornamental value, windbreaks, land reclamation, and
oil production (Turnbull, 1999). In South Africa, commercial plantations were intensified
from 1930 onwards, to meet the demand for wood destined for underground mining.
Eucalyptus species were introduced to the eastern Africa region at about the same time as in
South Africa (Dessie and Erkossa, 2011). More specifically, plantation forests were
established in the early 1900s in Rwanda (Nduwamungu, 2011a), in Kenya (Mathu, 2011) and
in Tanzania (Ngaga, 2011); in 1919 in Burundi (Nduwamungu, 2011b) and most recently in
Uganda, since the earliest report was in Kigezi District in 1940 (Kaboggoza, 2011). Large
scale establishment of industrial plantations in the region began during the period 1911-1960,
motivated by the realisation that the slow growing and uneasily propagated indigenous forests
would not meet future wood and non-wood forest products (Chamshama, 2011). The
introduction of the Eucalyptus to East Africa was aimed to meet this demand (Nduwamungu
et al., 2008).
As the first step to prepare for plantation forestry expansion in Rwanda, a 200 ha Arboretum
was established in Ruhande, Butare (southern province) in which exotic tree species were
tested, among which 63 eucalypt species were introduced (Burren, 1995). Plantations
expanded over time (Oballa et al., 2005), and by the early 1970s the area of Eucalyptus in
Ethiopia, Rwanda, Uganda, Kenya and Sudan had reached 95,684 ha (FAO, 1979). The
largest plantations at that time were in Ethiopia and Rwanda, at 42,300 ha and 23,000 ha,
respectively (Dessie and Erkossa, 2011).
Plantation trees and Eucalyptus spp. in particular have provoked controversy regarding their
effects on the environment (Vanclay, 2009). Some authors support Eucalyptus planting for
their economic, social and environmental benefits (Ferraz et al., 2013). On the other hand,
Eucalyptus are said to mine large amounts of nutrients, rendering the soils poor and unfit for
other use (Lemenih, 2004). Plantation trees are reported to take up much water, drying up
sites or interfering with water supply for other land uses (Jobbágy et al., 2012). Eucalyptus
trees are reported to use water in excess of supply from rainfall (Dye and Versfeld, 2007),
thereby lowering water tables due to water extraction (Dye, 2013). They also reduce water
availability for irrigation due to soil hydrophobocity (water repellence) of their litter and their
deep and dense root network (Lane et al., 2004). Replacement of natural vegetation by the
exotic eucalypts reduces biodiversity (Brokerhoff et al., 2013) and is said to prevent
understorey vegetation growth by exhausting soil water and nutrient resources, which also
may affect biodiversity negatively (Bouvet, 1998). These factors, especially the impacts on
water relations, raise considerable concern regarding the long-term sustainability of eucalypt
plantations.
In Rwanda, as in many high population density areas in the highlands of eastern Africa, most
forest plantations are privately-owned small woodlots. Principal owners include individual
farmers and businessmen, and institutions like churches, schools, cooperatives and tea

83
plantation companies (Nduwamungu, 2011a). This ownership pattern renders much of the
landscape of Rwanda to be covered predominantly by trees in small groups, rows or single
trees scattered on farms. Forest plantations are dominated by Eucalyptus species which
comprise 78% of all plantations, mostly managed as short rotation coppice (Nduwamungu,
2011a). Woodlots cover about 51% of plantation forests and are also dominated by
Eucalyptus spp. followed by Grevillea robusta and Pinus spp. (Nduwamungu et al., 2008;
Nduwamungu, 2011a). According to Nduwamungu et al. (2011a), preliminary results of
surveys carried out by FAO in 2010 to determine the extent of tree resources outside forests
(including woodlots below 0.5 ha) show that these resources cover about 6.6% of total
country land area.
Recent policy briefs in Rwanda recommend that the species should be uprooted from
wetlands and wherever they grow near water bodies, and their use prohibited in further
reforestation (Gahigana, 2006). Unfortunately, information on water use by Eucalyptus in
Africa is very scanty (Hailu et al., 2003) and particularly lacking in eastern Africa (Bayabil et
al., 2010). In Africa, water use by Eucalyptus has only been studied extensively in South
Africa, in the Congo, and to a lesser extent in Ethiopia, regions with a clearly different agro-
ecological environment from the East African highlands.
To quantify water use by Eucalyptus trees in the East African highlands we estimated the
transpiration of the species in the locally dominant management practice, i.e., small woodlots
scattered over the landscape by using a leaf area index (LAI) – diameter at breast height
(DBH) relationship. On the basis of the derived relationship, we quantified the water use by
short rotation Eucalyptus woodlots in representative catchments in southern Rwanda. A
monthly water balance of such woodlots was estimated and the overall water use by
Eucalyptus trees was compared with other key crops in the study area and to that of
Eucalyptus growing in other regions of the world.
Materials and methods
Study site
The water use by Eucalyptus woodlots was estimated in two catchments in southern Rwanda
by employing a LAI –DBH relationship. The woodlots in Busoro catchment were planted by
farmers for fuelwood production in the first place but also for soil protection against erosion.
Those in Butare catchment were planted by the local government primarily for protection
purposes. The catchments were chosen because of the availability of clear Google Earth
images, the general representativeness of land use, and the clear demarcation of the
boundaries of both catchments. One of the catchments borders the town of Butare, and is
referred to as the “Butare catchment”. It is located at 2.61º S, 29.72° E and covers an area of
472 ha. The other catchment is situated to the south near the village of Busoro, and is referred
to as the “Busoro catchment” (Fig. 5.1). This catchment covers an area of 618 ha and is
located at 2.67° S, 29.70° E.

84
The landscape of the study area is hilly with the villages mostly located on top of the ridges.
The predominant land use in both catchments is small-scale agriculture, with short rotation
Eucalyptus stands for firewood and timber production as well as prevention of soil erosion.
The woodlots were primarily planted by farmers. Based on the agro-ecological classification
of Delepierre (1982) and the elevational classification of Ndayambaje et al. (2012), the
catchments are located in the central plateau and hills zone of Rwanda. The climate is sub-
humid with moderately high rainfall of 1200 mm y-1
and mean annual temperature of 21oC.
The elevation is around 1700 m above sea level. The soils are derived from granitic rocks and
are classified as oxisols or ultisols (Delepierre, 1982).
Figure 5.1. The map of Rwanda showing Busoro catchment using ArcGIS. The
catchment is located in Huye (former Butare) district and is bordered by Shori cell of
Gishamvu sector on the west and Bukomeye cell of Mukura sector on the east.
This study was carried out in one year, 2007, and the LAI-DBH relationship was established
during the period May-August which is a transition between a wet and dry season, and the
woodlot sampling for LAI determination was done in October-November of the same year.
This sampling period is during a short rainy season. The difference in the months of field
work may not be important since DBH is not expected to change over such a short period.
This period starts at the end of the cropping season and at its beginning, most annual crops
were being harvested. Most major crops in the upland fields were perennial, including banana,
cassava and some sweet potato. In the relatively flat valleys rice was grown. Most households
had an avocado tree and a small Eucalyptus plot for domestic wood supply. E. saligna was the

85
predominant species, with a few small stands of E. tereticornis, E. maculata, E. maidenii, E.
microcorys, and E. citriodora. Some woodlots were comprised of mixed species of
Eucalyptus. Besides Eucalyptus, there were a few small stands of other species. Pinus patula
and Grevillea robusta were frequently found scattered on farms, Euphorbia tirucallii was
used to mark farm boundaries and Jacaranda mimosifolia and Ficus thonningii were grown in
home gardens. Eucalyptus woodlots were mostly coppice stands and were located on the
steepest parts of the landscape on infertile soils.
Estimation of the water use by Eucalyptus trees
We estimated the water use of Eucalyptus woodlots in the catchments by quantifying the most
important components of the water balance. The water balance can be determined by
calculating the amounts of water entering, stored and leaving a system. The inputs and outputs
of the water balance of the woodlots taken into account are based on Whitehead and Beadle
(2004):
P = ET + ΔS + D + R 1
where P is precipitation, ET is total evapotranspiration, ΔS is the change in total soil water
storage, D is drainage and R is surface run-off, all in mm d-1
.
Subsequently, ET was divided into tree transpiration (Et), evaporation of leaf interception (Ei),
and evaporation from understorey and the soil surface (Eu, Whitehead and Beadle, 2004).
Precipitation (mm d-1
) was derived from daily climate data from the weather stations of
Butare and Nyakibanda. These were used to quantify a monthly water balance, thereby
capturing the variations in the water balance throughout the year. Generally, Eu is estimated at
10% or less of Et (Whitehead and Beadle, 2004), which is the value we used. Eu is known to
be directly related to the LAI (Callister and Adams, 2006).
Et and Ei are considered the major components of evapotranspiration (Whitehead and Beadle,
2004). Ei can be estimated as a percentage of annual rainfall, and is normally affected by the
leaf area and the shape of the leaves of the vegetation, as well as by the rainfall distribution.
Interception losses in Eucalyptus woodlots are generally less than those from woodlots of
other tree species, which can be explained by the relatively small LAI of Eucalyptus trees
compared to other tree species (Calder, 1986). LAI for E. saligna, one of the most dominant
eucalypt species in the study area, was found in a different study in the same area to range
from 2.5-3.5 m2/m
-2 (Nsabimana et al., 2009). Eucalyptus interception losses were reported to
range from 4% in South Africa to 34% of the annual rainfall in Australia, India and Israel
(Hall et al. 1992; Calder, 1986). Most studies report Ei to range from 10-11% of annual
rainfall (Whitehead and Beadle, 2004). In South Africa interception losses were higher for
large trees than for small ones. As the woodlots in our study areas are mostly coppice stands
of several generations, dominated by very small coppice shoots of small DBH ranging from 2-
36 cm, a value on the lower side of the range for interception losses seemed most appropriate.
We therefore assumed interception losses to be 10% of annual rainfall.

86
Et was estimated for individual trees using the model of Radersma et al. (2006). The model
describes individual tree transpiration on the basis of an estimation of the leaf area. The model
assumes well-watered conditions, and therefore describes the potential tree transpiration (Etp,
Radersma et al., 2006; Whitehead and Beadle, 2004). Radersma et al. (2006) used sap-flow
measurements to quantify the relationship between leaf area and Etp for Eucalyptus trees in
sub-humid Kenya, an area with similar agro-ecological conditions to our study site in
Rwanda. The variance in measured transpiration accounted for by leaf area, was compared
with the variance accounted for by leaf area together with saturation deficit, radiation, and the
direct effect of soil water content. Leaf area was the most important determining factor for
transpiration across a large range of leaf. The equation that was established for Etp in relation
to leaf area is:
Etp = c × LA0.63
2
where Etp is in g d-1
, c is coefficient 1058 (g d
-1m
-2), and LA is leaf area (m
2). The explained
variance for this equation was 0.62. This equation does not take into account that during the
dry season Eucalyptus trees normally shed their leaves and thus the relationship between
DBH and leaf area changes across seasons (Roberts et al., 1992). During prolonged dry
periods, shedding of leaves is common in Eucalyptus (Ladiges, 1974) and this can result in
large seasonal changes in LAI, depending on the timing and magnitude of leaf production and
shedding (Whitehead and Beadle, 2004). As a result, transpiration of Eucalyptus during the
dry season could be overestimated. Although this equation was established specifically for E.
grandis, water-use per unit LA is known not to vary greatly among Eucalyptus species
(Radersma et al., 2006; Whitehead and Beadle, 2004). Therefore the same equation was
applied to all Eucalyptus species. E. saligna dominated in the study area and is
morphologically similar to E. grandis (Burren, 1995).
The leaf area of individual trees was derived from the leaf biomass, based on the relationship
between leaf biomass and DBH. Specific leaf area (SLA) or the ratio of leaf area to leaf mass
(m-2
kg-1
) or its inverse, leaf mass per area (LMA) are important Eco physiological parameters
widely used to derive canopy leaf area from leaf biomass (Diao et al., 2010). The relationship
between leaf dry matter and DBH was established for E. saligna by Mugunga et al., (in prep.)
as:
WL = α+βD2 3
where WL is leaf biomass (kg), α is intercept (0.881461 kg cm-2
), β is the coefficient (0.026311
kg cm-1
) and D is the DBH in cm. The explained variance of observed WL using this equation
was 0.88. After calculating the WL for each tree, LA was obtained by multiplying the leaf
biomass by the SLA (m2 kg
-1). To obtain the values of the SLA, a sample of 80 leaves was
taken for the test species. Each leaf was measured for projected leaf area and fresh weight,
and the corresponding dry weight was calculated by multiplying with a dry weight:green
weight conversion factor of 0.3 derived from the study by Mugunga et al. (in prep.). The steps
taken to estimate the Etp of individual trees are shown in Figure 5.2.

87
Tree leaf
area (LA)
Measurement 1:
- DBH
SLA Measurement 2:
- Leaf weight
- Leaf area
WL
Eqn. 3 Eqn. 2
Result 1: Etp per
tree (g/d)
Figure 5.2. Determining the leaf area and estimating the potential transpiration (Etp)
for individual trees. DBH is tree diameter at breast height, WL leaf biomass and SLA is
specific leaf area.
After determining the Etp for the individual trees, the results were aggregated to establish the
Etp of Eucalyptus woodlots across the two catchments. Google Earth images of the catchments
showed a very patchy landscape, with small fields of grain crops interspersed with banana
fields and Eucalyptus woodlots. Some of the Eucalyptus woodlots were dense, although bare
soil around the trees was visible in most of them. Busoro catchment was divided into two
parts: the northern and the southern sub-catchments. Sampling was done by taking one or more 0.02
ha (8 m radius) plots per woodlot depending on woodlot size (Fig. 5.3), while some small
woodlots with widths smaller than 16 m were sampled entirely.
Figure 5.3. Sampling strategy: The grey areas represent a number of woodlots in a catchment.
In this example, 4 plots were measured. The first plot was taken in woodlot A. The calculated
total tree potential transpiration (Etp) for this plot was extrapolated to the entire area of A. In
woodlot B two plots were taken, as this was a larger woodlot with more variation. The
average Etp of the two plots was used to compute the total Etp of B. Woodlot C and D are very
similar. Only one plot was taken and Etp extrapolated to represent both areas.
1 4
3
A
B
C
D
2
Legend
Plot
Woodlot
2

88
Google Earth image
- identify woodlots
- determine surface-
area woodlots
Estimate of
total Etp for
each woodlot
Result 2:
Total estimated Etp
of all woodlots in
the catchment
Result 1:
Etp of individual trees
in a plot
Link woodlots to
plots
Total Etp by
Eucalyptus/plot
In each plot, all tree species were identified and measured for DBH. A total of 59 samples
were taken in the Busoro catchment, representing 15 woodlot areas in the southern sub-
catchment and 36 woodlot areas in the northern sub-catchment. Seven samples representing 7
woodlot areas were taken from the Butare catchment (Fig. 5.4), giving a total of 66 plots
representing 58 woodlot areas.
Figure 5.4. Butare catchment. In this catchment 7 plots were measured
The Etp of each individual tree was calculated using the equation of Radersma et al. (2006).
Subsequently the sum of the Etp of all individual trees was divided by the plot area to
determine the Etp per m2 for each plot. Areas of the woodlots were determined using the
Google Earth images. The total Etp of Eucalyptus woodlots at catchment level was calculated
by aggregating the Etp of all the individual woodlots and converting them to mm d-1
(Fig. 5.5).
Catchment water balance was developed for the Busoro catchment by considering P as the
sole input and the Etp, Ei and Eu the outputs.
Figure 5.5. Procedure for determining potential tree transpiration (Etp) on catchment level.
For data analysis, linear regression was used to explore the correlation between tree DBH and
total tree water use. Mean DBH of each plot was plotted against the total water use of each
plot to determine if the total water use per unit area was affected by the size of the trees. It is
well known that LAI during the mid- to late-dry seasons is usually 40-50% smaller than the
LAI during the wet- and early-dry seasons in Eucalyptus forests (Nouvellon et al., 2010).
89
Reductions in the LAI were reported to be up to 50% even in moist tropical forests in Congo-
Guinean forest (de Wasseige et al., 2003), in Mexico (Mass et al., 1995) and in Thailand
(Tanaka et al., 2003), while leaf shedding during a severe drought in Australia ranged from
50-97% (Pook et al., 1985).
or this reason, we wanted to adjust the Etp following LAI reductions in the driest months.
Unfortunately, the exact LAI variation in our study area is unknown and we did not find
reports on LAI variations for the East-African region. To capture seasonal variations in LAI
and the resulting changes in Etp, a sensitivity analysis was done by assuming reductions in the
amounts of LAI in the driest months of June, July, August and September. To calculate the
reductions in Etp, equation 2 above was applied with an assumption that dry season reductions
in LA corresponded to reductions in LAI since the trees covered the same area. We used LA
reductions of 15, 30 and 50% and calculated the related reductions in Etp here-in-after referred
to as adjusted Etp (Adj.Etp). The new (adjusted) Etp values were computed as:
Adj.Etp = ((c*LA)0.63
*((1-r) 0.63
)) = Etp.orig*((1-r)0.63
) 4
where c is a constant described in equation 2, r is % reduction in LA expressed as a fraction
(50% reduction is entered in the equation as 0.5) and Etp.orig = the original Etp (mm month-1
).
The available water was estimated by assuming that the water accumulated in the root zone
during the wetter months was available for evaporation in the drier months. The soil water
storage (∆S) and physiological regulation on water loss by closing stomata were assumed to
further reduce the water deficit during dry months, thereby contributing to the closing of the
catchment water balance. Annual difference between potential ET and P were attributed to
runoff and drainage.
Results
Results on the occurrence of tree species, number of stems ha-1
, tree DBH and leaf area are
summarized in Tables 5.1, 5.2 and 5.3 for southern Busoro sub-catchment, Butare catchment
and the northern Busoro sub-catchment respectively. Woodlots in the study area were
dominated by Eucalyptus species and about 43 and 35% of all the standing stems per hectare
(N) identified were E. tereticornis and E. saligna respectively. The number of stems ha-1
ranged from 50 to 11,500, DBH from 2-36 cm and leaf area from 8-211 m2. The SLA’s for E.
saligna and E. tereticornis were 12.2 and 16 (m2 kg
-1) respectively. The total forested area, Etp
and relative cover by eucalypt woodlots for Butare catchment, and northern and southern
Busoro sub-catchments are presented in Tables 5.4, 5,5 and 5.6 respectively.
In northern Busoro, the sampled woodlots were relatively small with areas ranging from 130
m2 to 8,000 m
2, and four larger woodlots with areas of 14,300 - 41,700 m
2 (Table 5.4). There
was a wide range in Etp, with 4.58 mm d-1
for Plot 38 and only 0.41 mm d-1
for Plot 17. This
can be explained by the size and number of trees in the respective plots. Plot 17 was a thinly
spread coppice stand with a mean DBH of 4-6 cm while Plot 38 represented an area with full
grown trees with a mean DBH of 10-36 cm. In the southern Busoro sub-catchment the

90
samples represented areas ranging from 3,000-62,000 m2, and one area of 154,000 m
2 (Table
5.5).
Table 5.1. No. of sample plots/woodlot, tree species, number of stems, tree DBH and
leaf area of woodlot trees in Busoro southern sub-catchment , southern Rwanda
Woodlot Plot no. Species
No. of stems Tree DBH (cm) Tree leaf area
(m2)
(plot-1
) (ha-1
) Min. Max Av. ±
Std Min Max Av. ± Std
*SB-1 35+37 Eucalyptus saligna 47 1,150 1 8 4 ± 2 6 49 18 ± 10
E. teriticornis 68 1,700 1 8 3 ± 2 5 34 11 ± 7
E. microcorys 18 450 2 5 3 ± 1 7 24 13 ± 5
Other 1 <50 20 20 20 176 176 176
SB-2 47 E. saligna 34 1,700 3 20 12 ± 4 4 12 96 ± 43
E. microcorys 1 50 11 11 11 72 72 72
SB-3 48 E. saligna 56 2,800 1 26 9 ± 6 6 306 71 ± 65
E.tereticornis 6 300 2 15 10 ± 5 7 99 56 ± 36
SB-4 49 E. saligna 19 950 1 20 5 ± 6 6 212 38 ± 56
E. tereticornis 2 100 4 5 5 ± 1 16 21 18 ± 3
E. microcorys 100 4,950 1 23 6 ± 5 6 213 39 ± 43
Other 1 50 14 14 14 103 103 103
SB-5 50 E. tereticornis 106 5,250 1 13 4 ± 3 5 77 18 ± 15
E. microcorys 5 250 6 9 8 ± 1 27 51 46 ± 10
E. saligna 5 250 2 9 4 ± 3 8 54 20 ± 19
E. tereticornis 13 650 1 4 2 ± 1 5 16 8 ± 4
SB-6 51 E. microcorys 74 3,700 1 20 6 ± 4 6 174 33 ± 35
SB-7 52 Other 1 50 14 14 14 100 100 100
SB-8 53 E. saligna 23 1,150 1 16 8 ± 5 6 146 58 ± 43
E. tereticornis 45 2,250 2 17 6 ± 4 6 119 29 ± 24
SB-9 54 E. saligna 20 1,000 2 19 10 ± 5 11 192 76 ± 54
E. Microcorys 71 3,550 1 20 8 ± 5 6 178 52 ± 47
SB-10 55 E. saligna 5 250 6 17 11 ± 4 30 161 87 ± 47
E. tereticornis 83 4,150 1 13 5 ± 3 5 80 21 ± 17
SB-11 56 E. saligna 68 3,400 2 24 7 ± 6 8 275 54 ± 65
SB-12 57 E. microcorys 15 750 5 19 11 ± 4 19 156 73 ± 37
E. tereticornis 221 11,000 1 8 2 ± 1 5 34 9 ± 4
E. saligna 84 4,200 1 21 8 ± 5 6 229 62 ± 54
E. microcorys 6 300 2 13 8 ± 4 7 84 45 ± 31
Other 11 550 1 27 8 ± 9 6 287 64 ± 95
SB-13 58 E. saligna 141 7,000 2 8 3 ± 1 10 45 16 ± 8
SB-14 59 E. tereticornis 90 4,500 2 6 3 ± 2 6 26 12 ± 7
SB-15 58-59 E. saligna 141 3,500 2 8 3 ± 1 10 45 16 ± 8
E. tereticornis 90 2,250 2 6 3 ± 2 6 26 12 ± 7
*Southern Busoro sub-catchment

91
Table 5.2. No. of sample plots/woodlot, tree species, number of trees, tree DBH and leaf
area of woodlot trees in Butare catchment, southern Rwanda
Woodlot Plot no. Species
No. of stems Tree DBH (cm) Tree leaf area
(m2)
(plot-1
) (ha-1
) Min. Max Av. ±
Std Min Max Av. ± Std
*Bt-1 1 Eucalyptus saligna 145 7,200 1 9 2±1 5 47 8±5
Bt-2 2 E. saligna 14 700 1 5 2±1 8 28 12±5
E. tereticornis 110 5,450 1 7 3±1 5 27 10±4
E. microcorys 10 500 2 6 4±1 1 3 1±1
Other 1 50 1 2 1±0 1 1 1±0
Bt-3 3 E. saligna 22 1,100 1 14 3±3 6 119 16±23
E. tereticornis 33 1,650 1 8 3±2 5 37 10±7
E. microcorys 1 50 11 11 11±0 7 7 7±0
Bt-4 4 E. saligna 20 1,000 3 28 8±8 12 353 66±95
E. tereticornis 3 150 3 10 10±4 9 50 27±21
E. maculata 37 1,850 2 23 8±7 1 23 5±6
Other 3 150 3 18 9±8 1 15 6±7
Bt-5 5 E. saligna 19 950 1 4 2±1 6 16 10±3
E. tereticornis 6 300 1 1 1±1 5 5 5±0
E. citriodora 80 4,000 1 4 3±5 6 308 18±54
Bt-6 6 E. saligna 4 200 2 3 2±0 9 13 11±2
E. tereticornis 17 850 1 5 2±1 5 19 8±4
E. microcorys 5 250 2 7 5±3 7 33 22±14
E. citriodora 61 3,050 1 14 5±4 1 101 25±25
E. maidenii 18 900 1 14 4±3 6 97 18±21
Other 4 200 1 2 1±0 6 8 7±1
Bt-7 7 E. saligna 10 500 2 6 4±2 10 34 21±9
E. tereticornis 62 3,100 1 25 7±7 5 215 45±5.3
*Butare catchment
The highest Etp was found in Plot 57, with a value of 6.44 mm d-1
. This plot was located in a
very dense E. saligna and E. microcorys stand, with an average DBH of 8 cm. E. microcorys
stands were in general more leafy, denser and darker than woodlots with other species. This
value may be over-estimated since the water use: leaf area relation of Radersma et al. (2006)
is based on the assumption that there is little or no light competition between trees. Linear
regression of tree DBH and total tree water use showed no correlation between these two
variables, indicating that an increase in mean DBH was compensated for by a decrease in the
number of trees per plot (data not shown). For Butare catchment (Table 5.6) the areas covered
by a plot range from 50,000-172,000 m2. There was less variation than in the Butare
catchment because the plots here represented large areas. Actually the woodlots in this
catchment belong to the local government and not to the smallholder farmers.

92
Table 5.3. Number of sample plots/woodlot, tree species, number of stems, tree DBH
and leaf area of woodlot trees in Busoro northern sub-catchment (NB), southern
Rwanda
Wood-
lot No Plot no Species
No. of stems Tree DBH (cm) Tree leaf area
(m2)
(plot-1
) (ha-1
) Min Max Av ± Std Min Max Av ± Std
*NB-1 1 E. saligna 83 450 5 36 17 ± 6 22 520 166 ± 99
NB-2 2 E. tereticornis 280 800 2 28 12 ± 6 8 267 80 ± 56
NB-3 3 E. saligna 8 250 2 6 3 ± 2 10 36 17 ± 9
E. tereticornis 24 800 2 10 5 ± 2 7 52 19 ± 10
E. maidenii 10 350 2 11 6 ± 4 8 69 32 ± 24
NB-4 4 E. tereticornis 17 850 2 13 6 ± 3 7 74 28 ± 20
NB-5 5 E. saligna 62 3,100 2 10 5 ± 2 10 69 26 ± 12
E. microcorys 7 350 5 6 5 ± 1 19 28 22 ± 3
NB-6 6 E. saligna 29 1,450 2 17 6 ± 3 8 164 33 ± 30
E. tereticornis 10 500 4 12 7 ± 2 15 66 32 ± 15
NB-7 7 E. tereticornis 28 1,400 3 5 3 ± 1 9 19 12 ± 2
NB-8 8 E. saligna 26 150 8 8 8 ± 0 49 49 49 ± 0
E. microcorys 3 <50 5 5 5 ± 0 22 22 22 ± 0
Other 27 200 4 30 18 ± 7 16 346 157 ± 81
NB-9 9 E. saligna 13 650 2 9 5 ± 2 10 57 26 ± 15
E. microcorys 1 50 3 3 3 12 12 12
Other 7 350 12 23 18 ± 4 75 226 155 ± 51
NB-10 10 Other 14 700 8 25 19 ± 5 42 248 165 ± 63
NB-11 11 E. saligna 33 1,000 2 10 5 ± 2 9 73 25 ± 15
NB-12 12 E. tereticornis 38 1,150 3 12 6 ± 3 9 65 28 ± 17
NB-13 13-14 E. saligna 39 950 2 11 5 ± 2 10 80 26 ± 17
E. tereticornis 55 1,350 2 8 4 ± 2 6 36 12 ± 7
E. citriodora 5 100 2 9 6 ± 3 8 46 30 ± 20
E. maidenii 1 <50 7 7 7 35 35 35
Other 13 300 2 7 3 ± 2 8 36 15 ± 8
NB-14 15 E. tereticornis 49 1,000 2 8 4 ± 2 6 38 14 ± 8
NB-15 16 E. tereticornis 210 3,500 2 19 5 ± 4 6 142 24 ± 27
NB-16 17 E. tereticornis 31 600 3 6 4 ± 1 9 24 13 ± 4
E. maidenii 4 100 6 6 6 ± 0 25 25 25 ± 0
Other 1 <50 9 9 9 54 54 54
NB-17 18 E. tereticornis 37 2,850 2 6 2 ± 1 6 24 9 ± 3
NB-18 19-20 E. teriticornis 134 3,350 1 8 2 ± 1 5 37 10 ± 5
E. maidenii 2 50 3 10 6 ± 5 12 56 34 ± 31
NB-19 21-22 E. saligna 3 50 8 12 10 ± 2 52 88 66 ± 19
E. teriticornis 35 850 1 11 7 ± 3 5 64 33 ± 17
Other 2 50 3 4 4 ± 0 14 15 14 ± 1
NB-20 23-24 E. saligna 75 1,850 2 15 7 ± 3 8 125 41 ± 26
NB-21 25 E. teriticornis 59 2,950 2 5 2 ± 1 6 18 9 ± 3
NB-22 26-27 E. teriticornis 29 700 2 28 2 ± 1 7 310 161 ± 69

93
E.
camaldulencis 35 850 4 36 17 ± 7 15 454 147 ± 90
NB-23 28-29 E. saligna 64 1,600 2 13 5 ± 3 8 101 27 ± 21
E. teriticornis 33 800 2 11 5 ± 3 6 60 20 ± 16
NB-24 30 E. saligna 11 550 2 4 2 ± 1 10 20 12 ± 3
E. teriticornis 65 3,250 1 5 2 ± 1 5 20 8 ± 3
E. microcorys 2 100 2 2 2 ± 1 7 10 8 ± 2
NB-25 31-36 E. saligna 103 850 1 10 4 ± 2 6 69 19 ± 14
E. teriticornis 281 2,350 1 19 3 ± 2 5 142 15 ± 16
E. microcorys 2 <50 2 2 2 ± 1 7 10 8 ± 2
Other 9 50 5 14 8 ± 4 22 100 46 ± 37
NB-26 35+37 E. saligna 47 1,150 1 8 4 ± 2 6 49 18 ± 10
E. teriticornis 68 1,700 1 8 3 ± 2 5 34 11 ± 7
E. microcorys 18 450 2 5 3 ± 1 7 24 13 ± 5
Other 1 <50 20 20 20 176 176 176
NB-27 38 E. saligna 31 1,550 1 17 7 ± 4 6 158 46 ± 36
E. teriticornis 63 3,150 1 12 5 ± 3 5 64 21 ± 14
E. maidenii 2 100 7 17 12 ± 7 32 130 81 ± 69
Other 25 1,250 1 4 2 ± 1 6 19 10 ± 4
NB-28 39 E. teriticornis 75 3,750 2 9 4 ± 3 6 41 20 ± 15
NB-29 40 E. teriticornis 79 3,950 1 7 3 ± 1 5 27 10 ± 5
Other 10 500 3 15 8 ± 3 12 107 50 ± 28
NB-30 41 E. saligna 101 5,000 1 7 3 ± 1 6 36 14 ± 7
E. teriticornis 48 2,400 1 10 3 ± 2 5 48 13 ± 8
Other 3 150 2 3 3 ± 1 10 13 11 ± 2
NB-31 42 E. saligna 3 150 1 2 2 ± 1 6 11 9 ± 2
E. teriticornis 89 4,450 1 6 2 ± 1 5 24 8 ± 4
NB-32 43 E. teriticornis 153 7,600 1 5 2 ± 1 5 20 8 ± 3
NB-33 42-43 E. saligna 3 50 1 2 2 ± 1 6 11 9 ± 2
E. teriticornis 242 6,000 1 6 2 ± 1 5 24 8 ± 3
NB-34 44 E. teriticornis 169 8,400 1 6 2 ± 1 5 22 9 ± 4
NB-35 45 E. saligna 63 3,150 1 16 3 ± 2 6 136 18 ± 19
E. teriticornis 26 1,300 1 7 3 ± 2 5 33 13 ± 8
E. maidenii 3 150 5 7 6 ± 1 24 34 29 ± 5
Other 7 350 2 15 6 ± 4 9 106 35 ± 33
NB-36 46 Other 90 300 20 25 22 ± 2 176 253 211 ± 38
*Northern Busoro sub-catchment
Interestingly the total Etp of the Butare catchment was similar to that of the Busoro catchment,
that likely management differences between the different types of owners in the two study
areas did not have a major impact on the total water use. The Etp here ranges from 1.34-3.44
mm d-1
. The percentage of the area covered by trees in the three sub-catchments ranged from
10.9-17.4% of the total catchment. Table 5.7 gives a summary of the weighted average
estimates of Etp for Eucalyptus woodlots in the whole study area.

94
Table 5.4. No. of sample plots/woodlot, woodlot area, estimates of potential tree
transpiration (Etp) and extent of cover by Eucalyptus woodlots in northern Busoro sub-
catchment
Woodlot
No
Plot
No
Woodlot Area Potential tree transpiration (Etp) Cover
(m2) (g d
-1) (g d
-1m
2) (mm d
-1) (%)
*NB-1 1 1,800 2.11E+06 1173 1.17 100
NB-2 2 3,400 4.39E+06 1291 1.29 100
NB-3 3 540 5.32E+05 984 0.98 100
NB-4 4 2,100 1.45E+06 692 0.69 98
NB-5 5 530 1.46E+06 2761 2.76 100
NB-6 6 710 1.24E+06 1745 1.74 98
NB-7 7 440 3.10E+05 704 0.7 100
NB-8 8 1,500 1.01E+06 671 0.67 34
NB-9 9 1,600 2.26E+06 1411 1.41 38
NB-10 10 760 1.37E+06 1801 1.8 0
NB-11 11 330 2.55E+05 774 0.77 100
NB-12 12 3,680 3.49E+06 949 0.95 100
NB-13 13-40 2,700 4.69E+06 1738 1.74 92
NB-14 15 500 2.65E+05 530 0.53 100
NB-15 16 600 1.46E+06 2437 2.44 100
NB-16 17 500 2.07E+05 415 0.41 94
NB-17 18 130 1.52E+05 1166 1.17 100
NB-18 19-20 4,000 5.95E+06 1488 1.49 100
NB-19 21-22 670 6.38E+05 953 0.95 100
NB-20 23-24 2,000 3.86E+06 1932 1.93 100
NB-21 25 1,800 2.15E+06 1195 1.19 100
NB-22 26-27 14,300 5.54E+07 3874 3.87 100
NB-23 28-29 3,700 6.66E+06 1799 1.8 100
NB-24 30 7,800 1.23E+07 1580 1.58 100
NB-25 31-36 31,400 5.51E+07 1754 1.75 97
NB-26 35+37 20,000 3.69E+07 1847 1.85 97
NB-27 38 6,800 3.11E+07 4575 4.58 88
NB-28 39 4,100 9.84E+06 2399 2.4 100
NB-29 40 5,600 1.28E+07 2279 2.28 74
NB-30 41 4,200 1.65E+07 3939 3.94 98
NB-31 42 1,800 3.17E+06 1760 1.76 100
NB-32 43 900 2.69E+06 2989 2.99 100
NB-33 42-43 41,700 9.90E+07 2375 2.37 100
NB-34 44 7,400 2.56E+07 3464 3.46 100
NB-35 45 8,000 2.45E+07 3064 3.06 89
NB-36 46 6,000 5.52E+06 920 0.92 0
Total
193,990 4.36E+08 2,250 2.25 95
Total area catchment (m2) 1,7850,000
% coverage by trees 10.9
*Northern Busoro sub-catchment

95
Table 5.5. Woodlot area, estimates of potential tree transpiration (Etp) and extent of
cover by Eucalyptus woodlots in southern Busoro sub-catchment
Plot
No.
Woodlot
area (m2)
Tree potential transpiration (Etp) Cover (%)
(g d-1
) (g d-1
m2) (mm d
-1)
35+37 28,500 5.26E+07 1847 1.85 100
47 19,000 6.02E+07 3168 3.17 100
48 3,700 1.59E+07 4284 4.28 100
49 38,000 2.16E+08 5682 5.68 98
50 154,000 5.44E+08 3534 3.53 100
51 30,000 1.10E+08 3676 3.68 97
52 74,000 2.44E+08 3299 3.3 100
53 3,000 1.71E+07 5684 5.68 100
54 82,900 2.63E+08 3177 3.18 100
55 51,000 2.56E+08 5015 5.02 100
56 62,000 2.80E+08 4509 4.51 100
57 3,000 1.93E+07 6439 6.44 90
58 3,500 1.43E+07 4100 4.1 100
59 6,500 1.45E+07 2224 2.22 100
58+59 22,000 6.96E+07 3162 3.16 100
Total 581,100 2.18E+09 3746 3.75 100
Total area catchment (m2) 4,392,000
% coverage by trees 13.2
Table 5.6. Woodlot area, estimates of potential tree transpiration (Etp) and extent of
cover by Eucalyptus woodlots in Butare catchment, southern Rwanda
Plot no. Woodlot area (m2) Potential tree transpiration (Etp) Cover (%)
(g d-1
) (g d-1
m-2
) (mm d-1
)
1 101,000 280,116,110 2,773 2.77 100
2 120,000 349,608,055 2,913 2.91 100
3 50,000 66,989,693 1,340 1.34 100
4 131,000 247,621,809 1,890 1.89 98
5 155,000 394,592,172 2,546 2.55 100
6 172,000 591,586,594 3,439 3.44 98
7 90,000 298,106,349 3,312 3.31 100
Total 819,000 2,228,620,782 2,721 2.72 99
Total catchment area: 4,717,000 (m2)
% coverage by trees: 17.4%
Precipitation of the study site recorded at Butare and Nyakibanda meteorological (southern
Rwanda) stations from 1971-1992 gave a monthly averages ranging from 8 mm in July to 219
mm in April (Figure 5.6). There was no rainfall data recorded beyond 1992 to date following
the 1994 genocide. Rainfall is bi-modal with a long dry period in June-September and a short
one in February, with December and January also being relatively dry. The rainfall observed

96
here is similar to that recorded previously for the central plateau agro-ecological zone
(Delepierre, 1982). Applying the unadjusted models of Whitehead and Beadle (2004) and
Lane et al. (2004), the annual difference between P and Etp was estimated to be -84.0 mm y-1
.
Figure 5.6: Monthly mean precipitation of Butare area, southern Rwanda based on
precipitation rates collected in Butare in 1971-1993.
Table 5.7. Weighted average estimates of potential tree transpiration (Etp) for
Eucalyptus woodlots in Busoro and Butare catchments in southern Rwanda
Catchment Catchment
area
Total
area
under
trees
% area
covered
by trees
Tree transpiration Eucalypt
cover
/woodlot
(m2) (m
2) (%) (g d
-1) (g d
-1
m2)
(Mm d-1
) (%)
Busoro
Northern sub-catchment 1,785,000 193,000 10.8 4.36E+08 2,250 2.25 95
Southern sub-catchment 4,392,000 603,200 13.7 2.18E+09 3,612 3.61 100
Total 6,177,000 796,200 12.9 2.61E+09 3,371 3.37 99
Butare
4,717,000
819,000
17.4
2.26E+09
2,721
2.72
99
Weighted average 14.6 3,037 3.04 99
This was obtained as follows: Rainfall = 1245 mm; average tree water consumption (Etp) = 3
mm d-1
× 365 days y-1
= 1095 mm; Ei (10% of P) = 124.5 mm; Eu (10% of Etp) = 109.5 mm.
Subtracting the amount of water that potentially left the system from water that entered the
system gave: P - Etp - Ei - Eu = 1245-1095-124.5-109.5 = -84.0 (mm/y) (-7.0 mm/month or -2
mm d-1
). Since water outflow cannot exceed water inflow, this indicates that annual actual Et
did not equal annual Etp, likely due to drought stress in the drier months. Rainfall in the region
may seem not to be enough to support a year-round actual tree transpiration of 3 mm d-1
.
Estimated Etp was much larger than P in the months of June, July, August and September and
0
50
100
150
200
250
Jan Feb Mar Apr May Jun Jul Aug Sep Oct Nov Dec
Pre
cipit
atio
n (
mm
)

97
to a lesser extent in January (Table 5.8). To obtain a more accurate estimation of the actual Et,
both Etp and Eu were adjusted according to the assumed 15, 30 and 50% reductions in the LAI
during June-September. A reduction in LAI of 15% cut the yearly water balance by half from
-84.0 to -39.3. Decreasing LAI further resulted to a neutral to positive yearly water surpluses
of 2 and 62.8 mm y-1
for LAI reductions of 30 and 50% respectively (Table 5.9).
Transpiration deficits during the drier months were assumed to be buffered by both the soil
storage accumulated in wet months and stomatal closure as trees’ physiological response to
water deficits. Even in drier years, the differences in soil water storage are not likely to affect
the water balance on an annual basis (Everson, 2001).
Table 5.8. Etp in a monthly water balance (WB) estimated for Eucalyptus woodlots in
Busoro catchment, Butare, southern Rwanda based on Whitehead and Beadle (2004).
P = precipitation, Etp = potential tree transpiration, Ei = interception losses, Eu =
evaporation from the undergrowth and soil surface
Month *P (mm) Etp (mm) Ei (mm) Eu (mm) D+R (mm)
January 112 93.0 11.2 9.3 -1.5
February 106 84.0 10.6 8.4 3.0
March 132 93.0 13.2 9.3 16.5
April 219 90.0 21.9 9.0 98.1
May 126 93.0 12.6 9.3 11.1
June 32 90.0 3.2 9.0 -70.2
July 8 93.0 0.8 9.3 -95.1
August 36 93.0 3.6 9.3 -69.9
September 84 90.0 8.4 9.0 -23.4
October 123 93.0 12.3 9.3 8.4
November 149 90.0 14.9 9.0 35.1
December 118 93.0 11.8 9.3 3.9
Total 1,245.0 1,095.0 124.5 109.5 -84.0
*P = ET + ΔS + D + R , where P is precipitation, ET is total evapotranspiration, ΔS is the
change in total soil water storage, D is drainage and R is surface run-off, all in mm d-1
Discussion
Eucalyptus woodlots in the study area mainly comprised of coppice stands of varying
rotations of small young shoots with small DBH. Coppice shoot sizes are known to decline
with the number of harvesting cycles in short rotation Eucalyptus plantations. Stand above
ground biomass was observed to decrease as the number of cutting cycles increased (Zewdie,
2008). Specific leaf area (SLA) obtained for E. saligna in this study (16 m2 kg
-1) is only
slightly higher than that obtained for E. grandis in Nyabeda, western Kenya (Radersma et al.,
2006). This is not surprising since the two species are known to be morphologically similar
(Burren, 1995).
The estimated water use of Eucalyptus during the rainy season was generally less than that of
key crops in the study area (Table 5.9). The average potential evapotranspiration (ETc) of
Eucalyptus was reported to be 3.6 mm d-1
(1,329 mm y-1
) (Gislain, 2008). In comparison, the

98
reference ET, ETo1 is between 4 and 5 mm d
-1 (i.e. 1,460 and 1,825 mm y
-1) (Table 5.10).
Crops such as banana, cassava, beans and maize generally have a potential evapotranspiration
(ETc) slightly greater than 5 mm d-1
in the mid-season (Gislain, 2008). There are few studies
of Eucalyptus water use in Africa (Hailu et al., 2003). The water use observed in this study (3
mm d-1
) is on the lower side of the range observed for Eucalyptus and for forests of other tree
species.
Table 5.9. The adjusted potential tree transpiration through LA reductions of 15, 30
and 50% in dry seasons in a monthly water balance in Butare, southern Rwanda. P =
precipitation, Adj Etp = adjusted potential tree transpiration, Ei = interception losses,
Adj.Eu = adjusted evaporation from under storey and soil surface, and R and D which
add up to give water surplus. Month *P (mm) Adj.Etp (mm) Ei (mm) Adj.Eu (mm) Surplus (R+D)
LA85% LA70% LA50% LA85% LA70% LA50% LA85% LA70% LA50%
January 112.0 91.6 11.2 9.2 0.0
February 106.0 84.0 84.0 84.0 10.6 8.4 8.4 8.4 3.0 3.0 3.0
March 132.0 93.0 93.0 93.0 13.2 9.3 9.3 9.3 16.5 16.5 16.5
April 219.0 90.0 90.0 90.0 21.9 9.0 9.0 9.0 98.1 98.1 98.1
May 126.0 93.0 93.0 93.0 12.6 9.3 9.3 9.3 11.1 11.1 11.1
June 32.0 81.2 71.9 58.2 3.2 8.1 7.2 5.8 -60.6 -50.3 -35.2
July 8.0 82.1 72.7 58.8 0.8 8.2 7.3 5.9 -83.2 -72.8 -57.5
August 36.0 82.1 72.7 58.8 3.6 8.2 7.3 5.9 -58.0 -47.6 -32.3
September 84.0 81.2 71.9 58.2 8.4 8.1 7.2 5.8 -13.8 -3.5 11.6
October 123.0 93.0 93.0 93.0 12.3 9.3 9.3 9.3 8.4 8.4 8.4
November 149.0 90.0 90.0 90.0 14.9 9.0 9.0 9.0 35.1 35.1 35.1
December 118.0 93.0 93.0 93.0 11.8 9.3 9.3 9.3 3.9 3.9 3.9
Total 1245.0 1054.4 925.1 869.9 124.5 105.4 92.3 87.0 -39.3 2.0 62.8
*P = ET + ΔS + D + R , where P is precipitation, ET is total evapotranspiration, ΔS is the change in total soil
water storage, D is drainage and R is surface run-off, all in mm d-1
Water use ranged from 0.4 to 9.9 mm d-1
in Africa (Fritzsche et al., 2006; Radersma et al.,
2006) and from 0.4 to 49.0 mm d-1
around the world (Morris et al., 2004). The small rate
observed in the study area is attributed to the small tree size and LAI of the frequently
coppiced Eucalyptus. Tree water use is strongly related to heartwood area which in turn is
directly dependent on tree DBH (Vertessy et al., 1995). E. saligna was observed to have a
smaller LAI than other Eucalyptus and other tree species in Rwanda (Nsabimana et al., 2009).
Eucalyptus woodlots generally have smaller LAI than other tree species (Nsabimana et al.,
1 ET0 is the reference evapotranspiration widely used in the field of irrigation as a reference
surface for potential crop evapotranspiration. “The reference surface is a hypothetical grass
reference crop with an assumed crop height of 0.12 m, a fixed surface resistance of 70 s m-1
and an albedo of 0.23. The reference surface closely resembles an extensive surface of green,
well-watered grass of a uniform height, actively growing and completely shading the ground.
The fixed surface resistance of 70 s m-1
implies a moderately dry soil surface resulting from
about a weekly irrigation frequency.” ET0 can be computed from meteorological data or
estimated from pan evaporation. (FAO guideline, Allen et al., 1998)

99
2009; Calder, 1986) which may explain their lower water use rates. The observed rates in this
study are within the range of values given by Rutter (1968) who report a relatively good
agreement in studies that compared extrapolated results of stand transpiration with those
obtained by the Bowen ratio (Dunin and Greenwood, 1986) and eddy correlation methods
(Berbigier et al., 1996).
Table 5.10. Comparison of the potential evapotranspiration of Eucalyptus with ET0
and the potential evapotranspiration (ETc) of key crops in Rwanda. The ETc of the
reference crops for the first and second year of growth are derived from a research
conducted by the former Institut des Sciences Agronomiques du Rwanda, now
Rwanda Agriculture Board (RAB) (Gislain, 2008)
1ET0 Banana Cassava Maize Beans Eucalyptus
(mm) ETc (mm) ETc (mm) ETc (mm) ETc (mm) ETc (mm)
Month yr1 yr2 yr 1 yr 2 yr 1 yr 2 yr 1 yr 2 Pot.
January 149 78 155 124 171 0 0 47 0 114
February 148 84 140 112 154 56 0 0 0 103
March 155 130 171 109 140 124 0 0 0 116
April 141 150 165 60 66 135 0 0 0 121
May 130 155 171 0 47 149 53 0 0 115
June 123 150 165 0 45 105 105 0 60 102
July 130 155 171 0 47 0 140 0 155 103
August 143 155 171 0 47 0 155 0 155 106
September 147 150 165 0 45 0 60 0 0 107
October 161 78 155 47 109 0 0 62 0 115
November 141 75 150 90 165 0 0 171 0 114
December 140 78 155 124 171 0 0 155 0 114
Total 1,708 1,437 1,932 665 1,204 569 512 435 370 1,329
In addition to the observed low water use rates, Eucalyptus species are efficient users of
water. Eucalyptus water use range from 0.3 to 0.8 g of water g-1
of dry matter produced; water
use efficiency by other trees is up to about 0.9 g while that of some crops is 1.1 to 3.6 fold
higher (Davidson, 1993). Biophysical water use efficiency however may need to be supported
by an economic water use efficiency, which considers the financial returns of an investment
rather than relying on biomass produced, since not all biomass may be converted to monetary
terms. Water use efficiency is broadly defined by Hood (2002) as maximising returns and
minimising environmental impacts of every mega litre (ML) of water used by plants. This is
seen as an important concept for informing different aspects of land and water resource
management including reducing overall water use and producing high and/or better quality
yields (Wise et al., 2001). Hood (2002) developed an economic water use efficiency applied
on irrigated crops by measuring the net economic return per ML of water, estimated by
subtracting the costs of all non-water inputs from the total per hectare returns to production
and dividing by the average annual quantity of water evapotranspired per hectare. This
concept was successfully applied by Wise et al. (2011) in comparing water use by indigenous
and introduced forests.
100
Transpiration is strongly dependent on LAI (Benyon and Nambiar, 2006) which declines
during the dry seasons (Shi et al., 2012; Morris et al., 2004) as it depends on available water
(White et al., 2010) and temperature (Gholz, 1982). LAI of fast growing eucalypt forests is
also known to be dynamic both seasonally and between years (Le Maire et al., 2011),
especially in evergreen forests prone to seasonal droughts (Turner et al., 2008). Large
structural changes of the canopy that occur over the rotation affect LAI, crown cover, leaf
angle and specific leaf area (SLA) (Laclau et al., 2010). There is a strong linear relationship
between tree LAI and mean daily water use for a wide range of Eucalyptus species grown
under similar climatic conditions (Hatton et al., 1995). It was observed that, for each
additional 100 mm y-1
in rainfall, LAI increased 0.3 units and productivity increased 2.3 Mg
ha-1
y-1
, resulting in an additional increment of 7.6 Mg ha-1
y-1
per added unit of LAI (Ryan et
al., 2010). E. saligna (Ares and Fownes, 2000) and E. grandis (Kallarackal and Somen, 1997)
are known to exhibit stomatal closure in response to stronger atmospheric vapour pressure
deficits to reduce the Etp.
LAI during the mid- to late-dry seasons is reported to decline following water shortages in the
soil, and is usually reported to be 40-50% smaller than its value during the wet- and early-dry
seasons in Eucalyptus forests (Nouvellon et al., 2010). Reductions in the LAI were reported to
be up to 50% even in moist tropical forests in Congo-Guinean forest (de Wasseige et al.
2003), in Mexico (Mass et al., 1995) and in Thailand (Tanaka et al., 2003). In this study, an
assumed dry season reduction in LAI (Etp) of 15% was observed to lead to a deficit in
catchment water balance but a further increase in the reduction (30%) lead to a neutral
catchment water balance where P-ET gave a sum of R+D of about 2 mm. A higher rate LAI
(Etp) reduction which may be expected to reach a maximum of 50% would lead to a more
positive surplus. To a lesser extent, stomatal closure during the dry season as the soil water
declines may reduce tree transpiration further, thereby reducing water loss by trees
(Wullschleger et al., 1998) and thus, leading to a closed catchment water balance. The effect
of this on tree growth was assumed to be minimal or none since dry seasons are usually
dormant periods for tree growth.
According to climate data from 1982-1993 collected from Butare and Nyakibanda
meteorological stations in the study area, the area experiences annual dry seasons of up to 4
months during which mean monthly temperatures range 17.1-20.6oC. This agrees with the
general temperature for the central plateau agro-ecological zone reported by Delepierre (1982)
that the mean annual temperature is 19.5°C, with mean annual maxima and minima of 25.7
and 13.3°C respectively. The temperatures are most likely to have increased following global
climate change in the region, as affected by land cover change. In Africa, the role of cover
changes, both natural and human induced, in modifying regional climates is perhaps most
marked (Xue, 1997). A study on African climate concludes that additional stresses on water
resources are expected regardless of the rainfall alterations which are not clearly defined
currently (Hulme et al., 2001).
Considering plantation water use at catchment level, there is a general agreement in most of
the findings that tree species produce less surface run off, ground water recharge and stream

101
flow than shallow rooted vegetation such as crops, pastures and grasslands (Benyon et al.,
2007). Crops have a transpiring leaf area for only part of the year (Robinson et al., 2006) and
consequently, recharge under agro-ecosystems may be one to two orders of magnitude greater
than under natural vegetation (Tennant and Hall, 2001). This may be a result of the trees’
capacity to improve soil physical properties due to the addition of large quantities of litter fall
and root biomass (Scroth et al., 1995), root activity of trees, root induced soil biological
activity and tree roots leaving macropores following their decomposition (Van Noordwijk et
al., 1991). Litter fall of 6-9 Mg ha-1
y-1
was reported in Eucalyptus plantations at canopy
closure in a large range of tropical environments (du Toit, 2008). Likewise, large quantities of
fine roots were reported in Eucalyptus plantations in the Congo with wide and deep soil
volume exploration, which were thought to prevent water and nutrient losses by deep drainage
and to contribute to the maximisation of resource uses (Laclau et al., 2003).
If well situated within a catchment, trees may improve instead of negatively affect catchment
hydrology. Trees located close to rivers may affect stream flows more severely owing to their
large size and more abundant leaves with greater leaf area (Dvorak, 2012). Dvorak et al.
(2012) further observed that the severity of problems associated with water extraction are
greater where plantations are large in size and cover most of the catchment area or in places
with seasonally low rainfall. In this way, well planned agroforestry practice may provide an
option of locating trees on sites where they can provide net hydrological benefits, such as
controlling run off rates where this is a problem (Keenan et al., 2004). In our study, most
woodlots were growing on the hillside, reasonably far from the River Nyiranda. Negligible
impacts are expected in catchments in which plantations are established on sites which are
hydro-geologically isolated from streams (O’Loughlin and Nambiar, 2001).
The potential impact of land use change on catchment hydrology may depend on the type of
native vegetation replaced by exotics and on the extent of the land area covered by the new
species (Albaugh et al., 2013). Unfortunately, there are no records of the vegetation types that
were replaced by Eucalyptus woodlots in the study area and the respective water use.
Generally, indigenous vegetation was reported to have less annual evapotranspiration than
exotics since they usually show shallow roots and are seasonally dormant (Albaugh et al.,
2013).
The rate of water use by Eucalyptus trees depends on the amount of rainfall and soil water
available (Dye et al., 2001) and more water is transpired when water is plenty and vice versa
(White et al., 2010). Similarly, wetter catchments were observed to have greater water flow
reductions in South Africa (Scott et al., 2000). With this fact, more water flow reductions may
be expected in the northern and western Provinces of Rwanda where Eucalyptus populations
are larger (Nduwamungu et al., 2008) and the two regions have higher elevation and higher
average annual rainfall compared to the eastern and the southern Provinces (GoR, 2011).
However, Gush et al. (2002) cautioned that the results from one catchment cannot be
extrapolated to other areas with confidence because of differences in local climates.

102
Conclusion
Short rotation eucalypt stands in the study area had small shoot sizes with DBH ranging from
2-36 cm due to frequent coppicing. Potential tree transpiration (Etp) for eucalypt woodlots
ranged from 0.41-6.44 mm d-1
(mean 2.93 mm d-1
) for the Busoro catchment and from 1.34-
3.44 mm d-1
(mean 2.72 mm d-1
) for the Butare catchment. The overall mean Etp for eucalypt
woodlots in the study area was about 3 mm d-1
, equivalent to 1,095 (mm y-1
). It should be
noted that this is a conservative estimate, based on the assumption that runoff and drainage
only occurred when available water exceeded annual Etp. Long term precipitation of the study
site was 1,245 mm y-1
on average, which is 150 mm y-1
greater than the observed potential
tree transpiration. The observed surplus annual catchment water balance suggests that short
rotation eucalypt woodlots may not negatively affect the hydrology. Small deficits observed
during the driest months of June, July, August and September may be eliminated by
physiological responses of trees through reducing LAI and to a lesser extent, stomatal closure.
A sensitivity analysis on the variation of the LA during the dry seasons resulted into Etp
decreases. A possible maximum 50% LA reduction for example lead to a corresponding
decrease of 32.8 mm in Etp. Extra shortages if any may be evened out by soil storage, which
can be recharged in the wetter months. The observed deficit in soil water during dry seasons is
not expected to impact tree growth negatively since trees usually do not grow during the dry
seasons. The moderate eucalypt water use rate observed in this study may be a function of the
small size of trees and low stand density since less dense woodlots with smaller trees had
much less potential transpiration. Managing the woodlots at short rotations (to produce small
stems), plus increasing initial tree spacing, may contribute to the reduced catchment
hydrology problems associated with eucalypt plantations. The observed water use rate of
eucalypt woodlots was less than that of many annual crops in the study area and eucalypt trees
in Africa and elsewhere in the world. In addition to biophysical water use efficiency,
economic water use efficiency may be a useful option for water use comparisons among
different production options.

103
CHAPTER 6: SYNTHESIS

104

105
SYNTHESIS
Forestry and land use dynamics
Land use in Rwanda has been influenced by a number of factors, the main ones being climate,
socioeconomic (culture and population dynamics) and government policies (REMA, 2009).
During the period 1990-2002, cultivated land increased from 782,500 to 899,133 ha in
absolute terms between 1984 and 2002 (Fig. 6.1) (Mpyisi et al., 2003). This increase occurred
at the expense of land under pasture, fallow and woodlots. The shifting from one land use to
another has stabilised over the near past but land is being farmed intensively without fallow at
all (REMA, 2009). Example is the extent of eucalypt woodlots of areas <0.5 ha which were
estimated to occupy 7% of the total area in 2002 (Mpyisi et al., 2003) (Fig. 6.1) and 6.6% by
FAO in 2010 (FAO, 2010). The forest policy reports this to be 8% of the total country area
(MFM, 2010).
Figure 6.1. Land use dynamics in Rwanda during 1990-2002 – after Mpyisi et al.
(2003). The two pies from left to right show the situation in 1990 and 2002
respectively.
Land pressure remains in an interplay where different land uses compete for the limited land
available. Land scarcity limits the scope for further expansion of farming into uncultivated
lands except in the marshlands which are also limited in size. To improve crop productivity
the focus should be on optimizing the use of inputs and natural resources for sustainable food
production. For this purpose, Rwandan government has adopted a simplified land use
consolidation model in which case farmers in a given area grow the priority food crops in a
synchronised way while keeping their land rights unchanged (Kathiresan, 2012). This author
reports that crop intensification under this program has increased by 18 fold between 2008
and 2011. As a result, an impressive improvement in productivity has been observed in the
past decade which has resulted in significant crop yields as illustrated in Figure 6.2 (WFP,
2012). Forestry on the other hand needs to increase in order to meet a target cover of 30% by
2020 (MFM, 2010).
64% 22%
11% 3%
1990
74%
14% 7% 5%
2002
Crops
Pasture
Woodlot
Other

106
Figure 6.2. Production of main staple crops (2007-2011). (Adapted from WFP,
2012).
Maize is among the top priority crops in the current Rwandan crop intensification program
agriculture due to increased importance in food security assurance and the crop has seen an
increasing area under cultivation (Fig. 6.3) and grain yield. Average maize grain yield
increased from 600 to 2,600 kg ha-1 (WFP, 2012).
Figure 6.3. Trends in maize farming area and grain yield (Adapted from Kathiresan,
2012).
0
100,000
200,000
300,000
400,000
500,000
600,000
2006 2007 2008 2009 2010 2011
Yie
lds
(to
nn
es)
Banana
Roots & Tubers
Pulses
0
100,000
200,000
300,000
400,000
500,000
600,000
2003 2004 2005 2006 2007 2008 2009 2010 2011
Mai
ze p
roduct
ion
Area under cultivation (ha)
Total production (kg)

107
Forests only cover a total area of 330,576 ha, of which 215,739 ha are natural forests and
114,837 ha represent forest plantations (MFM, 2010). Eucalyptus cover the largest plantation
area compared to other exotic timber species and in 2008, it was reported to be 64% of the
total plantation area in the country, with 65% of it owned by the government; 26% by
smallholder farmers and 9% by private institutions (Nduwamungu et al., 2008). On-farm tree
planting is mainly in the form of woodlots ranging from very small to reasonably large stands
which are scattered on the landscape countrywide, though most are found in the southern and
the western Provinces (Nduwamungu et al., 2008). Small woodlots with areas of <0.5 ha and
trees on farm occupy 222,520 ha equivalent to conventional forests (FAO, 2010). This raises
the total area of national forest cover to 553,096 ha, equivalent to 21% of total country area
such that, in total, natural forests occur on 8% of total country area while plantations on 13%
(MFM, 2010).
Plant biomass is the main source of domestic energy, and is used by 96% of Rwandans
(MFM, 2010). While pointing out that there is information gap on fuelwood consumption rate
data in Rwanda, Ndayambaje and Mohren (2011) report that about 93% of Rwandan
population rely on firewood and charcoal as the sources of domestic energy. An estimated
72% of this comes from eucalypts (MINERENA, 2013). Data on this is however scanty and
none consistent. An example is depicted in Figure 6.4 below, where firewood as a source of
domestic energy is reported to be 57 and 80% by two different sources. This difference is
unlikely a result of different dates but rather, errors in the estimations. Tree planting has been
practiced to meet wood demand and to conserve soils against erosion by the government on
public land and by farmers and private organisations on their respective land holdings. In
most plantings, Eucalyptus species have been favoured. The proportion of Eucalyptus in the
total exotic plantation species used in reforestation and afforestation was cited to be 65% by
Ndayambaje and Mohren (2011) and ≥80% by MFM (2010).
(a) (b)
Figure 6.4. Primary energy balance for Rwanda (a) Adapted from: MFM (2010), (b)
from MINEFI-DGTPE (2005).
Small size of the woodlots is borne from the fact that each household grow trees in aspiration
to become self-sufficient not only in food production but also in firewood and other wood
product requirements. As a result, woodlots are scattered on the landscape in the same fashion
the households are distributed. This makes an interspaced woodlot-crop field mosaics on
Rwandan landscape in which trees and crops adjoin. Interspecific competition between very
57% 23%
11% 6% 3% Firewood
Charcoal
Petrolleum
Peat
Electicity
80.40%
10.70%
6% 1.90% 0.90%
0.10%
Firewood
CropresiduresPetrolleum

108
eucalypt woodlots and crops becomes a very important attribute of this farming system.
Competition between trees and annual crops is key to understanding the benefits of
agroforestry. Trees compete with crops for light, water and nutrients reducing crop yields
significantly (Rowe et al., 2005). Severe competition is recorded in areas with low water areas
(Ong and Leakey, 1999; Rao et al., 1998). Eucalyptus spp. are particularly competitive that
they significantly reduce crop growth due to severe competition for soil moisture (Forrester et
al., 2010), for nutrients (Harrison et al., 2000) and for light (Bertomeu, 2012) depending on
local conditions where they grow.
On-farm single tree and woodlot planting in agroforestry systems seen as a viable option to
contribute to the alleviation of the acute fuelwood crisis in the country was observed to be
only possible on farms of at least 0.76 ha to allow also for food production (Ndayambaje and
Mohren, 2011). The authors further suggest that for this purpose, the choice of tree species is
necessary, as well as consideration of multipurpose tree species having fuelwood attributes,
high biomass production rates and increased positive effects on crop yields. Whilst most of
these criteria apply to eucalypts, the latter being very competitive excludes them. This also
was the basis for the Rwandan police makers’ decision to restrict eucalypt planting to areas
far from marshlands (Gahigana, 2006). However, farmers keep silent on the no use of
eucalypts and continue to plant them, simply because they get multiple products from the
trees at a comparatively shorter period in relation to other timber species. It has been observed
that, when trees provide higher economic advantages, farmers usually ignore their
competitiveness and integrate them with crops (Ndayambaje et al., 2014; Bucagu et al., 2013;
Tang et al. 2012). Eucalyptus ensure readily available income to farmers which can be used at
any time of need. An example is the seasonal selling of timber to cover for school fees when
school year or term starts. The same applies during peak periods of food deficit to enable
households buy food from local markets.
Increased competition for land resource will continue to grow with increased pressures from
intensive and varied land use in the east African highlands and in Rwanda in particular. Food
production needs expansion to ensure food security for a growing population. Cash crops
need to be intensified to increase the country’s economy through export. Forestry needs to
expand afforestation and reforestation programmes in Rwanda to meet the national goal of
attaining 30% forest cover (MFM, 2010) and elsewhere in the region to cope with increasing
wood demand. It therefore becomes imperative to undertake a systematic evaluation to
analyse trade-offs among different land uses so as to wisely meet different community
production goals with less or no conflicts among the different land uses. Resource assessment
and quantification of the extent of competition between different plants in an agroforestry
system and the analysis of the benefits of different production alternatives in relation to plant
growth and yields becomes necessary as tools to aid in proper planning.
This thesis focused on two levels: First, plot/field/stand level to study tree allometry in
biomass estimation, the edge effects as interspecific (tree-crop) and intraspecific (tree-tree)
interaction; and the trade-offs of maize and eucalypt woodlot monocultures versus combined
production alternatives and second, regional/catchment level for making use of stand level

109
allometric equation to developing a regional allometric equation to estimate tree above ground
biomass in both coppice and planted stands of Eucalypt saligna common in the study region,
and to estimate eucalypt woodlot water use.
The use of Eucalyptus
Eucalyptus in plantations
Eucalyptus species have been in use as plantation trees for many years in the tropics. Native
in Australia and in the Philippines, Papua New Guinea, Indonesia and Timor, they grow in
diverse ecological conditions ranging from semi-arid to marshy and swampy sites. They are
adapted to almost all types of soils (KEFRI, 2010), making them to be most widely grown
plantation trees in the world. In the late 1990s, Eucalyptus plantations covered at least 12 M
ha throughout the tropics, 90% had been established since 1955 (Turnbull, 1999). In 2008,
there were >20 million hectares of Eucalyptus plantations around the world, ≥50% of these
occurring only in Brazil (4.2 M ha), India (3.9 M ha) and China (2.6 M ha) (Iglesias-Trabado
and Wilstermann, 2008).
Eucalyptus species were introduced to the eastern Africa region in the early 1900s
(Nduwamungu, 2011a). Large scale establishment of industrial plantations in the region began
during the period 1911-1960, motivated by the fact that the slow growing and uneasily
propagated indigenous forests would not meet future wood and non-wood forest products
(Chamshama, 2011). They were to meet this demand (Nduwamungu et al., 2008; Thorhaug
and Miller, 1986). Plantations expanded over time (Oballa et al., 2005), and by the early
1970s the area of Eucalyptus in Ethiopia, Rwanda, Uganda, Kenya and Sudan had reached
95,684 ha (FAO, 1979). The largest plantations at that time were in Ethiopia and Rwanda, at
42,300 ha and 23,000 ha, respectively (Dessie and Erkossa, 2011). Figure 6.5 shows the
extent of forest and eucalypt plantations in the region.
The eucalypts are mainly managed for timber production but also as short rotation woodlots
for fuelwood supply as well as for the supply of fibre for pulp and paper industries (Cuoto et
al., 2001). Recently, eucalypts have gained impetus as short rotations for bioenergy (Couto et
al. 2003). Renewable energy contributes about 19% of global energy matrix after fossil fuel
(78%) (Renewables, 2015). Rwandans depend on wood biomass as their primary source of
energy, and in 2007, forests contributed 80% of total national domestic energy as firewood
(57%) and charcoal (23%) (MFM, 2010). With the increasing eucalypt planting, there is a
need to develop a management tool for estimating biomass. Since a trend shows an increasing
state of managing the plantations both as coppice and short rotation stands, allometric
equations for both stand types are required. It was seen necessary to develop a general
allometric equation for both coppice and planted stands for southern Rwanda. This is detailed
in Chapter 2, where general allometric equations were developed using easily measured DBH
and height either singly or in combination for estimating above ground biomass for E. saligna
tree species for total tree and for the components of stem, branch, leaf and bark. The general
equations developed at stand level were more precise with R2 values of 0.97-0.98 and this
became comparatively less precise when applied to the regional scale, where R2
reduced to

110
0.93-0.95. These are however reasonably good and can be used successfully used. With
expanding eucalypt planting in the region, the equations may be used across the region as a
tool in forest resource management and assessment programmes. Equations developed for this
species can be applied to the same species in a broader extent in the east African region,
especially using equations combining DBH and height, either directly or with
parameterisation. Using equations that combine both height and DBH has been recommended
especially when applying allometric equations in regions other than where the equations were
developed (Ketterings et al., 2001).
Figure 6.5. Areas of Eucalyptus and total plantation forests in the east African
countries. *Figures for Sudan include planted gum arabic plantations and managed
gum gardens.
Sources: Chamshama (2011); FAO (2009); Kabogoza (2011); Mathu (2011);
Nduwamungu (2011a, b); Ngaga (2011).
Eucalyptus in agroforestry systems
Eucalyptus are competitive tree species and therefore not preferred in agroforestry systems.
However, in some situations, especially of land and wood shortages resulting from population
growth, these species find their way to the croplands. This is a typical case in the east African
region, especially in Rwanda and Ethiopia (Dessie and Erkossa, 2011; Kidanu et al., 2005).
Tree-crop interaction and competition mechanism
In agroforestry systems, valuable trees or shrubs are combined with annual crops on the same
plot of land, and this may be a viable alternative for some smallholder landowners to produce
food and obtain wood products for domestic use (Hagan et al., 2009; Jose and Gordon, 2008).
In these systems however, component plants differ in terms of patterns of resource use, which
may lead to a more efficient exploitation of resource than when grown in monocultures
(Willey, 1990; Francis, 1989). Environmental resources may be more completely absorbed
0
100,000
200,000
300,000
400,000
500,000
600,000
700,000
Burundi Ethiopia Kenya Rwanda Sudan Tanzania Uganda
Pla
nta
tion s
ize
(ha)
Other spp
Eucalypts

111
and used to build crop biomass by intercropping (Amini et al., 2013; Anil et al., 1998). This
may imply that, the component plants are not competing for the same ecological niches and
that interspecies competition is weaker than intra-specific competition for a given factor
(Vandermeer, 1989). The same would occur if resource requirements of the component
species are separated in space or in time (Cannel et al., 1996). Trees being larger usually
outcompete the annual crops, leading to yield reductions. Trees and crops compete more for
soil moisture and nutrients below ground and for light above ground (Jose et al., 2000). Below
ground interactions, particularly the competition for water and nutrients are more likely to
occur when the root systems of the associated plants grow into the same area of the soil
profile (Wanvestraut et al., 2004; Gillespie et al,. 2000). Light becomes more limiting on plant
growth only when there is sufficient water and nitrogen available to the crop (Zamora et al.,
2008; Monteith et al., 1991).
Eucalyptus have developed mechanisms which enable them to adapt to various soil and
environmental conditions. At the same time, these adaptation mechanisms enable the species
to be very efficient competitors against other plants they happen to grow together or in close
proximity. Such mechanisms include a fast root growth which spreads out (lateral growth)
and deep (vertical growth) to explore a considerable volume of soil so as to increase
accessibility to soil moisture and soil nutrients. A one year eucalypt plantation in the Congo
showed a quickly developing root system which extended to a depth beyond 3 m deep and up
to the middle of the inter-row (Bouillet et al., 2002). Similar findings were reported in Kenya,
where eucalypt root system reached 4 m depth in 11-months-old trees (Jama et al., 1998). A
2-year-old eucalypt plantation indicated had roots down to 6.2 m in Brazil (Pacheco and
Louzada, 1991). In E. saligna roots were observed to be concentrated in the top 61 cm soil
layer (Skolemann, 1974). Cohen, 1997 report a high density of fine roots in the top 20 cm soil
for E. urophylla, while the same was reported in different eucalypt species in different place
(Radersma and Ong, 2002; Kidanu, 2005; Nyadzi, 2003). Stone and Kalisz (1991) identified
more than 30 tree species that develop roots over long distances, and to a depth of up to 61 m
below the ground. Lateral extent of tree roots was observed up to 10 m in Eucalyptus hockii
(Sudmeyer et al., 2004). They also observed that root density declined with distance from the
trees, and that rate of decrease was less for E. globulus and least for P. pinaster. This means
that E. globulus had more roots extending far away from the trees than P. panister did.
Spatial arrangements
Owing to their competitive nature, Eucalyptus species are not usually spatially mixed with
annual crops and whenever it is done, it is when the trees are still very young. Few such cases
have been reported, examples include intercropping rice and beans with young E.
camaldulensis (Ceccon, 2005) and the same crops with E. urophylla (Ceccon, 2007) both in
Minas Gerais state of Brazil. Intercrops of E. camaldulensis with maize and beans were also
reported in Morogoro, Tanzania (Chingaipe, 1985), that of cabbage and E. torelliana in the
uplands of Mindanao, the Philippines (Nissen et al., 1999). Spatially zoned system is the most
commonly practiced system where crop-eucalypt combinations are managed, especially tree
lines or linear tree planting and to a lesser extent, the woodlots. Presumably, farmers expect

112
that this setting will minimise tree-crop competition and therefore yield decline and the
associated losses.
Eucalyptus tree lines can be intended for wood production like in Ethiopia where they are
used to produce poles and firewood (Kidanu et al., 2005) or established as windbreaks like in
Australia to protect crops against wind damage (Sudmeyer et al., 2005; 2002). Woodlots and
adjacent annual crops is another spatially zoned system which is predominant in Kivu region
(Rwanda, eastern DRC and east western Uganda) (Majaliwa et al., 2015). At times,
monoculture plantations of eucalypts have crop fields adjacent to them, where a tree-crop
interface exist with interaction between trees and crops, making two the components of an
agroforestry system. An example is the sugarcane-eucalypt systems in Sao Paulo as described
by Pinto et al. (2005). Sequential eucalypt-crop systems also are known in which case crops
are grown in areas previously occupied by eucalypt plantations.
Why farmers grow Eucalyptus trees?
Eucalypts are believed to perform better than indigenous species and most other exotics in
height and diameter growth, giving a variety of products (Casson, 1997) in 5-7 year rotations
(Betters et al., 2001). The trees can be easily cultivated and managed, they are not palatable to
animals and therefore easy to protect, they produce superior short fibre for paper making,
make high quality charcoal, provide durable furniture timber, and are useful for shelterbelts,
soil erosion control, land reclamation and drainage. They can be managed as short rotation
coppice stands and coppice cycles of up to seven cutting times are possible (Zewdi et al.,
2009). In addition, eucalypts provide valuable non-wood forest products such as honey,
tannins, essential oils, medicines and others. It is also promoted as a source of livelihood for
underprivileged in many developing countries. Farmers are aware that eucalypts are least
capital intensive since it needs minimum maintenance with assured returns.
Farmers usually intend to be self-sufficient and integrate trees and crops in the same land unit
so as to get crop yield for food (and sometimes for cash) to ensure food security and wood
and non-timber products from trees. Firewood requirements is one of the reasons that drive
farmers to grow trees on their fields. To mix trees and crops on the same piece of land, the
expected tendency would be for the farmers to grow trees which are compatible with crops.
Surprisingly however, they sometimes grow very competitive species (Schaler et al., 2003).
When trees provide higher economic advantages for example, framers usually ignore tree
competitiveness and integrate them with crops. This has been observed in a range of study
conditions across countries and continents. Examples include in Africa: Rwanda (Ndayambaje
et al., 2014), Ethiopia (Zerihun and Kaba, 2011) and Ghana (Isaac et al., 2009); in Asia:
China (Tang et al., 2012) and India (Banyal et al., 2011; Palsaniya et al., 2010), in Europe:
France (Mary et al., 1998) and in America: Costa Rica (Schaller et al 2003). Eucalyptus
urophylla was rated as very good by farmers in Kageyo area (northern Rwanda) owing to its
wood characteristics but very poor in terms of compatibility with crops, yet 50% of all
farmers grew the species (Bucagu et al., 2013).

113
Why Eucalyptus are said to be bad?
The eucalypt controversy
The eucalypts have been receiving criticisms and support from different people. The
controversy on eucalypts started in India in more than two decades ago, when issues on social
forestry as a strategy to provide rural poor with fuel rose (Casson, 1997). The critics allege
that eucalypts affect the environment negatively, some claiming that their benefits are
outweighed by their negative impacts. The main problem cited is the ecosystem hydro-
ecological imbalances. Other queries such as the loss of soil fertility, allelopathy and
replacement of conventional forests are sometimes raised (Casson, 1997).
Eucalyptus water use
Following controversy on water use by Eucalyptus, many studies have been directed toward
this aspect at the individual tree and stand levels with fewer studies at the landscape
(catchment or watershed) level (Stanturf et al., 2013). Very high water use rates have been
reported in some studies. Examples include tree daily water rates of 90 litres (7.35 mm) under
high water supply situations, dropping to 40-50 litres (3.3-4.4 mm) under water scarce
conditions (Mukundi and Palanisami, 2011). In the Argentine pampas, Engel (2005) studied
the impact of a 40 year E. camaldulensis plantation and reported a transpiration rate of 2-3.7
mm d-1
. They further observed lowering of the ground water levels of 0.5 m with respect to
the surrounding grassland and a resultant hydraulic gradient which induced flow from the
grassland areas into the plantation that lead to the rising of the plantation water table at night.
They conclude that E. camaldulensis used both groundwater and vadose zone moisture
sources, depending on soil water availability, with an estimated 67% of total annual tree water
use contributed from groundwater sources. Tree use of ground water was reported for the
same species in Karnataka, India (Calder et al., 1997). Some studies, example in South Africa
and South America have shown faster water use by Eucalyptus than by the native grasslands
and in some cases the agricultural croplands they replace (Le Maitre et al., 2002; Nosetto et
al., 2005; Dye, 2013). Many studies in south Africa have revealed that eucalypts use much
water and affect stream flow as a result of using ground water (Gush, 2006; Scott et al., 2004;
Scott et al., 2000).
On the other hand, eucalypts have been reported in other areas to use less or comparable water
quantities as other tree species or other vegetation types. A study was carried out in Ethiopia
to compare water use by exotic tree species (Eucalyptus globulus and Cupressus lusitanica)
and the indigenous trees (Croton macrostachys and Podocarpus falcatus). Depending on the
phenology, C. macrostachys showed higher water use rates than Eucalyptus globulus when
conditions were favourable (Fetene and Beck, 2004). Eucalyptus camaldulensis and E.
tereticornis had comparable water use rates with Tectona grandis, an indigenous tree species
in India, only that the latter shed its leaves during pre-monsoon periods showing no
transpiration during this period (Kallarackal, 2010). Myers et al. (1996) observed that water
use by Eucalyptus does not exceed that of Pinus when soil water is not limiting. Eucalyptus
camaldulensis and Casuarina cunninghamiana used equal amounts of water per tree in

114
Girgarre, Victoria, Australia (Morris and Collopy, 1999). Some studies in China also
indicated that eucalypt water use did not exceed the local rainfall (Yan, 2009; Lane et al.,
2004). In Karnataka, India, water use of young Eucalyptus plantation on a medium depth soil
was not greater than that of indigenous, semi-arid dry deciduous forest and both eucalypt and
the indigenous forest water use did not exceed annual rainfall (Calder, 1992). This was also
observed by (Salemi et al., 2013; Nosetto et al., 2005), who attribute this to be in part due to
lower interception of precipitation in Eucalyptus canopies offsetting their higher transpiration
rates. One assessment concluded that total water loss from Eucalyptus stands in the tropics is
often no greater than from native hardwoods but is greater than from (non-irrigated)
agricultural crops (Cannell, 1999).
Eucalyptus water use has been observed to depend on water availability, that is, the amount of
rainfall and the soil moisture (Ferraz et al., 2013; Dye et al. 2001) and more water is
transpired when water is plenty and vice versa (White et al. 2010). Similarly, wetter
catchments were observed to have greater water flow reductions in South Africa (Scott et al.
2000). Myers et al. (1996) and White et al. (2014) report annual water use in two sites of 975
and 1394 mm in rain fed treatments versus 1102 and 1779 mm in irrigated treatments,
accounting for approximately 67% and 58% of annual precipitation and irrigation inputs
respectively. They associated the increased water use in the irrigated stands with higher
sapwood area, leaf area index and transpiration per unit leaf area but there was no difference
in the response of canopy conductance with air saturation deficit between treatments. In the
same line, the effects on stream flow was reported to be most apparent in dry regions and
years than in wetter ones (Scott, 2005) and on sites with coarse-textured soils (Nosetto et al.,
2005; Busch, 2009).
Considering plantation water use at catchment level, there is a general agreement in most of
the findings that tree species produce less surface run off, ground water recharge and stream
flow than shallow rooted vegetation such as crops, pastures and grasslands (Benyon et al.,
2007). Crops have a transpiring leaf area for only part of the year (Robinson et al., 2006) and
consequently, recharge under agro-ecosystems may be one to two orders of magnitude greater
than under natural vegetation (Tennant and Hall, 2001). Forests are deep rooted compared to
most other vegetation types (e.g. grasses). In addition to their high leaf area index, forests tend
to consume more water (and intercept more rainfall, which is lost to the atmosphere through
evaporation) than other vegetation types. This is illustrated in a review by Gilmour (2014)
using data adapted from Zhang et al. (2001), relating water use (expressed as annual
evapotranspiration) to the prevailing rainfall as summarised in Figure 6.6a. Under drier
conditions, the amount of water use does not differ between vegetation types (Figure 6a, up to
500 mm per annum), showing the dependence of water use rate on the amount of water
available (Ferraz et al., 2013). This high water use generally leads to lower total water yield
from forested catchments than with grass catchments as illustrated by Zhang (2001) (Fig.
6.6b).
Studies in other areas agree with this observation. An annual water loss from a 100% forest
catchment was observed to use much more water than a grassland under the same conditions
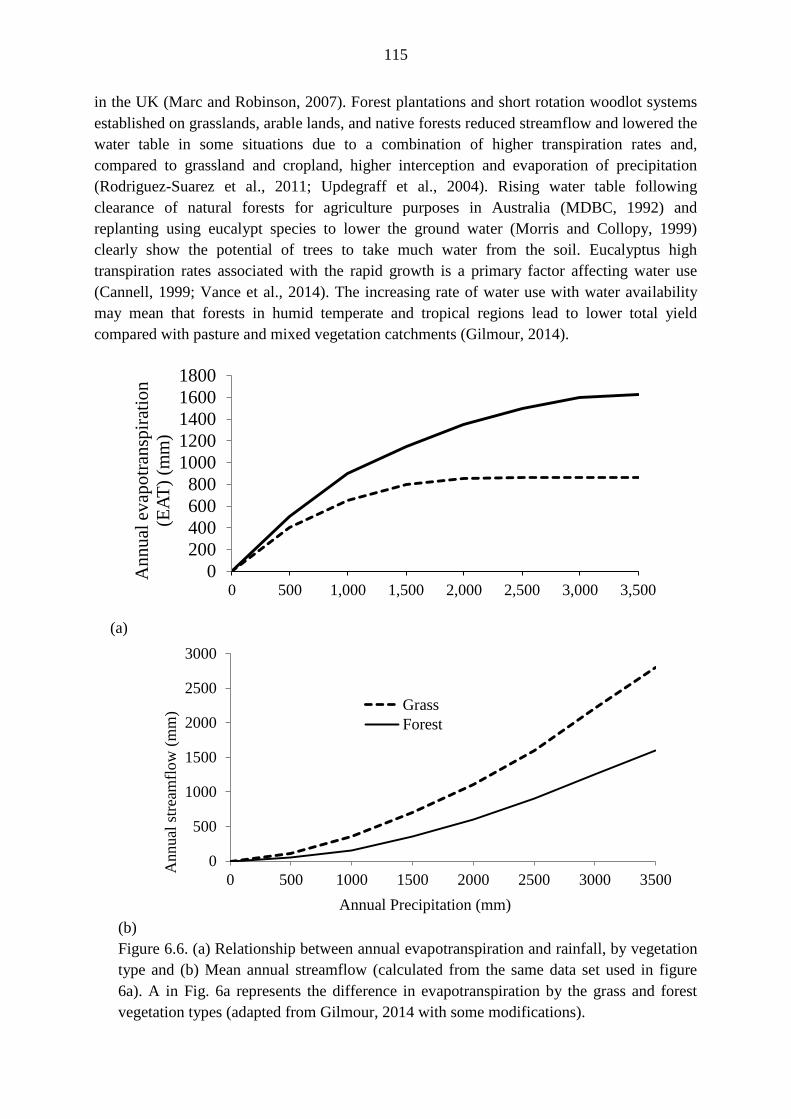
115
in the UK (Marc and Robinson, 2007). Forest plantations and short rotation woodlot systems
established on grasslands, arable lands, and native forests reduced streamflow and lowered the
water table in some situations due to a combination of higher transpiration rates and,
compared to grassland and cropland, higher interception and evaporation of precipitation
(Rodriguez-Suarez et al., 2011; Updegraff et al., 2004). Rising water table following
clearance of natural forests for agriculture purposes in Australia (MDBC, 1992) and
replanting using eucalypt species to lower the ground water (Morris and Collopy, 1999)
clearly show the potential of trees to take much water from the soil. Eucalyptus high
transpiration rates associated with the rapid growth is a primary factor affecting water use
(Cannell, 1999; Vance et al., 2014). The increasing rate of water use with water availability
may mean that forests in humid temperate and tropical regions lead to lower total yield
compared with pasture and mixed vegetation catchments (Gilmour, 2014).
(a)
(b)
Figure 6.6. (a) Relationship between annual evapotranspiration and rainfall, by vegetation
type and (b) Mean annual streamflow (calculated from the same data set used in figure
6a). A in Fig. 6a represents the difference in evapotranspiration by the grass and forest
vegetation types (adapted from Gilmour, 2014 with some modifications).
0
200
400
600
800
1000
1200
1400
1600
1800
0 500 1,000 1,500 2,000 2,500 3,000 3,500
An
nu
al e
vap
otr
ansp
irat
ion
(EA
T)
(mm
)
0
500
1000
1500
2000
2500
3000
0 500 1000 1500 2000 2500 3000 3500
Annual
str
eam
flow
(m
m)
Annual Precipitation (mm)
Grass
Forest
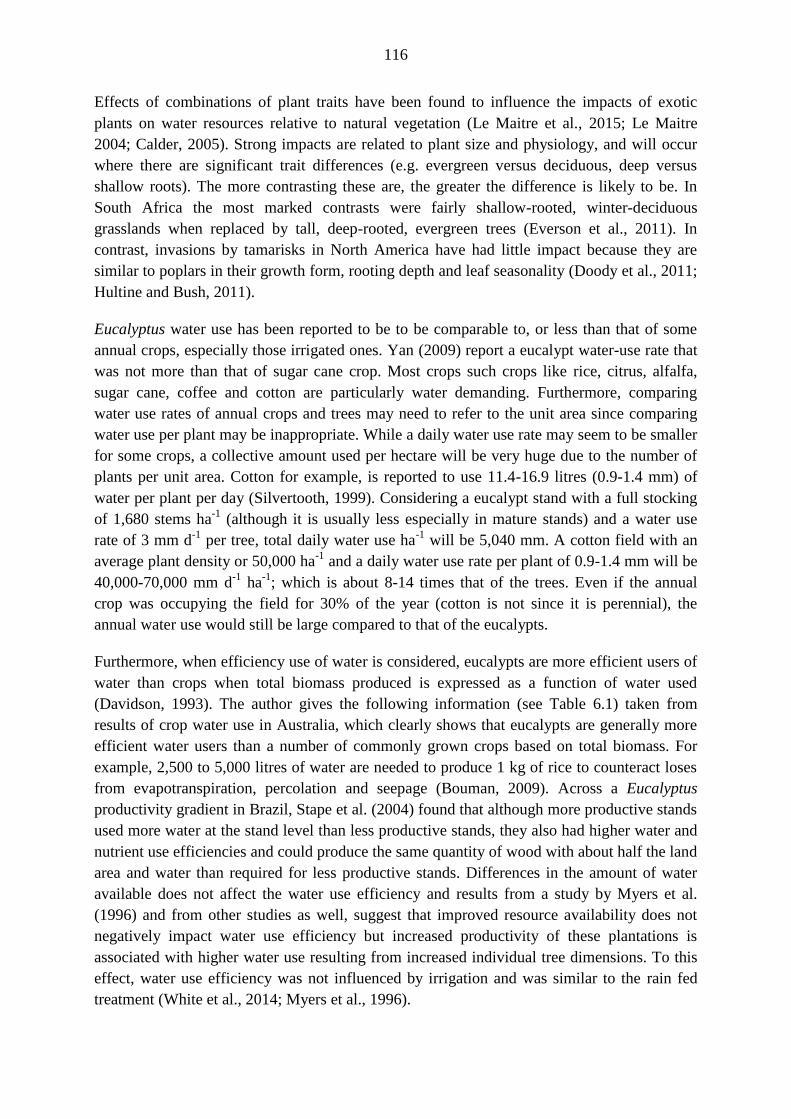
116
Effects of combinations of plant traits have been found to influence the impacts of exotic
plants on water resources relative to natural vegetation (Le Maitre et al., 2015; Le Maitre
2004; Calder, 2005). Strong impacts are related to plant size and physiology, and will occur
where there are significant trait differences (e.g. evergreen versus deciduous, deep versus
shallow roots). The more contrasting these are, the greater the difference is likely to be. In
South Africa the most marked contrasts were fairly shallow-rooted, winter-deciduous
grasslands when replaced by tall, deep-rooted, evergreen trees (Everson et al., 2011). In
contrast, invasions by tamarisks in North America have had little impact because they are
similar to poplars in their growth form, rooting depth and leaf seasonality (Doody et al., 2011;
Hultine and Bush, 2011).
Eucalyptus water use has been reported to be to be comparable to, or less than that of some
annual crops, especially those irrigated ones. Yan (2009) report a eucalypt water-use rate that
was not more than that of sugar cane crop. Most crops such crops like rice, citrus, alfalfa,
sugar cane, coffee and cotton are particularly water demanding. Furthermore, comparing
water use rates of annual crops and trees may need to refer to the unit area since comparing
water use per plant may be inappropriate. While a daily water use rate may seem to be smaller
for some crops, a collective amount used per hectare will be very huge due to the number of
plants per unit area. Cotton for example, is reported to use 11.4-16.9 litres (0.9-1.4 mm) of
water per plant per day (Silvertooth, 1999). Considering a eucalypt stand with a full stocking
of 1,680 stems ha-1
(although it is usually less especially in mature stands) and a water use
rate of 3 mm d-1
per tree, total daily water use ha-1
will be 5,040 mm. A cotton field with an
average plant density or 50,000 ha-1
and a daily water use rate per plant of 0.9-1.4 mm will be
40,000-70,000 mm d-1
ha-1
; which is about 8-14 times that of the trees. Even if the annual
crop was occupying the field for 30% of the year (cotton is not since it is perennial), the
annual water use would still be large compared to that of the eucalypts.
Furthermore, when efficiency use of water is considered, eucalypts are more efficient users of
water than crops when total biomass produced is expressed as a function of water used
(Davidson, 1993). The author gives the following information (see Table 6.1) taken from
results of crop water use in Australia, which clearly shows that eucalypts are generally more
efficient water users than a number of commonly grown crops based on total biomass. For
example, 2,500 to 5,000 litres of water are needed to produce 1 kg of rice to counteract loses
from evapotranspiration, percolation and seepage (Bouman, 2009). Across a Eucalyptus
productivity gradient in Brazil, Stape et al. (2004) found that although more productive stands
used more water at the stand level than less productive stands, they also had higher water and
nutrient use efficiencies and could produce the same quantity of wood with about half the land
area and water than required for less productive stands. Differences in the amount of water
available does not affect the water use efficiency and results from a study by Myers et al.
(1996) and from other studies as well, suggest that improved resource availability does not
negatively impact water use efficiency but increased productivity of these plantations is
associated with higher water use resulting from increased individual tree dimensions. To this
effect, water use efficiency was not influenced by irrigation and was similar to the rain fed
treatment (White et al., 2014; Myers et al., 1996).
117
Plant Water use per total biomass
(litres kg-1
) (mm kg-1
)
Cotton/Coffee/Bananas 3200 (264)
Sunflower 2400 (198)
Field Pea 2000 (165)
Paddy Rice 2000 (165)
Horse Bean 1714 (141)
Cow Pea 1667 (138)
Soy Beans 1430 (118)
Potato 1000 (83)
Sorghum 1000 (83)
Eucalypts 785 (65)
Finger Millet 592 (49)
Table 6.1. Water use by plants through evapotranspiration measured in total biomass
and expressed in litres/kg (adapted from Davidson, 1993).
Eucalyptus and soil fertility
Soil nutrient availability is known to be poor under eucalypt plantations. This is not only
attributed to the high nutrient uptake capacity of eucalypts (O’Connell and Grove, 1999;
Laclau et al., 2005) but also a result of the large amounts of non-recyclable nutrients exported
at the end of each rotation in harvested biomass (Laclau et al., 2010; Gonçalves et al., 2008).
The amount of nutrient exported will depend on the frequency of harvesting and thus, short
rotation cycles are expected to affect soils more (Poore & Fries 1988; Du Toit 2003)
compared to the longer rotations. Nandi et al. (1991) and Bernahard-Reversat (1993) report a
decline in soil properties under eucalypt plantations including soil pH, organic carbon and
exchangeable cations.
Continued export of nutrients cause other negative effects on the soils such as increased
acidity levels under eucalypt forest flow which may affect site productivity negatively.
Nsabimana et al. (2008) reported high acidity under eucalypt stands in Ruhande Arboretum
than under other forest tree species within the study region. This is attributed to the degree of
neutralisation of the soil exchange complex (Rhoades and Binkley, 1996). Biological soil
acidification under forest ecosystems has been previously reported in the tropics: in Argentina
(Jobbagy and Jackson, 2003), in India (Misra et al., 2003) and in Brazil (Lilienfein et al.,
2000).
Comparing a natural forest and five common plantation species including a eucalypt and a
pine, Michelsen et al. (1996) revealed a higher nutrient content under natural forest and
attribute this to the loss of organic matter during conversion of natural forest to plantations,
increased leaching in young plantations, and low nutrient demand by natural forest trees as
compared with fast growing exotics. Forrester et al. (2006) and El-khawas and Shehata (2005)
118
reported the accumulation of phytotoxins in soils under the plantations resulting into soil
degradation and loss of productivity. Chanie et al. (2013) reported that eucalypt plantations
exhausted sites which were productive before being planted with eucalypts. Gindaba (2006)
proposed to discourage farmers from planting eucalypts due to the fear of long term site
degradation in Ethiopian highlands.
On the other hand, eucalypt plantations have been reported to improve soil characteristics
especially in degraded sites in which case abandoned lands were brought back to agriculture.
An example includes in Ethiopia, where after five successive annual crop cycles, farmlands
reclaimed from eucalypt stands increased total biomass and grain yield of finger millet by
31.8 and 25.4% respectively; and that of barley by 32.8 and 37% respectively (Tadele and
Teketay, 2014). The authors observe that the soil conditions did not deteriorate in farmlands
reclaimed from eucalypt plantations. Positive outcomes of eucalypt growing on site quality
were also reported by other studies in the area. Lemma et al. (2006) reported a total soil
organic carbon increase to nearly pre-deforestation levels in Eucalyptus grandis plantations
during 20 years of establishment, after 20 years of cultivation and 35 years of pasture. Hailu
(2002) also reported improvement in total soil N following land use changes from cropland to
eucalypt plantations in the highlands of Ethiopia. Alem et al. (2010) found improved soil
nutrients and total carbon in E. grandis plantation compared with adjacent sub montane
rainforest in southwestern Ethiopia. It was observed in Cameroon by (Tchienkoua and Zech
2004) that planting croplands with eucalypts can improve soil productivity through
translocation of nutrients from deeper horizons to the soil surface. Guo et al. (2006) reported
import of up to 24% total N uptake to the soil surface via litter fall in short rotation eucalypt
forests. Gindaba (2003) recorded lower soil N and P concentrations 10 m away from eucalypt
edge of the canopy as compared to beneath the canopy where litter fall accumulated. Very
little influence of Eucalyptus plantations on the chemistry of surface waters were reported in
the savanna of Guinea (Laclau et al., 2007) and in Brazil (Lima and Zakia, 2006).
Realising constraints of site degradation following plantations, attempts to manage soil
nutrient levels under eucalypt plantations has traditionally been to apply fertilisers. The
approach has limitations due to their being expensive (Bouillet et al., 2013) as well as causing
negative environmental effects in terms of pollution (Epron et al., 2013). Alternative practice
was suggested as to mix eucalypts with other plantation tree species. The latter are thought to
have three broad advantages over monocultures: greater productivity (Montagnini et al., 1995;
Kelty, 2006), environmental services due to increased diversity (e.g. soil and water
protection) (Erskine et al., 2006; Kanowski et al., 2005) and risk aversion (resistance to pests
and pathogens, climate change, species failure, and market fluctuations) (Bosu et al., 2006;
Nichols et al., 2001). Although managing mixed species is more difficult compared to
managing simple monocultures, advantages the former gives may necessitate opting for
mixed stands. Nitrogen fixing species such as acacias have been tried and shown to improve
biomass, soil nutrient levels and soil properties (Bouillet et al., 2013; Epron et al., 2013).
Again, small size woodlots as traditionally grown in the study region offer a chance to
alternate stands of different tree species. Mixed stands are already managed in some locations

119
which may also contribute to the improved biomass production per unit area as well as in
managing soil nutrients. Small landholders have been observed to be the main innovators in
establishing and demonstrating mixed species plantations in Australia (Nichols et al., 2006).
An issue difficult to solve in the study region is the recycling of plant remains of the harvests
because any plant material available including leaf litter is used as firewood due to a great
deficit in the source of domestic energy for cooking (Ndayambaje and Mohren, 2011).
Eucalyptus allelopathy and effects on biodiversity
Interaction between plants in agro-ecosystems is a complex aspect and among strategies for
competition is allelopathy. Allelopathy is a result of chemical release by one plant species and
may affect companion plants, usually negatively (Abugre et al., 2011). Generally,
allelochemicals are released into the environment through leaching, root exudates, residual
decomposition and volatilisation and occurs both in natural and cropping systems (Fang et al.,
2009; Zhang and Fu, 2009). Different chemicals affect different plant species, meaning that
allelochemicals are species specific.
Many studies have shown that Eucalyptus species cause losses of biodiversity of the
understorey vegetation in plantations (He et al., 2014; Wang et al., 2010; Gareca et al., 2007).
This has been a crucial issue for long term sustainability of native ecosystems and allelopathy
is considered a factor for the losses (Zhang and Fu, 2009; Ahmed et al., 2008). Understorey
plants are very important in ensuring the overall species diversity in plantations where in most
cases indigenous, multispecies vegetation are replaced by a single, in most cases, exotic
species. In such plantations, many species are restricted to the understorey layer and others
must pass through it during their seedling stage (Ramovs and Roberts, 2003).
In experiments with rice seedlings and their reaction to leachates from the litter of Eucalyptus
hybrids Bernhard-Reversat (1999) noticed a sharp decrease of root length and an increase of
root weight/root length ratio with a decrease in the number of lateral roots of the seedlings.
However, the effect may substantially vary with the quality of litter as well as with the quality
of the soil. In the above mentioned experiment leachates from litter older than five days did
not exhibit any effect. Also the soil obtained under a Eucalyptus plantation used in a
greenhouse experiment to grow beans did not show any difference in comparison to trials on
other soil (Couto & Betters, 1995). These different results may be due to the fact that not the
leachates of Eucalyptus litter but the soil of different quality was used in the experiments. As
del Moral & Muller (1970) showed, the allelopathic effect is dependent on the soil. In this
experiment, Eucalyptus failed to inhibit annual herbs on sand whereas conditions for
allelopathic interference seemed to be optimal on soils that were poorly drained, poorly
aerated, shallow, and with high colloidal content. These factors permitted toxin concentrations
to reach physiologically significant proportions.
Most of allelopathic studies are usually done in laboratory bioassay experiments focussing on
the effects of leaf chemicals, volatile compounds, foliage decomposition and root exudates on
such factors as seed germination and early seedling growth (Fang et al., 2009; Lisanework
and Michelsen, 1993; Molina et al., 1991). However, these techniques hardly represent natural
120
ecological processes (May and Ash, 1990). According to Chu et al. (2014) and Jose et al.
(2006), field experiments testing the allelopathic effects are rare and those focusing on
eucalypt allelopathy on broad-leaved species are even rarer (Fang et al., 2009). Furthermore,
allelopathic studies have been towards crops and weeds and not on relevant species usually
associated with eucalypts in situ (Ahmed et al., 2008). Conclusions drawn from such studies
may not be relevant in explaining allelopathic effects of eucalypt species.
Eucalyptus and the replacement of conventional forests
Many native forests have been and are still being replaced by large-scale plantations of fast
growing exotic tree species. In the process, some native ecosystems and indigenous species
become extinct and others endangered and the ecosystem services provided by native forests
are diminishing or even disappearing (Sangha and Jalota, 2005; Foroughbakhch et al., 2001).
Continuous planting of eucalypts in pure stands for example, may cause accumulation of
phytotoxins in soil which may lead to soil degradation and loss of productivity (El-Khawas
and Shehata, 2005).
Sometimes eucalypts are accused for replacing natural forests. There are two ways in which
natural forests can be replaced by eucalypts. One is by establishing plantation forests and the
other is when eucalypts invade natural forests as aliens. In the first case, eucalypts do not
deserve the blame because they are planted by man. For invasion as aliens, some eucalypt
species such as E. camaldulensis and E. globulus were reported to have very high risk of
invasion (Gordon et al., 2012). Stanturf et al. (2013) also report that E. camaldulensis has
been a serious problem in South Africa. However, the potential invasiveness of eucalypts
studied in the southern USA was observed to be very low, owing to the species’ poor
dispersal, small seeds with limited viability that require bare soil to germinate, and light
demanding seedlings that do not grow successfully under closed forest or understory canopies
(Lorentz et al., 2015; Stanturf et al., 2013). Booth (2012) observed that generally eucalypts
have proved to have limited invasive potential for a number of reasons, including their poor
dispersal capabilities. Relatively limited seed dispersal, high mortality of seedlings and lack
of compatible ectomycorrhizal fungi were stated as three reasons making eucalypts
unsuccessful invasive species (Rejmanek and Richardson, 2011). Calvino-Cancela and
Rubido-Bara (2013) also observed that native vegetation in the Mediterranean region were
resistant to invasion by eucalypts.
Keeping plantations away from water courses, maintaining clear fire breaks and interspersing
eucalypt plantations with other intensive land uses are the suggested possible means to reduce
the chances of spreading (Stanturf et al., 2013).
Eucalyptus and crop yield losses
Eucalyptus species are blamed to exacerbate food insecurity problems through competing
with crops and significantly reducing crop yields (Mukund and Palanisami, 2001). Significant
depressions of crop yields have been reported in many areas when Eucalyptus trees were
grown near crops. Even at very young age of two years, eucalypt seedlings reduced soybean

121
yield by 27% (Franchini et al., 2014). In Ethiopia for example, tef and wheat yield
depressions occurred over the first 12 m from the tree line, with declines of 20 to 73% for tef
and 20 to 51% for wheat, equivalent to yield losses of 4.4 to 26% and 4.5 to 10% per hectare
respectively (Kidanu et al., 2005). The crop yield reductions observed when grown near
eucalypt is a result of tree-crop competition for soil moisture (Kidanu et al., 2005), for soil
nutrients (Harrison et al., 2000) and for light (Nissen et al., 1999). In our study (Chapter 3),
soil moisture and soil N were significantly reduced in the crop field zone from 0-10.5 m from
the tree-crop interface.
However, the way crop yield losses are usually presented in literature is not particularly
informative since percentage reductions usually appear to be very large, while the losses
actually apply to only small proportions of the cropland in question. Examining yields
combining crop field portions of the same field, both the one affected and that not affected,
may make the overall loss insignificant. An example is the maize experiment in this thesis
(Chapter 3) where maize in the 10.5 m crop field strip next to eucalypt woodlots lost 80% of
the grain yield since it produced an average yield of 0.5 t ha-1
in comparison with the yield in
the open areas of 2.5 t ha-1
. A seemingly very high (80%) grain yield loss is not that big when
it is spread over the whole field used for crop production. To illustrate this, consider one
hectare square crop field adjoining a eucalypt woodlot along one side, making a tree-crop
interface of 100 m long equivalent to the side of the crop field. Applying the results of our
study, a 10.5 m crop field strip only (equal to 1050 m2 or 0.105 ha; or 10.5% of a hectare)
next to the woodlot will produce 0.5 t ha-1
equivalent to 20% of the yield in the open areas
(2.5 t ha-1
), losing 80% of the grain. The remaining 8950 m2 or 0.895 ha (89.5% of a hectare)
will produce 2.5 t ha-1
. The overall yield of this 1 ha farmland will be:
[(0.5 t ha-1
× 0.105 ha) + (2.5 t ha-1
× 0.895)] = 2.29 t ha-1
.
This is only 0.21 t ha-1
less than the yield that would be produced from one hectare in the
absence of eucalypt-maize competition. The negative effect on the small area (10.5%)
distributed over the whole (1 ha) area reduces the overall effect from 80% to only 8.4%. This
however, applied to specific situations in the study area, may not present an insignificant loss.
Let us consider the following three of possible scenarios basing on property ownership and
land size: 1. When both the woodlot and the crop field belong to the same farmer and vice
versa, 2. When the crop field is very small compared to the woodlot, and vice versa. When
both the woodlot and crop field belong to the same farmer, losing 8.4% of the maize grain
yield per hectare to increase the owner’s woodlot productivity would actually be a benefit
since woodlots earn farmers more income than maize (as Chapter 4). Country level average
number of households with woodlots were reported to be about 42%, with the number
increasing with altitude such that in the low altitude zone 31% of households had woodlots,
mid altitude 43% and the high altitude 51% (Ndayambaje et al., 2014). Eucalyptus was the
most dominant tree species occupying 90% of all the woodlots in each of the three altitude
zones (Ndayambaje et al., 2014). This gives an impression that about 44 (90% of 49) to 62
(90% of 69) of all households may own both eucalypt woodlots and the crop fields on their
own farms. The situation becomes an issue on the remaining 38-66% of the households which

122
do not own woodlots, in which case however small the grain yield loss may be, it is an
absolute loss; and at the expense of a neighbour’s woodlot (benefit).
For the small crop field scenario, the Rwandan household lands are generally very small, with
an average of 0.7 ha (Ali et al., 2015). It is reported that 36% of the households own land of
0.11 ha on average (Warnest et al., 2011) and this may be divided into 4-5 small plots often in
multiple locations (REMA, 2009). By taking the same setting of Eucalyptus woodlot and
maize crop in example above, with half the crop field area of 0.5 ha (100 m × 50 m) for
example, and the 100 m side adjoining a woodlot; average maize grain yield will be reduced
to 1.04 t ha-1
. This yield is 10.5% less than half the yield obtained in 1 ha. In other words, by
halving the crop field without altering the length of the tree-crop interface, the decline in grain
yield is more than halved; implying that, the smaller the crop field, the greater the grain yield
loss. Farmers owning 0.11 ha with a rectangular shape of 50 m × 22 m, with the longest (50
m) side being at tree-crop interface will produce yield (Y):
Y = 0.5 × [(50 × 11.5)/10,000)+(2.5 × ((50 × 10.5)/10,000)]= 0.16 t.
If there was no tree-crop competition, the same 0.11 ha field would produce: 0.11 × 2.5 =
0.275 t, which means a grain yield loss of about 42%. The last scenario where the woodlot
becomes small, the edge effect generally will decrease as a result of the reduced length of the
tree-crop interface. However, the benefit or loss pattern will remain the same as for scenario
one based on the ownership of the two components of woodlot and crop field.
Basing on these estimates, the grain yield and corresponding losses can be extrapolated to
country level by applying the situation to the available arable land area. It was shown in
chapter 1 that the total arable land area in Rwanda is 1,369,576 ha. It was further estimated
that the total eucalypt area in the country is 282,747 ha, equivalent to about 21% of the total
arable land. With the average maize grain yield loss of 0.21 t ha-1
recorded in Chapter 3,
assuming an average of eucalypt woodlot-maize interface of 100 m ha-1
, the country level
maize grain yield loss would be 282,747*0.21, equivalent to 59,376.9 t. The same observation
applies, that, with the loss being experienced by woodlot owners would actually not be a loss;
but the loss is felt by the 58% households who do not own woodlots.
To analyse the integration of eucalypt woodlot and maize on one farm, (Chapter 4) we
considered the following. A household owning 1 ha to which both a Eucalyptus woodlot and
maize are grown with the woodlot located at one corner of the hectare such that the woodlot
adjoins the crop field along two of its sides and the other two sides are on the external
perimeter and assumed not to affect the crops. We assume also that the woodlot sizes vary in
proportions of the 1 ha, say from 15 × 15 m (225 m2) to 50 × 50 m (2,500 m
2). This would
lead to the area of maize field affected by the edge ranging from 0.042-0.105 ha (Fig. 6.7).
The crop field area affected will increase linearly with the increasing tree-crop interface
length and can be computed from equation 1 as:
A = 2L × 10.5 (or 21L) 1

123
where: A = the crop field prone to the edge effects (m2) and L = the side length of a square
woodlot adjoining the crop field (m). This 10.5 m is the length of the crop field affected by
the edge perpendicular to the tree-crop interface. It is multiplied by 2 because two sides of the
same woodlot are at the interface with maize.
Figure 6.7. Area of the maize field experiencing woodlot (edge) effects in relation to
woodlot size in a eucalypt woodlot-maize cropping system in southern Rwanda.
As earlier observed, many Rwandan farmers have small land holdings and the edge effects are
more felt the smaller the crop field. The orientation of the crop field is also very important in
smaller fields than in the bigger ones. This means that, if a rectangular crop field had its
longer side adjoining the woodlot would be more affected than when its shorter side adjoined
the woodlot. Consider a crop field of 0.4 ha laid such that 80 m adjoin a woodlot. The other
side of 50 m will be affected by the edge up to 10.5 m from the tree-crop interface, making a
total area affected to be 10.5 m × 80 m (= 924 m2) or 21.3% of the 0.4 ha total crop area. If,
on the other hand, the 50 m side adjoined the woodlot, the crop area affected by the edge
would be 10.5 m × 50 m (= 525 m2) or 13.1% of the 0.4 ha total crop area unaffected.
Woodlot trees are also affected by the edge as result of intraspecific competition, i.e.,
competition between trees. Trees in the eight outer tree rows making the woodlot edge were
observed to be 17.8% bigger in DBH and to produce 34.5% more aboveground biomass than
interior trees (Chapter 4). The woodlot area affected by the edge is derived as shown below
(equation 2). Woodlots of 16 × 16 m will be completely affected by the edge and from those
of 17 × 17 m and above, their proportion prone to edge effect will increase linearly with the
size of the woodlot (Fig. 6.8).
A = (L-2a)(L-2a) 2
= L2 - 4La + 4a
2
0
500
1000
1500
2000
2500
0 5 10 15 20 25 30 35 40 45 50
Woodlo
t ar
ea (
m2)
Side length of a square woodlot (m)
Woodlot area
Affected crop field area

124
where A = the woodlot area prone to the edge effect (m2), L = side length of a square woodlot
(m), and a = the length of the portion of the woodlot affected by the edge, found to be 8 m
(Chapter 4). To apply this formula, L must be >2a.
Figure 6.8. Total woodlot area in relation to its proportions that are prone- and not
prone to the edge effects in a eucalypt woodlot-maize cropping system in southern
Rwanda.
The estimated extra biomass obtainable from eucalypt woodlots would be computed as
follows, using average aboveground biomass obtained in one hectare (reported in Chapter 4):
W × A × I 3
where W = total above ground tree biomass (t ha-1
), A = country level eucalypt woodlot area
(ha) and i = % increment in standing tree biomass due to edge, found to be 34.5% (Chapter 4).
The average standing above ground tree biomass was found to be 204.5 t ha-1
(estimated from
edge effect free woodlot area) and the woodlot area 282,747 ha and the increment due to the
edge effect was 34.5%. This gives country level total biomass of 77,782,946 t containing
extra total wood biomass (34.5%) equal to 19,951,759 t obtainable from eucalypt woodlots
covering 21% of the arable land.
Other benefits of eucalypts
The value of eucalypt woodlots are sometimes overlooked probably due to ignorance.
Examples cited here due to their important applicability to the eastern African region include
prevention of run-off and soil loss and tree capacity to reduce CO2 emissions and to enhance
carbon sinks (Murthy et al., 2013). Soil erosion was reported to be a major concern for
agricultural development in Rwanda (Bizoza et al., 2012). Annual rates of soil losses at
0
500
1000
1500
2000
2500
0 5 10 15 20 25 30 35 40 45 50
Woodlo
t ar
ea (
m2)
Side length of a square woodlot (m)
Total area
Unaffected
Affected
125
country level were estimated at 1.4 million tonnes, and 40% of Rwanda’s land is classified by
FAO as having a high risk of erosion (GoR, 2009). On-station soil loss reported by the
national agricultural research institute (ISAR, now Rwanda Agriculture Board) as cited by
Olson (1994) range from 35-246 t h-1
per annum with most stations measuring over 100 t ha-1
per year. On five of the seven research stations where erosion was measured, erosion would
remove the fertile topsoil within 30 years if no anti-erosion techniques were used (König,
1994). Trees however have proved to be efficient tools to curb these problems.
Mulching by eucalypt leaves and branches is an important practice in Nyamagabe area,
southern Rwanda where the mulch is primarily used to reduce soil loss through erosion by
reducing kinetic energy of rain drops and nutrient enrichment through decomposition
(Nzeyimana et al., 2013). A study in a valley region of western Himalaya showed a decrease
in run-off and soil loss in contour cultivated maize by 27% and 45% compared to cultivated
fallow (Narain et al., 1998). They further reported that Eucalyptus was more effective in
controlling soil erosion than Leucaena trees both in alley cropping and in sole tree plots. In
the study area, Konig (1992) had earlier reported a remarkable reduction in run-off and soil
loss by using Calliandra calothyrsus and Leucaena leucocephala on a slope of 28%. Hedges
and manure were observed to reduce runoff and erosion efficiently on the densely populated
hill slopes of Rwanda (Roose and Ndayizigiye, 1997; Roose and Barthes, 2001).
If unchecked soil, erosion may cause more trouble as far as water supply is concerned.
Siltation of rivers and other water bodies downstream may lower water quantities and quality
significantly. Care must be put to the afforestation programmes regarding stand size and
placement on the landscape to keep eucalypts far from riparian zones and near other water
bodies, lakes and marshlands while curbing soil erosion and the associated soil losses.
Carbon sequestration as a feature of trees is very important in environmental conservation.
Trees fix carbon in their biomass and at the same time enhance sequestration of atmospheric
CO2 in the soil. Soil organic matter provides a more lasting solution than just sequestering
CO2 in standing biomass (Gupta and Sharma, 2015). Creation and strengthening of carbon
sinks in the soil were identified by the international panel on climate change (IPCC) as a clear
option for enhancing the removal of CO2 from the atmosphere and has recognises soil organic
carbon pool as one of the five major carbon pools for land use, land use change in forestry
(LULUCF) (paragraph 21, the annex to draft decision 16/CMP.1) (Anon, 2005). While soil
contains an important pool of active carbon that plays a major role in the global carbon cycle
(Melilo et al., 1995; Prentice et al., 2001), carbon in the soil is enhanced by trees. The build-
up of each ton of soil organic matter removes 3.667 tons of CO2 from the atmosphere (Bowen
and Rovira, 1999).
Approximately 50% of tree biomass is carbon (Unwin and Kriedemann, 2000). Fast growing
trees will therefore be more efficient fixers of carbon. Eucalyptus plantation was observed to
fix more soil carbon compared to several tree species plantation including Acacia catechu,
Tectona grandis, Populus deltoids, Ailanthus excels, Haloptelia integrifolia, Pongamia
pinnata and a mixed plantation (Gupta and Sharma, 2015).

126
The effectiveness of agroforestry systems to store carbon will be affected by the
environmental and socio-economic factors and in humid tropics, agroforestry systems have
been reported to have the potential to sequester over 70 Mg ha-1
in the top 20 cm of the soil
(Mutuo et al., 2005; Newaj and Dhyani, 2008). Other factors include the species, geography,
the structure and function of different components within the systems put into practice
(Schroeder, 1993; Albrecht and Kandji, 2003). Agroforestry systems significantly accumulate
C in living biomass and in the soil, demonstrating their potential to offer environmental
service of C sequestration, and can contribute to reducing CO2 emissions by avoiding burning
of forest-based fuelwood and conserving soil (Murthy et al., 2013). Eucalyptus woodlots in
the study area are likely to contribute significantly to C sequestration and related advantages
due to their fast growth rates and greater numbers of trees per unit area compared to tree-crop
mixtures in traditional agroforestry systems.
Trade-offs
Eucalyptus woodlots and crop production make the main components of plant production in
Rwandan agriculture landscape. Due to the field setting, trees and crops compete, making
what looks like monoculture tree stands and crop fields actually one system with the two
being its components. Crop reduction resulting from tree-crop competition was seen to be
insignificant, with an overall grain yield reduction of 8.4% Chapter 3). Economic analysis
showed that combined production of eucalypt woodlot and maize make a viable alternative
compared to sole maize (Chapter 4). Positive economic benefits are known to occur when
eucalypts are incorporated in the farming systems. This was reported in eastern Africa, in
Ethiopia (Kebebew and Ayele, 2010; Kidanu et al., 2005; Jagger and Pender, 2000) and in
Kenya (Peralta and Swinton, 2009). Kebebew and Ayele report a household income increase
of up to 50% compared to the major food crop and further observe that by allocating only
12% of available land to eucalypt increased returns on the same land unit by 90%. They report
a reduction in the returns from the land of 127 and 34% for teff and barley respectively when
eucalypt contribution was not considered.
The findings reported in Chapter 4 are supported by observations in other places that tree
component in agroforestry systems involving eucalypts adequately compensate for crop yield
reductions and even generate additional income (Kidanu et al., 2005). In our case, not only
tree-crop combinations but also even the additional wood increment obtained in the woodlots
due to edge effects fully compensated for corresponding losses in maize revenue experienced
due to woodlot tree competition. In addition to generating much income, Eucalyptus is less
sensitive to changes in wages and has yields more than the other crops and can be highly
profitable for smallholders (van Eijck et al., 2012). The income generated was significantly
affected by the increase in woodlot area since the revenue from tree commodities was
significantly greater than from the maize.
Water use rate of eucalypts observed in this study showed a small rate which is lower than the
annual rainfall and the water use by important crops in the region (Chapter 5). Based on these,
in addition to the dire need for firewood and wood for other uses by the farmers in the region,
the integration rather than segregation of crop production and eucalypt woodlot is suggested a

127
suitable choice for farmers in the east African highland region which has reasonably high
rainfall. This integration however would be more appropriate under two conditions: i) at the
landscape level where eucalypts will play a significant role in soil erosion control, and ii) with
farmers who have bigger land sizes where tree-crop competition is likely to be negligible.
Negative effects on the environment are not evident which supports the conclusion.
Plantation planning and management
Eucalyptus plantations are now established on more than 20 M hectares globally (Carle et al.,
2002; FAO, 2013). These plantations provide wood, environmental services and a source of
renewable energy (Bauhus et al., 2010). In the eastern African region, the trend in eucalypt
planting is also expected to continue and to expand with increasing population growth and
technology. Rwandan government indicates its intension to expand eucalypt planting and
states that approximately 11% of the total land area is potentially suitable for improved
management of eucalypt woodlots and plantations especially in the northern and southern
Provinces (MINITERE, 2014). This is necessary for both the supply of wood for firewood
and charcoal supply, as well as other wood products and also for soil erosion control. As long
as the planting is well planned, it would be appropriate to continue eucalypt planting.
Although the water use rates observed in the current study are reasonably low and suggest no
negative effects on the environment, some cautions may still be needed when planting
eucalypts. Size and location of eucalypt plantations seem to be important aspects to be
considered in afforestation programmes in the region.
Some features of Rwandan eucalypt plantings suggest they were well planned. The main
Rwandan catchments from which major rivers originate, the Nyungwe and the Volcano
forests, are both protected as national parks. Even the Gishwati and Mukura forests which had
been seriously degraded in the past 2-3 decades are now being restored and a decision has
been made to re-gazette and manage them as national parks to ensure their conservation. This
status excludes any reforestation programmes using exotic tree species in these areas. Tree
planting, if any, will be outside the national parks, restricted to the buffer zones. A similar
protective effect was observed and suggestion made in Kerala, India, where eucalypts grown
in Kanthalloor and the surrounding areas through which River Chengalar flowed from a
natural spring uphill. Eucalypt water consumption did not seem to reduce stream flow
(Kallarackal, 2010).
The small nature of eucalypt woodlots on Rwandan landscape is therefore appropriate.
Plantation effects on the environment were reported to be directly related to plantation size
with larger plantations causing more negative effects in Minas Gerais, Brazil (Ceccon, 2005).
He concludes that eucalypt agroforestry appeared to be a promising alternative that could
integrate timber and food production to meeting food demands while addressing wood
production needs and, thus an important element in the plantation programs oriented towards
small farm operations. In addition to plantation sizes, location is also an important factor as
far as water use of trees is concerned.
128
Stands located near rivers are likely to affect stream flows more than those located far away,
owing to the large size of individual trees and more abundant leaves with greater leaf areas
(Dvorak et al., 2012). Negligible impacts are expected in catchments in which plantations are
established on sites which are hydro-geologically isolated from streams (O’Loughlin and
Nambiar, 2001). The severity of problems associated with water extraction are greater where
plantations are large in size and cover most of the catchment area or in places with seasonally
low rainfall. In this way, well planned agroforestry practice may provide an option of locating
trees on sites where they can provide net hydrological benefits, such as controlling run off
rates where this is a problem (Keenan et al. 2004).
Mixing Eucalyptus woodlots with native species woodlots or plantations could also be
explored in terms of environmental conservation. Smethurst et al. (2015) observed that native
forest reserves intercepted ground water moving laterally between eucalypt plantations and
the stream. They observed that measured and simulated runoff were similarly small (5 and 3%
respectively) but the simulated rate increased to 38% when native forest was removed.
Appropriately planned agroforestry programmes would keep eucalypt stands far away from
water sources where they can provide net environmental benefits, such as run off and soil
erosion control (Keenan et al., 2004). Ferraz et al. (2013) also observed that a proportion of
native forest plays an important role in reducing and regulating water use at landscape level
and suggest a system of mosaic management to stabilise water flow across plantation
landscapes.
Mixed (native and exotic species) plantations were suggested in order to solve nutrient mining
by eucalypts and consequent soil degradation problems (Le Maitre et al., 2013). Resource use
efficiency may increase with resource use (Binkley et al., 2004) and mixed species plantations
may also use resources more efficiently through facilitation mechanisms (Kelty, 2006). An
example is planting N2-fixing tree species with a non-N2-fixing tree species, which may
enhance N soil availability and increase the growth of the non-N2-fixing tree (Kaye et al.,
2000; Richards et al., 2010). Several studies have shown that N-fixing species may have a
positive effect on the overall productivity of mixed forest plantations (e.g., Richards et al.,
2010; Forrester et al., 2010 Binkley et al., 2003). This kind of mixed species was also
suggested as a means to enhance biodiversity conservation (Brokerhoff et al., 2013) among
others.
Thinking across the east African region, so far, plantation water use in the region may not be
expected to cause problems since they cover only a very small proportion of total land area.
As seen earlier in Figure 5, the area of plantation forests (1.5 million hectares) in the eastern
African states in 2011 was estimated to be only 0.3% of the total land area (507,839,000 ha)
(Chamshama, 2011). With proper planning therefore, eucalypts are far from causing water use
problems in the region. The region enjoys enough rainfall in most of the areas and it has been
observed that in areas where annual rainfall exceeds annual potential evaporation, tree water
use is limited by energy and not water deficit (Roberts et al., 2014). The east African region
has some common issues including the shortage of wood for fuel and for other uses, high rates
of deforestation as a result of high and increasing population. The demand for wood and other

129
non-timber forest products has exceed forest capacity to supply these resulting into the
depletion of many natural forests (Burnett, 1985; Keerthisinghe, 1999). All these factors
necessitate the increase of afforestation and reforestation rates in addition to agroforestry tree
plantings so as to meet current and future wood demands which are expected to increase as
well as protecting the environment.
Conclusions and recommendations
Detailed investigations done in this thesis on the role of Eucalyptus and their interaction with
crops lead to the conclusion that the species are very useful agroforestry species for
smallholder farmers despite the bad name the species have acquired. It is not possible to get
an alterantive species, being indigenous or exotic, that can equally provide benefits as does
Eucalyptus. Owing to their competitive nature however, their integration in the spatially
zoned agroforestry systems is recommended under two conditions: i) at landscape level
where, in addition to the benefits farmers obtain from the woodlots, the latter will serve to
conserve soils against erosion and landslides incumbent in the area; and ii) at farm level for
farmers who own large land area, where crop yield losses due to tree-crop competition are
likely to be negligible and fully compensated for by benefits from woodlot trees. Segregation
or no woodlot planting at all will clearly be the option for farmers who own very small
landholdings where crop yield losses are likely to be very significant. While no evidence of
negative effects on catchment hydrology were observed in this study, some precautions which
would equally be applied whenever planting any exotic tree species for plantation purposes
still need to be taken and the following recommendations are suggested: 1. Plant and manage
Eucalyptus woodlots outside riparian zones to avoid any possible impact on water sources 2.
Maintain the current practice of not planting eucalypts in catchment areas 3. Maintain small
woodlots to avoid possible impacts reported in literature caused by large plantation
monocultures 4. Mix eucalypts with other species, preferably those capable of fixing nitrogen
to improve soils and woodlot productivity as well as to allow for possible improvements of
biodiversity 5. Make better species selection among eucalypts to allow for undergrowth
development in the woodlots to improve soil erosion control especially in very steep sites and
improve biodiversity. Finally, a holistic, integrated planning and management is needed,
considering the environmental conservation by different stakeholders to achieve a more
compatible agricultural production with the protection of ecosystems without impairing the
livelihoods of the farmers. Currently, land use specific fields plan independent of the others
which may be part of the cause of problems faced today.

130

131
REFERENCES
Abugre S, Apetorgbor AK, Antwiwaa A, Apetorgbor MM (2011). Allelopathic effects of ten tree
species on germination and growth of four traditional food crops in Ghana. Journal of
Agricultural Technology 7:825-834.
Adiku SGK, Rose CW, Braddock RD, Ozier-Lafontaine H (2000). On the simulation of root
water extraction: examination of a minimum energy hypothesis. Soil Science 165: 226-236.
Ahmed R, Hoque ATM, Hossain MK (2008). Allelopathic effects of leaf litters of Eucalyptus
camaldulensis on some forest and agricultural crops. Journal of Forestry Research 19:19-24.
Albaugh JM, Dye PJ, King JS (2013). Eucalyptus and water use in South Africa. A review article.
Hindawi Publishing Corporation, International Journal of Forestry Research Volume 2013,
Article ID 852540, 11 pages, http://dx.doi.org/10.1155/2013/852540.
Albrecht A, Kandji ST (2003). Carbon sequestration in tropical agroforestry systems. Agriculture,
Ecosystems and Environment 99: 15-27.
Alem S, Woldemariam T, Jindrich PJ (2010). Evaluation of soil nutrients under Eucalyptus
grandis plantation and adjacent sub-montane rain forest. Journal of Forestry Research, 21:457–
460.
Allen SJ, Grime VL (1998). Measurements of transpiration from savannah shrubs using sap flow
gauges. Agriculture Forestry Meteorology 75: 2341.
Akhter J, Mahmood K, Tasneem MA, Malik KA Naqvi MH, Hussain F, Serraj R (2005). Water-
use efficiency and carbon isotope discrimination of Acacia ampliceps and Eucalyptus
camaldulensis at different soil moisture regimes under semi-arid conditions. Agroforestry
Systems 49: 269-272.
Akindele SO, Tella IO, Fuwape JA (2010). Quadratic Functions for Estimating Biomass in
Eucalyptus camaldulensis energy plantations in the Semi-Arid Region of North-eastern
Nigeria, Libyan Agricultural Research Center International Journal 1: 10-18.
Akinnifesi FK, Rowe EC, Livesley FJ, Kwesiga FR, Vanlauwe B, Alegre J (2004). Tree root
architecture In: M van Noordwijk, G Cadisch and CK Ong (eds). Below-ground interactions in
tropical agro-ecosystems. Concepts and models with multiple plant components. CABI,
Wallingford. pp 61-81.
Akyeampong E, Duguma B, Heinneman AM, Kamara CS, Kiepe P, Kwesiga F, Ong CK, Otieno
HJ, Rao MR (1995). A synthesis of ICRAF’s research on alley cropping In: Kang BT,
Osiname OA and Larbi A (eds) Alley Farming Research and Development, IITA, Ibadan,
Nigeria pp 40-51.
Amini R, Shamayeli M, Dabbagh Mohammadi Nasab A (2013). Assessment of yield and yield
components of corn (Zea mays L.) under two and three strip intercropping systems.
International Journal of Bioscience 3: 65-690.
Armstrong RA, McGhee R (1980.) Competitive exclusion. American Naturalist 115: 151-170.
Anil L, Park RHP, Miller FA (1998). Temperate intercropping of cereal for forage: a review of
the potential for growth and utilization with particular reference to the UK. Grass and Forage
Science 53: 301-317.
Anon., (2005), Decision 16/CMP.1 Land use, land-use change and forestry. The Conference of
the Parties serving as the meeting of the Parties to the Kyoto Protocol, FCCC /KP /CMP /2005
/8 /Add.3 Page 8.
Antonio N, Tome M, Tome J, Soares P, Fontes L (2007). Effect of tree, stand and site variables on
the Allometry of Eucalyptus globules tree biomass. Canadian Journal of Forestry Research 37:
895-906.
Ares A, Reid W, Brauer D (2006). Production and economics of native pecan silvopastures in
central United States. Agroforestry Systems 66: 205-215.
Ares A, Fownes HJ (2000) Productivity, nutrient and water use by Eucalyptus saligna and Toona
ciliata in Hawaii. Forest Ecology and Management 129:227-236.

132
Ashton PS (2000). Ecological theory of diversity and its applications to mixed species plantation
systems. pp 61–77 In: Ashton MS and Montagnini F (eds), The Silvicultural Basis for
Agroforestry Systems. CRC Press, Boca Raton, FL, USA.
Baligar VC, Fageria NK, He ZL (2001). Nutrient use efficiency in plants. Communication in Soil
Science and Plant Analysis 32: 921-950.
Banyal R, Masoodi NA, Masoodi TH, Sharma LK, Gangoo SA (2011). Knowledge and attitude of
farmers towards agroforestry practices in north Kashmir- a case study. The Indian Forester 137
(12): 1377-1381.
Bauhus, J., van der Meer, P., Kanninen, M (2010). Ecosystem Goods and Services form
Plantation Forests. Earthscan, London, UK.
Bayabil HK, Tilahun SA, Collick AS, Steenhuis TS (2010). Are runoff processes ecologically or
topographically driven in the Ethiopian Highlands? The case of the Maybar. Eco hydrology 3:
457-466.
Bayala J, Sanou J, Teklehaimanot Z, Oedraogo SJ, Kalinganire A, Coe Ric (2015). Advances in
knowledge of processes in soil-tree-crop interactions in parkland systems in the West African
Sahel: A review. Agricultural Ecosystems and Environment 205: 25-35.
Behera N, Sahani U (2003). Soil microbial biomass and activity in response to Eucalyptus
plantation and natural regeneration on tropical soil. For. Ecol. Manage. 174,1–11.
Bene JG, Beall HW and Côté A (1977) Trees, Food and People – Land Management in the
Tropics. IDRC, Ottawa, Canada.
Benyon R, Nambiar S (2006). Forests and water. Science information forest and land use policy in
southern Australia. In International conference on forest and water in a changing environment,
Beijing, China, August 8-10, 2006.
Benyon R, England J, Eastham J, Polglase P, White D (2007). Tree water use in forestry
compared to other dry-land agricultural crops in the Victorian context. Report prepared for the
Department of Primary Industries Victoria to promote scientific knowledge in this area. Ensis
Technical Report No. 159.
Berbigier P, Bonnefond JM, Loustau D, Ferreira MI, David JS, Perreira JS (1996). Transpiration
of a 64-year-old maritime pine stand in Portugal. 2. Evapotranspiration and canopy stomatal
conductance measured by an eddy covariance technique. Oecologia 107: 43-52.
Berkhout AH (1920). Het meten der boomen in verband met hun aanwas (mit deutscher
Zusammenfassung). Mededelingen van de Landbouwhogeschool Wageningen, Netherlands 17:
109-225.
Berlin GP, Cho J (2000). Light, moisture and nutrient use by plants In: Ashton MS and
Montagnini F (eds). The silvicultural basis for agroforestry systems. CRS Press, Washington
DC pp 9-39.
Bernhard-Reversat F (ed.) (2001). Effect of Exotic Tree Plantations on Plant Diversity and
Biological Soil Fertility in the Congo Savanna: With Special Reference to Eucalypts. Centre
for International Forestry Research, Jakarta, Indonesia.
Bernhard-Reversat F (1999). The leaching of Eucalyptus hybrids and Acacia auriculiformis leaf
litter: laboratory experiments on early decomposition and ecological implications in Congolese
tree plantations. Applied Soil Ecology 12: 251–261.
Bernhard-Reversat F (1993). Dynamics of litter and organic matter at the soil-litter interface in
fast-growing tree plantations on sandy ferralitic soils (Congo). Acta Oecologia 14: 179-195.
Bertomeu M (2012). Growth and yield of maize and timber trees in smallholder agroforestry
systems in Claveria, northern Mindanao, Philippines. Agroforestry Systems 84: 73–87.
Bertomeu M (2006). Financial Evaluation of Smallholder Timber-based Agroforestry Systems in
Claveria, Northern Mindanao, the Philippines. Small-scale Forest Economics, Management
and Policy, 5: 57-82.
Betters DR, Wright L, Couto L (1991). Eucalypt based agroforestry systems as an alternative to
produce biomass for energy in Brazil In: Biomass and Bioenergy for Economic and
Environmental Benefits. Biomass and Energy, Great Britain, 1:305-316.

133
Bi H, Turner J, Lambert MF (2004). Additive biomass equations for native eucalypt forest trees of
temperate Australia. Trees (Berl.) 18: 467-479.
Binkley D, Senock R, Bird S, Cole TG (2003).Twenty years of stand development in pure and
mixed stands of Eucalyptus saligna and nitrogen-fixing Falcataria moluccana. Forest Ecology
and Management 182:93-102.
Birasa E, Bizimana I, Bouckaert W, Champelle J, Gallez A, Maesschalck G and Vercruysse J
(1990). Carte Pédologique du Rwanda. Banque des Sols du Rwanda. Ministry of Agriculture
(MINAGRI), Kigali, Rwanda.
Bizoza AR, de Graaf J (2012). Financial cost-benefit analysis of bench terraces in Rwanda. Land
Degradation and Development 23: 103–115.
Bohlman S, O’Brien S (2006). Allometry, adult stature and regeneration requirement of 65 tree
species on Barro Colorado Island, Panama. Journal of Tropical Ecology 22: 123-136.
Boland DJ, Brooker MIH, Chippendale GM, Hall N, Hyland BPM, Johnson RD (2006). Forest
trees of Australia. Melbourne, CSIRO, Australia.
Booth TH (2012). Eucalypts and Their Potential for Invasiveness Particularly in Frost-Prone
Regions. Hindawi Publishing Corporation International Journal of Forestry Research Volume
2012, Article ID 837165, 7 pages doi:10.1155/2012/837165.
Bosu P, Cobbinah JR, Nichols JD, Nkrumah EE, Wagner MR (2006). Survival and growth of
mixed plantations of Milicia excelsa and Terminalia superba nine years after planting in
Ghana. Forest Ecology and Management doi:10.1016/j.foreco.2006.05.032.
Bouillet JP Laclau JP, Gonçalves LM, Voigtlaender M, Gava JL, Leite FP, Hakamada R,
Mareschal L, Mabiala A, Tardy F, Levillain J, Deleporte P, Epron D, Nouvellon Y (2013).
Eucalyptus and Acacia tree growth over entire rotation in single-and mixed-species plantations
across five sites in Brazil and Congo. Forest Ecology and Management 301:89–101.
Bouillet JP, Laclaua JP, Arnaud M, M’Bouc AT, Saint-Andre´ L, Jourdan C (2002). Changes with
age in the spatial distribution of roots of Eucalyptus clone in Congo. Impact on water and
nutrient uptake. Forest Ecology and Management 171:43–57
Bouman B (2009). How much water does rice use? Rice Today. January-March.
http://www.adron.sr/files/ricetoday – vol08-nr01.pdf. Cited on 28 October 2015.
Bowen GD, Rovira AD (1999). The rhizosphere and its management to improve plant growth.
Advance Agronomy 66:1–102.
Bourleigh JR, Yamoah CF (1997). Site factors associated with the performance of Leucaena
leucocephala (Lam.) de Wit and Sesbania sesban (L.) Merill in pure and mixed stands in the
northern highlands of Rwanda. Agroforestry Systems 37: 121-131.
Bouvet JM (1998). Les plantations d’Eucalyptus. Evolutions récentes et perspectives. Internal
Note. CIRAD-Forêt, Montpellier, France. 35p.
Bouvet JM, Vigneron P, Saya A (2005). Phenotypic plasticity of growth trajectory and ontogenic
allometry in response to density for Eucalyptus hybrid clones and families, Annals of Botany
96: 811–821.
Brandeis TJ, Delaney M, Parresol BR, Royer L (2006). Development of equations for predicting
Puerto Rican subtropical dry forest biomass and volume. Forest Ecology and Management
233: 133–142.
Brockerhoff EG Jactel, H, Parrota JA, Ferraz SFB (2013). Role of eucalypt and other planted
forests in biodiversity conservation and the provision of biodiversity-related ecosystem
services. Forest Ecologyand Management 301: 43-50.
Brown, S. 2002 Measuring carbon in forestry: current status and future challenges. Environmental
Pollution 116, 363-372.
Bucagu C, Vanlauwe B, Van Wijk MT, Giller KE (2014). Resource use and food self-sufficiency
at farm scale within two agroecological zones of Rwanda. Food Security 6:609-628.
Bucagu C, Vanlauwe B, Van Wijk MT, Giller KE (2013). Assessing farmers’ interest in
agroforestry in two contrasting agro-ecological zones of Rwanda. Agroforestry Systems
87:141–158.

134
Burnett GN (1985). Kenya’s forests: going up in smoke. Western Wildlands 11, 25-27.
Burren C (1995). Les Eucalyptus au Rwanda. Analyse de soixante ans d'expérience avec référence
particulière à l'arboretum de Ruhande. Intercoopération, Organisation Suisse pour le
Dévelopment et la Coopéation. Berne, Suisse.
Burrows WH, Henry BK, Back PV, Hoffman MB, Tait LJ, Anderson AR, Menke N, Danahar T,
Carter JO, McKeon GM (2000). Growth and carbon stock change in eucalypt woodlands in
north east Australia: ecological and greenhouse sink implications. Global Change in Biology 8:
769-784.
Busch, G (2009). The impact of short rotation coppice on ground water recharge – A spatial
(planning) perspective. Agriculture and Forest Resources 59:207-222.
Calder IR (2005). Blue revolution: integrated land and water resource management.
Earthscan; (London) 353 p., ISBN:1844072398.
Calder IR, Rosier PTW, Prasanna KT, Parameswarappa S (1997). Eucalyptus water use greater
than rainfall input - a possible explanation from southern India. Hydrological Earth System
Science 1:249-256.
Calder IR, Swaminath MH, Kariyappa GS, Srinivasalu NV, Srinivasa Murty KV, Mumtaz J
(1992). Measurements of transpiration from Eucalyptus plantation, India using deuterium
tracing. In: Calder IR, Hall RL, Adlard PG (Ed.) (1992). Proc. Int. Symp. on the growth and
water use of forest plantations. Bangalore, 7-11 February 1991, Wiley, Chichester, p 196-215.
Calder IR (1986). Water use of Eucalyptus - a review with special reference to South India.
Agriculture Water Management 11: 333-342.
Callister AN, Adams MA (2006). Water stress impacts on respiratory rate, efficiency and
substrates, in growing and mature foliage of Eucalyptus spp. Planta 224: 680-691.
Calvino-Cancela M, Rubido-Bara M, van Etten EJB (2012). Do eucalypt plantations provide
habitat for native forest biodiversity? For Ecol Manage 270: 153-162.
Campoe OC, Stape JL, Laclau J-P, Marsden C, Nouvellon Y (2012). Stand-level patterns of
carbon fluxes and partitioning in a Eucalyptus grandis plantation across a gradient of
productivity, in São Paulo State, Brazil. Tree Physiology 32: 696-706.
Campos P, Daly-Hassen H, Ovando P, Chebil A, and Oviedo JL (2009). Economics of multiple
use cork oak woodlands: two case studies of agroforestry systems In: Riqueiro-Rodriguez A,
McAdam J, Mosquera-Losada MR (eds.). Agroforestry in Europe - Current Status and Future
Prospects. Springer, pp 269-294.
Cannell MGR, Van Noordwijk M, Ong CK (1996). The central agroforestry hypothesis: the trees
must acquire resources that crops would not otherwise acquire. Agroforestry Systems 34: 27-
31.
Carberry P, Huth N, Poulton P, Brennan L (2007). Quantifying the trade-off between tree and
crop productivity on farms. A report for the RIRDC/Land & Water Australia/FWPRDC Joint
Venture Agroforestry Program. RIRDC Publication No 07/192, RIRDC Project No CST-6A.
Carle J, Vuorinen P, Del Lungo E (2002). Status and trends in global forest plantation
development. For. Prod. J. 52, 1–13.
Casson A (1997). The controversy surrounding eucalypts in social forestry programmes of Asia.
A paper presented in the Resource Management in Asia-Pacific seminar series in June 1997.
Australian National University, 23p.
Ceccon E (2007). Production of bioenergy on small farms: a two-year agroforestry experient
using Eucalyptus urophlla intercropped with rice and beans in Minas Gerais, Brazil. New
Forests (16 Nov 2007).
Ceccon E (2005). Eucalyptus agroforestry system for small farms: 2-year experiment with rice
and beans in Minas Gerais, Brazil. New Forests 29: 261-272.
Champelle J (1985). Les sols du Rwanda: Premier Séminaire national sur la fertilisation des sols
du Rwanda. Kigali, du 17 au 20 Juin 1985. MINAGRI, Kigali, Rwanda.

135
Chamshama SAO (2011). Forest plantations and woodlots in eastern and north-eastern African
countries – a regional overview. Africa Forest Forum Working Paper Series Volume I No. 13.
A platform for stakeholders in African forestry. African forestry. African Forest Forum.
Chand R, Prasanna PAL, Singh A (2011). Farm size and productivity: understanding the strengths
of smallholders and improving their livelihoods. Review of Agriculture, Economic & Political
Weekly Supplement No. 26 & 27. June 25-July 8, pp. 5-11.
Chanie T, Collick AS, Adgo E, Lehmann CJ, Steenhuis TS (2013). Eco-hydrological impacts of
Eucalyptus in the semi humid Ethiopian Highlands: the Lake Tana Plain. Journal of Hydrology
and Hydromechanics 61: 21-29.
Chave J, Andalo C, Brown S, Cairns MA, Chambers JQ, Eamus D, Fölster H, Fromard F, Higuchi
N, Kira T, Lescure J-P, Nelson BW, Ogawa H, Puig H, Riéra B, Yamakura T (2005). Tree
allometry and improved estimation of carbon stocks and balance in tropical forests. Oecologia
145: 87-99.
Chave J, Condit R, Aguilar S, Hernandez A, Lao S, Perez R (2004). Error propagation and scaling
for tropical forest biomass estimates. Philosophical Translocation of the Royal Socety of
London B 35: 409-420.
Chingaipe TM (1985). Early growth of Eucalyptus camaldulensis under agroforestry conditions at
Mafiga, Morogoro, Tanzania. Forest Ecology and Management 11: 241-244.
Clay DC and Dejaegher YMJ (1987). Agro-ecological zones: The development of a regional
classification scheme for Rwanda. Tropicultura 5: 153-159.
Clark DA, Brown S, Kicklighter D, Chambers JQ, Thomlinson JR, Ni J (2001). Measuring net
primary production in forests: concepts and field methods. Applied Ecology 11: 356-370.
Coe R, Huwe B, Schroth G (2003). Designing experiments and analysing data In: Schroth G,
Sinclair FL (eds.). Trees, Crops and Soil Fertility Concepts and Research Methods. CAB
International, Wallingford, Oxon OX10 8DE, UK. ISBN 0 85199 593 4, pp 39-76.
Cohen Y, Adar E, Dody A, Schiller G (1997). Underground water use by Eucalyptus trees in an
arid climate. Tree Structure and Functioning 11 : 356-362.
Condit R (1998). Tropical forest census plots. Springer, Berlin Heidelberg New York.
Conklin HC (1957). Hanundo Agriculture. FAO, Rome, Italy.
Coomes DA, Allen RB (2009). Testing the metabolic scaling theory of tree growth. Journal of
Ecology 97: 1369ced co.
Cooper PJM, Leakey RRB, Rao MR and Reynolds L (1996). Agroforestry and the mitigation of
land degradation in the humid and sub-humid tropics of Africa. Experimental Agriculture 32:
235-290.
Coulibaly YN, Mulia R, Sanou J, Zombré G, Bayala J, Kalinganire A (2013). Crop production
under different rainfall and management conditions in agroforestry parkland systems in
Burkina Faso: observations and simulation with WaNuLCAS model. Agroforestry Systems 88:
13-28.
Cunia T (1964). Weighted Least Squares Method and Construction of Volume Tables. Forest
Science 10: 180-191.
Couto L, Betters D (1995). Short-rotation eucalypt plantations in Brazil: Social and environmental
issues. Martin Marietta Energy Systems Inc.
Couto L, Dubé F, (2001). The status and practice of forestry in Brazil at the beginning of the 21st
century: A review. The Forestry Chronicle, 77:817-830.
Couto L, Müller MD, Barcellos DC, Cuoto MMF (2004). Short Rotation Woody Crops
Operations Working Group IEA Bioenergy (Task 30), Short Rotation Crops for Bioenergy
Systems IUFRO Working Unit 1.09.01, Integrated research in temperate short-rotation energy
plantations pp 20-22. http://www.woodycrops.org/NR/rdonlyres/BF9B2067-FDB0-49B0-
9543-8EEA 03A415FD/1651/2004Abstracts.pdf; cited on 3 December 2015.
Davidson J (1993). Ecological aspects of eucalypt plantations. In: White K, Ball J and Kashio M
(eds). Proceedings of Regional expert consultation on Eucalyptus held from 4-8 October, 1993.
Volume I. FAO Regional Office for Asia and the Pacific

136
Bangkok, Thailand, pp 38-79. http://www.fao.org/docrep/005/ac/777e.ac.777e06.html
retrieved on 15.8.2013
De Gier A (2003). A new approach to woody biomass assessment in woodlands and shrublands
In: GeoinFormatics for Tropical Ecosystems, P. S. Roy, (ed.). Bishen Singh Mahendra Pal
Singh, Dehradun, India, pp 161–198.
De Ridder M, Hubau W, van den Bulcke J, van Acker J, Beeckman H (2010). The potential of
plantations of Terminalia superba engl. & diels for wood and biomass production (Mayombe
Forest, Democratic Republic of Congo). Annals of Forest Science 67: 501-512.
De Wasseige C, Bastin D, Defourny P (2003). Seasonal variation of tropical forest leaf area index
based on field measurements in Central African Republic. Agriculture Forest Meteorology
119: 181-194.
De Wit CT (1960). On competition. - Versl. Landbouwkd. Onderz. 66: 1-82.
Del Moral R, Muller C (1970). The Allelopathic Effects of Eucalyptus camaldulensis. American
Midland naturalist 83: 254–282.
Delepièrre (1975). Les regions agricoles du Rwanda. Bulletin agricole du Rwanda 8: 216-225.
Delepièrre G (1982). Les régions agro-climatiques en relation avec l’intensite´ de l’erosion du
Sol. Bulletin Agricole du Rwanda 2 : 87-95.
Dessie D, Erkossa T (2011). Eucalyptus in East Africa: socio-economic and environmental issues.
Planted Forests and Trees Working Papers. FAO Working Paper No. FP46/E.
Delepièrre (1975). Les regions agricoles du Rwanda. Bulletin agricole du Rwanda 8: 216-225.
Denison RF, McGuire AM (2015). What should agriculture copy from natural ecosystems?
Global Food Security 4:30–36
Diao J, Lei X, Hong L, Rong J, Shi Q (2010). Single leaf area estimation models based on leaf
weight of Eucalyptus in southern China. Journal of Forestry Research 21: 73-76.
Dietze MC, Wolosin MS, Clark JS (2008). Capturing diversity and interspecific variability in
allometries: A hierarchical approach. Forest Ecology and Management 256: 1939-1948.
Dignan P, Bren L (2003). Modelling light penetration edge effects for stream buffer design in
mountain ash forest in south-eastern Australia. Forest Ecology and Management 179: 95-106
.
Donald CM (1963). Competition among crop and pasture plants. Advanced Agronomy 15: 1-118.
Dossa EL, Fernandes ECM, Reid WS, Ezui K (2008). Above- and belowground biomass, nutrient
and carbon stocks contrasting an open-grown and a shaded coffee plantation. Agroforestry
Systems 72: 103-115.
Du Toit B (2003). Effects of site management on growth, biomass partitioning and light use
efficiency in a young stand of Eucalyptus grandis in South Africa. Forest Ecology and
Management 255: 2324-2336.
Dudley NS, Fownes JH (1992). Preliminary biomass equations for eight species of fast growing
tropical trees, Journal of Tropical Forest Science 5: 68-73 68.
Dunin FX, Greenwood EAN (1986). Evaluation of the ventilated chamber for measuring
evaporation from forest. Hydrological Processes 1: 47-62.
Dvorak WS (2012). Water use in plantations of Eucalyptus and pines: a discussion paper from a
tree breeding perspective. International Forestry Review 14 (1) 2012.
Dye PJ (2013). A review of changing perspectives on Eucalyptus water-use in South Africa.
Forest Ecology and Management 301, 51-57.
Dye PJ, Versfeld D (2007). Managing the hydrological impacts of South African plantations: An
overview. Forest Ecology and Management 251: 121-128.
Dye P, Vilakazi P, Gush M, Ndlela R, Royappen M (2001). Investigation of the feasibility of
using trunk growth increments to estimate water use of Eucalyptus grandis and Pinus patula
plantations. WRC Report 809/1/01, Water Research Commission, Pretoria, South Africa.
Dye PJ (1996). Climate, forest and streamflow relationships in South African afforested
catchments. Commonwealth Forestry Review 75: 31-38.

137
Eichhorn MP, Paris P, Herzog F, Incoll LD, Liagre F, Mantzanas K, Mayus M, Moreno G,
Papanastasis VP, Pilbeam DJ, Pisanelli A, Dupraz C (2006). Silvoarable systems in Europe –
past, present and future prospects. Agroforestry Systems 67:29-50.
Eldridge K, Davidson J, Harwood C, van Wyk G (1994). Eucalypt: Domestication and Breeding.
Oxford Clarendon Press 228 pp.
El-Khawas SA, Shehata MM (2005). The allelopathic potentialities of Acacia nilotica and
Eucalyptus rostrata on Monocot (Zea mays L.) and Dicot (Phaseolus vulgaris L.) plants.
Biotechnology 4: 23-34.
Engel V, Jobbágy EG, Stieglitz M, Williams M, Jackson RB, (2005). Hydrological consequences
of Eucalyptus afforestation in the Argentine Pampas, Water Resources Research 41, W10409,
DOI: 10.1029/2004WR003761.
Epron D, Nouvellon Y, Mareschal L, Moreirae RM, Koutika LS, Geneste B, Delgado-Rojas JS,
Laclau JP, Sola G, Gonçalves JLM, Bouillet JP (2013). Partitioning of net primary production
in Eucalyptus and Acacia stands and in mixed-species plantations: Two case-studies in
contrasting tropical environments. Forest Ecology and Management 301: 102-111.
Erskine PD, Lamb D, Bristow M (2006). Tree species diversity and ecosystem Function: Can
tropical multi-species plantations generate greater productivity? Forest Ecology and
Management 233, 205-210.
Everson CS, Dye PJ, Gush MB, Everson TM (2001). The water balance of a first order catchment
in the montane grasslands of South Africa. Journal of Hydrology 241: 110-123.
FAO (2013). Global Forest Resources Assessment 2010. In: FAO Technical Paper. Food and
Agriculture Organization of the United Nations, Rome, Italy, 378pp.
FAO (2010). WISDOM Rwanda: Woodfuel Integrated Supply/Demand Overview Mapping.
Projet TCP/RWA/3103 - Rationalisation de la filière bois-énergie.
FAO (2009). Eucalyptus in east Africa. The Socio-economic and Environmental Issues. FAO
Sub-regional Office Eastern Africa, Addis Ababa, Ethiopia.
FAO (2000). The global outlook for future wood supply from forest plantations by C. Brown.
Working paper GFPOS/WP/O3, Rome.
FAO (1979). Eucalyptus for planting. FAO forestry and forest products study No.11. FAO, Rome. Fang YT, Yoh M, Mo JM, Gundersen P, Zhou GY (2009). Response of nitrogen leaching to
nitrogen deposition in disturbed and mature forests of Southern China, Pedosphere 19: 111-
120.
Fantu W, Nuruddin AA, Haris FA, Malik ARA (2010). Above ground biomass equations for
selected Eucalyptus species in Ethiopia In: Gil L, Tadesse W, Tolosana E and López R (eds)
Eucalyptus Species Management, History, Status and Trends in Ethiopia. Proceedings of a
congress held in Addis Ababa September 15-17th, 2010 pp 297-309.
Ferraz SFB, Lima WP, Rodrigues CB (2013). Managing forest plantations for water conservation.
Forest Ecology and Management 301: 58-66.
Fetene M, Beck E (2004). Water relations of indigenous versus exotic tree species, growing at the
same site in a tropical montane forest in southern Ethiopia. Trees 18:428–435.
Fonweban JN, Houllier F (1997). Tarifs de cubage et fonctions de défilement pour Eucalyptus
saligna au Cameroun. Volume equations and taper function for Eucalyptus saligna in the
Cameroon. Annals of Forest Science 54: 513-528.
Ford ED (1975). Competition and stand structure in some even-aged plant monocultures. Journal
of Ecology 63: 311-333.
Forde DC (1937). Land and labor in a Cross River village. Geographical Journal. Vol. XC. No. 1.
Forrester DI, Theiveyanathan S, Collopy JJ and Marcar NE (2010). Enhanced water use efficiency
in a mixed Eucalyptus globulus and Acacia mearnsii plantations. Forest Ecology and
Management 259: 1761-1770.
Foroughbakhch F, Hauad LA, Cespedes AE, Ponce EE, Gonzalez N (2001). Evaluation of 15
indigenous and introduced species for reforestation and agroforestry in northeastern Mexico.
Agroforestry Systems 51:213–221.

138
Franchini JC, Balbinot Junior AA, Sichieri FR, Debiasi H, Conte O (2014). Yield of soybean,
pasture and wood in integrated crop-livestock-forest system in Northwestern Paraná state,
Brazil. Revista Ciência Agronômica 45:1006-1013.
Francis CA (1989). Biological efficiencies in multiple-cropping systems. Advances in Agronomy
42: 1-42.
Freer-Smith PH, Broadmeadow MSJ, Lynch JM (2007). Forestry and Climate. CAB International,
Wallingford, Oxfordshire, UK, 253 pp.
Fritzsche F, Abate A, Fetene M, Beck E, Weise S, Guggenberger G (2006). Soil-plant hydrology
of indigenous and exotic trees in an Ethiopian montane forest. Tree Physiology 6: 1043-1054.
Gahigana I (2006). No more Eucalyptus trees, says Official. The New Times, Kigali.
Garcia-Barrios, L. and Ong, C.K. (2004). Ecological management lessons and design tools in
tropical agroforestry systems, Agroforestry Systems 61: 221−236.
Gareca EE, Martinez YY, Bustamante TO, Aguirre LF, Siles MM (2007). Regeneration patterns
of Polylepis subtusalbida growing with the exotic trees Pinus radiata and Eucalyptus globulus
at Parque Nacional Tunari Bolivia. Plant Ecology 193:253–263.
Gholz HL (1982). Environmental limits on above ground net primary productivity, leaf area and
biomass in vegetation zones of the Pacific. North Western Ecology 63: 467-481.
Gillespie AR, Jose S, Mengel DB, Hoover WL, Pope PE, Seifert JR, Biehle DJ, Stall T, Benjamin
TJ (2000). Defining competition vectors in a temperate alley cropping system in the
midwestern USA. 1. Production physiology. Agroforestry Systems 48: 25–40.
Gilmour D (2014). Forests and water: A synthesis of the contemporary science and its relevance
for community forestry in the Asia–Pacific region. RECOFTC Issue Paper No. 3. RECOFTC -
The Center for People and Forests, Bangkok, Thailand.
Gindaba J (2006). Overview of water and nutrient relations of Eucalyptus and deciduous tree
species and implications for their use in land rehabilitation. Journal of the Dry lands, 1:15–25.
Gindaba J (2003). Water and nutrient relations of selected tree species of Ethiopia. PhD
dissertation. Department of forest science, Stellenbosch University, South Africa, p. 180.
Gislain NT (2008). Irrigation water requirement of prioritized crops in Nyagatare district. Institut
des Sciences Agronomiques du Rwanda (ISAR). Rapport Annuel, Gestion des Sols et des
Eaux.
Gonçalves JLM, Wichert MCP, Gava JL, Serrano MIP (2008). Soil fertility and growth of
Eucalyptus grandis in Brazil under different residue management practices. In: Nambiar EKS
(eds) Site management and productivity in tropical plantation forests. Proceedings of
workshops in Piracicaba (Brazil) 22–26 November 2004 and Bogor (Indonesia) 6–9 November
2006. Bogor, Indonesia. Center for International Forestry Research (CIFOR).
Gordon DR, Flory SL, CooperAL, Morris SK (2012). Assessing the invasion risk
of Eucalyptus in the United States using the Australian weed risk assessment. International
Journal of Forestry Research Volume 2012 (2012), Article ID 203768, 7 p.
GoR (Government of Rwanda) (2011). Water resources management sub-sector strategic plan
(2011 – 2015). Ministry of Natural Resources, Kigali, Rwanda.
GoR (2008). Strategic Plan for the Transformation of Agriculture in Rwanda – Phase II (PSTA
II). Final Report. Ministry of Agriculture and Animal Resources, Republic of Rwanda (ROR),
Kigali.
Grant JC Nichols JD, Yao RL, Smith RGB, Brennan PD, Vanclay JK (2012). Depth distribution
of roots of Eucalyptus dunnii and Corymbia citriodora subsp. variegata in different soil
conditions. Forest Ecology and Management 269: 249-258.
GTZ/Marge (2008). Biomass Energy Strategy (BEST), Rwanda. Volume 2: Background &
Analysis. European Union Energy Initiative Partnership Dialogue Facility.
Guo LB, Sim RH, Horne P (2006). Biomass production and nutrient cycling in Eucalyptus short
rotation energy forests in New Zealand: litter fall and nutrient return. Biomass and Bioenergy,
30:393–404.
139
Gupta MK, Sharma SD (2015). Carbon sequestration in the soils under different plantations in
Haryana State, India. International Journal of Environmental Sciences Volume 5, No 5, 2015.
Gush MB, Scott DF, Jewitt GPW (2002). Estimation of stream flow reductions resulting from
commercial afforestation in South Africa. WRC Report TT 173/02, Water Research
Commission, Pretoria, South Africa.
Hagan DL, Jose S, Thetford M, Bohn K (2009). Production physiology of three native shrubs
intercropped in a young longleaf pine plantation. Agroforestry Systems 76:283-294.
Hailu Z (2002). Ecological impact evaluation of Eucalyptus plantations in comparison with
agricultural and grazing land use types in the highlands of Ethiopia. PhD dissertation. Vienna
University of Agricultural Sciences, Vienna, p. 271.
Hailu Z, Sieghardt M, Schume H, Ottner F, Glatzel G, Assefa B, Hailu TT (2003). Impact of
Eucalyptus globulus and Eucalyptus camaldulensis small scale plantations on chemical and
physical soil properties and on soil hydrology parameter in the highland of Ethiopia. A
comparison with other land use systems. Final project report.
Hall RIL, Calder IR, Rosier PTW (1992). Measurements and modeling of interception loss from a
Eucalyptus plantation in southern India. In: Calder IR, Hall RL and Adlard PG (eds.). Growth
and water use of forest plantations. Wiley, Chichester, pp 270–289.
Hatton TJ, Moore SJ, Reece PH, (1995). Estimating stand transpiration in a Eucalyptus populnea
woodland with the heat pulse method: measurement errors and sampling strategies. Tree
Physiology 15: 219-227.
Harrington RA, Fownes JH (1993). Allometry and growth of planted versus coppice stands of
four fast-growing tropical tree species. Forest Ecology and Management 56: 315-327.
Harris F (2007) The effect of competition on stand, tree, and wood growth and structure in
subtropical Eucalyptus grandis plantations, PhD thesis, Southern Cross University, Lismore,
NSW.
Harper JL (1967). A Darwinian approach to plant ecology. Journal of Ecology 55: 247-270.
Harrison D, Reis GG, Reis MDGF, Bernardo AL, Firme DJ (2000). Effects of spacing and age on
nitrogen and phosphorus distribution in biomass of Eucalyptus camaldulensis, Eucalyptus
pellita and Eucalyptus urophylla plantations in southern Brazili. Forest Ecology and
Management 133: 167-177.
Hartemink AE (2003). Assessing soil fertility decline in the tropics with case studies on
plantations. Advances in Agronomy 89: 180-225.
Hartemink AE, Buresh RJ, van Bodegom PM, Braun AR, Jama B, Janssen BH (2000). Inorganic
nitrogen dynamics in fallows and maize on an Oxisol and Alfisol in the highlands of Kenya.
Goderma 98: 11-33.
Harrison RD, Reis GG, Reis MDGF, Bernardo AL, Firme DJ (2000). Effects of spacing and age
on nitrogen and phosphorus distribution in biomass of Eucalyptus camaldulensis, Eucalyptus
pellita and Eucalyptus urophylla plantations in southern Brazil. Forest Ecology and
Management 133: 167-177.
Hatton TJ, Moore SJ, Reece PH (1995). Estimating stand transpiration in a Eucalyptus populnea
woodland with the heat pulse method: measurement errors and sampling strategies. Tree
Physiology 15:219-227.
Hauser S (2006). Biomass production, nutrient uptake and partitioning in planted Senna
spectabilis, Flemingia macrophylla and Dactyladenia barteri fallow systems over three
fallow/cropping cycles on Ultisol and relationships with crop production. A paper presented in
the conference on international agriculture research for development held from 11-13, October
2006, Univerisity of Bonn, Germany.
He H, Song QM, Wang YF, Yu SX (2014). Phytotoxic effects of volatile organic compounds in
soil water taken from a Eucalyptus urophylla plantation. Plant and Soil
http://dx.doi.org/10.1007/s11104-013-1989-1.

140
Henry M, Picard N, Trotta C, Manray RJ, Valentini R, Bernoux M, Saint-Andre L (2011).
Estimating tree biomass of Sub-Saharan African forests: a review of available allometric
equations. Silva Fennica 45: 477-569.
Hillel D (1998). Environmental Soil Physics. Academic Press, San Diego.
Hohenadl W (1936). Die Bestandsmessung. Forstwissenschaftliches Centralblatt 58: 51-61, 69-86
en 114-127.
Hood S (2002). Rural water use efficiency – real water use efficiency and the opportunities. In: A
paper read at 11th cotton conference of the Australian Cotton Growers Research Association,
13-15 August 2002 at Brisbane Convention and Exhibition Centre, Brisbane, Queensland,
Australia.
Hou Q, Brandle J, Hubbard K, Schoeneberger M, Nieto C, Francis C (2003). Alteration of soil
water content consequent to root-pruning at a windbreak/crop interface in Nebraska, USA.
Hulme M, Doherty R, Ngara T, New M, Lister D (2001). African climate change: 1900-2100.
Climate Research 17: 145-168.
Hultine KR, Bush SE (2011). Ecohydrological consequences of non-native riparian vegetation in
the southwestern United States: a review from an ecophysiological perspective. Water
Resources Research 47:W07542.
Husch B, Beers TW, Kershaw JA (2003). Forest Mensuration, 4th Edition. John Wiley & Sons
Inc. Hoboken, New Jersey, USA 433 pp.
Iglesias-Trabado G, Wilstermann D (2008). Eucalyptus universalis. Global cultivated Eucalypt
forest map 2008. Version 1.0.1. www.git-forestry.com (accessed on 10.3.2014).
Isaac ME, Dawoe E, Sieciechowicz K (2009). Assessing local knowledge use in agroforestry
management with cognitive maps. Environmental Management 43:1321–1329.
Imo M (2008). Interactions amongst trees and crops in taungya systems of western Kenya.
Agroforest Syst (2008), DOI 10.1007/s10457-008-9164-z.
Imo M, Timmer VR (1999). Vector competition analysis of a leucena-maize alley cropping
system in western Kenya. Forest Ecology and Management 47: 1–4.
International Fund for Agricultural Development, IFAD (2011). Rwanda smallholder cash and
export crop development project. Interim Evaluation. International Fund for Agricultural
Development (IFAD), Kigali, Rwanda.
Jagger P, Penerd J (2000). The role of trees for sustainable management of less-favoured lands:
the case of Eucalyptus in Ethiopia. EPTD Discussion Paper No. 65. Environment and
Production technology Division International Food Policy Research Institute 2033 K Street,
NW Washington, D.C. 20006 USA.
Jama B, Buresh RJ, Ndufa JK, Shepherd K D (1998). Vertical distribution of roots and soil
nitrate: Tree species and phosphorus effects. Soil Science Society American Journal 62: 280-
286.
Jama PK, Nair PKR, Rao MR (1995). Productivity of hedgerow shrubs and maize under
alleycropping and block planting systems in semiarid Kenya. Agroforestry Systems 31: 257-
274.
Jobbágy E, Baldi G, Nosetto M (2012). Tree plantation in South America and the water cycle:
impacts and emergent opportunities In: Schlichter T and L Montes (eds.). Forests in
development: a vital balance pp 53-63. Springer.
Jobbagy EG, Jackson RB (2003). Patterns and mechanisms of soil acidification in the
conservation of grasslands to forests. Biogeochemistry 64: 205-229.
Jobbágy EG, Jackson RB (2001). The distribution of soil nutrients with depth: global patterns and
the imprint of plants. Biogeochemistry 53: 51–77.
Jolliffe, PA (2000). The replacement series. Essay review, Journal of Ecology. 88: 371-385.
Jones HG (1992). Plants and microclimate 2nd ed. Cambridge University Press.
Jose S, Gordon AM (2008). Ecological knowledge and agroforestry design. In: Jose S, Gordon
AM (eds.). Toward agroforestry design: an ecological approach. Springer, Dordrecht, pp 3–9.
141
Jose S, Williams R, Zamora D (2006). Belowground ecological interactions in mixed-species
forest plantations. For. Ecol. Manage. 233, 231–239.
Jose S, Gillespie AR, Pallardy SG (2004). Interspecific interactions in temperate agroforestry.
Agroforestry Systems 61: 237–255.
Jose S, Gillespie AR, Seifert JR, Biehle DJ (2000). Defining competition vectors in a temperate
alley cropping system in the mid-western USA. 2. Competition for water. Agroforestry
Systems 48:41–59.
Kabebebw Z, Ayele G (2010). Profitability and household income contribution of growing
Eucalyptus globulus (Labill.) to smallholder farmers: The case of central highland of Oroma,
Ethiopia. European Journal of Applied Science 2: 25-29.
Kaboggoza J (2011). Forest plantations and woodlots in Uganda. Africa Forest Forum Working
Paper Series Volume I No. 13. A platform for stakeholders in African forestry. African
forestry. African Forest Forum.
Kallarackal J (2010). Water use by Eucalyptus grandis plantations in comparison with grasslands
located in the downhill areas of Mannavan Shola in the Western Ghats of Kerala. Kelara
Forestry Research Institute (KFRI) Research Report No. 332.
Kallarackal J, Somen CK (1997). An ecophysiological evaluation of the suitability of Eucalyptus
grandis for planting in the tropics. Forest Ecology and Management 95:53–61
Kathiresan A (2012). Farm land use consolidation in Rwanda. Assessment from perspectives of
agriculture sector. Ministry of agriculture and animal resources (MINAGRI), Kigali, Rwanda.
Kanowski J, Catterall CP, Wardell-Johnson GW (2005). Consequences of broad scale timber
plantations for biodiversity in cleared rainforest landscapes of tropical and subtropical
Australia. Forest Ecology and Management 208:359-372.
Kaye JP, Resh SC, Kaye MW, Chimmer RA (2000). Nutrient and carbon dynamics in a
replacement series of Eucalyptus and Albizia trees. Ecology 81: 3267-3273.
Keenan RJ, Parsons M, O’Loughlin E, Gerrand A, Beavis S, Gunawardana D, Gavran M, Bugg A
(2004). Plantations and Water: a review. Report prepared for the Forest & Wood Products
Research & Development Corporation, Bureau of Rural Sciences, Canberra, Australia, 88p.
Keerthisinghe G (1999). The use of nuclear techniques for developing integrated nutrient and
water management practices for agroforestry systems. Report of a Joint FAO/IAEA division
of nuclear techniques in food and agriculture soil and water management and crop nutrition
section. Vienna international centre, Vienna. AUSTRIA.
Kelty MJ (2006). The role of species mixtures in plantation forestry. Forest Ecology and
Management 233:195-204.
Kenya Forestry Research Institute (KEFRI) (2010). Facts on growing and use of Eucalyptus in
Kenya. KEFRI, Nairobi, Kenya. ISBN: 9966 -7458 – 1-5.
Ketterings QM, Coe R, van Noordwijk M, Ambabagau Y, Palm CA (2001). Reducing un
certainty in the use of allometric biomass equations for predicting above ground tree biomass
in mixed secondary forests. Forest Ecology and Management 146: 199-209.
Kidanu S, Mamo T, Stoosnijder L (2005). Biomass production of Eucalyptus boundary and their
effect on crop productivity on Ethiopian highland Vertisols. Agroforestry Systems 63: 281-
290.
Kidd CV and Pimentel D (1992). Integrated resource management: agroforestry for development.
Academic Press Inc., San Diego, California.
King KFS (1987). The history of agroforestry. In: Steppler, HA and Nair, PKR. (eds.),
Agroforestry: A Decade of Development, pp. 1-11. ICRAF, Nairobi, Kenya.
König D (1992). The potential of agroforestry methods for erosion control in Rwanda. Soil
Technology 5: 167-176.
Laclau JP, da Silva EA, Lambais GR, Bernoux M, Maire G, Stape JL, Bouillet JP, Gonçalves
JLM, Jourdan C, Nouvellon Y (2013). Dynamics of soil exploration by fine roots down to a
depth of 10m throughout the entire rotation in Eucalyptus grandis plantations. Frontiers in
Plant Science published: 09 July 2013 doi: 10.3389/fpls.2013.00243.
142
Laclau JP, Ranger J, de Moraes Gonçalves JLM, Maquere V, Krusche AV, M’Bou AT (2010).
Biogeochemical cycles of nutrients in tropical Eucalyptus plantations: main features shown by
intensive monitoring in Congo and Brazil. Forest Ecology and Management 259: 1771-1785.
Laclau JP, Ranger J, Deleporte P, Safou-Matondo R, Bouillet JP (2007). Modifications of the
biogeochemical cycles of nutrients in savanna after afforestation with eucalypts. Anais do VIII
Congresso de Ecologia do Brasil, 23 a 28 de Setembro de 2007, Caxambu – MG.
Laclau JP, Ranger J, Deleporte P, Nouvellon Y, Saint-André L, Marlet S, Bouillet JP (2005).
Nutrient cycling in a clonal stand of Eucalyptus and an adjacent savanna ecosystem in Congo.
3. Input–output budgets and consequences for the sustainability of the plantations. For. Ecol.
Manage. 210:375-391.
Laclau JP, da Silva EA, Lambias GR, Bemoux M, Maire G, Stape JL, Bouillet JP, Gonçalves
GLM, Jourdan C, Nouvellon Y (2003). Dynamics of soil exploration by fine roots down to a
depth of 10 cm throughout the entire rotation in Eucalyptus grandis plantation. Front in Plant
Science 4: 1-12.
Ladiges PY (1974). Variation in drought tolerance in Eucalyptus viminalis Labill. Australian
Journal of Botany 22: 489-500.
Lambert MC, Ung CH, Rautier F (2005). Canadian national tree above ground biomass equations.
Canadian Journal of Forestry Research 35: 1996-2018.
Landsberg JJ, Waring RH (1997). A generalised model of forest productivity using simplified
concepts of radiation-use efficiency, carbon balance and partitioning. Forest Ecology
Management 95: 209-228.
Lange D (1998). Europe's medicinal and aromatic plants: their use, trade and conservation.
TRAFFIC International, Cambridge.
Lange D, Schippmann U (1997). Trade survey of medicinal plants in Germany. A contribution to
international plants species conservation. Bonn-Bad Godesberg, Germany.
Lane PNJ, Morris J, Zhang N, Zhou G, Zhou G, Xu D (2004). Water balance of tropical eucalypt
plantations in south-eastern China. Agriclture Forestry Meteorology 124: 253–267.
Le Maitre DC, Gush MB, Dzikiti S (2015). Review. Impacts of invading alien plant species on
water flows at stand and catchment scales. AoB PLANTS 7: plv043; doi:10.1093
/aobpla/plv043.
Le Maire G, Nouvellon Y, Christina M, Ponzoni FJ, Gonçalves JLM, Bouillet J-P, Laclau J-P
(2013). Tree and stand light use efficiencies over a full rotation of single- and mixed-species
Eucalyptus grandis and Acacia mangium plantations. Forest Ecology and Management 288:31-
42.
Le Maire G, Marsden C, Verhoef W, Ponzoni FJ, Seen DL, Begue A, Stape-L, Nouvellon Y
(2011). Leaf area index estimation with MODIS reflectance time series and model inversion
during full rotations of Eucalyptus plantations. Remote Sensing Environment 115: 586-599.
Le Maitre DC (2004). Predicting invasive species impacts on hydrological processes: the
consequences of plant physiology for landscape processes. Weed Technology 18:1408-1410.
Le Maitre DC, van Wilgena BW, Gelderbloma CM, Bailey C, Chapman RA, Nel JA (2002).
Invasive alien trees and water resources in South Africa: case studies of the costs and benefits
of management. Forest Ecology and Management 160:143-159.
Lehmann J (2003). Subsoil root activity in tree-based cropping systems. Plant and Soil 255: 319–
331.
Lemenih M (2004). Effects of land use change on soil quality and native flora degradation and
restoration in the highlands of Ethiopia. PhD dissertation. ISSN 1401-6230, ISBN 91-576-
6540-0, Swedish University of Agricultural Sciences, Department of Forest Soils, Uppsala.
Lemma B, Kleja DB, Nilsson I, Olsson M (2006). Soil carbon sequestration under different exotic
tree species in the southwestern highlands of Ethiopia. Geoderma, 136:886–898.
Lilienfein J, Wilcke W, Ayarza MA, Vilela L, Lima SC, Zech W (2000). Soil acidification in
Pinus carribaea forests on Brazilian savanna Oxisols. Forest Ecology and Management 128:
145-157.

143
Lima WP, Zakia MJB (2006). As florestas plantadas e a água – implementando o conceito da
microbacia hidrográfica como unidade de planejamento. BR: RiMa Editora, São Carlos.
Lin Y, Berger U, Grimm V, Huth F, Weiner J (2013). Plant interactions alter the predictions of
metabolic scaling theory. PLoS ONE 8, e57612.
Lin KC, Ma FC, Tang SL (2001). Allometric equations for predicting the above ground biomass
of tree species in the Fusham Forest. Taiwanian Journal of Forest Science 16: 143-151.
Lisanework N, Michele A (1993). Allelopathy in agroforestry systems: the effects of leaf extracts
of Cupressus lusitanica and three Eucalyptus spp. on four Ethiopian crops. Agroforestry
Systems 21: 63-74.
Lisuma JB, Semoka JMR, Semu E (2006). Maize yield response and nutrient uptake after
micronutrient application on a volcanic soil. Agronomy Journal. 98: 402-406.
Litton CM (2008). Allometric Models for Predicting Aboveground Biomass in Two Widespread
Woody Plants in Hawaii. Biotropica 40: 313–320.
Long AJ, Nair PKR (1999). Tree outside forests: agro-, community, and urban forestry. New
Forests 17135–174
Lorentz KA, Monigue PJ (2015). Potential invasiveness for Eucalyptus in Florida. Invasive Plant
Science and Management 8:90-97.
Lott JE, Khan AAH, Black CR, Ong CK (2003). Water use in a Grevillea robusta-maize
overstorey agroforestry system in semi-arid Kenya. Forest Ecology and Management 180: 45-
59.
Magcale-Macandog DB, Visco RG, Abucay ER, Garcia LE (2006). Alternative land use options
for Philippine grasslands: A bioeconomic modelling approach using the WaNuLCAS model.
International Symposium Towards Sustainable Livelihoods And Ecosystems In Mountainous
Regions 7-9 March 2006, Chiang Mai, Thailand.
Majaliwa MJG, Tenywa MM, Rao KPC, Musana B, Fungo B, Leblanc B, Mkangya J, Muke K,
Kamugisha R, Luswata KC, Nampijja J, Sebuliba E, Nandozi C, Barasa B, Azanga E,
Nyamwaro SO, Mugabo J, Buruchara R, Oluwole F, Katcho K, Adekunle A (2015). Soil
Fertility in relation to Landscape Position and Land Use/Cover Types: A Case Study of the
Lake Kivu Pilot Learning Site. Advances in Agriculture, Hindawi Publishing Corporation
Volume 2015, Article ID 752936, 8.
Malik RS, Sharma SK (1990). Moisture extraction and crop yield as a function of distance from a
row of Eucalyptus tereticornis. Agroforestry Systems 12: 187-195.
Marc V, Robinson M (2007). The long-term water balance (1972–2004) of upland forestry and
grassland at Plynlimon, mid-Wales, Hydrology of Earth System Science 11: 44-60.
Mary F, Dupraz C, Delannoy E, Liagre F (1998). Incorporating agroforestry practices in the
management of walnut plantations in Dauphine, France: an analysis of farmers’ motivations.
Agroforestry Systems 43:243–256.
Mass JM, Vose JM, Swank WT, Martineez-Yrizar A (1995). Seasonal changes of leaf area index
in a tropical deciduous forest in Mexico. Forest Ecology and Management 74: 171-180.
Mathu W (2011). Forest plantations and woodlots in Kenya. African Forest Forum Working Paper
Series Volume I No. 13. A platform for stakeholders in African forestry. African Forest
Forum.
May FE, Ash JE (1990). An assessment of the allelopathic potential of Eucalyptus. Australian
Journal of Botany 38:245–254.
Mayus M, Van Keulen H, Stroosnijder L (1999). A model of tree-crop competition for windbreak
systems in the Sahel: description and evaluation Agroforestry Systems 43: 183-201.
McConnell, D. J., Dillon, J. L (1997), “Farm management for Asia: a systems approach”, FAO
Rome. pp. xxix+355, ISBN 92-5104077-X. Australian Agricultural and Resource Economics
Society Inc. and Blackwell Publishers Ltd. Oxford, UK.
McDonald RI, Urban DL (2004). Forest edges and tree growth rates in the North Carolina
Piedmont. Ecology 85: 2258-2266.

144
McJannett D, Vertessy R (2000) Effects of thinning on wood production, leaf area index,
transpiration and canopy interception of a plantation subject to drought. Tree Physiology 21:
1001-1008.
MCPFE (2003). State of Europe's forests 2003. MCPFE, Vienna, Austria.
http://www.unece.org/trade/timber/docs/sfm/europe-2003.pdf, cited on 14 October 2015.
MDBC, 1992. Dryland salinity management in the Murray Darling Basin. Murray Darling Basin
Commission, Canberra.
Medhurst JL, Battaglia M, Cherry ML (1999). Allometric relationships for Eucalyptus nitens
(Deane & Maiden) plantations, Trees 14: 91-101.
Melilo JM, Kicklighter D, McGuire A, Peterjohn W, Newkirk K (1995). Global change and its
effects on soil organic carbon stocks. In: Dahlem Conference Proceedings. John Wiley and
Sons, New York, pp 175-189.
Michelsen A, Lisanework N, Friis I, Holst N (1996). Comparisons of understorey vegetation and
soil fertility in plantations and adjacent natural forests in the Ethiopian highlands. Journal of
Applied Ecology 33:627-642.
MINAGRI (2000). Agenda agricole. Ministry of Agriculture and Animal Husbandry, Kigali,
Rwanda.
MINICOFIN (2000). Rwanda Vision 2020, Kigali, Rwanda.
MINEFI-DGTPE (2005). L’énergie et l’eau au Rwanda. Fiche de synthèse. Ambassade de France
au Kenya, Nairobi.
MINERENA (2013). WISDOM Rwanda and Wood-fuels value chain analysis as a basis for a
Rwanda supply master plan for fuelwood and charcoal. Final Report. Department of Forestry
and Nature Conservation, Ministry of Natural Resources, Kigali, Rwanda.
Ministry of Forestry and Mines, MFM (2010). National forestry policy, Kigali, Rwanda.
Misra A, Sharma SD, Khan GH (2003). Improvement in soil physical and chemical properties of
Sodic soil by 3, 6 and 9 years old plantations of Eucalyptus camaldulensis biorejuvenation of
Sodic soils. Forest Ecology and Management 184, 115-124.
Ministry of Forests and Mines (MFM) (2010). National forest policy, Kigali, Rwanda.
MINIRENA/CGIS-NUR (2008) Cartographie des Forêts du Rwanda 2007. Rapport Final,
Volume 1. Ministry of Natural Resources and Environment, Kigali.
MINITERE (2004). National land policy. Ministry of Lands, Environment, Forests, Water and
Mines, Kigali, Rwanda.
Mongi HO and Huxley PA (1979). Soils Research in Agroforestry. ICRAF, Nairobi, Kenya.
Monserud RA, Marshall JD (1999). Allometric crown relations in three northern Idaho conifer
species, Canadian Journal of Forestry Research 29: 521-535.
Molina A, Reigosa MJ, Carballeira A (1991). Release of allelochemical agents from litter,
throughfall, and topsoil in plantation of Eucalyptus globules labill in Spain. Journal of
Chemical Ecology 17:147–160.
Montagnini F, Nair PKR (2004). Carbon sequestration: An underexploited environmental benefit
of agroforestry systems. Agroforestrty Systems 61: 281–295.
Montagnini F, Gonzalez E, Porras C, Rheingans R (1995). Mixed and pure forest plantations in
the humid neotropics: a comparison of early growth, pest damage and establishment costs.
Commonwealth Forestry Review 74: 306-314.
Montagu KD, Dottmer K, Burton CVM, Cowie AL (2005). Developing general allometric
relationships for regional estimates of carbon sequestr5ation – an example using Eucalyptus
pilularis from seven contrasting sites. Forest Ecology and Management 204: 113-127.
Monteith JL, Ong CK, Corlett JE (1991). Microclimate interactions in agroforestry systems.
Forest Ecology and Management 45: 31-44.
Morris JD, Collopy JJ (1999). Water use and salt accumulation by Eucalyptus camaldulensis and
Casuarina cunninghamiana on a site with shallow saline groundwater. Agriculture and Water
Management 39: 205-227.

145
Morris J, Zhang NN, Yang ZJ, Collopy J, Xu DP (2004). Water use by fast growing Eucalyptus
urophylla plantations in southern China. Tree Physiology 24: 1035-1044.
Moser SB, Feil B, Jampatong S, Stamp P (2005). Effects of pre-anthesis drought, nitrogen
fertilizer rate, and variety on grain yield, yield components, and harvest index of tropical
maize. Agriculture Water Management 81: 41–58.
Muberantwari V, Uwumukiza B, Murenzi B, Tuyishime O, Ramuni E, Sallah PYK (2009).
Performance of elite quality protein maize varieties in the mid altitude zone of Rwanda In:
National University of Rwanda Research Commission (ed)., 2009 Annual international
research conference proceedings pp 107-113.
Muchiri MN, Pukkala T, Miina J (2002a) Modelling trees’ effect on maize in the Grevillea
robusta + maize system in Central Kenya. Agroforestry Systems 55: 113-123.
Muchiri MN, Pukkala T, Miina J (2002b) Optimising the management of maize – Grevillea
robusta fields in Kenya. Agroforestry Systems 56: 13–25.
Mukundi J, Parasami K (2011). Impact of eucalyptus plantations on ground water availability in
south Karnataka, India. A paper presented in in the 21st International Congress on Irrigation
and Drainage, 15-23 October 2011, Tehran, Iran.
Murcia C (1995). Edge effects in fragmented forests: implications for conservation. Trees 10: 58-
62.
Murthy IK, Gupta M, Tomar S, Munsi M, Tiwari R, Hegde GT and Ravindranath NH (2013).
Carbon Sequestration Potential of Agroforestry Systems in India. Journal of Earth Science and
Climimate Change 4: 131.
Muthuri CW, Ong CK, Black CR, Ngumi VW, Mati BM (2006). Tree and crop productivity in
Grevillea, Alnus and Paulownia-based agroforestry systems in semi-arid Kenya. Forest
Ecology and Management 212: 23-39.
Mutuo PK, Cadisch G, Albrecht Palm CA and Verchot L (2005). Potential of agroforestry for
carbon sequestration and mitigation of greenhouse gas emissions from soils in the tropics.
Nutrient Cycling in Agroecosystems 71: 43-54.
Munyarugerero G (1985). Projet de Monographie sur les Eucalyptus de Ruhande au Rwanda.
Institut des Sciences Agronomiques du Rwanda, Butare, Rwanda.
Mpyisi, E., Weber, M., Shingiro, E. and S. Loveridge (2003). Changes in Allocation of Land
Holdings, Production and Farm Size in the Rwandan Smallholder Sector over the Period
1984/1990 to 2002. Agricultural Policy Synthesis. Number 6E. Rwanda Food Security
Research Project/ MINAGRI.
Mwakalukwa EE, Meilby H, Treue T (2014). Volume and Aboveground Biomass Models for Dry
Miombo Woodland in Tanzania. International Journal of Forestry Research, Hindawi
Publications Corporation, Volume 2014, Article ID 531256, 11 pages
http://dx.doi.org/10.1155/2014/531256.
Myers BJ, Theiveyanathan S, O’brien ND, Bond DWJ (1996). Growth and water use of
Eucalyptus grandis and Pinus radiata plantations irrigated with effluent. Tree Physiology
16:211-219.
Nair PKR (2012). Carbon sequestration studies in agroforestry systems: a reality-check.
Agroforestry Systems 86: 243-253.
Nair PKR, Buresh RJ, Mugendi DN, Latt CR (1999). Nutrient Cycling in Tropical Agroforestry
Systems: Myths and Science In: Buck, L.E., Lassoie, J.P., Fernandes E.C.M. (eds.), 1999.
Agroforestry in Sustainable Agricultural Systems. CRS Press LLC. New York.
Nair PKR (1989). Agroforestry Systems in the tropics. Kluwer Academic Publishers, the
Netherlands.
Nandi A, Basu PK, Banerjee SK (1991). Modification of some soil properties by Eucalyptus
species. Indian Forester 117: 53-57.
Narrain PN, Singh RK, Sindhwal NS, Joshie P (1998). Agroforestry for soil and water
conservation in the western Himalayan Valley Region of India. 2. Crop and tree production.
Agroforestry Systems 39: 191-203.

146
Navar J (2010). Measurement and assessment methods of forest aboveground biomass: a literature
review and the challenges ahead In: Biomass, M. Momba and F. Bux (eds.), Janeza Trdine,
Rijeka, Croatia, pp. 27–64.
Ndayambaje JD, Mugiraneza T, Mohren GMJ (2014). Woody biomass on farms and in the
landscapes of Rwanda. Agroforestry Systems 88:101-124.
Ndayambaje JD, Heijman WJM, Mohren GMJ (2012). Household determinants of tree planting
on farms in rural Rwanda. Small Scale Forestry 11: 477-508.
Ndayambaje JD, Mohren GMJ (2011). Fuelwood demand and supply in Rwanda and the role of
agroforestry. Agroforestry Systems 83: 303-320.
Nduwamungu J (2011a). Forest plantations and woodlots in Rwanda. African Forest Forum
Working Paper Series Volume I No. 13. A platform for stakeholders in African forestry.
African forestry. African Forest Forum.
Nduwamungu J (2011b). Forest plantations and woodlots in Burundi. Africa Forest Forum
Working Paper Series Volume I No. 13. A platform for stakeholders in African forestry.
African forestry. African Forest Forum.
Nduwamungu J, Munyanziza E, Mukuralinda A, Ndayambaje JD, Gapusi J Ntirugulirwa B,
Mutaganda A, Bambe JC, Gakwerere NE, Bizeye B, Ndizeye G, Ntabana D (2008). Inventaire
des resources ligneuses du Rwanda. Rapport final Vol. II. Institut des Sciences Agronomiques
du Rwanda, Butare, Rwanda.
Newaj R and Dhyani SK (2008). Agroforestry for carbon sequestration: scope and present status.
Indian Journal of Agroforestry 10: 1-9.
Ngaga YM (2011). Forest plantations and woodlots in Tanzania. Africa Forest Forum Working
Paper Series Volume I No. 16. A platform for stakeholders in African forestry. African
forestry. African Forest Forum.
Nichols JD, Bristow M, Vanclay JK (2006). Mixed species plantations: Prospects and challenges.
Forest Ecology and Management 233:383-390.
Nichols JD, Rosemeyer ME, Carpenter FL, Kettler J (2001). Intercropping legume trees with
native timber trees rapidly restores cover to eroded tropical pasture without fertilisation. Forest
Ecology and Management 152 :195-209.
NISR - National Institute of Statistics of Rwanda (2014). Fourth Population and Housing Census,
Rwanda, 2012. Ministry of Finance and Economic Planning, Kigali, Rwanda.
NISR (2012). Population and housing census of 2012. Report on the provisional results. National
institute of statistics. Ministry of Finance and Economic Planning, Kigali, Rwanda.
Nissen TM, Midmore DJ, Cabrera ML (1999). Aboveground and belowground competition
between intercropped cabbage and young Eucalyptus torelliana. Agroforestry Systems 46: 83–
93.
Nouvellon Y, Laclau J-P, Epron D, Kinana A, Mabiala A, Roupsard O, Bonnefond J-M, Le Maire
G, Marsden C, Bontemps J-D, Saint Andre L (2010). Within-stand and seasonal variations of
specific leaf area in a clonal Eucalyptus plantation in the Republic of Congo. Forest Ecology
and Management 259: 1796-1807.
Nosetto MD, Jobbágy EG, Paruelo JM (2005). Land use change and water losses: The case of
grassland afforestation across a soil textural gradient in Central Argentina, Global Change
Biology 11:1101 – 1117.
Nsabimana D, Klemedtson L, Kaplin DA, Wallin G (2009). Soil CO2 flux in six monospecific
forest plantations in Southern Rwanda. Soil Biology and Biochemistry 41: 396-402.
Nsabimana D, Klemedtson L, Kaplin DA, Wallin G (2008). Soil carbon and nutrient
accumulation under forest plantations in southern Rwanda. African Journal of Science and
Technology 2: 142-149.
Nzeyimana I, Hartemink AE, de Graaff J (2013). Coffee farming and soil management in
Rwanda. Outlook on agriculture 42: 47-52.

147
Nyadzi GI, Otsyina RM, Banzi FM, Bakengesa SS, Gama BM, Mbwambo L (2003). Rotational
woodlot technology in northwestern Tanzania: Tree species and crop performance.
Agroforestry Systems 59: 253-263.
O’Connell AM, Grove TS (1999). Eucalypt plantations in south-western Australia. In: Nambiar
EKS, Cossalter C, Tiarks A (eds.), Site Management and Productivity in Tropical Plantation
Forests, Proceedings. ... CIFOR, Pietermaritzburg, Bogor, pp. 53–59.
O’Loughlin E, Nambiar EKS (2001). Plantations, farm forestry and water.
RIRDC/LWA/FWPRDC Publication No. 01/137. Canberra, Australia.
Oballa P, Chagala-Odera E, Wamalwa L, Oeba V, Mutitu E, Mwangi L (2005). The performance
of Eucalyptus hybrid clones and local landraces in various agro-ecological zones in Kenya.
International Service for the acquisition of Agri-Biotechnology Applications (ISAA). Nairobi,
Kenya.
Odhiambo HO, Ong CK, Deans JD, Wilson J, Khan AAH, Sprent JI (2001). Roots, soil water and
crop yield: tree crop interactions in a semi-arid agroforestry system in Kenya. Plant and Soil
235: 221-233, 2001.
Oduol JBA, Hotta K, Shinkai S, Tsuji M (2006). Farm Size and Productive Efficiency: Lessons
from Smallholder Farms in Embu District, Kenya. Journal of the Faculty of Agriculture,
Kyushu University 51: 449–458.
Okalebo JR, Gathua KW, Woomer PL (2002). Laboratory Methods of Soil and Plant Analysis: A
Management of soil fertility in western Kenya 1473 Working Manual, KARI, SSSEA, TSBF,
SACRED Africa, Moi University. Second Edition, Nairobi, Kenya. pp. 128.
Okorio J, Byenkya S, Wajja N, Peden D (1994). Comparative performance of seventeen
upperstorey tree species associated with crops in the highlands of Uganda. Agroforestry
Systems 26: 135-203.
Ojo GJA (1966). Yoruba Culture. University of Ife and London Press, London, UK.
Oliver Y, Lefroy T, Stirzaker R, Davies C, Waugh D (2005). Integrate, segregate or rotate trees
with crops? Measuring the trade-off between yield and recharge control. A report for the
RIRDC/Land & Water Australia/FWPRDC/MDBC. Joint Venture Agroforestry Program.
RIRDC Publication No 04/177, RIRDC Project No UWA-64A. Rural Industries Research and
Development Corporation.
Olson JM (1994). Farmer Responses to land degradation in Gikongoro, Rwanda. PhD thesis,
Geography Department, Michigan State University, East Lansing.
Ong CK, Swallow BM (2003). Water productivity in forestry and agroforestry In: Kijne JW,
Barker R, Molden D (eds.). Water productivity in agriculture: limitations and opportunities for
improvement. CAB International and International Water Management Institute, Sri Lanka
217-228 pp.
Ong CK, Leakey RRB (1999). Why tree–crop interactions in agroforestry appear at odds with
tree–grass interactions in tropical savannahs. Agroforestry Systems 45: 109–129
Ong CK, Kho RM and Raderssma S (2004). Ecological interactions in multispecies
agroecosystems In: Van Noorwijk M, Cadisch G and Ong CK, 2004. Below-ground
interactions in tropical agroecosystems: Concepts and models with multiple plant components.
CAB International, Wallingford, UK.
Ong CK, Deans JD, Wilson J, Mutua J, Khan AAH, Lawsone M (1999.) Exploring below ground
complementarity in agroforestry using sap flow and root fractal techniques. Agroforestry
Systems 44: 87–103.
Ong CK, Black CR, Marshall FM, Corlett JE (1996). Principles of resource capture and utilization
of light and water. pp. 73–158. In: Ong CK and Huxley P (eds.), Tree–Crop Interactions: A
Physiological Approach. CAB International. Wallingford, UK.
Ong CK, Black CR (1994). Complementarity in resource use in intercropping and agroforestry
systems In: Monteith JL, Scott RK and Unsworth MH (eds). Resource capture by crops, pp
255-278, Nottingham University Press, Loughborough, UK.
148
Pacheco RM, Louzada PTC (1991). Development of root system I Eucalyptus grandis-E.
urophylla hybrids. In: Proceedings of the IUFRO Symposium on Intensive Forestry: The Role
of Eucalypts, vol. 1, Durban, South Africa, pp. 569–575.
Palsaniya DR, Tewari RK, Singh R, Yadav RS, Dhyani SK (2010). Farmer: agroforestry land use
adoption interface in degraded agroecosystem of Bundelkhand region, India. Range
Management Agroforestry 31:11–19.
Parrotta JA, Turnbull JW and Jones N (1997). Catalysing native forest regeneration on degraded
tropical lands. Forest Ecology and Management 99: 1-7.
Peden DG, Byeenkya S, Wajja N, Okorio J. (1993). Increased production with Alnus acuminata in
Uganda. Agroforestry Today 5: 5–8.
Peralta MA, Swinton SM (2009). Food vs. wood: dynamic choices for Kenyan smallholders.
Selected paper prepared for presentation at the Agriculture and Applied Economics
Association’s 2009 AAFA &ACCI Joint Annual Meeting, Milwaukee, WI July 26-28, 2009.
Phillips L, Malhi Y, Vinceti B, Baker T, Lewis SL, Higuchi N, Laurance WF, Núñez VP,
Vásquez MR, Laurance SG, Ferreira LV, Stern MM, Brown S, Grace J (2002). Changes in the
biomass of tropical forests: evaluating potential biases. Ecologie Appliques 12: 576–587.
Picard N, Saint-André L, Henry M (2012). Manual for Building Tree Volume and Biomass
Allometric Equations: From Field Measurement to Prediction. FAO, Rome, and CIRAD,
Montpellier 215 pp.
Pinto LFP, Bernardes MS, Stape JL, Fereira ARP (2005). Growth, yield and system performance
simulation of a sugarcane-Eucalyptus interface in a sub-tropical region of Brazil. Agriculture
Ecosystems and Environment 105: 77-86.
Pitt DG, Bell FW (2004). Effects of stand tending on the estimation of above ground biomass of
planted juvenile white spruce. Canadian Journal of Forestry Research 34: 649-658.
Pook EW (1855). Canopy dynamics of Eucalyptus maculata Hook. III. Effects of drought.
Australian Journal of Botany 33:65-79.
Poore M, Fries C (1988). The ecological effects of Eucalyptus. (FAO Forestry Paper). FAO
Forestry Paper No. 59. http://www.fao.org/3/a-an793e.pdf, cited on 3 November 2015.
Prentice IC, Farquhar GD, Fasham MJR, Goulden ML, Heimann M (2001). The carbon cycle and
atmospheric CO2. In: The Third Assessment Report of Intergovernmental Panel on Climate
Change (IPCC). Chapter 3, Cambridge University Press, Cambridge.
Raghavan MS (1960). Genesis and history of the Kumri system of cultivation. In: Proceedings of
the Ninth Silviculture Conference, Dehra Dun, 1956. Forest Research Institute, Dehra Dun,
India.
Radersma S, Ong CK, Coe R (2006). Water use of tree lines: Importance of leaf area and
micrometeorology in sub-humid Kenya. Agroforestry Systems 66: 179-189.
Radersma S, Ong CK (2004) Spatial distribution of root length density and soil water in linear
agroforestry systems in sub-humid Kenya: implications for agroforestry models. Forest
Ecology and Management 188:77-89.
Radersma S (2002). Tree effects on crop growth on a phosphorus-fixing ferrasol. PhD Thesis,
Wageningen University © 90-5808-671-2.
Rejmanek M, Richardson DM (2011). Eucalypts In: Simberloff D, Rejmanek M (Eds.).
Encyclopedia of Biological Invasions pp. 203–209, University of California, Berkeley, Calif,
USA.
Ramovs BV, Roberts MR (2003). Understory vegetation and environment responses to tillage,
forest harvesting, and conifer plantation development. Ecological Applications 13:1682–1700.
Rao MR, Nair PKR, Ong CK (1998). Biophysical interactions in tropical agroforestry systems.
Agroforestry Systems 38: 3–50.
Razakamanarivo RH, Razakavololona A, Razafindrakoto MA, Vieilledent G, Albrecht A (2012).
Below-ground biomass production and allometric relationships of eucalyptus coppice
plantation in the central highlands of Madagascar. Biomass Bioenergy 45: 1-1 0.

149
Reed DD, Tome M (1998). Total aboveground biomass and net dry matter accumulation by plant
component in young Eucalyptus globulus in response to irrigation. Forest Ecology and
Management 103: 21-32.
REMA (2009). Rwanda state of the environment report. Rwanda Environmental Management
Authority, Kigali, Rwanda. Renewables (2015). Global Status Report. Annual Reporting on Renewables: Ten years of
excellence. REN21 Renewable Energy Policy Network for the 21st century.
http://www.ren21.net/wp-content/uploads/2015/07/REN12-GSR2015_Onlinebook_low1.pdf.
Cited on 5 Decener 2015.
Rhoades C, Binkle (1996). Factors influencing decline in soil pH in Hawaiian Eucalyptus and
Albizia plantations. For. Ecol. Manage. 80, 47-56.
Richards AE, Forrester DI, Bauhus J, Scherer-Lorenzen M (2010). The influence of mixed tree
plantations on the nutrition of individual species: a review. Tree Physiology 30:1992-2108.
Riqueiro-Rodriguez A, McAdam J, Mosquera-Losada MR (2009). Definitions and components of
agroforestry practices in Europe In: Riqueiro-Rodriguez A, McAdam J, Mosquera-Losada MR
(eds.). Agroforestry in Europe- Current Status and Future Prospects. Springer, pp 3-20.
Roberts JM, Rosier PTW, Srinivasa MKV (1992). Physiological studies in young Eucalyptus
stands in southern India. In: Calder IR, Hall RL and Adlard PG (eds) Growth and water use of
forest plantations. Wiley, Chichester, pp 226–243.
Robinson N, Harper RJ, Smetten KRJ (2006). Soil water depletion by Eucalyptus spp. Integrated
into dryland agricultural systems. Plant and Soil 286: 141-151.
Rodriguez-Suarez JA, Soto B, Perez R, Diaz-Fierros F(2011). Influence of Eucalyptus globulus
plantation growth on water table levels and low flows in a small catchment. Journal of
Hydrology 396:321-326.
Roose E, Barthes B (2001). Organic matter management for soil conservation and productivity
restoration in Africa: a contribution from Francophone research. Nutr Cycl Agroecosyst 61:
159–170.
Roose E, Ndayizigiye F (1997). Agroforestry, water and soil fertility management to fight erosion
in tropical mountains of Rwanda. Soil Tech 1: 109-1 19.
Rowe EC, van Noordwijk M, Suprayogo D, Cadish G (2005). Nitrogen use efficiency of
monoculture and hedgerow intercropping in the humid tropics. Plant and soil 268: 61-74.
Rushemuka PN, Bock L, Moyo JG (2014). Soil science and agricultural development in Rwanda:
state of the art. A review. Biotechnology, Agronomy, Society and Environment 18: 142-154.
Rutter AJ (1968). Water consumption by forests In: TT Koslowski (ed.). Water deficits and plant
growth Vol II. Plant water consumption and response. New York Academic Press pp 23-84.
Ryan MG, Stape JL, Binkley D, Fonseca S, Loos RA, Takahashi EN, Silva CR, Silva SR,
Hakamada R, Ferreira JM, Lima AMN, Gava JL, Leite FP, Andrade HB, Alves JM, Silva
GGC (2010). Factors controlling Eucalyptus productivity: How water availability and stand
structure alter production and carbon allocation. Forest Ecology and Management 259: 1695-
1703.
Salemi LF, Groppo JD, Trevisan R, Moraes JM, Barros Ferraz SF, Villani JP , Duarte-Neto PJ,
Martinelli LA (2013). Land-use change in the Atlantic rainforest region: Consequences for the
hydrology of small catchments. Journal of Hydrology 499:100-109.
Saint-André L, M’Bou AT, Mabiala A, Mouvondy W, Jourdan C, Rouspard O, Deleporte P,
Hamel O, Nouvellon Y (2005). Age-related equations for above and below ground biomass of
a Eucalyptus hybrid. Forest Ecology and Management 205: 199–214.
Samra JS, Vishwanatham MK, Sharma AR (1999). Biomass production of trees and grasses in a
silvipasture system on marginal lands of Doon Valley of north-west India. Agroforestry
Systems 46: 197–212.
Sanchez PA, Palm CA, Buol SW (2003). Fertility capability soil classification: a tool to help
assess soil quality in the tropics. Geoderma 114: 157-185.
Sanchez P (1995) Science in agroforestry. Agroforestry Systems 30: 5–55.

150
Sang PM, Lamb D, Bonner M, Schimidt S (2013). Carbon sequestration and soil fertility of
tropical tree plantations and secondary forest established on degraded land. Plant and Soil 362:
187-200.
Sangha KK, Jalota RK (2005). Value of ecological services of exotic Eucalyptus tereticornis and
Native Dalbergia sissoo Tree Plantations of North-Western India. Conservation and Society 3:
92 – 109.
Sanou J, Bayala J, Teklehaimanot Z, Bazie´ P (2012). Effect of shading by baobab (Adansonia
digitata) and ne´re´ (Parkia biglobosa) on yields of millet (Pennisetum glaucum) and taro
(Colocasia esculenta) in parkland systems in Burkina Faso, West Africa. Agroforestry Systems
85: 431-441.
Schaller M, Schroth G, Beer J, Jiménez F (2003). Species and site characteristics that permit the
association of fast-growing trees with crops: the case of Eucalyptus deglupta as coffee shade in
Costa Rica. Forest Ecology and Management 75: 205-215.
Schroeder P (1993). Agroforestry systems: integrated land use to store and conserve carbon.
Climate Research 3: 53-60.
Schroth G (1995). Tree root characteristics as criteria for species selection and systems design in
agroforestry. Agroforestry Systems 30: 125-143.
Schumacher FX, Hall FS (1933). Logarithmic expression of timber-tree volume. Journal of
Agricultural Research 47: 719-734.
Scott DF, Lesch W (1997). Streamflow responses to afforestation with Eucalyptus grandis and
Pinus patula and to felling in the Mokobulaan experimental catchments, South Africa. Journal
of Hydrology 199: 360-377.
Scott DF, Bruijnzeel LA & Mackensen J (2004). The hydrological and soil impacts of forestation
in the tropics. In: Forests, Water and People in the Humid Tropics: Past, Present and Future
Hydrological Research for Integrated Land and Water Management In: M. Bonell & L. A.
Bruijnzeel (ed.) (UNESCO International Hydrology Series), Cambridge University Press,
Cambridge, UK. pp 622–651.
Scott DF, Prinsloo FW, Moses G, Mehlomakulu M, Simmers ADA (2000). A re-analysis of the
South African catchment afforestation experimental data,” WRC Report 810/1/00, Water
Research Commission, Pretoria, South Africa.
Senbeta F, Teketay D (2001). Regeneration of indigenous woody species under the canopies of
tree plantations in Central Ethiopia. Tropical Ecology 42(2): 175-185.
Sharma R, Sharma E (1997). Cardamom, mandarin and nitrogen- fixing trees in agroforestry
systems in India’s Himalayan region. I. Litterfall and decomposition. Agroforestry Systems 35:
239-253.
Sheil D (1995). A critique of permanent plot methods and analysis with examples from Budongo
forest, Uganda. Forest Ecology and Management 77: 11–34.
Sheley RR, James JJ (2014). Simultaneous intraspecific facilitation and interspecific competition
between native and annual grasses. J Arid Environ 104 : 80-87.
Shi Z, Xu D, Yang X, Jia Z, Guo H, Zhang N (2012). Ecohydrological impacts of eucalypt
plantations: A review. Journal of Food, Agriculture and Environment 10: 1419-1426.
Silvertooth JC (1999). Row Spacing, Plant Population, and Yield Relationships. Cotton
Agronomist Extension. The University of Arizona.
http://cals.arizona.edu/crop/cotton/comments/april1999cc.html, Cited on 28 October 2015.
Sklenicka, P., Salek, M., 2005. Effects of forest edge on the yield of silage maize (Zea mays L.).
Die Bodenkultur 56, 161-168.
Skolmen RG (1974). Lumber potential of 12-year-old saligna eucalyptus trees in Hawaii. USDA
Forest Service, Research Note PSW-288. Pacific Southwest Forest and Range Experiment
Station, Berkeley, CA. 7 p.
Smethurst PJ, Almeida AC and Loos RA (2014). Stream flow unaffected by Eucalyptus plantation
harvesting implicates water use by the native forest streamside reserve. Journal of Hydrology:
Regional Studies 3: 187-198.

151
Specht A, West PW (2003). Estimation of biomass and sequestered carbon on farm forest
plantations in Northern New South Wales, Australia. Biomass Bioenergy 25: 363-379.
Stape JL, Binkley D, Ryan MG (2004). Eucalyptus production and the supply, use use and
efficiency use of water, light and nitrogen across a geographic gradient in Brazil. Forest
Ecology and Management 193:17-31.
Stanturf JA, Vance ED, Fox TR, Kirst M (2013). Eucalyptus beyond its native range:
environmental issues in exotic bioenergy plantations. Hindawi Publishing Corporation,
International Journal of Forestry Research Volume (2013), Article ID 463030, 5 p.
Stone EL, and Kalisz PJ (1991). On the maximum extent of tree roots. Forest Ecology and
Management 46:59–102.
Steiner KG (1998). Using farmers knowledge in making research results more relevant to field
practice: experiences from Rwanda. Agriculture Ecosystem and Environment 69: 191-200.
Sudmeyer RA, Hall DJM (2015). Competition for water between annual crops and short rotation
mallee in dry climate agroforestry: The case for crop segregation rather than integration.
Biomass and Bioenergy 73: 195-208.
Sudmeyer RA, Speijes J, Nicholas BD (2004). Root distribution of Pinus pinaster, P. radiata,
Eucalyptus globulus and E. kochii and associated soil chemistry in agricultural lands adjacent
to tree lines. Tree Physiology 24: 1333-1346.
Sudmeyer RA, Hall DJM, Eastham J, Adams AM (2002). The tree-crop interface: the effects of
pruning in south-western Australia. Aust. J. Exp. Agric. 42, 763-772.
Tadele D, Teketay D (2014). Growth and yield of two grain crops on sites former covered with
eucalypt plantations in Koga Watershed, northwestern Ethiopia. Journal of Forestry Research
25: 935-940.
Tanaka K, Takizawa H, Tanaka N, Kosaka E, Yoshifuj N, Tantasirin C, Piman S, Suzuki M,
Tangtham N (2003). Transpiration peak over a hill evergreen forest in southern Thailand in the
late dry season: assessing the seasonal changes in evpotranspiration using a multi-layer model.
J Geophy Res 108 (D17), 4533. DOI 10.1029/2002JD003028.
Tang Q, Bao YH, He XB, Zhu B, Zhang XB (2012). Farmer’s adaptive strategies on land
competition between societal outcomes and agroecosystem conservation in the Purplesoiled
Hilly Region, Southwestern China. Journal of Mountain Science 9:77–86.
Tchienkoua M, Zech W (2004). Organic carbon and plant nutrient dynamics under Bosu P,
Cobbinah JR, Nichols JD, Nkrumah EE, Wagner MR (2006). Survival and growth of mixed
plantations of Milicia excelsa and Terminalia superba nine years after planting in Ghana.
Forest Ecology and Management 233:352-357.
Tennant D, Hall D (2001). Improving water use of annual crops and pasture-limitations and
opportunities in Western Australia. Aust. Journal of Agricultural Research 52: 171-181.
Ter-Mikaelian MT, Parker WC (2000). Estimating biomass of white spruce seedlings with vertical
photo imagery. New Forests 20: 145-162.
Thapa S (2007). The relationship between farm size and productivity: empirical evidence from the
Nepalese mid-hills. CIFREM, Faculty of Economics, University of Trento, DECOS,
University of Tuscia. http://mpra.ub.uni-muenchen.de/7638/ MPRA Paper No. 7638, posted
12. March 2008 00:16 UTC. Cited on 10 Dec 2015.
Thorhaug A, Miller B (1986). Endangered tree species in Northern Ethiopia. Environmental
Conservation 13: 71-72.
Tilman D, Isbell F, Cowles JM (2014). Biodiversity and Ecosystem Functioning. Annual Review
of Ecology, Evolution, and Systematics 45: 471-493.
Tittonell P, Corbeels M, van Wijk MT, Vanlauwe B, Giller KE (2007). Targeting nutrient
resources for integrated soil fertility management In: Tittonell P. Targeting resources within
diverse, heterogeneous and dynamic farming systems of East Africa, PhD thesis, Wageningen
University, The Netherlands, pp 159-190.
Torquebiau EF (2000). A renewed perspective on agroforestry concepts and classification. Life
Science 323: 1009-1017.

152
Turnbull JW (1999). Eucalyptus plantations. New Forests17: 37-52.
Turner NC, Schulze E-D, Nicolle D, Schumacher J, Kuhlmann I (2008). Annual rainfall does not
directly determine the carbon isotope ratio of leaves of Eucalyptus species. Physiology of
Plantations 132: 440-445.
Ukozehasi C (2007). Terrace stabilization: niche for producing Alnus nepalensis biomass as green
manure and stakes for bean production in Gicumbi district, Rwanda. MSc thesis.
Unwin GL, Kriedemann PE (2000). Principles and processes of carbon sequestration by trees.
Research and Development Division State Forests of New South Wales Sydney, Australia.
Technical Paper No.64.
Updegraff K, Baughman MJ, Taff SJ (2004). Environmental benefits of cropland conversion to
hybrid poplar: Economic and policy considerations. Biomass Bioenergy 27:411-428.
Van Eijck J, Smeets E, Faaij A (2012). The economic performance of jatropha, cassava and
Eucalyptus production systems for energy in East African smallholder settings. Global
Change in Biology and Bioenergy 4: 828-845.
Van Noordwijk M (1999). Scale effects in crop-fallow rotations. Agroforestry Systems 47: 239-
251.
Van Noordwijk M, Lawson G, Groot JJR and Hairiah K (1996) Root distribution in relation to
nutrients and competition. In: Ong CK and Huxley PA (eds). Tree-Crop Interactions – a
Physiological Approach, pp 319-364. CAB International, Wallingford, UK.
Van Noordwijk M (1991). Rooting depth in cropping systems in the humid tropics in relation to
nutrient use efficiency. Institute for Soil fertility, Haren, The Netherlands.
Van Noordwijk M, Ong CK (1999). Can the ecosystem mimic hypotheses be applied to farms in
African savannahs? Agroforestry Systems 45: 131–158.
Van Noordwijk M, Tata HL, Xu J, Dewi S, Minang PA (2012). Segregate or integrate for
multifunctionality and sustained change through landscape agroforestry involving rubber in
Indonesia and China. In: Nair PK, Garrity D (Eds.), Agroforestry: The Way Forward. Springer,
Dordrecht, the Netherlands, in press.
Vance ED, Loehle C, Wigley TB, Weatherford P (2014). Scientific Basis for Sustainable
Management of Eucalyptus and Populus as Short-Rotation Woody Crops in the U.S. Forests 5:
901-918.
Vanclay JK (2009). Managing water use from forest plantations. Forest Ecology and Management
257: 385-389.
Vandermeer J (1989). The ecology of intercropping. Cambridge, UK. Cambridge University
Press. 237p.
Verdoodt A and van Ranst E (2006). The soil information system of Rwanda: a useful tool to
identify guidelines towards sustainable land management. Africa Focus 19: 69-92.
Vertessy RA, Benyon RG, O’Sullivan SK, Gribben PR (1995). Relationships between stem
diamenter and sapwood area, leaf area and transpiration in a young mountain ash forest. Tree
Physiology 15: 559-567.
Verwijst T, Telenius B (1999). Biomass estimation procedures in short rotation forestry. Forest
Ecology and Management 121: 137–146.
Voicu MF, Comeau PG (2006) Microclimatic and spruce growth gradients adjacent to young
aspen stands. Forest Ecology and Management 221: 13-26.
Vosti S, Whitcover J, Gockowski J, Tomich T, Carpenter CL, Faminow MD, Olivera, Diaw SC
(2000). Working Group on Economic and social indicators: Report on methods for the ASB
best bet matrix, Nairobi: International Centre for Research in Agroforestry and the
Alternatives to Slash-and-Burn Agriculture Programme (ASB). ICRAF, Nairobi, Kenya.
Wajja-Musukwe TN, Wilson J, Sprent J, Ong CK, Deans JD and Okorio J (2008). Tree growth
and management in Ugandan agroforestry systems: effects of root pruning on tree growth and
crop yield. Tree Physiology 28: 233.242.

153
Wang HF, Lencinas MV, Friedman CR, Wang XH, Qiu JX (2010). Understory plant diversity
assessment of Eucalyptus plantations over three vegetation types in Yunnan, China. New
Forest 42:101–116.
Wanvestraut R, Jose S, Nair PKR, Brecke BJ (2004). Competition for water in a pecan–cotton
alley cropping system. Agroforestry Systems 60: 167–179.Warnest B, Sagashya G,
Nkurunziza E (2011) Emerging in a Changing Climate – Sustainable Land Use Management in
Rwanda. TS07F - Task Force on Surveyors and the Climate Change II, 5991. A paper
presented to the seventeenth session of the Conference of the Parties (COP 17) and the seventh
session of the Conference of the Parties serving as the meeting of the Parties to the Kyoto
Protocol (CMP 7) Durban, 6 December 2011.
Warnest B, Sagashya G, Nkurunziza E (2011). Emerging in a Changing Climate – Sustainable
Land Use Management in Rwanda. TS07F - Task Force on Surveyors and the Climate Change
II, 5991. A paper presented to the seventeenth session of the Conference of the Parties (COP
17) and the seventh session of the Conference of the Parties serving as the meeting of the
Parties to the Kyoto Protocol (CMP 7) Durban, 6 December 2011.
Weathers KC, Cadenasso ML, Pickett STA, (1997). The effect of forest edge structure on nutrient
flux: an experimental test. Bulletin of Ecology Society of America 78(4): 205.
Weiner J, Damgaard C ( 2006). Size-asymmetric competition and size asymmetric growth in a
spatially explicit zone-of-influence model of plant competition. Ecological Restoration 21:
702-712.
Weiner J, Thomas SC (1986). Size variability and competition in plant monocultures. Oikos 47:
211-222.
Weiner J, Stoll P, Muller-Landau H, Jasentuliyana A (2001). The effects of density, spatial
pattern, and competitive symmetry on size variation in simulated plant populations. American
Naturalist 158: 438-450.
Wenzel W, Ayisi K, Donaldson G (2000) Importance of harvest index in drought resistance of
sorghum. Journal of Applied Botany 74: 203-205.
White DA, McGrath JF, Ryan MG, Battaglia M, Mendham DS, Kina J, Downes GM, Crombie
DS, Hunt ME (2014). Managing for water-use efficient wood production in Eucalyptus
globulus plantations. Forest Ecology and Management 331: 272–280.
White DA, Battaglia M, Mendham DS, Crombie DS, Kinal J, McGrath FJ (2010). Observed and
modelled leaf area index in Eucalyptus globulus plantations: tests of optimality and
equilibrium hypothesis. Tree Physiology 30: 831-844.
Whitehead D, Beadle CL (2004). Physiological regulation of productivity and water use in
Eucalyptus: a review. Forest Ecology and Management 193: 113-140.
Whitesell CD, Miyasaka SC, Strand RF, Schubert TH, McDuffie KE (1988). Equations for
predicting biomass in 2- to 6-year-old Eucalyptus saligna in Hawaii. Res. Note PSW-RN-402.
Berkeley, CA: U.S. Department of Agriculture, Forest Service, Pacific Southwest Forest and
Range Experiment Station. 5 pp.
Whittock SP, Greaves BL, Apiolaza LA (2004). A cash flow model to compare coppice and
genetically improved seedling options for Eucalyptus globulus pulpwood plantations. Forest
Ecology and Management 191: 267-274.
Wilken GC (1977). Integrating forest and small-scale farm systems in Middle America.
Agroecosystems 3: 291-302.
William RJ, Zerihun A, Montagu KD, Hoffman M, Hutley LL, Chen X (2005). Allometry for
estimating above ground tree biomass in tropical and subtropical eucalypt woodlands: towards
a general predictive equation. Australian Journal of Botany 53: 607-619.
Willey RW (1990). Resource use in intercropping systems. Agriculture Water Management 17:
215–231.
Wojtkowski P (1998). The Theory and Practice of Agroforestry Design. Science Publishers, Inc.
Enfield, New Hampshire, USA, 282 pp.

154
World Food Program (WFP) (2012). Comprehensive food security and vulnerability analysis and
nutrition survey. Rwanda country report. Ministry of Agriculture and Animal Resources,
Kigali, Rwanda.
Woomer PL, Muchena FN (1996). Overcoming soil constraints in crop production in tropical
Africa. African Crop Science Journal 4:503-318.
Wright TE, Tausz M, Kasel S, Volkova L, Merchant A, Bennett LT (2011). Edge type affects
leaf-level water relations and estimated transpiration of Eucalyptus arenacea. Tree Physiology
32: 280-293.
Wullschleger SD, Meinzer FC, Vertessy RA (1998). A review of whole-plant water use studies in
trees. Tree Physiology 18: 499-512.
Xiao X, White EP, Hooten MB, Durham SL (2011). On the use of log transformation vs.
nonlinear regression for analyzing biological power laws. Ecology 92: 1887–1894.
Xue Y (1997). Biosphere feedback on regional climate in tropical north Africa. Quarterly Journal
of the Royal Meteorological Society 123: 1483-1515.
Yan D (2009). Spatial distribution of water use by Eucalyptus plantations in a small catchment in
Guangxi, South China: a modelling and GIS approach. MSc thesis, Department of Forest
Resource Management, University of Helsinki, Sweden, 101 p.
Young A (1997). Agroforestry for Soil Management, 2nd Ed. CAB International, Wallingford,
UK, 320 p.
Yirdaw E. (2002). Restoration of the native woodyspecies diversity, using plantation species as
foster trees, in the degraded highlands of Ethiopia. Tropical Forestry Reports 24. University of
Helsinki, Finland.
Zamora DS, Jose S, Jones JW, Brecke BJ, and Ramsey CL (2008). Interspecific competition in a
pecan-cotton alleycropping system in the southern United States. In: Jose, S. and Gordon,
A.M. (eds.). Toward Agroforestry Design: An Ecological Approach. Springer, NY pp 86-99.
Zerihun K, Kaba U (2011). Agroforestry perspective in land use pattern and farmers coping
strategy: experience from southwestern Ethiopia. World Journal of Agriculture Science 7:73-
77.
Zewdie M, Olsson M, Wervijst T (2009). Aboveground biomass production and allometric
relations of Eucalyptus globulus Labill. Coppice plantations along a chronosequence in the
central highlands of Ethiopia. Biomass Bioenergy 33: 421-428.
Zewdie M (2008). Temporal changes of biomass production, soil properties and ground flora in
Eucalyptus globulus plantations in the central highlands of Ethiopia. Doctoral thesis, Faculty of
Natural Resources and Agricultural Sciences, Swedish University of Agricultural Sciences 74
p.
Zhang L, Dawes WR, Walker GR (2001). Response of mean annual evapotranspiration to
vegetation changes and catchment scale. Water Resources Research 37: pp.701-708.
Zhang L, Dawes WR, Hatton TJ, Hume IH, O’Connell MG, Mitchell DC, Milthorpe PL, Yee M
(1999). Estimating episodic recharge under different crop/pasture rotations in the Mallee
region. 2. Recharge control by agronomic practices. Agriculture and Water Management 42:
237-249.
Zhou Y (2010). Smallholder Agriculture, Sustainability and the Syngenta Foundation. Syngenta
Foundation for Sustainable Agriculture. http://www.syngentafoundation.org/db/1/877.pdf;
cited on 23 November 2015.
Zianis D, Muukkonen P, Mäkipää R, Mencuccini M (2005). Biomass and stem volume equations
for tree species in Europe. Silva Fennica Monograph 4, 63 pp.

155
SUMMARY
Eucalyptus is the most planted Genus in Rwanda, with 69 species growing in Ruhande
Arboretum and 10 species widely grown in plantations and woodlots countrywide. The
species were introduced in the country in early 1900s by the colonial administration, to supply
wood for fuel and for construction. Population pressure resulted in natural forest being greatly
reduced in area, and so people have opted to grow trees on the farm to supply firewood and
charcoal, the primary source of domestic energy for 90% of the population. Farmers obtain
other wood and non-wood forest products from eucalypts and raise some income to sustain
their families. Their intangible benefits such as soil erosion and landslide control are also very
important for environmental conservation. Eucalyptus species are very competitive with crops
and so farmers grow them in woodlots instead of intermixing them with annual crops in the
fields. Farmers’ eucalypt woodlots reflect the settlement pattern and thus are found scattered
over most of the landscape, in a mosaic together with cropped fields. In such a setting the
interaction between woodlot trees and annual crops is unavoidable.
In this thesis I characterise this type of agroforestry system in which eucalypt woodlots
interact with annual crops, by investigating tree–crop interaction and the resultant effects on
crop yield. The effects of edge on both the crop and woodlot trees were quantified and I
evaluated the financial benefits of growing sole crops (annual or woodlot) versus their
combination, and the trade-offs. In addition, water use of the woodlot trees was assessed, to
evaluate the effects on environment at catchment level. An allometric relationship was used to
estimate aboveground tree biomass using measurable tree parameters (DBH and height). The
investigation was structured around four specific objectives: i) To develop a general equation
for the estimation of aboveground tree biomass, applicable to both planted and coppice stands
of Eucalyptus saligna; ii) To quantify the extent to which the competition for environmental
resources manifests itself in maize grain yield and how this varies with distance from
Eucalyptus woodlots along a line perpendicular to the tree–crop interface; iii) To determine
the area of maize field/eucalypt woodlot affected by the edge, and the extent of maize grain
loss or gain in aboveground biomass, and the trade-offs between the two components in an
agroforestry system; and iv) To estimate the water use rate of eucalypt woodlots and compare
this to the local precipitation to learn if eucalypts transpire more water than the rain supplies.
In chapter 2, allometric equations are developed for the estimation of aboveground tree
biomass for both coppice and planted stands of Eucalyptus saligna. This is one of the most
dominant tree species in southern Rwanda, where the study was done. DBH and total tree
height were used as input variables to estimate total tree biomass and tree component (stem,
branch, leaf and bark) biomass, and the best equations were selected. The equations can be
used by different stakeholders to predict tree biomass for different purposes. In addition, they
were used in other chapters of this thesis, as described below.
Chapter 3 is dedicated to investigating the interaction between eucalypt woodlots and maize
(a staple crop in Rwanda) as an example field crop. An experiment was set up in three sites

156
where maize was grown adjacent to selected mature woodlots of E. saligna. Soil was
characterised by measuring soil particle size distribution, soil nutrients (N, P and K) and soil
pH at the beginning of the experiment. Environmental resources of soil water and solar
radiation were assessed three times per season: the beginning, middle and end. This
assessment was done at nine distances (1, 3, 4.5, 7.5, 10.5, 14, 18, 22.5 and 27. 5 m) along a
line perpendicular to the tree–crop interface. The experiment was repeated for three
consecutive seasons: January–May 2007, September–December 2007 and January–May 2008.
Maize growth and grain yield were assessed and related to the spatial variation of
environmental resources in relation to distance from the tree–crop interface. In our
experimental plot of 30 × 12.75 m2, a strip of 10.5 (width) × 12.5 (length) m
2 crop field next
to the woodlot showed a loss in grain yield of 80%. By increasing the crop field to 1 100 ×
100 m2 (1ha) adjoining a woodlot along one side, the seemingly large grain yield loss will
reduce to only 8.4% since the width of the crop field strip prone to the edge effects will
remain constant.
Chapter 4 investigates the effect of the edge on both the maize crop and eucalypt woodlots.
One hectare of land owned by a farmer was assigned to growing sole maize and sole woodlot
and the benefits were compared with those obtained when both maize and woodlot were
combined on the same 1 ha field at varying area proportions occupied by each. Maize and
woodlot yields were quantified and an economic evaluation was made using a net present
value (NPV) approach. A trade-off analysis showed that combining maize and firewood or
pole or timber alternatives was more profitable than only growing maize. A further analysis
was done to compare monetary loss from the maize loss due to competition with the monetary
gain on the tree side obtained as a result of extra tree growth due to the edge effect. Trees in
the outer 8 m zone of the woodlot were observed to grow 17.8% bigger in DBH and 34.5%
more aboveground biomass. Combined maize–wood products were more profitable than the
products from sole systems, and revenue from extra wood gains due to edge effects exceeded
corresponding revenue losses in maize yield. However, land shortage, which is common in
most households, may drive farmers to prioritise crop production to ensure food security.
Again, since small cropped fields suffered more from tree–crop competition than bigger
fields, farmers with large land holdings are likely to adopt eucalypt woodlot–maize
agroforestry systems. Similarly, small woodlots are more prone to the edge effects, and the
edge effect was felt throughout square woodlots with sides 16 m long.
Chapter 5 investigates the water use of eucalypt woodlots, using the tree DBH–leaf area index
allometric relationship. This study was done in two catchments: Butare and Busoro in
southern Rwanda. A monthly water balance was established. The woodlots had small coppice
shoots ranging from 2–36 cm DBH and potential tree transpiration recorded was 3 mm d-1
.
The annual potential tree transpiration was 10% below the local annual precipitation. Dry
months had a water deficit, which could be covered by reductions in seasonal leaf area,
stomatal closure and changes in soil water storage. A sensitivity analysis showed that 50%
leaf area reduction corresponded to a 32.8 mm decline in potential tree transpiration. The
deficit may not impact tree growth negatively, since in dry seasons tree growth. The moderate
eucalypt water use rate observed in this study may be a function of tree size (which was

157
small) and low tree stocking, since such woodlots had less potential transpiration. The
observed eucalypt water use rate is smaller than the range reported for eucalypts in Africa and
was also smaller than that of key annual crops in the study area. Managing woodlots as short
rotations and increasing initial tree spacing may contribute to resolving issues related to
catchment hydrology associated with eucalypt plantations.
Detailed investigations done in this thesis on the role of Eucalyptus and their interaction with
crops lead to the conclusion that the species are very useful agroforestry species for
smallholder farmers, despite the bad name the Genus have acquired. The integration of
Eucalyptus species into agroforestry systems is recommended, under two conditions: i) at
landscape level where, in addition to financially benefitting farmers, the woodlots may serve
to conserve soils against soil erosion and landslides; and ii) at farm level for farmers who own
large areas of land, where total crop yield losses due to tree–crop competition are likely to be
negligible. Segregation or no woodlots at all will clearly be the options for farmers who own
very small areas of land; in their case, crop yield losses are likely to be appreciable and
therefore likely to affect household food security.
Although no evidence of negative effects on the environment was observed in this study,
some precautions (which would be applied whenever growing any exotic tree species) still
need to be taken and the following recommendations are suggested: 1. Plant and manage
Eucalyptus woodlots outside riparian zones to avoid possible impact on water sources 2.
Maintain the current practice of not planting Eucalyptus trees in catchment areas in which the
major rivers arise 3. Maintain small woodlots to avoid possible adverse impacts of large
plantation monocultures reported in the literature 4. Mix Eucalyptus woodlots with other
species (preferably N-fixing), to improve soils and woodlot productivity as well as to allow
for possible improvement of biodiversity 5. Make a better species selection from among
Eucalyptus species to allow for undergrowth development in the woodlots, which may also
improve soil erosion control, especially on very steep sites, as well as biodiversity.
Finally, all-encompassing rather than field-specific, integrated environmental conservation
planning and management by different stakeholders is needed, to develop agricultural
production that is more compatible with the protection of ecosystems and will not impair
farmers’ livelihoods. Different natural resource management fields plan independently and
lack of harmonised, multidisciplinary actions may be part of the cause of problems faced
today.

158

159
PE&RC Training and Education Statement
With the training and education activities listed below the PhD candidate has
complied with the requirements set by the C.T. de Wit Graduate School for
Production Ecology and Resource Conservation (PE&RC) which comprises
of a minimum total of 32 ECTS (= 22 weeks of activities)
Review of literature (6 ECTS)
- Tree-crop interactions and the use of eucalypts in agroforestry
systems (2006)
Writing of project proposal (4.5 ECTS)
- The use of Eucalyptus in agroforestry systems of Southern Rwanda: to integrate or segregate? (2006)
Post-graduate courses (3.0 ECTS)
- Analysing farming systems and rural livelihoods in a changing world: vulnerability and adaptation
competencies for integrated agricultural research; PE&RC/GERS-UZ (2008)
Laboratory training and working visits (3.0 ECTS)
- Soil and plant analysis; National University of Rwanda (NUR) (2007)
Deficiency, refresh, brush-up courses (7.5 ECTS)
- Research methods; ENP Group (2006)
- Basic statistics; PE&RC (2006)
Competence strengthening / skills courses (1.9 ECTS)
- PhD Competence assessment; WGS (2006)
- Information literacy and introduction to Endnote; WGS (2008)
- Mobilizing your scientific networking; WGS (2015)
PE&RC Annual meetings, seminars and the PE&RC weekend (1.5 ECTS)
- PE&RC Weekend first year (2006)
- PE&RC Day (2006)
- PE&RC Weekend final year (2015)
Discussion groups / local seminars / other scientific meetings (7.3 ECTS)
- Group discussions at FEM and FNP groups (2006, 2009, 2015)
- PhD Students discussion groups at the NUR (2007-2009)
- Annual national scientific meetings at the NUR (2007-2015)
International symposia, workshops and conferences (8 ECTS)
- International workshop on agroforestry and soil management; oral and three poster presentations;
National University of Rwanda and Wageningen University, Butare, Rwanda (2008)
- First global workshop on improving forestry education in Africa; oral presentation; International
Partnership for Forestry Education (IPFE) (2007)
- Workshop on biodiversity conservation in the Albertine Rift Region; oral presentation; Conservation
Educators of the Albertine Rift (RNCEAR), Makerere University, Kampala, Uganda (2009)
Lecturing / supervision of Practical’s / tutorials (13.2 ECTS)
- Multiple-purpose tree management (2006-2010)
- Agroforestry systems (2006-2010)
Supervision of MSc students
- Maize-Eucalyptus competition for soil water in Southern Rwanda
- Water consumption of Eucalyptus trees in Rwanda – an estimation based on leaf area
- Nutrient uptake by maize and Eucalyptus trees in an agroforestry system in Southern Rwanda
- Terrace stabilization: niche for producing Alnus nepalensis biomass as green manure and stakes for
bean production in Gicumbi district, Rwanda

160

161
CURRICULUM VITAE
Canisius Patrick Mugunga was born in Kagera, Tamnzania on 28 April 1964. After
completing secondary education, he joined a forestry training institute in Olotonyi, Arusha,
Tanzania, where he obtained a Diploma in forestry in 1990. He joined Sokoine University of
Agriculture in Morogoro, Tanzania where he obtained his first degree in forestry in 1994. He
was employed as an assistant research officer by “Institut des Sciences Agronomiques du
Rwanda, (ISAR)” from 1995 to 2005. He undertook Master studies at Stellenbosch University
in Cape Town, South Africa, where he obtained a master’s degree in forestry. During this
period, he held different positions and responsibilities. He was the manager of a national tree
seed centre and the National Designated Authority for the control of Forestry Reproductive
Material moving in International Trade in the Organisation for Economic Cooperation and
Development (OECD) Scheme from 1995-2004. From 2000-2004 he headed a Sida Salec
sponsored National Plant Genetic Resources programme which worked in 10 eastern African
countries. This post automatically rendered him two other designations namely: a National
Focal Point for the International Plant Genetic Resources Institute (IPGRI) and country
representative in the Eastern African Plant Genetic Resources Network (EAPGREN) and
member of EAPGREN’s Regional Steering Committee. From February 2004 - March 2005,
he was the head of Nyagatare research station in ISAR. From 2005 to date, he is a lecturer at
the University of Rwanda in the department of Forestry and Nature Conservation. He has
pursued a PhD in Agroforestry at Wageningen University from 2006 to 2016, a period during
which he was also doing his teaching at the home university.

162
The research described in this thesis was financially supported by the Netherlands
Organization for International Cooperation in Higher Education (NUFFIC) through a joint
project (NPT/RWA/061) between Wageningen University and the University of Rwanda.