the u.s. soybean export council quick facts
TRANSCRIPT
The U.S. Soybean Export Council
QUICK FACTS
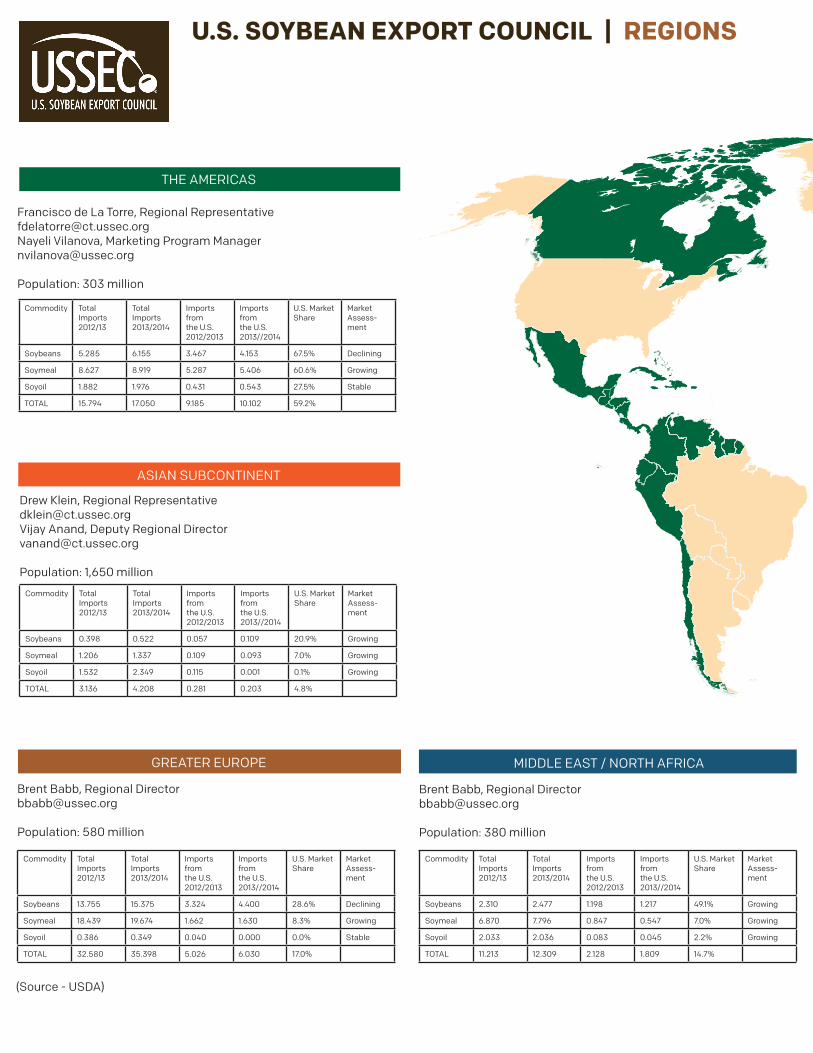
MIDDLE EAST / NORTH AFRICAGREATER EUROPE
THE AMERICAS
ASIAN SUBCONTINENT
Francisco de La Torre, Regional [email protected] Vilanova, Marketing Program [email protected]
Population: 303 million
Brent Babb, Regional [email protected]
Population: 380 million
Drew Klein, Regional [email protected] Anand, Deputy Regional [email protected]
Population: 1,650 million
Brent Babb, Regional [email protected]
Population: 580 million
U.S. SOYBEAN EXPORT COUNCIL | REGIONS
Commodity Total Imports 2012/13
Total Imports 2013/2014
Imports from the U.S. 2012/2013
Imports from the U.S. 2013//2014
U.S. Market Share
Market Assess-ment
Soybeans 2.310 2.477 1.198 1.217 49.1% Growing
Soymeal 6.870 7.796 0.847 0.547 7.0% Growing
Soyoil 2.033 2.036 0.083 0.045 2.2% Growing
TOTAL 11.213 12.309 2.128 1.809 14.7%
Commodity Total Imports 2012/13
Total Imports 2013/2014
Imports from the U.S. 2012/2013
Imports from the U.S. 2013//2014
U.S. Market Share
Market Assess-ment
Soybeans 13.755 15.375 3.324 4.400 28.6% Declining
Soymeal 18.439 19.674 1.662 1.630 8.3% Growing
Soyoil 0.386 0.349 0.040 0.000 0.0% Stable
TOTAL 32.580 35.398 5.026 6.030 17.0%
Commodity Total Imports 2012/13
Total Imports 2013/2014
Imports from the U.S. 2012/2013
Imports from the U.S. 2013//2014
U.S. Market Share
Market Assess-ment
Soybeans 0.398 0.522 0.057 0.109 20.9% Growing
Soymeal 1.206 1.337 0.109 0.093 7.0% Growing
Soyoil 1.532 2.349 0.115 0.001 0.1% Growing
TOTAL 3.136 4.208 0.281 0.203 4.8%
Commodity Total Imports 2012/13
Total Imports 2013/2014
Imports from the U.S. 2012/2013
Imports from the U.S. 2013//2014
U.S. Market Share
Market Assess-ment
Soybeans 5.285 6.155 3.467 4.153 67.5% Declining
Soymeal 8.627 8.919 5.287 5.406 60.6% Growing
Soyoil 1.882 1.976 0.431 0.543 27.5% Stable
TOTAL 15.794 17.050 9.185 10.102 59.2%
(Source - USDA)

NORTH ASIA SOUTHEAST ASIA
Timothy Loh, Regional [email protected]
Population: 636 million
Paul Burke, Regional [email protected]
Population: 1,550 million
U.S. SOYBEAN EXPORT COUNCIL | REGIONS
Commodity Total Imports 2012/13
Total Imports 2013/2014
Imports from the U.S. 2012/2013
Imports from the U.S. 2013//2014
U.S. Market Share
Market Assess-ment
Soybeans 5.571 6.15 3.162 3.524 57.30% Growing
Soymeal 12.489 13.372 1.462 1.995 14.91% Growing
Soyoil 0.226 0.236 0.015 0.007 2.97% Stable
TOTAL 18.286 19.758 4.639 5.581 28.25%
Commodity Total Imports 2012/13
Total Imports 2013/2014
Imports from the U.S. 2012/2013
Imports from the U.S. 2013//2014
U.S. Market Share
Market Assess-ment
Soybeans 66.112 76.881 24.538 31.413 40.9% Growing
Soymeal 3.509 3.902 0.389 0.442 11.3% Growing
Soyoil 1.862 1.776 0.263 0.198 11.1% Stable
TOTAL 71.483 82.559 25.190 32.053 38.8%

OUR VISION: Soy for a growing world
OUR MISSION: Maximize the use of U.S. soy internationally by meeting the needs of our stakeholders and global customers.
STRATEGY: Create a preference for U.S. soy by building and maintaining relationships through trade and technical services.
STRATEGY FLOWS DOWN
PARENTS AND FUNDING SOURCESUnited Soybean Board
QSSBsAmerican Soybean Association
Foreign Agricultural Service
USSECReview and update of our previous strategy
Members and IndustryOther Cooperators
GLOBAL UTILIZATION PLANSAqua
AnimalHuman
Market access
REGIONAL STRATEGIESAmericas
Asian SubcontinentEurope
Middle East / North AfricaNorth Asia
Southeast Asia
PROGRAMS, PROJECTS AND ACTIVITIESMarket AccessTrade Services
Technical Services
RESULTS FLOW UP
U.S. SOYBEAN EXPORT COUNCIL | STRATEGIC PLAN AND GOALS
2015 STRATEGIC GOALS: 1. Resolve our customers’ market access challenges through trade services, collaboration, and leveraging within the soy value chain.
2. Collaborate with the importers and exporters of soy to create a preference for U.S. soy in the markets in which we have a competitive advantage.
3. Meet our customers’ technical services needs by leveraging market access and technology advances.
# Projects
Budget ($) Anticipated Investment Rate
USB 100 $26,882,438
FMD 20 $6,976,305
MAP 21 $4,898,679
ALL 141 $38,757,422 90-95%
CURRENT PROJECT SUMMARY
The above table does not include Attachment C.
U.S. SOY INDUSTRY QSSBs
TRADE SERVICES
TECHNICAL SERVICES
MARKET ACCESS
MANAGEMENT, REPORTING & EVALUATION