the u.s. generic & biosimilar medicines savings report
TRANSCRIPT
The U.S. Generic & Biosimilar Medicines Savings ReportO C T O B E R 2 0 2 1
IntroductionLetter from the President and CEOLetter from the Biosimilars Council Executive DirectorYour Generics and Biosimilars Industry
Combined SavingsTopline FindingsSavings From Generics and Biosimilars
Generic SavingsPercent of U.S. Drug SpendAnnual Savings Savings by ProductSavings by StateSavings by Payment TypeSavings by AgeSavings by Patient ConditionAverage Primary Copay
COVID-19Generic Supply Chain Proves Resilient
Biosimilar SavingsApprovalsMarket LandscapeEstimated SavingsAnnual Saving by TypeAccessible Market OpportunityOncologyAutoimmune Brand Exclusivity ExpiryBiosimilars Adoption
MethodologyContact Us
The U.S. Generic & Biosimilar Medicines Savings ReportO C T O B E R 2 0 2 1
3
4
5
6
7
8
9
10
11
12
13
14
15
17
18
19
20
21
22
23
24
25
26
27
29
Letter from the President and CEO
Rising Savings, Expanding OpportunityTens of Millions of Americans Entrust Their Health to Generics and Biosimilars
In the United States, 76 million patients took at least one prescription medicine in 2020. The doctors ordering these prescriptions and the pharmacists filling them recognize that FDA-approved generics and biosimilars are just as safe and effective as their brand-name counterparts. As this report demonstrates, savings for individual consumers and the health care system as a whole continue to grow, reaching $338 billion in 2020.
Throughout the pandemic, U.S. patients and their families have been able to count on their prescription drugs to keep them healthy and productive. Generic and biosimilar manufacturers have worked tirelessly to ensure Americans have access to the medicines they need.
The data in this report tell a public health success story of resilience and innovation. On behalf of all the manufacturers and organizations that belong to AAM, I thank the men and women who have gone the extra mile to make these savings possible.
Dan LeonardCEO, Association for Accessible Medicines
I N T R O D U C T I O N
AAM / THE U.S. GENERIC & BIOSIMILAR MEDICINES SAVINGS REPORT 20213
Letter from the Biosimilars Council Executive Director
Biosimilars Means Savings for Patients with Cancer and Other Illnesses in the U.S.Over $12.6 Billion in Savings Since 2011
In the U.S., the safe, effective alternative versions of existing biologic medicines known as biosimilars have been used in more than 121 million days of patient therapy. They have resulted in almost 10 million additional days of care, fulfilling their promise of expanding patient access. As with small-molecule generic drugs, biosimilars depend on a competitive marketplace in order to deliver savings to patients and to the health care system.
I am encouraged by recent progress as shown in this report. Two oncology biosimilars, for example, launched in late 2019 and soon gained market share. Over the next five years, biosimilars are projected to yield $133 billion in savings.
The promise of biosimilars is coming into view, but it won’t be fully realized until more policymakers and physicians understand the value proposition of these FDA-approved treatments for acute and chronic conditions. The Biosimilars Council is dedicated to advocacy, education and collaboration to increase accessibility and, therefore, savings.
Christine SimmonExecutive Director, Biosimilars Council
I N T R O D U C T I O N
AAM / THE U.S. GENERIC & BIOSIMILAR MEDICINES SAVINGS REPORT 20214
Your Generics and Biosimilars Industry
Health is the foundation for everything in life.Healthy people are better able to reach their full potential.
• Generics and biosimilars help more people live healthier and longer. The Association for Accessible Medicines (AAM) works to make generic and biosimilar medicines more accessible to more people who need them. AAM improves access to safe, quality and effective medicines.
• Generic pharmaceutical companies manufacture the medicines used in 9 out of every 10 prescriptions dispensed in the United States. Our members form an integral and powerful part of the health care system.
• The Biosimilars Council, a division of AAM, works to ensure a positive regulatory and policy environment for biosimilar products and educates the public, providers and patients about the safety and effectiveness of biosimilar medicine.
I N T R O D U C T I O N
AAM / THE U.S. GENERIC & BIOSIMILAR MEDICINES SAVINGS REPORT 20215
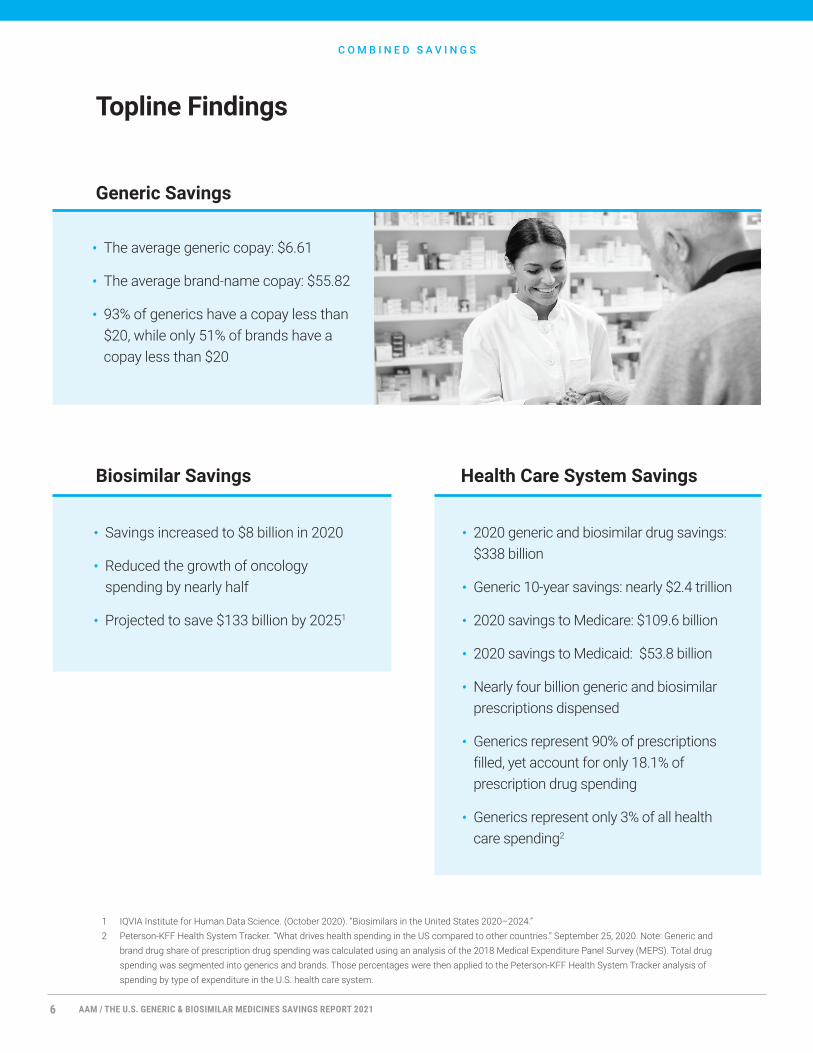
Topline Findings
C O M B I N E D S A V I N G S
• The average generic copay: $6.61
• The average brand-name copay: $55.82
• 93% of generics have a copay less than $20, while only 51% of brands have a copay less than $20
• Savings increased to $8 billion in 2020
• Reduced the growth of oncology spending by nearly half
• Projected to save $133 billion by 20251
• 2020 generic and biosimilar drug savings: $338 billion
• Generic 10-year savings: nearly $2.4 trillion
• 2020 savings to Medicare: $109.6 billion
• 2020 savings to Medicaid: $53.8 billion
• Nearly four billion generic and biosimilar prescriptions dispensed
• Generics represent 90% of prescriptions filled, yet account for only 18.1% of prescription drug spending
• Generics represent only 3% of all health care spending2
Generic Savings
Biosimilar Savings Health Care System Savings
1 IQVIA Institute for Human Data Science. (October 2020). “Biosimilars in the United States 2020–2024.”2 Peterson-KFF Health System Tracker. “What drives health spending in the US compared to other countries.” September 25, 2020. Note: Generic and
brand drug share of prescription drug spending was calculated using an analysis of the 2018 Medical Expenditure Panel Survey (MEPS). Total drug spending was segmented into generics and brands. Those percentages were then applied to the Peterson-KFF Health System Tracker analysis of spending by type of expenditure in the U.S. health care system.
AAM / THE U.S. GENERIC & BIOSIMILAR MEDICINES SAVINGS REPORT 20216
• Generic drugs contain the same active ingredients at the same strength and purity as their brand-name counterparts but come at a fraction of the cost.
• Likewise, biosimilars are lower-cost versions of costly biologic medicines and are approved by FDA as highly similar to and with no clinically meaningful differences from an existing FDA-approved reference product.
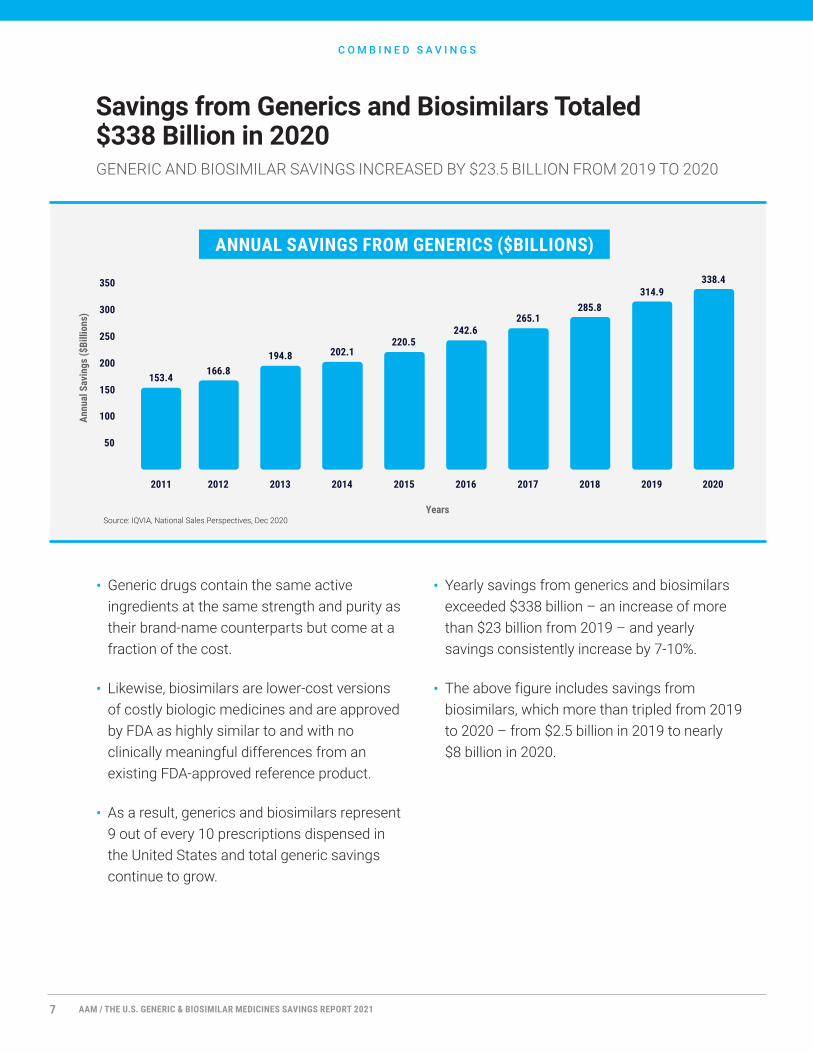
• As a result, generics and biosimilars represent 9 out of every 10 prescriptions dispensed in the United States and total generic savings continue to grow.
• Yearly savings from generics and biosimilars exceeded $338 billion – an increase of more than $23 billion from 2019 – and yearly savings consistently increase by 7-10%.
• The above figure includes savings from biosimilars, which more than tripled from 2019 to 2020 – from $2.5 billion in 2019 to nearly $8 billion in 2020.
Savings from Generics and Biosimilars Totaled $338 Billion in 2020GENERIC AND BIOSIMILAR SAVINGS INCREASED BY $23.5 BILLION FROM 2019 TO 2020
Source: IQVIA, National Sales Perspectives, Dec 2020
C O M B I N E D S A V I N G S
IN MOST POPULOUS STATE, GENERICS ARE LOWEST COST DRIVER
ANNUAL SAVINGS FROM GENERICS ($BILLIONS)
153.4166.8
194.8 202.1220.5
242.6265.1
285.8314.9
338.4
50
100
150
200
250
300
350
2011 2012 2013 2014 2015 2016 2017 2018 2019 2020
Annu
al S
avin
gs ($
Billi
ons)
Years
AAM / THE U.S. GENERIC & BIOSIMILAR MEDICINES SAVINGS REPORT 20217
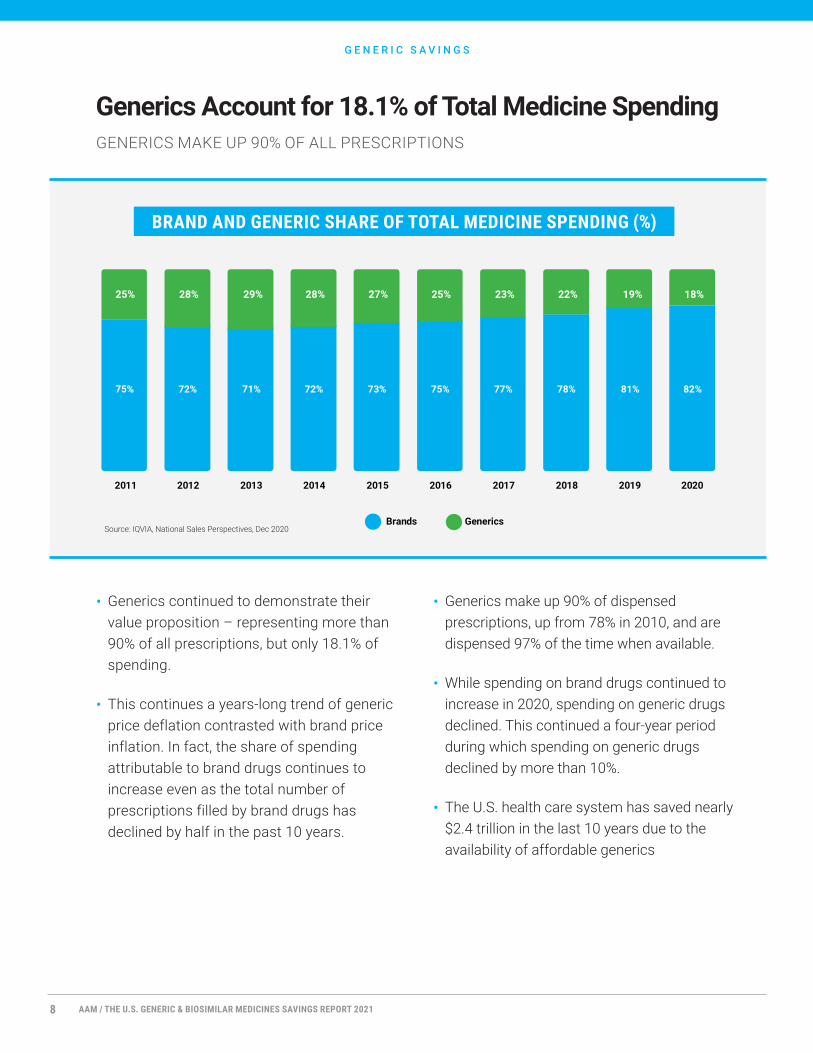
• Generics continued to demonstrate their value proposition – representing more than 90% of all prescriptions, but only 18.1% of spending.
• This continues a years-long trend of generic price deflation contrasted with brand price inflation. In fact, the share of spending attributable to brand drugs continues to increase even as the total number of prescriptions filled by brand drugs has declined by half in the past 10 years.
• Generics make up 90% of dispensed prescriptions, up from 78% in 2010, and are dispensed 97% of the time when available.
• While spending on brand drugs continued to increase in 2020, spending on generic drugs declined. This continued a four-year period during which spending on generic drugs declined by more than 10%.
• The U.S. health care system has saved nearly $2.4 trillion in the last 10 years due to the availability of affordable generics
Generics Account for 18.1% of Total Medicine SpendingGENERICS MAKE UP 90% OF ALL PRESCRIPTIONS
G E N E R I C S A V I N G S
Source: IQVIA, National Sales Perspectives, Dec 2020
BRAND AND GENERIC SHARE OF TOTAL MEDICINE SPENDING (%)
75% 72% 71% 72% 73% 75% 77% 78% 81% 82%
2011 2012 2013 2014 2015 2016 2017 2018 2019 2020
Brands Generics
25% 28% 29% 28% 27% 25% 23% 22% 19% 18%
AAM / THE U.S. GENERIC & BIOSIMILAR MEDICINES SAVINGS REPORT 20218
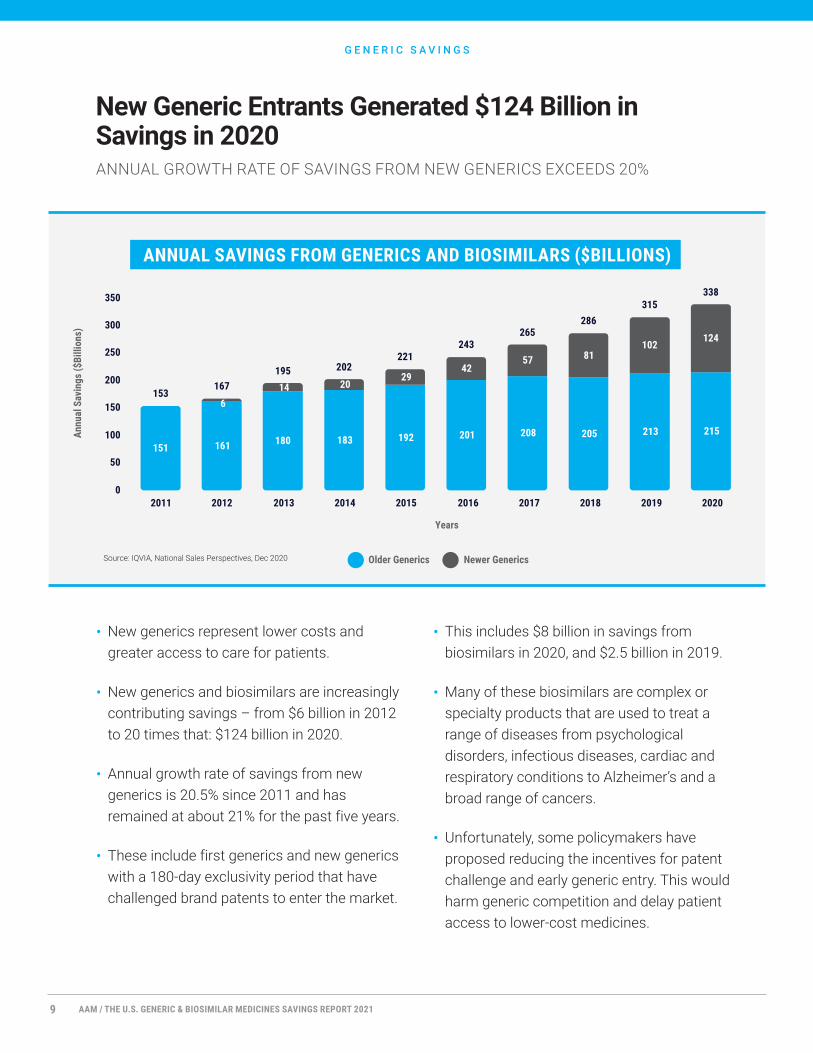
• New generics represent lower costs and greater access to care for patients.
• New generics and biosimilars are increasingly contributing savings – from $6 billion in 2012 to 20 times that: $124 billion in 2020.
• Annual growth rate of savings from new generics is 20.5% since 2011 and has remained at about 21% for the past five years.
• These include first generics and new generics with a 180-day exclusivity period that have challenged brand patents to enter the market.
• This includes $8 billion in savings from biosimilars in 2020, and $2.5 billion in 2019.
• Many of these biosimilars are complex or specialty products that are used to treat a range of diseases from psychological disorders, infectious diseases, cardiac and respiratory conditions to Alzheimer’s and a broad range of cancers.
• Unfortunately, some policymakers have proposed reducing the incentives for patent challenge and early generic entry. This would harm generic competition and delay patient access to lower-cost medicines.
New Generic Entrants Generated $124 Billion in Savings in 2020ANNUAL GROWTH RATE OF SAVINGS FROM NEW GENERICS EXCEEDS 20%
Source: IQVIA, National Sales Perspectives, Dec 2020
G E N E R I C S A V I N G S
ANNUAL SAVINGS FROM GENERICS AND BIOSIMILARS ($BILLIONS)
151 161 180 183 192 201 208 205 213 215
614 20
2942
57 81102
124
153167
195 202221
243265
286315
338
0
50
100
150
200
250
300
350
2011 2012 2013 2014 2015 2016 2017 2018 2019 2020
Annu
al S
avin
gs ($
Billi
ons)
Years
Older Generics Newer Generics
AAM / THE U.S. GENERIC & BIOSIMILAR MEDICINES SAVINGS REPORT 20219
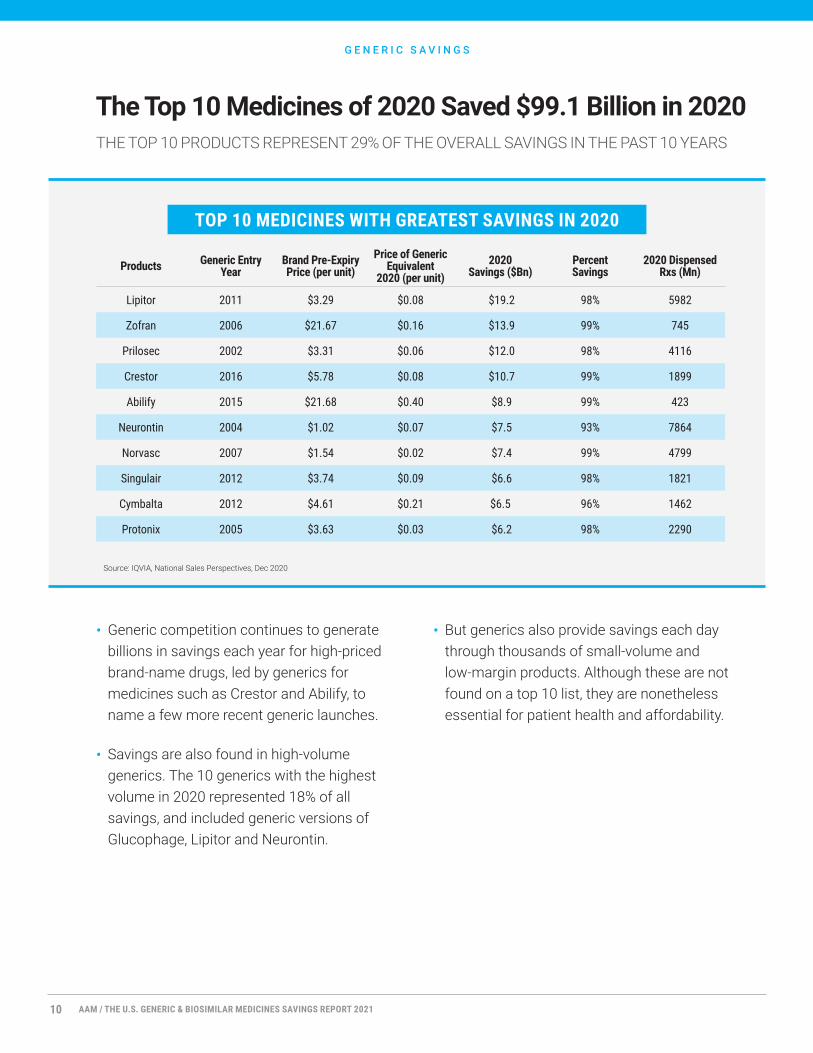
• Generic competition continues to generate billions in savings each year for high-priced brand-name drugs, led by generics for medicines such as Crestor and Abilify, to name a few more recent generic launches.
• Savings are also found in high-volume generics. The 10 generics with the highest volume in 2020 represented 18% of all savings, and included generic versions of Glucophage, Lipitor and Neurontin.
• But generics also provide savings each day through thousands of small-volume and low-margin products. Although these are not found on a top 10 list, they are nonetheless essential for patient health and affordability.
The Top 10 Medicines of 2020 Saved $99.1 Billion in 2020 THE TOP 10 PRODUCTS REPRESENT 29% OF THE OVERALL SAVINGS IN THE PAST 10 YEARS
G E N E R I C S A V I N G S
Source: IQVIA, National Sales Perspectives, Dec 2020
TOP 10 MEDICINES WITH GREATEST SAVINGS IN 2020
Products Generic Entry Year
Brand Pre-Expiry Price (per unit)
Price of Generic Equivalent
2020 (per unit)2020
Savings ($Bn)Percent Savings
2020 Dispensed Rxs (Mn)
Lipitor 2011 $3.29 $0.08 $19.2 98% 5982
Zofran 2006 $21.67 $0.16 $13.9 99% 745
Prilosec 2002 $3.31 $0.06 $12.0 98% 4116
Crestor 2016 $5.78 $0.08 $10.7 99% 1899
Abilify 2015 $21.68 $0.40 $8.9 99% 423
Neurontin 2004 $1.02 $0.07 $7.5 93% 7864
Norvasc 2007 $1.54 $0.02 $7.4 99% 4799
Singulair 2012 $3.74 $0.09 $6.6 98% 1821
Cymbalta 2012 $4.61 $0.21 $6.5 96% 1462
Protonix 2005 $3.63 $0.03 $6.2 98% 2290
AAM / THE U.S. GENERIC & BIOSIMILAR MEDICINES SAVINGS REPORT 202110
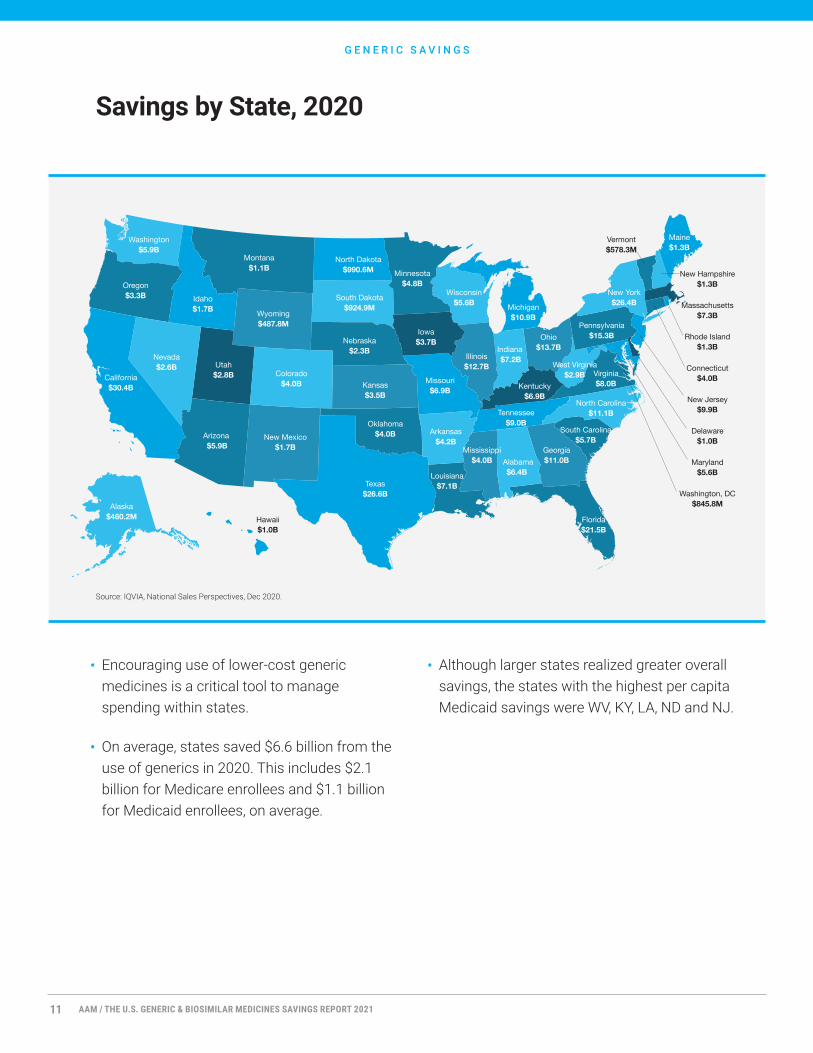
Savings by State, 2020
G E N E R I C S A V I N G S
Alabama $6.4B
Arizona $5.9B
New Mexico$1.7B
Texas$26.6B
Oklahoma$4.0B
Colorado$4.0B Kansas
$3.5B
Utah$2.8B
Nevada$2.6B
California$30.4B
Wyoming$487.8M
Idaho$1.7B
Montana$1.1B
South Dakota$924.9M
Nebraska$2.3B
North Dakota$990.6M
Washington$5.9B
Oregon$3.3B
Missouri$6.9B
Iowa$3.7B
Minnesota$4.8B
Wisconsin$5.6B
Illinois$12.7B
Indiana $7.2B
Michigan$10.9B
Ohio$13.7B
Pennsylvania$15.3B
North Carolina$11.1B
South Carolina$5.7B
Georgia$11.0B
Tennessee$9.0B
Mississippi$4.0B
Arkansas$4.2B
Louisiana$7.1B
Florida$21.5B
Virginia$8.0BKentucky
$6.9B
West Virginia$2.9B
New York$26.4B
Maine$1.3B
Connecticut$4.0B
Delaware$1.0B
Washington, DC$845.8M
Hawaii$1.0B
Maryland$5.6B
Massachusetts$7.3B
New Hampshire$1.3B
New Jersey$9.9B
Rhode Island$1.3B
Vermont$578.3M
Alaska$460.2M
Source: IQVIA, National Sales Perspectives, Dec 2020.
• Encouraging use of lower-cost generic medicines is a critical tool to manage spending within states.
• On average, states saved $6.6 billion from the use of generics in 2020. This includes $2.1 billion for Medicare enrollees and $1.1 billion for Medicaid enrollees, on average.
• Although larger states realized greater overall savings, the states with the highest per capita Medicaid savings were WV, KY, LA, ND and NJ.
AAM / THE U.S. GENERIC & BIOSIMILAR MEDICINES SAVINGS REPORT 202111
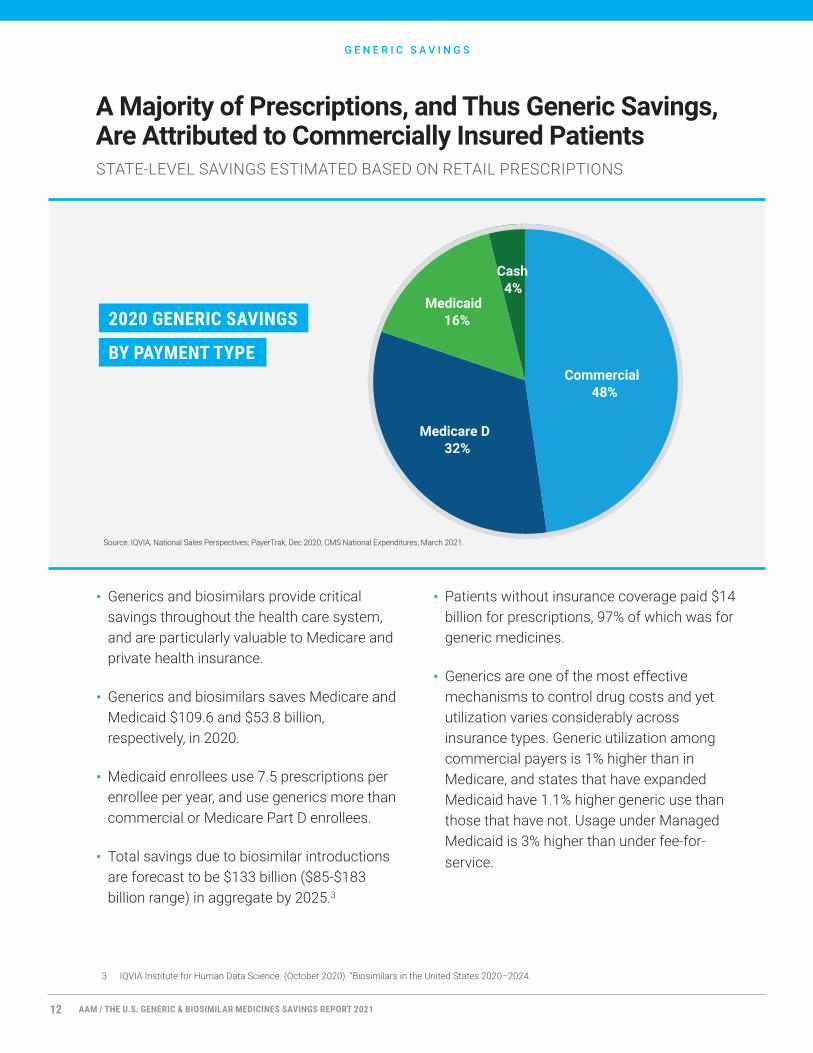
• Generics and biosimilars provide critical savings throughout the health care system, and are particularly valuable to Medicare and private health insurance.
• Generics and biosimilars saves Medicare and Medicaid $109.6 and $53.8 billion, respectively, in 2020.
• Medicaid enrollees use 7.5 prescriptions per enrollee per year, and use generics more than commercial or Medicare Part D enrollees.
• Total savings due to biosimilar introductions are forecast to be $133 billion ($85-$183 billion range) in aggregate by 2025.3
• Patients without insurance coverage paid $14 billion for prescriptions, 97% of which was for generic medicines.
• Generics are one of the most effective mechanisms to control drug costs and yet utilization varies considerably across insurance types. Generic utilization among commercial payers is 1% higher than in Medicare, and states that have expanded Medicaid have 1.1% higher generic use than those that have not. Usage under Managed Medicaid is 3% higher than under fee-for-service.
G E N E R I C S A V I N G S
A Majority of Prescriptions, and Thus Generic Savings, Are Attributed to Commercially Insured PatientsSTATE-LEVEL SAVINGS ESTIMATED BASED ON RETAIL PRESCRIPTIONS
Commercial48%
Medicare D32%
Medicaid16%
Cash4%
2020 GENERIC SAVINGS
BY PAYMENT TYPE
Source: IQVIA, National Sales Perspectives; PayerTrak, Dec 2020; CMS National Expenditures, March 2021.
3 IQVIA Institute for Human Data Science. (October 2020). “Biosimilars in the United States 2020–2024.
AAM / THE U.S. GENERIC & BIOSIMILAR MEDICINES SAVINGS REPORT 202112
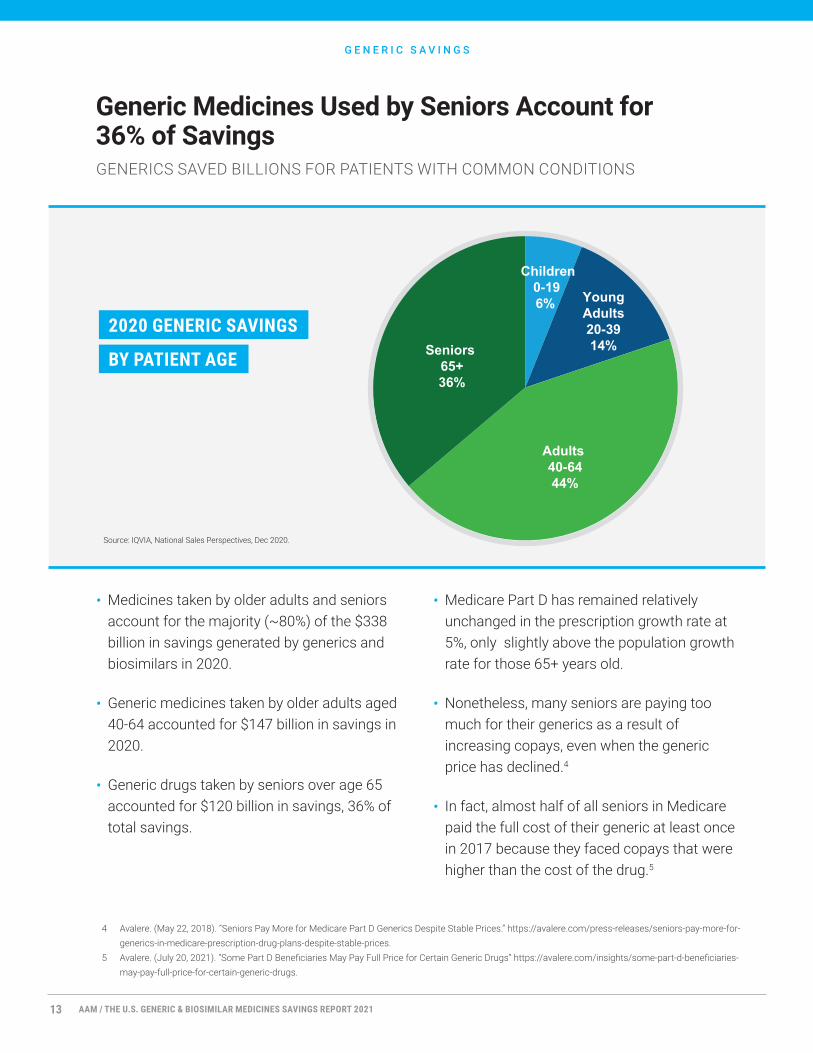
• Medicines taken by older adults and seniors account for the majority (~80%) of the $338 billion in savings generated by generics and biosimilars in 2020.
• Generic medicines taken by older adults aged 40-64 accounted for $147 billion in savings in 2020.
• Generic drugs taken by seniors over age 65 accounted for $120 billion in savings, 36% of total savings.
• Medicare Part D has remained relatively unchanged in the prescription growth rate at 5%, only slightly above the population growth rate for those 65+ years old.
• Nonetheless, many seniors are paying too much for their generics as a result of increasing copays, even when the generic price has declined.4
• In fact, almost half of all seniors in Medicare paid the full cost of their generic at least once in 2017 because they faced copays that were higher than the cost of the drug.5
Generic Medicines Used by Seniors Account for 36% of SavingsGENERICS SAVED BILLIONS FOR PATIENTS WITH COMMON CONDITIONS
G E N E R I C S A V I N G S
2020 GENERIC SAVINGS
BY PATIENT AGE
Source: IQVIA, National Sales Perspectives, Dec 2020.
Seniors 65+36%
Children0-196% Young
Adults20-3914%
Adults 40-6444%
4 Avalere. (May 22, 2018). “Seniors Pay More for Medicare Part D Generics Despite Stable Prices.” https://avalere.com/press-releases/seniors-pay-more-for-generics-in-medicare-prescription-drug-plans-despite-stable-prices.
5 Avalere. (July 20, 2021). “Some Part D Beneficiaries May Pay Full Price for Certain Generic Drugs” https://avalere.com/insights/some-part-d-beneficiaries-may-pay-full-price-for-certain-generic-drugs.
AAM / THE U.S. GENERIC & BIOSIMILAR MEDICINES SAVINGS REPORT 202113
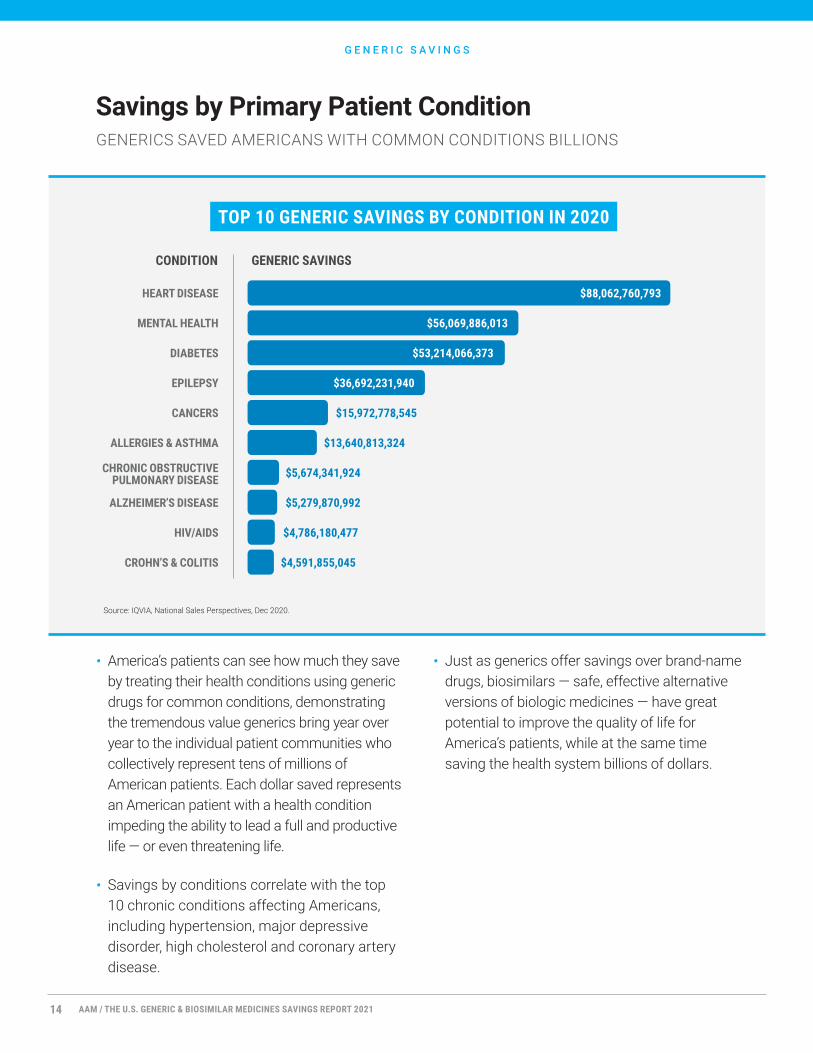
GENERICS SAVED AMERICANS WITH COMMON CONDITIONS BILLIONS
TOP 10 GENERIC SAVINGS BY CONDITION IN 2020
• America’s patients can see how much they save by treating their health conditions using generic drugs for common conditions, demonstrating the tremendous value generics bring year over year to the individual patient communities who collectively represent tens of millions of American patients. Each dollar saved represents an American patient with a health condition impeding the ability to lead a full and productive life — or even threatening life.
• Savings by conditions correlate with the top 10 chronic conditions affecting Americans, including hypertension, major depressive disorder, high cholesterol and coronary artery disease.
• Just as generics offer savings over brand-name drugs, biosimilars — safe, effective alternative versions of biologic medicines — have great potential to improve the quality of life for America’s patients, while at the same time saving the health system billions of dollars.
Savings by Primary Patient Condition
G E N E R I C S A V I N G S
Source: IQVIA, National Sales Perspectives, Dec 2020.
HEART DISEASE
MENTAL HEALTH
DIABETES
EPILEPSY
CANCERS
ALLERGIES & ASTHMA
ALZHEIMER’S DISEASE
HIV/AIDS
CROHN’S & COLITIS
CONDITION GENERIC SAVINGS
CHRONIC OBSTRUCTIVE PULMONARY DISEASE
$88,062,760,793
$56,069,886,013
$53,214,066,373
$36,692,231,940
$15,972,778,545
$13,640,813,324
$5,674,341,924
$5,279,870,992
$4,786,180,477
$4,591,855,045
AAM / THE U.S. GENERIC & BIOSIMILAR MEDICINES SAVINGS REPORT 202114
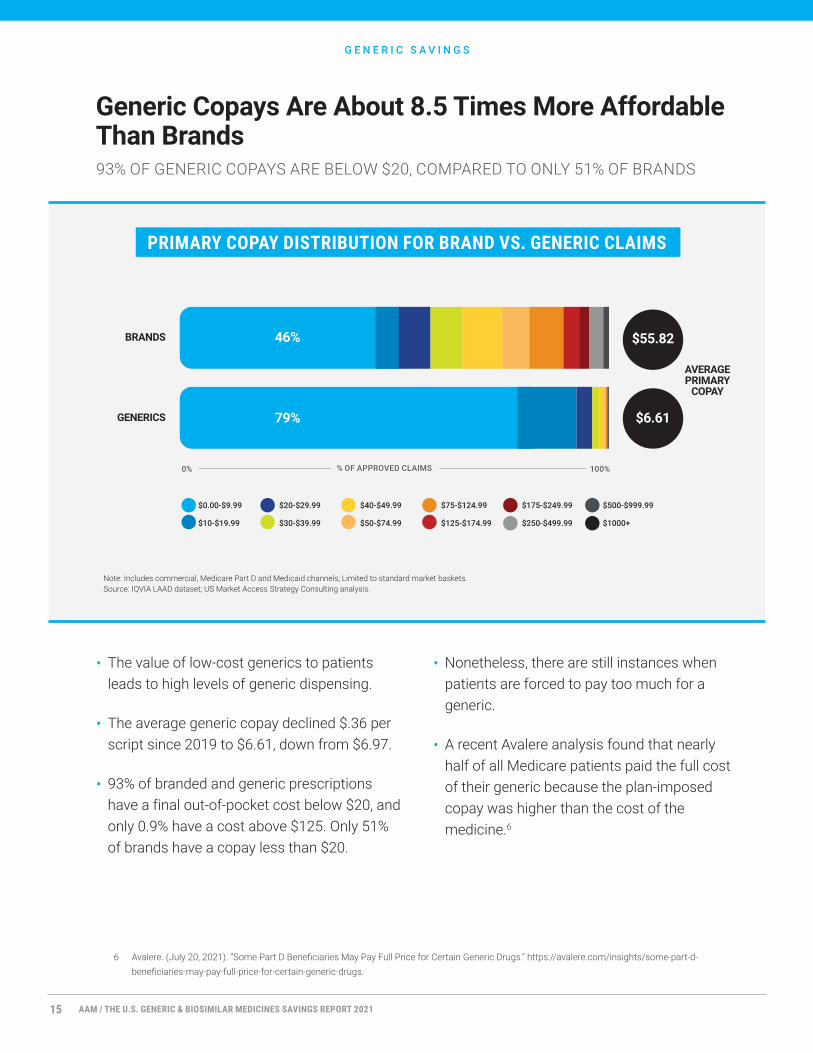
PRIMARY COPAY DISTRIBUTION FOR BRAND VS. GENERIC CLAIMS
• The value of low-cost generics to patients leads to high levels of generic dispensing.
• The average generic copay declined $.36 per script since 2019 to $6.61, down from $6.97.
• 93% of branded and generic prescriptions have a final out-of-pocket cost below $20, and only 0.9% have a cost above $125. Only 51% of brands have a copay less than $20.
• Nonetheless, there are still instances when patients are forced to pay too much for a generic.
• A recent Avalere analysis found that nearly half of all Medicare patients paid the full cost of their generic because the plan-imposed copay was higher than the cost of the medicine.6
Generic Copays Are About 8.5 Times More Affordable Than Brands93% OF GENERIC COPAYS ARE BELOW $20, COMPARED TO ONLY 51% OF BRANDS
G E N E R I C S A V I N G S
BRANDS
GENERICS
AVERAGE PRIMARY
COPAY
$55.82
$6.61
$0.00-$9.99
$10-$19.99
$20-$29.99
$30-$39.99
$40-$49.99
$50-$74.99
$75-$124.99
$125-$174.99
$175-$249.99
$250-$499.99
$500-$999.99
$1000+
0% 100%% OF APPROVED CLAIMS
79%
46%
Note: Includes commercial, Medicare Part D and Medicaid channels; Limited to standard market baskets. Source: IQVIA LAAD dataset; US Market Access Strategy Consulting analysis.
6 Avalere. (July 20, 2021). “Some Part D Beneficiaries May Pay Full Price for Certain Generic Drugs.” https://avalere.com/insights/some-part-d-beneficiaries-may-pay-full-price-for-certain-generic-drugs.
AAM / THE U.S. GENERIC & BIOSIMILAR MEDICINES SAVINGS REPORT 202115
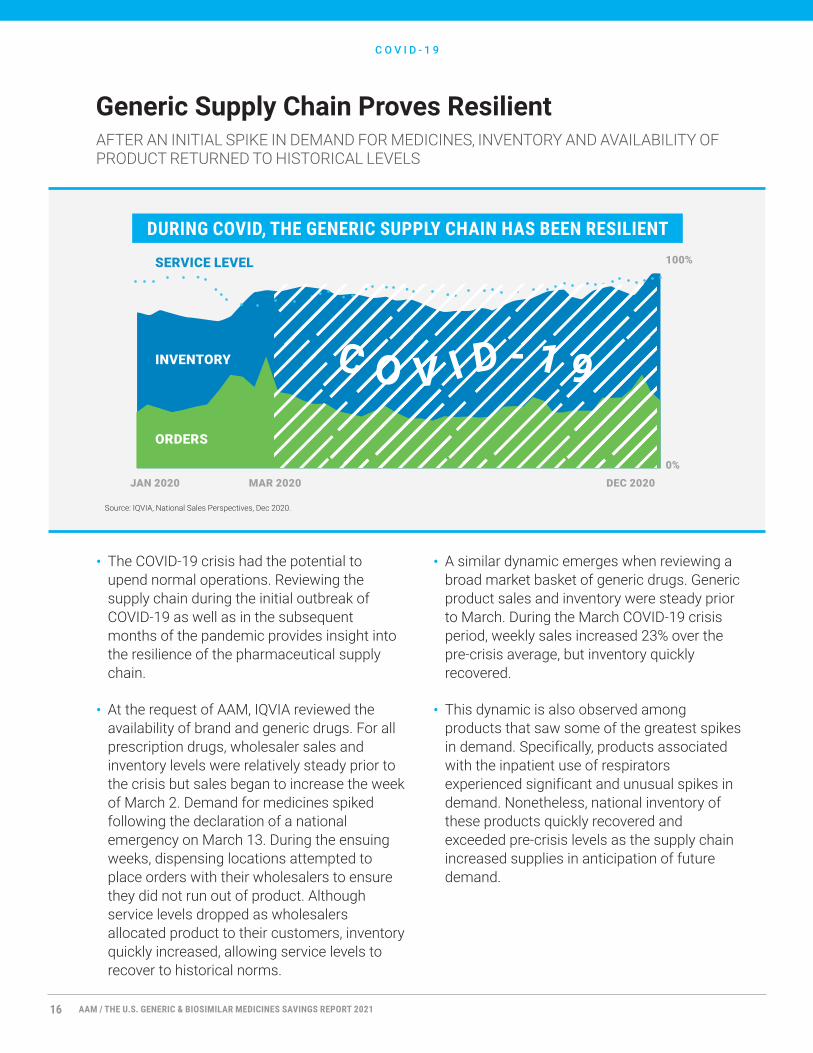
• The COVID-19 crisis had the potential to upend normal operations. Reviewing the supply chain during the initial outbreak of COVID-19 as well as in the subsequent months of the pandemic provides insight into the resilience of the pharmaceutical supply chain.
• At the request of AAM, IQVIA reviewed the availability of brand and generic drugs. For all prescription drugs, wholesaler sales and inventory levels were relatively steady prior to the crisis but sales began to increase the week of March 2. Demand for medicines spiked following the declaration of a national emergency on March 13. During the ensuing weeks, dispensing locations attempted to place orders with their wholesalers to ensure they did not run out of product. Although service levels dropped as wholesalers allocated product to their customers, inventory quickly increased, allowing service levels to recover to historical norms.
• A similar dynamic emerges when reviewing a broad market basket of generic drugs. Generic product sales and inventory were steady prior to March. During the March COVID-19 crisis period, weekly sales increased 23% over the pre-crisis average, but inventory quickly recovered.
• This dynamic is also observed among products that saw some of the greatest spikes in demand. Specifically, products associated with the inpatient use of respirators experienced significant and unusual spikes in demand. Nonetheless, national inventory of these products quickly recovered and exceeded pre-crisis levels as the supply chain increased supplies in anticipation of future demand.
Generic Supply Chain Proves ResilientAFTER AN INITIAL SPIKE IN DEMAND FOR MEDICINES, INVENTORY AND AVAILABILITY OF PRODUCT RETURNED TO HISTORICAL LEVELS
C O V I D - 1 9
Source: IQVIA, National Sales Perspectives, Dec 2020.
DURING COVID, THE GENERIC SUPPLY CHAIN HAS BEEN RESILIENT
JAN 2020 MAR 2020 DEC 2020
SERVICE LEVEL
INVENTORY
ORDERS
0%
100%
AAM / THE U.S. GENERIC & BIOSIMILAR MEDICINES SAVINGS REPORT 202116
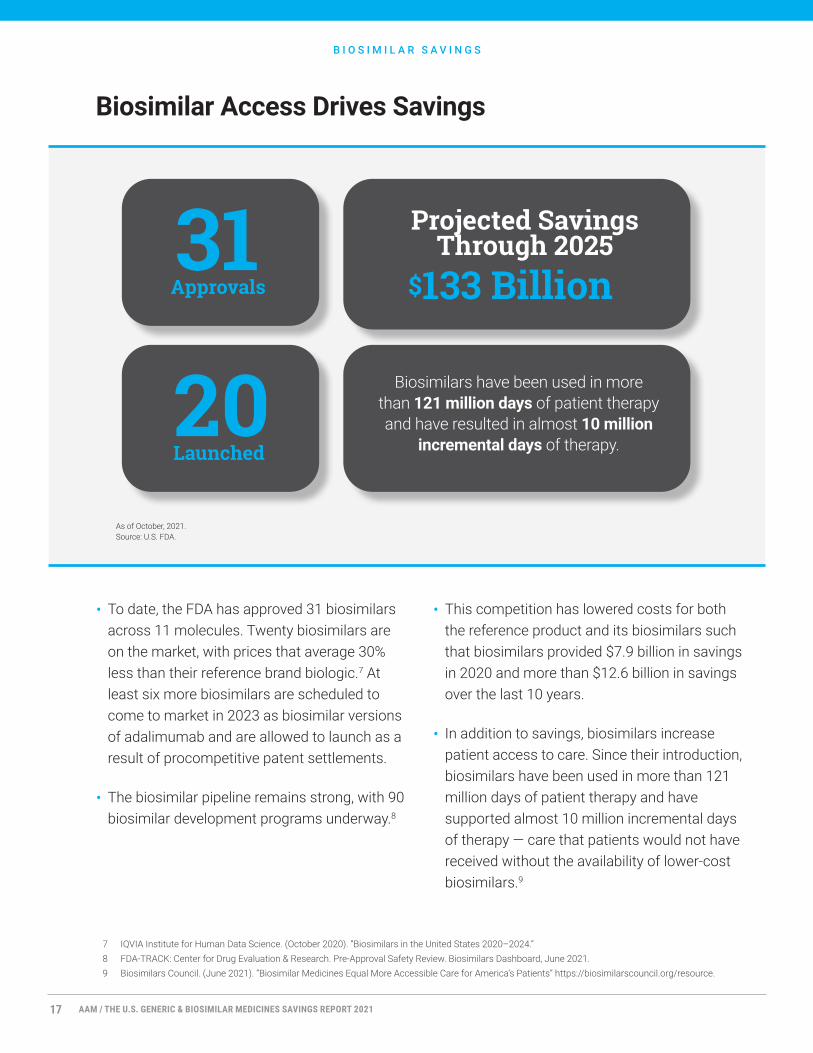
• To date, the FDA has approved 31 biosimilars across 11 molecules. Twenty biosimilars are on the market, with prices that average 30% less than their reference brand biologic.7 At least six more biosimilars are scheduled to come to market in 2023 as biosimilar versions of adalimumab and are allowed to launch as a result of procompetitive patent settlements.
• The biosimilar pipeline remains strong, with 90 biosimilar development programs underway.8
• This competition has lowered costs for both the reference product and its biosimilars such that biosimilars provided $7.9 billion in savings in 2020 and more than $12.6 billion in savings over the last 10 years.
• In addition to savings, biosimilars increase patient access to care. Since their introduction, biosimilars have been used in more than 121 million days of patient therapy and have supported almost 10 million incremental days of therapy — care that patients would not have received without the availability of lower-cost biosimilars.9
B I O S I M I L A R S A V I N G S
Biosimilar Access Drives Savings
As of October, 2021. Source: U.S. FDA.
31 Approvals
20 Launched
Projected SavingsThrough 2025
$133 Billion
Biosimilars have been used in more than 121 million days of patient therapy and have resulted in almost 10 million
incremental days of therapy.
7 IQVIA Institute for Human Data Science. (October 2020). “Biosimilars in the United States 2020–2024.”8 FDA-TRACK: Center for Drug Evaluation & Research. Pre-Approval Safety Review. Biosimilars Dashboard, June 2021.9 Biosimilars Council. (June 2021). “Biosimilar Medicines Equal More Accessible Care for America’s Patients” https://biosimilarscouncil.org/resource.
AAM / THE U.S. GENERIC & BIOSIMILAR MEDICINES SAVINGS REPORT 202117
B I O S I M I L A R S A V I N G S
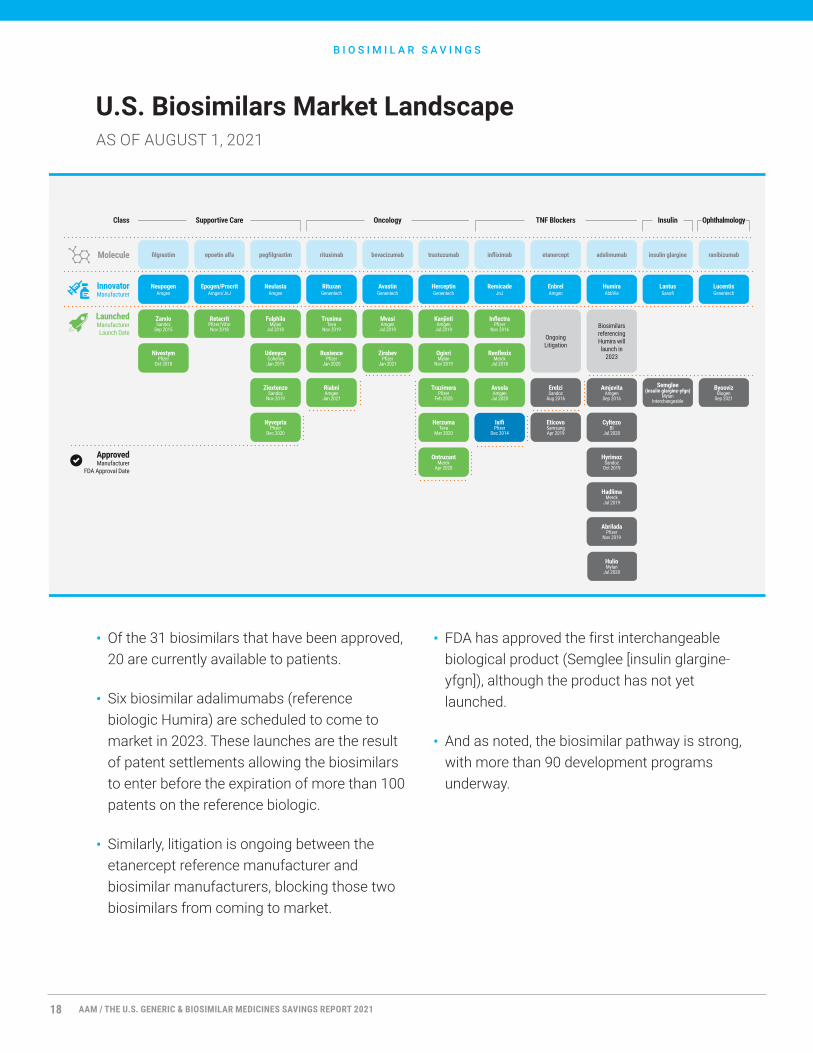
U.S. Biosimilars Market LandscapeAS OF AUGUST 1, 2021
• Of the 31 biosimilars that have been approved, 20 are currently available to patients.
• Six biosimilar adalimumabs (reference biologic Humira) are scheduled to come to market in 2023. These launches are the result of patent settlements allowing the biosimilars to enter before the expiration of more than 100 patents on the reference biologic.
• Similarly, litigation is ongoing between the etanercept reference manufacturer and biosimilar manufacturers, blocking those two biosimilars from coming to market.
• FDA has approved the first interchangeable biological product (Semglee [insulin glargine-yfgn]), although the product has not yet launched.
• And as noted, the biosimilar pathway is strong, with more than 90 development programs underway.
Class Supportive Care Oncology TNF Blockers Insulin Ophthalmology
Molecule filgrastim epoetin alfa pegfilgrastim rituximab bevacizumab trastuzumab infliximab etanercept adalimumab insulin glargine ranibizumab
InnovatorManufacturer
Neupogen Amgen
Epogen/Procrit Amgen/JnJ
NeulastaAmgen
RituxanGenentech
AvastinGenentech
HerceptinGenentech
RemicadeJnJ
EnbrelAmgen
HumiraAbbVie
Lantus Sanofi
Lucentis Genentech
Launched Manufacturer Launch Date
ZarxioSandoz
Sep 2015
RetacritPfizer/Vifor Nov 2018
FulphilaMylan
Jul 2018
TruximaTeva
Nov 2019
MvasiAmgen
Jul 2019
KanjintiAmgen
Jul 2019
InflectraPfizer
Nov 2016OngoingLitigation
Biosimilars referencing Humira will launch in
2023NivestymPfizer
Oct 2018
UdenycaCoherus Jan 2019
RuxiencePfizer
Jan 2020
ZirabevPfizer
Jan 2021
OgivriMylan
Nov 2019
RenflexisMerck
Jul 2018
ZiextenzoSandoz
Nov 2019
RiabniAmgen
Jan 2021
TrazimeraPfizer
Feb 2020
AvsolaAmgen
Jul 2020
Erelzi Sandoz
Aug 2016
AmjevitaAmgen
Sep 2016
Semglee(insulin glargine-yfgn)
MylanInterchangeable
ByoovizBiogen
Sep 2021
NyvepriaPfizer
Dec 2020
HerzumaTeva
Mar 2020
IxifiPfizer
Dec 2014
EticovoSamsung Apr 2019
CyltezoBI
Jul 2020
ApprovedManufacturer
FDA Approval Date
OntruzantMerck
Apr 2020
HyrimozSandoz
Oct 2019
HadlimaMerck
Jul 2019
AbriladaPfizer
Nov 2019
HulioMylan
Jul 2020
AAM / THE U.S. GENERIC & BIOSIMILAR MEDICINES SAVINGS REPORT 202118
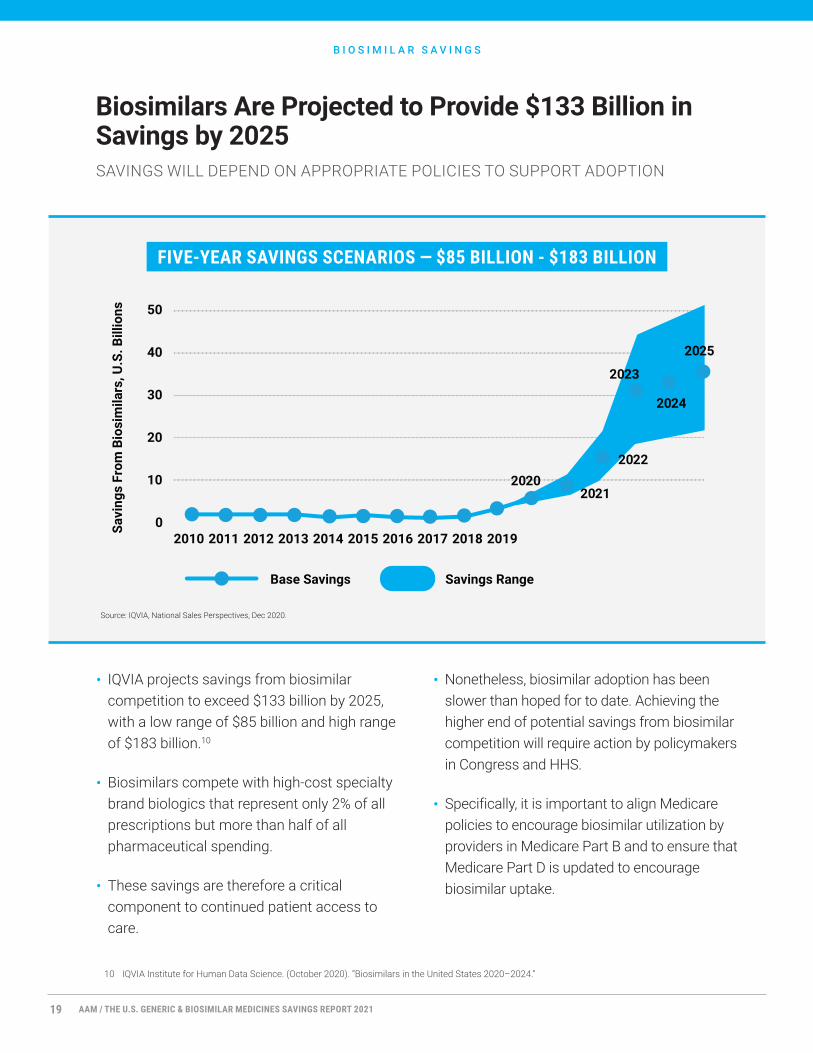
FIVE-YEAR SAVINGS SCENARIOS — $85 BILLION - $183 BILLION
• IQVIA projects savings from biosimilar competition to exceed $133 billion by 2025, with a low range of $85 billion and high range of $183 billion.10
• Biosimilars compete with high-cost specialty brand biologics that represent only 2% of all prescriptions but more than half of all pharmaceutical spending.
• These savings are therefore a critical component to continued patient access to care.
• Nonetheless, biosimilar adoption has been slower than hoped for to date. Achieving the higher end of potential savings from biosimilar competition will require action by policymakers in Congress and HHS.
• Specifically, it is important to align Medicare policies to encourage biosimilar utilization by providers in Medicare Part B and to ensure that Medicare Part D is updated to encourage biosimilar uptake.
Biosimilars Are Projected to Provide $133 Billion in Savings by 2025SAVINGS WILL DEPEND ON APPROPRIATE POLICIES TO SUPPORT ADOPTION
Source: IQVIA, National Sales Perspectives, Dec 2020.
B I O S I M I L A R S A V I N G S
2010 2015
50
40
30
20
10
0
20202021
2022
2023
2024
2025
2011 2012 2013 2014 2016 2017 2018 2019
Savings RangeBase Savings
Savi
ngs
From
Bio
sim
ilars
, U.S
. Bill
ions
10 IQVIA Institute for Human Data Science. (October 2020). “Biosimilars in the United States 2020–2024.”
AAM / THE U.S. GENERIC & BIOSIMILAR MEDICINES SAVINGS REPORT 202119
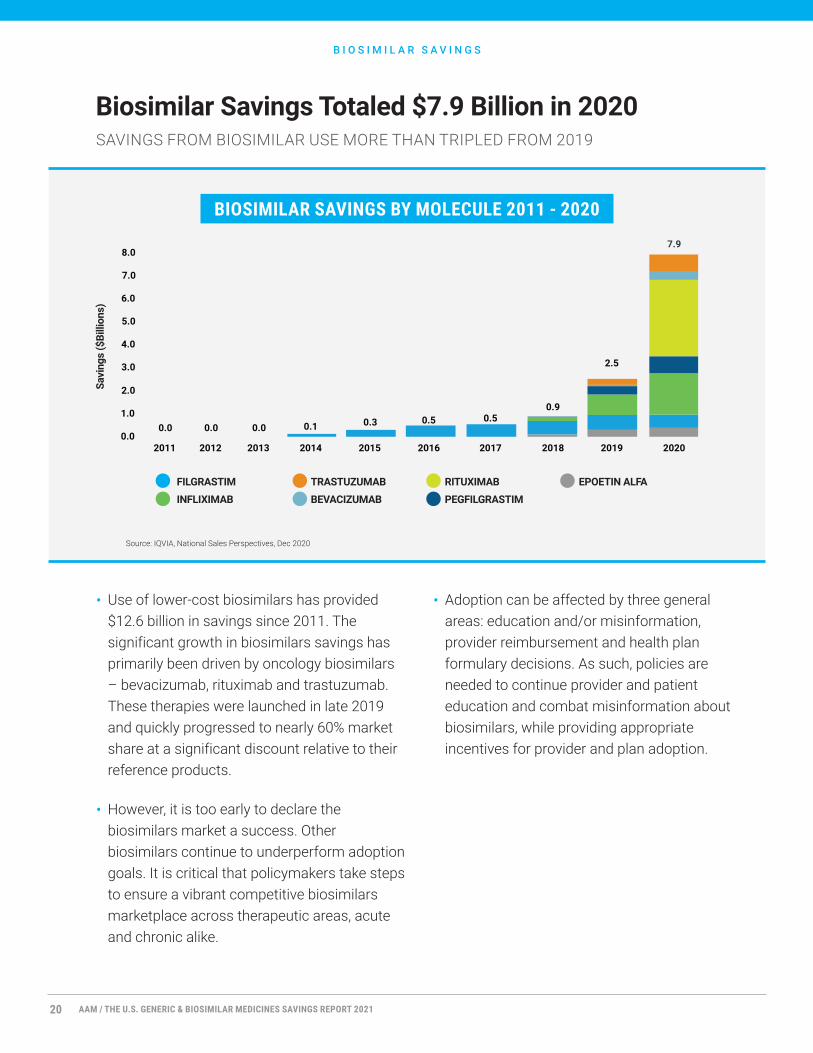
BIOSIMILAR SAVINGS BY MOLECULE 2011 - 2020
• Use of lower-cost biosimilars has provided $12.6 billion in savings since 2011. The significant growth in biosimilars savings has primarily been driven by oncology biosimilars – bevacizumab, rituximab and trastuzumab. These therapies were launched in late 2019 and quickly progressed to nearly 60% market share at a significant discount relative to their reference products.
• However, it is too early to declare the biosimilars market a success. Other biosimilars continue to underperform adoption goals. It is critical that policymakers take steps to ensure a vibrant competitive biosimilars marketplace across therapeutic areas, acute and chronic alike.
• Adoption can be affected by three general areas: education and/or misinformation, provider reimbursement and health plan formulary decisions. As such, policies are needed to continue provider and patient education and combat misinformation about biosimilars, while providing appropriate incentives for provider and plan adoption.
B I O S I M I L A R S A V I N G S
Biosimilar Savings Totaled $7.9 Billion in 2020SAVINGS FROM BIOSIMILAR USE MORE THAN TRIPLED FROM 2019
Source: IQVIA, National Sales Perspectives, Dec 2020
0.1 0.3 0.5 0.50.9
2.5
0.0
1.0
2.0
3.0
4.0
5.0
6.0
7.0
8.0
2011 2012 2013 2014 2015 2016 2017 2018 2019 2020
7.9
Savi
ngs
($Bi
llion
s)
FILGRASTIMINFLIXIMAB
TRASTUZUMABBEVACIZUMAB
RITUXIMABPEGFILGRASTIM
EPOETIN ALFA
AAM / THE U.S. GENERIC & BIOSIMILAR MEDICINES SAVINGS REPORT 202120
BIOSIMILAR EFFICIENCY
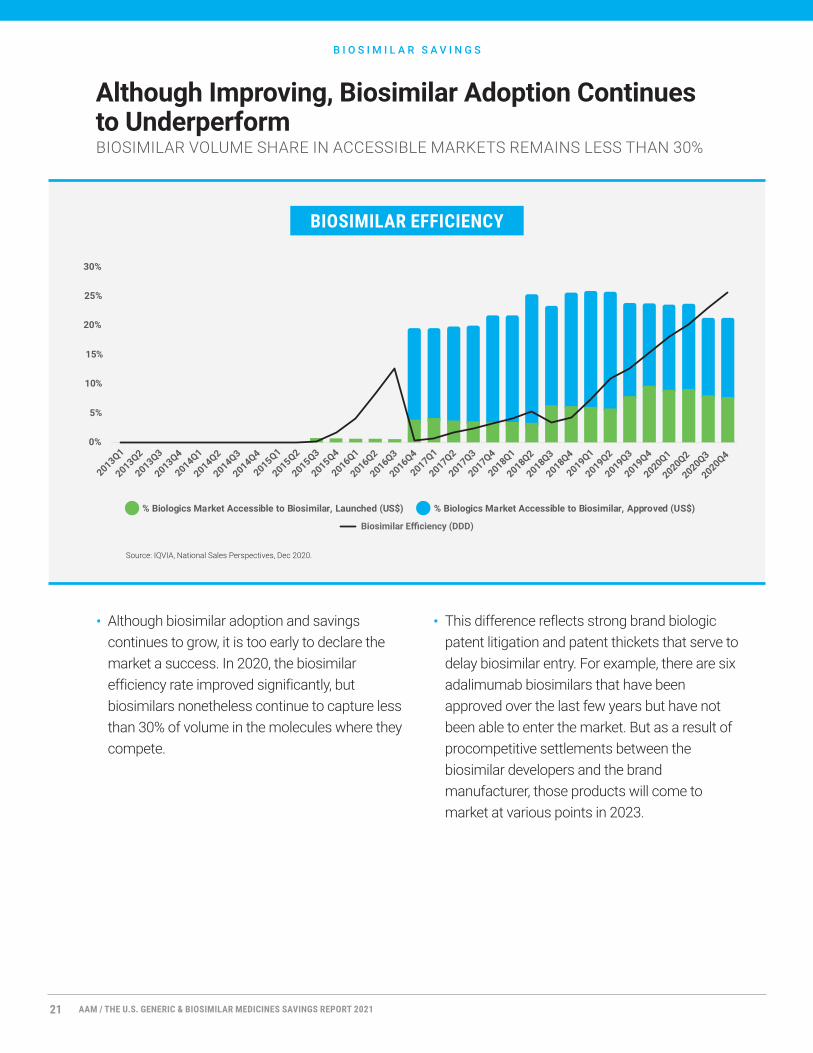
• Although biosimilar adoption and savings continues to grow, it is too early to declare the market a success. In 2020, the biosimilar efficiency rate improved significantly, but biosimilars nonetheless continue to capture less than 30% of volume in the molecules where they compete.
• This difference reflects strong brand biologic patent litigation and patent thickets that serve to delay biosimilar entry. For example, there are six adalimumab biosimilars that have been approved over the last few years but have not been able to enter the market. But as a result of procompetitive settlements between the biosimilar developers and the brand manufacturer, those products will come to market at various points in 2023.
B I O S I M I L A R S A V I N G S
Although Improving, Biosimilar Adoption Continues to UnderperformBIOSIMILAR VOLUME SHARE IN ACCESSIBLE MARKETS REMAINS LESS THAN 30%
Source: IQVIA, National Sales Perspectives, Dec 2020.
0%
5%
10%
15%
20%
25%
30%
2013Q1
2013Q2
2013Q3
2013Q4
2014Q1
2014Q2
2014Q3
2014Q4
2015Q1
2015Q2
2015Q3
2015Q4
2016Q1
2016Q2
2016Q3
2016Q4
2017Q1
2017Q2
2017Q3
2017Q4
2018Q1
2018Q2
2018Q3
2018Q4
2019Q1
2019Q2
2019Q3
2019Q4
2020Q1
2020Q2
2020Q3
2020Q4
% Biologics Market Accessible to Biosimilar, Launched (US$) % Biologics Market Accessible to Biosimilar, Approved (US$)
Biosimilar Efficiency (DDD)
AAM / THE U.S. GENERIC & BIOSIMILAR MEDICINES SAVINGS REPORT 202121
ONCOLOGY NON-DISCOUNTED SPENDING GROWTH
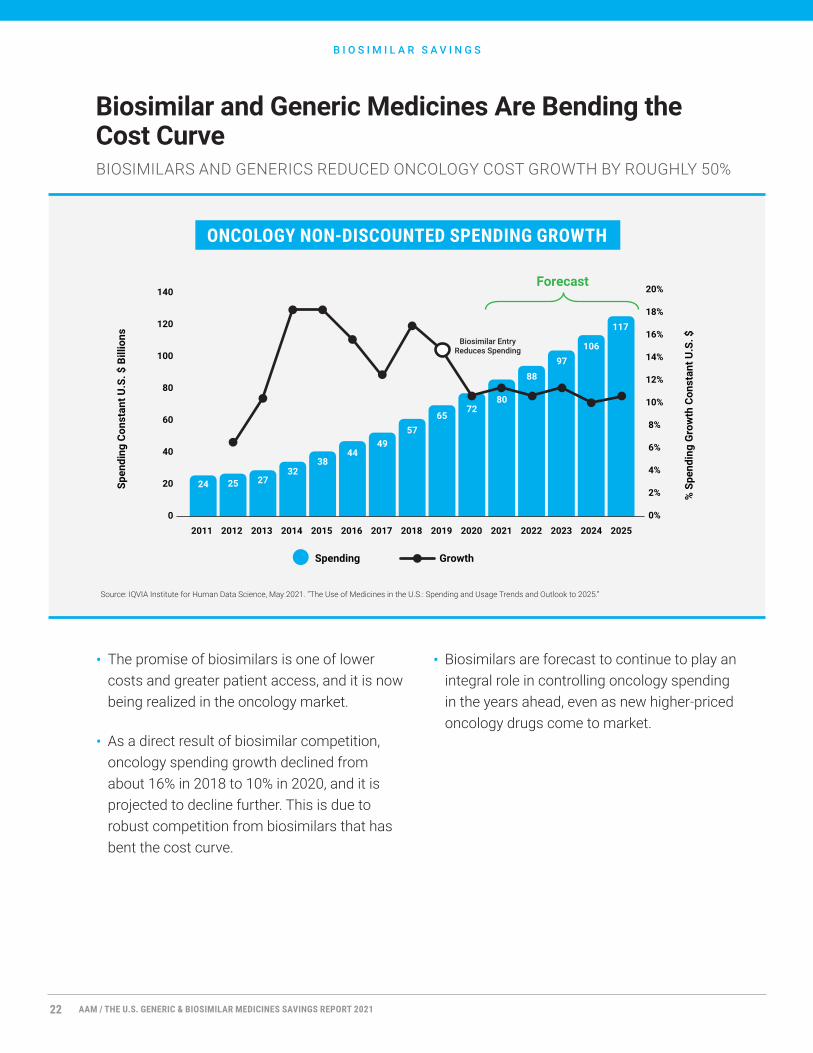
• The promise of biosimilars is one of lower costs and greater patient access, and it is now being realized in the oncology market.
• As a direct result of biosimilar competition, oncology spending growth declined from about 16% in 2018 to 10% in 2020, and it is projected to decline further. This is due to robust competition from biosimilars that has bent the cost curve.
• Biosimilars are forecast to continue to play an integral role in controlling oncology spending in the years ahead, even as new higher-priced oncology drugs come to market.
B I O S I M I L A R S A V I N G S
Biosimilar and Generic Medicines Are Bending the Cost CurveBIOSIMILARS AND GENERICS REDUCED ONCOLOGY COST GROWTH BY ROUGHLY 50%
Source: IQVIA Institute for Human Data Science, May 2021. “The Use of Medicines in the U.S.: Spending and Usage Trends and Outlook to 2025.”
20152011 2012 2013 2014 2016 2017 2018 2019
Spen
ding
Con
stan
t U.S
. $ B
illio
ns
2020 2021 2022 2023 2024 2025
38
24 25 2732
4449
5765
7280
8897
106
117
20%
18%
16%
14%
12%
10%
8%
6%
4%
2%
0%
% S
pend
ing
Gro
wth
Con
stan
t U.S
. $
Forecast
Spending Growth
140
120
100
80
60
40
20
0
Biosimilar Entry Reduces Spending
AAM / THE U.S. GENERIC & BIOSIMILAR MEDICINES SAVINGS REPORT 202122
U.S. AUTOIMMUNE NON-DISCOUNTED SPENDING GROWTH
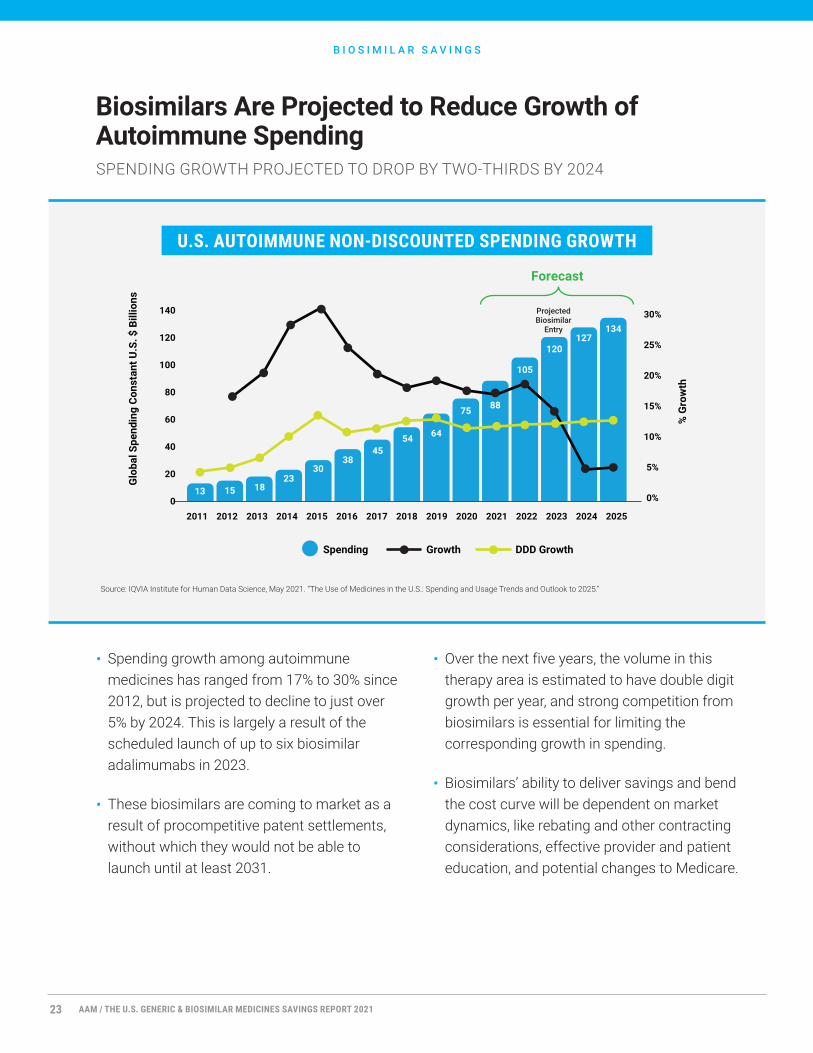
• Spending growth among autoimmune medicines has ranged from 17% to 30% since 2012, but is projected to decline to just over 5% by 2024. This is largely a result of the scheduled launch of up to six biosimilar adalimumabs in 2023.
• These biosimilars are coming to market as a result of procompetitive patent settlements, without which they would not be able to launch until at least 2031.
• Over the next five years, the volume in this therapy area is estimated to have double digit growth per year, and strong competition from biosimilars is essential for limiting the corresponding growth in spending.
• Biosimilars’ ability to deliver savings and bend the cost curve will be dependent on market dynamics, like rebating and other contracting considerations, effective provider and patient education, and potential changes to Medicare.
B I O S I M I L A R S A V I N G S
Biosimilars Are Projected to Reduce Growth of Autoimmune SpendingSPENDING GROWTH PROJECTED TO DROP BY TWO-THIRDS BY 2024
Source: IQVIA Institute for Human Data Science, May 2021. “The Use of Medicines in the U.S.: Spending and Usage Trends and Outlook to 2025.”
20152011 2012 2013 2014 2016 2017 2018 2019 2020 2021 2022 2023 2024 2025
Spending Growth DDD Growth
Glo
bal S
pend
ing
Cons
tant
U.S
. $ B
illio
ns
30%
25%
20%
15%
10%
5%
0%
% G
row
th
Forecast
30
13 15 1823
3845
54 64
75 88
105
120127
134
140
120
100
80
60
40
20
0
ProjectedBiosimilar
Entry
AAM / THE U.S. GENERIC & BIOSIMILAR MEDICINES SAVINGS REPORT 202123
IMPACT OF BRAND LOSSES OF EXCLUSIVITY 2016-2025 U.S. (BILLIONS)
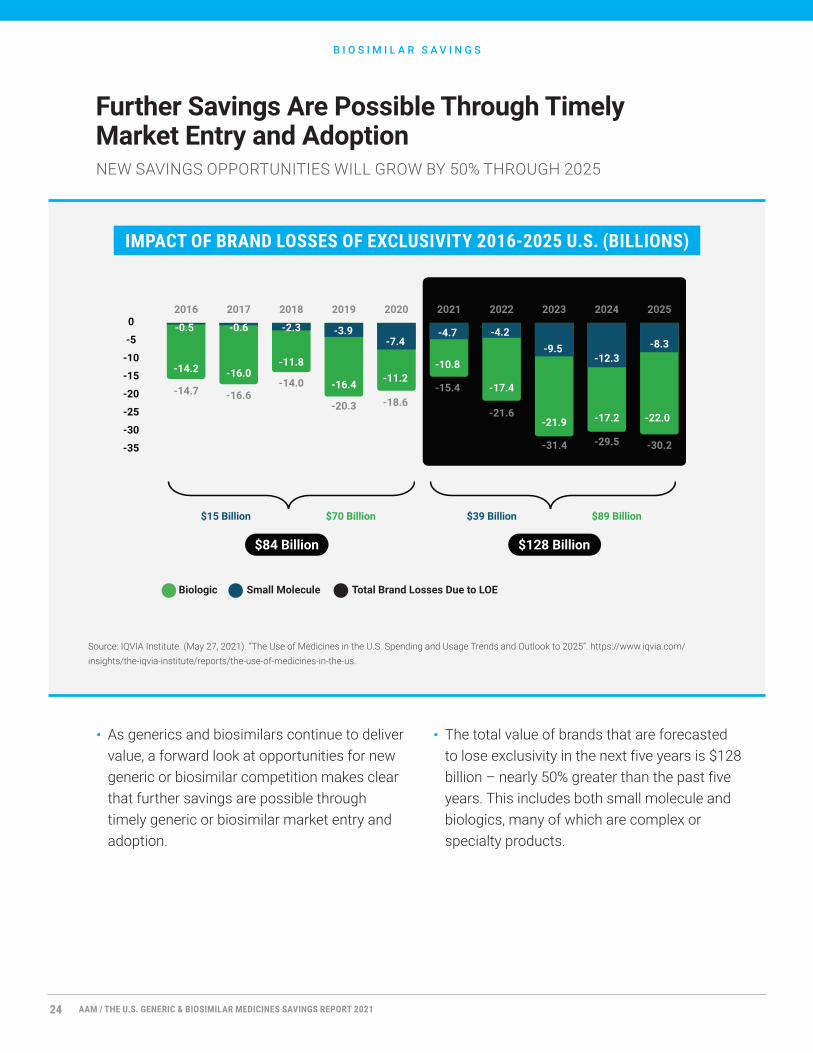
• As generics and biosimilars continue to deliver value, a forward look at opportunities for new generic or biosimilar competition makes clear that further savings are possible through timely generic or biosimilar market entry and adoption.
• The total value of brands that are forecasted to lose exclusivity in the next five years is $128 billion – nearly 50% greater than the past five years. This includes both small molecule and biologics, many of which are complex or specialty products.
B I O S I M I L A R S A V I N G S
Further Savings Are Possible Through Timely Market Entry and AdoptionNEW SAVINGS OPPORTUNITIES WILL GROW BY 50% THROUGH 2025
Forecast2016 2017 2018 2019 2020 2021 2022 2023 2024 2025
0
-5
-10
-15
-20
-25
-30
-35
-14.2 -16.0-11.8
-16.4 -11.2-10.8
-17.4
-21.9 -17.2 -22.0
-14.7 -16.6-14.0
-20.3 -18.6-15.4
-21.6
-31.4 -29.5 -30.2
-0.6 -2.3 -3.9-7.4
-4.7 -4.2-9.5
-12.3-8.3
-0.5
$84 Billion $128 Billion
$15 Billion $70 Billion $39 Billion $89 Billion
Source: IQVIA Institute. (May 27, 2021). “The Use of Medicines in the U.S. Spending and Usage Trends and Outlook to 2025”. https://www.iqvia.com/insights/the-iqvia-institute/reports/the-use-of-medicines-in-the-us.
Biologic Small Molecule Total Brand Losses Due to LOE
AAM / THE U.S. GENERIC & BIOSIMILAR MEDICINES SAVINGS REPORT 202124
Ord
er o
f Bio
sim
ilar L
aunc
h
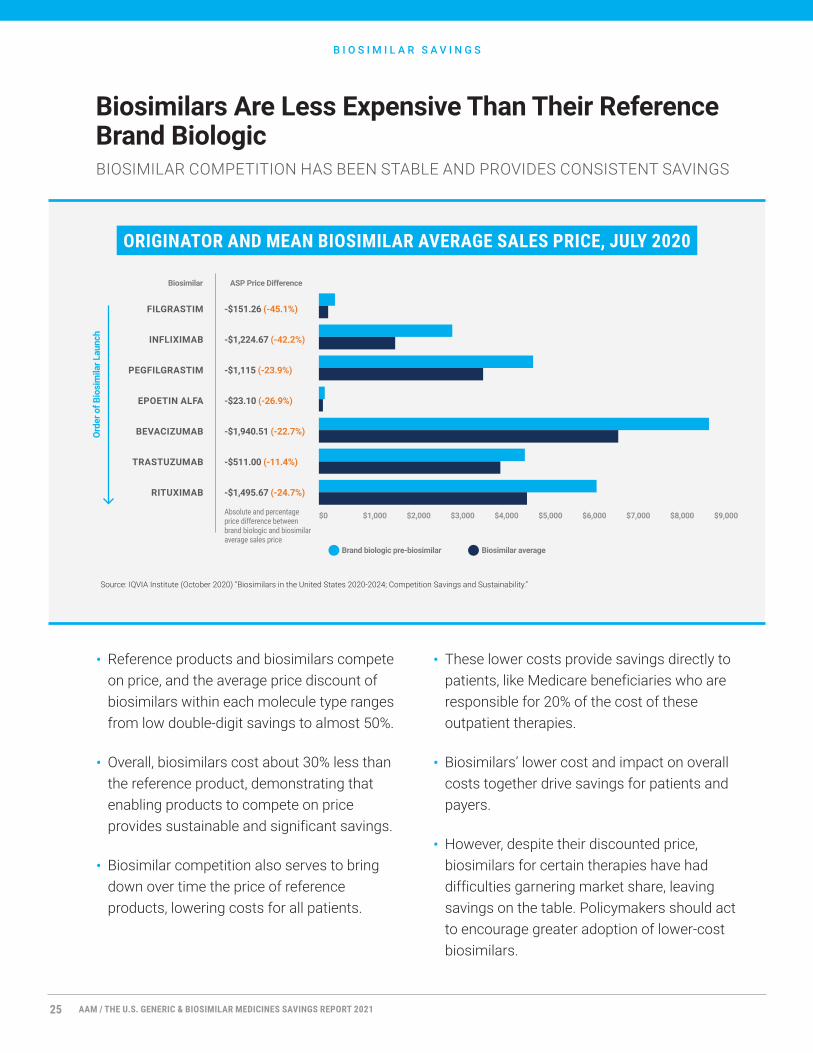
ORIGINATOR AND MEAN BIOSIMILAR AVERAGE SALES PRICE, JULY 2020
• Reference products and biosimilars compete on price, and the average price discount of biosimilars within each molecule type ranges from low double-digit savings to almost 50%.
• Overall, biosimilars cost about 30% less than the reference product, demonstrating that enabling products to compete on price provides sustainable and significant savings.
• Biosimilar competition also serves to bring down over time the price of reference products, lowering costs for all patients.
• These lower costs provide savings directly to patients, like Medicare beneficiaries who are responsible for 20% of the cost of these outpatient therapies.
• Biosimilars’ lower cost and impact on overall costs together drive savings for patients and payers.
• However, despite their discounted price, biosimilars for certain therapies have had difficulties garnering market share, leaving savings on the table. Policymakers should act to encourage greater adoption of lower-cost biosimilars.
B I O S I M I L A R S A V I N G S
Biosimilars Are Less Expensive Than Their Reference Brand BiologicBIOSIMILAR COMPETITION HAS BEEN STABLE AND PROVIDES CONSISTENT SAVINGS
Source: IQVIA Institute (October 2020) “Biosimilars in the United States 2020-2024; Competition Savings and Sustainability.”
FILGRASTIM
INFLIXIMAB
PEGFILGRASTIM
EPOETIN ALFA
BEVACIZUMAB
TRASTUZUMAB
RITUXIMAB
-$151.26 (-45.1%)
-$1,224.67 (-42.2%)
-$1,115 (-23.9%)
-$23.10 (-26.9%)
-$1,940.51 (-22.7%)
-$511.00 (-11.4%)
-$1,495.67 (-24.7%)
$0 $1,000 $2,000 $3,000 $4,000 $5,000 $6,000 $7,000 $8,000 $9,000
ASP Price DifferenceBiosimilar
Absolute and percentage price difference between brand biologic and biosimilar average sales price
Brand biologic pre-biosimilar Biosimilar average
AAM / THE U.S. GENERIC & BIOSIMILAR MEDICINES SAVINGS REPORT 202125
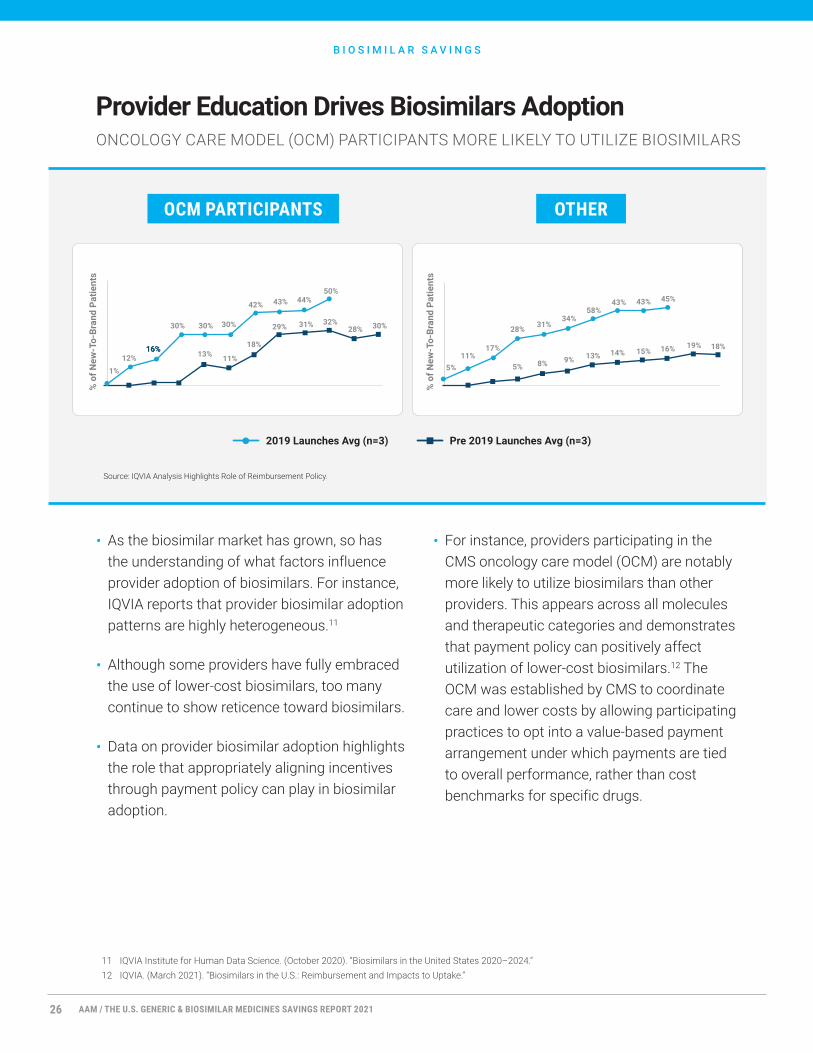
• As the biosimilar market has grown, so has the understanding of what factors influence provider adoption of biosimilars. For instance, IQVIA reports that provider biosimilar adoption patterns are highly heterogeneous.11
• Although some providers have fully embraced the use of lower-cost biosimilars, too many continue to show reticence toward biosimilars.
• Data on provider biosimilar adoption highlights the role that appropriately aligning incentives through payment policy can play in biosimilar adoption.
• For instance, providers participating in the CMS oncology care model (OCM) are notably more likely to utilize biosimilars than other providers. This appears across all molecules and therapeutic categories and demonstrates that payment policy can positively affect utilization of lower-cost biosimilars.12 The OCM was established by CMS to coordinate care and lower costs by allowing participating practices to opt into a value-based payment arrangement under which payments are tied to overall performance, rather than cost benchmarks for specific drugs.
Provider Education Drives Biosimilars AdoptionONCOLOGY CARE MODEL (OCM) PARTICIPANTS MORE LIKELY TO UTILIZE BIOSIMILARS
B I O S I M I L A R S A V I N G S
OCM PARTICIPANTS
Source: IQVIA Analysis Highlights Role of Reimbursement Policy.
% o
f New
-To-
Bran
d Pa
tient
s
% o
f New
-To-
Bran
d Pa
tient
s
OTHER
Pre 2019 Launches Avg (n=3)2019 Launches Avg (n=3)
1%
12%16%16%
30% 30% 30%
42% 43% 44%50%
30%28%32%31%29%
18%
11%13%
5%11%
17%
28% 31%34%
58%43% 43% 45%
5% 8% 9% 13% 14% 15% 16% 19% 18%
11 IQVIA Institute for Human Data Science. (October 2020). “Biosimilars in the United States 2020–2024.”12 IQVIA. (March 2021). “Biosimilars in the U.S.: Reimbursement and Impacts to Uptake.”
AAM / THE U.S. GENERIC & BIOSIMILAR MEDICINES SAVINGS REPORT 202126
Methodology
The value of generics currently on the market was estimated using the pre-expiry prices of the brands they replaced. The current dataset includes pre-expiry brand prices for 1255 generic molecules. The value of each generic molecule was determined by multiplying its pre-expiry brand price by the generic volume sold in each of the last ten years. This value represents what would have been spent on brand name medicines in the absence of generic competition.
The savings attributed to each of the 1255 generic molecules was determined by subtracting historic generic spending from the estimated brand spending in the absence of generic competition.This analysis was refreshed with annual sales and volume data for all medicines sold in the United States between 1992 and 2020, focusing on the 10-year savings for the period 2011 to 2020. Savings from generics launched in the 1993 to 2020 study period are based on the most current knowledge of their pre-expiry prices. Savings from generics launched prior to 1993 were calculated using brand prices from 1992 which is the oldest archived data period retained by IQVIA.
Generic savings were calculated at the molecule-class level using a single average price for each molecule across all formulations (oral solid, liquid). Molecules that are available in multiple formulations are assumed to have the same pre- and post-expiry utilization patterns. Molecules with injectable formulations were calculated related to specific formulations to appropriately measure the cost differences between brands and equivalent generic forms.
State level generic savings was estimated by apportioning total savings for each molecule by each state’s share of the national retail prescription volume. This method embeds two assumptions; first, that prices are uniform across the country, and second, that retail prescription activity mirrors prescription activity in other channels, notably mail order.
Savings generated by children, young adults, older adults, and seniors were estimated based on national prescription trends captured in the IQVIA New to Brand AuditTM. These figures represent the portion of the national savings generated by each age group, not the sum of the patients’ personal savings.
Savings by pay type were estimated using the share of each molecule dispensed via retail pharmacies to patients paying with cash and those covered by Medicare, Medicaid, and commercial insurance. After calculating savings at the molecule, state, and payer level, results were summed to the state-payer level. This method does not analyze the cost to the patient who may have a co-pay or discount card; rather it divides generic savings equally amongst patients based on prescription use, regardless of insurance plan.
Patients with Medicaid, Medicare, and commercial insurance pay different prices for their medications based on their insurance benefit design. This analysis did not attempt to estimate savings to individual patients based on their method of payment. Instead, total generic savings for each molecule was divided evenly based on the number of prescriptions filled by patients of each pay type.
M E T H O D O L O G Y
AAM / THE U.S. GENERIC & BIOSIMILAR MEDICINES SAVINGS REPORT 202127
Methodology
In earlier editions of this study, the IQVIA Institute has employed not previously available historic archives. Prior versions of this study were based on archives and live data covering 2003 to present. The current edition of the study includes archives extending a further 11 years to 1992. The calculation of generic savings depends upon the brand’s pre-expiry price or the oldest available brand price if the pre-expiry price is not available. Older generics, particularly those first launched before 1992, and even during 1992-2003, are now more accurately represented in the study. As brand prices change post-expiry, the more complete and accurate representation of their prices has improved the accuracy of the savings estimated in the study.
In the 2015 study release, the 10-year savings 2005-2014 were $1.68 trillion. Using the new study’s current method, the 2005-2014 savings would have been $1.26 trillion, with the majority of the difference from older generics due to more complete and accurate availability of pre-expiry brand prices. Offsetting these reduced savings modestly was the inclusion of some medicines where brands ceased to be marketed between 1992-2003, leaving only their generics available. These medicines were previously excluded due to the absence of a brand price for calculations of savings, and which can now be included in the study.
Patient Savings: Methodological Overview
Base Savings Estimates: The base savings were calculated by IQVIA. We generated condition-level savings by assigning drugs to a list of common conditions and aggregating savings for all drug that are used to treat these conditions. Product condition assignments were conducted by a Doctor of Pharmacy. Importantly, many products treat multiple conditions. For purposes of this analysis, we ensured that the most common used of the product was the condition into which it was assigned.
Comorbidity Estimates: We used published epidemiological data to determine the 3 most common comorbidities for each of the index conditions. We calculated the base savings for the primary condition in the same manner as described above, and then assigned a weighted savings to each of the 3 selected comorbid conditions based on published prevalence data. Because the IQVIA data provided units rather than patients, we used units as a proxy for the number of patients treated and adjusted the units, and thus savings, in proportion to the published prevalence of each comorbid condition. Importantly, this methodology, due to the differences in units utilized by patients for specific conditions, could occassionally lead to estimates of comorbidity savings that exceed the total savings for that stand alone condition. In these cases, the savings were either capped, when the total numbers were relatively low relative to the main condition or, more commonly, the incidence rate for the comorbidity was applied again, to ensure a lower savings estimate. While this is a methodological choice and likely underestimates the savings from the comorbidity, it effectively assumes that the commorbidity requires more units per patient treated than the main condition.
M E T H O D O L O G Y
AAM / THE U.S. GENERIC & BIOSIMILAR MEDICINES SAVINGS REPORT 202128
Get in Touch
Association for Accessible Medicines601 New Jersey Ave NW Suite 850Washington, D.C. 20001202-249-7100 accessiblemeds.org
AAM All Access Podcast https://aamallaccess.podbean.com/
Follow AAM on social media
/accessiblemeds
Biosimilars CouncilA division of the Association for Accessible Medicinesbiosimilarscouncil.org
Follow the Council on social media
Download this report at RxAccessReport.us
/biosimscouncil
C O N T A C T U S
AAM / THE U.S. GENERIC & BIOSIMILAR MEDICINES SAVINGS REPORT 202129
a c c e s s i b l e m e d s . o r g b i o s i m i l a r s c o u n c i l . o r g