the u.s. diet and the role of beverages u.s. diet and the role of beverages dr. barry popkin the...
TRANSCRIPT

The U.S. Diet and The Role of Beverages
Dr. Barry Popkin
The Beverage Panel
The University of North Carolina at Chapel Hill

Food and Beverage Trends
• The number of eating occasions is increasing
• Portion sizes of actual meals consumed is increasing
• Away from home eating continues to increase
• Adult consumption patterns differ on weekends
• Snacks have increased in number significantly over time and are consistently more energy dense and less nutrient dense (calcium, fiber, folate) than meals
The Beverage Panel
The University of North Carolina at Chapel Hill

Beverage Trends
• The major beverage shifts: increased calorically-sweetened beverages and alcohol; shift from whole to reduced fat milks; no data on water, tea or coffee trends
• The beverage trends are comparable across all age-gender groups; levels are higher in some age groupings
The Beverage Panel
The University of North Carolina at Chapel Hill

Trends in Beverage Consumption from 1977-2001
0.8
2.8
1.11.6
8.0
0.5
1.70.9
7.0
2.2
3.5
5.0
0.3
2.0
0
2
4
6
8
10
Coffeeand tea
Soft drinks Fruit drinks Alcohol Milk Other milkbev
Fruit juice
1977-78 1999-01
The % of total daily calorie intake from each beverage for all Americans aged 2 and older
Source:Nielsen & Popkin 2004 Am J Prev Med 27: 205-10. *All changes significant at the 0.01 level between 1977-78 and 1999-2001
The Beverage Panel
The University of North Carolina at Chapel Hill

Beverage Consumption1999-2001 Calorie Proportions Per Beverage
0
5
10
15
20
25
All ages 2-18 yr olds 19-39 yr olds 40-59 yr olds 60+ yr olds
Soft drinks Fruit drinks MilkFruit juice Alcohol Coffee and teaOther milk beverages
Per
cent
age
of to
tal d
aily
kca
l fro
m e
ach
beve
rage
Source:Nielsen & Popkin 2004 Am J Prev Med 27: 205-10.The Beverage Panel
The University of North Carolina at Chapel Hill

Average Beverage Intake Patterns for U.S. Adults Aged 19 and Older, 1999-2002
a. Fluid Ounces Consumed b. Kcal Consumed per dayTotal 114 FL OZ Total 464 KCALS
NONCALORICALLY-SWEETENED BEVERAGES (5 FL OZ)
LOW FAT MILK(3 FL OZ)
LEVEL I
LEVEL II
LEVEL IIILEVEL IV
LEVEL VI
LEVEL V
NONCALORICALLY-SWEETENEDBEVERAGES (1 KCALS)
TEA/COFFEE,UNSWEETENED(11 KCALS)
LEVEL I
LEVEL IILEVEL III
LEVEL IV
LEVEL VI
LEVEL V
WATER (0 KCALS)
WATER (46 FL OZ)
TEA/COFFEE,UNSWEETENED
(15 FL OZ)
CALORICALLY-SWEETENEDBEVERAGES
(20 FL OZ)
CALORIC BEVERAGESWITH SOME NUTRIENTS
(15 FL OZ)
CALORIC BEVERAGESWITH SOME NUTRIENTS
(213 KCALS)
CALORICALLY-SWEETENEDBEVERAGES (211 KCALS)
LOW FAT MILK (29 KCALS)
The Beverage Panel
The University of North Carolina at Chapel Hill

Liquid Calories Linked ToWeight Gain
• Liquid calories do not affect food intake [No adjustment for food intake to compensate for liquid calories]
• Clinical and epidemiological studies show the link between liquid calories and weight gain

Our Goal
Create a uniform guidance system to help consumers make healthy beverage choices
The Beverage Panel
The University of North Carolina at Chapel Hill

The Panel
The Healthy Beverage Guidelines were funded by the UnileverHealth Institute and created by a panel of leading nutritionexperts:• Barry Popkin – Panel Head: Professor of Nutrition, University of North
Carolina-Chapel Hill; Head of the Division of Nutrition Epidemiology, UNC-CH Schools of Public Health and Medicine; Director, UNC-CH’s Interdisciplinary Center for Obesity
• Benjamin Caballero – Professor of International Health, Johns Hopkins University Bloomberg School of Public Health; Professor of Pediatrics, Johns Hopkins School of Medicine
• Walter Willett – Professor, Harvard University, senior diet and chronic disease epidemiologist
• George Bray – Professor, Louisiana State University, major obesity scholar• Balz Frei – Professor, Oregon State University, key scholar on micronutrients,
phytochemicals and beverages and health• Lawrence Armstrong – Professor, University of Connecticut, exercise
physiologist, caffeine, hydration, performance scholar
The Beverage Panel
The University of North Carolina at Chapel Hill

The Research
• Review the science about each beverage and consider what is known about the health benefits and risks of each beverage category
• Classify beverages based on calories, nutrient content and potential health benefits and/or risks
The Beverage Panel
The University of North Carolina at Chapel Hill

The Findings
The Beverage Panel
The University of North Carolina at Chapel Hill

Energy Consumption from Beverages
• Today 23% of kcal from beverages. Need to reduce this level
The Beverage Panel
The University of North Carolina at Chapel Hill

Level I: Water
• Essential for life
• Needed for adequate hydration
• Dehydration: impaired cognition, moodiness, physical work performance, increased risk of bladder, colon, breast cancer
The Beverage Panel
The University of North Carolina at Chapel Hill

Level II: Tea and Coffee
• Tea and Coffee: Selected benefits on chronics, no adverse health effects in terms of weight gain and chronic diseases. The only issue is for high added cream and sugar such as for gourmet coffees
• Tea: In animal research, tea has protective role against selected cancers; unclear benefits in humans. Potential health benefits of flavonoids in tea are unclear
• Coffee: Mild antidepressant, some evidence lowers risk of Type 2 diabetes
• Caffeine: 400 mg limit. 32 ounce limit coffee [limit if pregnant]
The Beverage Panel
The University of North Carolina at Chapel Hill

Level III: Low Fat, Skim Milk and Fortified Soy Beverages
• Skim Milk – unclear benefits on weight loss and bone density and fractures. Important benefits as protein source for child linear growth. Also major provider of calcium and vitamin D
• Current consumption patterns indicate milk products are important contributors of many key nutrients
The Beverage Panel
The University of North Carolina at Chapel Hill

Level IV: Non-CaloricallySweetened Beverages
• High sweetness in these beverages holds the possibility that consumption of these sweet beverages may condition a preference for sweetness
The Beverage Panel
The University of North Carolina at Chapel Hill

Level V: Caloric Beverages With Some Nutrients
• Fruit juices: High in energy content, contribute limited nutrients
• Vegetable juices: Fewer calories, significant amounts of sodium
• Alcohol: Consumed in moderation has some health benefits
• Whole milk: Saturated fats are not needed
• Sports drinks: Reduced energy density over soft drinks, helpful for hydrating endurance athletes
The Beverage Panel
The University of North Carolina at Chapel Hill

Level VI: Calorically Sweetened Beverages
• Calorically-sweetened beverages are associated with increased energy intake
• Poor source of essential nutrients
The Beverage Panel
The University of North Carolina at Chapel Hill

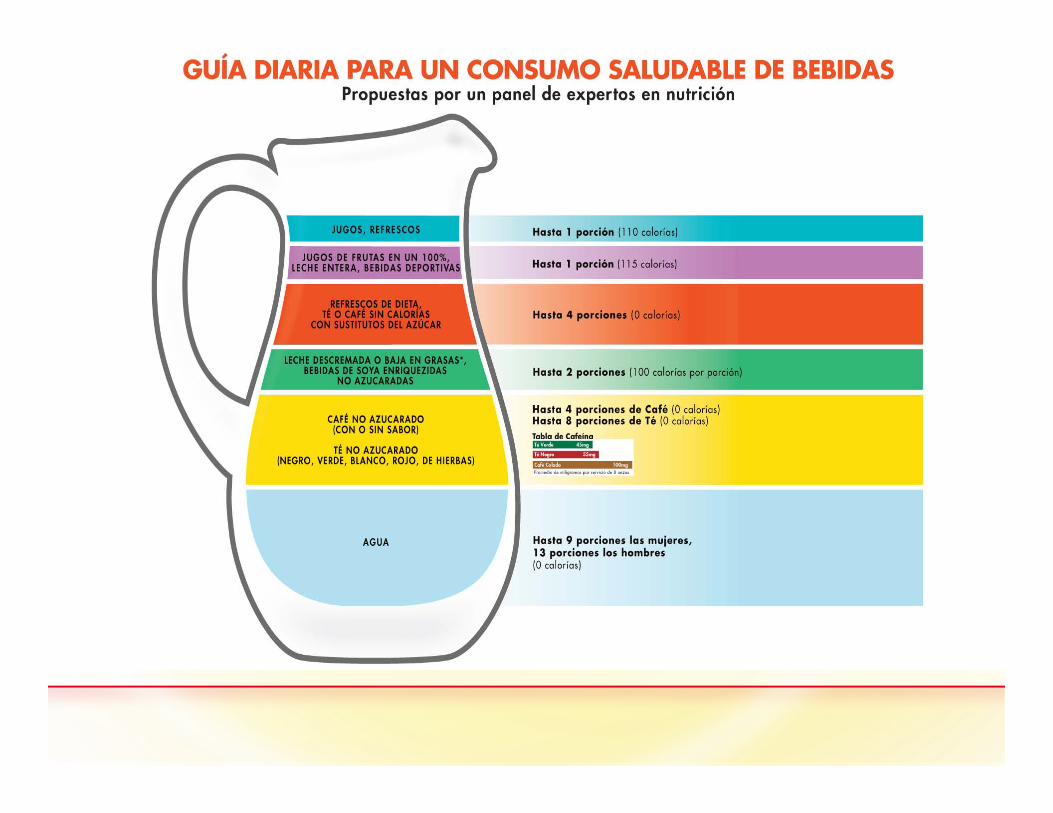
Example of Acceptable Beverage Pattern - 2200 Calories
• Level 1: Water 20-50 fl oz/d • Level 2: Tea and Coffee (unsweetened) 0-40 fl oz/d (can replace
water; caffeine is a limiting factor–up to 400 mg/d or about 32 fl oz/d of coffee)
• Level 3: Low Fat and Skim Milk and Soy Beverages 0-16 fl oz/d • Level 4: Noncalorically-Sweetened Beverages 0-32 fl oz/d (could
substitute for tea and coffee with the same limitations regarding caffeine)
• Level 5: Caloric Beverages with Some Nutrients: 100% fruit juices 0-8 fl oz/d, alcoholic beverages 0-1 drink per day for women and 0-2 drinks per day for men (one drink = 12 fl oz of beer, 5 fl oz of wine, or 1.5 fl oz of distilled spirits), whole milk 0 fl oz/d
• Level 6: Calorically-Sweetened Beverages 0-8 fl oz/d

Graphic worked out for the public