the ups and downs of populations -...
TRANSCRIPT

Heather Miller Printed on 3/21/2016
The Ups and Downs of Populations page 1
The Ups and Downs of Populations
Based on Oh Deer by Project WILD By Heather Miller
Focus on Inquiry The student will collect and analyze data, read, create and interpret graphs, and model population dynamics in a population of 100 deer as they encounter various limiting factors.
Lesson Content Overview Students will analyze population graphs, collect data to generate their own population graph, and experience limiting factors and their impact on carrying capacity in a small deer population. Students will be able to identify, explain, and evaluate the impact that different limiting factors have on the population of organisms including food, water, shelter, predation, human interference, changes in birth and death rate, changes in immigration and emigration, disease, and reproduction.
Duration
80 minutes
Setting
Classroom
Grouping
2-4 students
PTI Inquiry Subskills 1.3, 3.1, 4.2, 4.4, 5.8, 7.3, 7.5
Lesson Components
Estimated Time
Inquiry Subskills
Used
Technology Used
Level of Student
Engagement Brief Description
Engage 10
minutes 1.3, 4.2, 4.4, 7.5
Student personal electronic devices (BYOT)
2
Students will analyze 2 different deer population graphs and make hypotheses about what accounts for the differences in the populations. Students will conduct background research on what deer need to survive in the ecosystem.
Explore 20
minutes 3.1 None 3
Students will randomly draw cards to explore how different limiting factors cause changes to their population of deer.
Explain 20
minutes 4.2, 4.4, 5.8, 7.3
None 2 Students will graph their data and respond to follow up questions about their deer population changes.
Expand/Elaborate 20
minutes 4.4, 5.8,
7.3 None 2
Students will choose a different animal and identify the limiting factors in their ecosystem, graphically model the population of their animal and explain the cause of changes in their population.
Evaluate 10
minutes 7.3 None 1
Students will complete a summative assessment on population dynamics.
Level of Student Engagement 1 Low Listen to lecture, observe the teacher, individual reading, teacher demonstration, teacher-centered instruction
2 Moderate Raise questions, lecture with discussion, record data, make predictions, technology interaction with assistance
3 High Hands-on activity or inquiry; critique others, draw conclusions, make connections, problem-solve, student-centered
Next Generation Science Standards – Inquiry NGSS Practice 2: Developing and Using Models NGSS Practice 3: Planning and Carrying Out Investigations NGSS Practice 4: Analyzing and Interpreting Data NGSS Practice 6: Constructing Explanations NGSS Practice 8: Obtaining, Evaluating and Communicating Information
Heather Miller Printed on 3/21/2016
The Ups and Downs of Populations page 2
Next Generation Science Standards – Content HS-LS2-1.: Use mathematical and/or computational representations to support explanations of factors that affect carrying capacity of ecosystems at different scales.
LS2.A: Interdependent Relationships in Ecosystems LS2.C: Ecosystem Dynamics, Functioning, and Resilience
Florida Science Standards – Nature of Science SC.912.N.1.1: Define a concept in biology and do the following:
Pose questions about the natural world, Conduct systematic observations, Examine books and other sources of information to see what is already known, Review what is known in light of empirical evidence, Plan investigations, Use tools to gather, analyze, and interpret data (this includes the use of measurement in metric and other systems, and also the generation and interpretation of graphical representations of data, including data tables and graphs), Pose answers, explanations, or descriptions of events, Generate explanations that explicate or describe natural phenomena (inferences), Use appropriate evidence and reasoning to justify these explanations to others, Communicate results of scientific investigations, and Evaluate the merits of the explanations produced by others.
Florida Science Standards – Content SC.912.L.17.5: Analyze how population size is determined by births, deaths, immigration, emigration, and limiting factors (biotic and abiotic) that determine carrying capacity.
Materials and Advance Preparation Materials List
Group set:
Ups & Downs of Populations Cards (1 set per group)
Ups & Downs of Populations Student Worksheets (1 paper per group or student, as preferred)
Deer Population A and B Graphs (1 set per group)
Blackline Masters 1. Ups & Downs of Populations Cards – Blackline Master 1 2. Deer Population A and B Graphs – Blackline Master 2 3. Ups & Downs of Populations Student Worksheet – Blackline Master 3 4. Ups & Downs of Populations Assessment – Blackline Master 4 5. Ups & Downs of Populations Answer Keys – Blackline Master 5
Advance Preparation 1. Print enough copies of the Population Cards for each group/pair to have a set of cards. 2. Put cards in an envelope for each group. 3. Print enough copies of the Deer Population Graphs A & B for each group/pair to have a set. 4. Print enough copies of the Student Worksheets for each group/student to have one.
Lesson Information Learning Objectives
1. The student will be able to identify, explain, and evaluate the impact that different limiting factors have on the population of organisms including food, water, shelter, predation, human interference, changes in birth and death rate, changes in immigration and emigration, disease, and reproduction.
2. The student will be able to collect and analyze data, read, create and interpret graphs, and model population dynamics in a population of 100 deer as they encounter various limiting factors.
Prior Knowledge Needed by the Students
Heather Miller Printed on 3/21/2016
The Ups and Downs of Populations page 3
Students should have a general understanding of predator-prey relationships and factors that affect living things in their environment.
Students should have a general understanding of how to read and create line graphs.
No specific knowledge is required for this activity as students will uncover the concepts throughout the activity.
Background Information
Limiting factors are biotic (living) and abiotic (non-living) things in an ecosystem that prevent a population from growing any larger. For example, 100 deer may live in an ecosystem that has enough water, cover and space to support 200 deer, but if there is only enough food for 100 deer, the population will not grow any larger. In this example, food is the limiting factor.
Food is not the only factor that can limit population growth. For example, sometimes there is enough food in an ecosystem for a large population, but only a small amount of suitable shelter for the organism. Or maybe there is plenty of food, water, shelter and space to support a larger population in an area, but there are so many predators that it limits the amount of that organism.
Limiting factors are very closely tied to carrying capacity. Carrying capacity is the maximum number of a species that can be sustained by a given ecosystem. In the examples above, the carrying capacity of the deer would be 100 since there is only enough of all the resources for 100 deer to feasibly survive. Many animals can increase in numbers very quickly, and may temporarily exceed the carrying capacity of their ecosystem. When there are too many of a species in an ecosystem, this results in stress, starvation, disease, predation and parasites, poor reproductive success and damage to the habitat. For example, multiplying rabbits can very quickly eat all the vegetation in a grassland ecosystem. With the vegetation gone, food becomes the limiting factor and the rabbits may starve or move to another area (immigration). The grassland now has a reduced carrying capacity for rabbits until the vegetation grows back again.
Increasing or decreasing the limiting factors in an ecosystem will result in an increase or decrease in populations. Some of the limiting factors that are explored in this lesson include food, water, shelter, mates, too many males, too many females, drought, fire, hunters, car traffic, immigration, emigration, predators, dangerous organisms, parasites, and disease.
Lesson Procedure Engage
1. Students are introduced to the lesson’s focus question: How is population size affected by different environmental factors?
2. Looking at the patterns in two different graphs, students will predict what they think could account for the differences between the two populations of the deer and write these predictions on their worksheet. Student responses will vary.
3. With their face partner, students will rally robin (share back and forth) one idea each that they wrote for what is accounting for the differences between the two graphs. They will continue sharing back and forth until the teacher calls time (1-2 minutes).
4. With their shoulder partner, students will research the following questions (BYOD) (5-10 minutes): a. What do deer need to survive? Student responses will vary. b. What interferes with a deer’s survival? Student responses will vary.
5. Students will then complete the following hypothesis: If a population experiences ____________ then it will ____________ because _______________________________________________.
a. EX: If a population experiences (an abundance of food, a lack of water, harsh weather, hunting season, etc) then it will (increase, decrease, stay the same) because (deer need to eat a lot of food every day to sustain a healthy weight, deer need water to survive, the severe weather will cause some deer to die from exposure, etc). Student responses will vary.

Heather Miller Printed on 3/21/2016
The Ups and Downs of Populations page 4
Explore 1. Students will conduct their own population study with a population size of 100 deer. They will be
exposing their deer to factors that they commonly encounter in their natural ecosystems and will be evaluating how it impacts the deer population.
Procedure: 1. Draw one card out of the envelope at a time. 2. Read what the card says and record the results in your data table.
For example, if the card says that aliens have invaded and have killed 10 deer, subtract 10 deer from your population, record the new number of deer in your population, and then carry the new number into the row below for the next turn.
3. DO NOT put the card back in the envelope. 4. Draw the next card and continue drawing and recording data until you have drawn 20 cards and
completed all 20 trials. 5. When you are finished with your trials, put all cards back in the envelope.
Explain 1) Some questions you might ask students while they are working include:
a) Which factor(s) has/have had the most dramatic effect on your population so far? Student responses will vary but might include drought, mating, etc.
b) What is the highest your population has reached so far? Student responses will vary. c) Looking at your data so far, do you think your population is more like graph A or graph B?
Student responses will vary. d) Have you picked any cards that have surprised you? Student responses will vary.
2) The questions that are included on the student worksheet include: Expected student responses can be found in the answer key. a) Give an overall description of your graph/data. Explain what factors accounted for the major
increases or decreases in your population. b) Based on the cards that you chose, and using your data table as a reference, what do you think a
“limiting factor” is? c) What were some of the biotic limiting factors in the deer’s ecosystem? d) What were some of the abiotic limiting factors in the deer’s ecosystem? e) Choose two limiting factors that had a positive effect on your population and explain why they
had an impact on your population. f) Choose two limiting factors that had a negative effect on your population and explain why they
had an impact on your population. g) Carrying capacity is the maximum number of organisms that an ecosystem can support.
Looking at your data table and graph, what would you predict is the carrying capacity for your ecosystem? Explain your choice.
h) What is the relationship between limiting factors and carrying capacity in an ecosystem? i) Predict what you think would happen to a population that exceeds the carrying capacity for its
ecosystem. j) Explain how an immigration (movement INTO an area) of deer would impact the population in
terms of numbers, limiting factors, and carrying capacity. k) Explain how an emigration (movement OUT of an area) of deer would impact the population in
terms of numbers, limiting factors and carrying capacity. l) Density-dependent factors are limiting factors in an ecosystem that only impact a population
when the population becomes too large or too small. Which of the limiting factors that you encountered were density-dependent factors? Explain your rationale.

Heather Miller Printed on 3/21/2016
The Ups and Downs of Populations page 5
m) Density-independent factors are limiting factors in an ecosystem that impact a population regardless of the population size. Which of the limiting factors that you encountered were density-independent factors? Explain your rationale.
n) How is your graph similar or different than the graph of another group? Expand/Elaborate
1. Now that students know a little about deer and the limiting factors that affect their population sizes, they will think about one of their favorite animals or plant species and what might affect their population.
2. They will create a simulated population study of their animal based on a little research and their knowledge of limiting factors.
3. Students will complete their analysis of the animal’s/plant’s biotic factors, abiotic factors, density-dependent factors, density independent factors, factors that will increase the population, and factors that will decrease the population.
4. Lastly, they will draw a graph that could represent their animal’s population and its changes over time.
5. They will explain their graph in terms of what caused the changes in the population fluctuations (increases, decreases, etc). Assume that they begin with a population of 100 organisms.
Evaluate FORMAL EVALUTION Students will complete the Ups and Downs of Populations Assessment. Students can turn in their lab sheet or their Expand/Elaborate activity for Formal Observation and feedback. INFORMAL or OPTIONAL EVALUTIONS 1) Teacher Observation – Teacher should be watching students during the Explore for:
a) Students properly acquiring and recording data. b) Student understanding of their data through use of the Explain questions during and after the
Explore activity. c) Students properly graphing their data
WRAP UP.
Bring the lesson to a conclusion by discussing Explain questions in small groups or as a whole class.
Have students share their Expand/Elaborate assignment in their groups or do a whole class gallery walk.
Watch the Crash Course: Population Ecology video from YouTube: https://www.youtube.com/watch?v=RBOsqmBQBQk or if you cannot access YouTube: https://www.khanacademy.org/science/biology/crash-course-bio-ecology/crash-course-ecology-2/v/crash-course-ecology-02.
***Make sure to fast forward past the advertisements and display the video in “full screen”
mode so that the web page advertisements located on the right-hand side and underneath the
video will not be seen. In addition, please be on the lookout for “pop-up” ads while the video
is playing.*** Supplementary Resources Teachers
Crash Course. (2012). Population Ecology: The Texas Mosquito Mystery - Crash Course Ecology #2. Retrieved from https://www.youtube.com/watch?v=RBOsqmBQBQk or https://www.khanacademy.org/science/biology/crash-course-bio-ecology/crash-course-ecology-2/v/crash-course-ecology-02.

Heather Miller Printed on 3/21/2016
The Ups and Downs of Populations page 6
International Hunter Education Association. (2002). Limiting Factors. Retrieved from http://homestudy.ihea.com/wildlife/09limits.htm.
Students Andrew Raider Studios. (2015) Geography4kids.com: Populations. Retrieved from
http://www.geography4kids.com/files/land_population.html Ecology. (2015). In Compton's by Britannica. Retrieved from http://kids.britannica.com/comptons/article-
273221/ecology CITATION OF SOURCES.
Colorado Parks and Wildlife. (n.d.) Oh Deer! Retrieved from http://cpw.state.co.us/learn/Pages/ProjectWildOhDeer.aspx
Crash Course. (2012). Population Ecology: The Texas Mosquito Mystery - Crash Course Ecology #2.
Retrieved from https://www.youtube.com/watch?v=RBOsqmBQBQk or https://www.khanacademy.org/science/biology/crash-course-bio-ecology/crash-course-ecology-2/v/crash-course-ecology-02.
International Hunter Education Association. (2002). Limiting Factors. Retrieved from
http://homestudy.ihea.com/wildlife/09limits.htm. Parker, C. (1999). Oh Deer! Retrieved from http://www.beaconlearningcenter.com/documents/313_01.pdf All pictures are copyright free and retrieved from: Ups and Downs of Populations Cards: Flame: https://pixabay.com/get/9732887a5bc608483fc8/1441312505/fire-30276_1280.png?direct Drought: https://www.flickr.com/photos/oxfameastafrica/5758386784/ Snake: https://pixabay.com/get/66595badd7fa9a966102/1441312162/rattlesnake-32693_1280.png?direct Wolf: http://www.freestockphotos.biz/stockphoto/14950 Bear: http://www.freestockphotos.biz/stockphoto/13322 Buck: : www.public-domain-image.com%2Ffree-images%2Fart%2Fline-art-illustration-pictures%2Fwhite-tailed-deer-
head-illustration%2Fattachment%2Fwhite-tailed-deer-head-illustration&psig=AFQjCNF-0XvP6VQAiiCVaKGn79NibGF_Ig&ust=1441470873659269 Doe: https://pixabay.com/get/a4b6fbfb70b5a7d10c89/1441384611/female-48231_1280.png?direct Skull: http://www.sketchport.com/drawing/5684992466223104/ol-alfred Shelter: http://www.freestockphotos.biz/stockphoto/15119 Water: http://www.public-domain-image.com/free-images/flora-plants/flowers/water-lily-lotus-flower/aquatic-
environments-plants-water-lilies-leaves/attachment/aquatic-environments-plants-water-lilies-leaves Food: http://www.torange.us/Plants/fruit-and-berries/currants-in-isolation-33142.html Hunter: https://pixabay.com/get/a0a3a77e989458d58353/1441383050/hunter-160297_1280.png?direct Biting Fly: https://commons.wikimedia.org/wiki/File:Biting_Midge.png Car: http://www.freestockphotos.biz/stockphoto/15049 Doe & Buck: http://www.public-domain-image.com/free-images/fauna-animals/deers/mule-deer-in-
california/attachment/mule-deer-in-california
Ups and Downs of Populations Assessment: Food Web: https://commons.wikimedia.org/wiki/File:TrophicWeb.jpg Four Animal Populations Graph: https://stangbio.wikispaces.com/Ecology All pre-made charts, tables, and graphs created by Heather Miller.
Ups and Downs of Populations Student Worksheet: All pre-made charts, tables, and graphs created by Heather Miller. Student graph paper: http://www.texample.net/tikz/examples/graph-paper/
____ Yes, I cited all materials and resources used in this lesson. Heather Miller
Lesson author signature

Heather Miller Printed on 3/21/2016
The Ups and Downs of Populations page 7
Photo Credit:
https://pixabay.com/get/9732887a5bc608483fc8/1441312505/fire-
30276_1280.png?direct
Photo Credit: https://www.flickr.com/photos/oxfameastafrica/5758386784/
Photo Credit:
https://pixabay.com/get/66595badd7fa9a966102/1441312162/rattlesnake-
32693_1280.png?direct
A fire has engulfed a large section of the forest. 25 deer have died
as a result.
It hasn’t rained in weeks and your ecosystem is suffering a
drought. As a result, half of your current population dies.
A new family of rattlesnakes are living in your area and have
bitten 5 deer in your population. As a result, all 5 deer have died.
Photo Credit:
https://pixabay.com/get/66595badd7fa9a966102/1441312162/rattlesnake-
32693_1280.png?direct
Photo Credit: http://www.freestockphotos.biz/stockphoto/14950 Photo Credit: http://www.freestockphotos.biz/stockphoto/14950
A new family of rattlesnakes are living in your area and have
bitten 5 deer in your population. As a result, all 5 deer have died.
You share your habitat with wolves and they are your predator. 5 deer in your
population have died to feed the wolves.
You share your habitat with wolves and they are your predator. 5 deer in your
population have died to feed the wolves.
Photo Credit: http://www.freestockphotos.biz/stockphoto/14950
Photo Credit: http://www.freestockphotos.biz/stockphoto/14950
Photo Credit: http://www.freestockphotos.biz/stockphoto/13322
You share your habitat with wolves and they are your predator. 5 deer in your
population have died to feed the wolves.
You share your habitat with wolves and they are your predator. 5 deer in your
population have died to feed the wolves.
The local bear family can’t find any more fish so they have turned to the deer in your
population as a food source. 5 deer in your population have been killed to feed the bears.
Blackline Master 1

Heather Miller Printed on 3/21/2016
The Ups and Downs of Populations page 8
Photo Credit: www.public-domain-image.com%2Ffree-
images%2Fart%2Fline-art-illustration-pictures%2Fwhite-tailed-deer-head-illustration%2Fattachment%2Fwhite-tailed-deer-head-
illustration&psig=AFQjCNF-0XvP6VQAiiCVaKGn79NibGF_Ig&ust=1441470873659269
Photo Credit:
https://pixabay.com/get/a4b6fbfb70b5a7d10c89/1441384611/female-48231_1280.png?direct
Photo Credit: http://www.sketchport.com/drawing/5684992466223104/ol-
alfred
There are too many males in your population and not enough
females. Decrease your population by 20 deer.
There are too many females in your population and most are of age to reproduce. Increase your
population by 20 deer.
It was a harsh winter and all of your infant and elderly deer die. Decrease your population by 20
deer.
Photo Credit: http://www.freestockphotos.biz/stockphoto/15119
Photo Credit: http://www.freestockphotos.biz/stockphoto/15119 Photo Credit: http://www.freestockphotos.biz/stockphoto/15119
You’ve found SHELTER!
Increase your population by 10 deer.
You’ve found SHELTER!
Increase your population by 10 deer.
You’ve found SHELTER!
Increase your population by 10 deer.
Photo Credit: http://www.freestockphotos.biz/stockphoto/15119
Photo Credit: http://www.public-domain-image.com/free-images/flora-
plants/flowers/water-lily-lotus-flower/aquatic-environments-plants-water-lilies-leaves/attachment/aquatic-environments-plants-water-lilies-leaves
Photo Credit: http://www.public-domain-image.com/free-images/flora-
plants/flowers/water-lily-lotus-flower/aquatic-environments-plants-water-lilies-leaves/attachment/aquatic-environments-plants-water-lilies-leaves
You’ve found SHELTER!
Increase your population by 10 deer.
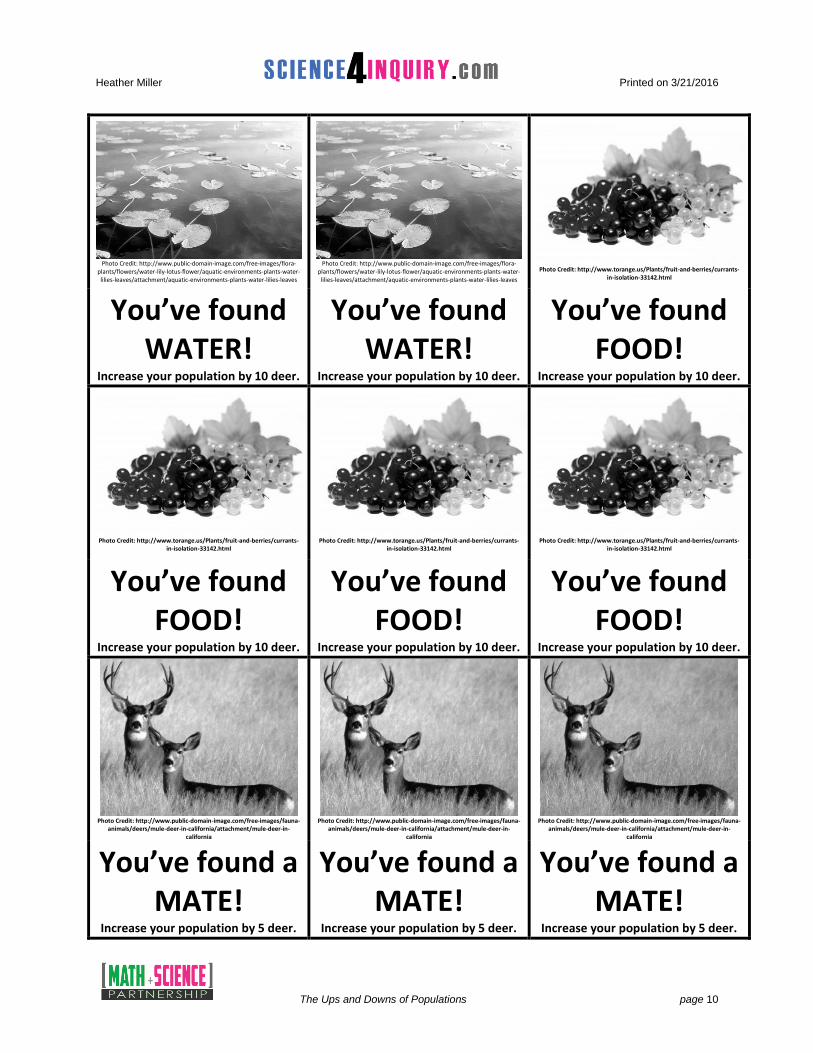
You’ve found WATER!
Increase your population by 10 deer.
You’ve found WATER!
Increase your population by 10 deer.

Heather Miller Printed on 3/21/2016
The Ups and Downs of Populations page 9
Photo Credit: http://www.freestockphotos.biz/stockphoto/13322
Photo Credit:
https://pixabay.com/get/a0a3a77e989458d58353/1441383050/hunter-
160297_1280.png?direct
Photo Credit:
https://pixabay.com/get/a0a3a77e989458d58353/1441383050/hunter-
160297_1280.png?direct The local bear family can’t find
any more fish so they have turned to the deer in your
population as a food source. 5 deer in your population have been killed to feed the bears.
There are hunters in your area. 10 deer in your population have
been shot and killed.
There are hunters in your area. 10 deer in your population have
been shot and killed.
Photo Credit: https://commons.wikimedia.org/wiki/File:Biting_Midge.png
Photo Credit: https://commons.wikimedia.org/wiki/File:Biting_Midge.png
Photo Credit: http://www.freestockphotos.biz/stockphoto/15049
The biting fly population is booming this year! As a result,
many of the deer in your population have contracted
Hemorrhagic Disease and 5 have died.
The biting fly population is booming this year! As a result,
many of the deer in your population have contracted
Hemorrhagic Disease and 5 have died.
There is a highway near your habitat that your population
often crosses. Many are hit by cars. Decrease your deer
population by 10.
Photo Credit: http://www.public-domain-image.com/free-images/flora-
plants/flowers/water-lily-lotus-flower/aquatic-environments-plants-water-
lilies-leaves/attachment/aquatic-environments-plants-water-lilies-leaves
Photo Credit: http://www.torange.us/Plants/fruit-and-berries/currants-
in-isolation-33142.html
Photo Credit: http://www.freestockphotos.biz/stockphoto/15119
You’ve found WATER!
Increase your population by 10 deer.
You’ve found FOOD!
Increase your population by 10 deer.
You’ve found SHELTER!
Increase your population by 10 deer.
Heather Miller Printed on 3/21/2016
The Ups and Downs of Populations page 10
Photo Credit: http://www.public-domain-image.com/free-images/flora-
plants/flowers/water-lily-lotus-flower/aquatic-environments-plants-water-lilies-leaves/attachment/aquatic-environments-plants-water-lilies-leaves
Photo Credit: http://www.public-domain-image.com/free-images/flora-
plants/flowers/water-lily-lotus-flower/aquatic-environments-plants-water-lilies-leaves/attachment/aquatic-environments-plants-water-lilies-leaves
Photo Credit: http://www.torange.us/Plants/fruit-and-berries/currants-
in-isolation-33142.html
You’ve found WATER!
Increase your population by 10 deer.
You’ve found WATER!
Increase your population by 10 deer.
You’ve found FOOD!
Increase your population by 10 deer.
Photo Credit: http://www.torange.us/Plants/fruit-and-berries/currants-
in-isolation-33142.html Photo Credit: http://www.torange.us/Plants/fruit-and-berries/currants-
in-isolation-33142.html Photo Credit: http://www.torange.us/Plants/fruit-and-berries/currants-
in-isolation-33142.html
You’ve found FOOD!
Increase your population by 10 deer.
You’ve found FOOD!
Increase your population by 10 deer.
You’ve found FOOD!
Increase your population by 10 deer.
Photo Credit: http://www.public-domain-image.com/free-images/fauna-
animals/deers/mule-deer-in-california/attachment/mule-deer-in-california
Photo Credit: http://www.public-domain-image.com/free-images/fauna-
animals/deers/mule-deer-in-california/attachment/mule-deer-in-california
Photo Credit: http://www.public-domain-image.com/free-images/fauna-
animals/deers/mule-deer-in-california/attachment/mule-deer-in-california
You’ve found a MATE!
Increase your population by 5 deer.
You’ve found a MATE!
Increase your population by 5 deer.
You’ve found a MATE!
Increase your population by 5 deer.

Heather Miller Printed on 3/21/2016
The Ups and Downs of Populations page 11
Blackline Master 2

Heather Miller Printed on 3/21/2016
The Ups and Downs of Populations page 12
Heather Miller Printed on 3/21/2016
The Ups and Downs of Populations page 13
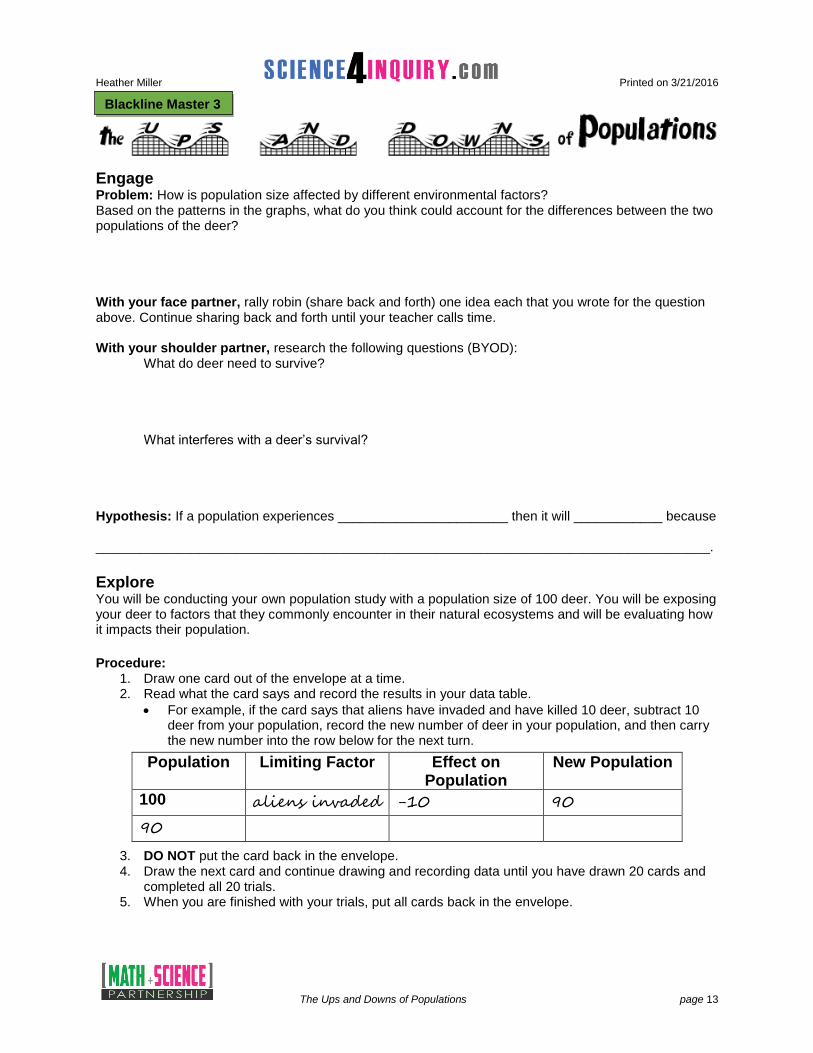
Engage Problem: How is population size affected by different environmental factors? Based on the patterns in the graphs, what do you think could account for the differences between the two populations of the deer? With your face partner, rally robin (share back and forth) one idea each that you wrote for the question above. Continue sharing back and forth until your teacher calls time. With your shoulder partner, research the following questions (BYOD):
What do deer need to survive? What interferes with a deer’s survival?
Hypothesis: If a population experiences _______________________ then it will ____________ because ___________________________________________________________________________________.
Explore You will be conducting your own population study with a population size of 100 deer. You will be exposing your deer to factors that they commonly encounter in their natural ecosystems and will be evaluating how it impacts their population.
Procedure:
1. Draw one card out of the envelope at a time. 2. Read what the card says and record the results in your data table.
For example, if the card says that aliens have invaded and have killed 10 deer, subtract 10 deer from your population, record the new number of deer in your population, and then carry the new number into the row below for the next turn.
3. DO NOT put the card back in the envelope. 4. Draw the next card and continue drawing and recording data until you have drawn 20 cards and
completed all 20 trials. 5. When you are finished with your trials, put all cards back in the envelope.
Population Limiting Factor Effect on Population
New Population
100 aliens invaded -10 90
90
Blackline Master 3

Heather Miller Printed on 3/21/2016
The Ups and Downs of Populations page 14
Deer Population Data Table (each turn represents population changes over a 3 month period)
Turn Population Limiting Factor Effect on
Population New
Population
1 100 Deer
2
3
4
5
6
7
8
9
10
11
12
13
14
15
16
17
18
19
20
Heather Miller Printed on 3/21/2016
The Ups and Downs of Populations page 15
Deer Population Graph
Photo Credit: http://www.texample.net/tikz/examples/graph-paper/
Months (1 turn = 3 months)
De
er
Po
pu
lati
on

Heather Miller Printed on 3/21/2016
The Ups and Downs of Populations page 16
Explain Use your data and your graph to help you answer the following questions. 1. Give an overall description of your graph/data. Explain what factors accounted for the major
increases or decreases in your population.
2. Based on the cards that you chose, and using your data table as a reference, what do you think a “limiting factor” is?
3. What were some of the biotic limiting factors in the deer’s ecosystem?
4. What were some of the abiotic limiting factors in the deer’s ecosystem?
5. Choose two limiting factors that had a positive effect on your population and explain why they had an impact on your population.
6. Choose two limiting factors that had a negative effect on your population and explain why they had
an impact on your population. 7. Carrying capacity is the maximum number of organisms that an ecosystem can support. Looking at
your data table and graph, what would you predict is the carrying capacity for your ecosystem? Explain your choice.

Heather Miller Printed on 3/21/2016
The Ups and Downs of Populations page 17
8. What is the relationship between limiting factors and carrying capacity in an ecosystem? 9. Predict what you think would happen to a population that exceeds the carrying capacity for its
ecosystem. 10. Explain how an immigration (movement INTO an area) of deer would impact the population in terms
of numbers, limiting factors, and carrying capacity. 11. Explain how an emigration (movement OUT of an area) of deer would impact the population in terms
of numbers, limiting factors and carrying capacity. 12. Density-dependent factors are limiting factors in an ecosystem that only impact a population when
the population becomes too large or too small. Which of the limiting factors that you encountered were density-dependent factors? Explain your rationale.
13. Density-independent factors are limiting factors in an ecosystem that impact a population
regardless of the population size. Which of the limiting factors that you encountered were density-independent factors? Explain your rationale.
14. How is your graph similar or different than the graph of another group?
Heather Miller Printed on 3/21/2016
The Ups and Downs of Populations page 18
Expand/Elaborate Now that you know a little about deer and the limiting factors that affect their population sizes, think about one of your favorite animal or plant species and what might affect their population. You will be creating a simulated population study of your animal based on a little research and your knowledge of limiting factors.
Animal: ___________________________
Biotic Factors
Abiotic Factors
Density-dependent limiting factors:
Density-independent limiting factors:
Factors that will increase the population:
Factors that will decrease the population:
Draw a graph that could represent your animal’s population and its changes over time. Explain your graph in terms of what caused the changes in the population fluctuations (increases, decreases, etc). Assume that you begin with a population of 100 organisms.
Explanation of your graph:

Heather Miller Printed on 3/21/2016
The Ups and Downs of Populations page 19
Assessment
1. The carrying capacity of an ecosystem is the maximum number of individuals of a particular species that can be supported on a long-term basis in a given amount of land. For example, the carrying capacity of the Florida Panther may be 50 panthers per 10,000 square kilometers of habitat in the Everglades ecosystem. Which of the following determines the carrying capacity of an ecosystem? (SC.912.L.17.5)
a. the availability of resources required for survival b. the average daily temperature of the ecosystem c. the number of predators found in the ecosystem d. the amount of disease affecting organisms in the ecosystem
2. The graph shown represents the population growth curves of two different species of organisms, A and B. What is a valid prediction based on this graph? (SC.912.L.17.5) (PTI 4,4. 5.8)
Photo Credit: Drawn by Heather Miller
a. Species A will eliminate species B after 1 year. b. Species A will not be present in the winter months. c. Species B will attain maximum population size each autumn due to a decrease in
temperature. d. Species B will decrease in population size approximately 2 months after a decrease in
the population size of species A. 3. The food web below shows the relationship between different factors in a forest ecosystem. (SC.912.L.17.5) (PTI 5.8)
Photo Credit: https://commons.wikimedia.org/wiki/File:TrophicWeb.jpg
Identify an abiotic limiting factor that could inhibit the growth of the snake population. a. disease in the trees b. a decrease in air and soil quality c. an increase in the fox population d. a decrease in the number of frogs
Blackline Master 4

Heather Miller Printed on 3/21/2016
The Ups and Downs of Populations page 20
4. Goatfish are fish that move in schools and feed on plankton and plant matter. Natural predators of the goatfish include sea trout, sharks, pelicans and dolphins. The graph below shows how the number of goatfish in an area has changed over time. (SC.912.L.17.5) (PTI 4.4, 5.8)
Photo Credit: Created by Heather Miller in Excel
Based on the data, one student concludes that a new predator was introduced into the area during this time period. Which of the following is a likely alternate explanation for the change in the goatfish population?
a. the temperature of the area increased b. the amount of goatfish prey increased in the area c. the amount of aquatic plants in the area decreased d. the amount of goatfish parasites decreased in the area
5. The graph below shows changes in the sizes of four animal populations over a 16-year period.
Photo Credit: https://stangbio.wikispaces.com/Ecology
In which population was birthrate most likely greater than death rate from year 8 to year 12? (SC.912.L.17.5) (PTI 4.4, 5.8)
a. population 1 b. population 2 c. population 3 d. population 4
OPTIONAL (not assessed on EOC). 6. Which of the following is NOT an example of a density-dependent limiting factor?
a. Diseases b. Natural disasters c. Parasites d. Predators

Heather Miller Printed on 3/21/2016
The Ups and Downs of Populations page 21
Engage:
Based on the patterns in the graphs…Student responses will vary.
What do deer need to survive? Student responses will vary but could include food, water, shelter, space, and mates.
What interferes with a deer’s survival? Student responses will vary but could include disease, hunters, lack of food, water, shelter, space, and mates.
Hypothesis: If a population experiences (a hardship, lack of food, lack of water, too many predators, an abundance of food, a stable ecosystem, etc) then it will (increase, decrease, stay the same, etc) because (organisms need food to survive, organisms need to mate to carry on the population, etc.)
Explore:
Student data & graphs will vary. Explain:
1. Give an overall description of your graph/data. Explain what factors accounted for the major increases or decreases in your population. Student responses will vary based on their graphs. Students should be able to identify what caused the increases and decreases in their population of deer.
2. Based on the cards that you chose, and using your data table as a reference, what do you think a “limiting factor” is? Student response should indicate that a limiting factor is anything in an organisms’ environment that can have a positive or negative impact on their population size.
3. What were some of the biotic limiting factors in the deer’s ecosystem? Food, hunters, bears, wolves, mates, biting flies, disease (if not viral), shelter (if trees and brush), snakes, and bears. Students may have additional responses that are correct as long as they are LIVING things.
4. What were some of the abiotic limiting factors in the deer’s ecosystem? Water, air, cars, fire, drought, guns, and seasons. Students may have additional responses that are correct as long as they are NON-LIVING things.
5. Choose two limiting factors that had a positive effect on your population and explain why they had an impact on your population. Food, water, shelter, mates, too many females all had a positive impact on the population. These allowed the deer to be healthy and reproduce which increased their numbers.
6. Choose two limiting factors that had a negative effect on your population and explain why they had an impact on your population. Drought, fire, snake bites, predators, disease, too many males, hunters, bad weather, and car traffic all had a negative impact on the population. These factors caused death or heightened competition which led to a decrease in numbers.
7. Carrying capacity is the maximum number of organisms that an ecosystem can support. Looking at your data table and graph, what would you predict is the carrying capacity for your ecosystem? Explain your choice. Student responses will vary depending on their graphs and data. The carrying capacity should be represented somewhere around their maximum population. Once deer reach a certain population size, the resources in their ecosystem become stretched too thin amongst the deer and deer begin dying or are not born.
Blackline Master 5: Answer Keys

Heather Miller Printed on 3/21/2016
The Ups and Downs of Populations page 22
8. What is the relationship between limiting factors and carrying capacity in an ecosystem? Student responses may vary but should indicate something similar to: The amount of limiting factors in an ecosystem determine the carrying capacity for each organism. For example, there may be enough food for 100 deer, but if there are too many predators, then the population of deer may only reach 50.
9. Predict what you think would happen to a population that exceeds the carrying capacity for its ecosystem. When a population exceeds its carrying capacity, natural factors (disease, food shortage, water shortage, competition over mates, etc) will cause deer to die or not be able to reproduce. This will decrease the deer numbers back to below the carrying capacity.
10. Explain how an immigration (movement INTO an area) of deer would impact the population in terms of numbers, limiting factors, and carrying capacity. Immigration into a community would cause the deer population to rise, there would be a strain on the limiting factors in the environment (like food shortage, water shortage, etc), the population would climb toward its carrying capacity, deer would begin to struggle for survival and would die off until the numbers fell back below the carrying capacity.
11. Explain how an emigration (movement OUT of an area) of deer would impact the population in terms of numbers, limiting factors and carrying capacity. . Emigration out of a community would cause the deer population to fall, there would be an abundance on the limiting factors in the environment (like food, water, shelter, etc), the population would climb toward its carrying capacity, deer would begin to struggle for survival and would die off until the numbers fell back below the carrying capacity.
12. Density-dependent factors are limiting factors in an ecosystem that only impact a population when the population becomes too large or too small. Which of the limiting factors that you encountered were density-dependent factors? Explain your rationale. Competition for food, water, shelter, predation by bears and wolves, and mates would all increase if the population is large and dense. The spread of disease within the population would also increase as the density of the population increases. With these factors, the more deer you have, the more likely they are to affect the population.
13. Density-independent factors are limiting factors in an ecosystem that impact a population regardless of the population size. Which of the limiting factors that you encountered were density-independent factors? Explain your rationale. Fire, drought, hunters, snakes, harsh weather, and car traffic are all factors that are not affected by how many deer there are. Whether there are 5 deer or 500 deer, these factors will impact the population size.
14. How is your graph similar or different than the graph of another group? Student responses will vary depending on their graph and the graph they choose for comparison.
Extend/Elaborate: Student animals, biotic factors, abiotic factors, density dependent & independent factors, graphs, and explanations will vary. Evaluate: 1. A 2. D 3. B 4. C 5. C 6. B