the untold story of the pig farming sector of rural
TRANSCRIPT
THE UNTOLD STORY OF THE PIG FARMING SECTOR OF RURAL KWAZULU-NATAL: A CASE STUDY OF UTHUKELA DISTRICT
By
SIBONGISENI THOKOZANI GCUMISA
Submitted in accordance with the requirements for the degree of
MASTER OF SCIENCE
in
AGRICULTURE
at the
UNIVERSITY OF SOUTH AFRICA
SUPERVISOR: PROF MARY M. MASAFU CO-SUPERVISOR: DR. JAMES W. OGUTTU
JUNE 2013

i
DECLARATION OF ORIGINALITY
I certify that the work presented in this dissertation is, to the best of my
knowledge and belief, original, except as acknowledged in the text and that
and the material has not been submitted, either in whole or in part, for a
degree at this or other university. I also certify that I have complied with the
rules, requirements, procedures and policy of the university.
Signed: __________________________________________
SIBONGISENI THOKOZANI GCUMISA Student No: 45005281
Date: 14 JUNE 2013
ii
ACKNOWLEDGEMENTS
I would like to express my sincere appreciation to the following for their assistance with
this work. Firstly to God the Almighty (without you, nothing is possible), the KZN
Department of Agriculture and Environmental Affairs for funding the study, my supervisor
Professor Mary M. Masafu (It’s been a rocky road for me and you kept me going), Dr
James W. Oguttu (co-supervisor), Cathy Stevens (assistance with data analysis), Dr H. de
Villiers (KZNDAEA Research Manager), Farming Systems Research Section colleagues
(Mr T. Mpanza, Mr S. Radebe, Mr S. Gumede, Mr F. Khuboni, Mr S. Thusi, Ms Z. Bovula,
Ms T. Mpakama , Mr S. Madiba, Mr S. Zondi and Mr J. Nzimande).
The Department of Agriculture and Environmental Affairs, Extension colleagues of
uThukela District (Mr P.R. Gwamanda, Ms Z. Mhlambi, Mr B. Khoza, Ms T. Dlamini, Mr
Z.V. Nkosi Mr O. Khuboni, Mr B. Khumalo, Ms T.H. Mkhize, Mr T.A. Malevu, Mr R. Mkhize,
Mr D.R. Hlatswayo and Mr A.M Mdlolo) for allowing me to work in your areas, assistance
with data collection and for helping me get access to the different areas and finally but not
least to all the pig farmers interviewed in the study for opening your warm hands to us.
To my mother (MaGumede), all my siblings (Mzo, Kwazi, Sindi, Phiwo and Phesh), my son
Minenhle and all other family members and friends for their support throughout my studies.
Finally to my late father, Mlindeli Simeon Gcumisa (Jezangeze) for teaching me how to
endure pain and yet still not give up!
To him I say:
Ngiyabonga wena ka “Mbikwa - Jivaza, kaMathuk’ ashay’ isithunzi sakhe, ka Mcanjana
KaManyosi kaSigobhe kaLubanjana’.
“ Ngwazi, Jezangeze, Ngangakazane
Manukelana, wena owanukela abakwenu waze wanukela nabezizwe
Nokhonkothwa izinja zakub’ oDibini
Kuhhahhame nezasendlunkul’ eTsheni, Zayikhex’ imilomo
Ngikhuluma nje nanamhlanje zisayikhexile”
Ngiyabonga sihlakaniphi, sesifundiswa esizishaya umfokazane
Ngiyabonga mntanenkosi!
iii
TABLE OF CONTENTS
DECLARATION OF ORIGINALITY................................................................................... i
ACKNOWLEDGEMENTS ........................................................................................... ii TABLE OF CONTENTS .............................................................................................. iii LIST OF TABLES ....................................................................................................... v
LIST OF FIGURES ...................................................................................................... vi LIST OF PLATES........................................................................................................ vii ABBREVIATIONS ..................................................................................................... viii ABSTRACT ................................................................................................................ x
CHAPTER 1: GENERAL INTRODUCTION .............................................................. 1 1.1 Background information ..................................................................................... 1
1.2 Problem statement ............................................................................................. 4
1.3 Assumptions/hypotheses ................................................................................... 5
1.4 Purpose statement ............................................................................................. 5
1.5 Research question ............................................................................................. 5
1.6 Aims and objectives ........................................................................................... 5
1.6.1 The aim ................................................................................................. 5
1.6.2 The objectives ....................................................................................... 5
1.7 Anticipated benefits of the study ........................................................................ 5
1.8 Ethical considerations ....................................................................................... 6
1.9 Components of the report .................................................................................. 6
CHAPTER 2: LITERATURE REVIEW ........................................................................ 8
2.1 Poverty in KwaZulu-Natal and uThukela District ............................................... 8
2.2 Fighting poverty through agriculture .................................................................. 9
2.3 Reasons for farming and owning pigs in rural areas ........................................ 11
2.4 Pig industry and pork consumption in South Africa .......................................... 12
2.5 Marketing of rural pigs ....................................................................................... 13
2.6 Production systems and management practices ................................................ 14
2.6.1 Pig farmers in rural areas ....................................................................... 14
2.6.2 Breeds kept in rural areas ....................................................................... 14
2.6.3 Breeding ................................................................................................ 16
2.6.4 Pig housing ............................................................................................ 16
iv
2.6.5 Nutrition ................................................................................................. 17
2.6.6 Health and mortalities ............................................................................ 19
CHAPTER 3: RESEARCH METHODOLOGY ............................................................ 21 3.1 Materials and methods ...................................................................................... 21
3.1.1 Study area ................................................................................................ 21
3.1.2 Research design and approach ................................................................ 24
3.1.3 Sample size and sample selection ........................................................... 24
3.1.4 Sampling tools .......................................................................................... 25
3.1.5 Sampling procedures ............................................................................... 25
3.1.6 Data collection .......................................................................................... 26
3.1.7 Data analysis ............................................................................................ 27
3.2 Limitations of the study ...................................................................................... 27
CHAPTER 4: RESULTS ............................................................................................. 28 4.1 Profile of study area and the participants .......................................................... 28
4.2 The social and economic contributions of pigs to households ........................... 33
4.3 Production systems ........................................................................................... 41
CHAPTER 5: DISCUSSIONS ..................................................................................... 56
5.1 Profile of study area and the participants .......................................................... 56
5.2 The social and economic contributions of pigs to households ........................... 62
5.3 Production systems ........................................................................................... 71
CHAPTER 6: CONCLUSIONS AND RECOMMENDATIONS……………………… ..... 97 Introduction ……………………………………………………………………………… ...... 97
6.1 Conclusions ……………………………………………………………………… ...... 97
6.2 Recommendations ……………………………………………………………… ....... 99
REFERENCES ........………………………………………………………………………… 103
THE APPENDIX.…………………………………………………………………………… 112
v
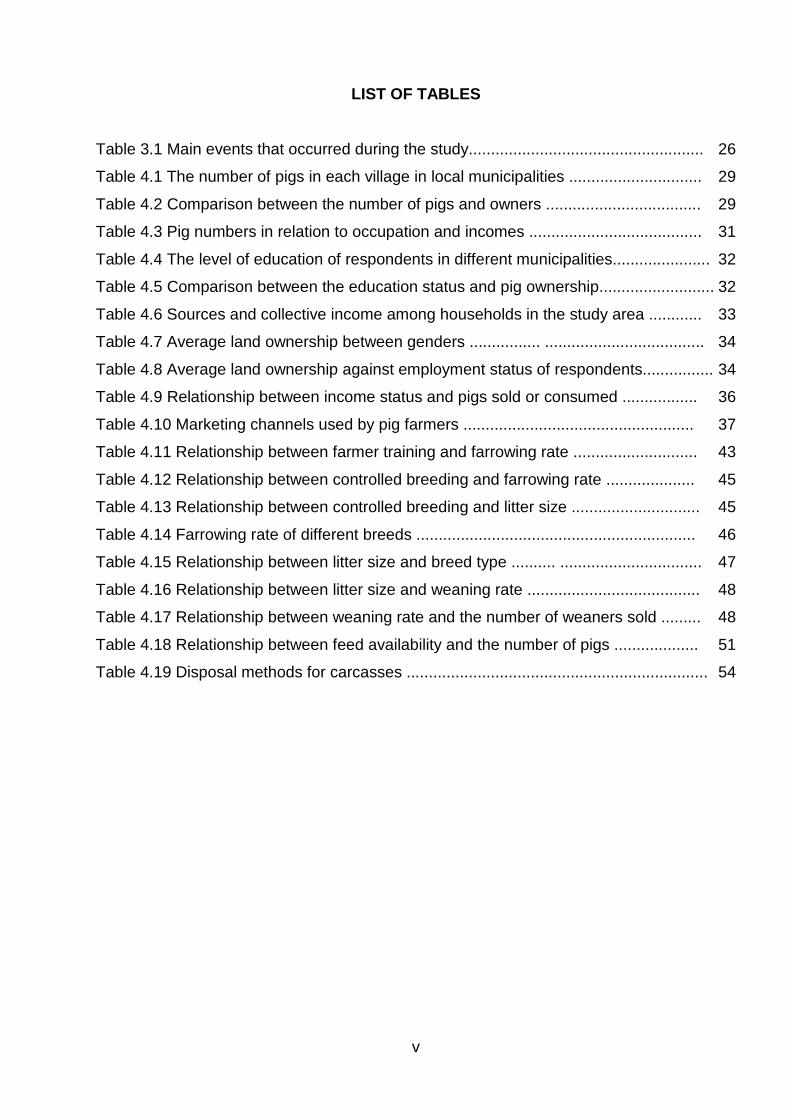
LIST OF TABLES
Table 3.1 Main events that occurred during the study..................................................... 26
Table 4.1 The number of pigs in each village in local municipalities .............................. 29
Table 4.2 Comparison between the number of pigs and owners ................................... 29
Table 4.3 Pig numbers in relation to occupation and incomes ....................................... 31
Table 4.4 The level of education of respondents in different municipalities...................... 32
Table 4.5 Comparison between the education status and pig ownership.......................... 32
Table 4.6 Sources and collective income among households in the study area ............ 33
Table 4.7 Average land ownership between genders ................ .................................... 34
Table 4.8 Average land ownership against employment status of respondents................ 34
Table 4.9 Relationship between income status and pigs sold or consumed ................. 36
Table 4.10 Marketing channels used by pig farmers .................................................... 37
Table 4.11 Relationship between farmer training and farrowing rate ............................ 43
Table 4.12 Relationship between controlled breeding and farrowing rate .................... 45
Table 4.13 Relationship between controlled breeding and litter size ............................. 45
Table 4.14 Farrowing rate of different breeds ............................................................... 46
Table 4.15 Relationship between litter size and breed type .......... ................................ 47
Table 4.16 Relationship between litter size and weaning rate ....................................... 48
Table 4.17 Relationship between weaning rate and the number of weaners sold ......... 48
Table 4.18 Relationship between feed availability and the number of pigs ................... 51
Table 4.19 Disposal methods for carcasses .................................................................... 54
vi
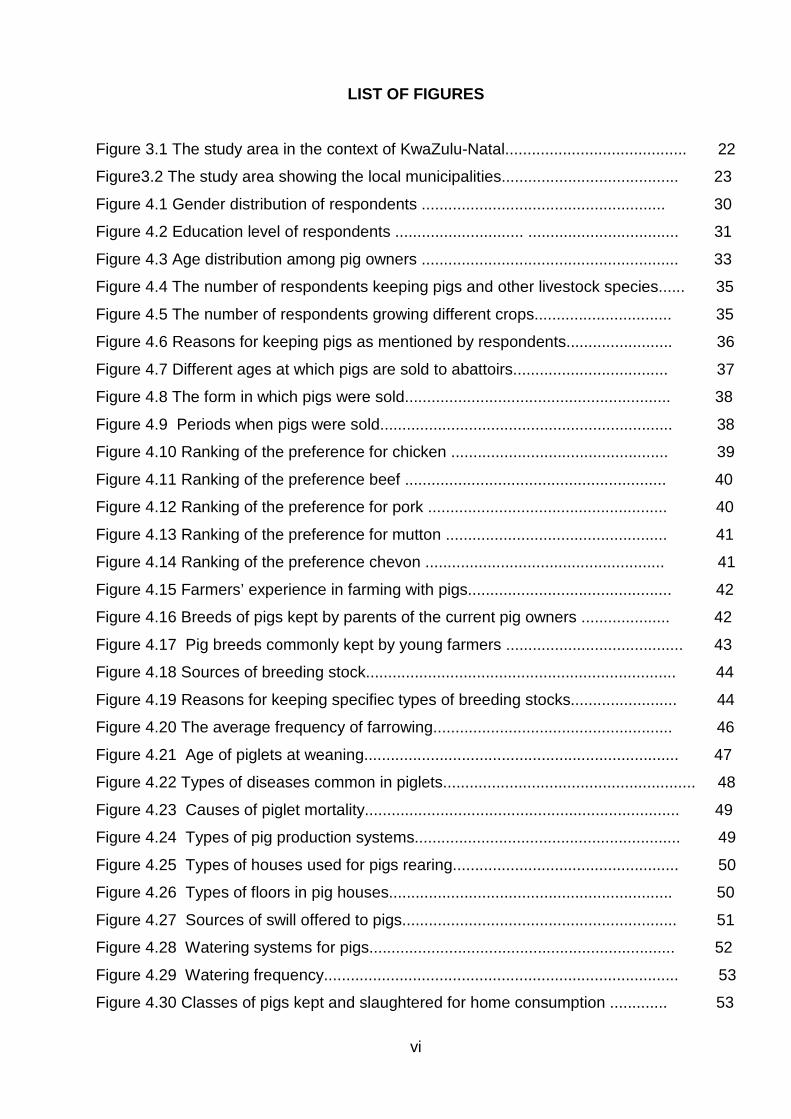
LIST OF FIGURES
Figure 3.1 The study area in the context of KwaZulu-Natal......................................... 22
Figure3.2 The study area showing the local municipalities........................................ 23
Figure 4.1 Gender distribution of respondents ....................................................... 30
Figure 4.2 Education level of respondents ............................. .................................. 31
Figure 4.3 Age distribution among pig owners .......................................................... 33
Figure 4.4 The number of respondents keeping pigs and other livestock species...... 35
Figure 4.5 The number of respondents growing different crops............................... 35
Figure 4.6 Reasons for keeping pigs as mentioned by respondents........................ 36
Figure 4.7 Different ages at which pigs are sold to abattoirs................................... 37
Figure 4.8 The form in which pigs were sold............................................................ 38
Figure 4.9 Periods when pigs were sold.................................................................. 38
Figure 4.10 Ranking of the preference for chicken ................................................. 39
Figure 4.11 Ranking of the preference beef ........................................................... 40
Figure 4.12 Ranking of the preference for pork ...................................................... 40
Figure 4.13 Ranking of the preference for mutton .................................................. 41
Figure 4.14 Ranking of the preference chevon ...................................................... 41
Figure 4.15 Farmers’ experience in farming with pigs.............................................. 42
Figure 4.16 Breeds of pigs kept by parents of the current pig owners .................... 42
Figure 4.17 Pig breeds commonly kept by young farmers ........................................ 43
Figure 4.18 Sources of breeding stock...................................................................... 44
Figure 4.19 Reasons for keeping specifiec types of breeding stocks........................ 44
Figure 4.20 The average frequency of farrowing...................................................... 46
Figure 4.21 Age of piglets at weaning....................................................................... 47
Figure 4.22 Types of diseases common in piglets......................................................... 48
Figure 4.23 Causes of piglet mortality....................................................................... 49
Figure 4.24 Types of pig production systems............................................................ 49
Figure 4.25 Types of houses used for pigs rearing................................................... 50
Figure 4.26 Types of floors in pig houses................................................................ 50
Figure 4.27 Sources of swill offered to pigs.............................................................. 51
Figure 4.28 Watering systems for pigs..................................................................... 52
Figure 4.29 Watering frequency................................................................................ 53
Figure 4.30 Classes of pigs kept and slaughtered for home consumption ............. 53
vii
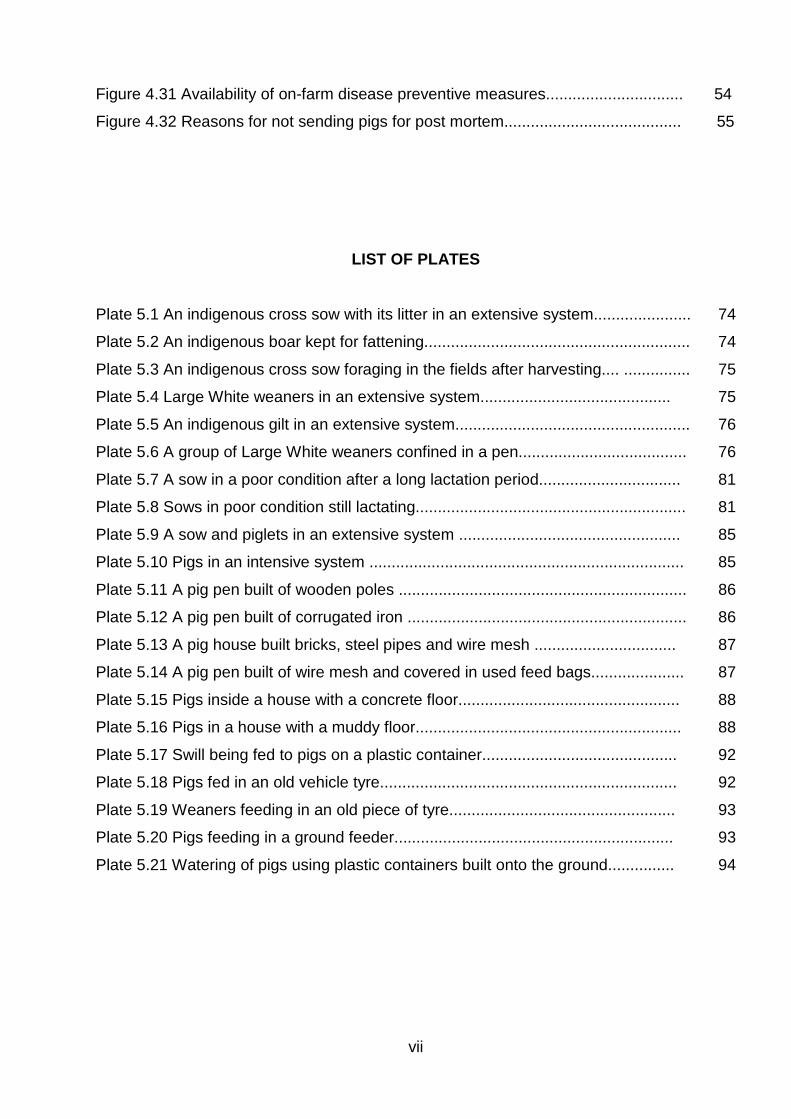
Figure 4.31 Availability of on-farm disease preventive measures............................... 54
Figure 4.32 Reasons for not sending pigs for post mortem........................................ 55
LIST OF PLATES
Plate 5.1 An indigenous cross sow with its litter in an extensive system...................... 74
Plate 5.2 An indigenous boar kept for fattening............................................................ 74
Plate 5.3 An indigenous cross sow foraging in the fields after harvesting.... ............... 75
Plate 5.4 Large White weaners in an extensive system........................................... 75
Plate 5.5 An indigenous gilt in an extensive system..................................................... 76
Plate 5.6 A group of Large White weaners confined in a pen...................................... 76
Plate 5.7 A sow in a poor condition after a long lactation period................................ 81
Plate 5.8 Sows in poor condition still lactating............................................................. 81
Plate 5.9 A sow and piglets in an extensive system .................................................. 85
Plate 5.10 Pigs in an intensive system ....................................................................... 85
Plate 5.11 A pig pen built of wooden poles ................................................................. 86
Plate 5.12 A pig pen built of corrugated iron ............................................................... 86
Plate 5.13 A pig house built bricks, steel pipes and wire mesh ................................ 87
Plate 5.14 A pig pen built of wire mesh and covered in used feed bags..................... 87
Plate 5.15 Pigs inside a house with a concrete floor.................................................. 88
Plate 5.16 Pigs in a house with a muddy floor............................................................ 88
Plate 5.17 Swill being fed to pigs on a plastic container............................................ 92
Plate 5.18 Pigs fed in an old vehicle tyre................................................................... 92
Plate 5.19 Weaners feeding in an old piece of tyre................................................... 93
Plate 5.20 Pigs feeding in a ground feeder............................................................... 93
Plate 5.21 Watering of pigs using plastic containers built onto the ground............... 94
viii
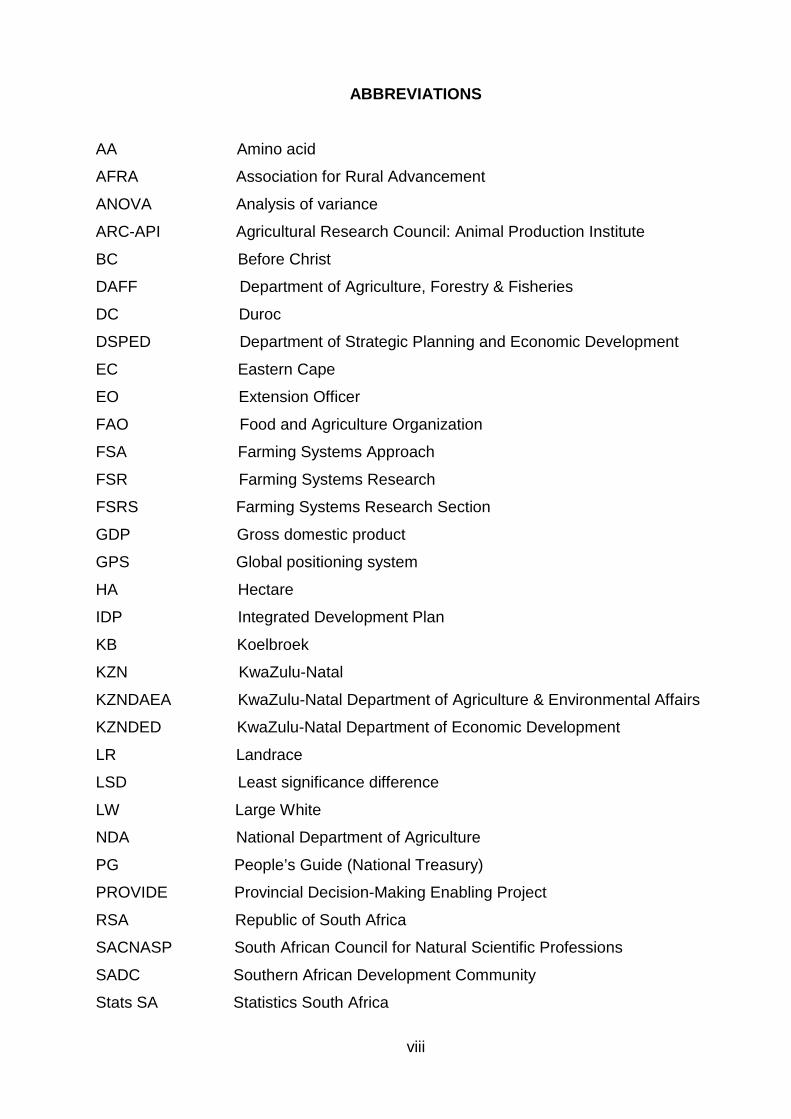
ABBREVIATIONS
AA Amino acid
AFRA Association for Rural Advancement
ANOVA Analysis of variance
ARC-API Agricultural Research Council: Animal Production Institute
BC Before Christ
DAFF Department of Agriculture, Forestry & Fisheries
DC Duroc
DSPED Department of Strategic Planning and Economic Development
EC Eastern Cape
EO Extension Officer
FAO Food and Agriculture Organization
FSA Farming Systems Approach
FSR Farming Systems Research
FSRS Farming Systems Research Section
GDP Gross domestic product
GPS Global positioning system
HA Hectare
IDP Integrated Development Plan
KB Koelbroek
KZN KwaZulu-Natal
KZNDAEA KwaZulu-Natal Department of Agriculture & Environmental Affairs
KZNDED KwaZulu-Natal Department of Economic Development
LR Landrace
LSD Least significance difference
LW Large White
NDA National Department of Agriculture
PG People’s Guide (National Treasury)
PROVIDE Provincial Decision-Making Enabling Project
RSA Republic of South Africa
SACNASP South African Council for Natural Scientific Professions
SADC Southern African Development Community
Stats SA Statistics South Africa

ix
UTDM-IDP uThukela District Municipality Integrated Development Plan
UNISA University of South Africa
WS Windsnyer
Vet Veterinarian
ZCC Zionist Christian Church
x
The untold story of the pig farming sector of rural KwaZulu-Natal: A case study of uThukela District
By
Sibongiseni Thokozani Gcumisa
Supervisor: Prof Mary M. Masafu
Co-Supervisor: Dr James W. Oguttu
Master of Science in Agriculture
Department of Agriculture and Animal Health
ABSTRACT
This study was done in the rural areas of uThukela District in KwaZulu-Natal. The
objectives were to determine pig production and management practices used by farmers
in rearing pigs in rural areas; to establish the role of pigs in social and economic lives of
the people; and to characterize and determine constrains and opportunities of pig farming
in rural areas. A farming systems approach was used in conjunction with a cross-sectional
survey method using a structured questionnaire in face-to-face interviews with farmers for
the collection of data. The study involved 4 local rural municipalities with a population of
4205 people who owned 2555 pigs. The sample size was 533 pig farmers/respondents.
The data included the demographic characteristics of pig farmers, pig production and
management practices, the role of pigs in both the social and economic lives of people
and the constraints and opportunities of pig farming. The data were analyzed to determine
simple means and frequencies.
The results showed that 20% of pigs were reared in intensive systems and 80% in
extensive systems in the district. Each village owned an average of 5 pigs. There were
more female respondents (60%) than males, and also female respondents owned more
(65%) pigs than males. Most of respondents (99%) were Zulu speaking people and only
1% was from other cultural groups. Majority of the respondents (74%) were unemployed,
16% were pensioners and only 10% were employed. Those who were employed kept
more pigs than the other groups. Over one third of the respondents had primary (34.5%)
and secondary (35.3%) education; and 2.7% had college education, while 27.5% had no
formal education at all.
xi
Sixty-two percent of the older respondents between the age of 46 and 65 years kept more
pigs than younger farmers. The collective incomes of the communities from salaries,
pensions, and sales of livestock and crops per annum were substantial. The average land
size per household ranged from 0.01 ha to 56 ha. Male respondents owned more land
(1.68 ha) than female respondents (0.96 ha). Similarly, employed people owned more land
(2.49 ha) than pensioners (1.26 ha) and the unemployed people (1.04 ha).
Respondents kept other livestock species such as cattle, sheep, goats and chickens.
Ninety percent of households kept chickens in addition to cattle (53%) and goats (49.3%).
They also grew crops such as maize, potatoes, vegetables (cabbage, spinach, tomatoes,
carrots, beetroots and onions) and fruits (peaches, apples and grapes). They kept pigs for
home consumption (63%), source of income (33%), source of manure (3%) and for other
reasons (1%). More employed people (68%) sold pigs for extra income, while 91%
pensioners and 81% unemployed people used pigs for home consumption.
Marketing channels included pension pay points, abattoirs, butcheries and
neighbourhoods. Abattoir sales accounted for 10% and the most common venues were
Amblecyte (40%) and Cato Ridge (27%). Selling of pigs occurred throughout the year, with
the peak in winter (May/July). Majority of farmers (59%) used their own transport to deliver
pigs to the selling points or they used contractors (41%). Pigs were sold at the age of 5 to
18 months old. Farmers sold live pigs and pork to the communities. Some farmers sold
live pigs only, while others sold pork only or both pork and live pigs. Religion and culture
had little influence on pig farming. Most farmers (88%) had no religious or cultural
influences, while 7% were influenced by religion and 1% was influenced by culture. The
most preferred meat among the communities was chicken meat, followed by beef, pork,
mutton and chevon.
Half of the respondents had >6 years of experience in pig farming, 34.9% had 2 – 5 years
of experience and 14.8% were beginners. The breeds of pigs kept in the district included
indigenous breeds, Large White, Landrace, Duroc and crosses of indigenous breeds with
Large White and Landrace. Farmers bought breeding stock within their communities or
they selected breeding stock from their own herds. Very few farmers have ever received
any type of training in pig farming. The training was provided by the KZN Provincial
Government, Zakhe Agricultural College and private farms. The training took 2-3 days of
xii
workshops, 2-3 weeks of short courses or 3-6 months of hands-on training on private
farms. The training improved the performance of sows within the communities.
Only 41% of farmers practised controlled stock breeding, which improved the farrowing
rate and litter size. About one third (32%) of farmers bred their gilts at 6 – 8 months, while
21.2% bred them at 8-12 months, and 29% bred them after 12 months. The farrowing rate
of indigenous sows was one litter per annum compared with the majority of Landrace and
Duroc sows that farrowed twice a year. Some farmers (28%) reported that they routinely
observed farrowing, while 72% of them said they never knew when the sows farrowed until
they saw sows and new litters coming back to their pens after grazing in the veld. The litter
sizes varied from ≤ 7 to ≥ 10. Half of the indigenous sows farrowed ≤ 7 piglets per litter,
while 41% had 8-10 piglets; compared with 49% Large White and 44% Duroc that
farrowed 8-10 and ≥ 10 per litter, respectively. Majority of farmers (66.1%) did not wean
their piglets at all, which was associated with low farrowing rate. However, farmers who
sold weaners for income weaned their piglets between 3 weeks and 3 months. This was
associated with higher farrowing rate of sows.
Piglet mortality was mainly due to worm infestation (26%), loss of hair (13%), lice and
mange infestation (16.4%) and diarrhoea (5.6%). Despite that only 10% of farmers
consulted the local Department of Veterinary Services. Some farmers (44.2%) said that
they did not know that they could make use of Veterinary services, and 28% of them said it
was a waste of time. Majority of farmers (80%) used home kitchen swill and brewer’s
grains to feed their pigs. Only 16% of farmers bought commercial feeds and 2% fed them
on maize grains and vegetables. Commercial feeds were bought from Farm Save (48%),
Afgri (19%) and Epol (7%).
Some farmers (65.4%) weighed feed before feeding, while 35% did not weigh feed at all.
Water was provided at feeding time, ad libitum or several times a day. Farmers disposed
of carcasses by eating them, feeding to their dogs, or throwing them away. Over half of the
farmers (52%) did not take carcasses for post mortem, while 26% did not know that they
could send carcasses for post mortem and 20% said they could not afford the cost. The
study concluded that pigs have a vital social and economic role in the lives of the rural
people of KZN for income generation and household consumption. The main constraints
are wide spread poverty and lack of management skills in pig production, nutrition, health,

xiii
housing and management. Government intervention is necessary to help farmers to
improve pig production and management as a means of poverty alleviation and household
food security.
1
CHAPTER 1: GENERAL INTRODUCTION
1.1 Background information
The domestication of pigs happened a long time ago during the Neolithic period according
to Bushby (1988). References to biblical times have also been mentioned by Esminger
(1961), who states that it could have taken place about 1500 BC. Holness (1991) refers to
2000 BC as the time pigs might have been domesticated. It was however not until the 18th
century that improvements on the pig breeds were initiated (Bushby, 1988).
The arrival of improved pig breeds in the Republic of South Africa (RSA) is not very clear
but, it is believed that the arrival of European settlers in RSA in 1600s was the source of
improved pig breeds that are found in Southern Africa today (Krige, 1950; Blench and
MacDonald, 2000; Swart et al., 2010). A number of pig breeds are found in RSA but only
the Windsnyer and the Kolbroek (Ramsey et al., 2000) are regarded as indigenous to
RSA. Other breeds that are found in RSA are the Large White, South African Landrace
(ancestral line from Denmark) and the Duroc. These breeds are mostly used in the
commercial sector (Kem, 1993; Swart et al., 2010) unlike the indigenous pigs that are
reared by smallholders (Blench and McDonald, 2000) in rural areas.
The need for increased animal protein is evident in developing countries and this has led
to animal production coming under intense pressure to satisfy the demand from the
increasing human population (Bellaver and Bellaver, 1999; van der Zijpp, 1999). The
increase in the demand for animal products suggests an increase in incomes and
urbanisation (Bradford, 1999), which are linked. Grigg (1995) stated that income has a
major role in influencing the level of consumption of animal protein. Therefore, the
demand for animal products and the per capita meat consumption can be said to be
correlated to economic growth or per capita income in developing countries (Bellaver and
Bellaver, 1999; Bradford, 1999; Speedy, 2003). Livestock production growth in general
has been very slow in the sub-Saharan Africa (FAO, 2009). Africa as a whole is still
underperforming in terms of production, food security and export, which are lower
compared to Asia and Latin America (Rukuni, 2002). There is a need to increase
production to meet the demand for livestock products and this could be best achieved
through improved livestock production and healthcare (Bellaver and Bellaver, 1999).
2
The South African National Food Survey report (1999) cited in Schönfeldt and Gibson
(2009) showed that 25.5% of South African children are stunted and wasted as a result of
malnutrition. The children who are stunted are mainly found rural areas (Hendriks, 2003).
Stunting in children is a standard term used for children who are considered to be too
short and light in weight for their age (Hendriks, 2003). When the RSA government
noticed severe malnutrition among the people, a Fortification Programme was
implemented in 2003 to curb the problem (Schönfeldt and Gibson, 2009). The programme
involved fortification of certain foods like maize meal with minerals and vitamins.
Speedy (2003) mentioned that meat is made up of high quality protein and thus very
important in the human diet because it supplies nutrients such as iron, zinc and vitamin
B. Pig meat in particular is said to be high in thiamine (Speedy, 2003). Cheeke (1993)
cited by Bellaver and Bellaver (1999) reported that protein of animal origin has a higher
nutritional value compared to vegetable protein. The differences are in the composition of
essential amino acids and minerals.
Pig production has increased dramatically over the years in the developing countries
(Steinfeld, 2003; FAO, 2009). Pig production in sub-Saharan Africa increased slightly from
0.5 million tonnes (1987) to 0.8 million tonnes in 2007 (FAO, 2009). FAO (2011)
estimated an increase of up to 155% in annual pork consumption from 2000 to 2030 in
sub-Saharan Africa. An even higher increase of 167% in annual pork consumption
globally in countries deemed to be of low income is also expected (FAO, 2011). Pig
production in RSA lags behind countries such as a China and the United States of
America who are the leading pig producers in the world (FAO, 2009). However, according
to Phiri et al. (2003) RSA has the highest pig population in southern Africa, of which 25%
are free ranging in the resource-poor areas (Krecek et al., 2004). About 86.5 % of the 2.2
million pigs in RSA are slaughtered through the 46 abattoirs yearly. Most of these come
mainly from commercial farms (Pig Breeders Society of SA, 2010). A study conducted in
2010 by the Department of Agriculture, Forestry and Fisheries (DAFF) estimated that
there are about 4000 commercial producers in RSA (DAFF, 2010). Although black farming
sector in RSA represent a large number of households, Aliber and Hart (2009) argued that
this sector contributes minimally to the country’s overall output and this might be the case
in terms of pig production as well.
3
Countries like Vietnam (Peters, 1998; Lemke and Valle Zárate, 2008), Nigeria (Ajala et al.,
2006; Ajala et al., 2007), Mexico (Mota et al., 2002), Zimbabwe (Chiduwa et al., 2008),
India (Rahman, 2007; Deka et al., 2007), Thailand (Nakai, 2012), Colombia (Ocampo et
al., 2005), Uganda (Nissen et al., 2011) and Kenya (Carter et al., 2013) have researched
the rural pig production sector and smallholder farming with the emphasis on the role of
pig production in economic growth and as a development pathway. In RSA, Madzimure et
al. (2013) has also recently looked at rural pig production in Limpopo and Eastern Cape
provinces, respectively.
Apart from pork being an essential source of protein to humans, pigs in rural areas assist
with income generation or additional investment and it was also reported that women
benefit from the additional income received from pigs, which in turn is used for household
goods, school fees and settling other obligations.(Chimonyo et al., 2005; Ocampo et al.,
2005; Ajala et al., 2007; Phengsavanh et al., 2010; Kamuribo et al., 2011; Nissen et al.,
2011; Carter et al., 2013; Madzimure et al., 2013). In Nigeria and India (Ajala et al., 2006;
2007; Deka et al., 2007) In northern Vietnam, Lemke and Valle Zárate (2008) observed
similar uses of pigs as was also reported by Deka et al. (2007) in India and Ajala et al.
(2006; 2007) in Nigeria. The consumption of pork in the rural areas however, is influenced
by some taboos, which range from human health, religion to cultural beliefs. Religion and
cultural beliefs prohibit the consumption of pork. For example, in RSA members of the
Zionist Church (ZCC) do not consume pork (Anderson, 1999) and is most prevalent
among black communities (Anderson and Otwang, 1993 cited by Anderson, 1999).
Free ranging pigs have the potential to transfer diseases to humans (Lekule and
Kyvsgaard, 2003; Fincham, 2005). Pork that is undercooked may harbour worms hence
the emphasis on the importance of confining pigs to prevent the transfer of parasites to
humans (Lekule and Kyvsgaard, 2003). A parasitic infection known as porcine
cysticercosis which is caused by Taenia solium, is very common in rural areas (Sciutto et
al., 2000; Phiri et al., 2003; Waiswa et al., 2009; Assana et al., 2010a). Pigs are
intermediate hosts, while the disease is transferred between humans and pigs (Assana et
al., 2010a). The infection can also cause neurocysticercosis in humans. Porcine
cysticercosis occurs in many countries including South Africa (Phiri et al., 2003; Krecek et
al., 2004; Fincham, 2005; Carabin et al., 2006), Mozambique (Vilhena et al., 1999; Pondja
et al., 2010) and Cameroon (Shey-Njila et al., 2003). Areas that are affected by severe
poverty are the most prone to Taenia solium infection in pigs, resulting in developing
4
countries being the main reservoirs of the disease (Sciutto et al., 2000; Assana et al.,
2010a). In 2010 the Association for Rural Advancement (AFRA) reported that 50% of KZN
population live in abject poverty. De Villiers (2005) observed that “the KZN communal rural
areas are characterised by overpopulation, low agricultural productivity,
underdevelopment and unemployment which is accompanied by high rate of illiteracy that
has resulted in extreme poverty and thus high dependency to remittances”.
Pigs are more preferred for meat in KZN instead of goats and cattle because it is easier to
kill pigs than any other stock, and Zulu people have no attachments to them like goats and
cattle. The uses for goats vary among different cultures and traditions in some instances
even within families. In KZN goats are used for in rituals for requesting for forgiveness and
luck from ancestors, during child birth and for chasing away bad luck (ARC-API, 1999).
For this reason goats and cattle are not slaughtered for provision of meat, but for cultural
rituals and ceremonies. Rumosa Gwaze et al. (2009) found that people in the Eastern
Cape Province people viewed goats as animals for ceremonies and were rarely
slaughtered for other reasons. Slaughtering of goats in the Eastern Cape Province is done
for bestowing good fortunes and to chase away evil spirits (Rumosa Gwaze et al., 2009).
Van Averbeke and Khosa (2007) noted that in Limpopo province many households used
animals for ceremonies. This shows that traditional ceremonies in rural RSA are still
common and hence the importance of livestock. Therefore, the purpose of this study was
to determine pig production and management practices; the role of pigs in social and
economic lives of people; and constraints and opportunities in pig farming in uThukela
District.
1.2 Problem Statement
The study was to answer questions with respect to pig farming in rural areas of uThukela
District as there was no primary information available. Pig farming in rural uThukela
District is a closed book only known to those within the communities. Furthermore,
farmers in uThukela District were constantly raising concerns about issues such as the
slow pig growth which was of concern. It was therefore evident that the whole sector
needed to be investigated and understood if solutions to the constraints were to be found
and to further improve pig production for the rural people of uThukela District.
5
1.3 Assumptions
Pig farming in rural areas contributes to people’s livelihoods and in fighting poverty in
uThukela District.
1.4 Purpose statement
The purpose of the study was to obtain information and establish the role of pig farming
socially and financially in rural uThukela District.
1.5 Research questions
1. What is the current status of the pig sector in rural uThukela District?
2. What constraints and opportunities related to pig farming exist in rural uThukela
District?
1.6 Aims and objectives
1.6.1 The aim
The aim of the study was to gain insight and better understanding of pig production in rural
areas of uThukela District by gathering information from farmers through a survey.
1.6.2 The objectives
1. To determine pig production and management practices used by farmers in
raising pigs in uThukela District rural areas.
2. To establish the role of pigs in both the social and economic lives of people in
rural areas of uThukela District.
3. Characterize and determine constrains and opportunities of pig farming in rural
uThukela District.
1.7 Anticipated benefits of the study
The study will provide detailed information on the current status of pig farming in the rural
areas of uThukela District. Information obtained from this study will be freely available to
farmers, researchers and wider population requiring such information. Farmers and
communities involved in this study will benefit as the information gathered will lead to the
6
development of further research and involvement by the KwaZulu-Natal Department of
Agriculture and Environmental Affairs (KZNDAEA) in due course with the goal of trying to
eradicate poverty in the province. Furthermore, data obtained will assist with addressing
areas where there may be shortfalls and facilitate the provision of necessary advice by
Extension Officers (EO). It is hoped that pig farming in the area of study will be improved,
and as result there will be improved food security and also it could lead to the entrance of
new entrant farmers. Other farming areas that may be related to pig farming will also get
attention from KZNDAEA.
1.8 Ethical considerations
Farmers’ participation in the study was voluntary, and no farmer was coerced to
participate in the study. The details of the research were explained to the farmers before
the interviews and the consent forms signed by farmers before the survey commenced.
Participants were informed of their rights, assurances of confidentiality were given and
participants were informed that their identity would be kept anonymous. Animals were not
used in this study and therefore the study posed no risks to animals as only human
participants provided information used in this study. Entrance into the different areas was
pre-arranged in conjunction with EO working in the respective areas and therefore risks
towards investigators were also minimal. Ethical approval was acquired from the
KZNDAEA research committee (FSR 2.12) and the UNISA Ethics Committee
(2011/CAES/047).
1.9 Components of the report
This dissertation consists of 6 chapters:
• Chapter 1: gives the background to the problem, statement, assumptions, purpose
of statement, research question, aims and objectives, anticipated benefits of the
study, ethics consideration, and the list of abbreviations.
• Chapter 2: presents the literature review with particular reference to the topic.
• Chapter 3: outlines the research methodology applied.
• Chapter 4: provides the results obtained from data after the analysis with respect
to the headings derived from the objectives, ''pig production and management
practices'', ''role of pigs in both social and economic lives of people'' and
''constraints and opportunities of pig farming''.
• Chapter 5: discusses the results obtained in conjunction with the literature review.

7
• Chapter 6: draws conclusions and reflects on the objectives and provides
recommendations.
• References from the literature read and used in the discussion follow after the
conclusions in chapter 6.
8
CHAPTER 2: LITERATURE REVIEW This chapter examines the literature on pig farming in rural areas in Africa and beyond. It
also looks at the South African pig industry. The social and economic contribution of pigs
to the rural households through the use of different production systems and management
practices is explored to lay a foundation for the story to be told of the pig farming sector in
rural KZN. The chapter focuses on the poverty situation in KZN province and uThukela
District in particular to find ways and means of eradicating abject poverty. It further
explores how livestock production is involved in the fight against poverty and food
insecurity in other countries.
2.1 Poverty in KwaZulu-Natal and uThukela District
KZN province has ten district municipalities with uThukela among them. The national
census done in 2011, showed that the number of people in KZN has increased from about
8,572,302 in 1996 to 10,267,300 in 2011 (Stats SA, 2012). There are more people in the
province than there were in the past 14 years. The province has the second largest
population in South Africa (RSA) after Gauteng province (Stats SA, 2012). In KZN as a
whole, about 78% of rural and 28% of urban areas are affected by severe poverty
(KZNDED, 2009). De Villiers (2005) reported that rural KZN is overpopulated and most of
the people in extreme poverty. Thirty-seven percent of rural areas are involved agricultural
activities (PROVIDE, 2005).
RSA is described as a middle income developing country that has contrasting situations
of wealth and poverty (Schönfeldt and Gibson, 2009). Most rural households are
dependent on crop and livestock farming subsistence (Shackleton et al., 2001). As a result
there is high dependency on incomes of relatives (KZNDED, 2006) and therefore there
are more people surviving on government grants or social security. Shackleton et al.
(2001) noted role of government in supporting the rural economy. According to the
People’s Guide by the National Treasury (2012), “the social assistance programme is
South Africa’s direct means of combating poverty”. The number of grant recipients was
estimated at 15.6 million over the period of 2012/2013 (National Treasury, 2012).
The different types for the social grants are State old-age grant or pension (R1200),
Disability grant (R1200), Foster grant (R770) and Child support grant (R280) (National
Treasury, 2012). The amount budgeted for social security KZN will increase from R1.953
9
billion in 2011/2012 to R2.401 billion in 2014/2015 (Cronje, 2012). This budget further
demonstrates how large the amount is that the government has to provide to alleviate
poverty in KZN. Social grants have therefore become an important source of income in
KZN and other provinces (Mtileni et al., 2009). With the population increase in the
province it can be assumed that poverty has also increased. KZNDED (2009) reported
that 58.1% of people in KZN earned <R400 per month per household in 2007 which was
higher compared to the 42.5% observed in Gauteng and 37.4% in the Western Cape who
earned a similar amount. The 2011 census estimated the unemployment rate in KZN at
33% or 1 006 409 unemployed people (Stats SA, 2012). UThukela District fell under the
indicator scale deemed to be in poverty because its income was below R1640 per month
per household (DSPED, 2007). The unemployment rate in uThukela District was
estimated at 35 – 39 % (Stats SA, 2012).
KZN economy is therefore constantly faced by high level of poverty and unemployment
challenges as indicated by the Department of Economic Development and Tourism
(KZNDED, 2011a). The globally recession in 2009 also affected KZN economy which has
continued to grow below 3% per annum in the past 3 years (KZNDED, 2011a). Growth
and development of the economy has been stunted by the high level of illiteracy, poverty
and unemployment (KZNDED, 2006). The challenges of poverty, unemployment and
underdevelopment are also seen in other provinces in RSA and other developing
countries (KZNDED, 2006). It is therefore very important for the provincial government to
put measures in place to alleviate poverty and build up household food security. One
measure that has the highest potential to overcome poverty in rural areas is agriculture. It
is also the starting point for development strategy for economic growth (KZNDED, 2009).
2.2 Fighting poverty through agriculture
Although KZN province has high poverty and dependency level, it has the largest area of
good agricultural land than any other province in the country (PGDS, 2011). The provincial
agricultural sector has not lived up to expectations because its contribution to the
provincial GDP has been ≤ 5.5 % in the past decade, which does not justify the potential
of agriculture in the province (KZNDED, 2011a). The KZN Government has since made
agricultural development a priority, especially with regard to food security. The importance
of this is evident as shown in the provincial goal that says “To engage, empower and
transform communities to participate in sustainable agricultural and environmental
10
practices in order to realize economic development and food security in the Province”
(KZNDAEA, 2012a). Sustainable economic development and job creation are other areas
that have been prioritized by the KZN Government (PGDS, 2011).
The challenges of low food production and sustainable economic growth are not new in
RSA. Bembridge (1979) highlighted these challenges and today they are still there in
much of the rural areas. Bembridge (1979) identified the shortage of animal and vegetable
protein in the former “Black Homeland States” of RSA. A nutritional study conducted by
Hendriks (2003) in KZN rural areas showed that cereals are major sources of energy, (if
not the only sources) in most households. Hendriks (2003) suggested that an increase in
the consumption of animal products could reduce the shortage of protein and fats in diets,
thus significantly improving energy intake. Other developing countries as well suffer from
shortages of dietary animal protein with per capita consumption being very low (Gill, 1999;
Ajala et al., 2007). High per capita income is associated with high per capita meat
consumption and vice versa (Grigg, 1995; Bellaver and Bellaver, 1999; Speedy, 2003).
An estimated 675 million rural poor people in the world are supported and sustained by
livestock production activities (Livestock in Development, 1999 cited by Steinfeld, 2003).
The majority of the rural poor people that are supported by incomes and assets from
livestock production activities are women (Steinfeld, 2003). Livestock produce high quality
protein from low quality feed resources that might not been used in some instances
(Speedy, 2003). One-third of the world protein comes from animal products (Bradford,
1999), but with the constant rise and fluctuations in meat prices (DAFF, 2012) most
people cannot access meat due to high unemployment and poverty. In countries such as
India (Kumaresan et al., 2007) and Kenya (Carter et al., 2013) it has been established that
poverty can be eradicated through pig raising because they have become crucial in
supporting the livelihoods of many rural households. In RSA the improvement of
agricultural productivity in the rural areas could assist in improving the nutritional status of
many households (Hendriks, 2003).
Rural people of KZN keep different types of livestock such as cattle, goats, sheep, pigs
and poultry (de Villiers, 2005), where ruminants are more dominant. Cattle form 50% of
the population followed by goats (74%) and sheep (19%)(KZNDAEA, 2012b). The
livestock industry in the rural areas is still underdeveloped due to low reproduction rate (25
- 35%), shortage of feed in winter, stock theft and limited knowledge and skills in
11
husbandry (KZNDAEA, 2012b). The disposal of cattle and goats for meat in KZN and EC
provinces is culturally forbidden (Rumosa Gwaze et al., 2009), and that leaves sheep, pigs
and chickens for regular meat supply. This further decreases the per capita consumption
of meat within the communities. Rumosa Gwaze et al. (2013) explained that in KZN and
EC provinces, goats in particular are slaughtered for cultural ceremonies and for
communicating with ancestors among other reasons. Goats are therefore not slaughtered
easily for reasons outside these specific rituals.
The status of pig farming in the rural areas of KZN has not been investigated and
documented. As such, literature about the subject is very limited and outdated. Pig
farming has been sidelined in KZN and is only known to those who have close links to the
rural communities. Information available on pigs in rural areas is about indigenous pig
breeds, where they are found, their characteristics and their suitability for rural conditions
(Ramsay et al., 2000), but not on how people farm with these pigs and how they benefit
financially from pig farming or the potential of these pigs. There is insufficient information
on pig farming in rural areas with respect to social and economic contribution and the
production systems.
2.3 Reasons for farming and owning pigs in rural areas
There are many other types of livestock that farmers choose to rear in KZN, but why do
some farmers keep pigs in the rural areas? In general pigs are known to be more prolific,
early maturing and more likely to give birth twice a year compared with cattle, goats and
sheep; and therefore more convenient source of animal protein supplier (Ajala et al.,
2007). All these factors are in favour of rearing pigs as the quickest way of increasing
animal protein supply (Ajala et al., 2007). According to Petrus et al. (2011) pigs are
genetically superior to ruminants in terms of converting feed to meat. Kumaresan et al.
(2007) described pigs as biological machines due to their efficiency in converting poor
feed resources into pork.
Therefore, taking into account of constrains in rural areas such as feed shortages in winter
and poor reproduction performance for ruminants (KZNDAEA, 2012b) this further
strengthens the reasons why pig farming may be a possible solution to promote livestock
production to meet the rising demand for animal protein and extra income (Chimonyo et
al., 2005; Ajala et al., 2007; Kamuribo et al., 2011; Pondja et al., 2010; Hossain et al.,
12
2011; Petrus et al., 2011; Nakai, 2012; Madzimure et al., 2013). Pigs can also be used for
household consumption and for sale to generate income which can be used on immediate
needs. In addition, pigs are used as a source of fat, dowry and manure in several
countries (Ocampo et al., 2005; Petrus et al., 2011; Madzimure et al., 2013; Kamuribo et
al., 2011). For example, Madzimure et al. (2013) reported that in RSA pig fat is used as
cooking oil and for softening leather ropes in Limpopo and EC provinces.
2.4 Pig industry and pork consumption in South Africa
Pork industry contributes about 2.15% of the GDP from the agricultural sector (DAFF,
2010). Limpopo province produces the highest pork (24%), followed by North West (20%),
KZN (11%) and the Western Cape (10%). However, the population of pigs reported by
DAFF (2010) does not include pigs that are reared in the rural areas and hence the
contribution of rural pig production is not reflected in the country’s economy, because is
regarded as negligible.
It is also known that South Africans consume more pork than they produce in the country,
which makes RSA a net importer of pork (DAFF, 2010). The per capita consumption of
pork in RSA has not changed drastically from 4.0 kg/yr/capita in 1970s to 4.6 kg/yr/capita
in 2010/11 (DAFF, 2012); compared with the consumption of other types of meat such as
mutton, lamb and goats (2.9 kg/yr/capita), beef and veal (17.07 kg/yr/capita); and poultry
and fish (34.91 kg/yr/capita) (DAFF, 2012a). It shows that the per capita consumption of
red meat as a whole was lower (24.47 kg/yr) than the consumption of white meat (DAFF,
2012a). South Africans prefer poultry, beef and pork more than mutton, lamb and goat
(DAFF, 2012a). The high consumption of pork is a sign of higher income earnings and
urbanisation (Grigg, 1995; Bellaver and Bellaver, 1999; Speedy, 2003).
Despite being a net importer of pork, RSA exports some of its pork to other African
countries; mainly the Southern African Development community (SADC) countries (DAFF,
2010).The SADC countries receive 73% of RSA pork, while Nigeria receives 4% and 23%
to the rest of African countries (DAFF, 2010). RSA exported 3.02 million tons of pork worth
R183.6 million in the period between 2000 and 2009. In 2009 RSA exported 2 022 tons of
pork to Zimbabwe (35%), Mauritius (23%) and the rest to Mozambique, Democratic
Republic of Congo, Nigeria and Angola (DAFF, 2010). RSA imports pork from Canada,
13
Germany and France (DAFF, 2010). A total of 27 210 tons of pork were imported in 2009
alone. This was far more imported pork than that produced in RSA within the same period.
2.5 Marketing of rural pigs
According to Shackleton et al. (2001) livestock production in rural areas is considered
unproductive. This may be due to poor management practices and low or no inputs
applied by the rural farmers. As a result marketing of pigs from the rural areas is not easy,
because buyers are already biased against rural pigs, which are thought to be of poor
quality and hence one would not enough money from them (Chimonyo et al., 2005). For
example, in Zimbabwe there is bias against indigenous Mukota pig breed in rural areas.
Buyers prefer exotic breeds because more improved and thus more suitable for income
generation (Chimonyo et al., 2005). Most of the marketing of rural pigs occurs within the
rural communities where pigs are sold either live or as meat (Nsoso et al. 2006). For
example, 62.5% of pigs were sold within the community in the Ramotswa village in
Botswana and 95% in Busia District in Kenya (Kagira et al., 2010).
In Namibia and India 90% of farmers said they sold their pigs to neighbours within their
communities (Petrus et al., 2011; Kumaresan et al. (2009). In RSA Madzimure et al.
(2013) also reported that among the different communities in Ntabankulu, Elundini and
Ngqushwa, farmers also said they sold (65%), (81%) and (96%), of their pigs respectively,
within their communities. Other pig farmers sold their pigs to butcheries, abattoirs and
supermarkets (Madzimure et al., 2013). In monetary terms it is not clear how much
money is made from pigs in the rural areas, because rural markets are considered
inefficient (Petrus et al., 2011). The markets are not well defined because pigs are sold at
different ages and sizes (Ajala et al., 2007; Petrus et al., 2011). Indications are that very
little effort has been made in trying to improve the marketing of local rural pigs. When
looking at the quality of the meat, only commercial pigs have been investigated and that
the quality of indigenous pig meat is not well known (Hoffman et al., 2005). The question
that arises is whether indigenous pigs will make it in abattoirs. Halimani et al. (2012)
discussed a number of reasons that have led to the exclusion of indigenous pigs. Among
them is the fact that indigenous pig carcasses do not make the grade in the biased
grading schemes that focus on lean meat production.
14
2.6 Production systems and management practices
2.6.1 Pig farmers in rural areas
Results from different studies reviewed suggested that rural pig farming is mainly done by
women and girls in RSA, Botswana, Zimbabwe, Namibia and Tanzania (Nsoso et al.,
2006; Chiduwa et al., 2008; Kamuribo et al., 2011; Petrus et al., 2011; Halimani et al.,
2012). In RSA Madzimure et al. (2013) reported that most pigs were also owned by
women farmers, and as many as 57% of women and 39% of girls in rural communities
were involved with pig husbandry (Petrus et al., 2011). In other studies in Namibia,
Zimbabwe and Botswana, Nsoso et al. (2006) and Halimani et al. (2012) reported that
75% of female and 69.7% of girls were involved with pig husbandry. In Laos,
Phengsavanh et al. (2010) reported that children assisted women with pig husbandry in
contrast with the observation made by Rumosa Gwaze et al. (2009), who said that in RSA
the youth were not interested in agricultural activities as they saw it as being backward
and unpopular.
2.6.2 Breeds of pigs kept in rural areas
There are two indigenous pig breeds RSA: Windsnyer and Koelbroek (Ramsey et al.,
2000). The indigenous breeds are classified as Sus indica, in common with Chinese pigs
(Nicholas, 1999) cited in Hoffman et al. (2005a). They are sometimes referred to as
unimproved breeds (Robinson and Penrith, 2009; Petrus et al., 2011).
Some of the exotic breeds in RSA (Landrace, Large White and Duroc) are mainly used in
the commercial sector (Kem, 1993; Swart et al., 2010). Exotic breeds were crossbred in
the rural areas and smallholder farms, which has influenced some farmers to abandon the
indigenous breeds, partly because indigenous breeds are not well regarded due to their
low productivity and too much fat (Halimani et al., 2012; Lekule and Kyvsagaard, 2003).
Hoffman et al. (2005a) reported that breed name is crucial in marketing because it is used
to distinguish factors that influence consumer’s perception of meat products. However,
there is very limited information about meat quality of indigenous pigs.
Indigenous breeds are hardy or can tolerate poor conditions or limited resources and
inputs (Lekule and Kyvsagaard, 2003; Chiduwa et al., 2008; Mutua et al., 2010). This
cannot be said for the exotic breeds because they are bred for intensive production
15
systems with high inputs in comparatively controlled environments, and thus find it difficult
to thrive under extensive production systems (Chimonyo et al., 2005). Chiduwa et al.
(2008) in a study done in Zimbabwe found that one of the advantages of farming
Indigenous pigs is that they more resilient and therefore more suitable for the resource-
poor farmers. Adaptability of indigenous pigs to local environment and management
conditions was also mentioned by Pengsavanh et al. (2010)
Then what could cause rural communities to substitute indigenous breeds with exotic
breeds? For more than sixty years developing countries have used exotic breeds for
crossbreeding to improve the productivity of indigenous breeds (Mathius and Mandy,
2005; Templeman and Caroellino, 2007 cited by Köhler-Rollefson et al. 2009). In a study
in Bangladesh, Hossain et al. (2011) found that exotic breeds were more preferred than
indigenous breeds because of their high growth potential, even though the high growth
potential comes at a price of high production inputs (Halimani et al., 2012).The result has
been a steady decline in the number of indigenous breeds in the rural areas.
Exotic breeds that are commonly used include the Large White, Landrace, Duroc and
Hampshire (Ocampo et al., 2005; Ajala et al., 2007; Kumaresan et al., 2009; Hossain et
al., 2011). Reports from India (Kumaresan et al., 2009), Nigeria (Ajala et al., 2007) and
Bangladesh (Hossain et al., 2011) showed that there is fast growth in the population of
exotic breeds in these countries due to an increase in the demand for pork. In Zimbabwe
(Chiduwa et al., 2008) and RSA (Madzimure et al., 2013) found that indigenous pigs were
still popular breeds of pigs in resource-poor areas. However, it is uncertain whether
indigenous pigs will remain viable rural areas because the balance between indigenous
and exotic breeds seems to be shifting towards the exotic breeds. Farmers in Zimbabwe
and the RSA are said to be willing to conserve indigenous pig genetics because of their
resistance to diseases and good adaptability to low input production systems (Halimani et
al. 2012).
Lemke and Valle Zárate (2008) separate the small-scale pig production systems into three
categories according to production intensity, market access and location. Farmers closer
to urban areas are usually driven by the market demand for pork, and those that are far
from the markets keep pigs for their own consumption or for informal markets. With the
different types of breeds being kept by rural farmers, the production and management
practices need to be improved to accommodate the fast growing exotic breeds. That is
16
why it is important to carry out further investigation of the existing production systems and
husbandry practices in KZN. Housing, feeds and feeding and healthcare practices need to
be examined. Ajala et al. (2007) emphasised the relationship between these factors,
making them important determinants of success or failure in pig farms and profit margins.
2.6.3 Breeding
At a glance one would confirm that pig farmers in rural areas do not control the breeding
of pigs because majority of farmers use semi-intensive production systems, where pigs of
all ages roam freely outside during the day and sleep in shelters during the night. This
also the cause of high incidences of porcine cysticercosis in rural areas (Sciutto et al.,
2000; Mafojane et al., 2003; Shey-Njila et al., 2003; Lekule and Kyvsagaard, 2003; Krecek
et al., 2004; Carabin et al., 2006; Veary and Manoto, 2008).
Nakai (2012) in Thailand reported that both controlled and uncontrolled breeding take
place as a result of the types of production systems used. Pigs are semi confined and are
sometimes found roaming around especially boars which break out of poorly constructed
housing. If pigs are not confined, breeding is difficult to control. In Colombia, Ocampo et
al. (2005) reported that farmers did not control breeding at all and that led to farmers being
unable to know the performance of individual pigs. A high percentage of replacement
stock for breeding are purchased within the community in rural areas in Kenya (Kagira et
al., 2010) and RSA (Madzimure et al., 2013) because most farmers sold their pigs within
their communities.
Uncontrolled breeding leads to uncontrolled weaning of piglets because rural farmers do
not know anything better. Piglets are weaned naturally when sows cannot breast feed
them any longer (Ocampo et al., 2005). The uncontrolled weaning leads to sows not
returning to oestrus sooner. The long lactation period leads to a condition known as the
“thin-sow condition” (Kugonza and Mutetikka, 2005). The sows lose body condition and
require a longer time to gain weight and show signs of oestrus again. That makes rural
pigs very unproductive.
2.6.4 Pig housing
Economic growth in many developing countries has been achieved through the
intensification of animal agriculture (Bellaver and Bellaver, 1999). Pigs do not require as
17
much land like ruminants (Phiri et al., 2003). That is one of the reasons that make pig
farming more suitable for the rural and smallholder farmers. Pig rearing can be done
intensively or extensively (Nsoso et al., 2006; Kumaresan et al., 2009; Kagira et al., 2010).
Pig housing in intensive production systems in developing countries, especially in the
tropics have poor waste disposal, wet floors without beddings, no wind protection and
worm infested (Lekule and Kyvsagaard, 2003). On the other hand, the poor structures in
traditional or extensive systems are seen as better than intensive systems for the local
breeds that are said to adapt to local conditions and can survive with limited structures.
Despite all this, it does not mean that free ranging pigs they do not require good
husbandry practices (Madzimure et al., 2013).
Proper pig housing is very important because pre-weaning mortality is commonly due to
piglets being exposed to bad weather conditions such as cold, rain and predators
(Chiduwa et al., 2008; Madzimure et al., 2013). The mortality of young pigs can be
avoided by providing adequate and secure housing (Madzimure et al., 2013). Semi-
intensive systems allow pigs to roam freely by day and at night they are kept in shelters
during the dry season; but during the wet season pigs are kept indoors to prevent the
destruction of growing crops, and worm infection in muddy pools (Ocampo et al., 2005;
Ajala et al., 2007; Chiduwa et al., 2008; Assana et al., 2010b; Nakai, 2012; Krecek et al.,
2012). The materials used for building rural pig houses vary according to their affordability
and availability locally (Ajala et al., 2007; Kumaresan et al., 2009). Materials such as mud
bricks cement bricks, bamboo, concrete, wood and iron sheets (Ajala et al., 2007; Nsoso
et al., 2006; Nakai, 2012).
Animal welfare activists believe that outdoor pig farming may be more suitable for pigs
because it addresses the welfare of pigs (Bellaver and Bellaver, 1999). Concerns
regarding pig housing from the welfare point of view indicate that climate of the buildings,
floor types, stocking density, feeding management and restraining devices tend to affect
pigs negatively, while other views argue that the confinement of pigs makes production
more manageable in terms of feed supplementation, which leads to faster growth and
higher performance (Madzimure et al., 2013).
2.6.5 Nutrition
According to Smith (2006) feed costs take 75 – 80% of the total production costs of
rearing pigs, this makes feed the most expensive part of pig rearing. Grains make up
18
between 55 - 70% of pig rations (Smith, 2006), and also used for human and other
livestock feeds. Haynes (2001) described a pig’s digestive system as very similar to that of
humans among all other animals, because they make use of energy and protein from
vegetable and animal origins. This therefore makes pig feed expensive because in many
developing countries there aren’t enough grains to feed humans and livestock (Petrus et
al., 2011). Small pig producers in the developing countries face a general problem of high
feed costs and shortages as well (Peters, 2004).
Swill or kitchen leftovers make part of diets of most pigs in the rural areas in different
countries (Ocampo et al., 2005; Nsoso et al., 2006; Ajala et al., 2007; Kumaresan et al.,
2009; Mtileni et al., 2009; Kagira et al., 2010; Phengsavanh et al., 2010; Hossain et al.,
2011; Kamuribo et al., 2011; Nissen et al., 2011; Carter et al., 2013). In the Northwest
province of RSA, Veary and Manoto (2008) found that farmers fed swill and their findings
were of particular interest to this study because it occurs in RSA. Petrus et al. (2011) also
found 53% of the farmers in Namibia use brewer’s grains; while Ajala et al. (2007)
reported that in Nigeria farmers use brewer’s grains mixed with swill.
The problem of feeding swill is the spread of diseases to pigs and from pigs to humans
(Haynes, 2001). Kumaresan et al. (2007) in India and Phengsavanh et al. (2010) in Laos
reported that cooking of swill before feeding to pigs is effective in controlling diseases. In
addition, feeding of swill poses a challenge because the diets are unbalanced and cannot
supply all the necessary nutrients for pigs (Kagira et al., 2010). Lekule and Kyvsagaard
(2003) and van An et al. (2005) noted that supplying pigs with the required protein under
village conditions is very difficulty mainly because of the cost involved. Pigs under
intensive systems in particular require a dietary intake of balanced diets because they
cannot fend for themselves and get all the required nutrients.
Very few farmers supplement pig diets with concentrates or commercial feeds because
most of them are not willing or cannot afford commercial feeds (Kumaresan et al., 2009;
Kagira et al., 2010; Hossain et al., 2011). Ocampo et al. (2005) reported that less than
2% of farmers in Columbia used commercial feeds, while Kumaresan et al. (2007) found
that between 8.12% farmers fed commercial concentrates in India; and in Laos 6%
(Phengsavanh et al., 2010). The amount of feed and the number of times pigs were fed
were very vague in most studies. The amount feed depended mainly on age, physiological
state of the pigs (Hossain et al., 2011) and the availability of feed (Kagira et al., 2010).
The difficulty in measuring the feed intake in rural areas was a challenge (Ocampo et al.,
19
2005; Phengsavanh et al., 2010). Many farmers could not describe their feeding
programmes because in most cases they did not have any. In India, Laos and Thailand
farmers reported that they fed their pigs twice a day (Kumaresan et al., 2007;
Phengsavanh et al., 2010; Nakai, 2012).
Fewer pigs are normally reared by rural farmers and this is because of feed scarcity at
times (Holness et al., 2005 cited by Chiduwa et al., 2008; Kamuribo et al., 2011).
Therefore, farmers keep just enough pigs to match the available feed resources, which
are most of the time characterised by poor quality and scarcity (Halimani et al., 2012).
Mtileni et al. (2009) observed that in RSA chickens were fed swill and grains which was
similar to what was fed to pigs. The findings suggested that farmers keeping pigs and
chickens had to split the already limited feed resources among the animals which further
created a problem with regard to feeding animals in rural areas. The feed scarcity in rural
areas is therefore one of the most important reasons behind small-scale pig farmers not
growing in size (Madzimure et al., 2013). Out of dietary components, water is the most
essential although often over looked (Haynes, 2001). Farmers in rural areas often provide
water mixed with feed only during feeding (Kumaresan et al., 2007; Phengsavanh et al.,
2010). Only a few farmers were found to provide additional water outside the feeding
times, while the majority of farmers provided no water. Phengsavanh et al. (2010)
observed that only 7% of the farmers in his study offered extra water during the day. In
Kenya, Carter et al. (2013) found that farmers did not provide feed and water ad libitum.
2.6.6 Healthcare and mortality
The healthcare of pigs in rural areas has been reported in a number of studies with no
particular reference to biosecurity (Lekule and Kyvsagaard, 2003; Ajala et al., 2007;
Kamuribo et al., 2011). Worm infestation was reported as one of the health problems
frequently mentioned by most farmers (Lekule and Kyvsagaard, 2003; Ajala et al., 2007;
Kamuribo et al., 2011). Worms can be controlled but the resistance to a number of drugs
used as a result of inappropriate use of antihelmintics has been noted and therefore the
worms end up affecting the productivity and profits (Steinfeld, 2003).
In some studies farmers were not able to describe animal diseases and some said they
did not experience any disease problems (Mutua et al., 2010). Treatment and vaccination
programmes exist in some areas in RSA but farmers were not aware of such services
20
(Mutua et al., 2010; Petrus et al., 2011). On the contrary, Ajala et al. (2007) noted that
over 60% of respondents in Kaduna, Nigeria vaccinated their pigs against diseases.
Kumaresan et al. (2009) also found that 37.8% of farmers in India vaccinated pigs against
common diseases.
Most mortality of pigs occurs during the early life of piglets (Ajala et al., 2007; Kamuribo et
al., 2011). A number of diseases have been mentioned that affect piglets such as worm
infestation, diarrhoea and skin diseases caused by mange, lice and deficiencies. Ocampo
et al. (2005) reported that at least two piglets die per litter as a result of worm infestation,
diarrhoea or being squashed by sows. This suggested that diseases observed by farmers
in rural areas are somehow similar worldwide. In terms of healthcare in rural areas, Taenia
solium infestation is recognised as not only a health problem for pigs but also a public
health problem (Vilhena et al., 1999; Sciutto et al., 2000; Veary and Manoto, 2008;
Assana et al., 2010a; Assana et al., 2010b).
Lack of pig meat inspectors and poor husbandry practices in rural area makes worm
infestation a serious public health problem in many developing countries (Veary and
Manoto, 2008). Vilhena et al. (1999) in Mozambique noted that poor people who live in
poor sanitary conditions were the most affected or showed signs of cystercecosis. Public
educating and general awareness of Taenia solium infections is vital in eradicating the
disease (Krecek et al., 2012). It is important to educate rural people about personal
hygiene and environmental control (Vilhena et al., 1999). Assana et al. (2010a) reported
that in developed countries neurocysticercosis was eradicated through improvements in
public health.
21
CHAPTER 3: RESEARCH METHODOLOGY A Farming Systems Research Section (FSRS) was introduced in KZN in mid 1990s to
tackle on-farm and client-orientated research in the rural areas (de Villiers, 2005), and to
meet the needs of many small-scale farmers. The Farming Systems Research was first
introduced in East and southern Africa in the mid 1970s as described by Matata et al.
(2001). The aim was to improve technology generation and dissemination of technology to
smallholder farmers. It was required to conduct the studies on pig production in rural areas
through Extension Officers in uThukela District who are the first line of government
intervention in the rural areas.
3.1 Materials and methods
3.1.1 The study area
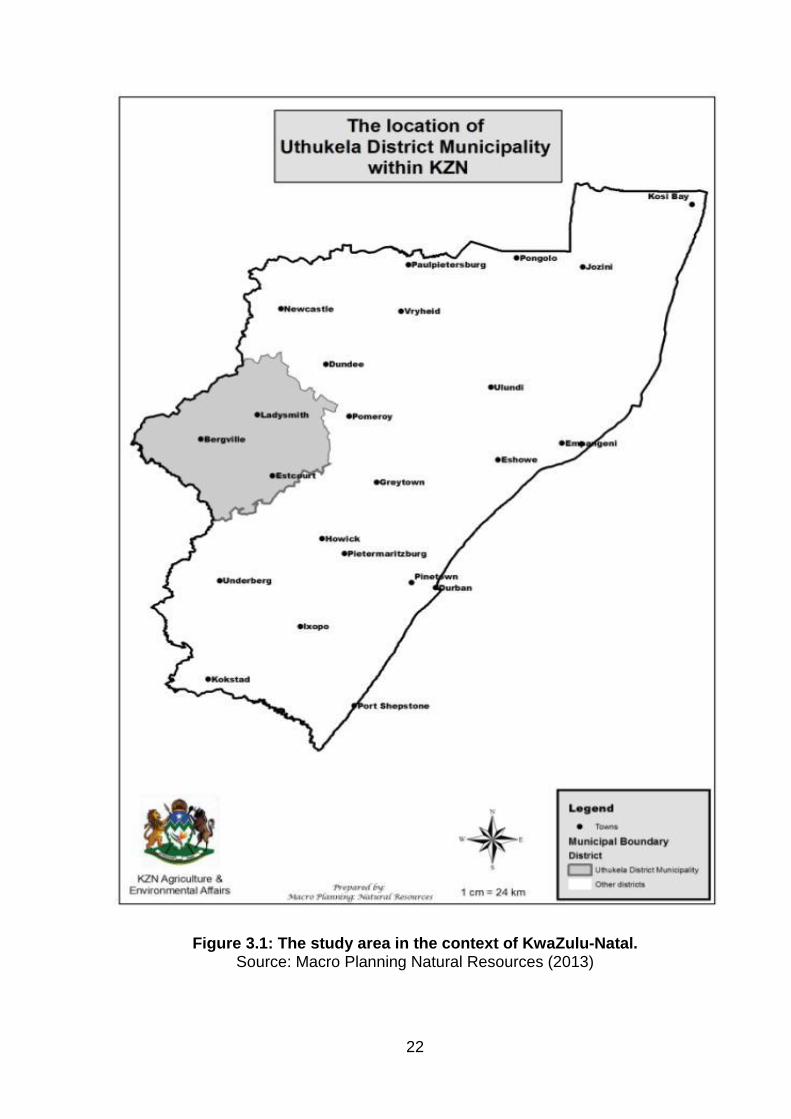
The study was conducted in uThukela District Municipality in KZN province, as shown in
Figure 3.1 below. UThukela District covers an area of approximately 11500 km2, with a
population of about 714 909 people (DSPED, 2012) from a community study done in
2007; while Statistics SA (2012) reported uThukela District to had about 7% of KZN
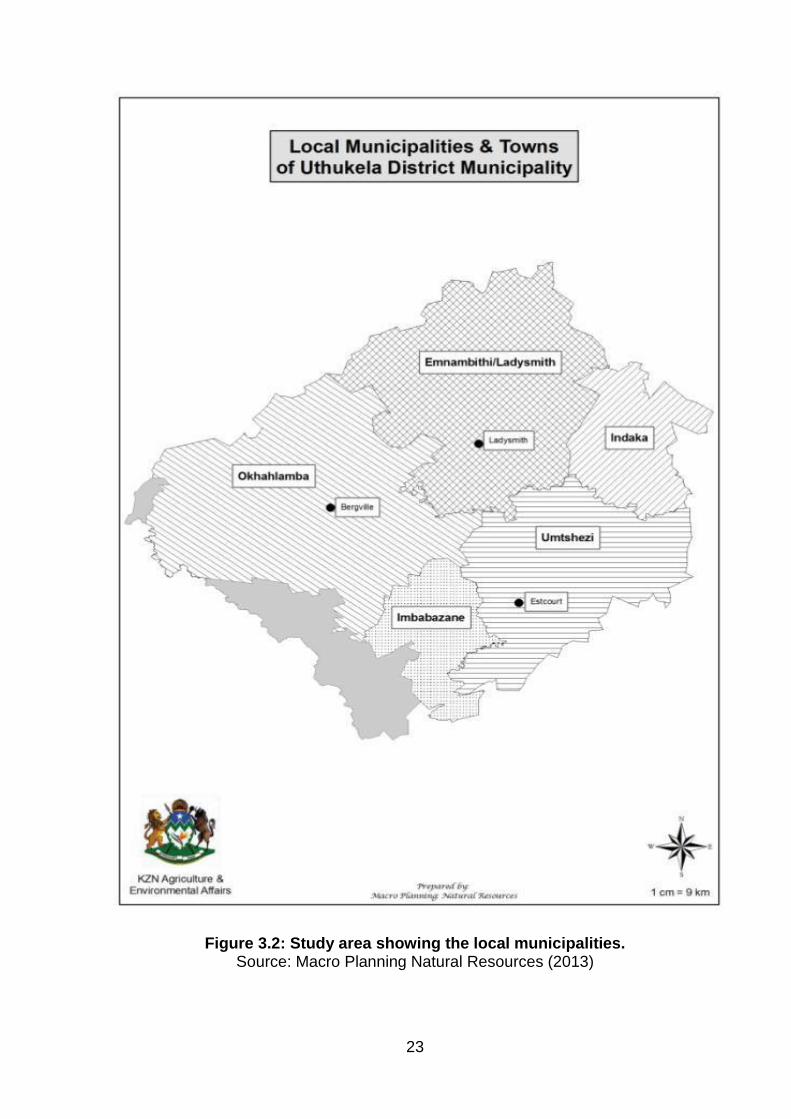
population or 718 711 people in 2011. UThukela District Municipality has five local
municipalities: Indaka (991.71 km2), Emnambithi/Ladysmith (2,965.92 km2), uMtshezi
(2,130.85 km2), Okhahlamba (3,540.63 km2) and Imbabazane (827.74 km2), as shown in
Figure 3.2.
Seventy five percent of uThukela District is rural comprising of 22 Amakhosi or Traditional
Authorities. Indaka and Imbabazane Municipalities do not have any formal towns.
Okhahlamba and Indaka municipalities are both dominated by agricultural activities. The
district has a good climate and abundance of natural resources such as water which is
supplied to the rest of KZN and Gauteng Province. The district receives an annual rainfall
of over 1 000 mm per annum with temperatures ranging between a mean maximum of
13.5 oC – 25.9 oC and a mean minimum of 3.7 oC – 12 oC (DSPED, 2012).In 2007 DSPED
estimated the number of households in uThukela District to be 139 639 (DSPED, 2012).
The number of households in the local municipality was distributed as: 50 259 in
Emnambithi, 21 081 in Indaka, 15 232 in uMtshezi, 28 508 in Okhahlamba and 24 559 in
Imbabazane.
22
Figure 3.1: The study area in the context of KwaZulu-Natal.
Source: Macro Planning Natural Resources (2013)
23
Figure 3.2: Study area showing the local municipalities.
Source: Macro Planning Natural Resources (2013)
24
3.1.2 Research design and approach
As was recommended by de Villiers (2005) a stronger and much improved bond between
the agricultural role players is necessary and must result in demand-driven services which
should include research that speaks directly to the farmers. This study therefore followed
the Farming Systems Approach (FSA) which sought to understand the whole farm system
through studying and understanding the relationships between and among the various
components (Matata et al., 2001).
The study methodologies such as the diagnostic study which is a crucial stage in the FSA
as it lays foundation for the interventions that follow (Matata et al., 2001). This diagnostic
study was the first stage of research which aimed at understanding the current production
systems and to identification of the major constraints and possible solutions. The
diagnostic stage included identifying the target groups, collection and analysis of data as
described by Matata et al. (2001).
The target population of pig farmers was identified with the assistance of EOs working in
the each municipality through purposive sampling and also through the use of the
snowballing technique (Pondja et al., 2010). The EOs were in constant communication
with the farmers and livestock associations in their respective areas. This made EOs
credible as the source of identifying pig farmers. Purposive sampling was used as only pig
farmers were targeted for the study and snowballing technique was later applied to cover
pig farmers in the district. By covering all pig farmers we ensured that biasness was
minimised in the data collection and all rural villages and communities in the district were
surveyed.
3.1.3 Sample size and sample selection
UThukela District was chosen as the study area because there were many pig farmers in
its local Municipalities who kept on requesting for advice to improve their pig production
practices. A request was made to the FSRS to empower EOs to be able them to assist pig
farmers in the district. This resulted in the primary data collection in the area. The target
population in the study was all pig farmers living in uThukela District, irrespective of
number of pigs they kept. The target group is defined as a group of farmers whose
circumstances are similar enough and they can all adopt and use the same advice and
25
recommendations (Matata et al., 2001) and as such all pig farmers in uThukela were
targeted.
As no secondary data existed on pig production in the district, hence accessing
respondents was difficult. It was made even more difficult by EOs reporting that some
areas of the district did not have pig farmers because of religious beliefs. This was
confirmed during the surveys as in some parts of the district there were no pigs. A total of
533 pig farmers were interviewed for the study in the end.
3.1.4 Sampling tools
A cross-sectional survey, using a structured questionnaire (Appendix A) was used to
collect data from pig farmers in uThukela District. A cross-sectional survey was used
because it provided a snapshot of what was happening at that point in time from a sample
selected to represent a larger population (Owens, 2002; Mathers et al., 2009). A
structured questionnaire was used because had more closed questions with answers
defined in advance and therefore guided the respondents (Mathers et al., 2009).
3.1.5 Sampling procedures
A total of 300 pig farmers were initially identified by EO but the number increased through
the snowballing technique whereby farmers who were interviewed referred the team to
other farmers in the area. In the end a total of 533 pig farmers were interviewed. The
uMtshezi local municipality did not have pig farmers hence no data was collected from
there.
The questionnaire was completed during the visits to the farmers homestead and during a
face-to-face interview. The interviews were aimed at obtaining information from the
farmers themselves to provide a clear picture about the local pig sector. Walonick (2007)
described personal interview as one of the best methods of acquiring personal and in
depth information. Murphy et al. (1998) cited by de Villiers (2005) stated that “if you want
to understand what people do, believe and think, ask them”. The questionnaire dealt with
a number of variables which included demographic questions, social and economical
contribution of pigs to households and different production systems. The investigation on
production systems covered aspects such as farmer’s experience in farming and training,
pig reproduction management, housing, slaughter, biosecurity and healthcare. The events
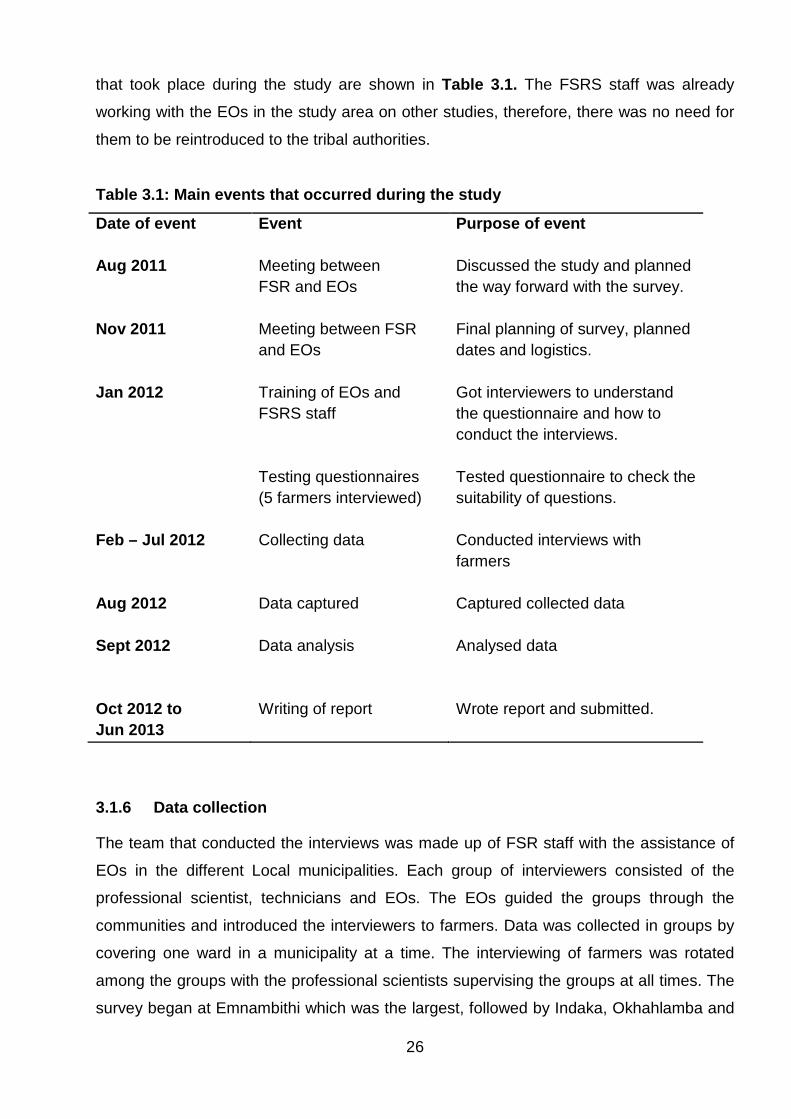
26
that took place during the study are shown in Table 3.1. The FSRS staff was already
working with the EOs in the study area on other studies, therefore, there was no need for
them to be reintroduced to the tribal authorities.
Table 3.1: Main events that occurred during the study
Date of event Event Purpose of event Aug 2011
Meeting between FSR and EOs
Discussed the study and planned the way forward with the survey.
Nov 2011
Meeting between FSR and EOs
Final planning of survey, planned dates and logistics.
Jan 2012
Training of EOs and FSRS staff Testing questionnaires (5 farmers interviewed)
Got interviewers to understand the questionnaire and how to conduct the interviews. Tested questionnaire to check the suitability of questions.
Feb – Jul 2012
Collecting data Conducted interviews with farmers
Aug 2012
Data captured
Captured collected data
Sept 2012
Data analysis
Analysed data
Oct 2012 to Jun 2013
Writing of report
Wrote report and submitted.
3.1.6 Data collection
The team that conducted the interviews was made up of FSR staff with the assistance of
EOs in the different Local municipalities. Each group of interviewers consisted of the
professional scientist, technicians and EOs. The EOs guided the groups through the
communities and introduced the interviewers to farmers. Data was collected in groups by
covering one ward in a municipality at a time. The interviewing of farmers was rotated
among the groups with the professional scientists supervising the groups at all times. The
survey began at Emnambithi which was the largest, followed by Indaka, Okhahlamba and
27
iMbabazane. Each community was covered completely before moving on to the next. Data
was collected using a structured questionnaire where all identified households formed part
of the study. Each pig owner was interviewed in a face-to-face interview at the homestead.
The interviews were conducted in isiZulu and answers were translated into English. The
study was conducted between February 2012 and July 2012.
3.1.7 Data analysis
Survey data were captured on a Microsoft Excel 2007 spreadsheet and analysed to
determine simple means and frequencies. No statistical analysis was done.
3.2 Limitations of the study
Time and resource constraints were the major challenges of this study. Accessibility to
some of the rural areas by vehicles was very difficult and therefore interviewers had to
walk long distances to reach some homesteads. The snowballing sampling method could
have introduced some bias and that some farmers who lived in very isolated parts of the
district might have been missed.
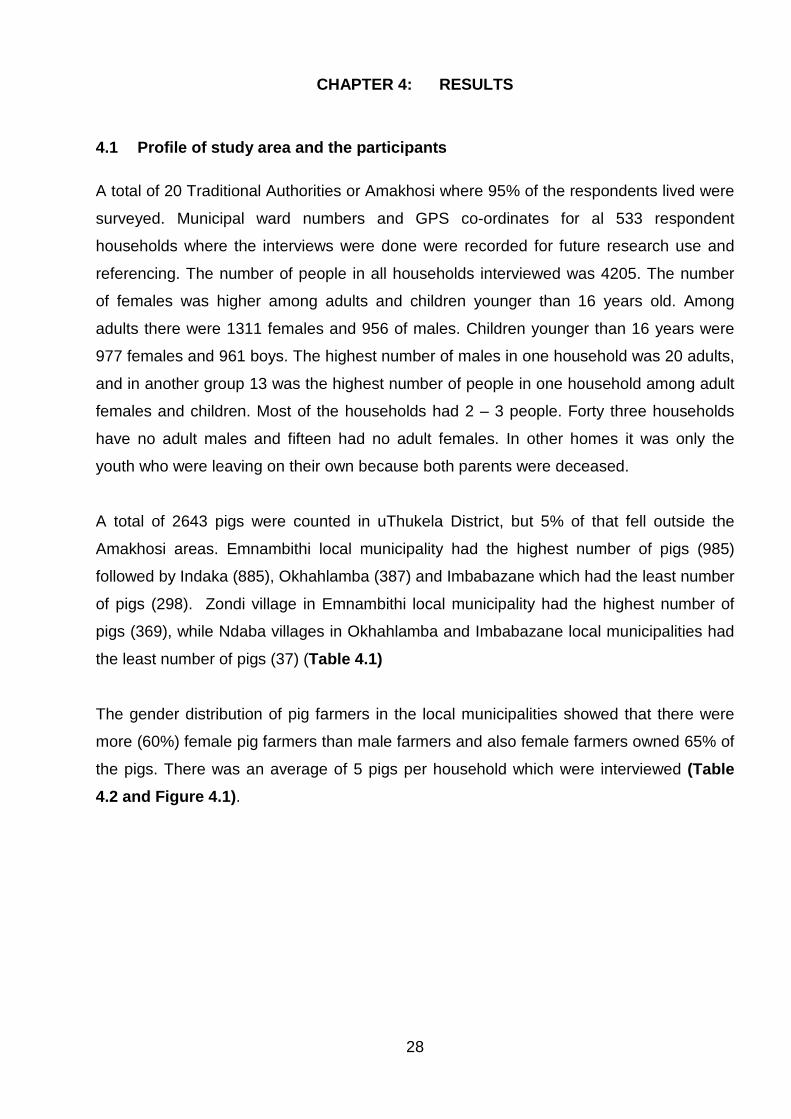
28
CHAPTER 4: RESULTS
4.1 Profile of study area and the participants
A total of 20 Traditional Authorities or Amakhosi where 95% of the respondents lived were
surveyed. Municipal ward numbers and GPS co-ordinates for al 533 respondent
households where the interviews were done were recorded for future research use and
referencing. The number of people in all households interviewed was 4205. The number
of females was higher among adults and children younger than 16 years old. Among
adults there were 1311 females and 956 of males. Children younger than 16 years were
977 females and 961 boys. The highest number of males in one household was 20 adults,
and in another group 13 was the highest number of people in one household among adult
females and children. Most of the households had 2 – 3 people. Forty three households
have no adult males and fifteen had no adult females. In other homes it was only the
youth who were leaving on their own because both parents were deceased.
A total of 2643 pigs were counted in uThukela District, but 5% of that fell outside the
Amakhosi areas. Emnambithi local municipality had the highest number of pigs (985)
followed by Indaka (885), Okhahlamba (387) and Imbabazane which had the least number
of pigs (298). Zondi village in Emnambithi local municipality had the highest number of
pigs (369), while Ndaba villages in Okhahlamba and Imbabazane local municipalities had
the least number of pigs (37) (Table 4.1)
The gender distribution of pig farmers in the local municipalities showed that there were
more (60%) female pig farmers than male farmers and also female farmers owned 65% of
the pigs. There was an average of 5 pigs per household which were interviewed (Table 4.2 and Figure 4.1).
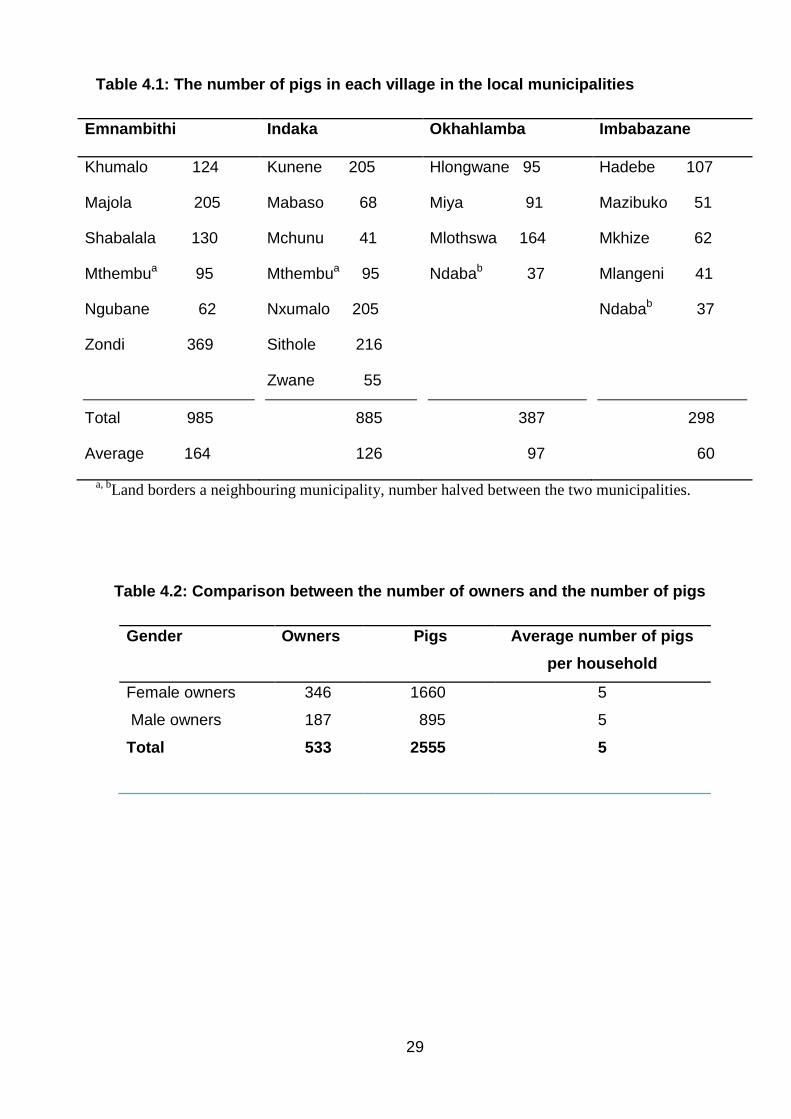
29
Table 4.1: The number of pigs in each village in the local municipalities
Emnambithi Indaka Okhahlamba Imbabazane
Khumalo 124
Majola 205
Shabalala 130
Mthembua 95
Ngubane 62
Zondi 369
Total 985
Kunene 205
Mabaso 68
Mchunu 41
Mthembua 95
Nxumalo 205
Sithole 216
Zwane 55
885
Hlongwane 95
Miya 91
Mlothswa 164
Ndabab 37
387
Hadebe 107
Mazibuko 51
Mkhize 62
Mlangeni 41
Ndabab 37
298
Average 164 126 97 60
a, bLand borders a neighbouring municipality, number halved between the two municipalities.
Table 4.2: Comparison between the number of owners and the number of pigs
Gender Owners Pigs Average number of pigs per household
Female owners 346 1660 5
Male owners 187 895 5
Total 533 2555 5
30
Figure 4.1: Gender distribution of respondents
With respect to home language 99% of respondents stated that isiZulu was their home
language. Other RSA official languages such as isiXhosa, Sesotho and siSwati were also
mentioned by 1 % of the households in uThukela District. Imbabazane and Indaka both
were 100% Zulu home language speakers, with no other RSA official language mentioned
in them, leaving Emnambithi and Okhahlamba Municipalities having the other languages
as home languages. Overall, there was a 74% unemployment rate in every local
municipality, 16% were pensioners, and only 10% of the respondents were employed in
different types of employments.
A number of the respondents were self-employed. The most common self-employment
area was tuck-shops as owners (4%) or selling in schools during lunch breaks almost
similar in all local municipalities, while others were employed as road works labourers (1
%). Other types of occupations observed were taxi drivers, security guards, teachers and
domestic workers. People employed had a significantly higher number of pigs than the
unemployed and pensioners (P<0.05) as shown on table 4.3. No significant differences
were seen between pensioners and the unemployed.
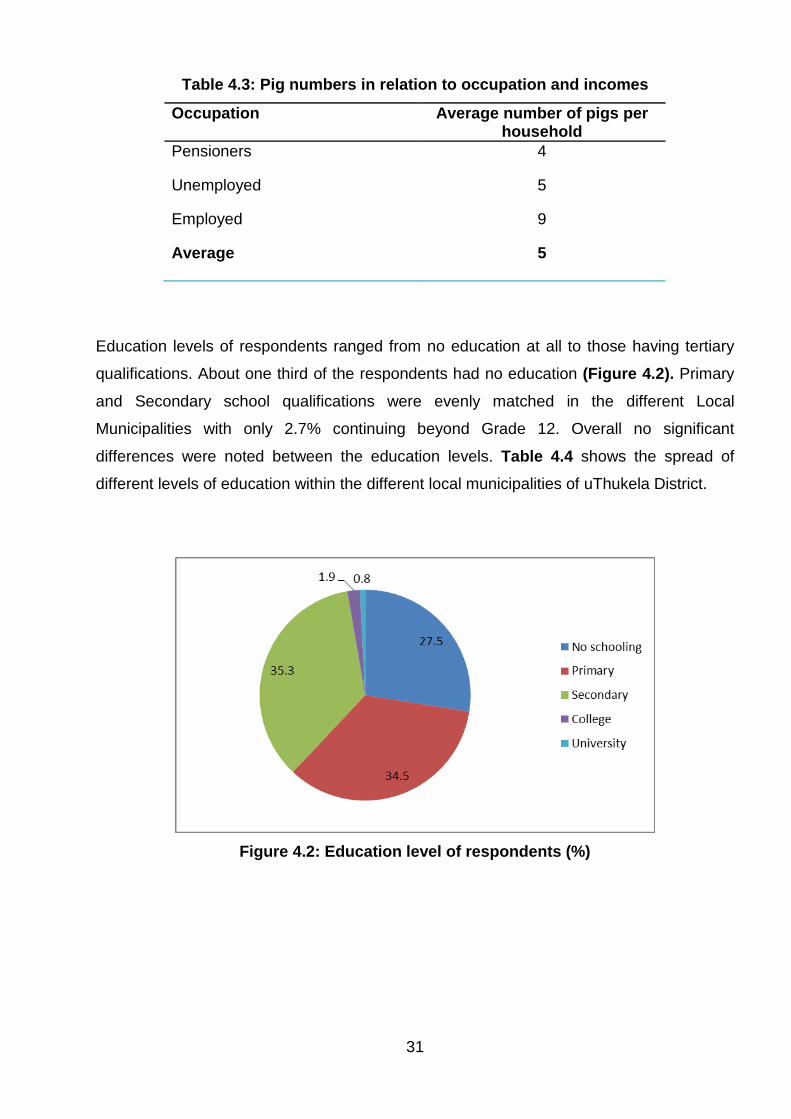
31
Table 4.3: Pig numbers in relation to occupation and incomes
Occupation Average number of pigs per household
Pensioners 4
Unemployed 5
Employed 9
Average 5
Education levels of respondents ranged from no education at all to those having tertiary
qualifications. About one third of the respondents had no education (Figure 4.2). Primary
and Secondary school qualifications were evenly matched in the different Local
Municipalities with only 2.7% continuing beyond Grade 12. Overall no significant
differences were noted between the education levels. Table 4.4 shows the spread of
different levels of education within the different local municipalities of uThukela District.
Figure 4.2: Education level of respondents (%)
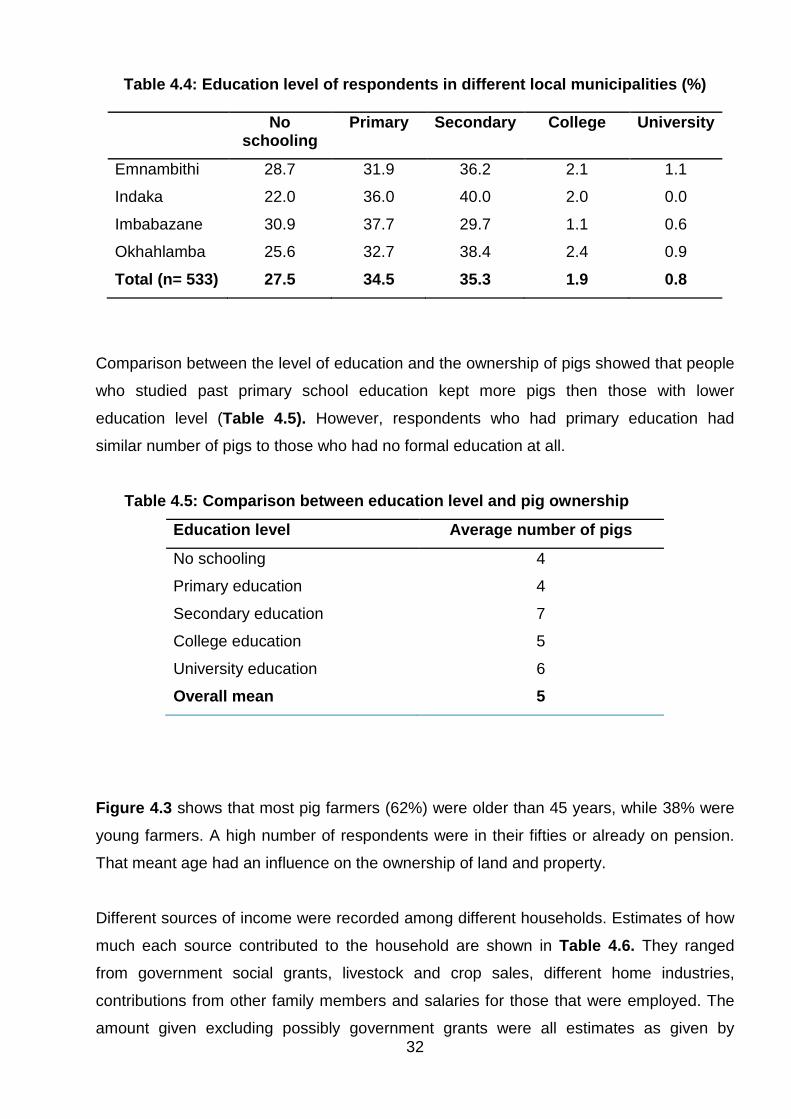
32
Table 4.4: Education level of respondents in different local municipalities (%)
No schooling
Primary Secondary College University
Emnambithi 28.7 31.9 36.2 2.1 1.1
Indaka 22.0 36.0 40.0 2.0 0.0
Imbabazane 30.9 37.7 29.7 1.1 0.6
Okhahlamba 25.6 32.7 38.4 2.4 0.9
Total (n= 533) 27.5 34.5 35.3 1.9 0.8
Comparison between the level of education and the ownership of pigs showed that people
who studied past primary school education kept more pigs then those with lower
education level (Table 4.5). However, respondents who had primary education had
similar number of pigs to those who had no formal education at all.
Table 4.5: Comparison between education level and pig ownership
Education level Average number of pigs
No schooling 4
Primary education 4
Secondary education 7
College education 5
University education 6
Overall mean 5
Figure 4.3 shows that most pig farmers (62%) were older than 45 years, while 38% were
young farmers. A high number of respondents were in their fifties or already on pension.
That meant age had an influence on the ownership of land and property.
Different sources of income were recorded among different households. Estimates of how
much each source contributed to the household are shown in Table 4.6. They ranged
from government social grants, livestock and crop sales, different home industries,
contributions from other family members and salaries for those that were employed. The
amount given excluding possibly government grants were all estimates as given by
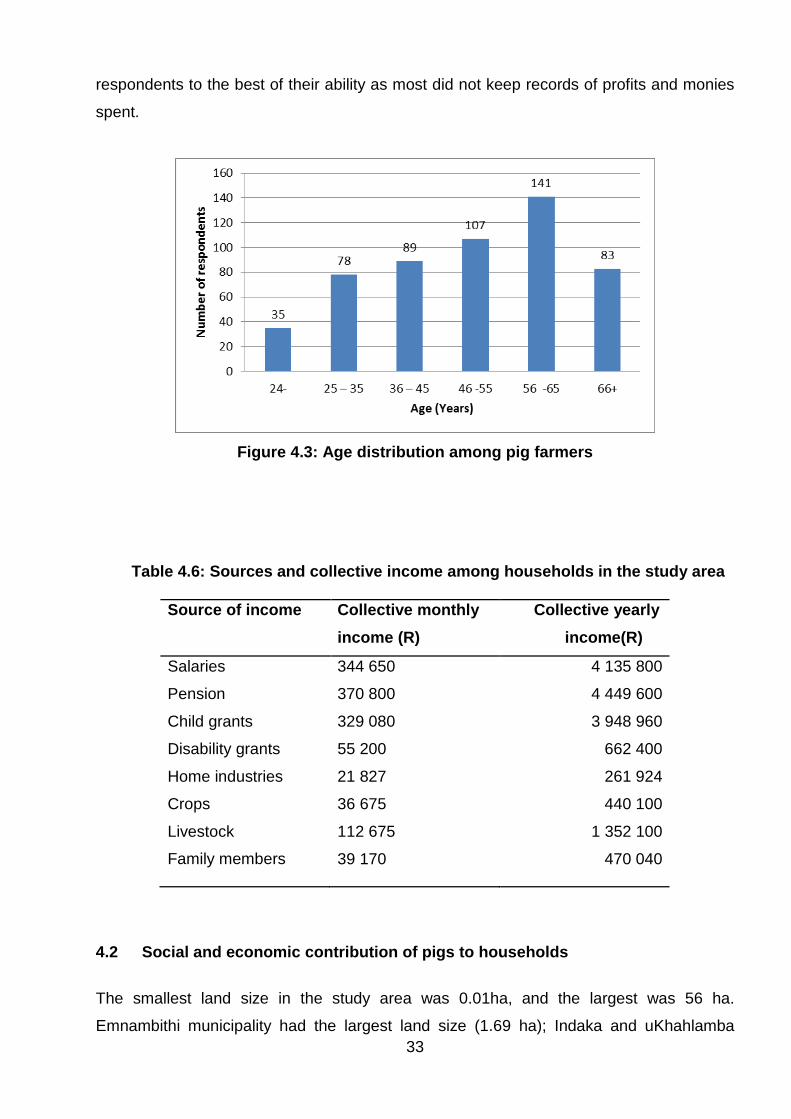
33
respondents to the best of their ability as most did not keep records of profits and monies
spent.
Figure 4.3: Age distribution among pig farmers
Table 4.6: Sources and collective income among households in the study area
Source of income Collective monthly income (R)
Collective yearly income(R)
Salaries 344 650 4 135 800
Pension 370 800 4 449 600
Child grants 329 080 3 948 960
Disability grants 55 200 662 400
Home industries 21 827 261 924
Crops 36 675 440 100
Livestock 112 675 1 352 100
Family members
39 170 470 040
4.2 Social and economic contribution of pigs to households
The smallest land size in the study area was 0.01ha, and the largest was 56 ha.
Emnambithi municipality had the largest land size (1.69 ha); Indaka and uKhahlamba
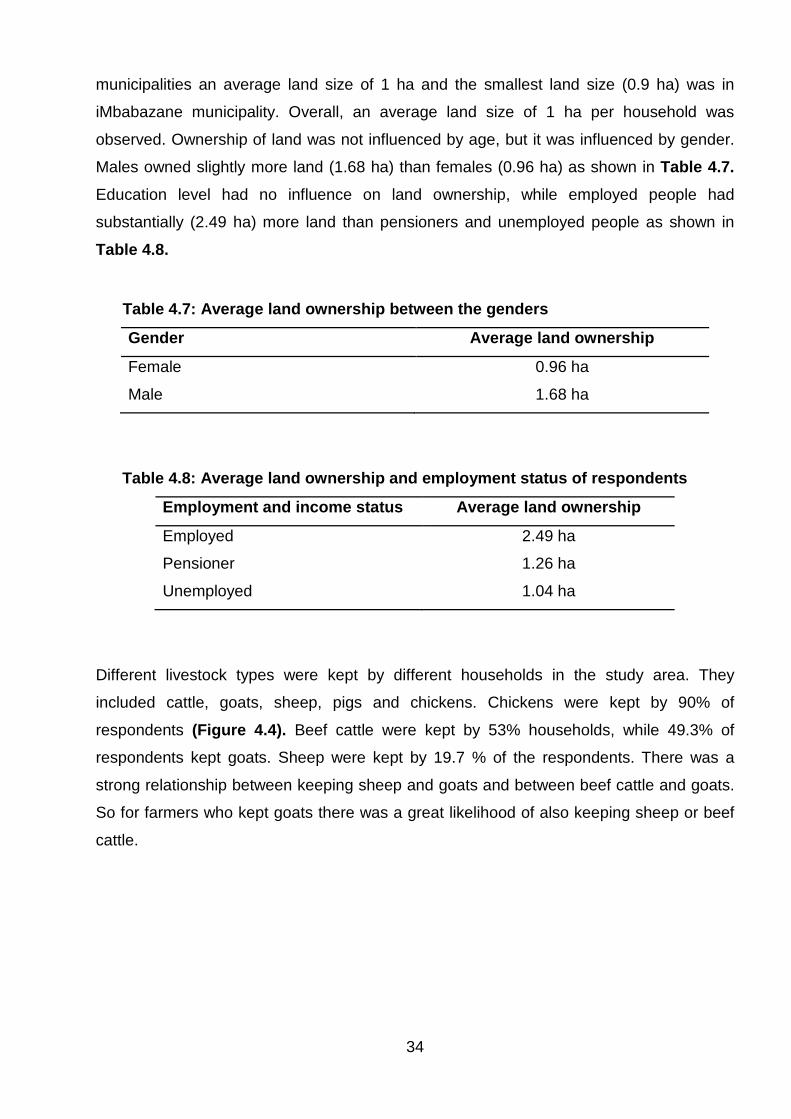
34
municipalities an average land size of 1 ha and the smallest land size (0.9 ha) was in
iMbabazane municipality. Overall, an average land size of 1 ha per household was
observed. Ownership of land was not influenced by age, but it was influenced by gender.
Males owned slightly more land (1.68 ha) than females (0.96 ha) as shown in Table 4.7. Education level had no influence on land ownership, while employed people had
substantially (2.49 ha) more land than pensioners and unemployed people as shown in
Table 4.8. Table 4.7: Average land ownership between the genders
Gender Average land ownership
Female 0.96 ha
Male 1.68 ha
Table 4.8: Average land ownership and employment status of respondents
Employment and income status Average land ownership
Employed 2.49 ha
Pensioner 1.26 ha
Unemployed 1.04 ha
Different livestock types were kept by different households in the study area. They
included cattle, goats, sheep, pigs and chickens. Chickens were kept by 90% of
respondents (Figure 4.4). Beef cattle were kept by 53% households, while 49.3% of
respondents kept goats. Sheep were kept by 19.7 % of the respondents. There was a
strong relationship between keeping sheep and goats and between beef cattle and goats.
So for farmers who kept goats there was a great likelihood of also keeping sheep or beef
cattle.
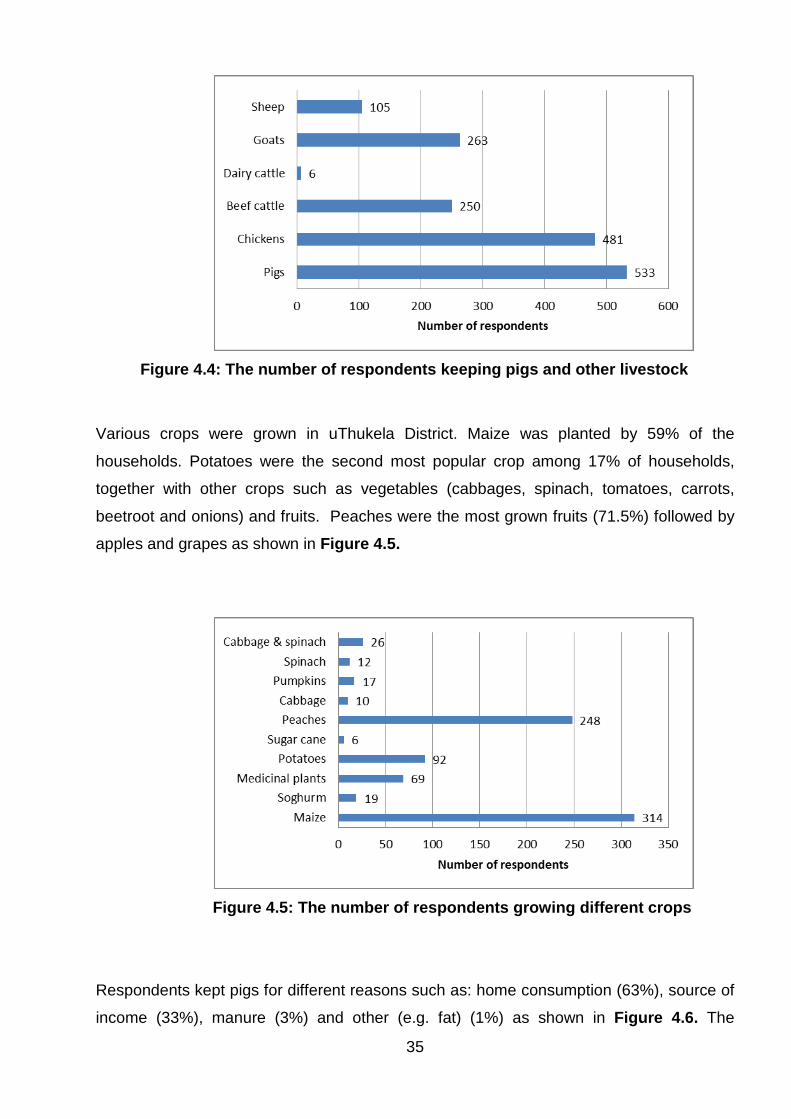
35
Figure 4.4: The number of respondents keeping pigs and other livestock Various crops were grown in uThukela District. Maize was planted by 59% of the
households. Potatoes were the second most popular crop among 17% of households,
together with other crops such as vegetables (cabbages, spinach, tomatoes, carrots,
beetroot and onions) and fruits. Peaches were the most grown fruits (71.5%) followed by
apples and grapes as shown in Figure 4.5.
Figure 4.5: The number of respondents growing different crops
Respondents kept pigs for different reasons such as: home consumption (63%), source of
income (33%), manure (3%) and other (e.g. fat) (1%) as shown in Figure 4.6. The
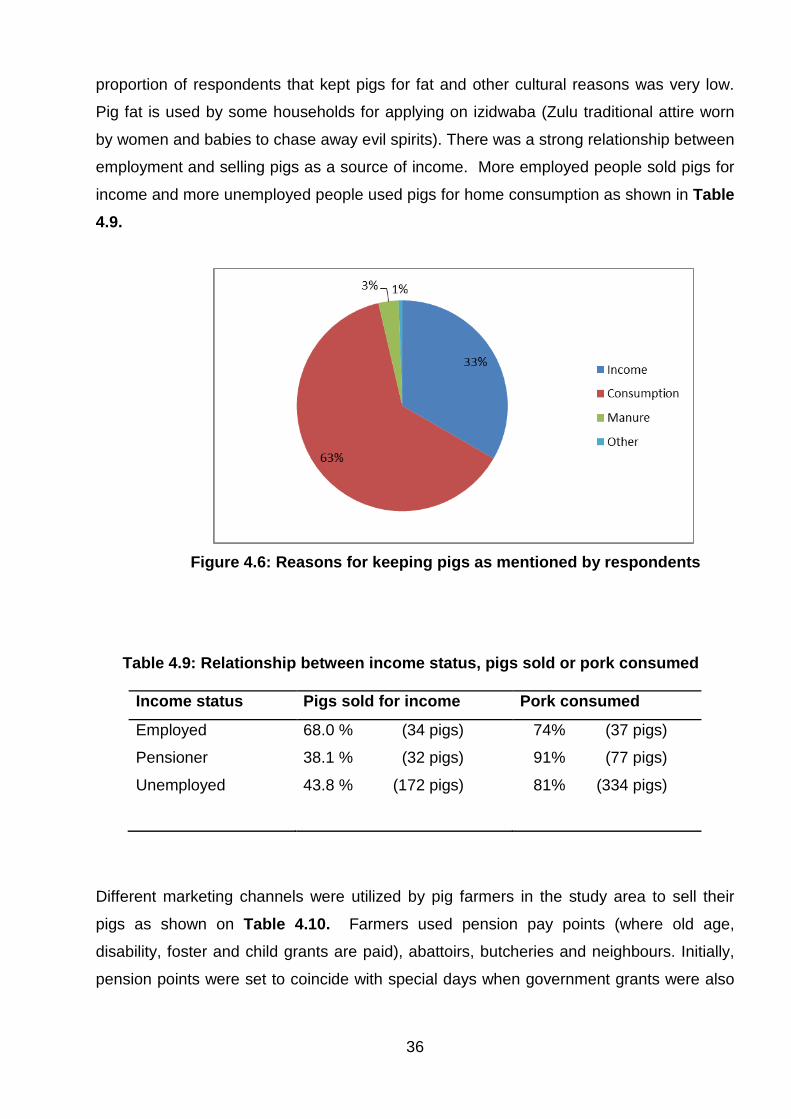
36
proportion of respondents that kept pigs for fat and other cultural reasons was very low.
Pig fat is used by some households for applying on izidwaba (Zulu traditional attire worn
by women and babies to chase away evil spirits). There was a strong relationship between
employment and selling pigs as a source of income. More employed people sold pigs for
income and more unemployed people used pigs for home consumption as shown in Table 4.9.
Figure 4.6: Reasons for keeping pigs as mentioned by respondents
Table 4.9: Relationship between income status, pigs sold or pork consumed
Income status Pigs sold for income Pork consumed
Employed 68.0 % (34 pigs) 74% (37 pigs)
Pensioner 38.1 % (32 pigs) 91% (77 pigs)
Unemployed 43.8 % (172 pigs) 81% (334 pigs)
Different marketing channels were utilized by pig farmers in the study area to sell their
pigs as shown on Table 4.10. Farmers used pension pay points (where old age,
disability, foster and child grants are paid), abattoirs, butcheries and neighbours. Initially,
pension points were set to coincide with special days when government grants were also
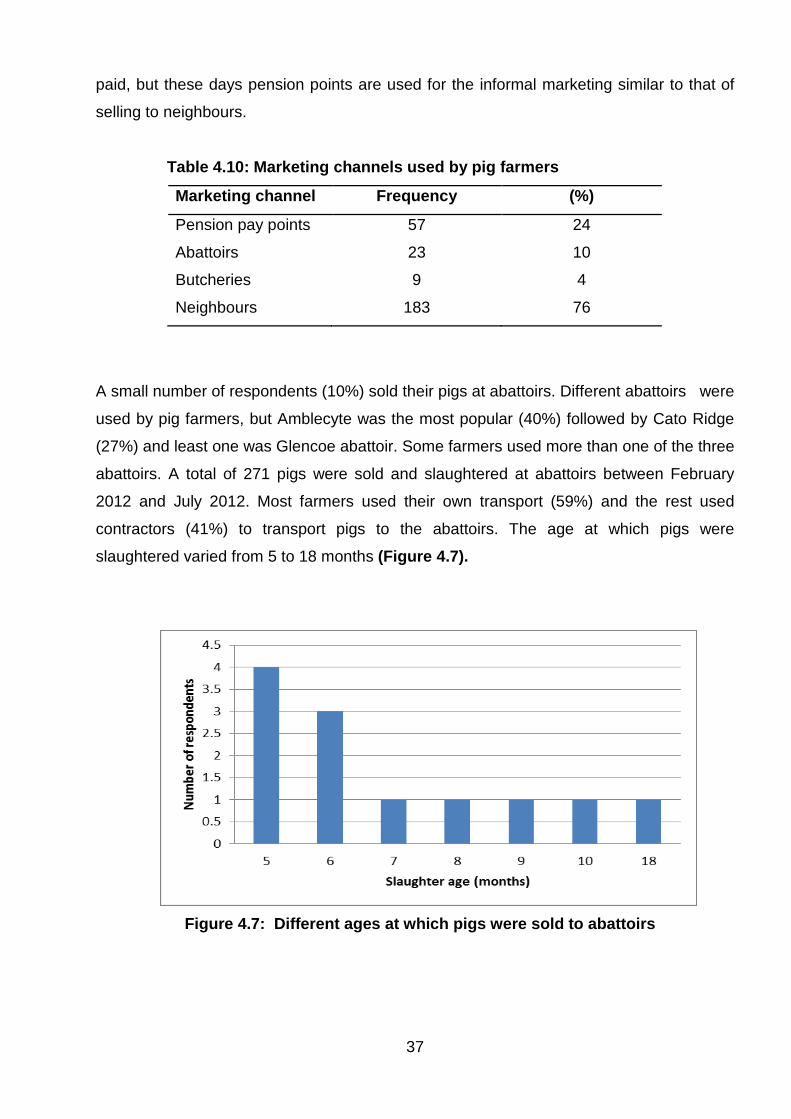
37
paid, but these days pension points are used for the informal marketing similar to that of
selling to neighbours.
Table 4.10: Marketing channels used by pig farmers
Marketing channel Frequency (%)
Pension pay points 57 24
Abattoirs 23 10
Butcheries 9 4
Neighbours 183 76
A small number of respondents (10%) sold their pigs at abattoirs. Different abattoirs were
used by pig farmers, but Amblecyte was the most popular (40%) followed by Cato Ridge
(27%) and least one was Glencoe abattoir. Some farmers used more than one of the three
abattoirs. A total of 271 pigs were sold and slaughtered at abattoirs between February
2012 and July 2012. Most farmers used their own transport (59%) and the rest used
contractors (41%) to transport pigs to the abattoirs. The age at which pigs were
slaughtered varied from 5 to 18 months (Figure 4.7).
Figure 4.7: Different ages at which pigs were sold to abattoirs
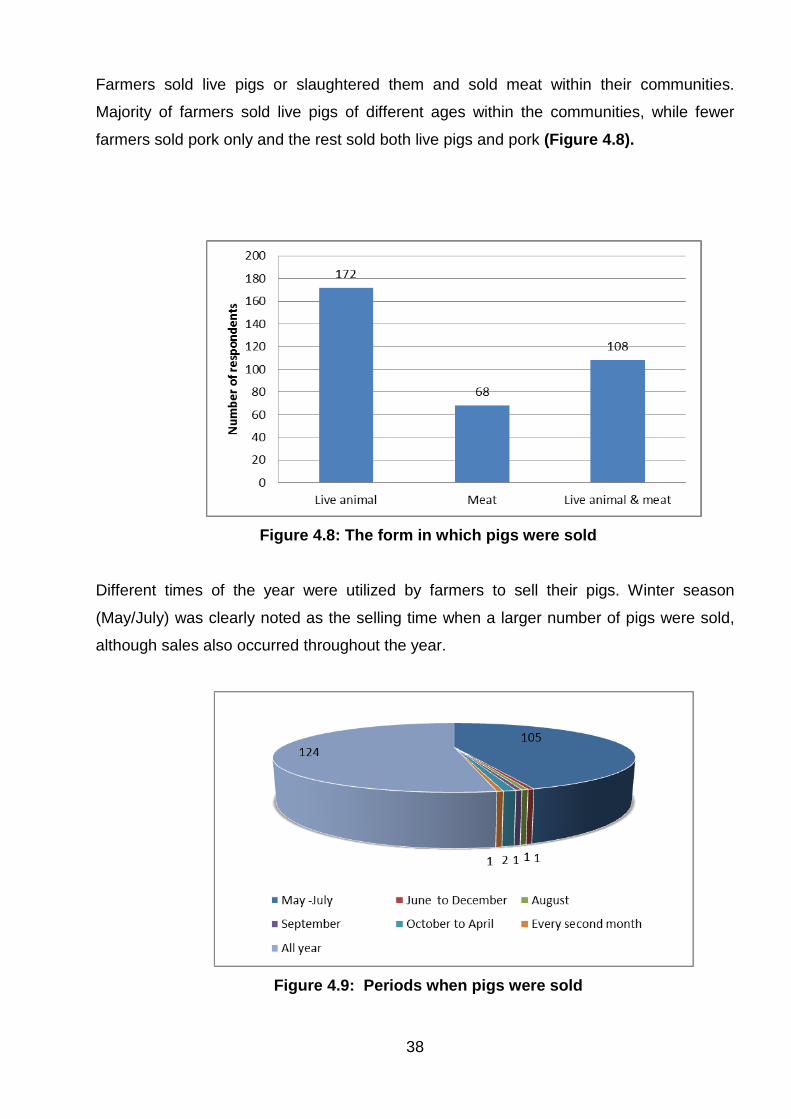
38
Farmers sold live pigs or slaughtered them and sold meat within their communities.
Majority of farmers sold live pigs of different ages within the communities, while fewer
farmers sold pork only and the rest sold both live pigs and pork (Figure 4.8).
Figure 4.8: The form in which pigs were sold
Different times of the year were utilized by farmers to sell their pigs. Winter season
(May/July) was clearly noted as the selling time when a larger number of pigs were sold,
although sales also occurred throughout the year.
Figure 4.9: Periods when pigs were sold
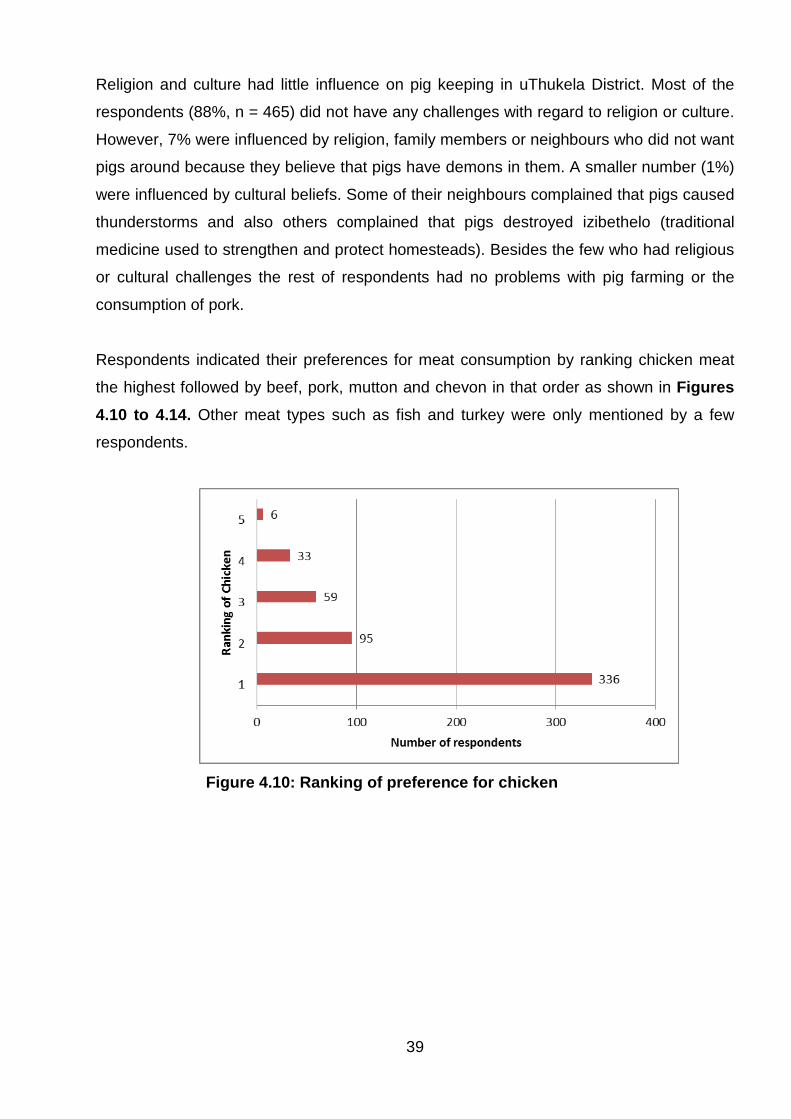
39
Religion and culture had little influence on pig keeping in uThukela District. Most of the
respondents (88%, n = 465) did not have any challenges with regard to religion or culture.
However, 7% were influenced by religion, family members or neighbours who did not want
pigs around because they believe that pigs have demons in them. A smaller number (1%)
were influenced by cultural beliefs. Some of their neighbours complained that pigs caused
thunderstorms and also others complained that pigs destroyed izibethelo (traditional
medicine used to strengthen and protect homesteads). Besides the few who had religious
or cultural challenges the rest of respondents had no problems with pig farming or the
consumption of pork.
Respondents indicated their preferences for meat consumption by ranking chicken meat
the highest followed by beef, pork, mutton and chevon in that order as shown in Figures
4.10 to 4.14. Other meat types such as fish and turkey were only mentioned by a few
respondents.
Figure 4.10: Ranking of preference for chicken
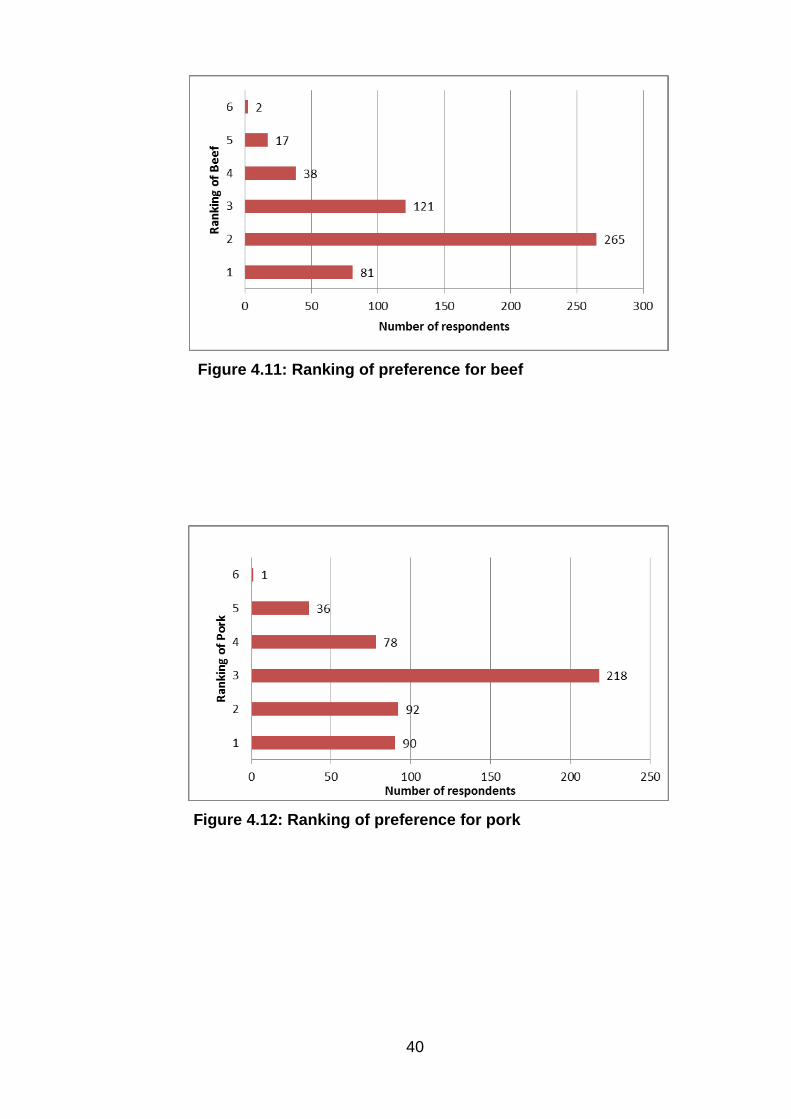
40
Figure 4.11: Ranking of preference for beef
Figure 4.12: Ranking of preference for pork
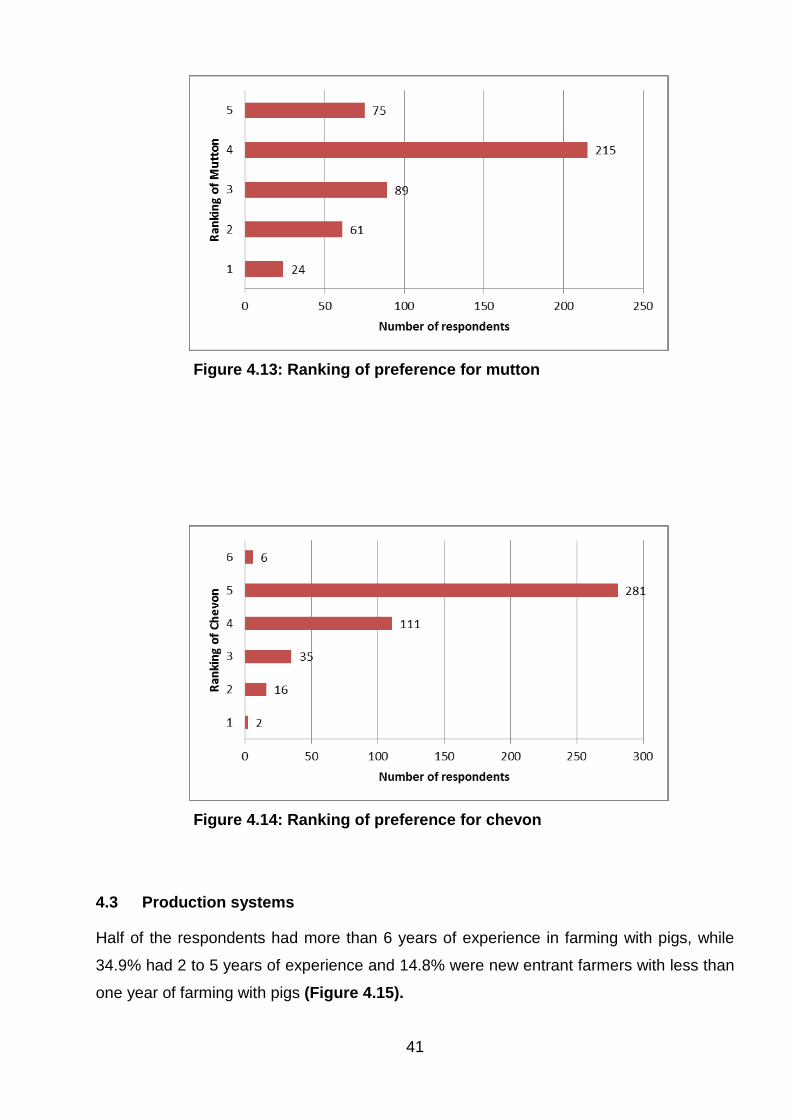
41
Figure 4.13: Ranking of preference for mutton
Figure 4.14: Ranking of preference for chevon
4.3 Production systems
Half of the respondents had more than 6 years of experience in farming with pigs, while
34.9% had 2 to 5 years of experience and 14.8% were new entrant farmers with less than
one year of farming with pigs (Figure 4.15).
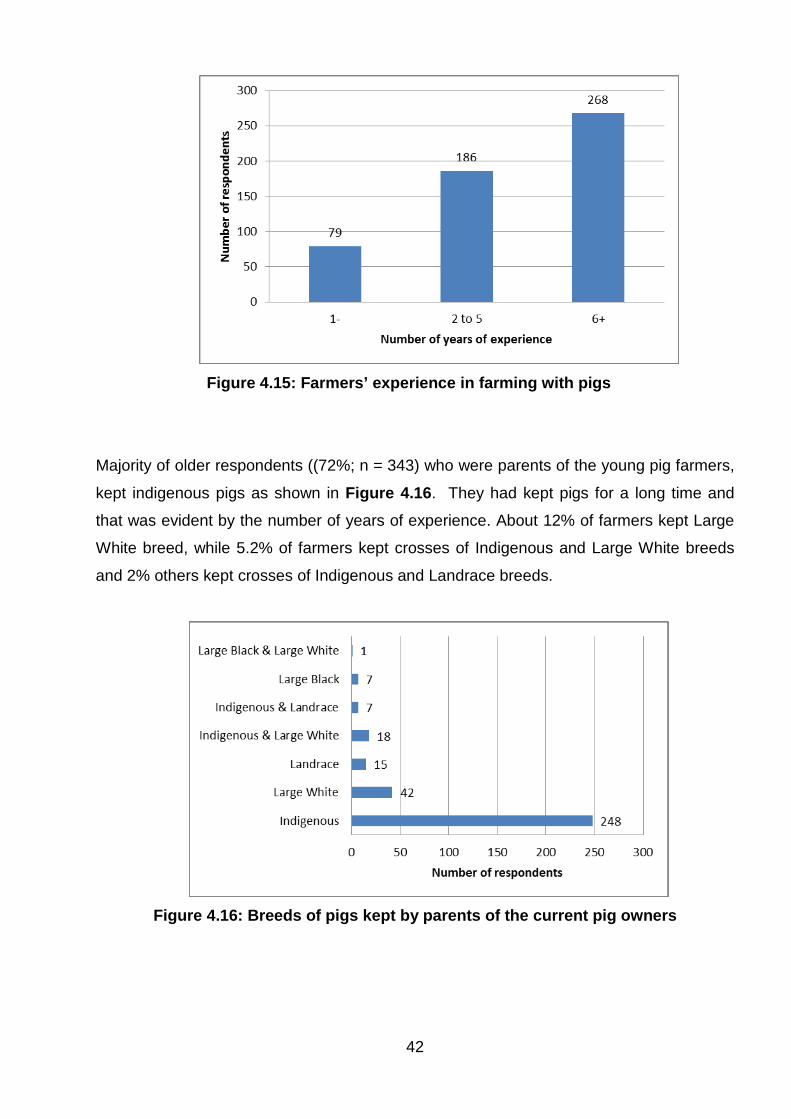
42
Figure 4.15: Farmers’ experience in farming with pigs
Majority of older respondents ((72%; n = 343) who were parents of the young pig farmers,
kept indigenous pigs as shown in Figure 4.16. They had kept pigs for a long time and
that was evident by the number of years of experience. About 12% of farmers kept Large
White breed, while 5.2% of farmers kept crosses of Indigenous and Large White breeds
and 2% others kept crosses of Indigenous and Landrace breeds.
Figure 4.16: Breeds of pigs kept by parents of the current pig owners
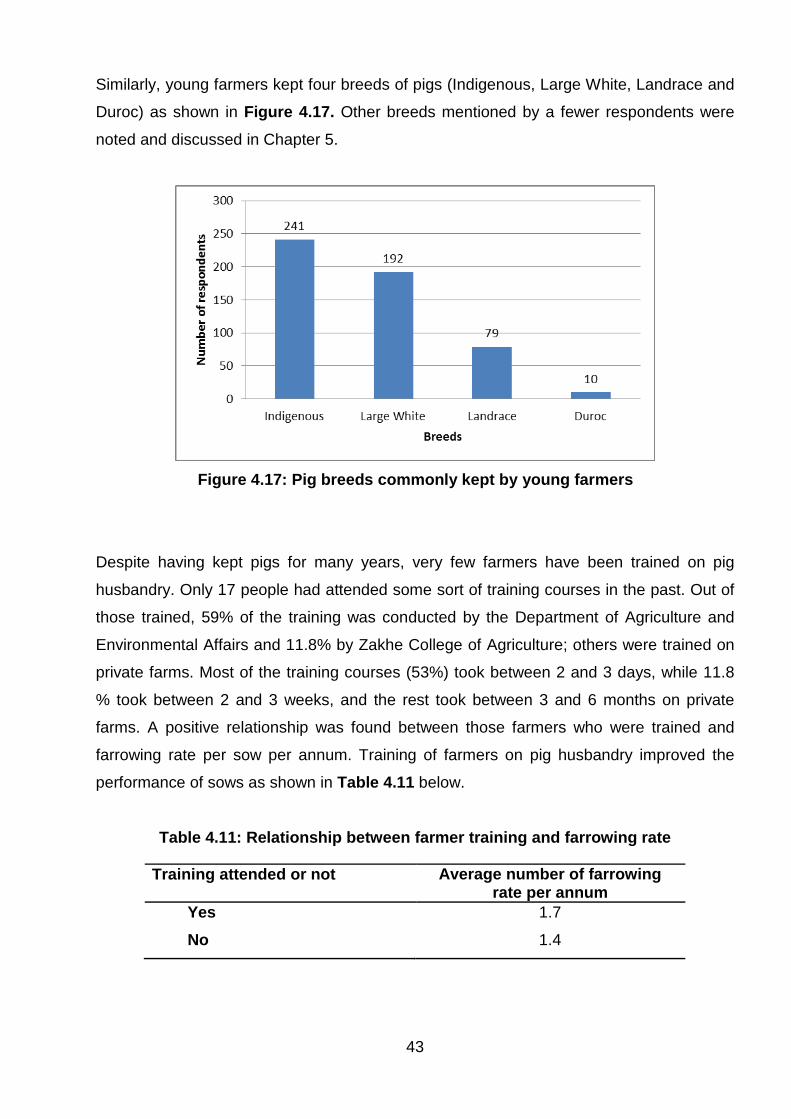
43
Similarly, young farmers kept four breeds of pigs (Indigenous, Large White, Landrace and
Duroc) as shown in Figure 4.17. Other breeds mentioned by a fewer respondents were
noted and discussed in Chapter 5.
Figure 4.17: Pig breeds commonly kept by young farmers
Despite having kept pigs for many years, very few farmers have been trained on pig
husbandry. Only 17 people had attended some sort of training courses in the past. Out of
those trained, 59% of the training was conducted by the Department of Agriculture and
Environmental Affairs and 11.8% by Zakhe College of Agriculture; others were trained on
private farms. Most of the training courses (53%) took between 2 and 3 days, while 11.8
% took between 2 and 3 weeks, and the rest took between 3 and 6 months on private
farms. A positive relationship was found between those farmers who were trained and
farrowing rate per sow per annum. Training of farmers on pig husbandry improved the
performance of sows as shown in Table 4.11 below.
Table 4.11: Relationship between farmer training and farrowing rate
Training attended or not Average number of farrowing rate per annum
Yes 1.7
No 1.4
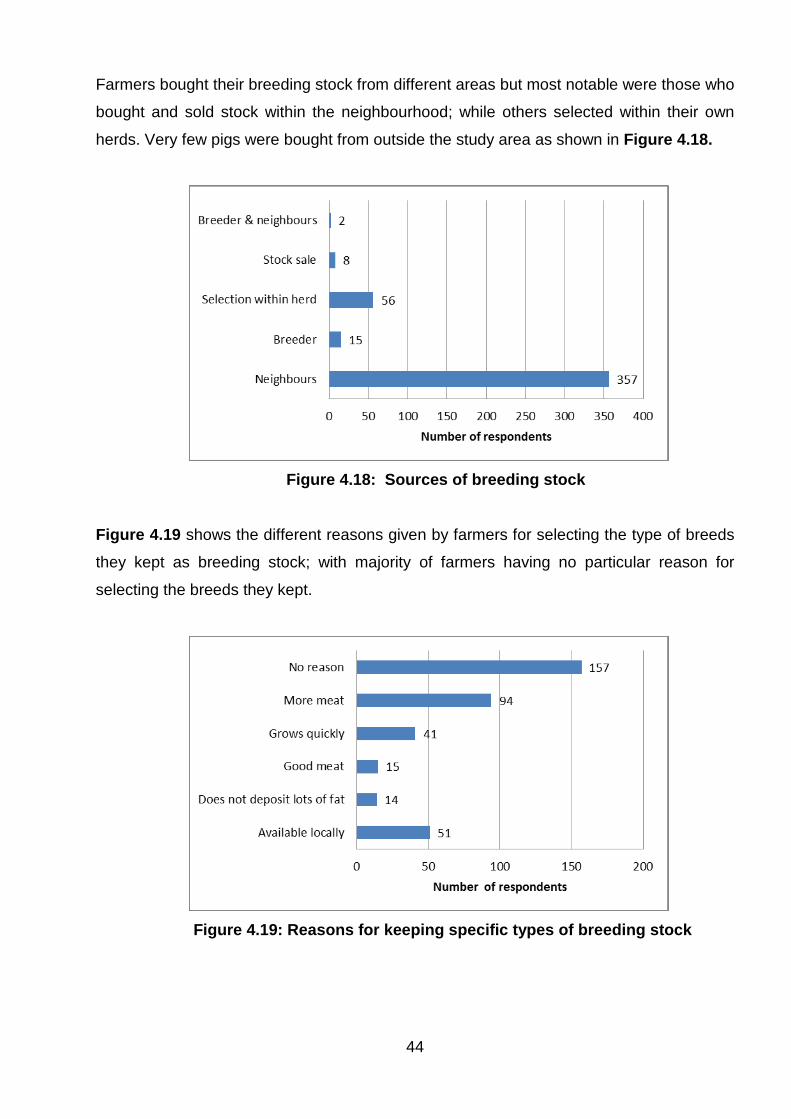
44
Farmers bought their breeding stock from different areas but most notable were those who
bought and sold stock within the neighbourhood; while others selected within their own
herds. Very few pigs were bought from outside the study area as shown in Figure 4.18.
Figure 4.18: Sources of breeding stock
Figure 4.19 shows the different reasons given by farmers for selecting the type of breeds
they kept as breeding stock; with majority of farmers having no particular reason for
selecting the breeds they kept.
Figure 4.19: Reasons for keeping specific types of breeding stock
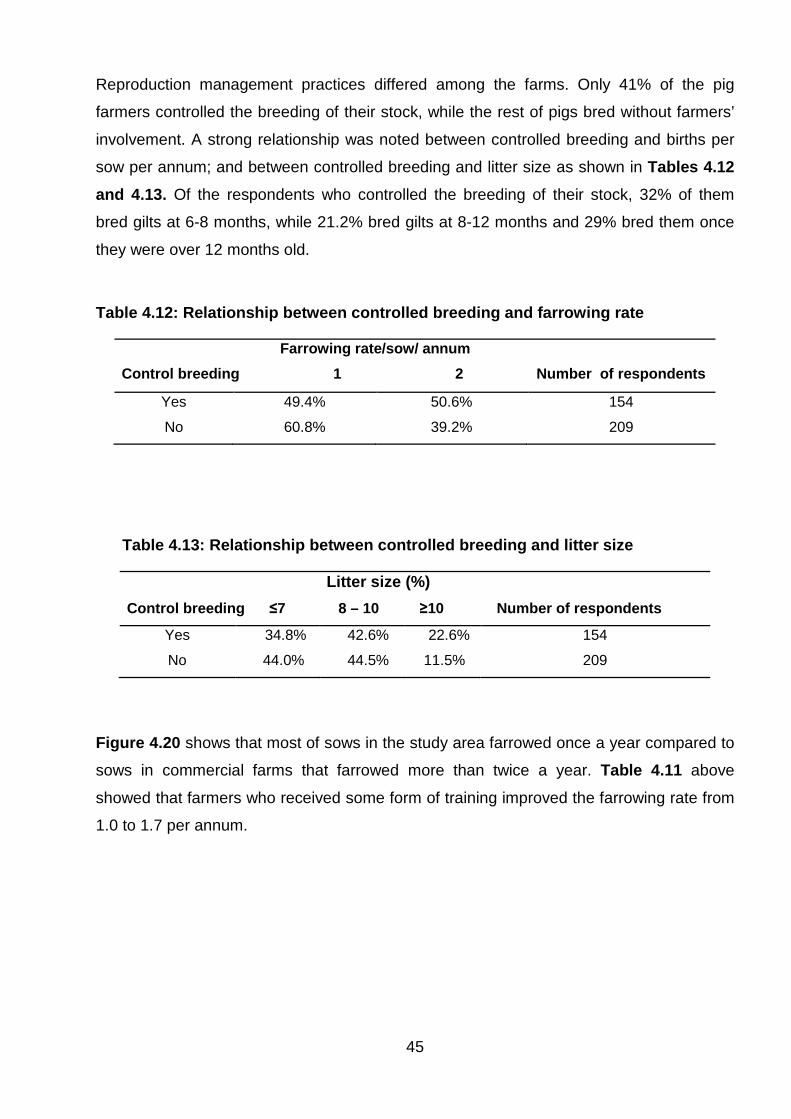
45
Reproduction management practices differed among the farms. Only 41% of the pig
farmers controlled the breeding of their stock, while the rest of pigs bred without farmers’
involvement. A strong relationship was noted between controlled breeding and births per
sow per annum; and between controlled breeding and litter size as shown in Tables 4.12 and 4.13. Of the respondents who controlled the breeding of their stock, 32% of them
bred gilts at 6-8 months, while 21.2% bred gilts at 8-12 months and 29% bred them once
they were over 12 months old.
Table 4.12: Relationship between controlled breeding and farrowing rate
Farrowing rate/sow/ annum Control breeding 1 2 Number of respondents
Yes 49.4% 50.6% 154
No 60.8% 39.2% 209
Table 4.13: Relationship between controlled breeding and litter size
Litter size (%) Control breeding ≤7 8 – 10 ≥10 Number of respondents
Yes 34.8% 42.6% 22.6% 154
No 44.0% 44.5% 11.5% 209
Figure 4.20 shows that most of sows in the study area farrowed once a year compared to
sows in commercial farms that farrowed more than twice a year. Table 4.11 above
showed that farmers who received some form of training improved the farrowing rate from
1.0 to 1.7 per annum.
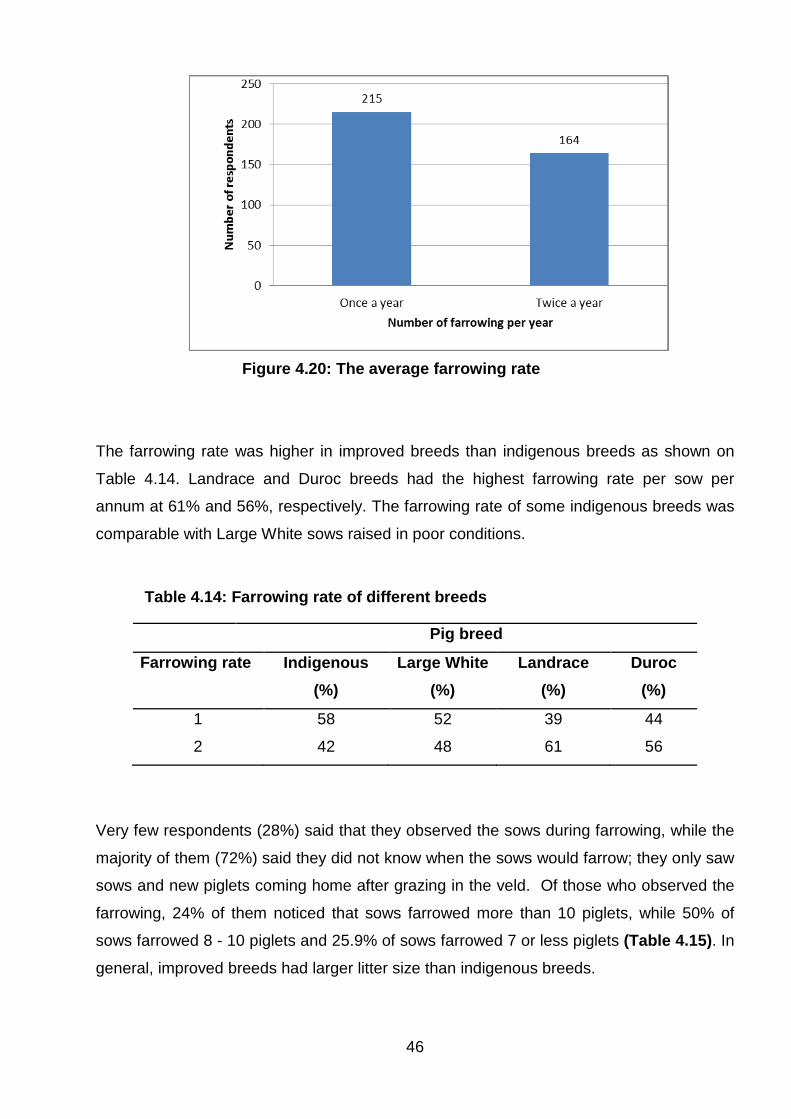
46
Figure 4.20: The average farrowing rate
The farrowing rate was higher in improved breeds than indigenous breeds as shown on
Table 4.14. Landrace and Duroc breeds had the highest farrowing rate per sow per
annum at 61% and 56%, respectively. The farrowing rate of some indigenous breeds was
comparable with Large White sows raised in poor conditions.
Table 4.14: Farrowing rate of different breeds
Pig breed
Farrowing rate Indigenous (%)
Large White (%)
Landrace (%)
Duroc (%)
1 58 52 39 44
2 42 48 61 56
Very few respondents (28%) said that they observed the sows during farrowing, while the
majority of them (72%) said they did not know when the sows would farrow; they only saw
sows and new piglets coming home after grazing in the veld. Of those who observed the
farrowing, 24% of them noticed that sows farrowed more than 10 piglets, while 50% of
sows farrowed 8 - 10 piglets and 25.9% of sows farrowed 7 or less piglets (Table 4.15). In
general, improved breeds had larger litter size than indigenous breeds.
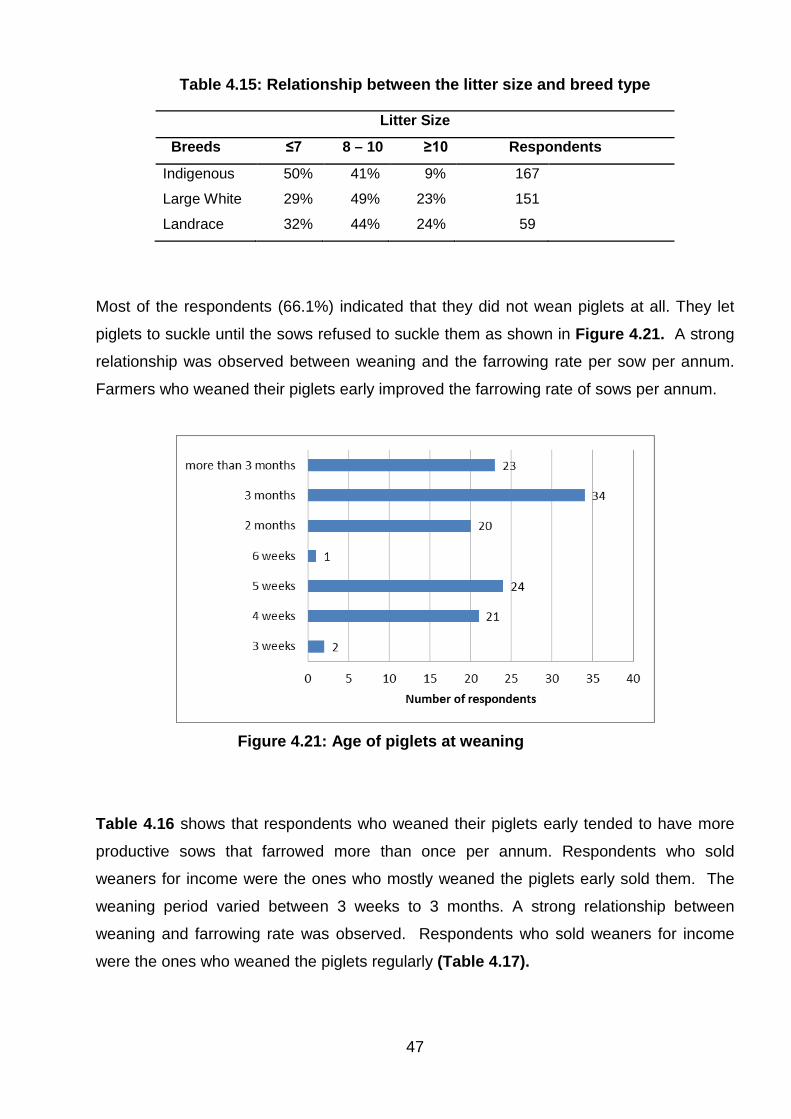
47
Table 4.15: Relationship between the litter size and breed type
Litter Size
Breeds ≤7 8 – 10 ≥10 Respondents
Indigenous 50% 41% 9% 167
Large White 29% 49% 23% 151
Landrace 32% 44% 24% 59
Most of the respondents (66.1%) indicated that they did not wean piglets at all. They let
piglets to suckle until the sows refused to suckle them as shown in Figure 4.21. A strong
relationship was observed between weaning and the farrowing rate per sow per annum.
Farmers who weaned their piglets early improved the farrowing rate of sows per annum.
Figure 4.21: Age of piglets at weaning
Table 4.16 shows that respondents who weaned their piglets early tended to have more
productive sows that farrowed more than once per annum. Respondents who sold
weaners for income were the ones who mostly weaned the piglets early sold them. The
weaning period varied between 3 weeks to 3 months. A strong relationship between
weaning and farrowing rate was observed. Respondents who sold weaners for income
were the ones who weaned the piglets regularly (Table 4.17).
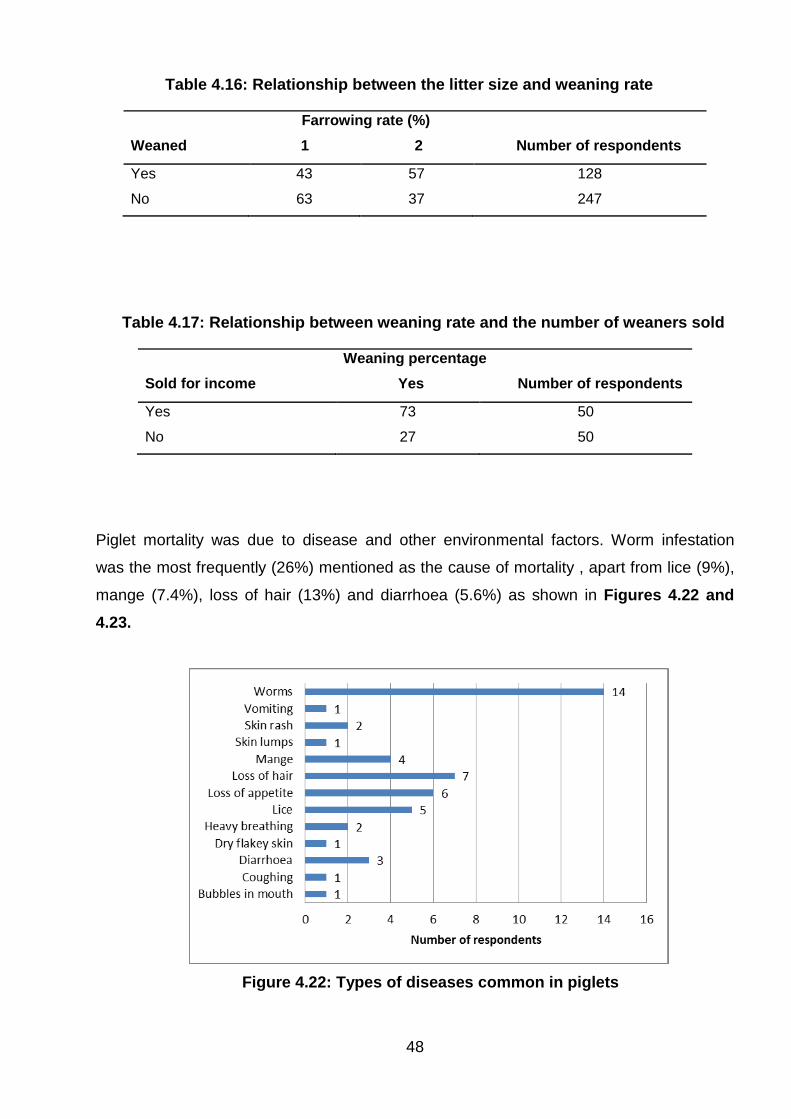
48
Table 4.16: Relationship between the litter size and weaning rate
Farrowing rate (%) Weaned 1 2 Number of respondents
Yes 43 57 128
No 63 37 247
Table 4.17: Relationship between weaning rate and the number of weaners sold
Weaning percentage Sold for income Yes Number of respondents
Yes 73 50
No 27 50
Piglet mortality was due to disease and other environmental factors. Worm infestation
was the most frequently (26%) mentioned as the cause of mortality , apart from lice (9%),
mange (7.4%), loss of hair (13%) and diarrhoea (5.6%) as shown in Figures 4.22 and 4.23.
Figure 4.22: Types of diseases common in piglets
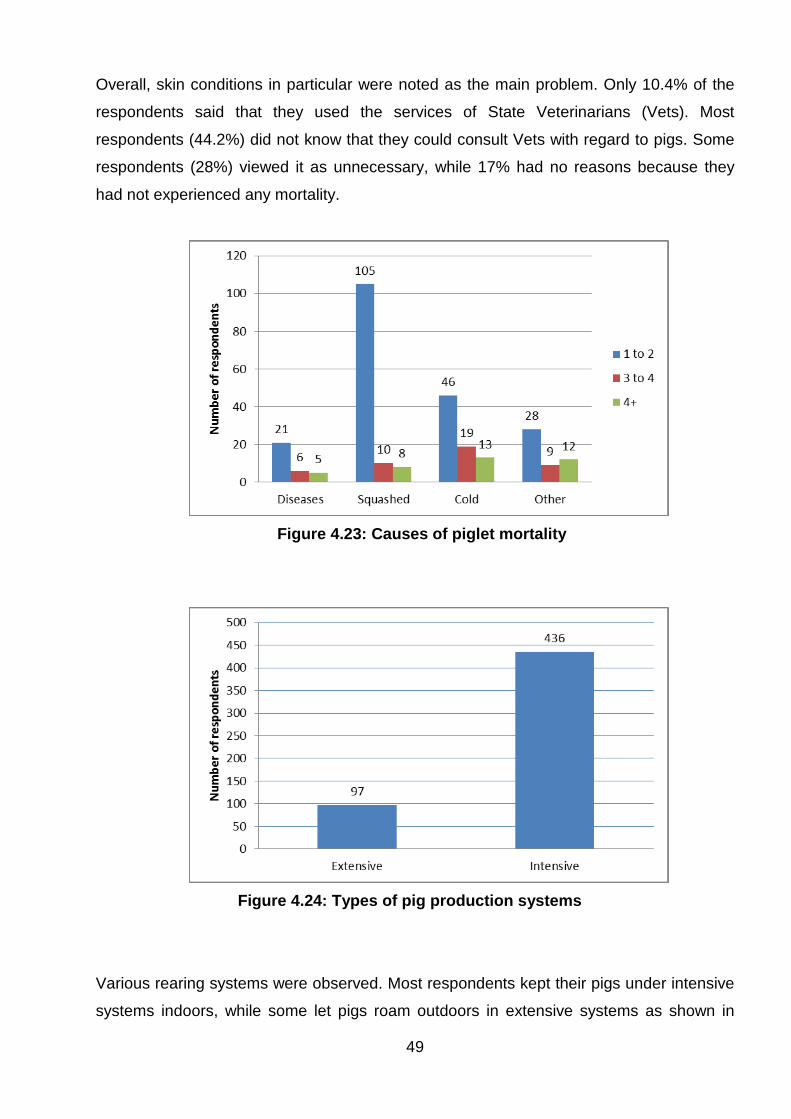
49
Overall, skin conditions in particular were noted as the main problem. Only 10.4% of the
respondents said that they used the services of State Veterinarians (Vets). Most
respondents (44.2%) did not know that they could consult Vets with regard to pigs. Some
respondents (28%) viewed it as unnecessary, while 17% had no reasons because they
had not experienced any mortality.
Figure 4.23: Causes of piglet mortality
Figure 4.24: Types of pig production systems
Various rearing systems were observed. Most respondents kept their pigs under intensive
systems indoors, while some let pigs roam outdoors in extensive systems as shown in
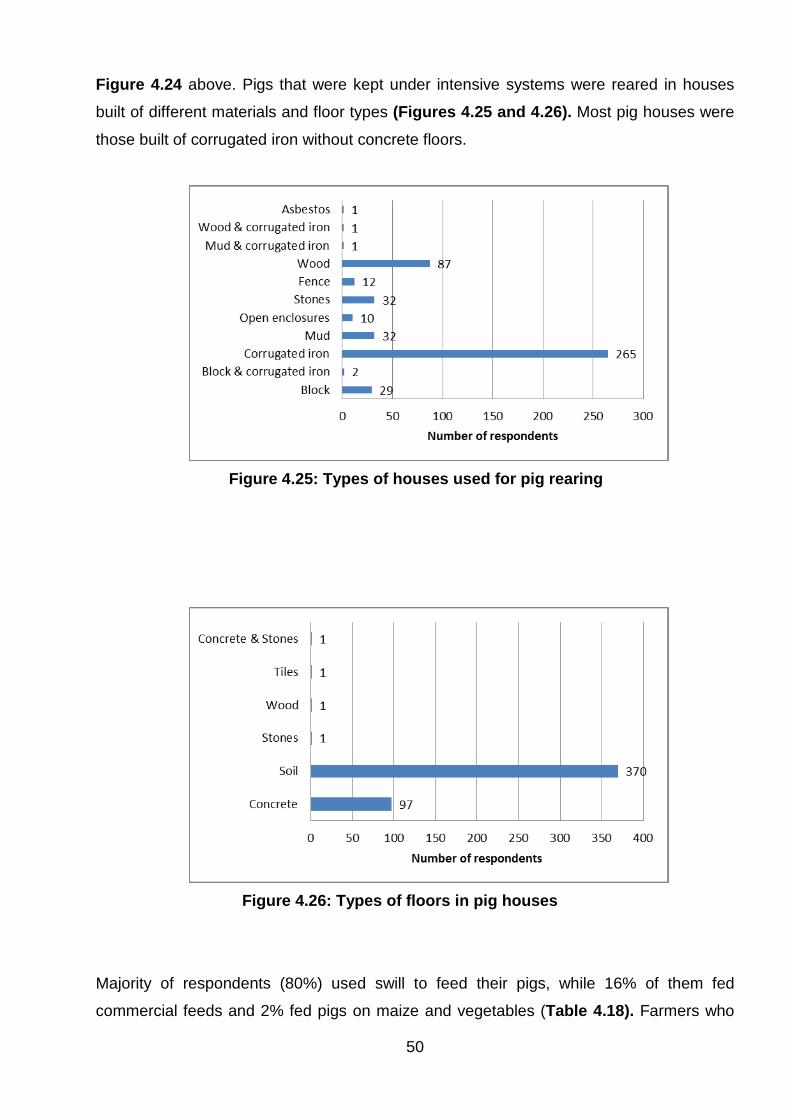
50
Figure 4.24 above. Pigs that were kept under intensive systems were reared in houses
built of different materials and floor types (Figures 4.25 and 4.26). Most pig houses were
those built of corrugated iron without concrete floors.
Figure 4.25: Types of houses used for pig rearing
Figure 4.26: Types of floors in pig houses
Majority of respondents (80%) used swill to feed their pigs, while 16% of them fed
commercial feeds and 2% fed pigs on maize and vegetables (Table 4.18). Farmers who
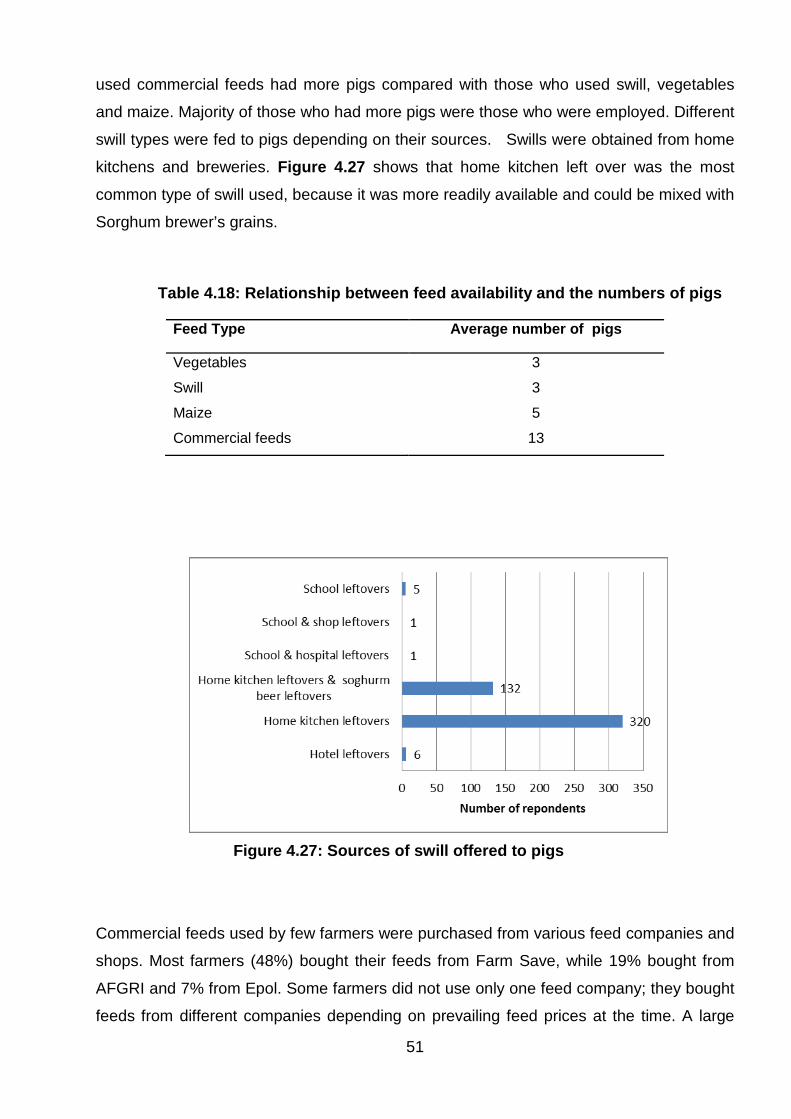
51
used commercial feeds had more pigs compared with those who used swill, vegetables
and maize. Majority of those who had more pigs were those who were employed. Different
swill types were fed to pigs depending on their sources. Swills were obtained from home
kitchens and breweries. Figure 4.27 shows that home kitchen left over was the most
common type of swill used, because it was more readily available and could be mixed with
Sorghum brewer’s grains.
Table 4.18: Relationship between feed availability and the numbers of pigs
Feed Type Average number of pigs
Vegetables 3
Swill 3
Maize 5
Commercial feeds 13
Figure 4.27: Sources of swill offered to pigs
Commercial feeds used by few farmers were purchased from various feed companies and
shops. Most farmers (48%) bought their feeds from Farm Save, while 19% bought from
AFGRI and 7% from Epol. Some farmers did not use only one feed company; they bought
feeds from different companies depending on prevailing feed prices at the time. A large
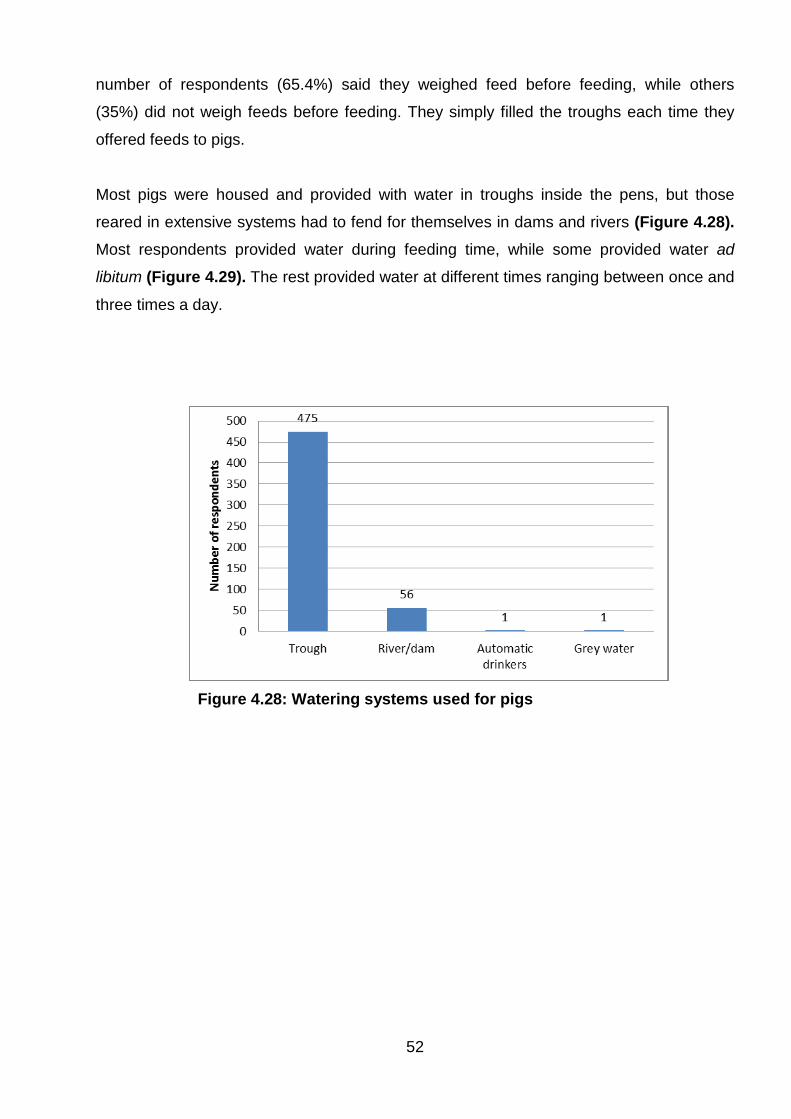
52
number of respondents (65.4%) said they weighed feed before feeding, while others
(35%) did not weigh feeds before feeding. They simply filled the troughs each time they
offered feeds to pigs.
Most pigs were housed and provided with water in troughs inside the pens, but those
reared in extensive systems had to fend for themselves in dams and rivers (Figure 4.28). Most respondents provided water during feeding time, while some provided water ad
libitum (Figure 4.29). The rest provided water at different times ranging between once and
three times a day.
Figure 4.28: Watering systems used for pigs
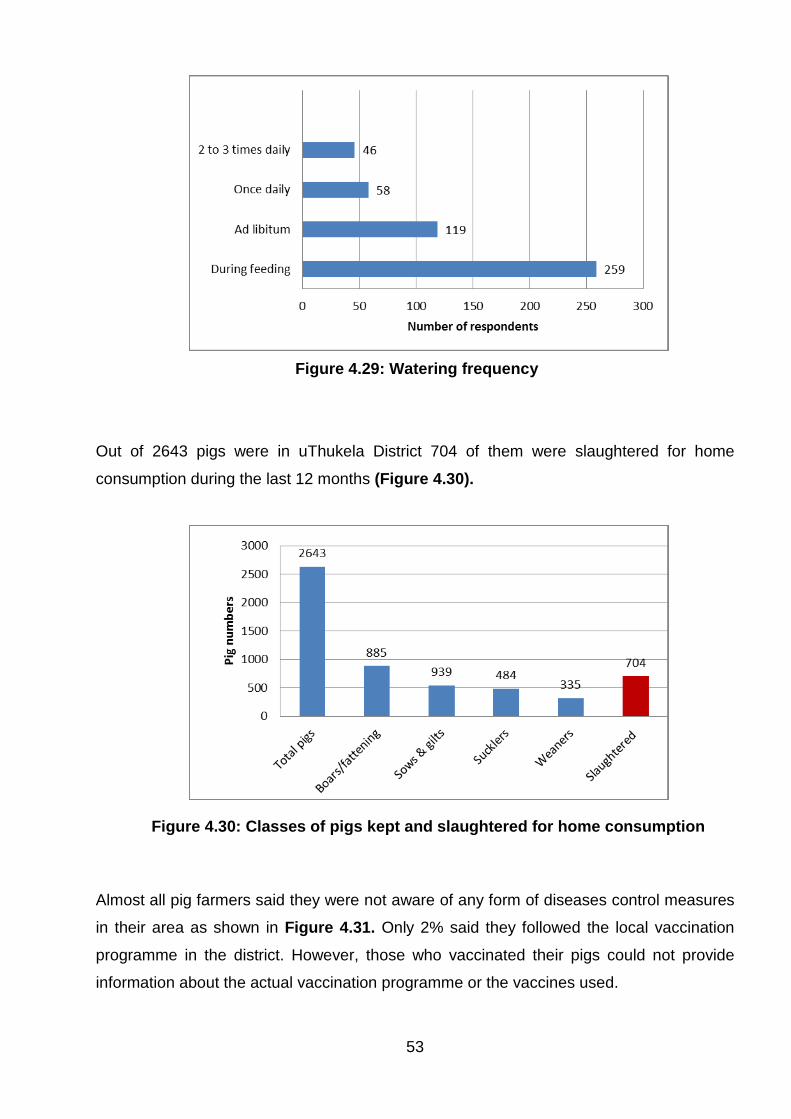
53
Figure 4.29: Watering frequency
Out of 2643 pigs were in uThukela District 704 of them were slaughtered for home
consumption during the last 12 months (Figure 4.30).
Figure 4.30: Classes of pigs kept and slaughtered for home consumption Almost all pig farmers said they were not aware of any form of diseases control measures
in their area as shown in Figure 4.31. Only 2% said they followed the local vaccination
programme in the district. However, those who vaccinated their pigs could not provide
information about the actual vaccination programme or the vaccines used.
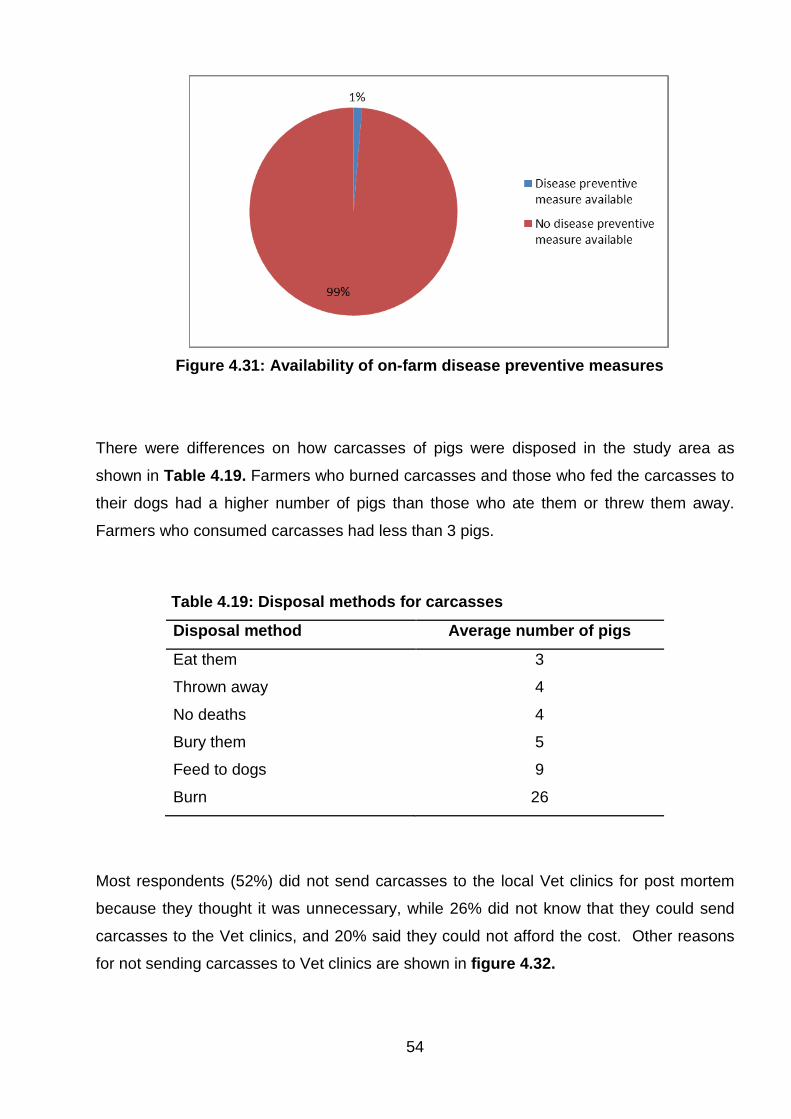
54
Figure 4.31: Availability of on-farm disease preventive measures
There were differences on how carcasses of pigs were disposed in the study area as
shown in Table 4.19. Farmers who burned carcasses and those who fed the carcasses to
their dogs had a higher number of pigs than those who ate them or threw them away.
Farmers who consumed carcasses had less than 3 pigs.
Table 4.19: Disposal methods for carcasses
Disposal method Average number of pigs
Eat them 3
Thrown away 4
No deaths 4
Bury them 5
Feed to dogs 9
Burn 26
Most respondents (52%) did not send carcasses to the local Vet clinics for post mortem
because they thought it was unnecessary, while 26% did not know that they could send
carcasses to the Vet clinics, and 20% said they could not afford the cost. Other reasons
for not sending carcasses to Vet clinics are shown in figure 4.32.
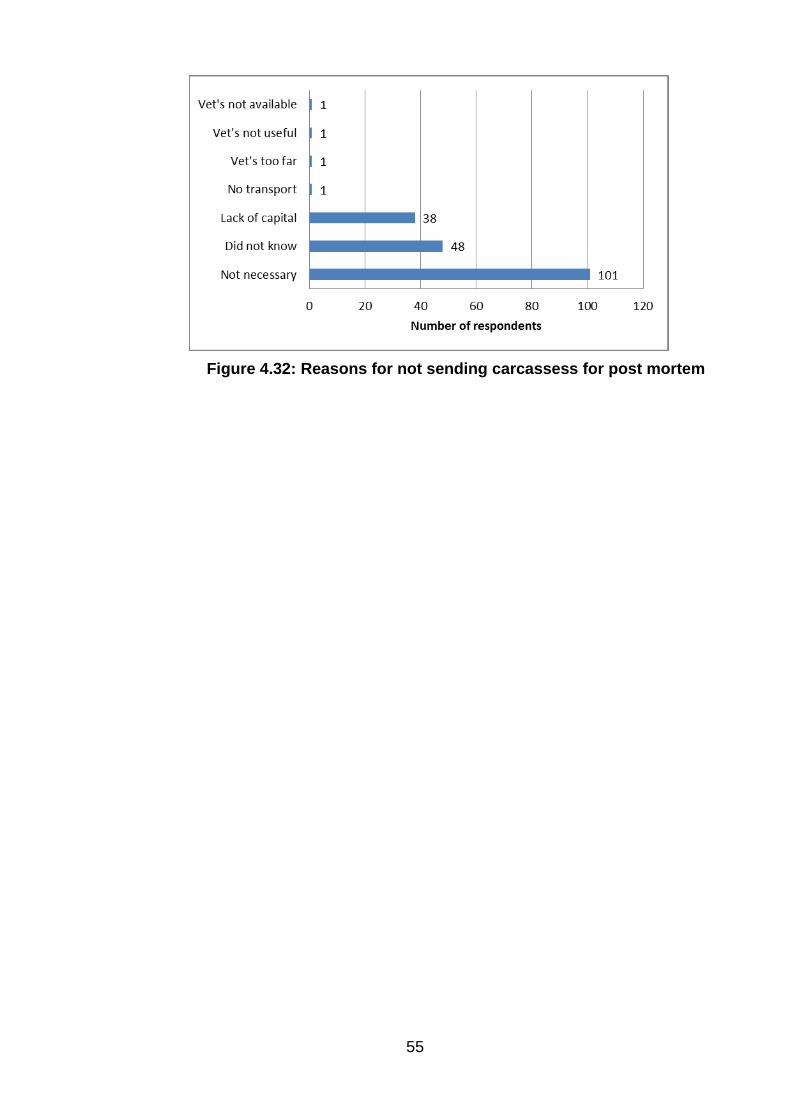
55
Figure 4.32: Reasons for not sending carcassess for post mortem
56
CHAPTER 5: DISCUSSIONS
5.1 Profile of the study area and the participants
About 75% of uThukela District is rural as indicated in the UTDM- IDP of 2012 (DSPED,
2012). Indaka and Imbabazane local municipalities have no established towns they are
made up of traditional villages. The majority of people still live in traditional villages where
traditional leadership under Amakhosi is common. It was observed from this study that
95% of the respondents (n = 533) lived under the Amakhosi areas. There were a total of
20 Amakhosi in the study area (Table 4.1). The rest of the respondents lived in town
municipalities, where they have politically elected councillors.
There were 22 traditional authorities in the uThukela District (DSPED, 2012). Among the
different Amakhosi areas, the number of pigs kept by respondents varied as shown in
Table 4.1. The different Amakhosi areas were of different sizes and the total number of
people living in them also varied greatly and maybe one of the reasons for the variation
observed in pig numbers. As the different Amakhosi fall under different local
municipalities, pig numbers were grouped according to the local municipality.
Indaka and Emnambithi had more pigs compared to other municipalities, with Imbabazane
municipality having the lowest pig numbers. The size of Emnambithi (2,965.92 km2) could
have contributed to the high pig numbers. On the contrary, Indaka which was the second
smallest municipality (991.71 km2) had high number of pigs. Indaka is still more rural
compared to Emnambithi and Okhahlamba where there were no formal towns (DSPED,
2012) and thus people were more dependent on agriculture or livestock keeping in
particular. During the data collection, it was also evident through discussions held with the
respondents in Indaka that pigs were a very important part of their lives.
Households that kept pigs in Indaka municipality were close proximity to each other as
opposed to other areas such as Emnambithi where they were scattered. In this study
there were more female respondents (60%), compared to males who also owned the pigs.
The trend was similar in all the local municipalities (Figure 4.1). The high number of
females owning pigs and taking care of pigs in uThukela District was similar to that
observed in other countries where females were responsible for looking after pigs.
57
Studies by Nsoso et al. (2006) in Ramotswa village in Botswana, Chiduwa et al. (2008) in
Zimbabwe, Petrus et al. (2011) in Etayi, Namibia and Halimani et al. (2012) in Zimbabwe
and South Africa (2012) supported the current results. Similarly, Madzimure et al. (2013)
in a study done in the EC province in RSA found that mainly females owned and took care
of pigs as was the case in uThukela District. Petrus et al. (2011) reported the highest
number of females (96%) (57% wives and 39% young girls) reared pigs, while Nsoso et al.
(2006) and Halimani et al. (2012) reported that 75% and 69.7% females, respectively.
Karimuribo et al. (2011) found about 70% females who reared pigs in Iringa region of
Tanzania.
Results from different studies suggested that rural pig farming is mainly practiced by
females in most countries. Some female respondents in uThukela District gave reasons
for rearing pigs instead of other species of animals. They said that they saw it as less
complicated, especially those who reared one pig for slaughter compared to rearing
ruminants. As most pigs were reared intensively, the only work necessary was that of
feeding and cleaning and that could be done all at once normally in the mornings. This
therefore left the rest of the day free for other household chores.
In terms of home languages, it was noted almost all the people in the study area (99%)
spoke isiZulu. This can be explained by the fact that, Imbabazane and Indaka were two
municipalities which are still very rural and under traditional leadership, that could be the
reason why other languages have not yet made it to the rural area. In Obonjaneni which
falls under Okhahlamba municipality, de Villiers (2005) also reported that all the people in
his study spoke isiZulu. Imbabazane and Indaka were 100% Zulu-speaking while
Emnambithi and Okhahlamba had other official languages (1%) spoken as home
languages. Both Okhahlamba and Emnambithi municipalities have towns and that could
be why people from different regions have settled there. It was also noted that
Okhahlamba municipality is closer to the Lesotho border and Ladysmith, where Southern
Sotho is spoken, and people moving in because of job opportunities.
One of the challenges outlined in the uThukela IDP of 2012/2013 was high level of poverty
and unemployment (DSPED, 2012). This was evident in this study where 74% of the
respondents were unemployed, while 16% were pensioners and only 10% were
employed. This scenario was the same across all local municipalities in the study area.
Therefore, most of uThukela District (65.7%) was a poverty stricken area, especially the
58
more rural municipalities such as Indaka and Imbabazane (DSPED, 2012). Poverty was
more evident in Indaka municipality, which had the highest unemployment rate in
uThukela District.
Stats SA (2012) reported from the 2011 census that, uThukela District had 58 800
unemployed people or 35 - 39% unemployment rate. This was even higher than overall
unemployment rate of 33% in KZN province as a whole. The 10% who were employed
engaged in various occupations. Self employment included ownership of tuck-shops or
selling food items at schools gates during lunch breaks. Some were employed by the
Department of Transport as road works labourers where most of them women (through an
initiative aiming at assisting women called “Zibambele”). The rest of the employed people
were taxi drivers, security guards, teachers and domestic workers.
The women who were employed as road works labourers also emphasised how pigs were
easier for them to keep because pigs were reared intensively. This allowed women to take
care of their pigs while also being employed elsewhere. They were able to feed pigs and
clean the pens before they went to work. People who were employed had more pigs to the
unemployed group and pensioners as shown in Table 4.3. This could be due to the fact
that employed people could support themselves and their families from their salaries and
therefore they did not consume as many pigs as the unemployed who depended on pigs
for food for their families.
Employed people could also afford to purchase other types of meat for consumption unlike
the unemployed who did not have that luxury. Thus, employed people kept pigs for sale
only. They also managed to feed their pigs better compared to the unemployed who
struggled to feed larger numbers of pigs because feed was scarce sometimes, which
forced some farmers to reduce the number of pigs. The low employment rate among pig
farmers in the study area was similar to that observed by Nsoso et al. (2006) in Botswana
(12.5%) and Kamuribo et al. (2011) in Tanzania of (6 %). Therefore, unemployment was a
wide spread problem in other countries as well.
In other countries where pig farming in rural areas has been investigated, different authors
found that pig farmers had very low education. Nsoso et al. (2006) in Botswana found that
only 25% of the respondents had secondary education, while Kamuribo et al. (2011) in
Tanzania reported that only 14.6% of respondents had secondary education; and in
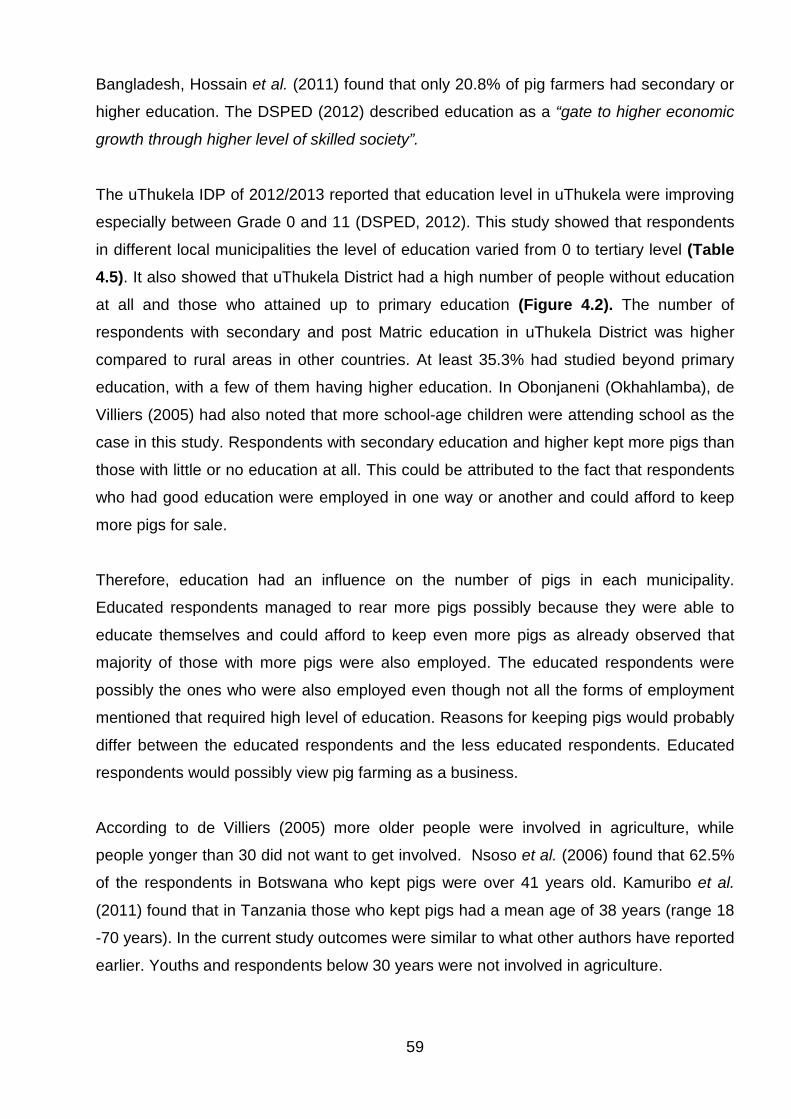
59
Bangladesh, Hossain et al. (2011) found that only 20.8% of pig farmers had secondary or
higher education. The DSPED (2012) described education as a “gate to higher economic
growth through higher level of skilled society”.
The uThukela IDP of 2012/2013 reported that education level in uThukela were improving
especially between Grade 0 and 11 (DSPED, 2012). This study showed that respondents
in different local municipalities the level of education varied from 0 to tertiary level (Table
4.5). It also showed that uThukela District had a high number of people without education
at all and those who attained up to primary education (Figure 4.2). The number of
respondents with secondary and post Matric education in uThukela District was higher
compared to rural areas in other countries. At least 35.3% had studied beyond primary
education, with a few of them having higher education. In Obonjaneni (Okhahlamba), de
Villiers (2005) had also noted that more school-age children were attending school as the
case in this study. Respondents with secondary education and higher kept more pigs than
those with little or no education at all. This could be attributed to the fact that respondents
who had good education were employed in one way or another and could afford to keep
more pigs for sale.
Therefore, education had an influence on the number of pigs in each municipality.
Educated respondents managed to rear more pigs possibly because they were able to
educate themselves and could afford to keep even more pigs as already observed that
majority of those with more pigs were also employed. The educated respondents were
possibly the ones who were also employed even though not all the forms of employment
mentioned that required high level of education. Reasons for keeping pigs would probably
differ between the educated respondents and the less educated respondents. Educated
respondents would possibly view pig farming as a business.
According to de Villiers (2005) more older people were involved in agriculture, while
people yonger than 30 did not want to get involved. Nsoso et al. (2006) found that 62.5%
of the respondents in Botswana who kept pigs were over 41 years old. Kamuribo et al.
(2011) found that in Tanzania those who kept pigs had a mean age of 38 years (range 18
-70 years). In the current study outcomes were similar to what other authors have reported
earlier. Youths and respondents below 30 years were not involved in agriculture.
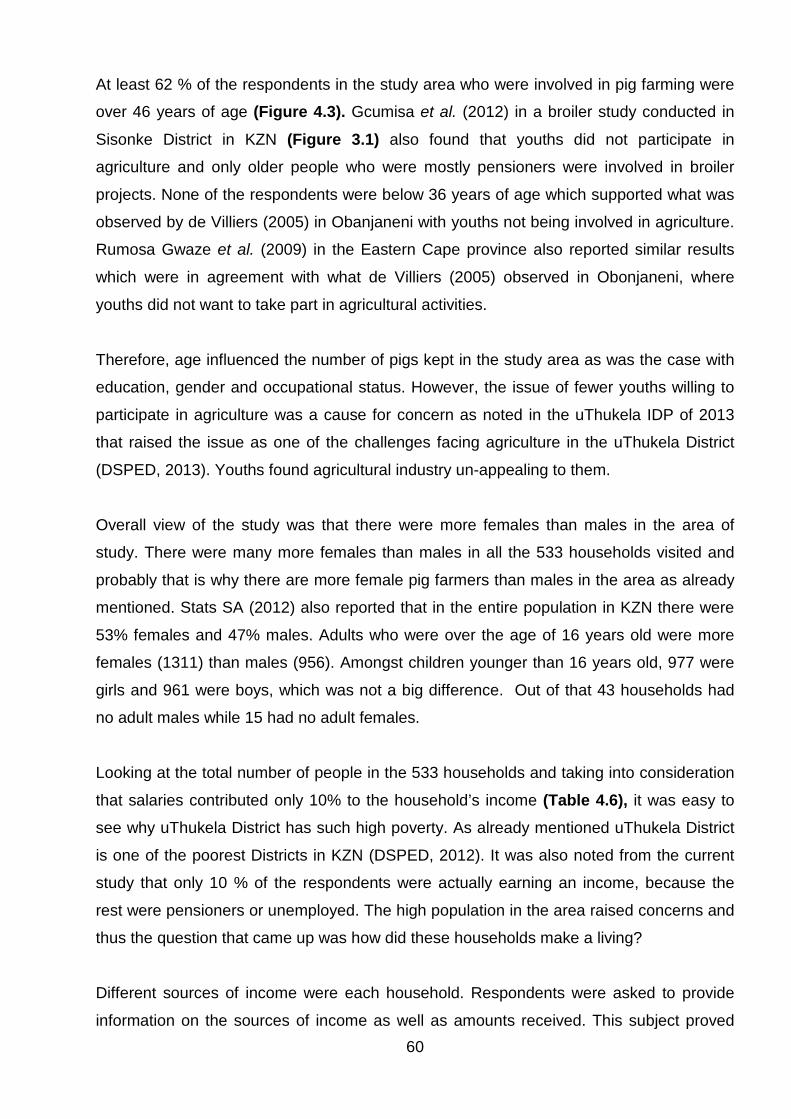
60
At least 62 % of the respondents in the study area who were involved in pig farming were
over 46 years of age (Figure 4.3). Gcumisa et al. (2012) in a broiler study conducted in
Sisonke District in KZN (Figure 3.1) also found that youths did not participate in
agriculture and only older people who were mostly pensioners were involved in broiler
projects. None of the respondents were below 36 years of age which supported what was
observed by de Villiers (2005) in Obanjaneni with youths not being involved in agriculture.
Rumosa Gwaze et al. (2009) in the Eastern Cape province also reported similar results
which were in agreement with what de Villiers (2005) observed in Obonjaneni, where
youths did not want to take part in agricultural activities.
Therefore, age influenced the number of pigs kept in the study area as was the case with
education, gender and occupational status. However, the issue of fewer youths willing to
participate in agriculture was a cause for concern as noted in the uThukela IDP of 2013
that raised the issue as one of the challenges facing agriculture in the uThukela District
(DSPED, 2013). Youths found agricultural industry un-appealing to them.
Overall view of the study was that there were more females than males in the area of
study. There were many more females than males in all the 533 households visited and
probably that is why there are more female pig farmers than males in the area as already
mentioned. Stats SA (2012) also reported that in the entire population in KZN there were
53% females and 47% males. Adults who were over the age of 16 years old were more
females (1311) than males (956). Amongst children younger than 16 years old, 977 were
girls and 961 were boys, which was not a big difference. Out of that 43 households had
no adult males while 15 had no adult females.
Looking at the total number of people in the 533 households and taking into consideration
that salaries contributed only 10% to the household’s income (Table 4.6), it was easy to
see why uThukela District has such high poverty. As already mentioned uThukela District
is one of the poorest Districts in KZN (DSPED, 2012). It was also noted from the current
study that only 10 % of the respondents were actually earning an income, because the
rest were pensioners or unemployed. The high population in the area raised concerns and
thus the question that came up was how did these households make a living?
Different sources of income were each household. Respondents were asked to provide
information on the sources of income as well as amounts received. This subject proved
61
very sensitive to some as others felt if they gave the impression that they had money it
would affect their requests for assistance from the local government in the future. Some
farmers therefore did not divulge how much they made from particular sources, but gave
an estimate of their incomes. They did not say how much they earned from the sale of
pigs alone but preferred to give estimates of incomes for all livestock sales.
Even though respondents were assured through the consents forms that their information
would be kept confidential they did not say much to the interviewers. Besides the salaries,
other most noted sources of incomes were social grants from the government (Pension
grant, child support grant and disability grant), and livestock sales (Table 4.6). Krecek
(2004) in the Eastern Cape Province found that pension was the main source of income
for the pig farmers.
According to the People’s Guide by the National Treasury (2012), “the social assistance
programme is South Africa’s direct means of combating poverty”. The number of grant
recipients in the country for 2012/2013 was estimated at 15.6 million (National Treasury,
2012). The different values for the social grants mentioned in the study by respondents
were R1200 for old-age grant or pension, R1200 for disability grant, for R770 for foster
grant and R280 for child support grant (National Treasury, 2012). The amount budgeted
for grants by the Department of Social Development in KZN has increased from R1.953
billion (2011/2012) to R2.401 billion (2014/2015) as mentioned in the 2012 Budget Speech
(Cronje, 2012). This budget further demonstrates how much the government has provided
as a way of curbing poverty in KZN province.
Mtileni et al. (2009) observed that the main sources of income mentioned by most
respondents in the study area differed from those mentioned by pig farmers in other
countries; but similar to those mentioned in other provinces of RSA; where social grants
form a large part of the income for most households. In their studies in Vhembe District
(Limpopo Province), Kgalagadi District (Northern Cape Province) and in the Alfred-Nzo
District (EC Province); Mtileni et al. (2009) found in all the areas that the social grants
were the primary source of income (47.3%) for the many households. Wages or salaries
contributed 30%, followed by crop sales (12.7%) and livestock sales (10%).
In South Africa, there seem to be a lot of government assistance in the form of grants as
means of curbing poverty. In Botswana, sources of income included farming, salaries,
62
business, odd jobs and sale of traditional beer (Nsoso et al., 2006). In Tanzania crop
farming, livestock, business and salaries were mentioned (Kamuribo et al., 2011).
Livestock contribution to the livelihoods of rural people was enormous with over R1 million
from livestock sales in uThukela District. Crop sales also contributed substantially
although the value was lower (Table 4.6).
5.2 Social and economic contribution of pigs to households
The fact that pigs can be reared in intensive systems this normally allowed people with
very little land to keep pigs. In some countries such as India where many pig farmers have
less than 2 acres of land (Kumaresan et al., 2009), and in Bangladesh where 52.8 % of
pig owners do not have any land (Hossain et al., 2011), but farmers were able to rear
many pigs. In uThukela District the smallest land size was 0.01ha, and the largest land
size was 56 ha. Emnambithi farmers owned an average of 1.69 ha per household, while
Indaka and uKhahlamba farmers owned an average of 1 ha per household, and
iMbabazane farmers owned even less land with an average of 0.9 ha per household. Male
farmers owned slightly more land than females in the district may be because some
women were wives of men who owned land. Therefore, the land was regarded as the
man’s property in such households. It should also be noted that the difference between
the genders might not be a true reflection because some women or wives might have
referred to their husband’s land or jointly owned land as their own, since some men work
away from home did not live in the rural areas. Respondents were also not asked whether
they were household heads or not. This might have created some confusion with regard to
gender and land ownership, and thus the results might be misleading to some extent.
Overall the average land size in uThukela district was about 1 ha per household. A
comparison between land availability and the ownership of pigs in uThukela District with
that reported by Kumaresan et al. (2009) and Hossain et al. (2011) in India and
Bangladesh, respectively, farmers in uThukela District have reasonable amount of land to
farm on. Since pigs in the present day can be kept in intensive systems, it leaves ample of
space for other farming activities.
The results showed that education level had no influence on land size. Employed people
also appeared to have more land compared to pensioners and the unemployed, probably
because employed people could buy more land with their extra income. They could also
afford to lease more land from farmers who needed extra income from their fallow land.
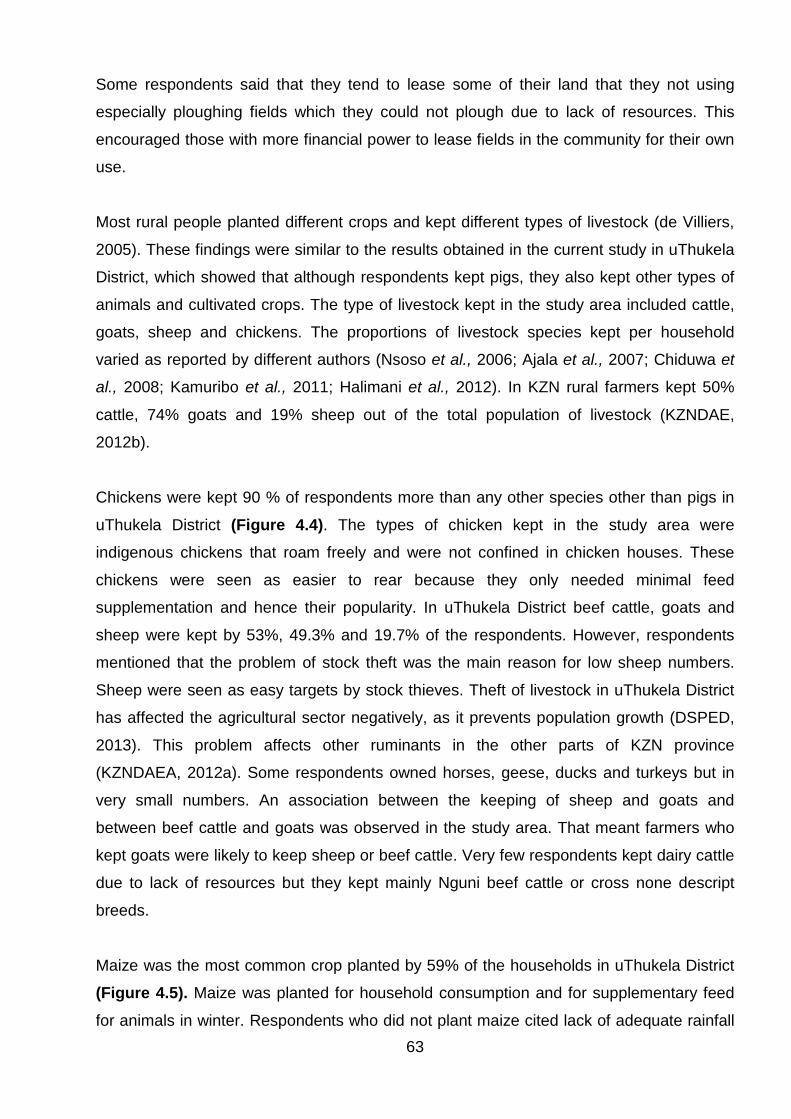
63
Some respondents said that they tend to lease some of their land that they not using
especially ploughing fields which they could not plough due to lack of resources. This
encouraged those with more financial power to lease fields in the community for their own
use.
Most rural people planted different crops and kept different types of livestock (de Villiers,
2005). These findings were similar to the results obtained in the current study in uThukela
District, which showed that although respondents kept pigs, they also kept other types of
animals and cultivated crops. The type of livestock kept in the study area included cattle,
goats, sheep and chickens. The proportions of livestock species kept per household
varied as reported by different authors (Nsoso et al., 2006; Ajala et al., 2007; Chiduwa et
al., 2008; Kamuribo et al., 2011; Halimani et al., 2012). In KZN rural farmers kept 50%
cattle, 74% goats and 19% sheep out of the total population of livestock (KZNDAE,
2012b).
Chickens were kept 90 % of respondents more than any other species other than pigs in
uThukela District (Figure 4.4). The types of chicken kept in the study area were
indigenous chickens that roam freely and were not confined in chicken houses. These
chickens were seen as easier to rear because they only needed minimal feed
supplementation and hence their popularity. In uThukela District beef cattle, goats and
sheep were kept by 53%, 49.3% and 19.7% of the respondents. However, respondents
mentioned that the problem of stock theft was the main reason for low sheep numbers.
Sheep were seen as easy targets by stock thieves. Theft of livestock in uThukela District
has affected the agricultural sector negatively, as it prevents population growth (DSPED,
2013). This problem affects other ruminants in the other parts of KZN province
(KZNDAEA, 2012a). Some respondents owned horses, geese, ducks and turkeys but in
very small numbers. An association between the keeping of sheep and goats and
between beef cattle and goats was observed in the study area. That meant farmers who
kept goats were likely to keep sheep or beef cattle. Very few respondents kept dairy cattle
due to lack of resources but they kept mainly Nguni beef cattle or cross none descript
breeds.
Maize was the most common crop planted by 59% of the households in uThukela District
(Figure 4.5). Maize was planted for household consumption and for supplementary feed
for animals in winter. Respondents who did not plant maize cited lack of adequate rainfall
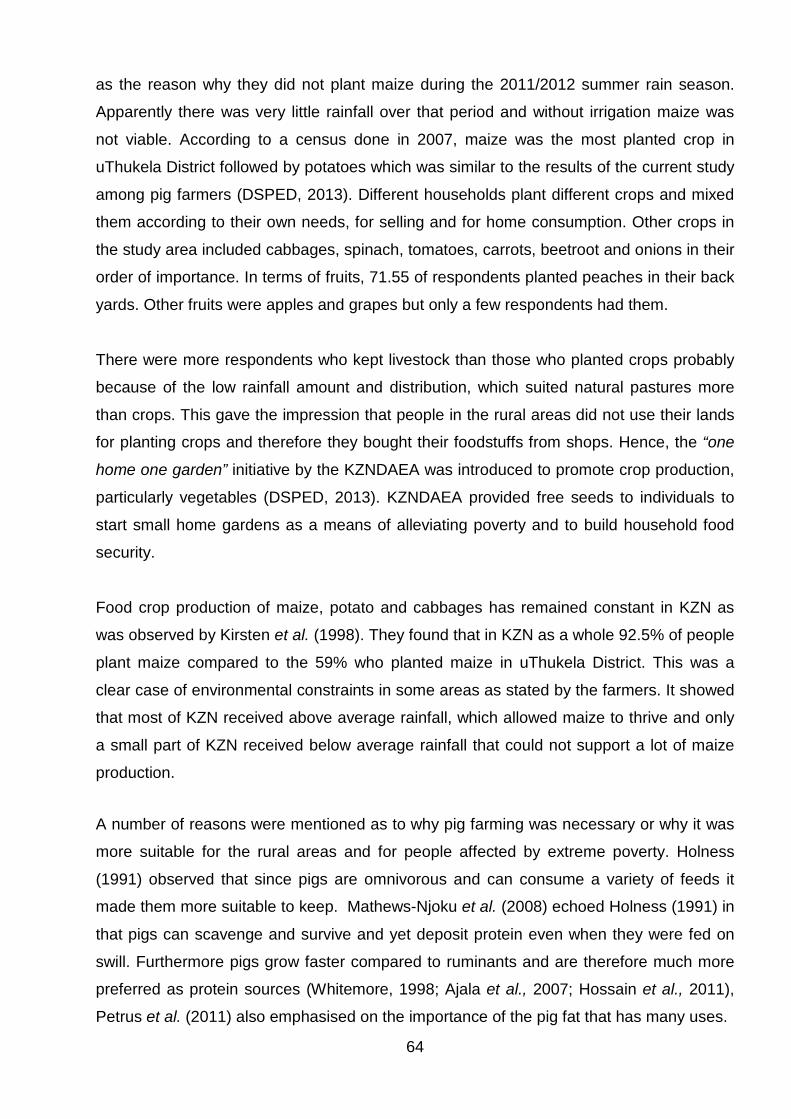
64
as the reason why they did not plant maize during the 2011/2012 summer rain season.
Apparently there was very little rainfall over that period and without irrigation maize was
not viable. According to a census done in 2007, maize was the most planted crop in
uThukela District followed by potatoes which was similar to the results of the current study
among pig farmers (DSPED, 2013). Different households plant different crops and mixed
them according to their own needs, for selling and for home consumption. Other crops in
the study area included cabbages, spinach, tomatoes, carrots, beetroot and onions in their
order of importance. In terms of fruits, 71.55 of respondents planted peaches in their back
yards. Other fruits were apples and grapes but only a few respondents had them.
There were more respondents who kept livestock than those who planted crops probably
because of the low rainfall amount and distribution, which suited natural pastures more
than crops. This gave the impression that people in the rural areas did not use their lands
for planting crops and therefore they bought their foodstuffs from shops. Hence, the “one
home one garden” initiative by the KZNDAEA was introduced to promote crop production,
particularly vegetables (DSPED, 2013). KZNDAEA provided free seeds to individuals to
start small home gardens as a means of alleviating poverty and to build household food
security.
Food crop production of maize, potato and cabbages has remained constant in KZN as
was observed by Kirsten et al. (1998). They found that in KZN as a whole 92.5% of people
plant maize compared to the 59% who planted maize in uThukela District. This was a
clear case of environmental constraints in some areas as stated by the farmers. It showed
that most of KZN received above average rainfall, which allowed maize to thrive and only
a small part of KZN received below average rainfall that could not support a lot of maize
production.
A number of reasons were mentioned as to why pig farming was necessary or why it was
more suitable for the rural areas and for people affected by extreme poverty. Holness
(1991) observed that since pigs are omnivorous and can consume a variety of feeds it
made them more suitable to keep. Mathews-Njoku et al. (2008) echoed Holness (1991) in
that pigs can scavenge and survive and yet deposit protein even when they were fed on
swill. Furthermore pigs grow faster compared to ruminants and are therefore much more
preferred as protein sources (Whitemore, 1998; Ajala et al., 2007; Hossain et al., 2011),
Petrus et al. (2011) also emphasised on the importance of the pig fat that has many uses.
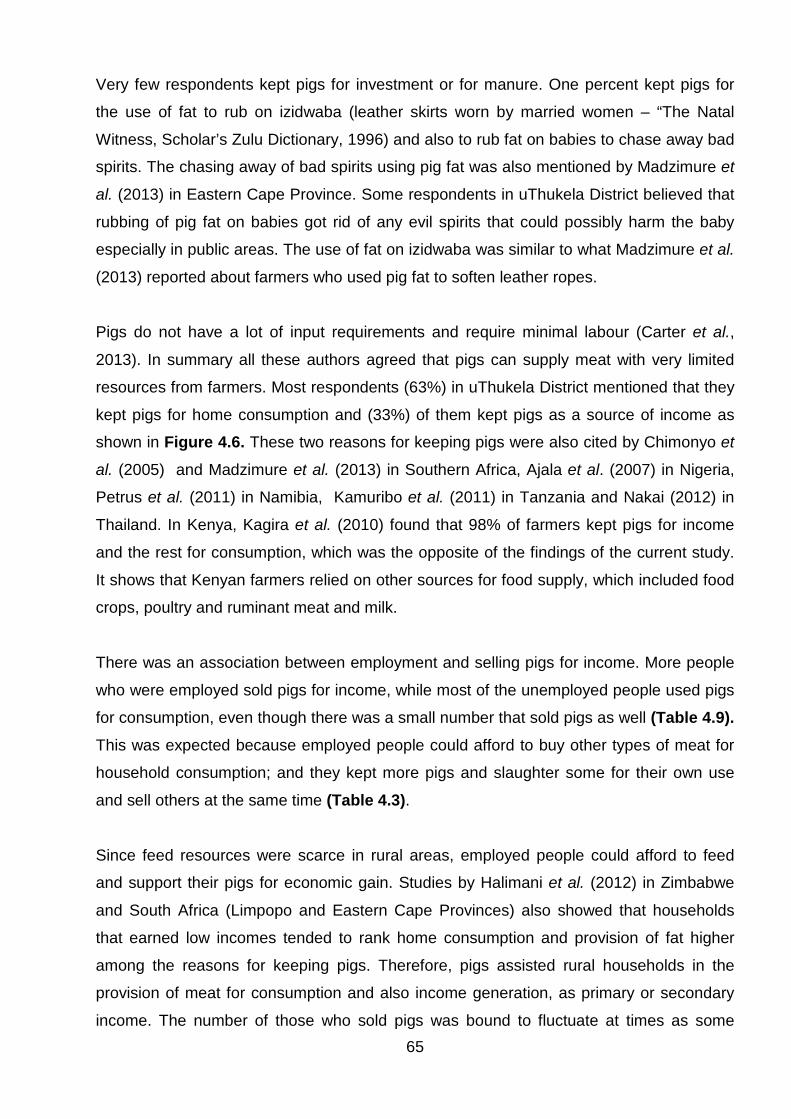
65
Very few respondents kept pigs for investment or for manure. One percent kept pigs for
the use of fat to rub on izidwaba (leather skirts worn by married women – “The Natal
Witness, Scholar’s Zulu Dictionary, 1996) and also to rub fat on babies to chase away bad
spirits. The chasing away of bad spirits using pig fat was also mentioned by Madzimure et
al. (2013) in Eastern Cape Province. Some respondents in uThukela District believed that
rubbing of pig fat on babies got rid of any evil spirits that could possibly harm the baby
especially in public areas. The use of fat on izidwaba was similar to what Madzimure et al.
(2013) reported about farmers who used pig fat to soften leather ropes.
Pigs do not have a lot of input requirements and require minimal labour (Carter et al.,
2013). In summary all these authors agreed that pigs can supply meat with very limited
resources from farmers. Most respondents (63%) in uThukela District mentioned that they
kept pigs for home consumption and (33%) of them kept pigs as a source of income as
shown in Figure 4.6. These two reasons for keeping pigs were also cited by Chimonyo et
al. (2005) and Madzimure et al. (2013) in Southern Africa, Ajala et al. (2007) in Nigeria,
Petrus et al. (2011) in Namibia, Kamuribo et al. (2011) in Tanzania and Nakai (2012) in
Thailand. In Kenya, Kagira et al. (2010) found that 98% of farmers kept pigs for income
and the rest for consumption, which was the opposite of the findings of the current study.
It shows that Kenyan farmers relied on other sources for food supply, which included food
crops, poultry and ruminant meat and milk.
There was an association between employment and selling pigs for income. More people
who were employed sold pigs for income, while most of the unemployed people used pigs
for consumption, even though there was a small number that sold pigs as well (Table 4.9). This was expected because employed people could afford to buy other types of meat for
household consumption; and they kept more pigs and slaughter some for their own use
and sell others at the same time (Table 4.3).
Since feed resources were scarce in rural areas, employed people could afford to feed
and support their pigs for economic gain. Studies by Halimani et al. (2012) in Zimbabwe
and South Africa (Limpopo and Eastern Cape Provinces) also showed that households
that earned low incomes tended to rank home consumption and provision of fat higher
among the reasons for keeping pigs. Therefore, pigs assisted rural households in the
provision of meat for consumption and also income generation, as primary or secondary
income. The number of those who sold pigs was bound to fluctuate at times as some
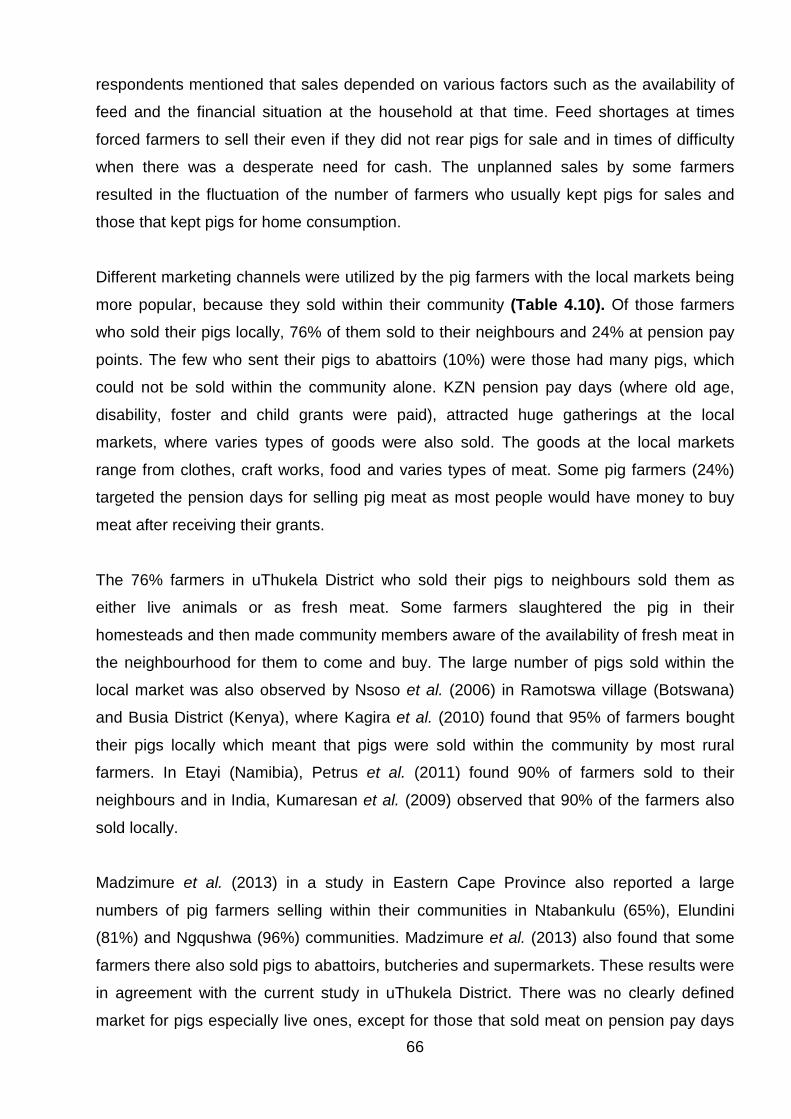
66
respondents mentioned that sales depended on various factors such as the availability of
feed and the financial situation at the household at that time. Feed shortages at times
forced farmers to sell their even if they did not rear pigs for sale and in times of difficulty
when there was a desperate need for cash. The unplanned sales by some farmers
resulted in the fluctuation of the number of farmers who usually kept pigs for sales and
those that kept pigs for home consumption.
Different marketing channels were utilized by the pig farmers with the local markets being
more popular, because they sold within their community (Table 4.10). Of those farmers
who sold their pigs locally, 76% of them sold to their neighbours and 24% at pension pay
points. The few who sent their pigs to abattoirs (10%) were those had many pigs, which
could not be sold within the community alone. KZN pension pay days (where old age,
disability, foster and child grants were paid), attracted huge gatherings at the local
markets, where varies types of goods were also sold. The goods at the local markets
range from clothes, craft works, food and varies types of meat. Some pig farmers (24%)
targeted the pension days for selling pig meat as most people would have money to buy
meat after receiving their grants.
The 76% farmers in uThukela District who sold their pigs to neighbours sold them as
either live animals or as fresh meat. Some farmers slaughtered the pig in their
homesteads and then made community members aware of the availability of fresh meat in
the neighbourhood for them to come and buy. The large number of pigs sold within the
local market was also observed by Nsoso et al. (2006) in Ramotswa village (Botswana)
and Busia District (Kenya), where Kagira et al. (2010) found that 95% of farmers bought
their pigs locally which meant that pigs were sold within the community by most rural
farmers. In Etayi (Namibia), Petrus et al. (2011) found 90% of farmers sold to their
neighbours and in India, Kumaresan et al. (2009) observed that 90% of the farmers also
sold locally.
Madzimure et al. (2013) in a study in Eastern Cape Province also reported a large
numbers of pig farmers selling within their communities in Ntabankulu (65%), Elundini
(81%) and Ngqushwa (96%) communities. Madzimure et al. (2013) also found that some
farmers there also sold pigs to abattoirs, butcheries and supermarkets. These results were
in agreement with the current study in uThukela District. There was no clearly defined
market for pigs especially live ones, except for those that sold meat on pension pay days
67
as established in uThukela District. The prices of meat cuts and sale days were not
standardised because they were determined by individual farmers. Most respondents
(72%) sold their pigs live within the community, while others (28%) sold meat only and
45% sold both live animal as well as meat.
The lack of clearly defined marketing of pigs in rural areas was observed in other
countries such as Nigeria (Ajala et al., 2007) and Namibia (Petrus et al., 2011). The age
and size of pigs that were sold in uThukela District varied, some sold piglets to others for
rearing and mature pigs for slaughter. The variation was as a result of farmers having
different reasons for selling their animals. Some sold piglets because they could not afford
to rear large litters due to high cost of inputs. Lemke et al. (2007) observed similar
practices in Vietnam, where pigs were at different ages and at any weight when there
were difficult times such as feed shortages or need for cash.
With large numbers of pigs marketed within the community that left a smaller fraction that
was sent to abattoirs, since 9.6% of respondents sent pigs to abattoirs. A total of 271 pigs
were sold and slaughtered at abattoirs from February 2012 to July 2012. They slaughtered
at different abattoirs such as Amblecyte in Winterton for most of them (40%), followed by
Cato Ridge (27%) and the least preferred was Glencoe. The low number of farmers who
sold their pigs to abattoirs could be attributed to the fact that livestock production in rural
areas has always been seen as unproductive (Shackleton et al., 2001) and that has led to
the rural animals having no economic value (DSPED, 2013). Therefore, some farmers
were reluctant to sell their pigs to abattoirs for fear of receiving very little cash value for
them. This was one of the many challenges facing the uThukela District agricultural sector
(DSPED, 2013).
Most farmers (59%) used their own transport to transport pigs to the abattoirs, while (41%)
used contractors. Respondents who did not have their own transport mentioned loss of
profits through hiring contractors to transport their pigs to abattoirs for slaughter. The
distance travelled by 27% of farmers to Cato Ridge abattoir which was somewhere
between Pietermaritzburg and Durban; was quite far from uThukela District and therefore
high transport costs. The majority of farmers slaughtered the pigs themselves at their
homesteads, while a few farmers slaughtered pigs at the abattoirs and then fetched the
frozen carcasses from the abattoirs to sell to the community. There were no health
68
inspections of the meat slaughtered at the homesteads, and the meat was sold at owner’s
price, which sometimes proved profitable and sometimes it led to some losses.
It was difficult to determine how much profits farmers earned from the sale of pigs; and
how much they lost because of high costs of inputs and transport; since farmers were not
willing to divulge exactly the amounts they received from the sale of their pigs. An average
of R50 was given as the standard price of a piglet was in the local market in uThukela
District. But considering that some were willing to send pigs as far as Cato Ridge abattoir;
might mean that they were making some profit. The age at which pigs were slaughtered
varied from 5 to 18 months (Figure 4.7). The variation in age at slaughter depended on
how long it took for pigs to reach slaughter weight; as a result of the type of housing or
environment the pigs are reared in. Pigs in poor environment (too cold or too hot) did not
grow well enough; or they did not get enough feed while they were growing.
Those farmers who did not feed adequate and balanced diets, such as the 81% of
respondents who used swill; had their pigs taking longer to reach slaughter weight.
According to Deka et al. (2007) in India poor feeds that lacked enough protein was a
major contributor to the length of time it took for pigs to reach slaughter weight. Some
farmers used commercial feeds mixed with other low quality feeds like swill to increase the
quantity, which obviously affected the growth rate of pigs. Housing, nutrition and health
were important determinants of profit or the lack of it for piggeries because they are
closely linked (Ajala et al., 2007). Management of piggeries was reported in some areas
as problematic because farmers had to repair pig houses constantly because as pigs got
older, they broke down their pens and ran out.
Hygiene and health were of concern as the meat was left uncovered on the tables in some
instances and it was not refrigerated. Deka et al. (2007) in India also reported that meat
was sold at the road side after slaughter because there was no formal infrastructure. In
the Northwest and the Eastern Cape provinces similar conditions were observed. There
were no proper slaughtering facilities and no meat inspection being conducted (Veary and
Manoto, 2008, Krecek et al., 2012). The issue of no meat inspection in the informal
markets seen in uThukela District was also noted by Phiri et al. (2003) in Zimbabwe, Deka
et al. (2007) in India, Veary and Manoto (2008) in RSA and Pondja et al. (2010) in
Mozambique. Krecek et al. (2012) in Eastern Cape province found 98% of farmers
slaughtering at home with 99% without meat inspection either.
69
Rural farmers in Zimbabwe and Mozambique sold meat in similar ways to that in uThukela
District. Deka et al. (2007) reported that one potential risk linked to selling and buying of
pork meat especially in rural markets was that of worm infestation, particularly Taenia
solium. The worm is transferred from pigs to humans through the consumption of pork that
is not properly cooked (Deka et al., 2007; Veary and Manoto, 2008).
Times for marketing live pigs varied as mentioned by respondents (Figure 4.9). Some
(53%) sold pigs all year round at pension pay points and others 45% sold during winter
(May-July). Majority of those who sold throughout the year were those who sent pigs to
the abattoirs, at pension pay points and those who sold piglets. A few farmers sold pigs in
different months of the year, depending on farmers’ needs or when pigs were available or
ready for slaughter. The 76% that sold meat and animals that were ready for slaughter
within the community, mentioned that they preferred selling in winter as there was a high
demand of pork because the weather was cold and meat did not decompose as quickly.
Similar comments were noted from farmers those that kept pigs for their own
consumption. Most of them said that they slaughtered pigs in winter, because they did not
have fridges, thus it was better to slaughter in winter since the meat could be kept fresh
for longer. Petrus et al. (2011) in a study in Namibia reported that farmers sold pigs in
cases of emergency and consumed pigs during Christmas celebrations and marriage
ceremonies which was not the case in uThukela District.
Pigs in this study area were sold at times when farmers needed money but respondents
did not mention slaughtering them on any special days or ceremonies. An interesting
belief linked to selling and slaughtering of pigs in winter was that the weather was cold but
also because there were no thunderstorms in winter. Thunderstorms are believed to spoil
the meat if they occur while there was fresh meat and therefore some farmers would not
slaughter pigs during summer. Most of the respondents (88%) did not have any
challenges with regard to religion or culture because they kept pigs and ate pork.
Respondents who had challenges (7%) it was mainly due to religious beliefs. Churches,
family members or neighbours did not want pigs around them because they believed that
pigs have demons and that they destroy izibethelo/muthi (traditional medicine used to
strengthen and protect the household).
Some respondents (1%) mentioned that mothers-in-law did not like pigs while their wives
(abomakoti) liked them mostly because of religious reasons. It is common in most rural
70
areas for sons not to move out of their homes when they got married and hence the wives
had to move in with the in-laws which results in clashes over pig keeping. Respondents
also had different views about the relationship between muthi and pigs. Some felt that pigs
helped to stop witchcraft from coming into the homestead while others felt that pigs
destroyed izibethelo/muthi used in protecting the household. In the Eastern Cape
province, Madzimure et al. (2013) reported that farmers believed in the use of pork mixed
with some concoctions chased away evil spirits as was mentioned by some respondents
in uThukela District as well. In general, uThukela District was not affected by religious and
culture beliefs, although a few farmers believed that pigs have certain powers be it good
or bad.
“Meat consumption per capita in developing countries is considerable lower than that in
developed world” (Gill, 1999). As mentioned already, DAFF (2012a) reported that the per
capita consumption of different meat types in RSA in 2010/2011 was 4.6 kg/yr, 2.9 kg/yr,
and 17.07 kg/yr for pork, sheep, shoats, beef and veal, respectively, and 34.91 kg/yr for
white meat (poultry and fish). Per capita consumption of red meat as a whole in the period
of 2010/2011 was 24.47 kg/yr, which was lower than that of white meat (DAFF, 2012a).
Respondents in the study area ranked meat consumption according to their preferences
as order 1 = most, 3 = average and 6 = least). Out of all meat types chicken was ranked
first (1st), followed by beef (2nd), pork (3rd), mutton/lamb (4th), chevon (5th) and fish and
turkey (6th). Figures 4.10 to 4.14 showed the ranking of the different meat types. The high
preference of chicken was also reported DAFF (2012a), which showed that white meat
was consumed by the majority of people in RSA. The ranking was similar to how the
respondents in the study area ranked the different types of meat. As observed in the
DAFF statistics (DAFF, 2012a) meat prices fluctuated and that might have influenced how
people decided on which type of meat buy. The price of poultry and pork (R/kg) was
relatively low compared to beef and mutton (DAFF, 2012a) and could influenced people to
prefer white meat because it was relatively cheaper and more affordable.
The other reason that could have influenced the high consumption of white meat in
uThukela District was that chickens were the most popular species that was kept by 90%
of the respondents besides pigs (Figure 4.4); and hence chickens and pigs were more
readily available for consumption. Chevon was the least consumed type of meat goats
were only slaughtered for special occasions particularly traditional ceremonies. This was
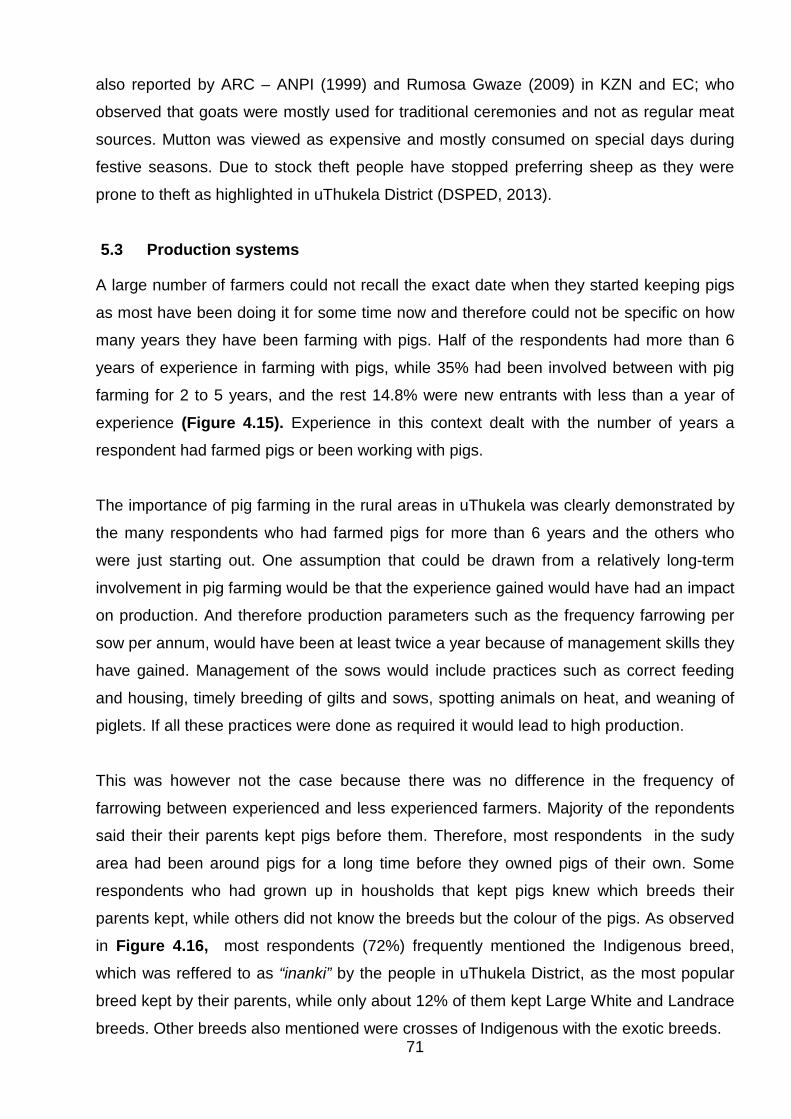
71
also reported by ARC – ANPI (1999) and Rumosa Gwaze (2009) in KZN and EC; who
observed that goats were mostly used for traditional ceremonies and not as regular meat
sources. Mutton was viewed as expensive and mostly consumed on special days during
festive seasons. Due to stock theft people have stopped preferring sheep as they were
prone to theft as highlighted in uThukela District (DSPED, 2013).
5.3 Production systems
A large number of farmers could not recall the exact date when they started keeping pigs
as most have been doing it for some time now and therefore could not be specific on how
many years they have been farming with pigs. Half of the respondents had more than 6
years of experience in farming with pigs, while 35% had been involved between with pig
farming for 2 to 5 years, and the rest 14.8% were new entrants with less than a year of
experience (Figure 4.15). Experience in this context dealt with the number of years a
respondent had farmed pigs or been working with pigs.
The importance of pig farming in the rural areas in uThukela was clearly demonstrated by
the many respondents who had farmed pigs for more than 6 years and the others who
were just starting out. One assumption that could be drawn from a relatively long-term
involvement in pig farming would be that the experience gained would have had an impact
on production. And therefore production parameters such as the frequency farrowing per
sow per annum, would have been at least twice a year because of management skills they
have gained. Management of the sows would include practices such as correct feeding
and housing, timely breeding of gilts and sows, spotting animals on heat, and weaning of
piglets. If all these practices were done as required it would lead to high production.
This was however not the case because there was no difference in the frequency of
farrowing between experienced and less experienced farmers. Majority of the repondents
said their their parents kept pigs before them. Therefore, most respondents in the sudy
area had been around pigs for a long time before they owned pigs of their own. Some
respondents who had grown up in housholds that kept pigs knew which breeds their
parents kept, while others did not know the breeds but the colour of the pigs. As observed
in Figure 4.16, most respondents (72%) frequently mentioned the Indigenous breed,
which was reffered to as “inanki” by the people in uThukela District, as the most popular
breed kept by their parents, while only about 12% of them kept Large White and Landrace
breeds. Other breeds also mentioned were crosses of Indigenous with the exotic breeds.
72
Although most of the respondents had vast experience only a few had actually attended
some form of training in pigs rearing. Out of the 533 respondents, only 17 have attended
some form of pig training courses. Majority of the courses attended were those that were
conducted by KZNDAE (59%) and Zakhe Agricultural College of Agriculture (11.8%) in
Baynesfield (KZN). The other respondents attended training on private/commercial pig
farms or they were employed there at some stage. Most of the courses offered were 2 to 3
days (53%) and 2 to 3 weeks, while the rest were 3 to 6 months for those offered on
private farms. The pig production courses offered by the KZNDAE were mainly for
beginners as a way of introducing pig production and were conducted twice yearly. Since
the courses were conducted over a short period of less than a week, they did not transfer
adequate knowledge and skills to farmers.
An association was found between the training and the frequency of farrowing per sow per
annum. The type of training improved farmers’ knowledge and skills in pig production. It
helped farmers to provide the right environment for breeding sows as shown in Table 4.10. The trained farmers realised higher farrowing frequency (at least twice a year) than
untrained farmers. This demonstrated the importance of having farmer education even
though the courses were sometimes too short. The training provided much needed
breeding management skills that allowed farmers to know when to breed gilts and sows
for better productivity. That meant that trained farmers made more profit from selling more
piglets than untrained farmers. Training of pig farmers was therefore better at increasing
farm productivity and household food security than the experience young farmers gained
because of growing on the farms. That realisation suggested that having some years of
experience or being around pigs for long did not automatically mean higher productivity.
As was mentioned by Botha and Lombard (1992) cited by de Villiers (2005) training is an
important determinant of success as those who were willing to be trained became better
farmers and more successful than those had no training at all.
The Windsnyer and the Koelbroek are two breeds known to be indigenous to RSA
(Ramsey et al, 2000). Indigenous pigs are sometimes referred to as local or unimproved
breeds (Robinson and Penrith, 2009; Petrus et al., 2011). Exotic pigs such as Large White
and Landrace have gained popularity in the rural areas and smallholder farms. Halimani et
al. (2012) reported that a number of factors have led to indigenous pigs being sidelined.
One of the most noted reasons was negative perception about both the pig and the
environment where they are raised; and historical biases against local pigs and free range
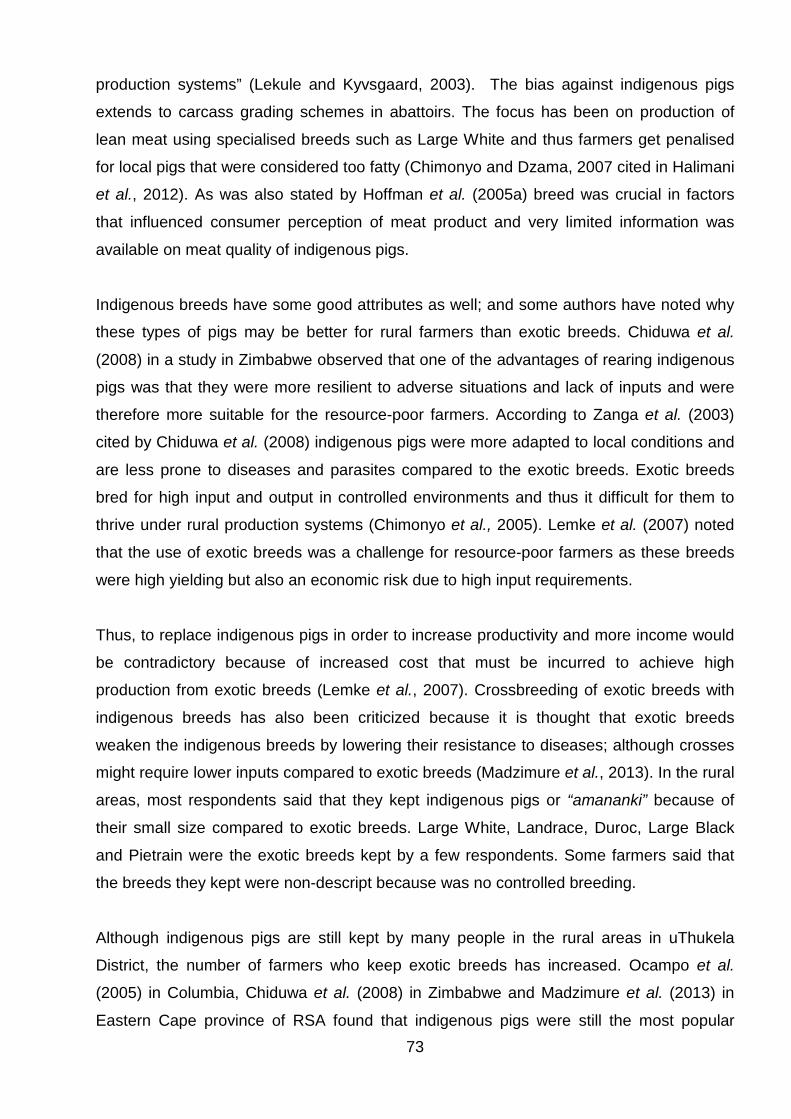
73
production systems” (Lekule and Kyvsgaard, 2003). The bias against indigenous pigs
extends to carcass grading schemes in abattoirs. The focus has been on production of
lean meat using specialised breeds such as Large White and thus farmers get penalised
for local pigs that were considered too fatty (Chimonyo and Dzama, 2007 cited in Halimani
et al., 2012). As was also stated by Hoffman et al. (2005a) breed was crucial in factors
that influenced consumer perception of meat product and very limited information was
available on meat quality of indigenous pigs.
Indigenous breeds have some good attributes as well; and some authors have noted why
these types of pigs may be better for rural farmers than exotic breeds. Chiduwa et al.
(2008) in a study in Zimbabwe observed that one of the advantages of rearing indigenous
pigs was that they were more resilient to adverse situations and lack of inputs and were
therefore more suitable for the resource-poor farmers. According to Zanga et al. (2003)
cited by Chiduwa et al. (2008) indigenous pigs were more adapted to local conditions and
are less prone to diseases and parasites compared to the exotic breeds. Exotic breeds
bred for high input and output in controlled environments and thus it difficult for them to
thrive under rural production systems (Chimonyo et al., 2005). Lemke et al. (2007) noted
that the use of exotic breeds was a challenge for resource-poor farmers as these breeds
were high yielding but also an economic risk due to high input requirements.
Thus, to replace indigenous pigs in order to increase productivity and more income would
be contradictory because of increased cost that must be incurred to achieve high
production from exotic breeds (Lemke et al., 2007). Crossbreeding of exotic breeds with
indigenous breeds has also been criticized because it is thought that exotic breeds
weaken the indigenous breeds by lowering their resistance to diseases; although crosses
might require lower inputs compared to exotic breeds (Madzimure et al., 2013). In the rural
areas, most respondents said that they kept indigenous pigs or “amananki” because of
their small size compared to exotic breeds. Large White, Landrace, Duroc, Large Black
and Pietrain were the exotic breeds kept by a few respondents. Some farmers said that
the breeds they kept were non-descript because was no controlled breeding.
Although indigenous pigs are still kept by many people in the rural areas in uThukela
District, the number of farmers who keep exotic breeds has increased. Ocampo et al.
(2005) in Columbia, Chiduwa et al. (2008) in Zimbabwe and Madzimure et al. (2013) in
Eastern Cape province of RSA found that indigenous pigs were still the most popular
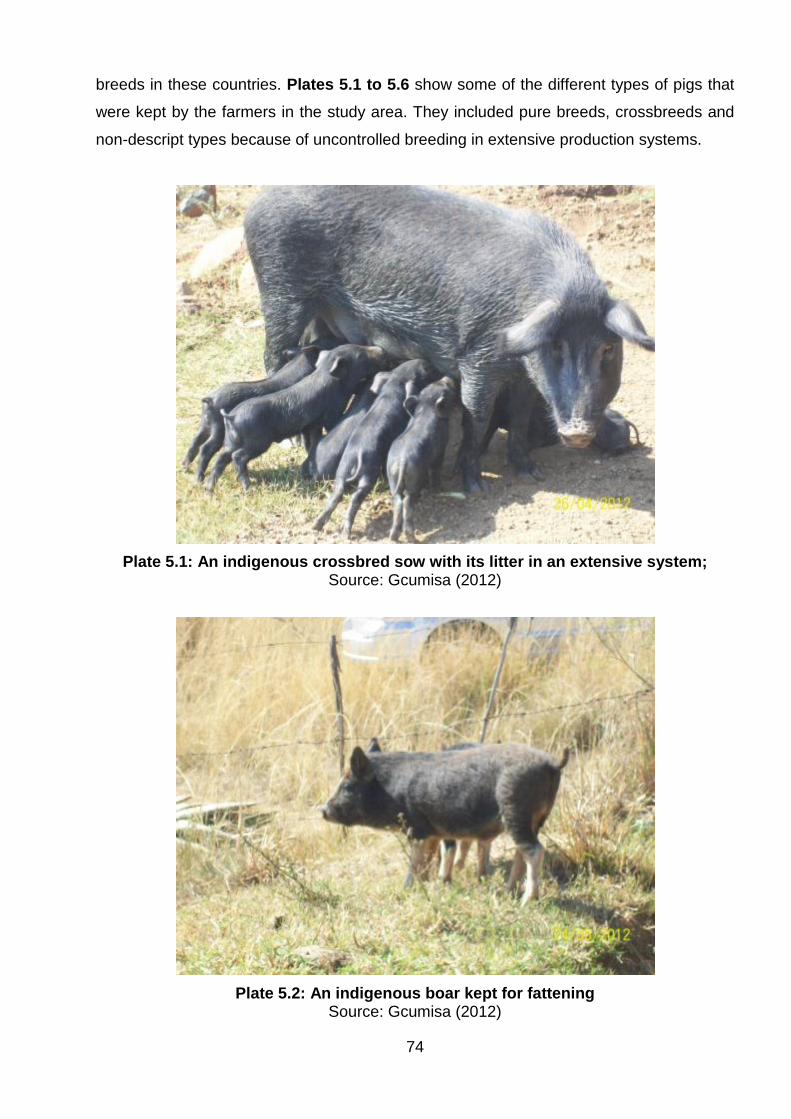
74
breeds in these countries. Plates 5.1 to 5.6 show some of the different types of pigs that
were kept by the farmers in the study area. They included pure breeds, crossbreeds and
non-descript types because of uncontrolled breeding in extensive production systems.
Plate 5.1: An indigenous crossbred sow with its litter in an extensive system;
Source: Gcumisa (2012)
Plate 5.2: An indigenous boar kept for fattening
Source: Gcumisa (2012)
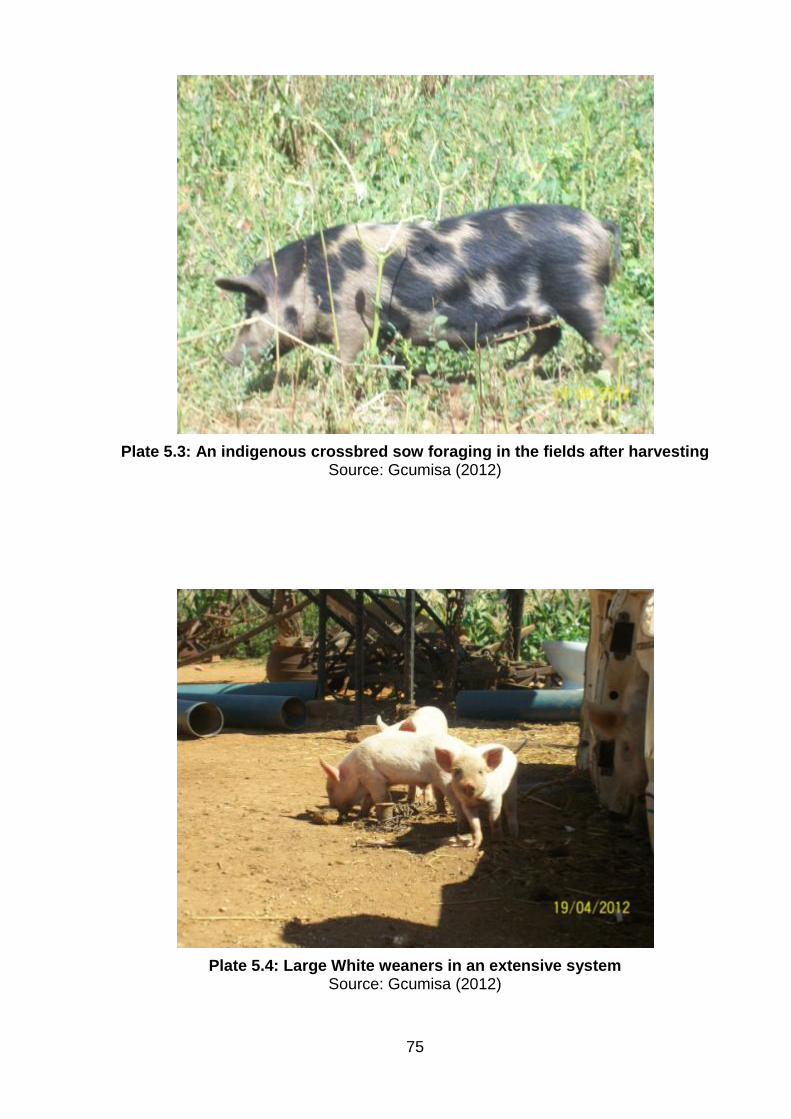
75
Plate 5.3: An indigenous crossbred sow foraging in the fields after harvesting
Source: Gcumisa (2012)
Plate 5.4: Large White weaners in an extensive system
Source: Gcumisa (2012)
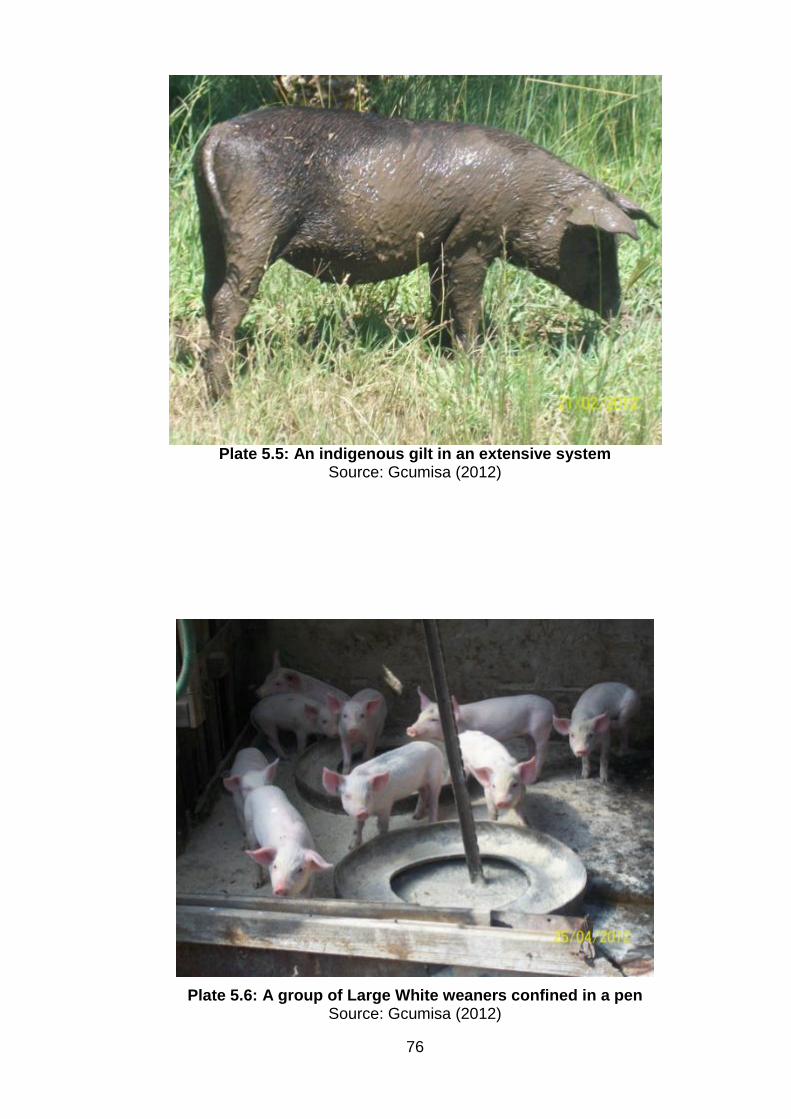
76
Plate 5.5: An indigenous gilt in an extensive system
Source: Gcumisa (2012)
Plate 5.6: A group of Large White weaners confined in a pen
Source: Gcumisa (2012)
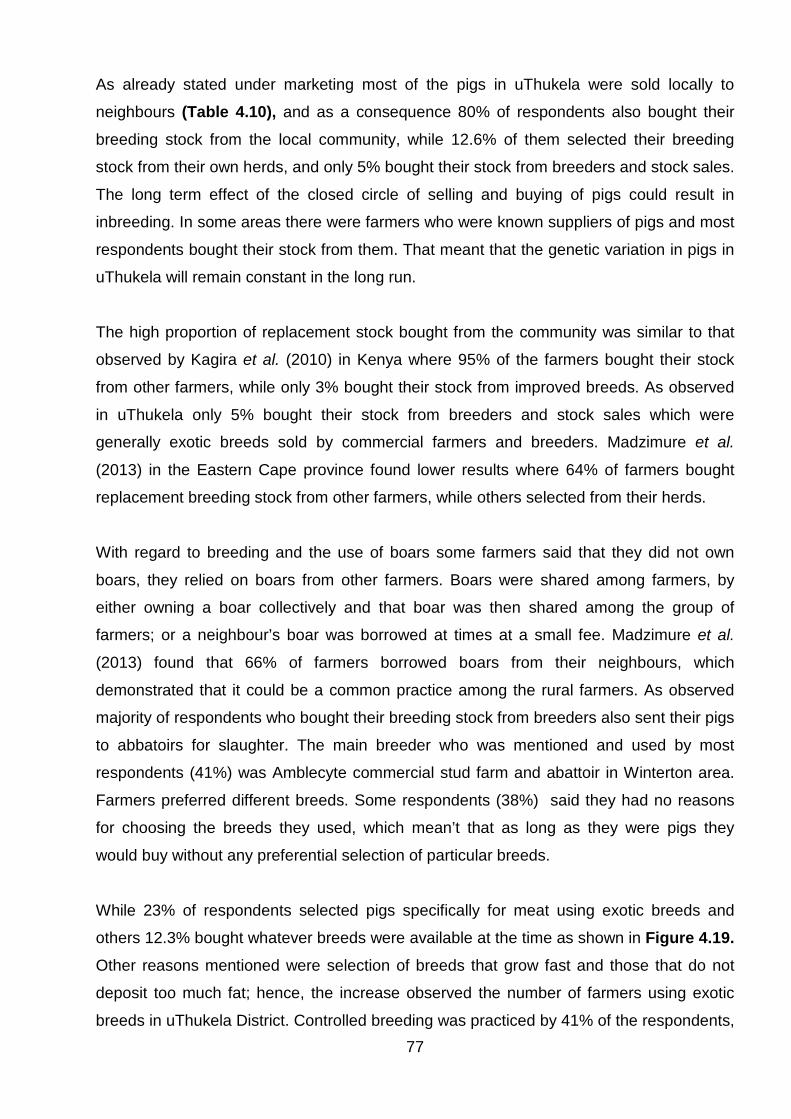
77
As already stated under marketing most of the pigs in uThukela were sold locally to
neighbours (Table 4.10), and as a consequence 80% of respondents also bought their
breeding stock from the local community, while 12.6% of them selected their breeding
stock from their own herds, and only 5% bought their stock from breeders and stock sales.
The long term effect of the closed circle of selling and buying of pigs could result in
inbreeding. In some areas there were farmers who were known suppliers of pigs and most
respondents bought their stock from them. That meant that the genetic variation in pigs in
uThukela will remain constant in the long run.
The high proportion of replacement stock bought from the community was similar to that
observed by Kagira et al. (2010) in Kenya where 95% of the farmers bought their stock
from other farmers, while only 3% bought their stock from improved breeds. As observed
in uThukela only 5% bought their stock from breeders and stock sales which were
generally exotic breeds sold by commercial farmers and breeders. Madzimure et al.
(2013) in the Eastern Cape province found lower results where 64% of farmers bought
replacement breeding stock from other farmers, while others selected from their herds.
With regard to breeding and the use of boars some farmers said that they did not own
boars, they relied on boars from other farmers. Boars were shared among farmers, by
either owning a boar collectively and that boar was then shared among the group of
farmers; or a neighbour’s boar was borrowed at times at a small fee. Madzimure et al.
(2013) found that 66% of farmers borrowed boars from their neighbours, which
demonstrated that it could be a common practice among the rural farmers. As observed
majority of respondents who bought their breeding stock from breeders also sent their pigs
to abbatoirs for slaughter. The main breeder who was mentioned and used by most
respondents (41%) was Amblecyte commercial stud farm and abattoir in Winterton area.
Farmers preferred different breeds. Some respondents (38%) said they had no reasons
for choosing the breeds they used, which mean’t that as long as they were pigs they
would buy without any preferential selection of particular breeds.
While 23% of respondents selected pigs specifically for meat using exotic breeds and
others 12.3% bought whatever breeds were available at the time as shown in Figure 4.19. Other reasons mentioned were selection of breeds that grow fast and those that do not
deposit too much fat; hence, the increase observed the number of farmers using exotic
breeds in uThukela District. Controlled breeding was practiced by 41% of the respondents,
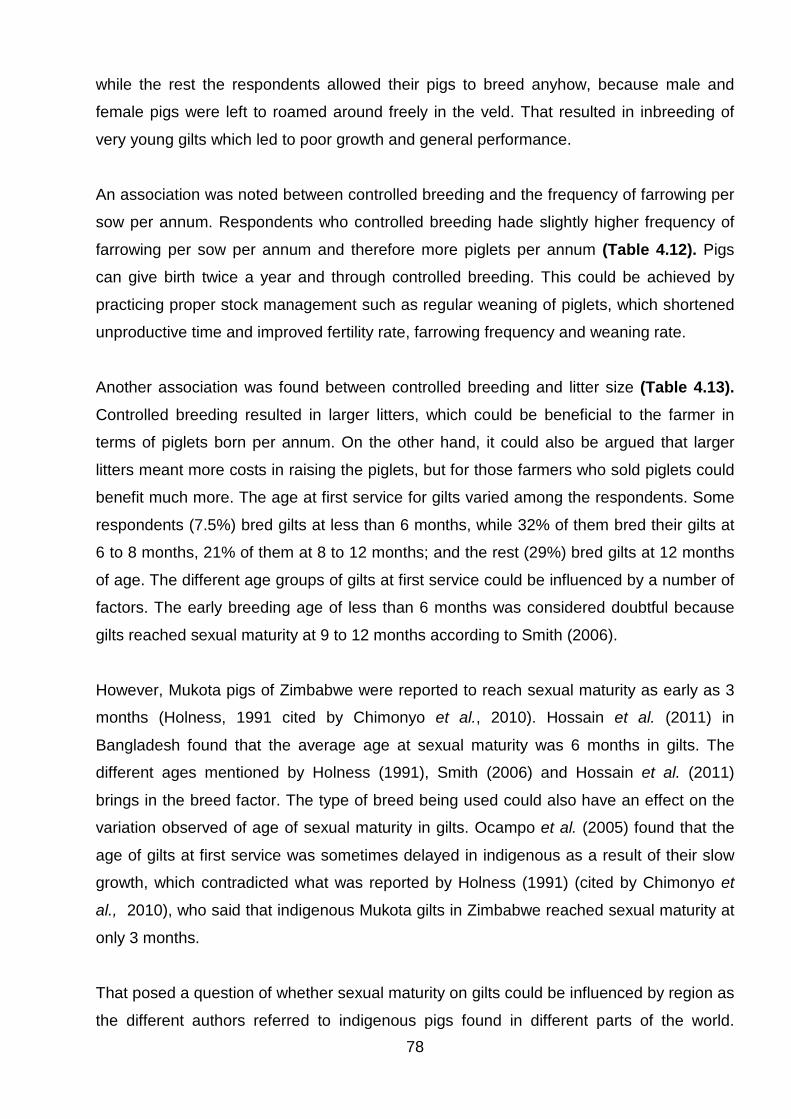
78
while the rest the respondents allowed their pigs to breed anyhow, because male and
female pigs were left to roamed around freely in the veld. That resulted in inbreeding of
very young gilts which led to poor growth and general performance.
An association was noted between controlled breeding and the frequency of farrowing per
sow per annum. Respondents who controlled breeding hade slightly higher frequency of
farrowing per sow per annum and therefore more piglets per annum (Table 4.12). Pigs
can give birth twice a year and through controlled breeding. This could be achieved by
practicing proper stock management such as regular weaning of piglets, which shortened
unproductive time and improved fertility rate, farrowing frequency and weaning rate.
Another association was found between controlled breeding and litter size (Table 4.13). Controlled breeding resulted in larger litters, which could be beneficial to the farmer in
terms of piglets born per annum. On the other hand, it could also be argued that larger
litters meant more costs in raising the piglets, but for those farmers who sold piglets could
benefit much more. The age at first service for gilts varied among the respondents. Some
respondents (7.5%) bred gilts at less than 6 months, while 32% of them bred their gilts at
6 to 8 months, 21% of them at 8 to 12 months; and the rest (29%) bred gilts at 12 months
of age. The different age groups of gilts at first service could be influenced by a number of
factors. The early breeding age of less than 6 months was considered doubtful because
gilts reached sexual maturity at 9 to 12 months according to Smith (2006).
However, Mukota pigs of Zimbabwe were reported to reach sexual maturity as early as 3
months (Holness, 1991 cited by Chimonyo et al., 2010). Hossain et al. (2011) in
Bangladesh found that the average age at sexual maturity was 6 months in gilts. The
different ages mentioned by Holness (1991), Smith (2006) and Hossain et al. (2011)
brings in the breed factor. The type of breed being used could also have an effect on the
variation observed of age of sexual maturity in gilts. Ocampo et al. (2005) found that the
age of gilts at first service was sometimes delayed in indigenous as a result of their slow
growth, which contradicted what was reported by Holness (1991) (cited by Chimonyo et
al., 2010), who said that indigenous Mukota gilts in Zimbabwe reached sexual maturity at
only 3 months.
That posed a question of whether sexual maturity on gilts could be influenced by region as
the different authors referred to indigenous pigs found in different parts of the world.
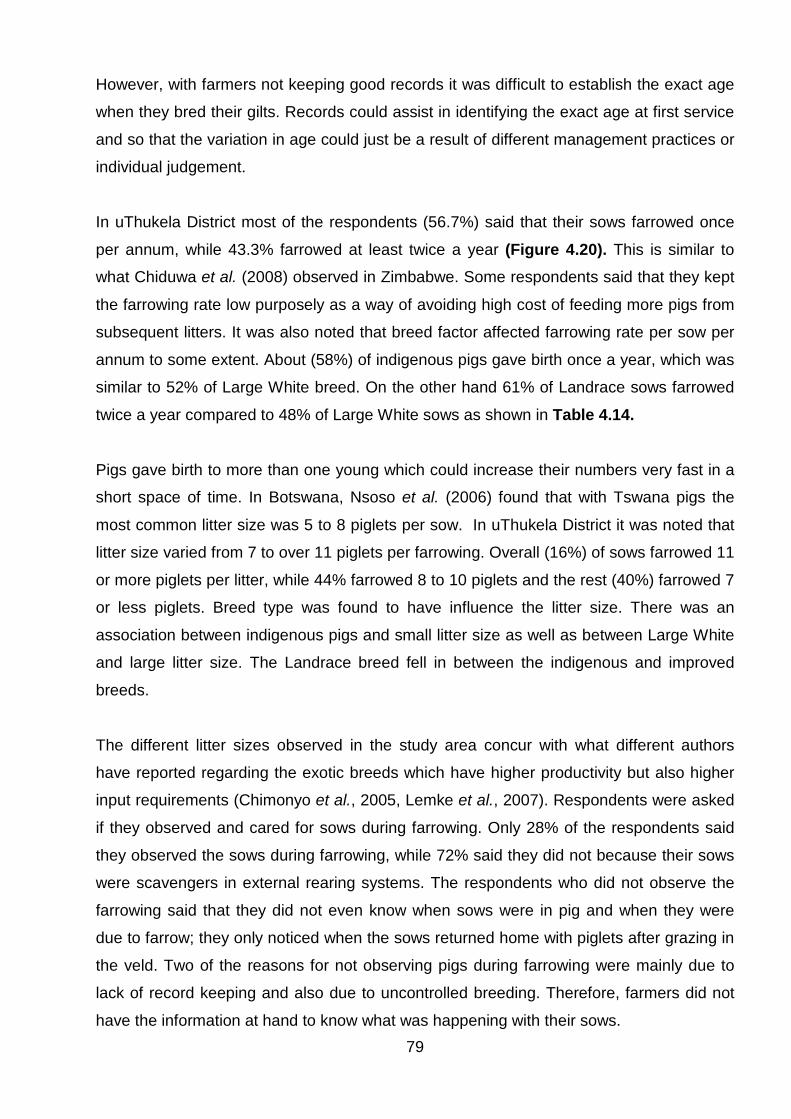
79
However, with farmers not keeping good records it was difficult to establish the exact age
when they bred their gilts. Records could assist in identifying the exact age at first service
and so that the variation in age could just be a result of different management practices or
individual judgement.
In uThukela District most of the respondents (56.7%) said that their sows farrowed once
per annum, while 43.3% farrowed at least twice a year (Figure 4.20). This is similar to
what Chiduwa et al. (2008) observed in Zimbabwe. Some respondents said that they kept
the farrowing rate low purposely as a way of avoiding high cost of feeding more pigs from
subsequent litters. It was also noted that breed factor affected farrowing rate per sow per
annum to some extent. About (58%) of indigenous pigs gave birth once a year, which was
similar to 52% of Large White breed. On the other hand 61% of Landrace sows farrowed
twice a year compared to 48% of Large White sows as shown in Table 4.14.
Pigs gave birth to more than one young which could increase their numbers very fast in a
short space of time. In Botswana, Nsoso et al. (2006) found that with Tswana pigs the
most common litter size was 5 to 8 piglets per sow. In uThukela District it was noted that
litter size varied from 7 to over 11 piglets per farrowing. Overall (16%) of sows farrowed 11
or more piglets per litter, while 44% farrowed 8 to 10 piglets and the rest (40%) farrowed 7
or less piglets. Breed type was found to have influence the litter size. There was an
association between indigenous pigs and small litter size as well as between Large White
and large litter size. The Landrace breed fell in between the indigenous and improved
breeds.
The different litter sizes observed in the study area concur with what different authors
have reported regarding the exotic breeds which have higher productivity but also higher
input requirements (Chimonyo et al., 2005, Lemke et al., 2007). Respondents were asked
if they observed and cared for sows during farrowing. Only 28% of the respondents said
they observed the sows during farrowing, while 72% said they did not because their sows
were scavengers in external rearing systems. The respondents who did not observe the
farrowing said that they did not even know when sows were in pig and when they were
due to farrow; they only noticed when the sows returned home with piglets after grazing in
the veld. Two of the reasons for not observing pigs during farrowing were mainly due to
lack of record keeping and also due to uncontrolled breeding. Therefore, farmers did not
have the information at hand to know what was happening with their sows.
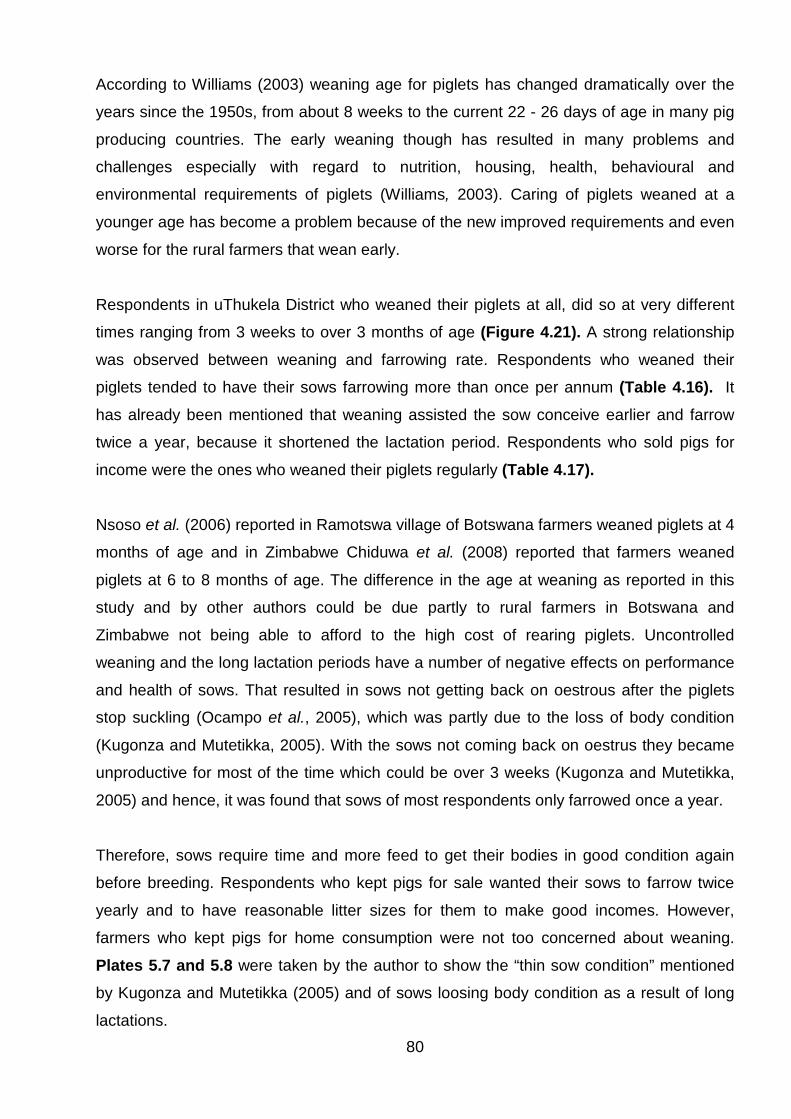
80
According to Williams (2003) weaning age for piglets has changed dramatically over the
years since the 1950s, from about 8 weeks to the current 22 - 26 days of age in many pig
producing countries. The early weaning though has resulted in many problems and
challenges especially with regard to nutrition, housing, health, behavioural and
environmental requirements of piglets (Williams, 2003). Caring of piglets weaned at a
younger age has become a problem because of the new improved requirements and even
worse for the rural farmers that wean early.
Respondents in uThukela District who weaned their piglets at all, did so at very different
times ranging from 3 weeks to over 3 months of age (Figure 4.21). A strong relationship
was observed between weaning and farrowing rate. Respondents who weaned their
piglets tended to have their sows farrowing more than once per annum (Table 4.16). It has already been mentioned that weaning assisted the sow conceive earlier and farrow
twice a year, because it shortened the lactation period. Respondents who sold pigs for
income were the ones who weaned their piglets regularly (Table 4.17).
Nsoso et al. (2006) reported in Ramotswa village of Botswana farmers weaned piglets at 4
months of age and in Zimbabwe Chiduwa et al. (2008) reported that farmers weaned
piglets at 6 to 8 months of age. The difference in the age at weaning as reported in this
study and by other authors could be due partly to rural farmers in Botswana and
Zimbabwe not being able to afford to the high cost of rearing piglets. Uncontrolled
weaning and the long lactation periods have a number of negative effects on performance
and health of sows. That resulted in sows not getting back on oestrous after the piglets
stop suckling (Ocampo et al., 2005), which was partly due to the loss of body condition
(Kugonza and Mutetikka, 2005). With the sows not coming back on oestrus they became
unproductive for most of the time which could be over 3 weeks (Kugonza and Mutetikka,
2005) and hence, it was found that sows of most respondents only farrowed once a year.
Therefore, sows require time and more feed to get their bodies in good condition again
before breeding. Respondents who kept pigs for sale wanted their sows to farrow twice
yearly and to have reasonable litter sizes for them to make good incomes. However,
farmers who kept pigs for home consumption were not too concerned about weaning.
Plates 5.7 and 5.8 were taken by the author to show the “thin sow condition” mentioned
by Kugonza and Mutetikka (2005) and of sows loosing body condition as a result of long
lactations.
81
Plate 5.7: A sow in poor condition after a long lactation period
Source: Gcumisa (2012)
Plate 5.8: Sows in poor condition still lactating
Source: Gcumisa (2010)
82
Most of pig mortality was observed in the early life of piglets as was also reported by Ajala
et al. (2007) and Kamuribo et al. (2011). That could have been caused by a number of
factors including diseases, piglets getting squashed by sows, bad weather conditions and
predation (Madzimure et al., 2013). A number of diseases that affected piglets such as
worm infestation, skin related problems (mange, lice and loss of hair) and diarrhoea were
observed in the study area.
The pig diseases mentioned farmers in uThukela District were also reported by a number
of authors. Ajala et al. (2007) in Nigeria, Kagira et al. (2010) in Kenya, Hossain et al.
(2011) in Bangladesh and Kamuribo et al. (2011) in Tanzania reported on the same
diseases mentioned in uThukela District. That suggested that these diseases were
common in rural areas in most developing countries. The types of worms commonly
identified in pigs were of big concern as Chaline (2011) highlighted that the two most
dangerous parasitic infections transmitted by pork were caused by worms; such as the
round worms (Trichinosis) and tapeworms Taenia solium (Cysticercosis); which are still
common in many African countries (Chaline, 2011).
In this study, piglets getting squashed by sows were reported as one of the major causes
of mortality in piglets followed by exposure to cold (Figure 4.23). Respondents in rural
areas do not have farrowing crates or creep areas. Thus, sows were prone to squashing
their piglets that tended to lie next to them for warm. Chills or cold was also reported by
Haynes (2001) as a common cause of mortality in piglets born with very little hair and fat.
It showed that farmers did not provide beddings or suitable environment for piglets to keep
warm enough after farrowing. This was the case of pigs which were reared in free range
or extensive systems, coupled by the fact that farmers did not keep records to know when
sows were due to farrow, so that they could provide sows and piglets with the right
environment. Under intensive conditions as well where there were no records, it will be
difficult for farmers to know when sows were close to farrow and provide beddings. All
these were management practices that needed to be taught to farmers. Other causes of
mortality were mostly accidental and did not occur frequently, which included drowning or
being eaten by dogs. Preparation for safe farrowing areas with beddings to provide
warmth for the piglets is an important requirement in well managed piggeries.
Very few respondents (10.4%) said they have ever consulted with the State Veterinary
Department (Vets) to report about the health of their pigs. Most respondents (44.2%) did
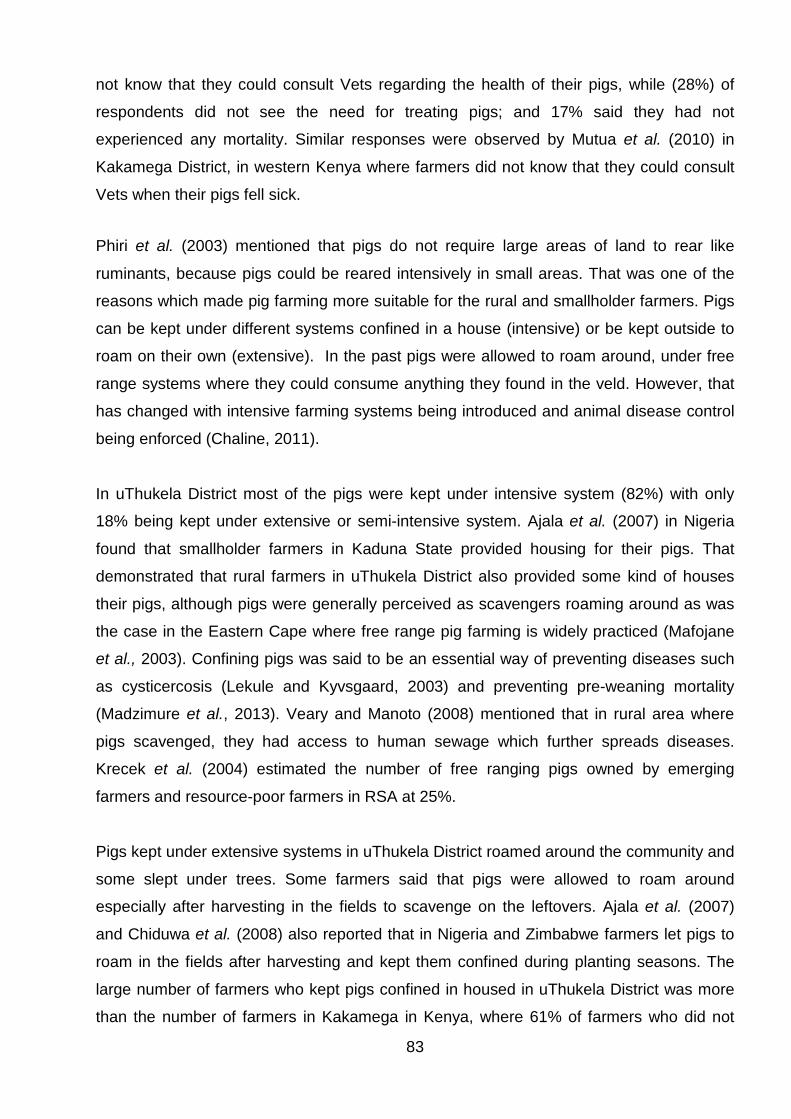
83
not know that they could consult Vets regarding the health of their pigs, while (28%) of
respondents did not see the need for treating pigs; and 17% said they had not
experienced any mortality. Similar responses were observed by Mutua et al. (2010) in
Kakamega District, in western Kenya where farmers did not know that they could consult
Vets when their pigs fell sick.
Phiri et al. (2003) mentioned that pigs do not require large areas of land to rear like
ruminants, because pigs could be reared intensively in small areas. That was one of the
reasons which made pig farming more suitable for the rural and smallholder farmers. Pigs
can be kept under different systems confined in a house (intensive) or be kept outside to
roam on their own (extensive). In the past pigs were allowed to roam around, under free
range systems where they could consume anything they found in the veld. However, that
has changed with intensive farming systems being introduced and animal disease control
being enforced (Chaline, 2011).
In uThukela District most of the pigs were kept under intensive system (82%) with only
18% being kept under extensive or semi-intensive system. Ajala et al. (2007) in Nigeria
found that smallholder farmers in Kaduna State provided housing for their pigs. That
demonstrated that rural farmers in uThukela District also provided some kind of houses
their pigs, although pigs were generally perceived as scavengers roaming around as was
the case in the Eastern Cape where free range pig farming is widely practiced (Mafojane
et al., 2003). Confining pigs was said to be an essential way of preventing diseases such
as cysticercosis (Lekule and Kyvsgaard, 2003) and preventing pre-weaning mortality
(Madzimure et al., 2013). Veary and Manoto (2008) mentioned that in rural area where
pigs scavenged, they had access to human sewage which further spreads diseases.
Krecek et al. (2004) estimated the number of free ranging pigs owned by emerging
farmers and resource-poor farmers in RSA at 25%.
Pigs kept under extensive systems in uThukela District roamed around the community and
some slept under trees. Some farmers said that pigs were allowed to roam around
especially after harvesting in the fields to scavenge on the leftovers. Ajala et al. (2007)
and Chiduwa et al. (2008) also reported that in Nigeria and Zimbabwe farmers let pigs to
roam in the fields after harvesting and kept them confined during planting seasons. The
large number of farmers who kept pigs confined in housed in uThukela District was more
than the number of farmers in Kakamega in Kenya, where 61% of farmers who did not
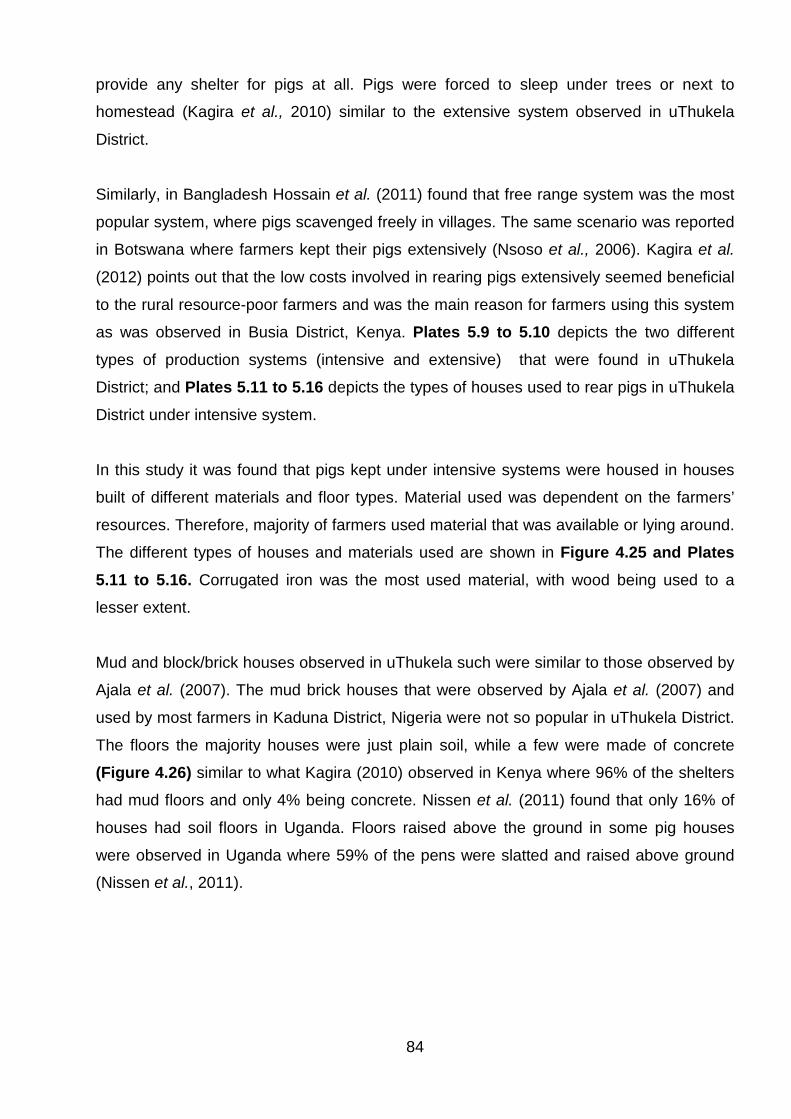
84
provide any shelter for pigs at all. Pigs were forced to sleep under trees or next to
homestead (Kagira et al., 2010) similar to the extensive system observed in uThukela
District.
Similarly, in Bangladesh Hossain et al. (2011) found that free range system was the most
popular system, where pigs scavenged freely in villages. The same scenario was reported
in Botswana where farmers kept their pigs extensively (Nsoso et al., 2006). Kagira et al.
(2012) points out that the low costs involved in rearing pigs extensively seemed beneficial
to the rural resource-poor farmers and was the main reason for farmers using this system
as was observed in Busia District, Kenya. Plates 5.9 to 5.10 depicts the two different
types of production systems (intensive and extensive) that were found in uThukela
District; and Plates 5.11 to 5.16 depicts the types of houses used to rear pigs in uThukela
District under intensive system.
In this study it was found that pigs kept under intensive systems were housed in houses
built of different materials and floor types. Material used was dependent on the farmers’
resources. Therefore, majority of farmers used material that was available or lying around.
The different types of houses and materials used are shown in Figure 4.25 and Plates 5.11 to 5.16. Corrugated iron was the most used material, with wood being used to a
lesser extent.
Mud and block/brick houses observed in uThukela such were similar to those observed by
Ajala et al. (2007). The mud brick houses that were observed by Ajala et al. (2007) and
used by most farmers in Kaduna District, Nigeria were not so popular in uThukela District.
The floors the majority houses were just plain soil, while a few were made of concrete
(Figure 4.26) similar to what Kagira (2010) observed in Kenya where 96% of the shelters
had mud floors and only 4% being concrete. Nissen et al. (2011) found that only 16% of
houses had soil floors in Uganda. Floors raised above the ground in some pig houses
were observed in Uganda where 59% of the pens were slatted and raised above ground
(Nissen et al., 2011).
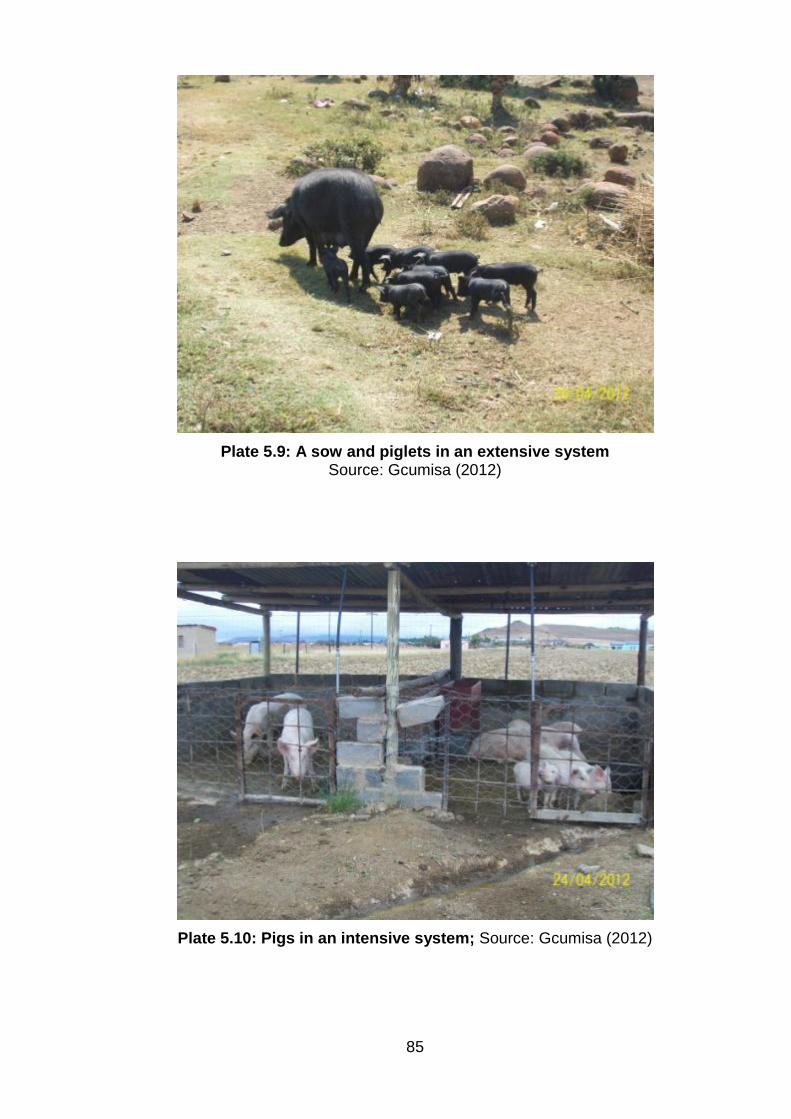
85
Plate 5.9: A sow and piglets in an extensive system
Source: Gcumisa (2012)
Plate 5.10: Pigs in an intensive system; Source: Gcumisa (2012)
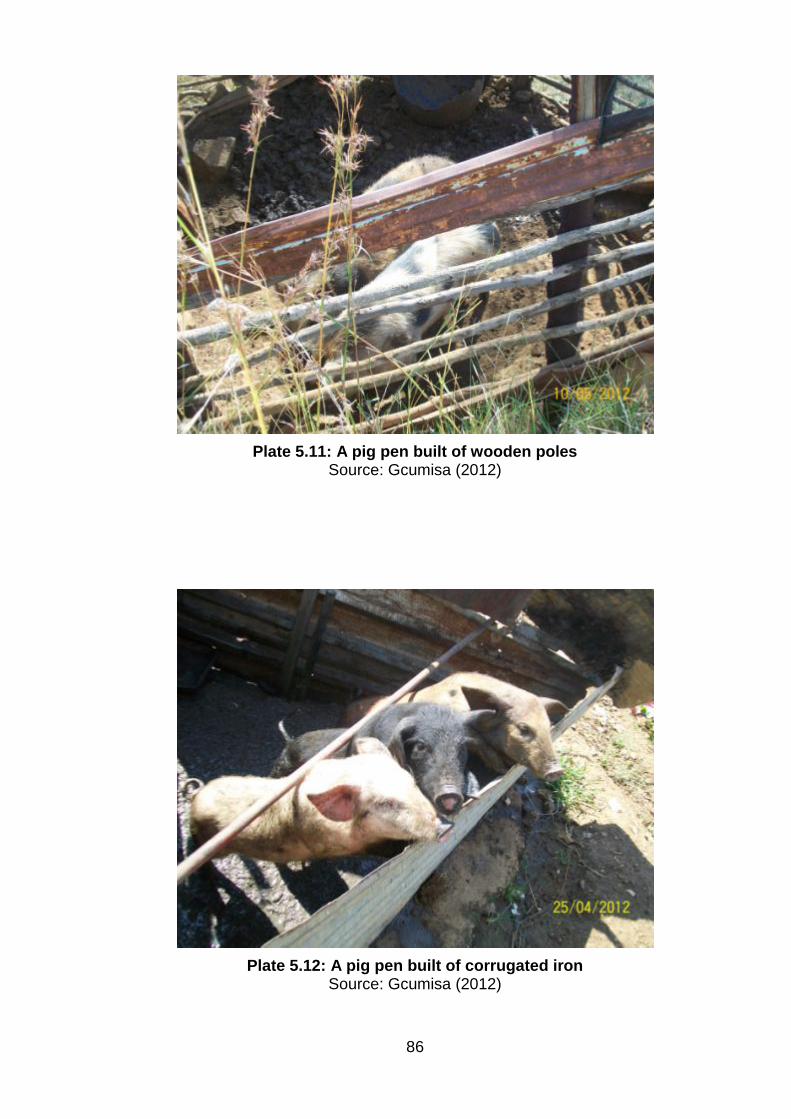
86
Plate 5.11: A pig pen built of wooden poles
Source: Gcumisa (2012)
Plate 5.12: A pig pen built of corrugated iron
Source: Gcumisa (2012)
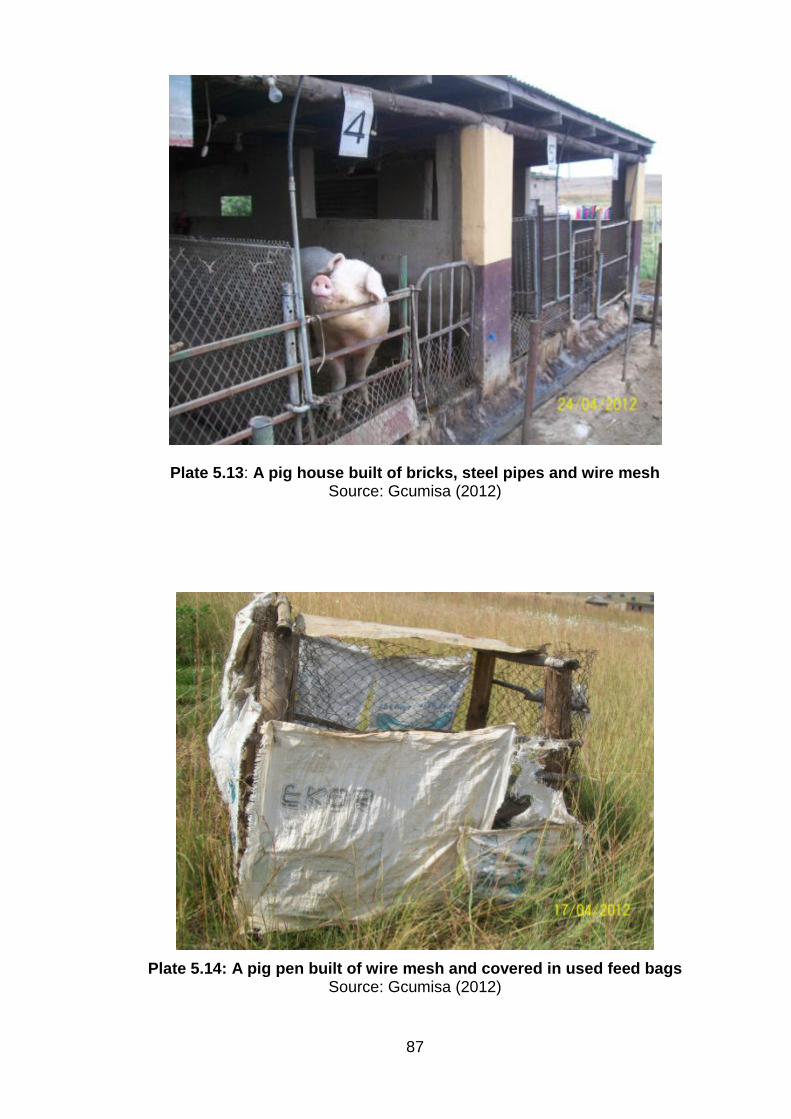
87
Plate 5.13: A pig house built of bricks, steel pipes and wire mesh Source: Gcumisa (2012)
Plate 5.14: A pig pen built of wire mesh and covered in used feed bags
Source: Gcumisa (2012)
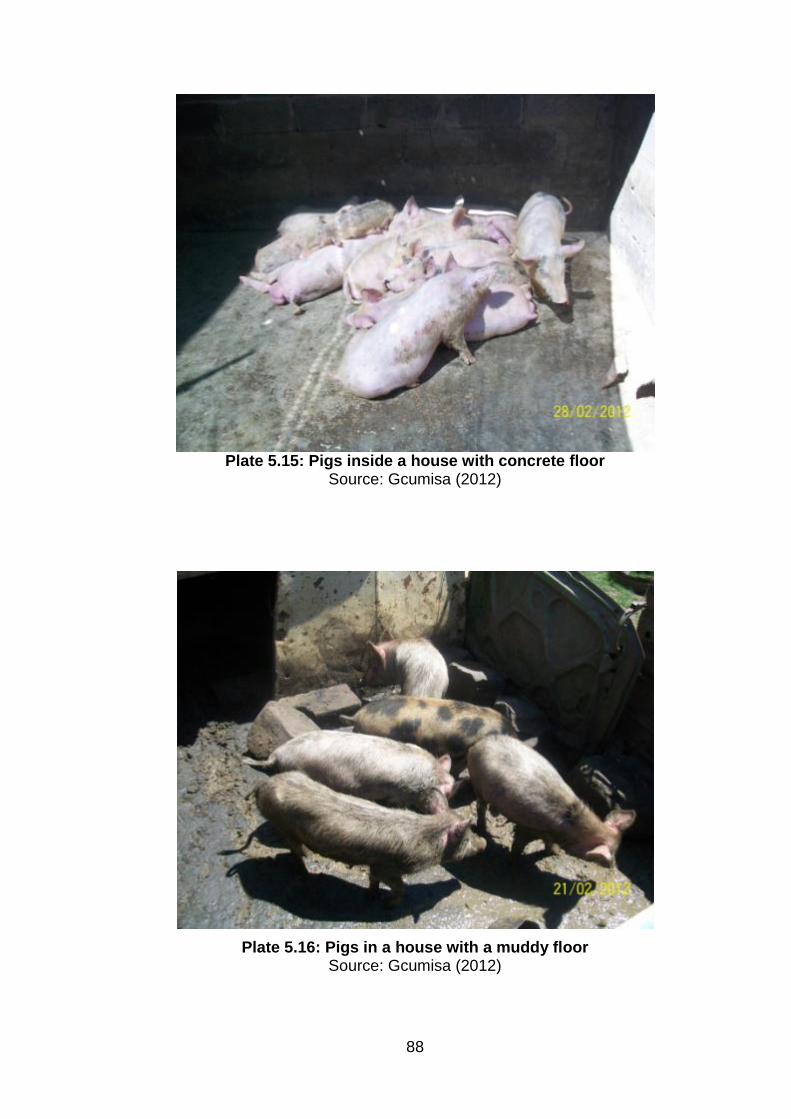
88
Plate 5.15: Pigs inside a house with concrete floor
Source: Gcumisa (2012)
Plate 5.16: Pigs in a house with a muddy floor
Source: Gcumisa (2012)
89
Feed is one of the most important inputs in pig production. According to Smith (2006) feed
costs take 75 – 80% of total variable costs in the pig production. Commercial feeds are
mainly constituted from maize, wheat or sorghum as energy sources and soya bean as
the protein source. Grains make up between 55 - 70% of rations (Smith, 2006). Most
crops that were used in pig feeds increased in prices between August 2011 and August
2012 (DAFF, 2012b), from R1 907/ton to R2 650/ton for white maize; R1 909/ton to
R2 644/ton for yellow maize; R3 006/ton to R3 478/ton for wheat; R3 316/ton to
R5 394/ton for soybean. The increase in commodity prices had an impact on the feed
prices because of the raw materials form a very large portion of pig feeds. As already
mentioned by Smith (2006) that feed costs about 75 -80% of total production costs, this
makes feed the most expensive input in pig farming. It is because of the high feed costs
that farmers in rural areas do not buy commercial feeds and tend to use alternatives in
feeding their pigs. Lekule and Kyvsgaard (2003) also noted that most small-scale pig
farmers could not buy commercial feeds.
The pig was described by Haynes (2001) as the “most nearly parallel to humans of all
farm animals” because pigs can make use of energy and protein from vegetable and
animal sources. That made pig feed more expensive in many developing countries
because pigs compete for with humans in their feed requirements; and there isn’t enough
supply of raw materials (Petrus et al., 2011). Majority of the respondents in uThukela
District (81%) said that they use swill to feed their pigs, while 16% of them fed pigs on
commercial feeds and 2% fed them maize grains and vegetables. Chikwanha et al. (2007)
mentioned that rural farmers in the Southern Africa were dependent on locally available
feed resources for feeding their animals as observed in uThukela District where farmers
fed even vegetables to pigs.
A strong relationship was observed between the total pig numbers and the type of feeds
commonly used (Table 4.18). Farmers who fed pigs on commercial feeds seemed to have
more pigs compared to those who fed them on swill, vegetables and maize. Majority of
those who had more pigs were the ones who were employed and also sold their pigs.
Thus, farmers who were more financially secure either because of being employed or
because they kept more pigs; were the ones who were able to buy feeds while the
majority of respondents could not.
90
Madzimure et al. (2013) reported that feed scarcity observed in rural areas was one of the
reasons behind small-scale pig farmers not growing their production. Swill or “isilothi”
formed 81% of pig feeds in uThukela District. The feed came from different sources such
as schools with government feeding schemes, hospitals, hotels and game reserves.
Farmers were able to get leftovers for their pigs. Some respondents got swill from the
nearest townships or from neighbours who had no pigs. Farmers who needed swill left
empty containers at particular households and collected the swill on particular days when
the containers were full. For this gesture the farmers gave away one piglet to each
household in return for the swill. All the different sources of swill provided farmers with
mixtures of different types of feed used in these areas. The most used type of swill was
that derived from home kitchen wastes and leftovers as indicated in Figure 4.27.
Sorghum brewer’s grain or “amavovo” were also mentioned as of swill which was mixed
with kitchen leftovers by some farmers in uThukela District. Petrus et al. (2011) also found
that 53% of farmers in Etayi, Namibia made use of by-products from local brewing industry
to feed their pigs. That was also reported by Nsoso et al. (2006) in Botswana and Ajala et
al. (2007) in Nigeria; who showed that local beer residues mixed with kitchen wastes were
fed to pigs. Holness (1999) (cited by Nsoso et al., 2006) also mentioned the wide use of
brewing by-products by many small-scale pig producers in Africa.
Mtileni et al. (2013) found that rural farmers fed kitchen wastes and maize to chickens.
With over 90% of farmers in uThukela having chickens as well as pigs this showed that
there was bound to be feed shortages if livestock numbers were not kept low. Chiduwa et
al. (2008) noted that most rural pig farmers kept pig numbers low because of not having
enough feed. Some respondents fed their pigs once in the morning and majority did not
weigh or measure feed before offering to pigs. Chiduwa et al. (2008) in Zimbabwe, Kagira
et al. (2010) in Kenya found that farmers fed kitchen wastes to their pigs. Kumaresan et al.
(2009) in India and Nissen et al. (2011) in Uganda also found that pig farmers also made
use of kitchen wastes and crop residues. The different types of swill fed to pigs
demonstrated how pig diets were similar to those of humans.
The problem with feeding swill to pigs has been that of disease spread as mentioned by
Haynes (2001), who said that swill could be hazardous as it could harbour pathogenic
organisms that may infect pigs. In this study none of the respondents said that they
cooked or boiled swill before feeding to their pigs. According to Robinson and Penrith
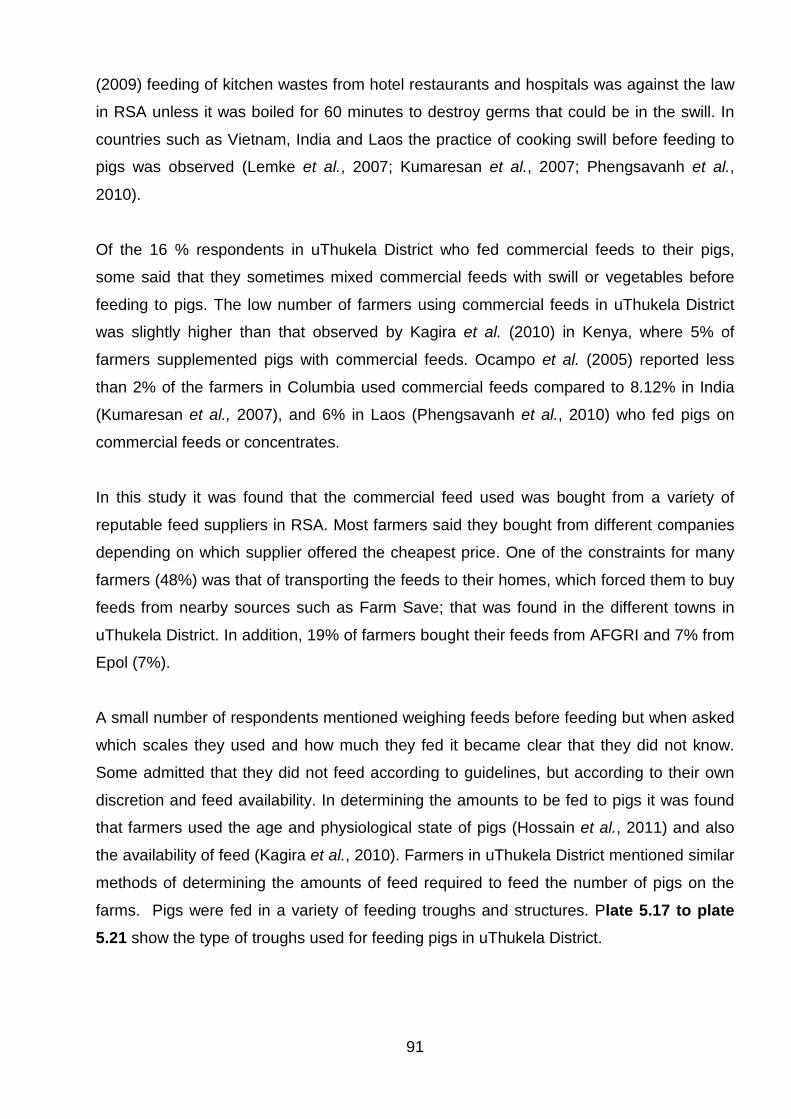
91
(2009) feeding of kitchen wastes from hotel restaurants and hospitals was against the law
in RSA unless it was boiled for 60 minutes to destroy germs that could be in the swill. In
countries such as Vietnam, India and Laos the practice of cooking swill before feeding to
pigs was observed (Lemke et al., 2007; Kumaresan et al., 2007; Phengsavanh et al.,
2010).
Of the 16 % respondents in uThukela District who fed commercial feeds to their pigs,
some said that they sometimes mixed commercial feeds with swill or vegetables before
feeding to pigs. The low number of farmers using commercial feeds in uThukela District
was slightly higher than that observed by Kagira et al. (2010) in Kenya, where 5% of
farmers supplemented pigs with commercial feeds. Ocampo et al. (2005) reported less
than 2% of the farmers in Columbia used commercial feeds compared to 8.12% in India
(Kumaresan et al., 2007), and 6% in Laos (Phengsavanh et al., 2010) who fed pigs on
commercial feeds or concentrates.
In this study it was found that the commercial feed used was bought from a variety of
reputable feed suppliers in RSA. Most farmers said they bought from different companies
depending on which supplier offered the cheapest price. One of the constraints for many
farmers (48%) was that of transporting the feeds to their homes, which forced them to buy
feeds from nearby sources such as Farm Save; that was found in the different towns in
uThukela District. In addition, 19% of farmers bought their feeds from AFGRI and 7% from
Epol (7%).
A small number of respondents mentioned weighing feeds before feeding but when asked
which scales they used and how much they fed it became clear that they did not know.
Some admitted that they did not feed according to guidelines, but according to their own
discretion and feed availability. In determining the amounts to be fed to pigs it was found
that farmers used the age and physiological state of pigs (Hossain et al., 2011) and also
the availability of feed (Kagira et al., 2010). Farmers in uThukela District mentioned similar
methods of determining the amounts of feed required to feed the number of pigs on the
farms. Pigs were fed in a variety of feeding troughs and structures. Plate 5.17 to plate 5.21 show the type of troughs used for feeding pigs in uThukela District.
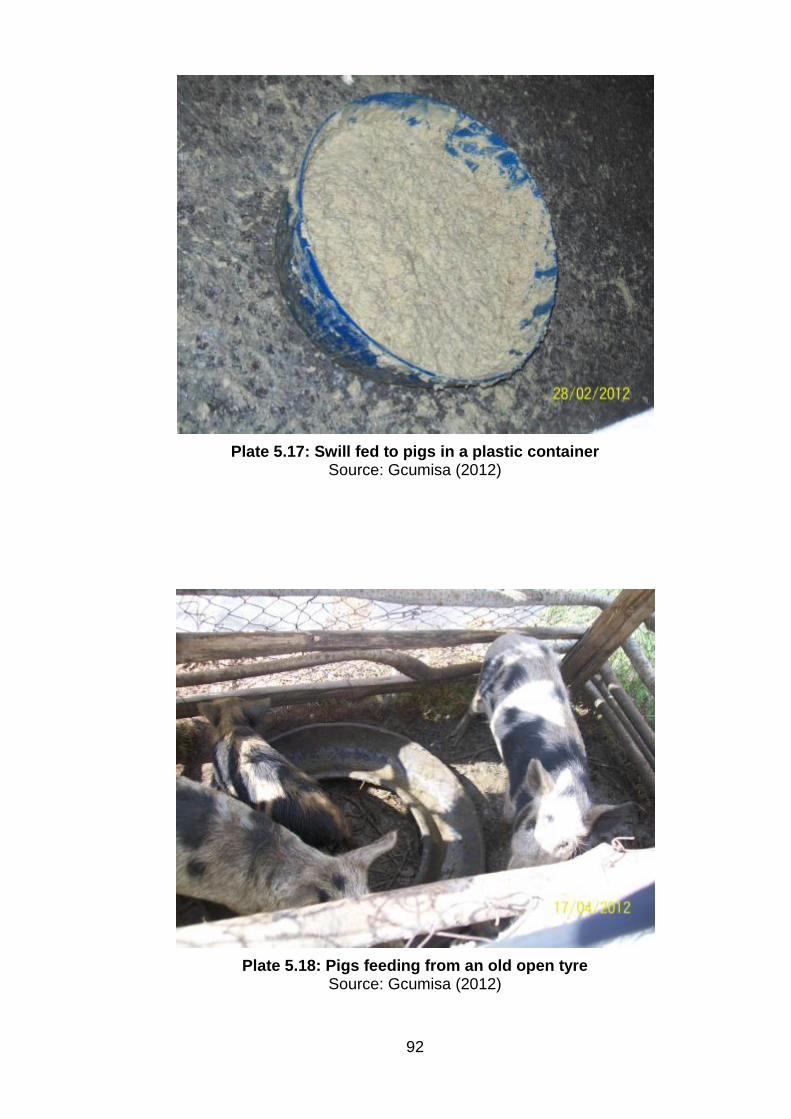
92
Plate 5.17: Swill fed to pigs in a plastic container
Source: Gcumisa (2012)
Plate 5.18: Pigs feeding from an old open tyre
Source: Gcumisa (2012)
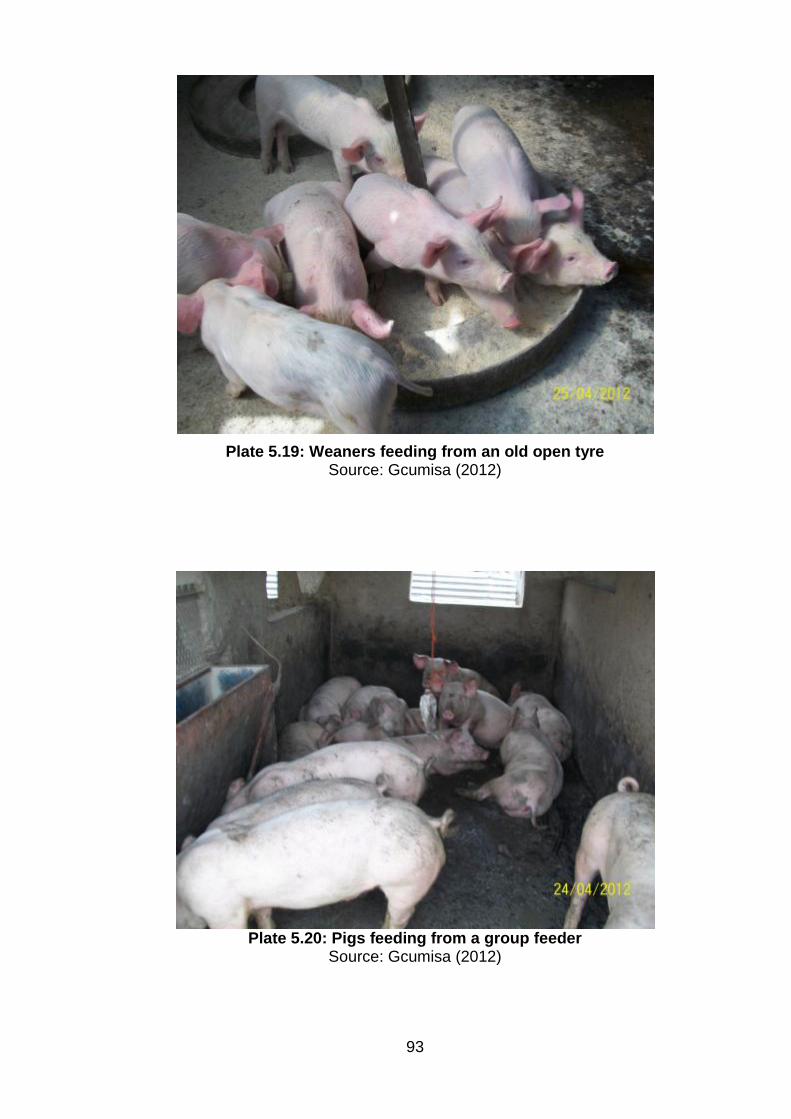
93
Plate 5.19: Weaners feeding from an old open tyre
Source: Gcumisa (2012)
Plate 5.20: Pigs feeding from a group feeder
Source: Gcumisa (2012)
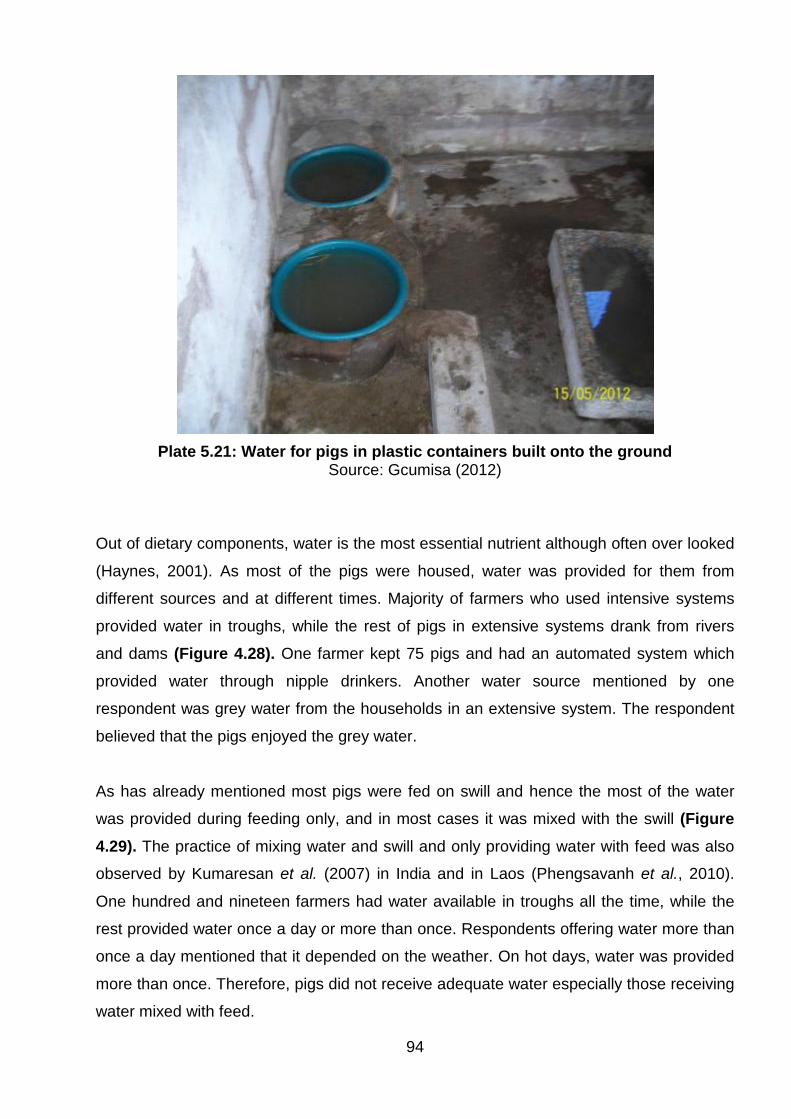
94
Plate 5.21: Water for pigs in plastic containers built onto the ground
Source: Gcumisa (2012)
Out of dietary components, water is the most essential nutrient although often over looked
(Haynes, 2001). As most of the pigs were housed, water was provided for them from
different sources and at different times. Majority of farmers who used intensive systems
provided water in troughs, while the rest of pigs in extensive systems drank from rivers
and dams (Figure 4.28). One farmer kept 75 pigs and had an automated system which
provided water through nipple drinkers. Another water source mentioned by one
respondent was grey water from the households in an extensive system. The respondent
believed that the pigs enjoyed the grey water.
As has already mentioned most pigs were fed on swill and hence the most of the water
was provided during feeding only, and in most cases it was mixed with the swill (Figure 4.29). The practice of mixing water and swill and only providing water with feed was also
observed by Kumaresan et al. (2007) in India and in Laos (Phengsavanh et al., 2010).
One hundred and nineteen farmers had water available in troughs all the time, while the
rest provided water once a day or more than once. Respondents offering water more than
once a day mentioned that it depended on the weather. On hot days, water was provided
more than once. Therefore, pigs did not receive adequate water especially those receiving
water mixed with feed.
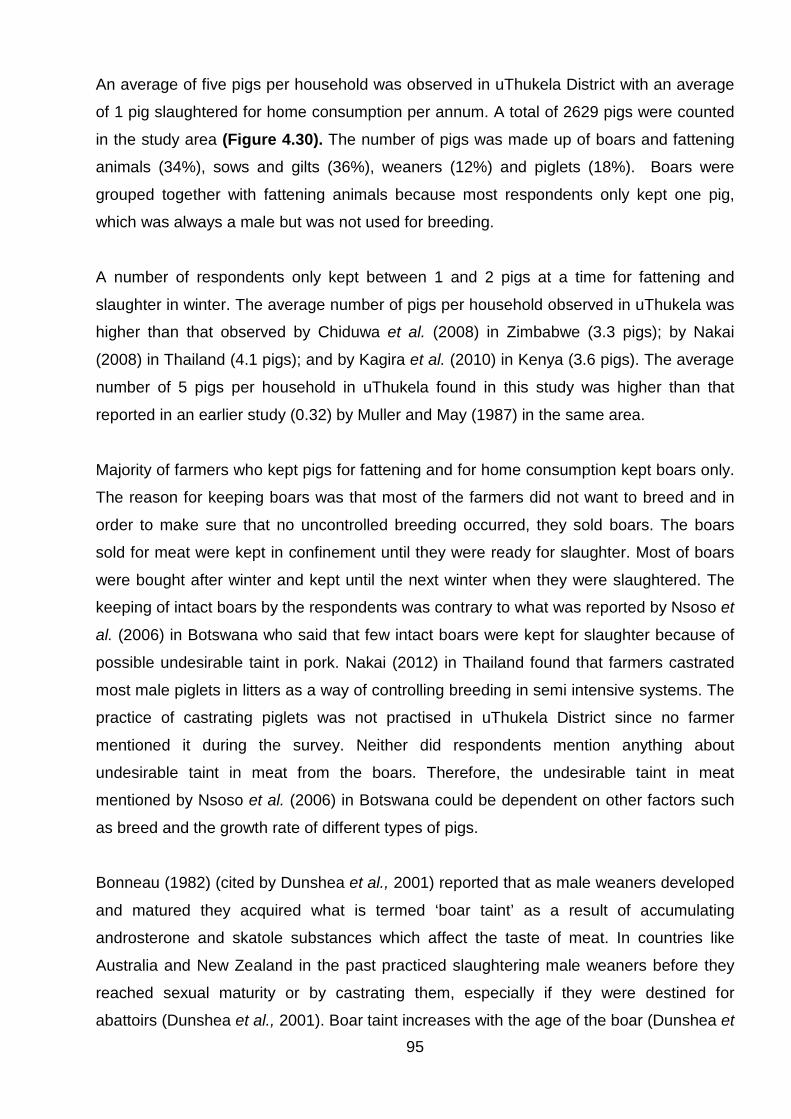
95
An average of five pigs per household was observed in uThukela District with an average
of 1 pig slaughtered for home consumption per annum. A total of 2629 pigs were counted
in the study area (Figure 4.30). The number of pigs was made up of boars and fattening
animals (34%), sows and gilts (36%), weaners (12%) and piglets (18%). Boars were
grouped together with fattening animals because most respondents only kept one pig,
which was always a male but was not used for breeding.
A number of respondents only kept between 1 and 2 pigs at a time for fattening and
slaughter in winter. The average number of pigs per household observed in uThukela was
higher than that observed by Chiduwa et al. (2008) in Zimbabwe (3.3 pigs); by Nakai
(2008) in Thailand (4.1 pigs); and by Kagira et al. (2010) in Kenya (3.6 pigs). The average
number of 5 pigs per household in uThukela found in this study was higher than that
reported in an earlier study (0.32) by Muller and May (1987) in the same area.
Majority of farmers who kept pigs for fattening and for home consumption kept boars only.
The reason for keeping boars was that most of the farmers did not want to breed and in
order to make sure that no uncontrolled breeding occurred, they sold boars. The boars
sold for meat were kept in confinement until they were ready for slaughter. Most of boars
were bought after winter and kept until the next winter when they were slaughtered. The
keeping of intact boars by the respondents was contrary to what was reported by Nsoso et
al. (2006) in Botswana who said that few intact boars were kept for slaughter because of
possible undesirable taint in pork. Nakai (2012) in Thailand found that farmers castrated
most male piglets in litters as a way of controlling breeding in semi intensive systems. The
practice of castrating piglets was not practised in uThukela District since no farmer
mentioned it during the survey. Neither did respondents mention anything about
undesirable taint in meat from the boars. Therefore, the undesirable taint in meat
mentioned by Nsoso et al. (2006) in Botswana could be dependent on other factors such
as breed and the growth rate of different types of pigs.
Bonneau (1982) (cited by Dunshea et al., 2001) reported that as male weaners developed
and matured they acquired what is termed ‘boar taint’ as a result of accumulating
androsterone and skatole substances which affect the taste of meat. In countries like
Australia and New Zealand in the past practiced slaughtering male weaners before they
reached sexual maturity or by castrating them, especially if they were destined for
abattoirs (Dunshea et al., 2001). Boar taint increases with the age of the boar (Dunshea et
96
al., 2001). In rural areas castrating male piglets serves two purposes, firstly to get rid of
the boar taint in the meat and to control unplanned breeding, because only the intact
boars can breed.
Almost all respondents (98%) in uThukela District did not know of any diseases control
measures or any bio-security measures in place (Figure 33). Only 2 % said that they
vaccinated their pigs regularly but, none of them could give the name of the vaccination
programme or the vaccine which was used on their pigs. This left question marks on
whether the respondents vaccinated or not; and whether they used the right vaccines or
because they could have been given medications for other ailment but not vaccines.
Some respondents said that they have never seen a sick pig, while some reiterated that
they did not know that they could consult government Vets to treat their pigs. The non
existence of vaccination programmes in uThukela District was echoed by Petrus et al.
(2011) in Etayi, Namibia, who reported that respondents in that study were amazed to
hear that pigs can be treated or vaccinated. Ajala et al. (2007) on the contrary found that
over 60% of respondents in Kaduna, Nigeria, vaccinated their pigs against diseases
regularly. Kumaresan et al. (2009) found that 37.8% of pigs in India were vaccinated. That
showed that in other countries farmers vaccinated their pigs regularly.
About half of respondents (59%) in uThukela District said that they have not experienced
pig mortality within their herds, and yet there was poor disease control observed in the
area. Of those who experienced regular mortality, 25% of them burned the carcasses, 8%
of them fed carcasses to dogs and 2.1% of them ate the carcasses. Farmers who burned
or fed carcasses to their dogs kept many pigs than those that ate or threw the carcasses.
Respondents who consumed carcasses had very few pigs, which kept solely for home
consumption.
The majority of respondents (99.6%) did not send pigs for post mortem, because they felt
that it was not necessary to do so (Figure 4.32). Kumaresan et al. (2009) in India also
observed similar reaction from farmers. A number of reasons were mentioned by
respondents for not sending dead pigs for post mortem. Most of them (52%) felt that post
mortem was not necessary, while 26% of them did not know that they could send pigs for
post mortem; and 20% of them said they could not afford the cost of transport to the Vets
clinic.
97
CHAPTER 6: CONCLUSIONS AND RECOMMENDATIONS
Introduction
“Lack of opportunities rather than resistance to change is the main bottleneck to the development of the livestock industries in these areas” – Bembridge (1979).
Literature on pig production in Africa and Asia clearly indicated that pigs are kept by many
people in rural areas for different reasons. The uses vary from country to country, but the
two most important ones are: the provision of protein in many households; and source of
income. A number of other reasons exist but one common fact is that pigs make a
difference in the livelihoods of rural people. With most African countries facing severe
poverty there have to be other means of providing for the family and this is where
agriculture and pigs in particular play a role in poverty alleviation and food security.
In this study which was conducted in the uThukela District in KZN, it was evident that the
district faced severe poverty as was the case for KZN province as a whole. People
residing in the rural areas tended to be most affected by poverty. Keeping of indigenous
pigs was more appropriate for rural farmers because these pigs are known to be hardy,
resistant to diseases, and require minimal inputs. Since meat consumption required some
wealth, indigenous pigs in particular provided a source of protein that could be exploited
without major inputs from farmers. Changes have occurred in pig production over the
years and farmers need to adapt to the new practices especially if they would like to keep
exotic pig breeds and shift from producing for consumption to produce for income
generation.
6.1 Conclusions Pig production and practices observed in the rural areas of uThukela District were similar
to those observed in other RSA provinces and in many other developing countries.
Women were the most involved in keeping and raising pigs in uThukela District. Fewer
males kept pigs but the number of pigs they kept was higher compared to females who
kept fewer pigs.
98
Employment status and education level of farmers were the two important determinants of
the number of pigs owned. Farmers who were employed owned more pigs, and similarly
the higher the level of education the more the number of pigs they owned. Employment
also determined the reasons for keeping pigs. Employed farmers were the ones who
mainly sold pigs. The unemployed farmers mostly kept pigs for home consumption.
Majority of farmers kept pigs for home consumption and for income generation. Thus, pigs
provided a source of protein for the majority of households and extra income for those
who sold their pigs.
Pigs and chickens were the most popular species in the rural areas. Chicken meat was
the most preferred meat followed by beef, pork, mutton and chevon as the least
consumed. At least one pig was slaughtered per household yearly. Indigenous pigs were
still the most popular pigs in the study area. Exotic pigs were few but their numbers were
increasing.
Religious and cultural beliefs were not major obstacles to pig farming and pork
consumption in uThukela District. Only a few people in the community had problems with
both pig farming and consumption of pork due to religious groups and churches around
them that prohibited the keeping of pigs and consumption of pork, which they considered
a taboo. Others were affected by cultural beliefs, especially those who believed in
traditional medicines/muthi/izibethelo. They associated pig with evil and they believed that
interfered with their muthi/izibethelo.
Majority of the farmers had experience in pig farming because they lived or worked on
farms that kept pigs for a long time but that did not improve their production skills. Very
few farmers had been trained in pig production and the rewards for such training were
evident in terms of improved management practices (especially breeding management)
and higher production. Thus, trained farmers did better than untrained farmers.
Management and care of gilts, sows and piglets was a big problem in uThukela District.
Farmers did not have selection criteria for breeding stock. There was poor management
between services and weaning periods. Piglets got squashed by sows or died from
exposure to cold, which were major concerns. Diseases were not commonly encountered
especially in piglets. There was very low mortality as a result of diseases. Vaccination and
biosecurity measures did not exist. Treatment of sick pigs was minimal, mainly because
99
farmers did not know that Vets could also treat pigs. Disposal methods for carcasses
revealed that some farmers with very few pigs consumed the carcasses.
Most of the farmers with few pigs were unemployed and in poverty. Pigs were kept mainly
in intensive systems. Structures were poorly constructed mainly with different locally
available materials without concreted floors. Mud floor were a big challenge during wet
seasons because pigs made mud pools.
Swill was the common feed for pigs in most households. The main concern was the
spread of diseases from swill, but because of feed shortages, farmers did not have other
resources. Commercial feeds were used by a few farmers, especially those who kept pigs
for sales and those who sold their pigs to abattoirs. These farmers understood the
importance of good nutrition for pigs destined for slaughter.
Opportunities were there if farmers could manage their pigs properly. Water for pigs was
provided only during feeding and sometimes mixed with the feed. That was a problem,
especially with unbalanced feeds and hot weather. It was one of the causes of poor pig
performance in the study area.
Time taken for pigs to reach slaughter weight was a problem for some farmers because of
poor feeds and underfeeding. Therefore it took a long time before pigs attained slaughter
weight. The cost of rearing the pigs for extra months meant that farmers were not making
any profit. Farmers utilized different markets both formal (abattoirs and butcheries) and
informal (pension pay points and neighbours) to sell their pigs live or as pork meat.
Informal markets were not organized, farmers sold pigs throughout the year, especially in
winter, and prices were determined at the point of sale.
6.2 Recommendations
Results of the current study have shown that pig farming in uThukela District is an
important economic activity, which fulfilled a social and economic household needs. It is
therefore necessary to assist those farmers through mentoring to make pig farming more
successful in the rural areas of KZN; as means of alleviating poverty and eliminating food
insecurity in uThukela District. It is therefore of utmost importance for KZNDAEA to
100
support the pig farmers in rural areas by equipping them with knowledge and skills to
improve the quality of pigs sold in market; for better economic gains.
The low youth involvement in agriculture is of great concern because it creates a problem
when the current farmers will no longer be able to work or are deceased it will certainly
mean that farming will have stopped in those households. Majority of households had an
average family size of 8 people who were poorly educated and unemployed. With that
comes the issue of dependency, especially on government grants because there are no
other sources of income in most cases. Therefore, it is crucial that youth are motivated
and shown the importance of agriculture to eliminate the stigma that sometimes
accompanies agriculture by magnifying its gains. This issue has been addressed by the
current IDP for uThukela District. This will improve number of youth involved in agriculture
and in other employments in the rural areas. The KZN government should increase
bursaries for more youths to study agriculture through Cedara and Owen Sithole Colleges
that are managed by KZNDAEA.
There is a gap between KZNDAEA and the rural people with regard to the marketing of
livestock and related products. It is necessary for the government to study and understand
the local market; with the view of developing marketing infrastructure on one hand; and on
the other the government should empower farmers with knowledge and skills on issues
such as hygiene, healthcare and animal welfare; so that they can improve livestock
production and sales. This does not necessarily means that the government should
interfere with the local market. What is required is for the government to develop
standards and market places or auctions for pigs, so that local farmers can meet buyers
on regular basis.
Recently KZNDAEA initiated auctions for cattle where rural farmers sell their cattle, which
have become very popular. Possibly similar development is required for pigs to have more
organized marketing. This will improve animal disease control and the quality of meat
sold. It will also improve the economic status and household food security of pig farmers.
KZNDAEA should work with the Department of Health to improve the handling and selling
of meat in the local markets. This will prevent the spread zoonotic diseases. Research is
also necessary to investigate the zoonotic diseases and any other diseases that could
affect pigs and people through scavenging pigs and consumption of pork. There should
also be stricter health programmes/vaccination programmes and the involvement of
101
KZNDAEA animal health technicians to mentor pig farmers to observe the required
healthcare and biosecurity routines on their farms to prevent the spread of animal
diseases. Disposal of carcasses of dead pigs need to be looked into to educate farmers
not to damp/throw away or eat carcasses to prevent the spread of zoonotic diseases.
Farmers should be encouraged to dispose carcasses as required by Biosecurity and
Disease Prevention Act.
Respondents used limited resources to the best of their ability, but proper feeding,
housing and controlled breeding needed urgent attention. They neglected proper animal
husbandry such as keeping of records, care and handling of sows, piglets and using
quality breeding stock. Inbreeding could be avoided by selling pigs to other districts in
KZN and also buying breeding stock from outside the district. It is also necessary to
establish alternative feed sources other than swill that could be grown in the area for the
development of indigenous breeds, than can be kept by rural farmers to meet their
economic needs and household food security.
Indigenous breeds are hardy and able to survive on limited resources in rural areas.
Therefore, research into non conventional feedstuffs should be encouraged and shared
with farmers to improve pig production in the district. It is important that to ensure that
indigenous breeds do not fade away from the rural areas of KZN. Farmers educated on
the importance of the pure bred indigenous pigs and their strengths such as their
resistance to diseases; and their ability to thrive in resource scarcity. Research for the
improvement of indigenous breeds should be encouraged for the preservation of the gene
pool in the province.
The KZNDAEA should investigate the possibility of introducing smaller, easily movable pig
houses that can be used by farmers keeping one or two pigs for fattening only. The
advantage of a movable house is that it could be moved to cleaner and dry areas when
required. Raised floor houses that are used in other countries could also need to be
investigated and adopted, since there are some that are already being used for goats in
the province.
Lastly, good management of pigs is the main catalyst of good production. Farmers should
be trained on how to keep financial and production records and to view pig farming as a
business which needs better management; for them to realise economic freedom and food

102
security. Pigs have a place in the lives of the rural people of KZN whether it’s for income
generation or for home consumption. Farmers need mentoring in different aspects of
production, nutrition, health, housing and management; because pig production has the
potential of supporting many households in the rural areas of KZN.
103
REFERENCES
Agricultural Research Council - Animal Nutrition and Animal Production Institute. 1999. Goat management manual for goat owners. ARC-API: Irene
Ajala, M.K., Adesehinwa, A.O.K., and Bawa, G.S. 2006. Socio-economic factors
influencing swine management practices among women in Jama’a Local Government Area of Kaduna State, Nigeria. Tropical and Subtropical Agroecosystems, 6: 43-48.
Ajala, M.K., Adesehinwa, A.O.K. and Mohammed, A.K., 2007. Characteristics of
smallholder pig production in southern Kaduna State, Nigeria. American-Eurasian Journal of Agriculture and Environmental Sciences, 2(2): 182-188.
Aliber, M. and Hart, T.G.B. 2009. Should subsistence agriculture be supported as a
strategy to address rural food insecurity. Agrekon, 48 (4): 434-458. Anderson, A.H. 1999. The Lekganyanes and Prophecy in the Zion Christian church.
Journal of Religion in Africa, 29:.285-312. Assana, E., Kyngdon, C.T., Gauci, C.G., Geerts, S., Dornny, P., De Deken, R.,
Anderson, G.A., Zoli, A.P. and Lightowlers, M.W. 2010a. Elimination of Taenia solium transmission to pigs in a field trial of the TSOL18 vaccine in Cameroon. International Journal for Parasitology, 40, pp.515-519.
Assana, E., Amadou, F., Thys, E., Lightowlers, M.W., Zoli, A.P., Dorny, P. and Geerts,
S. 2010b. Pig-farming systems and porcine cysticercosis in the north of Cameroon. Journal of Helminthology, 84: 441-446.
Association for Rural Advancement. 2010. KwaZulu-Natal facts and figures. [Online]
Available at: http://www.afra.co.za/jit_default_975.html [Accessed 10 September 2010]
Bellaver, C. and Bellaver, I. H. 1999. Livestock production and quality of societies’ life in
transition economies. Livestock Production Science, 59: 125-135. Bembridge, T.J. 1979. Problems of livestock production in the black states of southern
Africa and future strategy. South African Journal of Animal Science, 9: 163-176. Blench, R.M. and MacDonald, K.C. (eds). 2000. The origins and development of African
livestock. Archaeology, genetics, linguistics and ethnography. UCL Press: Taylor and Francis Group.
Bradford, G.E. 1999. Contributions of animal agriculture to meeting global human food
demand. Livestock Production Science, 59: 95-112. Bushby, R. 1998. Pigs. In: K. Thear and A. Fraser (eds). The complete book of
raising livestock and poultry: Martin Dunitz Limited, pp.140-156.
Carabin, H., Krecek, R.C., Cowan, L.D., Michael, L., Foyaca-Sibat, H., Nash, T. and
104
Willingham, A.L. 2006. Estimation of the cost of Taenia solium cysticercosis in Eastern Cape Province, South Africa. Tropical Medicine and International Health, 2(6): 906-916.
Carter, N., Dewey, C., Mutua, F., de Lange, C. and Grace, D. 2013. Average daily gain
of local pigs on rural and peri-urban smallholder farms in two districts of Western Kenya. Tropical Animal Health Production. [online] Available at: http://0-www.ncbi.nlm.nih.gov.elis.tmu.edu.tw/pubmed/23504593 [Accessed 14 May 2013]
Chaline, E. 2011. Fifty animals that changed the course of history. Cape Town: Quid
Publishers. Chiduwa, G., Chimonyo, M., Halimani, T.E., Chisambara, S.R. and Dzama, K. 2008.
Herd dynamics and contribution of indigenous pigs to the livelihoods of rural farmers in a semi-arid area of Zimbabwe. Tropical Animal Health, 40: 125-136.
Chikwanha, O.C., Halimani, T.E., Chimonyo, M., Dzama, K. and Bhebhe, E. 2007.
Seasonal changes in body condition scores of pigs and chemical composition of pig feed resources in a semi-arid smallholder farming area of Zimbabwe. African Journal of Agricultural Research, 2 (9): 468-474.
Chimonyo, M., Bhebhe, E., Dzama, K., Halimani, T.E. and Kanengoni, A. 2005. Improving smallholder pig production for food security and livelihoods of the poor in Southern Africa. Proceedings of African Crop Science Conference, 7: 569-573.
Cronje, I. 2012. Budget speech. Pietermaritzburg. Provincial Treasury. [online] Available
at<http://www.treasury.gov.za/documents/provincial%20budget/2012/1.%20Provincial%20Budget%20Speechs/KwaZulu-Natal%20budget%20Speech%20-%2009%20March%2012.pdf> [Accessed 20 March 2012]
Deka, R., Thorpe, W., Lucila Lapar, M. and Kumar, A. 2007. Kamrup’s pig sub-sector:
Current status, constraints and opportunities. New Delhi: International livestock research institute, India.
Department of Agriculture, Forestry and Fisheries. 2010. A profile of the South African
pork market value chain. [online] Available at:<http://www.nda.agric.za/docs/AMCP/porkMVCP2010-11.pdf> [21 September 2012]
Department of Agriculture, Forestry and Fisheries. 2012a. Abstract of agricultural
statistics. [online] Available at:<http://www.daff.gov.za/docs/statsinfo/Ab2012.pdf> [Accessed 03 August 2012]
Department of Agriculture, Forestry and Fisheries. 2012b. Weekly price watch . [online]
Available at: <http://www.daff.gov.za/docs/Pricewatch/PriceWatch%2012-08-03.pdf>[Accessed 03 August 2012]
Department Strategic Planning and Economic Development. 2007. UThukela District
Municipality, 2007/2008. Integrated development plan. [online] Available at: <http://devplan.kzntl.gov.za/idp_reviewed_2007_8/idps/kz232/Adopted/idp%202007.2008.pdf> [Accessed 20 June 2011]
105
Department Strategic Planning and Economic Development. 2012. UThukela District Municipality, 2012/2013. Integrated development plan. [online] Available at: <http://devplan.kzntl.gov.za/idp_reviewed_2012_13/IDPS/DC23/Adopted/ADOPTED%20IDP%2012.13.pdf>[Accessed 24 October 2012]
Department Strategic Planning and Economic Development. 2013. UThukela District
Municipality, 2013/2014. Integrated development plan. [online] Available at: <www.uthukeladm.co.za/uthukela/index.php?option=com>[Accessed 02 May 2013]
De Villiers, J.F. 2005. A strategy to improve agricultural productivity in a rural community
through on-farm research and technology transfer. PhD Pietermaritzburg: University of KwaZulu-Natal.
Dunshea, F.R., Colantoni, C., Howard, K., McCauley, I., Long, K.A., Lopaticki, S.,
Nugent, E.A., Simons, J.A., Walker, J. and Hennessy, D.P. 2001. Journal of Animal Science, 79: 2524-2535.
Esminger, M.E. 1961. Swine Science: Animal Agriculture Series. 3rd ed. Danville, Illinois:
The Interstate Printers and Publishers. Food and Agriculture Organization. 2009. Production of pig meat and chicken
meat. [Online] Available at:< http://www.fao.org/economic/ess/publications-studies/statistical-yearbook/fao-statistical-yearbook-2009/b-agricultural-production/en/>[Accessed 21 September 2010]
Food and Agriculture Organization. 2011.Livestock and food supply. [Online]
Available at:< http://www.fao.org/docrep/014/i237e/i237e.pdf>[Accessed 06 March 2012]
Fincham, J., 2005.Tapeworm alert in rural Eastern Cape. Science in Africa. [Online]
Available at: <http://www.scienceinafrica.co.za/2005/june/tapeworm.htm> [Accessed 26 January 2010]
Fowler, V.R. 1984. Improving efficiency in pig production. South African Journal of Animal Science, 14 (4): 147-151.
Gcumisa, S.T., Mpanza, T.P., Gumede, S.A., Khuboni, F.Z., Thusi, S.P., Radebe, S.B.
and Madiba, S.B. 2012. Study on Government funded broiler projects in the Sisonke District. KZN AGRI REPORT N/A/2012/03. Hilton. KZN Department of Agriculture and Environmental Affairs.
Gill, M. 1999. Meat production in developing countries. Proceedings of the nutrition
society, 58: 371-376. Grigg, D. 1995. The pattern of world protein consumption. Geoforum, 26: 1-17. Halimani, T.E., Muchadeyi, F.C., Chimonyo, M. And Dzama, K. 2012. Opportunities for
conservation and utilisation of local pig breeds in low-input systems in Zimbabwe and South Africa. Tropical Animal Health Production, 45(1): 81-90.
Haynes, N.B. 2001. Keeping livestock healthy. 4th ed. Massachusetts: Storey publishing.
106
Hendriks, S.L. 2003. The potential for nutritional benefits from increased agricultural production in rural KwaZulu-Natal. South African Journal of Agricultural Extension, 32: 28-44.
Hoffman, L.C., Styger, W.F., Brand and Muller, M. 2005a. The growth, carcass yield,
physical and chemical characteristic of two South African indigenous pig breeds. Journal of South African Animal Science, 6: 25-35.
Hoffman, L.C., Styger, E., Muller, M. and Brand, T.S. 2005b. Sensory, physical and
chemical quality characteristics of bacon derived from South African indigenous and commercial pig breeds. Journal of South African Animal Science, 6: 36-48.
Holness, D.H. 1991. The Tropical Agriculturalist. London: MACMILLAN Education Ltd. Hossain, M.E., Chakma, S., Khatun, M.M., Hasanuzzaman, M., Miah, M.Y. and Biswas,
M.A.A. 2011. Production systems of swine in the rural areas of Rangamati and Khagrachari districts of Bangladesh. Bangladesh Journal of Animal Science, 40(1&2): 28-33.
Kagira, J.M., Kanyari, P.W.N., Maingi, N., Githigia, S.M., Ng’ang’a, J.C. and Karuga,
J.W. 2010. Characteristics of the smallholder free-range pig production system in Western Kenya. Tropical Animal Health, 42: 865-873.
Kamuribo, E.D., Chenyambuga, S.W., Makene, V.W., and Mathias, S. 2011.
Characteristics and production constraints of rural-based small-scale pig farming in Iringa region, Tanzania. Livestock Research for Rural Development, [online] Available at:<http://www.lrrd.org/lrrd23/8/Kari23172.htm>[Accessed 28 May 2012]
Kem, E.H. (Ed.). 1993. Pig production in South Africa. Irene: Agricultural Research
council. Kirsten, J., Townsend, R. and Gibson, C. 1998. Determining the contribution of
agricultural production to household nutritional status in KwaZulu-Natal, South Africa. Development South African, 15(4): 573-587.
Köhler-Rollefson, I., Rathore, H.S. and Mathias, E. 2009. Local breeds, livelihoods and
livestock keepers’ rights in South Asia. Tropical Animal Health Production, 41: 1061-1070.
Krecek, R.C., Michael, L.M., Willingham III, A.L. and Schantz, P.M. 2004. Questionnaire
results from a community-based project on porcine cysticercosis in the Eastern Cape province of South Africa. Southeast Asian Journal of Tropical Medicine, 35(1): 271-274.
Krige, J.E. 1950. The social systems of the Zulus. 2nd ed. Pietermaritzburg: Shuter and
Shooter. Kugonza, D.R. and Mutetikka, D., 2005. Weaning strategies to improve the performance
of sows and their progeny under smallholder farming conditions. South African Journal of Animal Science, 35 (4): 244-248
107
Kumaresan, A., Bujarbaruah, K.M., Pathak, K.A., Chhetri, B., Das, S.K., Das, A. and Ahmed, S.K. 2007. Performance of pigs reared under tradition tribal low input production system and chemical composition of non-conventional tropical plants used as pig feed. Livestock Science, 107: 294-298.
Kumaresan, A., Bujarbaruah, K.M., Pathak, K.A., Das, A. And Bardoloi, R.K. 2009.
Integrated resource-driven pig production systems in a mountainous area of Northeast India: production practices and pig performance. Tropical animal Health Production, 41: 1187-1196.
KwaZulu-Natal Department of Agriculture and Environmental Affairs. 2012a. Vision and
mission. KZNDAEA. [online] Available at: <http://www.kzndae.gov.za/en-za/aboutus/visionmission.aspx> [Accessed 24 October 2012].
KwaZulu-Natal Department of Agriculture and Environmental Affairs. 2012b. Livestock.
KZNDAEA. [online] Available at: <http://www.kzndae.gov.za/en-za/agriculture/programmes/livestock.aspx> [Accessed 24 October 2012].
KwaZulu-Natal Department of Economic Development and Tourism. 2006. Provincial
growth and development strategy . [online] Available at: <http://kznded.gov.za/Portals/o/policies%20and%20legislation/pgds%2017jan07%20without%20maps.pdf.> [Accessed 05 February 2013].
KwaZulu–Natal Department of Economic Development. 2009. Five year strategic plan.
[online] Available at: <http://www.kznded.gov.za/Portals/0/11413%20-%20DED%20Strategic%20Planning%20-%20Tyrone.pdf>[Accessed 05 February 2013]
KwaZulu-Natal Department of Economic Development and Tourism. 2011a. Economic
Developments in brief. [online] Available at: http://www.kznded.gov.za/Portals/0/ Econ%20Developments%20in20%Brief%203rd%20Quater.pdf.[Accessed 05 February 2013].
KwaZulu-Natal Department of Economic Development and Tourism, 2011b. Economic
developments in brief . [online] Available at: <http://www.kznded.gov.za/Portals/0/Econ%20Delopments%20in%20Brief%203rd%20Quater.pdf>
Lekule, F.P. and Kyvsgaard, N.C. 2003. Improving pig husbandry in tropical resource-
poor communities and its potential to reduce risk of porcine cysticercosis. Acta Tropica, 87: 111- 117.
Lemke, U., Kaufmann, B., Thuy, L.T., Emrich, K. And Valle Zárate, A. 2007. Evaluation of
biological and economic efficiency of smallholder pig production systems in North Vietnam. Tropical Animal Health, 39: 237-254.
Lemke, U and Valle Zárate, A. 2008. Dynamics and developmental trends of smallholder pig production systems in North Vietnam. Agricultural Systems, 96: 207-223.
108
Madzimure, J., Chimonyo, M., Zander, K.K. and Dzama, K. 2013. Potential for using indigenous pigs in subsistence-oriented and market-oriented small-scale farming systems of Southern Africa. Tropical Animal Health Production, 45:135-142.
Mafojane, N.A., Appleton, C.C., Krecek, R.C., Michael, L.M. and Willingham III, A.L.
2003. The current status of neurocysticercosis in Eastern and Southern Africa. Acta Tropica, 87: 25-33.
Matata, J.B., Anandajayasekeram, P., Kiriro, F.H., Wandera, E.O. and Dixon, J. 2001.
Farming Systems approach to Technology Development and Transfer. Harare: The Farm Level Applied Research Methods for East and Southern Africa.
Mathers, N., Fox, N and Hunn A. 2009. Surveys and questionnaires. The NIHRD RDS for
the East Midlands/Yorkshire and the Humber. [online] Available at: www.rds-eastmidlands.nihr.ac.uk [Accessed 19 February 2013]
Matthews-Njoku, E.C., Asiabaka, C.C. and Adesope, O.M., 2008. Determinants of pork
consumption among rural households in Rivers State, Nigeria. The Social Sciences 3(4), pp. 341-342.
Mota, D., Ramirez-Necoechea, R., Alonso-Spilsbury, M. and Garcia-Contreras, A.C.
2002. Characterization of the productive performance in family pig farms located in Ayotzingo, State of Mexico. Livestock Research for rural development, 14 (1): 2. [online] Available at http://www.cipav.org.co/lrrd/lrrd14/1/mota141.htm [Accessed 11February 2010].
Mtileni, B.J., Muchadeyi, F.C., Maiwashe, A., Phitsane, P.M., Halimani, T.E., Chimonyo, M. and Dzama, K. 2009. Characterisation of production systems for indigenous chicken genetic resources of South Africa. Applied Animal Husbandry and Rural Development, 2: 18-22.
Muller, N. And May, J. 1987. Upper Tugela baseline data study 1986. Pietermaritzburg:
KwaZulu bureau of Natural Resources. Mutua, F., Arimi, S., Ogara, W., Dewey, C. and Schelling, E. 2010. Farmer perception on
Indigenous pig farming in Kakamega District, western Kenya. Nordic Journal of African Studies, 19(1): 43-57.
Nakai, S. 2012. Pig Domestication Processes: An analysis of varieties of household pig
reproduction control in a Hillside village in northern Thailand. Human Ecology, 40: 145-152.
Nissen, S., Poulsen, I.H., Nejsum, P., Olsen, A., Roepstorff, A., Rubaire-Akiiki, C. and
Thamsborg, S.M. 2011. Prevalence of gastrointestinal nematodes in growing pigs in Kabale District in Uganda. Tropical Animal Health, 43: 567-572.
Nsoso, S.J., Mannathoko, G.G. and Modise, K. 2006. Monitoring production, health and
marketing of indigenous Tswana pigs in Ramotswa village of Botswana. Livestock Research for Rural Development, 18(125) [online] Available at: http://www.lrrd.org/lrrd18/9/nsos18125.htm [Accessed 10 August 2012].
109
Ocampo, L.M., Leterme, P. and Buldgen, A. 2005. A survey of pig production systems in the rain forest of the pacific coast of Colombia. Tropical Animal Health Production, 37: 315-326.
Owen, L.K. 2002. Introduction to Survey Research Design [pdf]: SRL Fall 2002 seminar
series. [online] Available at: http://www.srl.uic.edu [Accessed 19 February 2013] Oxford University Press. 1992. The Concise Oxford Dictionary. New York: Oxford
University Press People’s Guide. 2012. Budget 2012 [pdf] Pretoria: Department of National Treasury.
[online] Available at: <http://www.treasury.gov.za/documents/national%20budget/2012/guides/People’s%20Guide%2012%20-%20English.pdf> [Accessed 20 March 2012]
Peters, D. 1998. Improving small-scale pig production in northern Vietnam. World Animal
Review, 91 (2): 2-13. Peters, D. 2004. Use of sweet potato in pig production in Asia: agricultural and socio-
economic aspects. Pig News and Information, 25 (1): 25N-34N. Petrus, N.P., Mpofu, I., Schneider, M.B. and Nepembe, M. 2011. Livestock Research for
Rural Development, 23(159) [online] Available at:< http://www.lrrd.org/lrrd23/7/petr23159.htm>[Accessed 10 August 2012].
Phengsavanh, P., Ogle, B., Stür, W., Frankow-Lindberg, B.E. and Lindberg, J.A. 2010. Feeding and performance of pigs in smaller-holder production systems in Northern Lao PDR. Tropical animal Health Production, 42, pp.1627-1633.
Pig Breeders Society. 2010. Pig breeders society of South Africa. [online] Available at:
<http://www.studbook.co.za/Pigs/pigbreed/htm>[Accessed 14 September 2010] Phiri, I.K., Ngowi, H., Afonso, S., Matenga, E., Boa, M., Mukaratiwa, S., Githigia, S.,
Saimo, M., Sikasunge, C., Maingi, N., Lubega, G.W., Kassuku, A., Michael, L., Siziya, S., Krecek, R.C, Noormahomed, Vilhena, M., Dorny, P. and Willingham III, A.L. 2003. The emergence of Taenia solium cysticercosis in Eastern and Southern Africa as a serious agricultural problem and public health risk. Acta Tropica, 87, pp.13-23.
Pondja, A., Neves, L., Mlangwa, J., Afonso, S., Fafetine, J., Willingham III, A.L.,
Thamsborg, S.M. and Johansen, M.V. 2010. Prevalence and risk factors of pocine cysticercosis in Angónia, Mozambique. PLoS Neglected Tropical Diseases, 4(2): [online] Available at: < http://www.plonsntds.org/article/info:doi/10.1371/journal.pntd.0000594> [Accessed: 05 July 2012]
Provincial Decision-making Enabling Project. 2005. A profile of KwaZulu-Natal:
Demographics, poverty, inequality and unemployment. [pdf] Elsenburg: National and Provincial Department of Agriculture. [online] Available at: <http://www.elsenburg.com/provide/documents/BP2005_1_5%20Demographics%20KZ.pdf> [Accessed 10 September 2010]
110
Rahman, S. 2007. Adoption of improved technologies by the pig farmers of Aizawl district of Mizoram, India. Livestock Research for Rural Development, 19 (1): [online] Available at http://ww.lrrd.org/lrrd19/1/rahm19005.htm [Accessed 14 January 2010].
Ramsay, K., Smuts, M. and Els, H.C. 2000. Adding value to South African landrace
breeds conservation through utilisation. Agri 2000, 27: 9-15. Robinson, J. and Penrith, M., 2009. Pigs for profit. Menlo Park. South African Pork
Producers. Rukuni, M. 2002. Africa: Addressing growing threats to food security. The Journal of
Nutrition, 132: 3443S-3448S. Rumosa Gwaze, F., Chimonyo, M. and Dzama, K. 2009.Variation in the functions of
village goats in Zimbabwe and South Africa. Tropical Animal Health Production, 41: 1381-1391.
Schönfeldt, H.C. and Gibson, N. 2009. Healthy eating guidelines in the South African
context. Journal of Food Composition and Analysis, 22S: S68-S73. Sciutto, E., Fragoso, G., Fleury, A., Laclette, J.P., Sotelo, J., Aluja, A., Vargas, L. and
Larrade, C. 2000. Taenia solium disease in humans and pigs: an ancient parasitosis disease rooted in developing countries and emerging as a major health problem of global dimensions. Microbes and Infection, 2: 1875-1890.
Shackleton, C.M., Shackleton, S.E., and Cousins, B. 2001. The role of land-based strategies in rural livelihoods: the contribution of arable production, animal husbandry and natural resource harvesting in communal areas in South Africa. Development Southern Africa, 18: 581-604.
Shey-Njila, O., Zoli, P.A., Awah-Ndukum, J., Nguekam, Assana, E., Byambas, P., Dorny,
P., Brandt, J. and Geerts, S. 2003. Porcine cystercercosis in village pigs of North-West Cameroon. Journal of Helminthol, 77: 351-354.
Smith, B. 2006. The Farming Handbook. Pietermaritzburg: CTA and University of
KwaZulu-Natal Press. Steinfeld, H. 2003. Economic constraints on production and consumption of animal
source foods for nutrition in developing countries. The Journal of Nutrition, 133: 4054S-4061S.
Speedy, A.W. 2003. Global production and consumption of animal source foods. The
Journal of Nutrition, 133: 4048S-4053S. Stats SA, 2012. KwaZulu-Natal Census 2011. [Online] Stats SA. Available at: <http://www.statssa.gov.za/census2011/Products/Sg_presentation_kzn.zip> [Accessed 06/11/2012]
Swart, H., Kotze, A., Olivier, P.A.S. and Grobbler, J.P. 2010. Microsatellite-based
characterization of Southern African domestic pigs (Sus scrofa domestica). South African Journal of Animal Science, 40(2): 121-132.
The Natal Witness. 1996. Scholar’s Zulu Dictionary. Pietermaritzburg: The Natal Witness
Printing and Publishing Company (PTY) Ltd.
111
Van Averbeke, W. and Khosa, T.B. 2007. The contribution of smallholder agriculture to the nutrition of rural households in a semi-arid environment in South Africa. In: Nutritional value and water use of indigenous crops for improved livelihoods. Pretoria, 19-20 September. Pretoria: http://wrc.org.za
Van der Zijpp, A.J. 1999. Animal food production: the perspective of human
consumption, production, trade and disease control. Livestock Production Science, 59: 199-206.
Veary, C.M. and Manoto, S.N. 2008. Neurocysticercosis: a possible cause of epileptiform
seizures in people residing in villages served by the Bethanie clinic in the North West Province of South Africa. Journal of the South African Veterinary Association, 79(2): 84-88.
Vilhena, M., Santos, M. and Torgal, J. 1999. Seroprevalence of human cysticercosis in
Maputo, Mozambique. American Journal of Tropical Medicine and Hygiene, 61(1): 59-62.
Waiswa, C., Fèvre, E.M., Nsadha, Z., Sikasunge, C.S. and Willingham III, A.L. 2009.
Porcine Cysticercosis in Southeast Uganda: Seroprevalence in Kamuli and Kaliro Districts. Journal of Parasitology Research, 2009: 1-5.
Walonick, D.S. 2004. Survival Statistics. [online] Available at:
http://www.suu.edu/faculty/wright/nfs4480/surveys.pdf. [Accessed 19 February 2013]
Whittemore, C.T. 1998. The Science and Practice of Pig Production. 2nd ed. Oxford:
Blackwell Science Ltd. Williams, I.H. 2003. Growth of the weaned pigs. In J.R. Pluske, J. Le Dividich and
M.W.A. Verstegen (Eds). 2003. Weaning the pig concepts and consequences. Wageningen: Wagenigen Academic Publishers. Ch.2.
112
THE APPENDIX
KWAZULU-NATAL DEPARTMENT OF AGRICULTURE, ENVIRONMENTAL AFFAIRS AND RURAL DEVELOPMENT
FARMING SYSTEMS RESEARCH QUESTIONNAIRE
Private Bag X6005, Hilton, 3245
Tel: 033 – 3438300
Fax: 033 - 3438417
THE UNTOLD STORY OF THE PIG FARMING SECTOR OF RURAL KWAZULU-NATAL: A CASE STUDY OF UTHUKELA DISTRICT
QUESTIONNAIRE NUMBER .................................................................. INTERVIEWER’S NAME …………………………………………... DATE OF INTERVIEW ...................................................................
A. PROFILE OF STUDY AREA AND THE PARTICIPANTS
1. GENERAL INFORMATION (STUDY AREA)
MUNICIPALITY WARD WHO IS THE INKOSI OF THE AREA GPS CO-ORDINATES OF HOMESTEAD
113
2. DEMOGRAPHIC QUESTIONS (PIG FARMER)
2.1 GENDER FEMALE [ ] MALE [ ]
2.2 HOME LANGUAGE
2.3 OCCUPATION
2.4 LEVEL OF EDUCATION [ ] NO FORMAL EDUCATION [ ] PRIMARY EDUCATION [ ] SECONDARY EDUCATION [ ] COLLEGE EDUCATION [ ] UNIVERSITY EDUCATION
2.5 AGE GROUP IN YEARS [ ] <25 [ ] 25 -35 [ ] 36 – 45 [ ] 46 – 55 [ ] 56 – 65 [ ] >65
3. SIZE OF HOUSEHOLD (FAMILY & PEOPLE RESIDING IN HOUSEHOLD)
AGE GROUP NO. OF MALES NO. OF FEMALES
ADULTS (+16 YEARS)
CHILDREN (< 16 YEARS)
4. HOW MUCH INCOME IS DERIVED FROM THE FOLLOWING SOURCES?
RANDS/MONTH RANDS/YEAR
SALARIES
PENSION (OLD AGE)
CHILD SUPPORT GRANT
DISABILITY GRANT
HOME INDUSTRIES
CROP SALES
114
LIVESTOCK SALES
CONTRIBUTIONS FROM FAMILY MEMBERS, BOARDERS
OTHER (SPECIFY)
B. THE SOCIAL AND ECONOMIC CONTRIBUTION OF PIGS TO HOUSEHOLD
5. ANIMALS AND CROPS FARMED AND LAND AVAILABILITY
5 .1 HOW MUCH LAND DO YOU OWN (HA)……………………………………………
5.2 DO YOU FARM WITH THE FOLLOWING (TICK AS MANY AS APPROPIATE)
BEEF CATTLE
DAIRY CATTLE
GOATS
SHEEP
PIGS
CHICKENS
RABBITS
CRAFT PLANTS
MAIZE
SORGHUM
MEDICINAL PLANTS
POTATOES
SUGAR CANE
FRUIT (IF YES, SPECIFY BELOW)
VEGETABLES (IF YES, SPECIFY BELOW)

115
OTHERS (IF YES, SPECIFY BELOW)
5.3 WHY DO YOU KEEP PIGS (TICK APPROPIATE ANSWERS)?
SELLING TO RAISE INCOME
HOUSEHOLD CONSUMPTION
MANURE
INVESTMENT
OTHER (SPECIFY)
6. MARKETING
6.1 WHICH MARKETING CHANNELS DO YOU USE?
[ ] PENSION POINTS [ ] ABATTOIRS [ ] BUTCHERIES [ ] NEIGHBOURS [ ] OTHER (SPECIFY)
6.2 HOW DO YOU SELL YOUR PIGS? [ ] LIVE [ ] FRESH MEAT [ ] OTHER (EXPLAIN)
6.3 AT WHAT TIME OF THE YEAR DO YOU USUALLY SELL PIGS AND WHY?
…………………………………………………………………………………………………………
…………………………………………………………………………………………………………
…………………………………………………………………………………………………………
…………………………………………………………………………
116
6.4 DO YOU FACE ANY RELIGIOUS OR CULTURAL CHALLENGES WITH REGARD TO KEEPING PIGS AND PIG MARKETING? EXPLAIN.
…………………………………………………………………………………………………………
…………………………………………………………………………………………………………
…………………………………………………………………………………………………………
………………………………………………………………………………………………
7. RANK YOUR FAMILY MEAT CONSUMPTION PREFERENCES (1 – MOST, 3 – AVERAGE AND 6 – LEAST)
WHICH MEAT TYPE DOES YOUR FAMILY CONSUME MOST?
[ ] PORK [ ] BEEF [ ] CHICKEN [ ] MUTTON [ ] CHEVON [ ] OTHER (SPECIFY)
C. PRODUCTION SYSTEMS
8. EXPERIENCE AND PIG TRAINING
8.1 HOW LONG HAVE YOU BEEN FARMING WITH PIGS?
[ ] <1 YEAR [ ] 2 – 5 YEARS [ ] >5 YEARS, SPECIFY
8.2 DID YOUR PARENTS KEEP PIGS? [ ] YES [ ] NO
8.3 IF YES ABOVE, CAN YOU DESCRIBE THE TYPE OF PIGS THEY FARMED WITH
8.4 DID YOU ATTEND ANY PIG TRAINING COURSE ON PIG REARING?
[ ] YES [ ] NO
8.5 IF YES, NAME THE INSTITUTION THAT GAVE THE COURSE
8.6 HOW LONG WAS THE COURSE?
[ ] 1 DAY [ ] 2 – 3 DAYS [ ] 1 WEEK
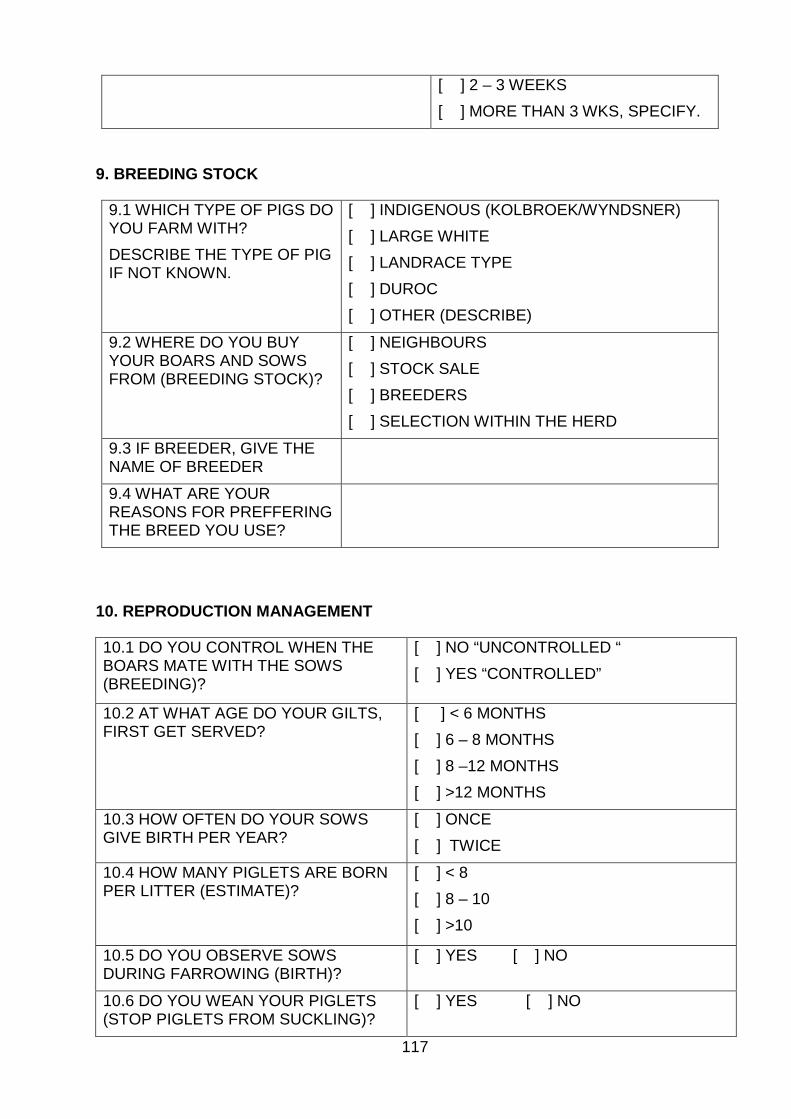
117
[ ] 2 – 3 WEEKS [ ] MORE THAN 3 WKS, SPECIFY.
9. BREEDING STOCK
9.1 WHICH TYPE OF PIGS DO YOU FARM WITH? DESCRIBE THE TYPE OF PIG IF NOT KNOWN.
[ ] INDIGENOUS (KOLBROEK/WYNDSNER) [ ] LARGE WHITE [ ] LANDRACE TYPE [ ] DUROC [ ] OTHER (DESCRIBE)
9.2 WHERE DO YOU BUY YOUR BOARS AND SOWS FROM (BREEDING STOCK)?
[ ] NEIGHBOURS [ ] STOCK SALE [ ] BREEDERS [ ] SELECTION WITHIN THE HERD
9.3 IF BREEDER, GIVE THE NAME OF BREEDER
9.4 WHAT ARE YOUR REASONS FOR PREFFERING THE BREED YOU USE?
10. REPRODUCTION MANAGEMENT
10.1 DO YOU CONTROL WHEN THE BOARS MATE WITH THE SOWS (BREEDING)?
[ ] NO “UNCONTROLLED “ [ ] YES “CONTROLLED”
10.2 AT WHAT AGE DO YOUR GILTS, FIRST GET SERVED?
[ ] < 6 MONTHS [ ] 6 – 8 MONTHS [ ] 8 –12 MONTHS [ ] >12 MONTHS
10.3 HOW OFTEN DO YOUR SOWS GIVE BIRTH PER YEAR?
[ ] ONCE [ ] TWICE
10.4 HOW MANY PIGLETS ARE BORN PER LITTER (ESTIMATE)?
[ ] < 8 [ ] 8 – 10 [ ] >10
10.5 DO YOU OBSERVE SOWS DURING FARROWING (BIRTH)?
[ ] YES [ ] NO
10.6 DO YOU WEAN YOUR PIGLETS (STOP PIGLETS FROM SUCKLING)?
[ ] YES [ ] NO
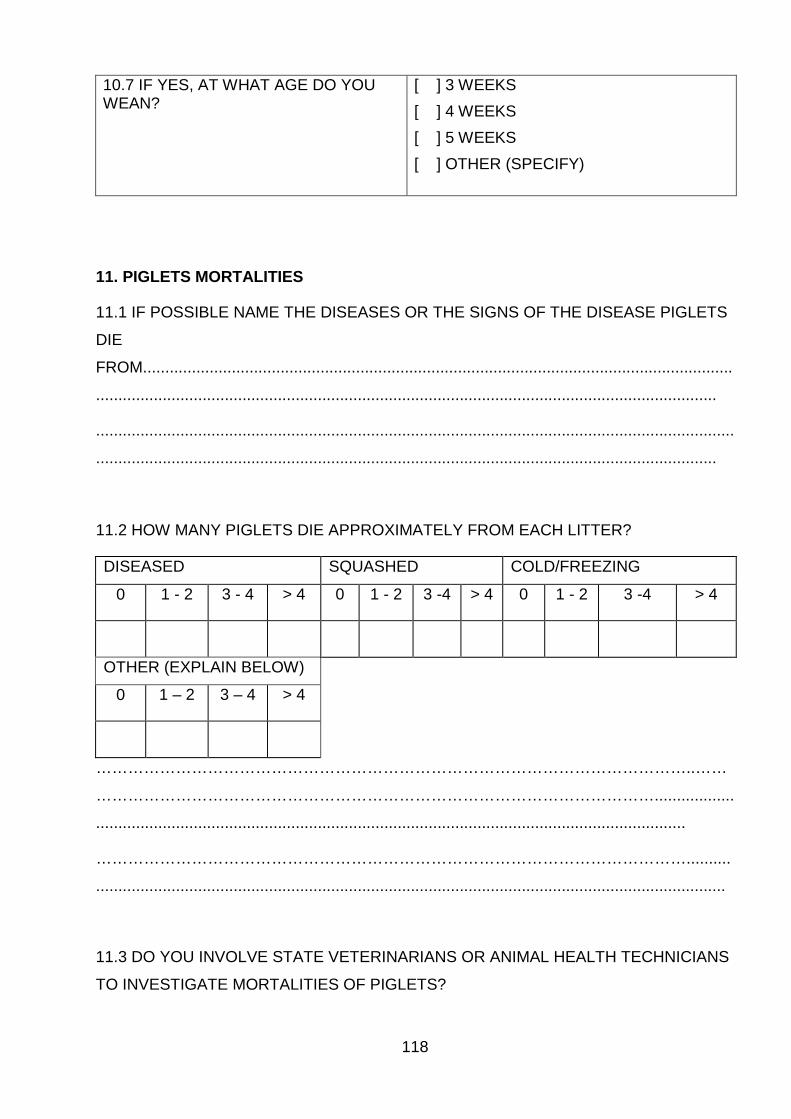
118
10.7 IF YES, AT WHAT AGE DO YOU WEAN?
[ ] 3 WEEKS [ ] 4 WEEKS [ ] 5 WEEKS [ ] OTHER (SPECIFY)
11. PIGLETS MORTALITIES
11.1 IF POSSIBLE NAME THE DISEASES OR THE SIGNS OF THE DISEASE PIGLETS
DIE
FROM.....................................................................................................................................
............................................................................................................................................
................................................................................................................................................
............................................................................................................................................
11.2 HOW MANY PIGLETS DIE APPROXIMATELY FROM EACH LITTER?
DISEASED SQUASHED COLD/FREEZING
0 1 - 2 3 - 4 > 4 0 1 - 2 3 -4 > 4 0 1 - 2 3 -4 > 4
OTHER (EXPLAIN BELOW)
0 1 – 2 3 – 4 > 4
…………………………………………………………………………………………………..……
……………………………………………………………………………………………..................
.....................................................................................................................................
…………………………………………………………………………………………………..........
..............................................................................................................................................
11.3 DO YOU INVOLVE STATE VETERINARIANS OR ANIMAL HEALTH TECHNICIANS
TO INVESTIGATE MORTALITIES OF PIGLETS?

119
YES
NO
11.4 IF NOT, WHY?
…………………………………………………………………………………………………..……
……………………………………………………………………………………………..
12. PIG HOUSING
12.1 WHICH OF THESE BEST DESCRIBES THE WAY YOU REAR YOUR PIGS
[ ] EXTENSIVE - PIGS KEPT OUTDOORS
[ ] INTENSIVE
- PIGS KEPT INDOORS
12.2 IN WHICH OF THESE BEST DESCRIBES THE WAY YOU HOUSE YOUR PIGS?
[ ] BLOCK HOUSES [ ] WOODEN HOUSES [ ] CORRUGATED IRON HOUSES [ ] OPEN ENCLOSURES [ ] MUD [ ] OTHER (SPECIFY)
12.3 FLOOR TYPES INSIDE PENS
[ ] CONCRETE [ ] WOODEN [ ] SOIL [ ] OTHER (SPECIFY)
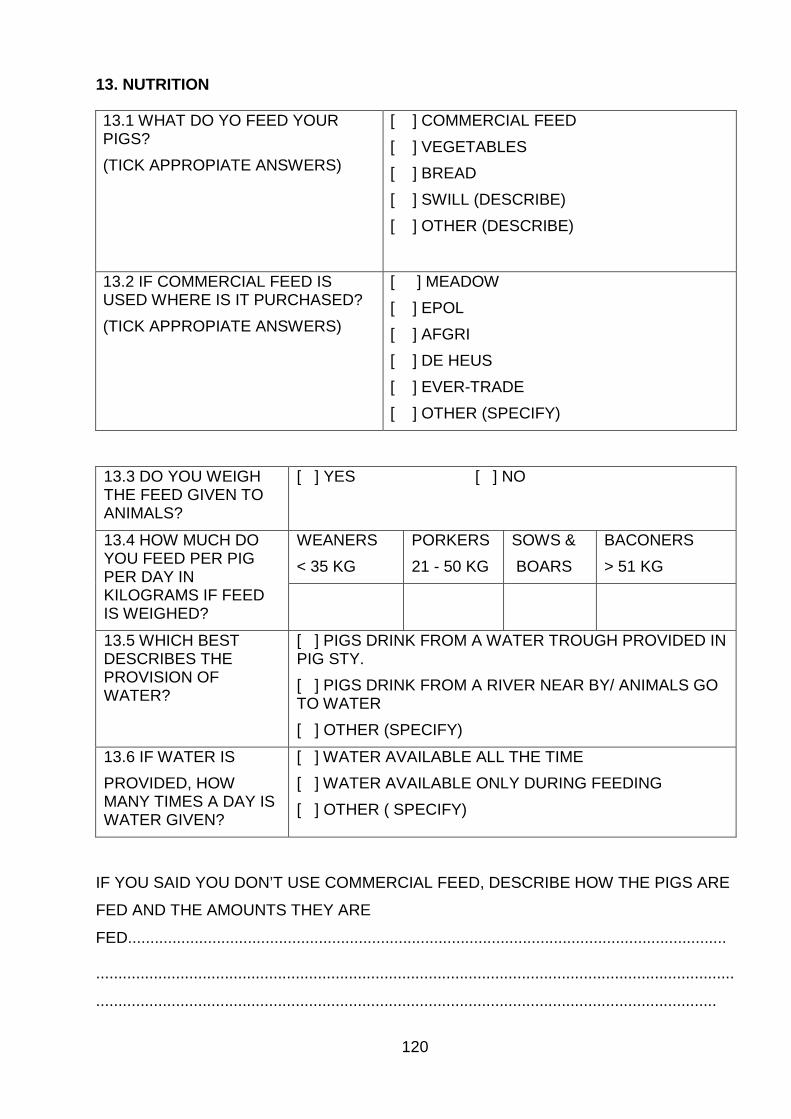
120
13. NUTRITION
13.1 WHAT DO YO FEED YOUR PIGS? (TICK APPROPIATE ANSWERS)
[ ] COMMERCIAL FEED [ ] VEGETABLES [ ] BREAD [ ] SWILL (DESCRIBE) [ ] OTHER (DESCRIBE)
13.2 IF COMMERCIAL FEED IS USED WHERE IS IT PURCHASED? (TICK APPROPIATE ANSWERS)
[ ] MEADOW [ ] EPOL [ ] AFGRI [ ] DE HEUS [ ] EVER-TRADE [ ] OTHER (SPECIFY)
13.3 DO YOU WEIGH THE FEED GIVEN TO ANIMALS?
[ ] YES [ ] NO
13.4 HOW MUCH DO YOU FEED PER PIG PER DAY IN KILOGRAMS IF FEED IS WEIGHED?
WEANERS < 35 KG
PORKERS 21 - 50 KG
SOWS & BOARS
BACONERS > 51 KG
13.5 WHICH BEST DESCRIBES THE PROVISION OF WATER?
[ ] PIGS DRINK FROM A WATER TROUGH PROVIDED IN PIG STY. [ ] PIGS DRINK FROM A RIVER NEAR BY/ ANIMALS GO TO WATER [ ] OTHER (SPECIFY)
13.6 IF WATER IS PROVIDED, HOW MANY TIMES A DAY IS WATER GIVEN?
[ ] WATER AVAILABLE ALL THE TIME [ ] WATER AVAILABLE ONLY DURING FEEDING [ ] OTHER ( SPECIFY)
IF YOU SAID YOU DON’T USE COMMERCIAL FEED, DESCRIBE HOW THE PIGS ARE
FED AND THE AMOUNTS THEY ARE
FED.......................................................................................................................................
................................................................................................................................................
............................................................................................................................................
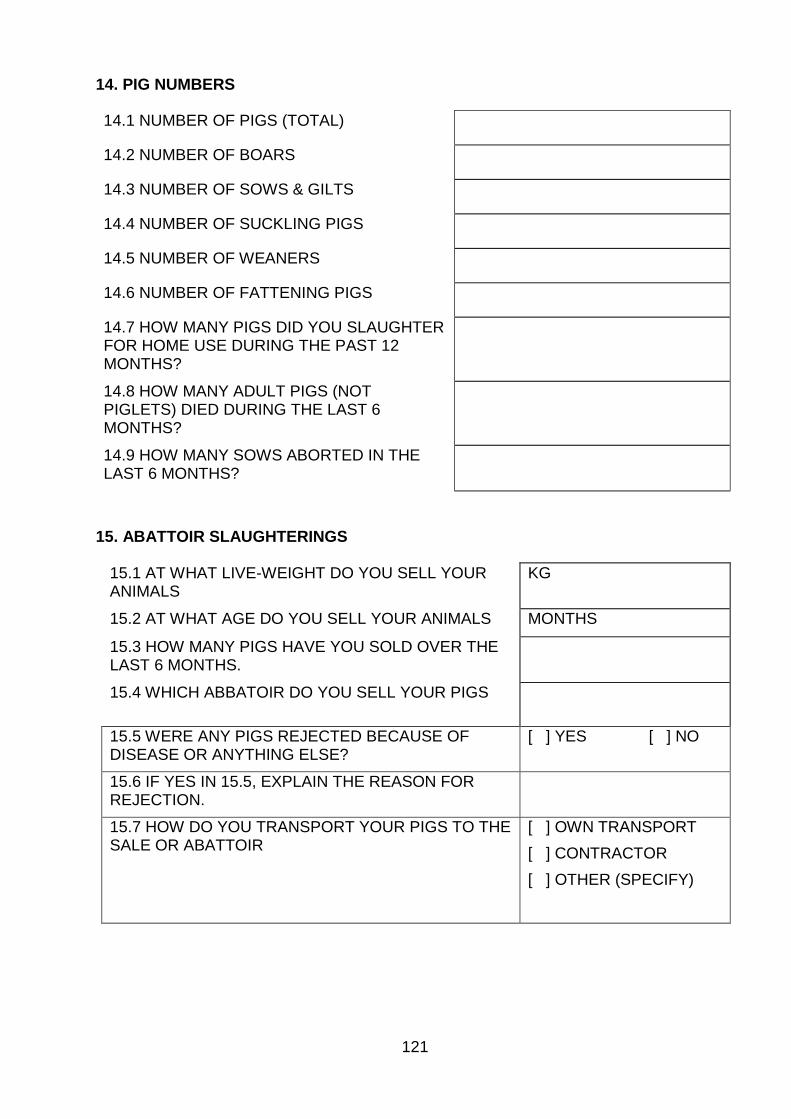
121
14. PIG NUMBERS
14.1 NUMBER OF PIGS (TOTAL)
14.2 NUMBER OF BOARS
14.3 NUMBER OF SOWS & GILTS
14.4 NUMBER OF SUCKLING PIGS
14.5 NUMBER OF WEANERS
14.6 NUMBER OF FATTENING PIGS
14.7 HOW MANY PIGS DID YOU SLAUGHTER FOR HOME USE DURING THE PAST 12 MONTHS?
14.8 HOW MANY ADULT PIGS (NOT PIGLETS) DIED DURING THE LAST 6 MONTHS?
14.9 HOW MANY SOWS ABORTED IN THE LAST 6 MONTHS?
15. ABATTOIR SLAUGHTERINGS
15.1 AT WHAT LIVE-WEIGHT DO YOU SELL YOUR ANIMALS
KG
15.2 AT WHAT AGE DO YOU SELL YOUR ANIMALS MONTHS
15.3 HOW MANY PIGS HAVE YOU SOLD OVER THE LAST 6 MONTHS.
15.4 WHICH ABBATOIR DO YOU SELL YOUR PIGS
15.5 WERE ANY PIGS REJECTED BECAUSE OF DISEASE OR ANYTHING ELSE?
[ ] YES [ ] NO
15.6 IF YES IN 15.5, EXPLAIN THE REASON FOR REJECTION.
15.7 HOW DO YOU TRANSPORT YOUR PIGS TO THE SALE OR ABATTOIR
[ ] OWN TRANSPORT [ ] CONTRACTOR [ ] OTHER (SPECIFY)
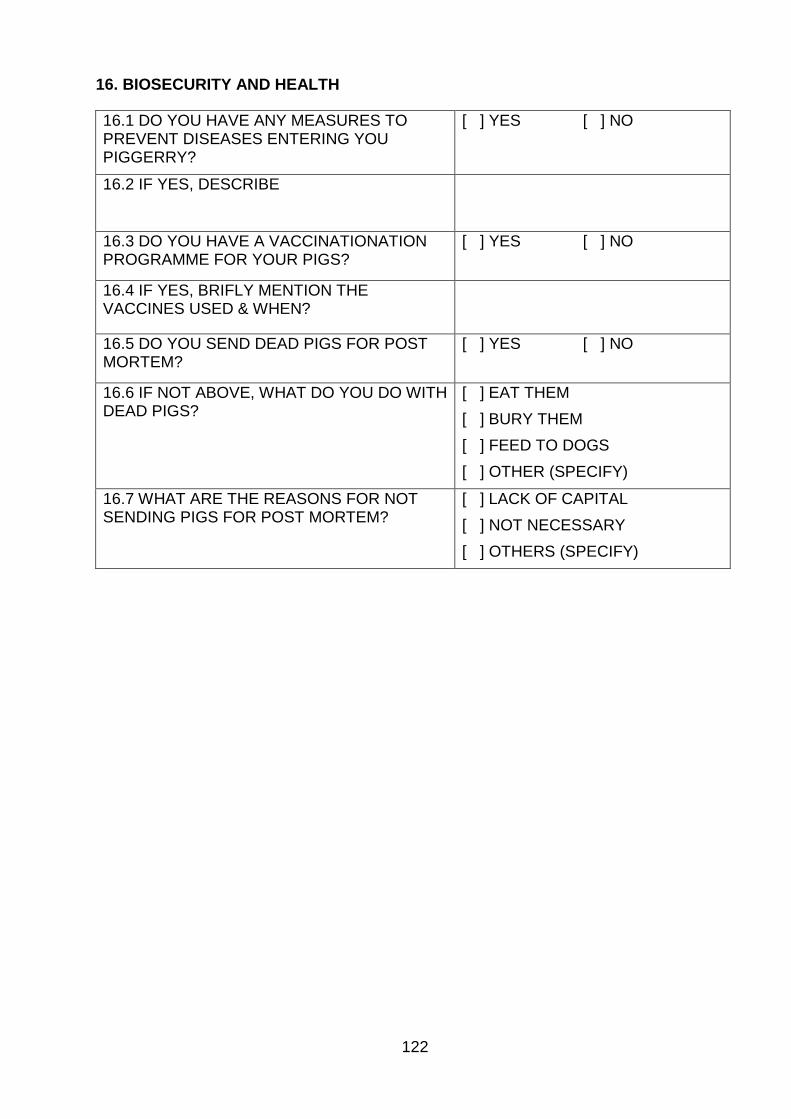
122
16. BIOSECURITY AND HEALTH
16.1 DO YOU HAVE ANY MEASURES TO PREVENT DISEASES ENTERING YOU PIGGERRY?
[ ] YES [ ] NO
16.2 IF YES, DESCRIBE
16.3 DO YOU HAVE A VACCINATIONATION PROGRAMME FOR YOUR PIGS?
[ ] YES [ ] NO
16.4 IF YES, BRIFLY MENTION THE VACCINES USED & WHEN?
16.5 DO YOU SEND DEAD PIGS FOR POST MORTEM?
[ ] YES [ ] NO
16.6 IF NOT ABOVE, WHAT DO YOU DO WITH DEAD PIGS?
[ ] EAT THEM [ ] BURY THEM [ ] FEED TO DOGS [ ] OTHER (SPECIFY)
16.7 WHAT ARE THE REASONS FOR NOT SENDING PIGS FOR POST MORTEM?
[ ] LACK OF CAPITAL [ ] NOT NECESSARY [ ] OTHERS (SPECIFY)