the undrained strength of soft clays determined from ... · zocone test (cptu) performed locally...
TRANSCRIPT

The Undrained Strength of Soft Clays Determinedfrom Unconventional and Conventional Tests
S.G.F.P. Lemos, P.J.M. Pires
Abstract. The laboratory fall cone test, considered an unconventional test, was performed to estimate the undrained shearstrength of undisturbed samples of Brazilian coastal soft clays with different plasticity index values. The undrained shearstrength determined by laboratory fall cone test was compared with the strength determined by conventional field andlaboratory tests commonly used to estimate this parameter in cohesive soils: piezocone test, field vane test, unconfinedcompression test, unconsolidated undrained triaxial compression test and laboratory vane test. The fall cone test undrainedshear strength results presented good agreement with the laboratory vane test strength results and reasonable agreementwith unconfined compression test strength results. The strength results obtained by laboratory tests were compared withthe continuous strength profile estimated from the piezocone test calibrated using the field vane test, and presented goodagreement with fall cone test and laboratory vane test strength results. The normalised undrained shear strength wascompared with some empirical correlations reported in the literature based on plasticity index, being verified somebehaviour similarity.
Keywords: fall cone test, soft clays, undrained shear strength.
1. Introduction
The properties of the soil are crucial to perform ageotechnical engineering design. Estimating geotechnicalparameters is complex because of the difficulty in obtain-ing reliable experimental data and because of the naturalvariability of the subsoil. In soft cohesive soils, the determi-nation of these parameters is considered to be even morecomplex, as it is necessary to understand not only the soilsstrength properties but also its deformability properties andhydraulic conductivity. For short-term stability analyses inthese soils, the undrained shear strength Su is the most im-portant design parameter (Shogaki, 2006).
Many factors affect the shear strength of clays, suchas the types of minerals, humidity, stress history, drainingduring shear, load rate and soil structure, and it is not justifi-able to attempt to attribute a unique shear-strength value toany given clay (Sridharan et al., 1971). Moreover, accord-ing to Lunne et al. (1997b), there is no unique value for Su insitu; this value depends on the mode of rupture, the aniso-tropy of the soil, the deformation rate and the stress history.
The standard tests to determine the shear strength ofsoils are typically classified as either laboratory or fieldtests. Field tests generally supply measurements of the soilstrength that can be acquired more rapidly and in greaterquantity than the measurements afforded by laboratorytests. However, they provide less precise measurementsand, in some cases, are based on empirical correlations(Alshibli et al., 2011).
The conventional tests to determine Su in the labora-tory are unconfined compression test (UCT), unconsoli-dated undrained triaxial compression test (UUT) and labo-ratory vane test (LVT), and in situ are piezocone test(CPTU), field vane test (FVT) and pressuremeter test(Kempfert & Gebreselassie, 2010). Su depends on the test-ing method, among other factors, thus to understand the re-lations between the strengths determined by each test andthe reliability of these determinations is important when Su
is a relevant parameter (Watabe & Tsuchida, 2001).The fall cone test (FCT), considered unconventional
test in many countries, was developed between 1914 and1922 by the Geotechnical Commission of the SwedishState Railways and, compared with other test methods, it isconsidered to be a very simple method, which has led to itsextensive use in Scandinavia (Hansbo, 1957). Although itwas originally developed to estimate the strength of re-moulded cohesive soils, it became widely used as a stan-dard method of determining the liquid limit of clays(Koumoto & Houlsby, 2001), having already been includedin the British, Swedish, Canadian and Japanese standards(Claveveau-Mallet et al., 2012; Feng, 2000; Tanaka et al.,2012).
The present study shows the result of five conven-tional and commonly applied tests for the Su determination -CPTU, FVT, UCT, UUT and LVT - and compares these re-sults with those of the fall cone test (FCT), also known asthe Swedish cone test.
The strength results obtained by laboratory tests werecompared with the strength profile obtained from CPTU
Soils and Rocks, São Paulo, 40(3): 291-301, September-December, 2017. 291
Silvia Gomes Fernandes Polido Lemos, Ph.D. Student, Programa de Pós-Graduação em Engenharia Civil, COPPE, Universidade Federal do Rio de Janeiro, Rio de Janeiro, RJ,Brazil. e-mail: [email protected] J.M. Pires, D.Sc., Associate Professor, Departamento de Engenharia Civil, Universidade Federal do Espírito Santo, Vitória, ES, Brazil. e-mail: [email protected] on September 11, 2016; Final Acceptance on November 24, 2017; Discussion open until April 30, 2018.DOI: 10.28927/SR.403291

with the cone factors (Nkt and N�u) calibrated using the FVT,
considered a referential test to obtain reliable values of Su
(Schnaid & Odebrecht, 2012). The CPTU was adopted be-cause it supplies a continuous profile of Su. Also it has astrong theoretical foundation and several well-known andcomprehensive publications are available concerning its in-terpretation (Robertson, 2009).
This study also compares the normalised undrainedshear strength results with some empirical correlationsreported in the literature based on the plasticity index(IP).
2. Materials and Methods
2.1. Soil
The investigated site is located in the city of VilaVelha, Espirito Santo State, in the coastal region ofBrazil, near to Rio de Janeiro, composed of recent flu-vial, fluvial-marine and fluvial-lacustrine sediments.The soft clay deposits in Brazil found all along the coast-
line were originated in the Quaternary period. The localsubsoil was formed by cycles of erosion and sedimenta-tion which occurred during periods of regression andtransgression of sea level, between the Pleistocene,123000 years ago, and the Holocene, 5100 years beforepresent (Suguio, 2010).
The investigated deposit is formed of a thick layer ofsoft clay, situated in an area near to a highway constructionsite, whose subsoil underwent rupture during the embank-ment operations. Standard penetration tests (SPT) and pie-zocone test (CPTU) performed locally indicate that the site(Fig. 1) is composed of a subsurface layer of a very soft or-ganic clay, with water level 0.50 m below the surface, overa layer of very soft marine clay with thickness of 15.0 m,followed by a layer of sand. Fig. 1 also presents the claylayer SPT blow count (Nvalue) of zero values, low values of qt
and fs, obtained from CPTU, and water content (wn) valuesabove the liquid limits (wL) determined by characterizationtests in SPT samples.
292 Soils and Rocks, São Paulo, 40(3): 291-301, September-December, 2017.
Lemos & Pires
Figure 1 - Typical geotechnical profile.

2.2. Testing program
Piezocone test (CPTU) and field vane tests (FVT)were performed near to the Standard Penetration Test loca-tion whose results are indicated in Fig. 1. CPTU was per-formed between the depths of 0.50 and 20.0 m, with threedissipation tests being performed at depths of 6, 7 and 12 m.At depths between 7.0 and 12.0 were performed the fieldvane tests (FVT) and also collected six undisturbed sam-ples. The sampling procedures, packaging and transport ofthe undisturbed samples followed the requirements of theBrazilian standard ABNT (1997).
The laboratory testing program comprised 24 fallcone tests (FCT), 12 vane tests (LVT), 6 unconfined com-pression tests (UCT) and 6 unconsolidated undrained tria-xial tests (UUT).
The undisturbed sampling tubes were segmented asillustrated in Fig. 2, allowing the FCT tests to be performedon the faces of all segments. The FCT and LVT were per-formed with the soil sample kept in the segmented sam-pling tube. Subsequently the sample was extracted formoulding the specimens to UUT, UCT and oedometer(OCT) tests.
2.3. Fall cone test (FCT)
The test consists of dropping a standard cone onto thesoil under its own weight and after 5 seconds measuring thepenetration depth of the cone into the soil. From the pene-tration depth, the undrained shear strength in both undis-turbed (Su) and remoulded (Sur) conditions can be estimatedby the following equation:
S KW
du FCT( ) �
2(1)
where W is the mass of the cone in grams, d is the penetra-tion depth of the cone in the soil in units of mm, and K is an
empirical constant that depends on the cone tip angle (�)and on the cone roughness (�).
Hansbo (1957) estimated the value of K by compar-ing the FCT results with FVT and LVT, with K equal to 1.0and 0.30 for cone angles of 30° and 60°, respectively, thatare used in the Canadian standard CAN (2006) to estimateSu and Sur (Claveveau-Mallet et al., 2012). Wood (1985apud 1990) found K mean values of 0.85 and 0.29 for conesangles of 30° and 60°, respectively, by comparing resultsbetween FCT and LVT. The European standard ISO (2004)indicates K values of 0.80 to 1.0 for cone angle of 30° and0.27 for 60°.
Houlsby (1982) has presented a theoretical analysisof the cone test for strengths in the same range as those thathave already been determined empirically. This analysis re-inforces the use of empirical correlations and the relevanceof certain variables in the determination of the constant K,such as the cone tip angle and its roughness.
Koumoto & Houlsby (2001) have analysed the conepenetration mechanism into the soil, introducing the con-cept of dynamic strength for static results. They comparedtheir theoretical K values with those obtained experimen-tally by other authors, concluding that there was goodagreement in the results obtained for a cone with an angle of60°, whereas for a 30° cone, the theoretical values wereslightly higher than those obtained experimentally.
The fall cone tests were performed on the faces of thesoil sample kept in the segmented sampling tube followingthe recommendations of the European standard ISO (2004).The cone has a weight (W) of 80 g, a cone tip angle of 30°and a mean roughness of 0.4 �m. Five measurements of thedepth (d) were performed on each face of the segmentedsample indicated in Fig. 2, keeping at least 25 mm distancebetween each point and from the edge of the sampler. Mea-surements higher than 10% of the mean value were ex-
Soils and Rocks, São Paulo, 40(3): 291-301, September-December, 2017. 293
The Undrained Strength of Soft Clays Determined from Unconventional and Conventional Tests
Figure 2 - Undisturbed sampling tubes segmentation for laboratory tests. Values in mm.
cluded from the estimate of Su and a K value 0.80 wasadopted, as recommended by the standard ISO (2004).
2.4. Conventional laboratory tests
2.4.1. Laboratory vane test (LVT)
The procedure to perform the LVT followed the rec-ommendations of the American standard ASTM (2010), in-cluding those concerning the calibration of the springs. Thevane has a height of 25.4 mm and a diameter of 12.7 mm,corresponding to the 2:1 ratio that is recommended to re-duce the effects of the anisotropy on the shear strength. Thevane was inserted into the soil sample kept in the seg-mented sampling tube, with a depth equal to twice itsheight, for measuring undisturbed strength (Su). Two testswere performed for each segmented samples indicated inFig. 2 in opposite faces. The remoulded conditions werecreated after the peak strength was reached. So the vanewas manually rotated by ten complete turns, and the testwas then repeated. The Su and Sur values were estimatedbased on the following equation, for the height of the vanebeing twice the diameter:
ST
Du LVT( ) .� 086
3�(2)
where T is the maximum torque applied by the spring and Dis the diameter of the vane in consistent units with strength.The relationship between vane torque T and spring deflec-tion measurement in the test was established through thecalibration procedure.
2.4.2. Unconfined compression test (UCT)
The UCT was performed following the recommenda-tions of the American standard ASTM (2006). Specimenswere moulded for each segmented sampling tube indicatedin Fig. 2, except for sampling from 7.0 m depth that washighly fissured and was discarded. They were preparedwith a constant height to diameter ratio of 2 and unconfinedcompression tests with controlled strain were performed.The Su(UCT) value was calculated as half of the unconfinedcompression strength (qu).
2.4.3. Unconsolidated Undrained Triaxial CompressionTest (UUT)
The UUT was performed in accordance with the rec-ommendations of the American standard ASTM (2003).Specimens were moulded for each segmented samplingtube indicated in Fig. 2 with a constant height to diameterratio of 2 and wrapped in a membrane. The specimen wasinserted into a triaxial cell for the application of confiningpressure followed by the application of an axial load. TheSu(UUT) value was calculated as half of the deviator stress (�d),calculated without correction for membrane effects.
2.5. Conventional in situ tests
2.5.1. Field vane test (FVT)
The field vane tests were performed in accordancewith the Brazilian standard ABNT (1989) using a steel vaneretracted in the protective shoe for advancement withoutpre-drilling and the instrument is equipped with slip cou-pling. The vane prescribed by the Brazilian standard has adiameter of 65 mm, a height of 130 mm, and a vane thick-ness of 2 mm. The vane retracted in the protective shoe wasinserted into the soil and once the desired depth wasreached, it was pushed into the soil 0.50 m from the lowerpart of the protective shoe. Immediately was applied torqueat a speed of 6 0.6°/min and the torque curve vs. the ap-plied rotation was recorded to determinate Su. The remoul-ded conditions were created by rotating the vane rapidlythrough ten revolutions and the test repeated to determineSur. The Su(FVT) and Sur(FVT) values were estimated using Eq. 2,where T is the maximum value of torque corrected for rodfriction measured by slip coupling.
2.5.2. Piezocone test (CPTU)
The cone test with porewater pressure measurementswas performed following the recommendations of theAmerican standard ASTM (2012). The penetrometer has across section area of 10 cm2 and the filter element locatedat the base (measurement of u2). The penetration was per-formed at a constant speed of 20 5 mm/s, taking auto-matic measurements of the following parameters: coneresistance (qc), friction sleeve resistance (fs) and porewaterpressure (u2). The corrected cone total resistance (qt) wascalculated using the following equation:
q q u at c n� �2 1( ) (3)
where an is the ratio between the areas obtained through cal-ibration, which, in this case, was equal to 0.75.
A large number of studies concerning the interpreta-tion of the CPTU to obtain the undrained strength of clayscan be found in the literature, representing two different in-terpretation approaches: one based on theoretical solutionsand another based on empirical correlations, generally pre-ferred as reported by Lunne et al. (1997b). The empiricalapproaches estimate Su by three empirical cone factors, Nkt,N
�u and Nke, generally used in combination with FVT databeing given by the following equations (Danziger &Schnaid, 2000):
Sq
Nu CPTUt vo
kt FVT
( )
( )
( )�
� �(4)
Su u
Nu CPTU
u FVT
( )
( )
( )�
�2 0
�
(5)
Sq u
Nu CPTUt
ke FVT
( )
( )
( )�
� 2 (6)
294 Soils and Rocks, São Paulo, 40(3): 291-301, September-December, 2017.
Lemos & Pires
In geotechnical engineering practice in Brazil, Eq. 4is more used (Danziger & Schnaid, 2000; Almeida & Mar-ques, 2014; Coutinho & Schnaid, 2010). In very soft clays,the Eq. 5 has more accuracy in u2 and u0 measurements thanqt (Robertson & Cabal, 2015).
3. Results and Discussion
3.1. Field test results
The undisturbed and remoulded strengths obtainedthrough the field vane test (FVT) are presented in Table 1.According to Skempton & Northey (1952) classification,the soil deposit can be considered sensitive.
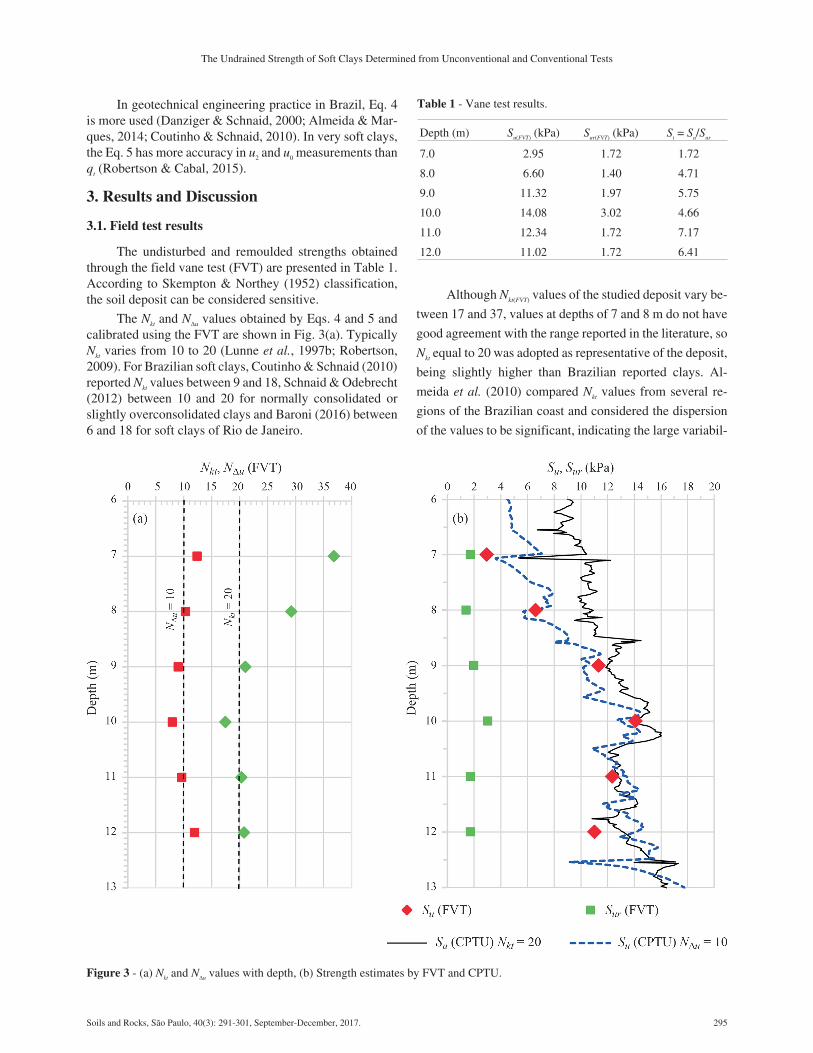
The Nkt and N�u values obtained by Eqs. 4 and 5 and
calibrated using the FVT are shown in Fig. 3(a). TypicallyNkt varies from 10 to 20 (Lunne et al., 1997b; Robertson,2009). For Brazilian soft clays, Coutinho & Schnaid (2010)reported Nkt values between 9 and 18, Schnaid & Odebrecht(2012) between 10 and 20 for normally consolidated orslightly overconsolidated clays and Baroni (2016) between6 and 18 for soft clays of Rio de Janeiro.
Although Nkt(FVT) values of the studied deposit vary be-
tween 17 and 37, values at depths of 7 and 8 m do not have
good agreement with the range reported in the literature, so
Nkt equal to 20 was adopted as representative of the deposit,
being slightly higher than Brazilian reported clays. Al-
meida et al. (2010) compared Nkt values from several re-
gions of the Brazilian coast and considered the dispersion
of the values to be significant, indicating the large variabil-
Soils and Rocks, São Paulo, 40(3): 291-301, September-December, 2017. 295
The Undrained Strength of Soft Clays Determined from Unconventional and Conventional Tests
Figure 3 - (a) Nkt and N�u values with depth, (b) Strength estimates by FVT and CPTU.
Table 1 - Vane test results.
Depth (m) Su(FVT) (kPa) Sur(FVT) (kPa) St = Su/Sur
7.0 2.95 1.72 1.72
8.0 6.60 1.40 4.71
9.0 11.32 1.97 5.75
10.0 14.08 3.02 4.66
11.0 12.34 1.72 7.17
12.0 11.02 1.72 6.41
ity of the Brazilian coast soils and the importance of esti-mating the Nkt value for each deposit.
Roberson & Cabal (2015) reported N�u values be-
tween 4 and 10. For Brazilian soft clays, Coutinho &Schnaid (2010) reported N
�u values between 7 and 9.5 andCoutinho & Bello (2014) between 7.5 and 11 for Recife softclays. N
�u(FVT) equal to 10 was adopted as representative ofthe deposit, being similar to Brazilian reported clays.
Figure 3(b) shows the undrained shear strength valuesestimated by in situ tests. The Su estimate from CPTU usedthe adopted cone factors Nkt and N
�u, respectively, equal to20 and 10. From 9.0 m depth there was a good agreementbetween the Su(CPTU) estimates by the two cone factors andbetween Su(CPTU) and Su(FVT) estimates.
3.2. Laboratory test results
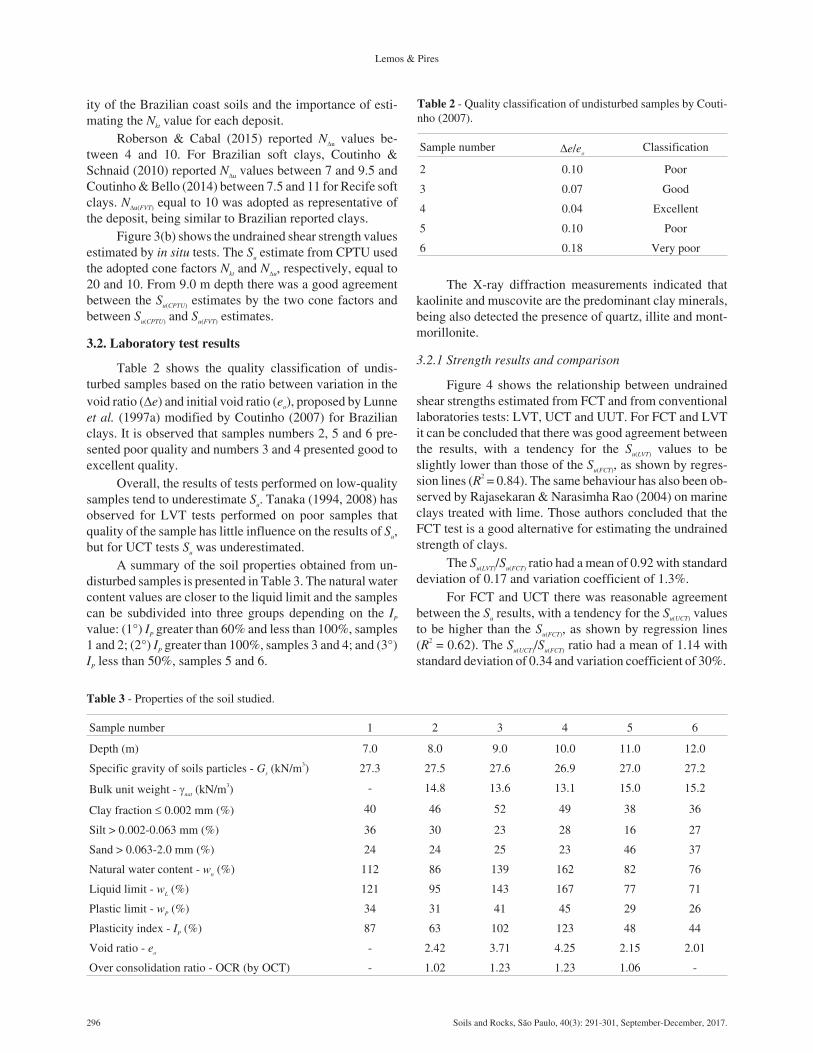
Table 2 shows the quality classification of undis-turbed samples based on the ratio between variation in thevoid ratio (�e) and initial void ratio (eo), proposed by Lunneet al. (1997a) modified by Coutinho (2007) for Brazilianclays. It is observed that samples numbers 2, 5 and 6 pre-sented poor quality and numbers 3 and 4 presented good toexcellent quality.
Overall, the results of tests performed on low-qualitysamples tend to underestimate Su. Tanaka (1994, 2008) hasobserved for LVT tests performed on poor samples thatquality of the sample has little influence on the results of Su,but for UCT tests Su was underestimated.
A summary of the soil properties obtained from un-disturbed samples is presented in Table 3. The natural watercontent values are closer to the liquid limit and the samplescan be subdivided into three groups depending on the IP
value: (1°) IP greater than 60% and less than 100%, samples1 and 2; (2°) IP greater than 100%, samples 3 and 4; and (3°)IP less than 50%, samples 5 and 6.
The X-ray diffraction measurements indicated thatkaolinite and muscovite are the predominant clay minerals,being also detected the presence of quartz, illite and mont-morillonite.
3.2.1 Strength results and comparison
Figure 4 shows the relationship between undrainedshear strengths estimated from FCT and from conventionallaboratories tests: LVT, UCT and UUT. For FCT and LVTit can be concluded that there was good agreement betweenthe results, with a tendency for the Su(LVT) values to beslightly lower than those of the Su(FCT), as shown by regres-sion lines (R2 = 0.84). The same behaviour has also been ob-served by Rajasekaran & Narasimha Rao (2004) on marineclays treated with lime. Those authors concluded that theFCT test is a good alternative for estimating the undrainedstrength of clays.
The Su(LVT)/Su(FCT) ratio had a mean of 0.92 with standarddeviation of 0.17 and variation coefficient of 1.3%.
For FCT and UCT there was reasonable agreementbetween the Su results, with a tendency for the Su(UCT) valuesto be higher than the Su(FCT), as shown by regression lines(R2 = 0.62). The Su(UCT)/Su(FCT) ratio had a mean of 1.14 withstandard deviation of 0.34 and variation coefficient of 30%.
296 Soils and Rocks, São Paulo, 40(3): 291-301, September-December, 2017.
Lemos & Pires
Table 2 - Quality classification of undisturbed samples by Couti-nho (2007).
Sample number �e/eoClassification
2 0.10 Poor
3 0.07 Good
4 0.04 Excellent
5 0.10 Poor
6 0.18 Very poor
Table 3 - Properties of the soil studied.
Sample number 1 2 3 4 5 6
Depth (m) 7.0 8.0 9.0 10.0 11.0 12.0
Specific gravity of soils particles - Gs (kN/m3) 27.3 27.5 27.6 26.9 27.0 27.2
Bulk unit weight - �nat (kN/m3) - 14.8 13.6 13.1 15.0 15.2
Clay fraction 0.002 mm (%) 40 46 52 49 38 36
Silt > 0.002-0.063 mm (%) 36 30 23 28 16 27
Sand > 0.063-2.0 mm (%) 24 24 25 23 46 37
Natural water content - wn (%) 112 86 139 162 82 76
Liquid limit - wL (%) 121 95 143 167 77 71
Plastic limit - wP (%) 34 31 41 45 29 26
Plasticity index - IP (%) 87 63 102 123 48 44
Void ratio - eo - 2.42 3.71 4.25 2.15 2.01
Over consolidation ratio - OCR (by OCT) - 1.02 1.23 1.23 1.06 -

Tanaka et al. (2012) have compared Su data estimatedby UCT and FCT from four sites that have been extensivelyinvestigated in Japan (Atsuma, Takuhofu, Y-Ariake, &H-Osaka). These sites exhibit different characteristics butsimilar undrained shear strengths, varying between 20 and80 kPa. In this study, the author recognised a tendency forthe Su(UCT) values to be lower than the Su(FCT), except for theY-Ariake site. It was observed that the differences couldnot be attributed to the quality of the samples, consistentwith the study of Horng et al. (2011), which concluded thatthe effects of disturbances in the samples are similar forUCT and FCT.
Unexpectedly, the UUT results did not demonstrategood agreement with the FCT, as shown by regression lines(R2 = -0.85). And the Su(UUT)/Su(FCT) ratio had a mean of 1.51 withstandard deviation of 0.51 and a variation coefficient of 34%.
Figure 5 shows the correlation between undrainedshear strengths estimated from FCT and conventional insitu tests: FVT and CPTU. For these correlations there wasobserved larger discrepancy between Su results and it wasnot possible to establish an adequate linear regression.
The Su(FVT)/Su(FCT) ratio had a mean of 0.92 with standarddeviation of 0.49 and variation coefficient of 53%. Despitethe larger discrepancy, it was observed a tendency for theSu(FCT) values to be higher than the Su(FVT) values, similarly toTanaka et al. (2012) results.
The Su(CPTU-Nkt)/Su(FCT) ratio had a mean of 1.25 with stan-dard deviation of 0.52 and variation coefficient of 41%.The Su(CPTU-N�u)/Su(FCT) ratio had a mean of 1.11 with standarddeviation of 0.59 and variation coefficient of 53%.
It is difficult to judge whether variation in soil proper-ties is caused by human factors or by the natural variabilityin the properties (Tanaka, 2008). The discrepancy observedin Figs. 4 and 5 can be considered to be predominantly at-tributable to the disturbance of the samples, as their qualitywas generally classified as poor. However, others impor-tant factors were observed in the samples and should beconsidered, such as the large vertical variability, indicatedby liquid limit variations, the presence of shells (Fig. 6a),concretionary materials (Fig. 6b) and thin layers of sandand mica (Fig. 6c). These factors may have influenced the
Soils and Rocks, São Paulo, 40(3): 291-301, September-December, 2017. 297
The Undrained Strength of Soft Clays Determined from Unconventional and Conventional Tests
Figure 4 - Correlation between Su values from FCT and conven-tional laboratory tests (LVT, UCU and UUT).
Figure 5 - Correlation between Su values from FCT and conven-tional in situ tests (FVT and CPTU).
Figure 6 - Samples variability: (a) shells, (b) concretionary material and (c) layers of fine sand and mica.

laboratory test results, particularly the FCT and LVT, andare also an indicative of horizontal variability.
Figure 7 may help to understand the larger discrep-ancy between Su results presented in Fig. 5. It is observedthat Su estimated by CPTU ranged between 3.6 kPa to17.6 kPa with considerable variations at certain depths,such as between 7.0 and 7.2 m. For correlations presentedin Fig. 7, the mean value of Su(CPTU) in 1.0 m range was con-sidered, thus it was not possible to verify by this analysis ifthere was good agreement between the FCT and CPTU re-sults.
Despite the heterogeneity of the deposit and discard-ing the very discrepant values of Su(UCT) and Su(UUT), it can bevisually observed in Fig. 7 that between the depths of 7.0and 11.0 m there is a good agreement between the labora-tory Su results and Su(CPTU) estimated with Nkt cone factor. Be-tween depths of 11.0 and 13.0 m the Su(FCT) and Su(LVT) do notpresent good agreement with Su(CPTU). These samples pre-sented the lowest plasticity index (mean of 46) and thehighest percentage of sand (mean of 42%). Maybe a drai-ned behaviour can explain this greater variation among theSu results. Larsson et al. (1987) observed that Su(FCT) valuesmeasured in specimens from greater depths than 10 and15 m are often too low and the same behaviour occurs inclays of low plasticity and high sensitivity, which also canexplain the lower Su(FCT) results between depths of 11.0 and13.0 m.
3.2.2. Empirical correlations
Attempts to develop simple methods for estimatingthe undrained shear strength of soils based on physical indi-ces, such as correlations based on plasticity index, havebeen conducted since the beginning of Soil Mechanics(Kempfert & Gebreselassie, 2010). However, several of themost well-known empirical correlations were establishedusing data from soils obtained in countries of northern Eu-rope and America, where the sediments were strongly in-fluenced by the glaciers of the ice age period (Tanaka,2000; Tanaka et al., 2001).
Although the correlations developed in a given geo-logical context are not universally applicable and should be
used with caution, as well as be calibrated locally (Larsson
& Ahnberg, 2005; Leroueil et al., 2001), empirical correla-
tions between the undrained shear strength (Su) and the
plasticity index (IP) can be used to support and complement
strength determinations (Larsson et al., 1987). Some of
these correlations are presented in Table 4.
298 Soils and Rocks, São Paulo, 40(3): 291-301, September-December, 2017.
Lemos & Pires
Figure 7 - Undrained shear strength estimated by conventionaland unconventional tests.
Table 4 - Empirical correlations between normalised Su and IP (adapted from Kempfert & Gebreselassie, 2010).
Equation Reference Applicability
Su/�’vo = 0.0037IP + 0.11 Skempton (1957) NC soils, IP > 10%
Su/�’P = 0.0024IP + 0.2 Leroueil et al. (1983) Clays from eastern Canada, IP < 60%
Su/�’P = 0.003IP + 0.14 Lambe & Whitman (1969) All clays
Su/�’P = 0.45(IP/100)1/2 Bjerrum & Simons (1960) NC clays
Su/�’P = 0.22 Mesri (1975) Soft clays
Su/�’P = 0.0043IP + 0.129 Wroth & Houlsby 1985 NC clays
�’vo: initial effective vertical stress; �’p: preconsolidation stress.
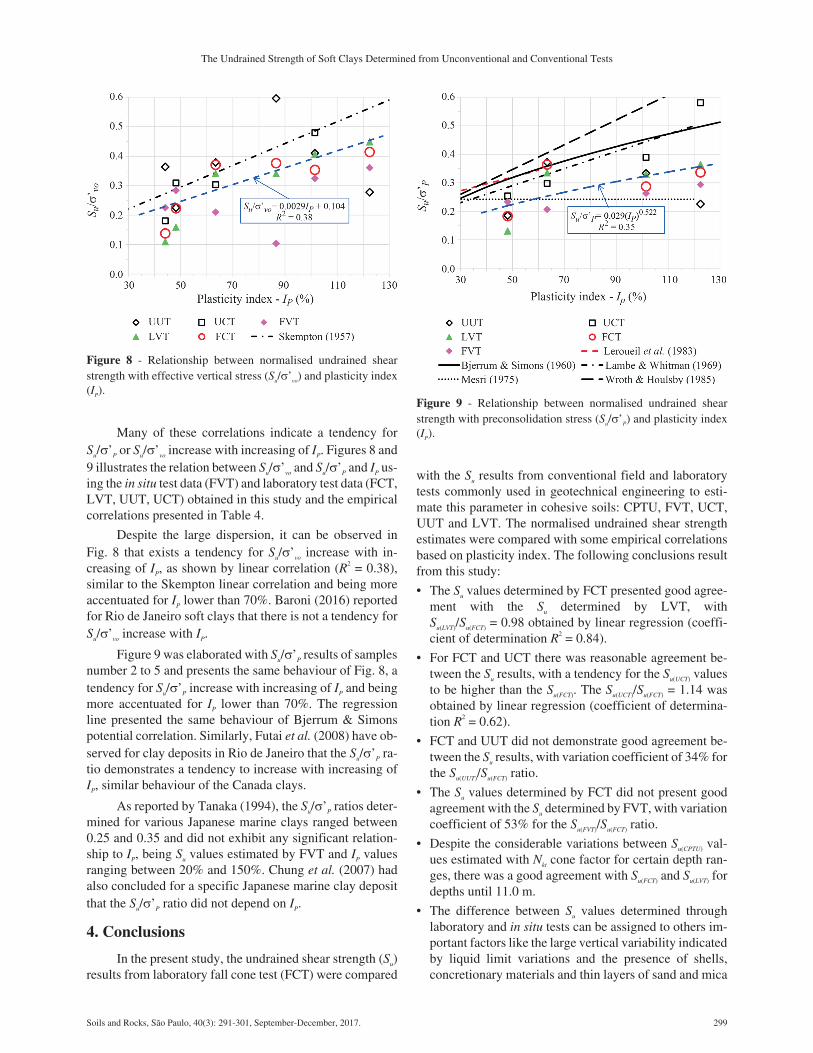
Many of these correlations indicate a tendency forSu/�’P or Su/�’vo increase with increasing of IP. Figures 8 and9 illustrates the relation between Su/�’vo and Su/�’P and IP us-ing the in situ test data (FVT) and laboratory test data (FCT,LVT, UUT, UCT) obtained in this study and the empiricalcorrelations presented in Table 4.
Despite the large dispersion, it can be observed inFig. 8 that exists a tendency for Su/�’vo increase with in-creasing of IP, as shown by linear correlation (R2 = 0.38),similar to the Skempton linear correlation and being moreaccentuated for IP lower than 70%. Baroni (2016) reportedfor Rio de Janeiro soft clays that there is not a tendency forSu/�’vo increase with IP.
Figure 9 was elaborated with Su/�’P results of samplesnumber 2 to 5 and presents the same behaviour of Fig. 8, atendency for Su/�’P increase with increasing of IP and beingmore accentuated for IP lower than 70%. The regressionline presented the same behaviour of Bjerrum & Simonspotential correlation. Similarly, Futai et al. (2008) have ob-served for clay deposits in Rio de Janeiro that the Su/�’P ra-tio demonstrates a tendency to increase with increasing ofIP, similar behaviour of the Canada clays.
As reported by Tanaka (1994), the Su/�’P ratios deter-mined for various Japanese marine clays ranged between0.25 and 0.35 and did not exhibit any significant relation-ship to IP, being Su values estimated by FVT and IP valuesranging between 20% and 150%. Chung et al. (2007) hadalso concluded for a specific Japanese marine clay depositthat the Su/�’P ratio did not depend on IP.
4. Conclusions
In the present study, the undrained shear strength (Su)results from laboratory fall cone test (FCT) were compared
with the Su results from conventional field and laboratorytests commonly used in geotechnical engineering to esti-mate this parameter in cohesive soils: CPTU, FVT, UCT,UUT and LVT. The normalised undrained shear strengthestimates were compared with some empirical correlationsbased on plasticity index. The following conclusions resultfrom this study:
• The Su values determined by FCT presented good agree-ment with the Su determined by LVT, withSu(LVT)/Su(FCT) = 0.98 obtained by linear regression (coeffi-cient of determination R2 = 0.84).
• For FCT and UCT there was reasonable agreement be-tween the Su results, with a tendency for the Su(UCT) valuesto be higher than the Su(FCT). The Su(UCT)/Su(FCT) = 1.14 wasobtained by linear regression (coefficient of determina-tion R2 = 0.62).
• FCT and UUT did not demonstrate good agreement be-tween the Su results, with variation coefficient of 34% forthe Su(UUT)/Su(FCT) ratio.
• The Su values determined by FCT did not present goodagreement with the Su determined by FVT, with variationcoefficient of 53% for the Su(FVT)/Su(FCT) ratio.
• Despite the considerable variations between Su(CPTU) val-ues estimated with Nkt cone factor for certain depth ran-ges, there was a good agreement with Su(FCT) and Su(LVT) fordepths until 11.0 m.
• The difference between Su values determined throughlaboratory and in situ tests can be assigned to others im-portant factors like the large vertical variability indicatedby liquid limit variations and the presence of shells,concretionary materials and thin layers of sand and mica
Soils and Rocks, São Paulo, 40(3): 291-301, September-December, 2017. 299
The Undrained Strength of Soft Clays Determined from Unconventional and Conventional Tests
Figure 8 - Relationship between normalised undrained shearstrength with effective vertical stress (Su/�’vo) and plasticity index(IP).
Figure 9 - Relationship between normalised undrained shearstrength with preconsolidation stress (Su/�’P) and plasticity index(IP).

that may have influenced the laboratory test results, par-ticularly the FCT and LVT.
• The normalized undrained shear strength data, Su/�’P andSu/�’vo, determined using the various test methods pre-sented a tendency to increase with increasing of IP, simi-lar to some empirical correlations reported in the litera-ture.
As a final contribution of this study, considering thesimplicity and flexibility of the fall cone test (FCT) applica-tion and the possibility to collect a greater number of data, itwould be appropriate to use this method to support andcomplement other strength determinations.
References
ABNT (1997). Assessment of Undisturbed Low Consis-tency Soil Samples from Boreholes – Procedure. NBR9820, Rio de Janeiro, 5 p. (in Portuguese).
ABNT (1989). Soil – Field Vane Shear Test – Method ofTest. NBR 10905, Rio de Janeiro, 9 p. (in Portuguese).
Almeida, M.S.S. & Marques, M.E.S. (2014). Embank-ments on Soft Soils: Design and Performance. 2nd ed.Oficina de Textos, São Paulo, 256 p. (in Portuguese).
Almeida, M.S.S.; Marques, M.E.S. & Baroni, M. (2010).Geotechnical parameters of very soft clays from CPTu.Proc. 2th International Symposium on Cone PenetrationTest, California, USA.
Alshibli, K.A.; Okeil, A.M.; Alramahi, B. & Zhang, Z.(2011). Reliability analysis of CPT measurements forcalculating undrained shear strength. Geotechnical Tes-ting Journal, 34(6):1-9.
ASTM (2003). Standard Test Method for Unconsolidated-Undrained Triaxial Compression Test on CohesiveSoils. D2850-03a. ASTM International, West Consho-hocken, Pennsylvania, USA, 6 p.
ASTM (2006). Standard Test Method for UnconfinedCompressive Strength of Cohesive Soil. D2166-06.ASTM International, West Conshohocken, Pennsylva-nia, USA, 6 p.
ASTM (2010). Standard Test Method for Laboratory Min-iature Vane Shear Test for Saturated Fine-Grained Soil.D4648/D4648M-10. ASTM International, WestConshohocken, Pennsylvania, USA, 7 p.
ASTM (2012). Standard Test Method for Eletronic FrictionCone and Piezocone Penetration Testing of Soils.D5778-12. ASTM International, West Conshohocken,Pennsylvania, USA, 20 p.
Baroni, M. (2016). Geotechnical Behaviour of ExtremelySoft Clays of the Jacarepaguá Lowlands, RJ. PhD Dis-sertation, COPPE, Federal University of Rio de Janeiro,292 p. (in Portuguese).
CAN (2006). Soils – Determination of Undrained ShearStrength and Determination of Sensitivity of CohesiveSoils using the Fall Cone Penetrometer. BNQ 2501-110. Canadian Standards Association and Bureau de
Normalisation du Québec, National Standard of Ca-nada, Ottawa, ON, CAN.
ISO (2004). Geotechnical Investigation and Testing – Lab-oratory Testing of Soil – Part 6: Fall Cone Test. ISO/TS17892-6. ISO, Geneva, CHE, 16 p.
Chung, S.G.; Kim, G.J.; Kim, M.S. & Ryu, C.K. (2007).Undrained shear strength from field vane test on Busanclay. Marine Georesources and Geotechnology,25:167-179.
Claveveau-Mallet, D.; Duhaime, F. & Chapuis, R.P.(2012). Practical considerations when using the Swed-ish Fall Cone. Geotechnical Testing Journal, 35(4):1-11.
Coutinho, R.Q. (2007). Characterization and engineeringproperties of Recife soft clays - Brazil. Proc. 2th Inter-national Workshop on Characterization and Engi-neering Properties of Natural Soils, Tan, Phoon, Hightand Leroueil (eds), Singapore, v. 3, pp. 2049-2100.
Coutinho, R.Q. & Bello M.I.M.C.V. (2014). Geotechnicalcharacterization of Suape soft clays, Brazil. Soils andRocks, 37(3):257-276.
Coutinho, R.Q. & Schnaid, F. (2010). CPT Regional Re-port for South America. Proc. 2th International Sympo-sium on Cone Penetration Test, California, USA, v. 1,p. 313-333.
Danziger, F.A.B. & Schnaid, F. (2000). Piezocone Tests:Procedures, recommendations and interpretation. Proc.SEFE IV, São Paulo, v. 3, pp. 1-51 (in Portuguese).
Feng, T.W. (2000). Fall-cone penetration and water contentrelationship of clays. Géotechnique, 50(2):181-187.
Futai, M.M.; Almeida, M.S.S. & Lacerda, W.A. (2008).Laboratory behavior of Rio de Janeiro soft clays. Part 2:strength and yield. Soils and Rocks, 31(2):77-84.
Hansbo, S. (1957). A New Approach to the Determinationof the Shear Strength of Clay by the Fall-Cone Test.Proceedings of Royal Swedish Geotechnical Institute,n. 14, Stockholm.
Houlsby, G.T. (1982). Theoretical analysis of the fall conetest. Géotechnique, 32(2):111-118.
Horng, V.; Tanaka, H.; Hirabayachi, H. & Tomita, R.(2011). Sample disturbance effects on undrained shearstrengths – Study from Takunoku site, Sapporo. Soilsand Foundations, 51(2):203-213.
Kempfert, H. & Gebreselassie, B. (2010). Excavations andFoundations in Soft Soils. Springer-Verlag Berlin Hei-delberg r, Netherlands, 576 p.
Koumoto, T. & Houlsby, G.T. (2001). Theory and practiceof the fall cone test. Géotechnique, 51(8):701-712.
Larsson, R. & Ahnberg, H. (2005). On the evaluation of un-drained shear strength and preconsolidation pressurefrom common field tests in clay. Canadian Geotechni-cal Journal, 42:1221-1231.
Larsson R.; Bergdahl, U. & Eriksson, L. (1987). Evaluationof shear strength in cohesive soils with special reference
300 Soils and Rocks, São Paulo, 40(3): 291-301, September-December, 2017.
Lemos & Pires
to Swedish practice and experience. Geotechnical Tes-ting Journal, 10(3):105-112.
Leroueil, S.; Demers, D. & Saihi, F. (2001). Considerationson stability of embankments on clay. Soils and Founda-tions, 41(5):117-127.
Lunne, T.; Berre, T. & Strandvik, S. (1997a). Sample dis-turbance effects in soft low plastic Norwegian clay.Proc. of the Conference on Recent Developments inSoil and Pavement Mechanics, Rio de Janeiro, pp. 81-102.
Lunne, T.; Robertson, P.K. & Powell, J.J.M. (1997b). ConePenetration Testing in Geotechnical Practice. Taylor &Francis, New York, 352 p.
Robertson, P.K. (2009). Interpretation of cone penetrationtests – unified approach. Canadian Geotechnical Jour-nal, 46:1337-1355.
Robertson, P.K. & Cabal, F.L. (2015). Guide to Cone Pene-tration Testing for Geotechnical Engineering. 6th ed.Gregg Drilling & Testing Inc., Signal Hill, 133 p.
Rajasekaran, G. & Narasimha Rao, S. (2004). Falling conemethod to measure the strength of marine clays. OceanEngineering, 31:1915-1927.
Schnaid, F. & Odebrecht, E. (2012). Field Tests and theirApplications to Foundation Engineering. 2nd ed. Ofi-cina de Textos, São Paulo, 223 p. (in Portuguese).
Shogaki, T. (2006). An improved method for estimatingin-situ undrained shear strength of natural deposits.Soils and Foundations, 46(2):109-121.
Skempton, A.W. & Northey, R.D. (1952). The sensitivityof clays. Géotechnique, 3(1):30-53.
Sridharan, A.; Narasimha Rao, S. & Venkatappa Rao, G.(1971). Shear strength characteristics of saturatedmontmorillonite and kaolinite clays. Soils and Founda-tions, 11(3):1-22.
Suguio, K. (2010). Quaternary Geology and EnvironmentalChanges. 2nd ed. Oficina de Textos, São Paulo, 408 p.(in Portuguese).
Tanaka, H. (1994). Vane shear strength of a Japanese ma-rine clay and applicability of Bjerrum correction factor.Soils and Foundations, 34(3):39-48.
Tanaka, H. (2000). Sample quality of cohesive soils: les-sons from three sites, Ariake, Bothekennar and Dram-men. Soils and Foundations, 40(4):57-74.
Tanaka, H. (2008). Sampling and sample quality of softclays. Proc. 3rd International Conference on Site Char-acterization, Taipei, pp. 139-157.
Tanaka, H.; Hirabayashi, H.; Matsioka, T. & Kaneko, H.(2012). Use of fall cone test as measurement of shearstrength for soft clay materials. Soils and Foundations,52(4):590-599.
Tanaka, H.; Locat, J.; Shibuya, S.; Soon, T.T. & Shiwakoti,D.R. (2001). Characterization of Singapore, Bangkok,and Ariake clays. Canadian Geotechnical Journal,38:378-400.
Watabe, Y. & Tsuchida, T. (2001). Comparative study onundrained shear strength of Osaka Bay pleistocene claydetermined by several kinds of laboratory test. Soils andFoundations, 41(5):47-59.
Wood, D.M. (1990). Soil Behaviour and Critical State SoilMechanics. Cambridge University Press, Cambridge,488 p.
Soils and Rocks, São Paulo, 40(3): 291-301, September-December, 2017. 301
The Undrained Strength of Soft Clays Determined from Unconventional and Conventional Tests