the ultimate guide to unlocking e-commerce growth in
TRANSCRIPT

The Ultimate Guide to Unlocking E-Commerce Growth in Markets across LATAM, APAC & EMEA
A local payments strategy for global merchants
An industry report by Americas Market IntelligenceApril 2021

2
Table of Contents
About dLocal . . . . . . . . . . . . . . . . . . . . . . . . . . . . . . . . . . . . . . . . . . . . . . . . . . . . . . . . . . . . . . . . . . . . . . . . . . . . . . . . . . . . 4
About AMI . . . . . . . . . . . . . . . . . . . . . . . . . . . . . . . . . . . . . . . . . . . . . . . . . . . . . . . . . . . . . . . . . . . . . . . . . . . . . . . . . . . . . . . 5
Approach and methodology . . . . . . . . . . . . . . . . . . . . . . . . . . . . . . . . . . . . . . . . . . . . . . . . . . . . . . . . . . . . . . . . . . . . . . . 7
Why is this report different? . . . . . . . . . . . . . . . . . . . . . . . . . . . . . . . . . . . . . . . . . . . . . . . . . . . . . . . . . . . . . . . . . . 7
Methodology . . . . . . . . . . . . . . . . . . . . . . . . . . . . . . . . . . . . . . . . . . . . . . . . . . . . . . . . . . . . . . . . . . . . . . . . . . . . . . . 7
14 core markets . . . . . . . . . . . . . . . . . . . . . . . . . . . . . . . . . . . . . . . . . . . . . . . . . . . . . . . . . . . . . . . . . . . . . . 7Secondary emerging markets . . . . . . . . . . . . . . . . . . . . . . . . . . . . . . . . . . . . . . . . . . . . . . . . . . . . . . . . . . 7Pay-outs . . . . . . . . . . . . . . . . . . . . . . . . . . . . . . . . . . . . . . . . . . . . . . . . . . . . . . . . . . . . . . . . . . . . . . . . . . . . . 8
How do we define e-commerce? . . . . . . . . . . . . . . . . . . . . . . . . . . . . . . . . . . . . . . . . . . . . . . . . . . . . . . . . . . . . . 8
How do we define pay-outs? . . . . . . . . . . . . . . . . . . . . . . . . . . . . . . . . . . . . . . . . . . . . . . . . . . . . . . . . . . . . . . . . . 9
Other technical specifications . . . . . . . . . . . . . . . . . . . . . . . . . . . . . . . . . . . . . . . . . . . . . . . . . . . . . . . . . . . . . . . . 9
The Ultimate Guide to Unlocking E-commerce Growth in Markets across LATAM, APAC & EMEA . . . . . . . . . .11
Estimated total addressable market size . . . . . . . . . . . . . . . . . . . . . . . . . . . . . . . . . . . . . . . . . . . . . . . . . . . . . .11
AMI summary observations . . . . . . . . . . . . . . . . . . . . . . . . . . . . . . . . . . . . . . . . . . . . . . . . . . . . . . . . . . . . . . . . .14
Pay-ins . . . . . . . . . . . . . . . . . . . . . . . . . . . . . . . . . . . . . . . . . . . . . . . . . . . . . . . . . . . . . . . . . . . . . . . . . . . . . . . . . . . .16
Argentina . . . . . . . . . . . . . . . . . . . . . . . . . . . . . . . . . . . . . . . . . . . . . . . . . . . . . . . . . . . . . . . . . . . . . . . . . . . .16Brazil . . . . . . . . . . . . . . . . . . . . . . . . . . . . . . . . . . . . . . . . . . . . . . . . . . . . . . . . . . . . . . . . . . . . . . . . . . . . . . . .20Chile . . . . . . . . . . . . . . . . . . . . . . . . . . . . . . . . . . . . . . . . . . . . . . . . . . . . . . . . . . . . . . . . . . . . . . . . . . . . . . . .24Colombia . . . . . . . . . . . . . . . . . . . . . . . . . . . . . . . . . . . . . . . . . . . . . . . . . . . . . . . . . . . . . . . . . . . . . . . . . . . .28Egypt . . . . . . . . . . . . . . . . . . . . . . . . . . . . . . . . . . . . . . . . . . . . . . . . . . . . . . . . . . . . . . . . . . . . . . . . . . . . . . .32India . . . . . . . . . . . . . . . . . . . . . . . . . . . . . . . . . . . . . . . . . . . . . . . . . . . . . . . . . . . . . . . . . . . . . . . . . . . . . . . .36Mexico . . . . . . . . . . . . . . . . . . . . . . . . . . . . . . . . . . . . . . . . . . . . . . . . . . . . . . . . . . . . . . . . . . . . . . . . . . . . . .40Morocco . . . . . . . . . . . . . . . . . . . . . . . . . . . . . . . . . . . . . . . . . . . . . . . . . . . . . . . . . . . . . . . . . . . . . . . . . . . . .44Nigeria . . . . . . . . . . . . . . . . . . . . . . . . . . . . . . . . . . . . . . . . . . . . . . . . . . . . . . . . . . . . . . . . . . . . . . . . . . . . . .48Paraguay . . . . . . . . . . . . . . . . . . . . . . . . . . . . . . . . . . . . . . . . . . . . . . . . . . . . . . . . . . . . . . . . . . . . . . . . . . . .52Peru . . . . . . . . . . . . . . . . . . . . . . . . . . . . . . . . . . . . . . . . . . . . . . . . . . . . . . . . . . . . . . . . . . . . . . . . . . . . . . . .56South Africa . . . . . . . . . . . . . . . . . . . . . . . . . . . . . . . . . . . . . . . . . . . . . . . . . . . . . . . . . . . . . . . . . . . . . . . . .60Turkey . . . . . . . . . . . . . . . . . . . . . . . . . . . . . . . . . . . . . . . . . . . . . . . . . . . . . . . . . . . . . . . . . . . . . . . . . . . . . . .64Uruguay . . . . . . . . . . . . . . . . . . . . . . . . . . . . . . . . . . . . . . . . . . . . . . . . . . . . . . . . . . . . . . . . . . . . . . . . . . . . .68Pay-ins in secondary markets . . . . . . . . . . . . . . . . . . . . . . . . . . . . . . . . . . . . . . . . . . . . . . . . . . . . . . . . . .72
Pay-outs . . . . . . . . . . . . . . . . . . . . . . . . . . . . . . . . . . . . . . . . . . . . . . . . . . . . . . . . . . . . . . . . . . . . . . . . . . . . . . . . . .74
Contact the author . . . . . . . . . . . . . . . . . . . . . . . . . . . . . . . . . . . . . . . . . . . . . . . . . . . . . . . . . . . . . . . . . . . . . . . . . . . . . . .76

3
Figure 1 . Total addressable market for pay-ins, markets covered in this report, 2020 . . . . . . . . . . . . . . . . . . . . .12Figure 2 . Total addressable market for pay-outs, select markets, 2020 . . . . . . . . . . . . . . . . . . . . . . . . . . . . . . . . . .12Figure 3 . Summary TAM, pay-ins and pay-outs by country, 2020 . . . . . . . . . . . . . . . . . . . . . . . . . . . . . . . . . . . . . . .13Figure 4 . Historic and projected e-commerce volume, Argentina, 2018-2024 . . . . . . . . . . . . . . . . . . . . . . . . . . . .17Figure 5 . E-commerce volume by payment method, Argentina, 2020 . . . . . . . . . . . . . . . . . . . . . . . . . . . . . . . . . . .18Figure 6 . Historic and projected e-commerce volume, Brazil, 2018-2024 . . . . . . . . . . . . . . . . . . . . . . . . . . . . . . . .21Figure 7 . E-commerce volume by payment method, Brazil, 2020 . . . . . . . . . . . . . . . . . . . . . . . . . . . . . . . . . . . . . . .22Figure 8 . Historic and projected e-commerce volume, Chile, 2018-2024 . . . . . . . . . . . . . . . . . . . . . . . . . . . . . . . . .25Figure 9 . E-commerce volume by payment method, Chile, 2020 . . . . . . . . . . . . . . . . . . . . . . . . . . . . . . . . . . . . . . .26Figure 10 . Historic and projected e-commerce volume, Colombia, 2018-2024 . . . . . . . . . . . . . . . . . . . . . . . . . . .29Figure 11 . E-commerce volume by payment method, Colombia, 2020 . . . . . . . . . . . . . . . . . . . . . . . . . . . . . . . . . .30Figure 12 . Historic and projected e-commerce volume, Egypt, 2018-2024 . . . . . . . . . . . . . . . . . . . . . . . . . . . . . . .33Figure 13 . E-commerce volume by payment method, Egypt, 2020 . . . . . . . . . . . . . . . . . . . . . . . . . . . . . . . . . . . . . .34Figure 14 . Historic and projected e-commerce volume, India, 2018-2024 . . . . . . . . . . . . . . . . . . . . . . . . . . . . . . . .37Figure 15 . E-commerce volume by payment method, India, 2020 . . . . . . . . . . . . . . . . . . . . . . . . . . . . . . . . . . . . . .38Figure 16 . Historic and projected e-commerce volume, Mexico, 2018-2024 . . . . . . . . . . . . . . . . . . . . . . . . . . . . . .41Figure 17 . E-commerce volume by payment method, Mexico, 2020 . . . . . . . . . . . . . . . . . . . . . . . . . . . . . . . . . . . .42Figure 18 . Historic and projected e-commerce volume, Morocco, 2018-2024 . . . . . . . . . . . . . . . . . . . . . . . . . . . .45Figure 19 . E-commerce volume by payment method, Morocco, 2020 . . . . . . . . . . . . . . . . . . . . . . . . . . . . . . . . . . .46Figure 20 . Historic and projected e-commerce volume, Nigeria, 2018-2024 . . . . . . . . . . . . . . . . . . . . . . . . . . . . . .49Figure 21 . E-commerce volume by payment method, Nigeria, 2020 . . . . . . . . . . . . . . . . . . . . . . . . . . . . . . . . . . . .50Figure 22 . Historic and projected e-commerce volume, Paraguay, 2018-2024 . . . . . . . . . . . . . . . . . . . . . . . . . . . .53Figure 23 . E-commerce volume by payment method, Paraguay, 2020 . . . . . . . . . . . . . . . . . . . . . . . . . . . . . . . . . .54Figure 24 . Historic and projected e-commerce volume, Peru, 2018-2024 . . . . . . . . . . . . . . . . . . . . . . . . . . . . . . . .57Figure 25 . E-commerce volume by payment method, Peru, 2020 . . . . . . . . . . . . . . . . . . . . . . . . . . . . . . . . . . . . . . .58Figure 26 . Historic and projected e-commerce volume, South Africa, 2018-2024 . . . . . . . . . . . . . . . . . . . . . . . . .61Figure 27 . E-commerce volume by payment method, South Africa, 2020 . . . . . . . . . . . . . . . . . . . . . . . . . . . . . . . .62Figure 28 . Historic and projected e-commerce volume, Turkey, 2018-2024 . . . . . . . . . . . . . . . . . . . . . . . . . . . . . .65Figure 29 . E-commerce volume by payment method, Turkey, 2020 . . . . . . . . . . . . . . . . . . . . . . . . . . . . . . . . . . . . .66Figure 30 . Historic and projected e-commerce volume, Uruguay, 2018-2024 . . . . . . . . . . . . . . . . . . . . . . . . . . . .69Figure 31 . E-commerce volume by payment method, Uruguay, 2020 . . . . . . . . . . . . . . . . . . . . . . . . . . . . . . . . . . .70Table 1 . Secondary e-commerce market size and forecast . . . . . . . . . . . . . . . . . . . . . . . . . . . . . . . . . . . . . . . . . . . .72Table 2 . Pay-outs estimated market size . . . . . . . . . . . . . . . . . . . . . . . . . . . . . . . . . . . . . . . . . . . . . . . . . . . . . . . . . . . .74
4
About dLocal dLocal is the only 360 payments platform designed to handle mass online payments in multiple emerging countries in Latin America, Asia, Middle East, and Africa through one single direct API . Global eCommerce retailers, SaaS companies, online travel providers, and marketplaces rely on dLocal to accept locally-relevant payment methods, as well as to issue payments to their contractors, agents, and sellers in growth markets around the world . Some of dLocal’s customers include Amazon, Booking .com, Didi, DropBox, Inditex, MailChimp, Spotify, Shopify, TripAdvisor, Uber, and Wikimedia .
www.dlocal.com

5
About AMIAmericas Market Intelligence (AMI) is the premier market intelligence firm for Latin America, providing powerful market and competitive intelligence-driven insights for companies to succeed in the region . With a specialization in the payments industry, its expertise includes e-commerce, neobanks and digital wallets, fintech, POS and acceptance technology, financial inclusion, cross-border payments, B2B payments, open banking and real-time payments . Its customized research reports deliver data-based clarity and granular strategic direction based on expert sourcing .
AMI’s payments practice is focused on helping financial institutions, merchants and others navigate the unique payments landscape in Latin America and compete in a rapidly digitizing environment . AMI consultants are recognized thought leaders in verticals such as e-commerce, payments innovation, contactless technology, real-time payments, and consumer and payment industry trends .
www.americasmi.com

6

7
Approach and methodology
Why is this report different?There is no lack of data on the state of e-commerce in most global markets . A quick search on Google will yield thousands of results . As the digitization of the economy drives growth in the region, both governments and the private sector have a vested interest in producing trustworthy e-commerce statistics . Unfortunately, the data we’ve seen so far has several shortcomings, making it unreliable for global merchants’ decision-making, especially in emerging markets .
First, existing e-commerce reports on emerging markets are often unclear on what is covered under the term “e-commerce .” In some cases, they encompass only physical products, excluding travel, services, and digital goods . In other cases, they cover only purchases made with credit cards, which excludes over 80% of spend in many markets because this spend occurs with cards that are not internationally enabled or via local payment methods . In addition, it is not uncommon for local e-commerce associations to include corporate tax payments made over electronic channels in their e-commerce reports, which wildly inflates their numbers . Finally, many reports simply do not clarify what they include and exclude . These inconsistencies make it nearly impossible to conduct a smart analysis of the region or execute a market-by-market comparison .
In this report, AMI aims to provide a clear, concise and consistent account of e-commerce in strategic emerging markets across Latin America, Asia Pacific, Africa and the Middle East. Using a singular methodology and clear definitions, we have created a guide to enable global merchants to accurately analyze, compare and contrast both individual markets and emerging markets as a whole .
The pay-outs industry is another area of the payments industry that is opaque and lacking in reliable information . There is almost no public data published on the pay-outs industry, even as verticals
like ride-hailing and delivery apps explode in growth all over the world . In this report, we aim to size the total pay-outs market in five key verticals: ride-hailing, delivery apps, travel accommodations, freelance work, and inbound international remittances .
Methodology14 CORE MARKETS
The body of this report covers 14 top emerging markets . To develop the data and analysis on these markets, AMI first compiled all publicly available data from sources, including local chambers of commerce, e-commerce associations, local press, market reports and government statistics, as well as data from the World Bank and affiliated international organizations. The authors adopted a critical approach, identifying the holes, errors and inconsistencies in this data to prepare it for primary research .
Then AMI conducted interviews with local e-commerce industry stakeholders to clarify, deepen, and streamline data collected via secondary research . In the creation of this report, we interviewed over 40 e-commerce executives in the 14 markets covered in this report, including banks, acquirers, payment gateways, payment service providers, merchants and consultants .
Finally, AMI conducted a rigorous analysis of the primary and secondary results to arrive at the conclusions contained in this report .
SECONDARY EMERGING MARKETS
AMI also provides the market size and projections for an additional set of 17 emerging markets . Utilizing a combination of internal data from AMI, desk research and a modeling exercise based on population, GDP per capita and forecasted GDP growth, we supply estimated figures for these markets.

8
PAY-OUTS
Due to the lack of public information on the pay-outs industry, AMI created a representative model in each vertical to estimate their respective market sizes . AMI analysts collected available relevant data and created a model based on overall population and other sizing metrics to estimate the size of each pay-out vertical . Please note that the figures provided are estimates only, directionally accurate but based on modeling and not actual, verifiable volume.
How do we define e-commerce? In this whitepaper, our e-commerce analysis covers all online purchases of goods and services, regardless of the device or payment method used, including:
�� All local and cross-border1 product and service verticals, including retail, travel, and digital goods and services.
�� Retail is defined as: All physical products purchased online directly from the merchant or marketplace
�� Travel is defined as: Travel services including airline tickets, car rentals, tour packages, hotels and home rentals
�� Digital goods and services comprises two categories:
�� Digital goods is defined as: All digital goods and services include ride-hailing, delivery apps, streaming, online gaming, online education, digital downloads, mobile top-ups, advertising, SaaS, etc .
�� Other services is defined as: Recurring purchases such as monthly bills, insurance payments, school tuition payments, home ownership association
1. A cross-border purchase is one in which the merchant is located outside of the buyer’s home country
fees, taxes and government licenses and fees (if they are paid online over an e-commerce gateway) . These expenses are not included if they are paid via online banking or direct debit from a check or savings account . Recurring payments to a credit or debit card are included, as are one-time payments over an online ACH portal such as Botón PSE in Colombia .
�� All locally-issued payment methods including:
�� Internationally enabled credit cards, local credit cards, debit cards, online bank transfers, cash payment platforms (such as Oxxo in Mexico or Fawry in Egypt), digital wallets (such as PayPal, MercadoPago and ApplePay), cash on delivery, and other miscellaneous payment methods .
�� Please note the following definitions:
�� Cash-based payment platform: is defined as a payment platform that enables a shopper to make an online order, receive a bar code or unique PIN and use that bar code or PIN to make the payment in cash at an affiliated retail location. Such platforms often allow payment using an online bank transfer . Examples include Oxxo in Mexico, PagoEfectivo in Peru and boleto bancário in Brazil .
�� Digital wallet: AMI defines a digital wallet as a payment method that stores any funding source on file, including a credit card, debit card, bank account or stored balance, and uses that funding source to remit payment . E-commerce volume falls into the digital wallet category if the wallet brand is selected at checkout, even if a different funding source (such as a credit card) is ultimately selected as the funding source . Examples include card-on-file wallets such as PayPal and ApplePay, as well as stored balance wallets like TigoMoney and MercadoPago .

9
How do we define pay-outs?
Pay-outs are defined as payments made by companies to individuals for contract services rendered or for other purposes . In this report, we look at the following five pay-out verticals in 14 markets:
�� Ride-hailing: Funds paid to ride-hailing app (i .e . Uber) drivers as compensation for services rendered
�� Delivery services: Funds paid to delivery services app (i .e . Rappi) delivery agents as compensation for services rendered
�� Property rentals: Funds paid to hosts for the rental of their property on a platform such as Airbnb
�� Freelance work: Funds paid to freelance workers offering services on a platform such as Upwork .com
�� International remittances: Funds paid to individuals using a remittance operator such as Transferwise
Our analysis excludes:
�� Payments made by international visitors
�� P2P payments
�� Payments made in cash for ride-hailing services and delivery app orders
Other technical specificationsUnless otherwise stated, all currency is expressed in US dollars .
Please note that numbers contained in figures and tables may not add due to rounding .
How do we define e-commerce?
All local and cross-border product and service verticals, including retail, travel, and digital goods and services
All locally-issued payment methods including: internationally enabled credit cards, local credit cards, debit cards, online bank transfers, cash payment platforms, cash
on delivery and other miscellaneous payment methods

10

11
The Ultimate Guide to Unlocking E-commerce growth in markets across LATAM, APAC & EMEA
Estimated total addressable market sizeTo begin this report, we start off by quantifying the total addressable market size (TAM) comprised of the 31 countries covered in this analysis .
Our e-commerce estimates include all spend made by consumers in the online channel, as well as the retail, travel, and digital goods verticals, including non-traditional e-commerce purchases like digital goods (e .g . cloud storage or anti-virus software) made by using any locally issued payment method, and including purchases made both domestically and from international merchants . Because AMI’s e-commerce values are comprehensive, these represent an appropriate proxy for the estimated TAM in each analyzed market .
This data considers both pay-ins, defined as funds received by a merchant for the sale of a good or services, as well as pay-outs, defined as the disbursement of funds to an individual .
Based on our analysis, in 2020, the total TAM across the 31 markets covered in this report for pay-ins was equivalent to $445 billion, divided across the following segments:
�� Domestic: $383 billion
�� Cross-border: $63 billion
In the 2024, the pay-in TAM is projected to reach $1 .159 billion .
The total TAM for pay-outs in the 14 markets covered in the report in 2020 was equivalent to $812 billion . This amount is divided across the following segments:
�� Ride-hailing: $1.9 billion
�� Delivery apps: $3.3 billion
�� Property rentals: $2.0 billion
�� Freelance work: $626 billion
�� International remittances: $181 billion

12
Figure 2. Total addressable market for pay-outs, select markets covered in this report, 2020: USD 812 billionPay-outs TAM, 2020, USD billions
Figure 1. Total addressable market for pay-ins, markets covered in this report, 2020: $USD 445 billionPay-in TAM, 2020, USD billions

13
Pay-in market Pay-outs
Domestic Cross-border
Total Ride-hailing
Delivery apps
Property rentals
Freelance work
International remittances
Total
Argentina $11 .9 $0 .4 $12 .3 $0 .1 $0 .1 $0 .1 $0 .9 $0 .1 $1 .3
Bangladesh $5 .0 $0 .5 $5 .4 -- -- -- -- -- --
Bolivia $1 .4 $0 .3 $1 .7 -- -- -- -- -- --
Brazil $103 .9 $7 .2 $111 .1 $0 .5 $0 .5 $0 .2 $6 .4 $1 .6 $9 .3
Cameroon $2 .7 $0 .3 $3 .1 -- -- -- -- -- --
Chile $9 .6 $3 .6 $13 .2 $0 .1 $0 .1 $0 .1 $1 .4 $0 .3 $2 .0
Colombia $13 .0 $2 .9 $16 .0 $0 .1 $0 .1 $0 .1 $5 .2 $6 .2 $11 .8
Costa Rica $0 .6 $1 .5 $2 .1 -- -- -- -- -- --
Dominican Republic $0 .3 $0 .9 $1 .2 -- -- -- -- -- --
Ecuador $2 .9 $0 .6 $3 .6 -- -- -- -- -- --
Egypt $2 .8 $0 .3 $3 .1 $0 .1 $0 .1 $0 .1 $4 .1 $24 .4 $28 .7
Ghana $5 .0 $0 .6 $5 .5 -- -- -- -- -- --
India $70 .1 $15 .4 $85 .5 $0 .1 $1 .4 $0 .1 $564 .3 $75 .9 $641 .9
Indonesia $19 .1 $1 .9 $21 .0 -- -- -- -- -- --
Ivory Coast $4 .1 $0 .5 $4 .6 -- -- -- -- -- --
Kenya $6 .9 $0 .8 $7 .7 -- -- -- -- -- --
Malaysia $3 .3 $2 .3 $5 .7 -- -- -- -- -- --
Mexico $29 .4 $8 .1 $37 .5 $0 .6 $0 .3 $0 .8 $11 .0 $39 .5 $52 .2
Morocco $0 .5 $0 .0 $0 .5 $0 .1 $0 .1 $0 .1 $2 .1 $6 .4 $8 .7
Nigeria $29 .4 $3 .5 $32 .9 $0 .0 $0 .1 $0 .0 $19 .8 $21 .0 $40 .9
Panama $1 .9 $0 .7 $2 .6 -- -- -- -- -- --
Paraguay $0 .1 $0 .0 $0 .2 $0 .0 $0 .0 $0 .0 $0 .3 $0 .6 $0 .9
Peru $5 .6 $1 .2 $6 .8 $0 .0 $0 .0 $0 .0 $3 .2 $3 .3 $6 .6
Philippines $3 .9 $1 .9 $5 .9 -- -- -- -- -- --
Senegal $1 .6 $0 .2 $1 .8 -- -- -- -- -- --
South Africa $3 .7 $0 .4 $4 .1 $0 .1 $0 .1 $0 .2 $1 .4 $0 .8 $2 .5
Sri Lanka $3 .9 $1 .9 $4 .9 -- -- -- -- -- --
Thailand $6 .0 $2 .0 $7 .9 -- -- -- -- -- --
Turkey $25 .8 $2 .4 $28 .2 $0 .1 $0 .2 $0 .0 $6 .0 $0 .7 $7 .1
Uruguay $2 .4 $0 .4 $2 .8 $0 .0 $0 .0 $0 .0 $0 .1 $0 .2 $0 .3
Vietnam $6 .0 $0 .6 $6 .6 -- -- -- -- -- --
Total $382.7 $63.3 $445.2 $1.9 $3.3 $2.0 $626.3 $181.0 $814.4
Figure 3. Summary TAM, pay-ins and pay-outs by country, 2020, USD billions

14
AMI summary observations A GLOBAL VIEW
2020 was the most disruptive year for the e-commerce industry, arguably, since its birth . With the global spread of the COVID-19 pandemic and the corresponding closing of borders and businesses all over the world, life changed dramatically . The travel industry grinded to a halt and online retail exploded, especially in emerging categories like grocery, pharmacy and household goods while digital services like delivery apps, streaming and gaming saw triple digits growth rates . Although the global economy contracted by 3 .5% in 2020, e-commerce growth remained positive, averaging 27% YoY among the 14 core markets analyzed in this study . 2020 growth rates at the market level were highly dependent on the share of travel e-commerce (which reached -50% in almost every market) and those with a high share of cross-border e-commerce . AMI expects cross-border retail spend and domestic travel to recover by the end of 2021, but international travel will probably not recover to 2019 levels until 2023 .
In total, the global e-commerce market reached $5 .5 trillion in 2020, 74% of which comes from emerging markets ($2 .3 trillion and 40% when excluding China) . This highlights the importance of local payment methods . While in the United States and Europe, credit and debit cards are widely owned and used online, this is not the case in global emerging markets, where banking penetration can fall below 20% of the adult population and cash-based payments methods, local digital wallets and bank transfers are prevalent .
All in all, local payment methods represent 83% of total e-commerce expenditure in the 14 core markets analyzed in this report . Extrapolated to the global level, local payment methods represent an estimated 61% of all global e-commerce spend, an estimated $3 .4 trillion . Given this, it is imperative for global merchants venturing beyond the US and Western Europe to develop a global and comprehensive local payment strategy .
KEY MARKET TRENDS
1. The pay-ins market will grow 27% annually through 2024: In most markets, e-commerce received a substantial boost in 2020, growing by an average of 33% in 2020 over 2019, thanks to economic shutdowns related to the COVID-19 pandemic . The pandemic attracted millions of new consumers to the e-commerce channel for the first time and helped to develop emerging e-commerce retail channels, such as grocery, delivery services, and online gaming . These segments will continue to drive e-commerce growth in the medium term, at an average CAGR of 27% through 2024 .
2. The domestic travel industry will recover throughout 2021; leisure international travel will begin to rebound in 2022, possibly reaching pre-pandemic levels by 2024. Business travel may never recover fully. While the travel sector was devastated in 2020, the industry will stabilize as COVID-19 vaccines become increasingly available and consumers resume leisure travel . In the meantime, travelers are seeking alternative accommodations (such as home rentals instead of hotels) and are traveling shorter distances . This impacts both the pay-in market and pay-outs, as well as property rentals and ride-hailing .
3. Cross-border retail spend is growing thanks to international marketplaces seeking new places to do business. While the COVID-19 pandemic brought cross-border e-commerce to a standstill for several months in 2020, the sector began to accelerate in 2021, driven by consumers in emerging markets looking for lower prices during high economic uncertainty . With more consumers shopping online than ever before, international marketplaces are setting their sights on new markets and investing in international expansion .
4. Digital goods and services are diversifying. While traditionally dominated by a handful of categories, namely video streaming, the digital goods category is becoming increasingly diverse . Consumers were

15
forced to stay home throughout 2020, and they turned to digital services to fulfill a wide range of needs, including education, exercise, video conferencing, remote work, and entertainment . This caused a boom in online gaming, niche streaming services, software downloads and SaaS, online education, telemedicine, and a host of other digital sectors . Increasing innovation and creativity across the globe will give rise to more opportunities to offer digital services to the new COVID-19-online consumer .
5. Fintech and digital payment innovation are spreading financial inclusion and local payments. Supported by the rise of fintechs, digital wallets and neobanks, as well as initiatives by Central Banks across emerging markets, financial inclusion has
reached record highs . In Latin America, access to banking has exceeded 70%, up from 51% in 2018 .2 As millions of previously unbanked enter the digital payment ecosystem, they primarily adopt prepaid/debit cards, digital wallets, and bank transfers as payment methods . Embracing such local payments methods thus becomes central to successfully reaching these newly digitized populations .
This report intends to provide deeper evidence of these data and trends on a country-by-country basis and deliver insight into the local payment ecosystems of each market .
2. AMI internal data

16
Market size, growth, COVID-19 impact
Argentina is home to the largest e-commerce and fintech company in Latin America (Mercado Libre), putting it on the map for e-commerce . Argentina has 75% smartphone penetration and more than half of its population are e-commerce users . However, a fragile currency, constant macroeconomic problems, not to mention rampant and endemic inflation, are some of the difficulties that explain why the third-largest economy in the region still has 40% of its population excluded from digital financial services.
Nevertheless, Argentina has been showing impressive growth rates in the digital economy . Driven by COVID-19, e-commerce volume in 2020 exceeded $12 .3 billion, compared to $9 .5 billion in 2019 . According to the Argentine Chamber of E-commerce, just during the first half of 2020, 9 out of 10 Argentines made an online purchase and 70% of these were made on a mobile device . Top selling products included groceries, cell phones and accessories and sporting goods .
Nearly all of the e-commerce growth in 2020 can be attributed to the domestic market, thanks to a combination of inflation, devaluation and the restriction on acquiring foreign currency that limited the population’s access to dollars in 2020 . With 38% devaluation in 2019, the government deepened its
efforts to prevent the outflow of US-dollar reserves with the so-called PAIS tax, which established a surcharge of 30% on the purchase of foreign currency for savings and for consumption abroad (with credit cards) . Unfortunately, the devaluation trend continued in 2020, and currency control measures were applied . This ongoing situation has essentially limited the population’s international purchases, causing cross-border e-commerce to plummet to just 3% of total volume in 2020, unusual for a population with an avid appetite for international brands .
Argentinae-commerce payments overview
Source: Interviews, AMI analysis
Key stats
Domestic vs. cross-border shopping
3%97% of online sales were
to local merchants
of online sales were cross-border
E-commerce market size
$12B32%
in total e-commerce spend in 2020
projected 2020-2024 CAGR

17
Figure 4. Historic and projected e-commerce volume, Argentina, 2018-2024, USD billions
Source: Interviews, AMI analysis
What is driving Argentina’s e-commerce growth in 2021?
�� Digitized SMEs and social media e-commerce: Growth in Argentina’s e-commerce industry ties into emerging small and medium-sized companies wanting to gain an online presence . The COVID-19 pandemic generated an acceleration of merchants’ investment in their own websites and in sales over social media, in particular grocery stores, markets, restaurants, as well as service providers like private doctors and psychologists . According to internal analysis, approximately 77% of retail e-commerce in Argentina is through merchants’ proprietary channels and 23% through marketplaces . The know-how of SMEs during 2020 seems to have pushed more individual online stores and service providers through social media (i .e Facebook or Instagram) .
�� Rise of digital payments and acceptance: According to the Central Bank, cash was as high as 90% of offline retail payments at mid-2020, which underscores the fact that 40% of the population still does not have a bank account . The response of the banking and fintech sector to this data was to build new solutions . During the last quarter of 2020, there was a boom in acquiring and wallets . Among these we can mention: Supervielle Bank launched IUDÚ, its digital platform; BIMO, the virtual wallet from Grupo Clarin 365 (media conglomerate) launched together with Prisma (leading acquirer); MODO, a wallet supported by 35 private, public and cooperative banks, which by February 2021 already had gained more than one million users; Banco Santander launched its acquiring business Getnet; and Ualá (the second-largest wallet after Mercado Pago) launched acquiring solutions, offering mPOS devices and payment link to merchants . This trend is expected to show its impact during 2021 and consequently boost e-commerce and digital payments overall .

18
How do Argentines pay?
Argentina is unique in Latin America for the dominance of digital wallet Mercado Pago, owned by marketplace Mercado Libre . In 2020, 48% of Argentina’s total e-commerce spend was made using a digital wallet, up from 26% in 2019 . Beyond e-commerce, Mercado Pago has had extraordinary success developing a payments ecosystem, ranging from on-platform payments within its marketplace and capturing off-platform spend in with its wallet to enabling in-store QR code and mPOS payments .
The success of Mercado Pago has spurred on other wallets . There are about 20 in the country, such as Ualá, Yacaré, Ank and others, who together, represented 33% of the total funds transferred between banking accounts, including to and from both banks and fintechs.3 This demonstrates the increasing willingness of consumers to adopt and use wallets and their likelihood to claim even more share in e-commerce going forward .
This growth of wallets in e-commerce spend had caused a corresponding drop in the share of credit cards (from 46% to 21%), although it is important to note that the bulk of purchases within wallets is funded by an associated credit or debit card . Part of the popularity of credit cards is driven by the high use of installments, which represent 45% of credit card purchases, depending on the vertical, as reported by the country’s #1 acquirer, Prisma . In turn, as the banked population grows and debit cards proliferate, so does debit card consumption in e-commerce .
Cash payment methods for e-commerce such as RapiPago and Pago Fácil are on the decline in Argentina (from 11% market share in 2019 to 8% in 2020) . However, as payment service providers enable online selling for more SMEs (which in turn tend to attract less affluent consumers), these alternative payment methods are likely to maintain some market share .
3. Central Bank of Argentina
A final payment method which is booming in Argentina is QR codes . With Mercado Pago as the biggest promoter, more than 35 public and private banks have created MODO, a digital wallet that lets all the banking apps connect with it and pay with one interoperable QR code system . While QR codes so far are used in physical stores only, with Mercado Pago leading the way, these are already blurring the lines between physical commerce and remote e-commerce .
Figure 5. E-commerce volume by payment method, Argentina, 2020, USD BN
19
Relevant regulatory developments
From the public sector, there have been no regulatory developments specifically oriented to the promotion of e-commerce . However, the Central Bank has made important moves around financial inclusion, which contribute to overall digitization and e-commerce in the medium term .
Unprecedented banking access: In 2020, public banks alone enabled about 2 .5 million new savings accounts, almost five times more than all those opened in 2019 . This implies a huge group of the population with a free debit card (by law), now available to make online purchases, which has undoubtedly boosted e-commerce .
Transferencias 3.0: The main milestone of 2020 within the fintech segment was the launch of Transferencias 3 .0 . This system, designed by the Central Bank, establishes the use of one interoperable QR code to be offered by all digital wallets and bank apps . Prior to this, the 100,000 merchants in Argentina accepting QR had to integrate with multiple wallets to attain full coverage . However, Transferencias 3 .0 enables merchants to accept QR codes from all participating wallets via one integration . Under this program, which came into force on December 7, 2020, transfers are also made in real time, which is highly attractive to merchants . The initiative is expected to boost the digital economy by expanding QR code acceptance and reducing the use of cash .
Uber accepting cards: Prior to 2020, Uber and ride-hailing apps in general were prohibited from accepting locally issued credit and debit cards, limiting the service to tourists with international credit cards or cash . But in September 2020, after a legal dispute, the government lifted this ban . So far, Uber has only enabled UberEats to accept cards, but the end of this years-long regulatory battle will undoubtedly increase use of ride-hailing and delivery apps in 2021 .
Essential takeaways about Argentina
�� Triple-digit growth rates in e-commerce in Argentina (in pesos) and the proliferation of digital payment solutions show an auspicious future of the sector, today valued at $12 billion .
�� The response of the government and banking sector has generated an unprecedented banking penetration in Argentina . This opens the door for the first time to an important part of the population to be potential online consumers .
�� Digital wallets have greater presence in Argentina than any other market in Latin America, making connection to local payment methods essential to engaging local e-commerce shoppers .
Argentina stands out as an economy with significant growth rates and a population with a keen interest in, albeit high barriers to, shopping abroad . Merchants who can tap into local payment methods, especially the growing number of wallets, will be able to serve Argentine consumers, who are increasing their e-commerce spend at a rate of 32% per year .

20
Market size, growth, COVID-19 impact
With a population of 211 million, Brazil continues to be Latin America’s economic powerhouse, both on the physical and e-commerce fronts . However, despite an ongoing recession that started in 2013, economic scandals, political uncertainty and, most recently, the impact of COVID-19 (which resulted in reduced purchasing power), e-commerce in Brazil grew by 7% in 2020, reaching $111 billion in sales . In fact, Brazil’s amazingly resilient e-commerce sector is expected to accelerate in 2021 and beyond with an impressive 30% CAGR from 2020 to 2024, potentially reaching over $300 billion in three years .
The pandemic, despite all of the misfortune it caused, has fueled growth in some areas . For example, although it temporarily crushed sales of physical merchants, it propelled e-commerce on many fronts: large merchants grew in emerging product areas like grocery and personal care, more small- and mid-sized stores started to sell online and long-time “physical-only” consumers discovered the path to online purchases .
Compared to their peers in other emerging markets, Brazilians are brand-oriented, highly active on social media and early technology adopters . This makes the country attractive for merchants who are aware of Brazil’s 70% social media penetration paired with its 80%+ smartphone penetration, not to mention its status as the world’s third-largest
marketplace for Instagram advertising . Already in 2019, Brazil was Uber’s second-largest global market4 (up from 3rd in 2018) and the birthplace of several mega e-retailers including Magazine Luiza (which in turn had acquired Netshoes in 2019), B2W (Americanas and Submarino), and Via Varejo (Ponto Frio and Casas Bahia) . Moreover, as Hootsuite reports, 76% of Brazilian Internet users aged 16 to 64 have previously bought something online .5
Brazilians are also savvy shoppers and know how to find deals. With the onset of Chinese marketplaces offering rock-bottom prices, Brazilians have grown accustomed to waiting up to 30 days for their merchandise to arrive, especially in a context of economic slowdown . The offering of aggressive installment plans for credit card purchases by domestic and international merchants also helps keep buyers in the game when times are tough .
In addition to being the largest e-commerce market in Latin America, Brazil is also the most mature and competitive . As a result, Brazilians are the least tolerant in the region for friction in the checkout process; if a purchase fails, they can easily resort to a competitor’s online store . This is especially true in the mobile channel, where purchase pain points are the most severe . Therefore, merchants must get their mobile UX right in Brazil, since this channel now represents over 50% of e-commerce volume, up from 35% in 2018 .6
4. Exame5. Hootsuite6 . AMI analysis
Brazile-commerce payments overview

21
Source: Interviews, AMI analysis
Key stats
Domestic vs. cross-border shopping
6%94% of online sales were
to local merchants
of online sales were cross-border
E-commerce market size
$111B30%
in total e-commerce spend in 2020
projected 2020-2024 CAGR
Figure 6. Historic and projected e-commerce volume, Brazil, 2018-2024, USD billions
Source: Interviews, AMI analysis
What is driving Brazilian e-commerce growth in 2021?
�� Growing diversity of products and services offered online: From groceries to online education, home decoration to construction and baby products—these segments have seen the largest growth during the pandemic . Today, one can find nearly anything in the Brazilian e-commerce market, so the convenience (and sometimes the obligation) of purchasing online will continue to be the strongest driver through 2021 .
�� Increasing number of consumers with access to a bank account: This means they also likely have a debit or credit card, which together currently represent over 70% of online purchases in Brazil (that said, 60% of this spend is made using a card enabled for domestic purchases only) .
�� Improved consumer confidence: As merchants compete for a better user experience and payments companies and logistics providers continually professionalize the channel, consumers are more willing to buy online .

22
How Brazilians pay
Even though Brazilians are keen to buy online, the local banking system makes accessing e-commerce difficult for many. Roughly 40% of Brazilians adults have a credit card—this number has increased in recent years due to the onslaught of online-only banks offering no-fee credit cards, the leader being Nubank . Of these digital banks, around 10% run on Brazil-only networks, Elo and Hipercard . In contrast, 90% of cards are Visa, Mastercard and American Express, but only about 20% of them (representing ~10 million cardholders) are automatically enabled for international purchases . In most cases, consumers must request that their bank enable international purchasing for their credit cards, resulting in high decline rates when customers are trying to buy from non-Brazilian websites .
Debit cards, with an estimated penetration of over 65%, contribute little to e-commerce, since most banks have not enabled debit for online purchases . Largely due to fear of fraud, a debit purchase is much harder to be challenged since the funds are withdrawn from the account as soon as the purchase is confirmed. Despite the impressive growth of more than 100% in two years, today debit cards make up only 5% of all e-commerce spend, up from 2% in 2018 .
Pix, the instant payment system launched by the Central Bank in November 2020, has potential to become a relevant e-commerce payment method, but most likely not until the latter half of 2021 and into 2022 . As of January 2021, while more than 50 million Brazilians have signed up to use Pix, only three million merchants have done so .7 Local industry players expect Pix to ramp up as a payment method in six months or more, once sufficient testing has been done as to the platform’s security and integrity . Within e-commerce, Pix will eventually take share away from cash and bank account-based payment methods because of its very easy UX, but it will have a hard time competing with credit cards, which Brazilians adhere to for their points and miles and also installments .
7. Brazilian Central Bank
While Pix may eventually disrupt existing payment methods, the 60% of Brazilians who do not have a credit card still prefer to buy online via boleto bancário, a voucher that can be paid in cash or via online banking . Boleto is commonplace in Brazil, used for e-commerce and many other payments, including rent and utilities . Merchants frequently offer a discount for boleto payments because there is no chargeback risk . It is also popular for high-ticket items, for which customers may feel insecure about putting their card information online . Despite its less-than-ideal user experience, boleto today accounts for 13% of all e-commerce spend .
Figure 7. E-commerce volume by payment method, Brazil, 2020, USD BN

23
Relevant regulatory developments
A discouraging 124th place in the World Bank’s Ease of Doing Business ranking is due to Brazil’s complex (and onerous) tax and regulatory system, red tape, corruption and endless permitting requirements . In addition, withholding taxes as high as 35% make it prohibitive to repatriate funds, and strong, local competition poses a business challenge comparable to that of more mature markets . For many, this is a reason to have a partner to enable local payment processing so paramount for Brazil .
Essential takeaways about Brazil
�� Brazil is the largest e-commerce market in Latin America, representing $111 billion in sales . Expected CAGR for the period 2020-2024 is 30% .
�� Domestic-only credit cards remain the leading payment method in e-commerce, representing 55% of total spend (up from 51% in 2018) .
�� ●A growing diversity of products and services offered online, as well as an increasing percentage of the population with access to digital payments, have both been leveraged by the pandemic and increased online channels .
�� More than any other market in Latin America, enabling local payments is a key requirement for international merchants to succeed in Brazil .
Today, the prevalence of local payment methods in Brazil means that international merchants processing offshore continue to have access to only 10% of the country’s total e-commerce market .
24
Market size, growth, COVID-19 impact
With among the highest banking (82%) and smartphone (77%)8 penetrations in South America, Chile is one of the markets with greatest potential for digitization and e-commerce growth in its region, thanks in part to several e-commerce giants, including retailers Falabella, Ripley and Cencosud, as well as the continent’s largest airline, LATAM . E-commerce volume in 2020 exceeded $13 billion, giving it the highest per capita e-commerce spend in Latin America of $697 .
Chileans are well-versed in using both debit and credit cards, both of which supported rapid growth of the e-commerce sector during the COVID-19 pandemic (51% over 2019) . Retail was the biggest winner, achieving triple-digit growth in certain months of the year, thanks to a boom in grocery, cosmetics, healthcare, home appliances, decor, technology and home improvement supplies . As of September 2020, a study by the Chilean Chamber of Commerce also reported that 46% of Chileans declared that their increased e-commerce shopping habits would outlast the COVID-19 pandemic, meaning that the momentum gained in 2020 will be permanent .
8 . AMI estimates based on historic data from the World Bank and GSMA combined with local sources and AMI analysis
Despite this, until 2016, Chile only had one card acquirer, Transbank, meaning that competition and fintech have been slow to flourish. Although other acquirers like Multicaja and GetNet are now operating, Transbank still processes over 90% of card-based e-commerce volume . Scarce competition has resulted in a poor e-commerce user experience and a lack of innovation commonly found in other markets, such as one-click checkout and digital wallets that remove friction and enhance security . To serve this unmet need, national banks and retailers Falabella and Ripley are all innovating in payments, launching wallets (e .g . MACH from Banco BCI, Chek from Ripley and FPay from Falabella) for both on and offline payments, which puts pressure on Transbank to up its game .
Because of the monopolized landscape, it can be difficult for international merchants to establish operations in Chile and gain a relationship with Transbank . In addition, Chile’s small population often deters international merchants from investing there . All the while, Chile also has one of the highest shares of cross-border e-commerce in the region (30% in 2019, which fell to 13% in 2020 due to coronavirus), with global marketplaces like AliExpress, Amazon, eBay and Wish at the top of the ranks, as well as streaming and online gaming .
Chilee-commerce payments overview

25
Source: Interviews, AMI analysis
Source: Interviews, AMI analysis
Key stats Domestic vs. cross-border shopping
27%73% of online sales were
to local merchants
of online sales were cross-border
E-commerce market size
$13B28%
in total e-commerce spend in 2020
projected 2020-2024 CAGR
Figure 8. Historic and projected e-commerce volume, Chile, 2018-2024, USD billions
What is driving Chile’s e-commerce growth in 2021?
�� Online retail: Chile is home to three of the region’s largest retail chains: Falabella, Ripley and Cencosud, which are also the country’s top innovators, especially during COVID-19 . Both Falabella and Ripley have launched digital wallets, with Falabella’s FPay being the first to integrate with GooglePay . Falabella reported regional 348% growth9 in Q3 2020 .
�� SMEs: Growth in Chile’s e-commerce industry ties into the growing entrepreneurial scene with emerging small and medium-sized companies
9. Gross merchandise value
wanting to gain an online presence . In February 2021, Transbank partnered with content management system Wix to permit merchants to launch online stores and accept card sales . As more tools like this become available, the Chilean e-commerce market will become increasingly dynamic and diversified.
�� Startups and fintechs: Despite market concentration in payments, Chile has a vibrant startup community, bolstered by the government agency Start-Up Chile . One standout includes Pago46, which enables Chileans to purchase e-commerce goods with cash, while La Plataforma specializes in blockchain-powered technology for speedy international money transfers . These are just some of the emerging enterprises that prove the strength of Chile’s long-term growth potential in digital payments and commerce .

26
How do Chileans pay?
Credit cards grabbed the highest e-commerce share in 2020 (55% of spend), increasing by 12% since 2019 . Part of the popularity of credit cards is driven by the high use of installments, which can represent over 50% of credit card purchases depending on the vertical .
Debit cards represent 24% of the market in Chile, and while many are now enabled for international use, some 50% can only be used domestically . A subset of debit, prepaid cards linked to digital wallets are growing, particularly among the unbanked and younger population (18-25 years olds) . The leaders are Banco BCI’s MACH attached to a virtual prepaid card, as well as Tenpo (from Multicaja) and Santander’s financial inclusion platform, Superdigital. Together, there are roughly five million prepaid cards in circulation that get counted as debit cards when measuring e-commerce volume .
Mercado Pago, Latin America’s most widely used wallet, has a small presence in Chile compared to other markets where it dominates, like Argentina and Brazil . However, Mercado Pago’s investor reports reveal that 7% of Chile’s population purchased online goods through this wallet for the first time in 2020, adding to its pre-pandemic app user base of eight million .
Cash payments for e-commerce are on the decline in Chile, although a handful of cash voucher platforms offer e-commerce payment capabilities to the unbanked, including Servipag, Sencillito and Pago46 .
Figure 9. E-commerce volume by payment method, Chile, 2020, USD BN

27
Relevant regulatory developments
In April 2020, the Ministry of Economy and Santiago Chamber of Commerce debuted new digital tools for SMEs to improve operations, including security, transactions, marketing, payment methods, logistics and consumer flows . Similarly, Chile’s Ministry of Culture started to train artisans in August 2020 on how to incorporate e-commerce into their protocols, particularly to enable sales on mobile devices .
Essential takeaways about Chile
�� Chile has all of the necessary tools to become an e-commerce powerhouse in South America due to its high internet, smartphone and banking penetration levels .
�� Transbank historically had the upper hand in Chile, as merchants could tap into 90%+ of the Chilean card market with just one integration . However, the scene is becoming more diverse with increasing competition, which should accelerate market growth .
�� E-commerce increased its penetration of online retail in 2020 as sales in certain categories tripled in 2020 . Chileans are more ready than ever to shop online, especially for everyday domestic items .Chileans are equipped to pioneer
South America’s e-commerce revolution, and with high credit card penetration, they are eager to purchase on the international market . Nonetheless, international merchants must be connected locally to be able to offer installments, a mainstay in the Chilean shopping experience, and connect to domestic-only debit cards .

28
Colombiae-commerce payments overview
Market size, growth, COVID-19 impact
With a highly educated citizenry and large professional class, in many ways Colombia is primed for digitization due to its exhibited fast technology and e-commerce adoption . At 79%, Colombia has the second-highest smartphone penetration in the region10 and is home to Latin America’s foremost superapp, Rappi, a delivery service platform turned unicorn in 2019 thanks to a $1 billion investment from Softbank . Rappi now is active in over a dozen verticals, as well as payments and financial services with its wallet RappiPay, created in partnership with Banco Davivienda . Ultimately, Rappi has put Colombia on the map as a hub for innovation .
At the same time, Colombia has challenges to its digital revolution, such as mountainous regions of the country with minimal communications, technology and banking infrastructure . Moreover, Colombians have a high preference for cash (81% of overall retail spend is in cash)11 and a concentrated payment processing industry that has curbed the expansion of digital financial services. In 2020, Colombia experienced a boost in banking access thanks to a government program that paid out social benefits via bank accounts and digital wallets in response to the COVID-19 pandemic . Even so, 40% of Colombians are still unbanked .12
10. AMI estimates based on 2018 GSMA data and local11. AMI analysis based on EIU data and local official sources, 202112. AMI analysis based on EIU data and World Bank data and local official sources, 2021
Despite these challenges, Colombia experienced a similar surge in e-commerce in 2020 as its neighbors, albeit at a lower rate of 20% growth over 2019, (compared to 54% in Peru and 33% in Mexico) . Total volume reached $16 billion — making it the third-largest e-commerce market in the region . COVID-19 has dramatically changed the local landscape: at the start of 2020, travel and transportation (including ride-hailing apps) represented 30% of total market spend . Yet by August, this category had declined in share to <5% . Large supermarkets and big box stores (namely Exito, Carulla, Jumbo and Alkosto) experienced the greatest increase, moving from 12% share in January 2020 to their peak of 35% in June . Other categories with large jumps were online education and school supplies, as well as books and paper products . In total, retail grew 38%, digital services upwards of 75%, and travel fell more than 50% .
Rappi and similar platforms saw the greatest lift during COVID-19, serving not only to boost 2020 volumes but to introduce new consumers and merchants to e-commerce, which will have lasting effect . During the pandemic, Rappi experienced record-level demand from merchants wanting to onboard onto their platform, including small neighborhood retailers and fine dining restaurants. During 2020, Rappi also entered new verticals including gaming, live events, music streaming and travel . While these new capabilities are not unique to Colombia (Rappi is present in nine regional markets), the unicorn’s penetration is strongest in its home market where it arguably has the greatest impact .

29
Source: Interviews, AMI analysis
Figure 10. Historic and projected e-commerce volume, Colombia, 2018-2024, USD billions
Alongside other food delivery apps like iFood and Domicilios .com, Rappi has contributed vastly to the conversion of Colombian users to e-commerce and will underpin its future annual growth of 21% .
Source: Interviews, AMI analysis
Key stats
Domestic vs. cross-border shopping
18%82% of online sales were
to local merchants
of online sales were cross-border
E-commerce market size
$17B21%
in total e-commerce spend in 2020
projected 2020-2024 CAGR
What is driving Colombia’s e-commerce growth in 2021?
�� Continued desire to avoid crowds: The Colombian government enacted severe COVID-19 lockdowns in March 2020 lasting for five months. In September, the restrictions were eased but the state still maintained a “selective quarantine” that banned large gatherings . This was meant to be lifted in January 2021 but was extended through February . Consumers are wary of contagion and will continue to avoid shopping malls and events throughout 2021, contributing to the growth of online retail and entertainment .
�� New customer segments: Older consumers, middle-to-low-income consumers, as well as consumers located in secondary cities and rural areas, will drive e-commerce in 2021 as the channel expands beyond its traditional client base .

30
How Colombians pay
Credit cards are the preferred way to pay online in Colombia, representing 41% share in 2020 . Most credit cards are cross-border ready, meaning banks do not automatically restrict Visa and Mastercard from international use . There are a few local-only credit card networks, including cards issued by large retailers Exito, Olypmica, Codensa and Alkosto, but their use in e-commerce is small . Even so, only <30% of Colombians own a credit card, making it difficult for most Internet users to transact online.
For those who do pay with credit cards, installments are very important . Colombians commonly pay for even everyday items like groceries in installments, and large purchases are broken up into 9, 12, or even 24 monthly payments . This is especially true within e-commerce and for lower-income consumers who depend on installments to get through the month . Merchants who are unable to offer financing because they are collecting payments offshore run the risk of being priced out of the market .
Yet, despite their popularity, credit cards actually lost share in 2020 compared to 2018, as bank transfers rose rapidly, 38% over 2019 . Pagos Seguros Online (PSE) is a platform enabling consumers to make a direct ACH payment for e-commerce purchases, enabled by the local clearinghouse, ACH Colombia . This payment method has grown as merchants and payment service providers accept it and promote it more widely .
Cash payments are also relevant in Colombia with networks like Via Baloto and Efecty being the most popular providers . However, this category declined 20% in volume in 2020 as Colombians opted for electronic and “safer” payment methods with respect to COVID-19 contagion .
Digital wallets MercadoPago and PayPal claimed a small share in Colombia, around 5% . Beyond these players, an important enabler of e-commerce in 2020 was prepaid cards attached to a digital wallet, marketed toward the unbanked . Movii, Nequi and Daviplata are the leading examples . E-commerce on these prepaid cards are counted as debit spend, helping to drive debit share of e-commerce overall .
Figure 11. E-commerce volume by payment method, Colombia, 2020, USD BN

31
Relevant regulatory developments
In December 2020, President Ivan Duque signed a new bill into law meant to support the opening of the acquiring space in Colombia by attracting new payment facilitators . The law allows non-bank players who do not need to be regulated by the Financial Superintendent to offer acquiring services . It also calls for greater transparency in interchange fees charged by banks, which will likely lead to a better fee schedule for merchants and promote increased acceptance . With these new rules, local e-commerce acceptance is likely to grow in 2021, creating an increasingly dynamic local market .
Essential takeaways about Colombia
�� Colombian e-commerce is sized at $16 billion, making it the number three market in Latin America growing at 21% annually .
�� Colombia is home to super app Rappi, which has helped expand e-commerce in myriad verticals and is preparing Colombia for continued growth and innovation .
�� With digital wallets growing in impact and the change of rules to the acquiring landscape that was approved in December 2020, the Colombian payments market is poised to open up aggressively in 2021, making it both more attractive to international merchants and more competition .
In Colombia, internationally enabled credit cards represent only 41% of the total market, meaning global merchants who don’t connect locally miss out on more than half of the Colombian market . Offering debit cards and bank transfers are paramount to be able to serve Colombia’s maturing e-commerce customer base .

32
Egypte-commerce payments overview
Market size, growth, COVID-19 impact
At the epicenter of trade and commerce between Africa and Asia, Egypt is among the most promising e-commerce markets for long-term growth . On one hand, worsening inflation has motivated citizens to seek cost-effective alternatives for everyday purchases, such as online shopping . With this comes more exposure and understanding of digital payments, made evident by credit card share of total e-commerce volume growing from 5% in 2018 to 24% in 2020 . Equally influential are age demographics, since over 50% of the 100 million population is under 30 years old . For some, the stage is already set in Egypt for e-commerce expansion .
Even so, challenges persist with subpar internet connectivity and complicated logistics for merchants wanting to gain a foothold in Egypt . Similarly, outdated information and communications technology (ICT) infrastructure paired with drawn-out negotiations to build trust between buyers and sellers have made Egypt a challenging business culture to navigate at times . Nonetheless, such circumstances mean that Egypt is full of untapped potential for dedicated merchants willing to put in the work .
Despite less than 5% of Egypt’s population being e-commerce customers in 2018, like other nations, COVID-19 accelerated demand with 35% e-commerce growth in 2020 . Consequently, companies like Jumia increased sales by 50% while digital payments firms like Fawry reached $1 billion market value . According to a Mastercard study on consumer spending in November 2020, 72% more Egyptians resorted to online shopping since the pandemic started .
Source: Interviews, AMI analysis
Key stats
Domestic vs. cross-border shopping
10%90% of online sales were
to local merchants
of online sales were cross-border
E-commerce market size
$3B38%
in total e-commerce spend in 2020
projected 2020-2024 CAGR

33
Source: Interviews, AMI analysis
Figure 12. Historic and projected e-commerce volume, Egypt, 2018-2024, USD billions
What is driving Egypt’s e-commerce growth in 2021?
�� Population distribution: E-commerce penetration will likely flourish in both urban and non-urban areas in Egypt . About half of Egypt’s population resides outside of urban areas, many of which have internet connection thanks to government programs . Online retailers Jumia and Souq have made efforts to access the portion of consumers living outside of the major metropolitan areas of Cairo and Alexandria . Simultaneously, logistics company Aramex is investing in improving last-mile delivery, making it easier for global merchants to enter the scene and reach consumers located in urban areas and beyond .
�� Government support: The Egyptian government has advocated for e-commerce growth in the past, which plays an influential role in transforming digital payments . In April 2018, Egypt released a plan to double the number of online businesses by 2020, as well as create new job opportunities and increase competitiveness . With this also came a commitment to increase government spending on technology . As reported by the World Bank, in 2019 Egypt received a $1 billion loan specifically to invest in financial technology, and the government expects to raise ICT spending from 3 .1% of GDP in 2019 to 6% in 2025 .

34
How Egyptians pay
Cash has historically dominated in Egypt as most working people deposit their wages into bank accounts to accrue interest and withdraw funds out of ATMs to spend money . This helps explain why cash payment methods in total represented 56% of e-commerce volume in 2020 . Online cash payments are dominated by Fawry, a digital platform by which consumers can make a purchase online and pay for the item in cash by presenting a unique code at over 150,000 retail locations across the country . Representing 42% of the e-commerce market, Fawry is an absolute must for international merchants wanting to collect payment from Egyptian shoppers . An additional 14% of e-commerce spend is cash on delivery .
Yet, total cash payments are down from 64% in 2018 as Egyptians increasingly adopt credit cards and digital wallets to pay online . Local providers including Vodafone, CID Bank and National Bank of Egypt offer a digital wallet to make e-commerce payments . Also, leading PSP PayFort (acquired by Amazon Payment Services) partnered with fintech VaIU in Q1 2020 to offer installment payments to shoppers at checkout, with payment collected directly from their bank account .
While no local wallet13 has dominant market share yet, Egyptian e-shoppers are experimenting with digital payment methods that increase convenience and make them feel secure when shopping online . Merchants must be plugged into these local payments to fully understand how local consumers think and participate in online payments .
13. Observers of Egypt’s e-commerce market may consider Fawry a “wallet” since it enables both bank account and cash payments and is integrated with several online merchants and public utilities . However, for the purposes of this study, Fawry is characterized as a “cash-based payment platform .”
Figure 13. E-commerce volume by payment method, Egypt, 2020, USD BN

35
Relevant regulatory developments
A policy paper released by the Institute of National Planning in June 2020 formally made suggestions to the Egyptian government to further stimulate e-commerce growth . Under this fell a national strategy, quick adoption of e-commerce laws, combining formal and informal markets, in addition to adopting a national digital identity number for every citizen . Prior to this, the government made an amendment to value-added tax (VAT) plus custom duties to include e-commerce and digital services in April 2020 .
Essential takeaways about Egypt
�� Long-term e-commerce growth will continue to exceed 30% per year thanks to youthful demographics, increasing digital payment methods, plus government support .
�� Cash vouchers are the #1 e-commerce payment method but are noticeably declining with credit cards and digital wallet purchases on the rise .
�� The fact that the Egyptian government has promoted e-commerce so ardently means that over time, merchants and consumers are going to see fewer barriers to market entry .
Connecting to local payment methods like cash voucher platform Fawry and the growing wallet landscape is essential for merchants doing business in Egypt . Outside of international credit cards, local payment methods account for 81% of total spend .

36
Indiae-commerce payments overview
Market size, growth, COVID-19 impact
Long considered a strategic market for global e-commerce players, India’s blossoming online marketplace guarantees long-term growth as more citizens gain access to the internet, smartphones and banking . Galvanized by a growing GDP and eager middle class, annual e-commerce spend leaped from $55 billion in 2018 to $85 billion in 2020, with COVID-19 as a major growth factor . Combined with a 10% gain in household income over the past decade, by 2021, e-commerce is predicted to reach $100 billion in 2021, especially as domestic players reach more rural areas of the country and delivery logistics improve, two trends actively underway in the wake of COVID-19 .
E-commerce growth is supported by the variety of payment methods available, including credit cards as well as bank transfers, digital wallets and cash on delivery, all of which serve the millions of Indians without a bank account . Locally, e-commerce giants Flipkart, Amazon India, Paytm Mall and Snapdeal are the leading online stores . These helped close the supply gap for consumers during COVID-19 quarantines, supplying everything from personal and sanitary products, furniture, electronics, home improvement supplies, clothing, home goods and groceries .
With the travel industry declining more than 30% and ride-hailing falling over 60% in 2020, today retail makes up an estimated 70% of e-commerce volume in India . Streaming services and the burgeoning food delivery segment also grew faster than the market average in 2020 . Sources predict that food-related e-commerce purchases will continue to spike as more Indians continue working from home and vehemently avoid crowded places like markets, grocery stores or shopping centers .
Source: Interviews, AMI analysis
Key stats
Domestic vs. cross-border shopping
18%82% of online sales were
to local merchants
of online sales were cross-border
E-commerce market size
$85B17%
in total e-commerce spend in 2020
projected 2020-2024 CAGR

37
Source: Interviews, AMI analysis
Figure 14. Historic and projected e-commerce volume, India, 2018-2024, USD billions
What is driving India’s e-commerce growth in 2021?
�� Affordable data: Growing internet penetration, which is directly related to e-commerce growth, can be attributed to cost-effective rates for phone data in India . In recent years, mobile data companies like Reliance Jio have optimized prices to assist the population in adopting smartphones and mobile internet .
�� Digital payments: Growing digital payments and the decline of cash are translating to lower operational costs for e-commerce merchants, who then transfer these savings to consumers in the form of discounts, points and other rewards . This is most common among ride-hailing and delivery platform companies, and retailers as well, as fierce competitors vie for market share.
�� Organic growth: While a $85 billion market size is large compared to many emerging markets, e-commerce spend per capita is low in this country of a billion people (only $63 compared to $526 in Brazil) . India has years of double-digit organic e-commerce growth ahead as the country goes through massive digital transformation .

38
How do Indians pay?
Today, the most prevalent form of e-commerce payment is credit cards, taking 30% market share, up from 28% in 2018 . For many, this uptick coincides with India’s rising socioeconomic classes, yet credit cards are still mostly limited to the affluent who use them to take advantage of special installment deals for big ticket items . These are known as Easy (or Equated) Monthly Installments (EMI) and are essential for even upper-middle class shoppers to afford large items like airplane tickets, refrigerators, televisions and electronics .
Debit card purchases for e-commerce represented 19% of spend in 2020, 64% over 2018, highlighting a trend of fewer Indians wanting to take on debt during the pandemic . In addition, a sizable amount of e-commerce consumers still gravitate towards cash on delivery, specifically lower-income Indians who may not have a bank account or trust e-commerce channels .
In hopes of lessening society’s dependence on cash, the National Payments Corporation of India launched the Unified Payments interface (UPI) in 2016 to streamline real-time payments by using digital methods on mobile devices . Using UPI, consumers can send instant interbank transfers through an expanding network of over 100 Indian banks . UPI has helped transform India’s payment scene by sucking cash out of the system and making great leaps in e-commerce, today representing 14% of spend .
Finally, digital wallets are showing promising growth for the tech-savvy who are keen to shop online over mobile and want a secure experience . Local players report that wallets like Mobikwik, PayZapp, and PayTM, which attract members of India’s middle and upper-middle classes who already represent 11% of spend, are growing at 40% per year, faster than any other payment method . Although to a lesser extent, these wallets also attract consumers without a credit card who want a convenient way to pay online .
Figure 15. E-commerce volume by payment method, India, 2020, USD BN

39
Relevant regulatory developments
Revised KYC guidelines mandated wallet companies to connect user accounts to a government-approved ID, which complicated matters for some consumers without the proper paperwork . As of February 2020, however, the Reserve Bank of India was reportedly allowing 200 million digital wallets to remain open despite non-compliance . This has helped support digital wallet growth .
In 2018, authorities implemented a goods and services tax (GST) to apply to both local and international e-commerce entities based on a policy called Tax Collected at Source (TCS), meant to streamline tax payments . While initially thought to be a burden on the industry, it has ultimately simplified tax payments for e-commerce companies and has not transferred into decreased sales .
Relevant takeaways about India
�� India has tremendous potential as e-commerce penetration is still low . This market will exceed $100 billion in 2021, growing at 17% annually .
�� The un- and underbanked of India still need support to access international e-commerce via bank transfers and wallets focused on financial inclusion. Merchants can serve this evolving consumer base through local payment connections .
�� India’s advanced UPI system will help facilitate the arrival of more international players in the e-commerce market as it supports the development of digital payments and e-commerce overall .
Cross-border payment processing only gives merchants access to 30% of Indian e-commerce market—the amount spent using internationally enabled credit cards—while local wallets, bank transfers and debit cards represent the bulk of the market . Merchants must offer a localized payment experience to consumers in this increasingly competitive marketplace .

40
Mexicoe-commerce payments overview
Market size, growth, COVID-19 impact
Mexico is among the most strategic Latin American markets for global e-commerce players based on its close proximity to the US, high smartphone penetration of 75% and population of 128 million . The second-largest e-commerce market in Latin America reached $37 .5 billion in 2020, an increase of 33% over the previous year . The pressures of COVID-19 were arguably more impactful here than in many other emerging markets because of Mexicans’ historic preference for cash and resistance to digital payments . Sparked by COVID-19 quarantines, retail surged 33% in 2020, led by marketplaces Mercado Libre and Amazon, as well as well-established retailers Walmart, Liverpool, Palacio de Hierro and others . Additionally, cross-border e-commerce is high in Mexico—22% in 2020—especially in the retail vertical due to the large border that the country shares with the US. Specifically, US-based merchants are able to store goods in large warehouses in Texas and easily ship them across the border, helping to maximize the variety of goods available in Mexico and keep prices down .
The Mexican Internet Association reports that COVID-19 helped establish e-commerce as a habit for more Mexicans than ever before, with 74% of non-users buying online for the first time in 2020.
It also established a precedent for new product categories, with fashion accessories, personal care products and tools being the top products that first-time users purchased online in 2020. In terms of overall retail share, technology, clothing, sporting equipment, furniture and home decor were the largest categories . Digital goods fared even better than retail, growing over 100% in some product categories, like food delivery . Multiple platforms provide this service, including regional leaders UberEats, Rappi, PedidosYa, as well as grocery delivery platforms such as Cornershop and Jüsto .
All the while, e-commerce still has some challenges in Mexico . For example, 80% of those who still do not shop online cite fear of fraud as the number one deterrent, and 25% say they do not know how to use e-commerce . Despite Mexico’s large middle class and tech-savvy population, income inequality and poverty still plague many parts of the country, making it hard for some to join the digital economy . Despite the feverish growth of fintech in urban centers among millennials, a staggering 55% of Mexicans still do not have a bank account and only around 25% have a credit card . For this reason, cash-based payment methods for e-commerce play an important role in the sector’s development, despite the increase of digital payment methods overall .

41
Source: Interviews, AMI analysis
Figure 16. Historic and projected e-commerce volume, Mexico, 2018-2024, USD billions
What is driving Mexico’s e-commerce growth in 2021?
�� Online retail: The pandemic gave millions of Mexicans a taste of e-commerce for the first time, especially in new product categories like personal care, clothing, pharmacy, groceries, and furniture, which were traditionally reserved for the brick-and-mortar channel . With global powerhouses like Mercado Libre and Amazon vying for market share, the product diversity and online user experience is improving, attracting more customers to the channel .
�� Growth of digital banking: Mexico gained international fame in 2018 when it passed the region’s first fintech law, enabling non-banks to collect deposits as well as issue prepaid and debit cards. Now, nearly two dozen fintechs, including MercadoPago, RappiPay, Nubank, Albo, Cuenca, Klar, among many others, provide this service, offering a free account and digital onboarding to Mexico’s un- and underbanked . This, in combination with traditional banks improving their online banking service, is supporting the growth of digital payments in all verticals .
Source: Interviews, AMI analysis
Key stats Domestic vs. cross-border shopping
22%78% of online sales were
to local merchants
of online sales were cross-border
E-commerce market size
$37B27%
in total e-commerce spend in 2020
projected 2020-2024 CAGR

42
How do Mexicans pay?
Despite the heavy weight of cash throughout the Mexican economy, credit and debit cards make up the majority market share for e-commerce spend . In Mexico, credit cards lead with the way with 43% . Reflective of the country’s high cross-border spend, practically every credit card in Mexico is internationally enabled . However, global merchants still need to connect to local acquirers to offer installments that are highly popular, especially during holidays and promotional seasons like Black Friday, Christmas and Mother’s Day . During these times, local merchants offer generous promotions and extended payment plans and the penetration of installments can exceed 60% of volume .
Debit cards are essential to e-commerce in Mexico, representing 26% of share . Unlike most other Latin American markets, debit cards in Mexico carry a CVV code, making them automatically enabled for e-commerce . This opens up online shopping for the millions of Mexicans who have a debit card but no credit card . Debit cards are the payment method that rose the most during the COVID-19 pandemic, 55% over 2019 .
Beyond cards, with a 55% unbanked population, alternative payment methods have found a large market in Mexico . A plethora of cash voucher platforms exist, the leader being Oxxo, the country’s largest convenience store chain with over 16,000 retail locations . Others include 7Eleven, Farmacias del Ahorro and OpenPay, an e-commerce payment platform owned by Banco BBVA . These platforms enable shoppers to place an order online, print out a voucher with a barcode (or download it to a mobile phone), and then use this barcode to pay in cash at affiliated retail locations. While this payment method declined significantly in 2020 due to COVID-19, it still represents 10% of total share .
Finally, wallets represent a growing share of e-commerce in Mexico with PayPal leading, especially for cross-border purchases, and MercadoPago close behind it . These wallets are mostly used for their card-on-file capability, adding an additional layer of security for credit and debit card purchases, but MercadoPago, which also operates as a digital account and stores funds, is growing as a payment method for the underbanked .
Figure 17. E-commerce volume by payment method, Mexico, 2020, USD BN
43
Relevant regulatory developments
The 2018 Fintech Law has made waves in Mexico . While most consider it to be positive for digital payments by providing regulatory legitimacy to a fledgling market and attracting investment dollars, others opine that the law has introduced too much red tape and hindered growth of the sector . In fact, in 2020 the CNBV (the regulating body) had severe delays in approving applications for fintech licenses while also cracking down on the stop-gap method that many companies have used while waiting for their licenses to be approved (or to avoid having to get a license at all): that of “renting” wallet and card-issuing capabilities from another regulated entity, a practice commonly known as fintech-as-a-service. Presently, the fintech sector in Mexico is rife with uncertainty as the CNBV recuperates from COVID-related delays and re-establishes normal operations .
In 2019, the Central Bank of Mexico launched CoDi, a QR-code functionality for its real-time ACH payment network, SPEI . In an effort to promote the adoption of digital payment methods and reduce cash use, CoDi can be used to make P2P payments and off- and online purchases via QR . Most banks are required to provide functionality in their digital wallets to read CoDi QR codes, which are interoperable across all banks participating in SPEI . While highly visionary in its conception, CoDi has been slow to take off, with only five million user accounts and total transaction volume of $50 million in 2020 . True believers in CoDi have hopes that it will become a commonly used e-commerce payment method, but there is no evidence of this yet .
Essential takeways about Mexico
�� Mexico’s e-commerce market grew 34% in 2020 despite the COVID-19 crisis, with online retail getting a much-needed boost . Projected growth is 27% annually over the next four years to reach $97 billion in 2024 .
�� Debit cards, digital wallets and cash-based payment methods are all significant in the local e-commerce market, with debit growing the fastest .
�� To overcome low credit card penetration and access ~75% of Mexico’s consumers, integration with local payment methods is essential .
Mexico’s e-commerce market still has enormous growth potential with only 45% bank penetration and a large, young, urbanized population . International merchants must connect to local payment methods, representing $23 billion, to be able to offer installments and accept debit cards and digital wallets, as well as cash-based payment methods, in order to reach this population .

44
Market size, growth, COVID-19 impact
Due to a location at the crossroads of Africa and Europe, geography has cultivated a thriving market culture in Morocco . Cash has historically dominated in its iconic bazaars and souq markets, driven by the cultural practice of inspecting items before purchase. However, recent data shows a significant decline in cash-based payments for e-commerce, falling from 74% of e-commerce volume in 2018 to 41% in 2020 . This implies that credit and debit cards and other digital payments have started to replace traditional methods . Given its high internet connectivity, higher banked population and governmental support, global merchants should be optimistic about Morocco as online payments gain momentum and make cash more obsolete .
Making positive strides, internationally enabled and domestic credit cards respectively comprised 10% of the total market in 2020, while debit accounted for 27% . Regardless of the payment method, though, trust must be established between buyers and vendors for any conversion to take place in Morocco . Whether buying through retail or e-commerce channels, many Moroccan consumers still prefer to hold, taste, weigh, or at least view goods prior to handing over any dirham, which explains why cash on delivery still accounts for 41% of total e-commerce spend in Morocco .
Morocco’s domestic market is where most of the action takes place today, and a majority of e-commerce sales come from just two regional merchants: Jumia and Hmizate. As an incentive for consumers to adopt digital payments, Jumia frequently offers 10% discounts on purchases paid for with cards, particularly throughout the COVID-19 crisis . Like other countries, COVID-19 spurred e-commerce purchases in Morocco, bringing the total volume to over $514 million (35% growth over 2019), with upticks in domestic goods as well as digital entertainment and content streaming .
Cross-border e-commerce is poised to grow for international merchants who are prepared to accept local payment methods, particularly debit cards and domestic-only credit cards .
Morocco e-commerce payments overview
Source: Interviews, AMI analysis
Key stats
Domestic vs. cross-border shopping
3%97% of online sales were
to local merchants
of online sales were cross-border
E-commerce market size
$514M38%
in total e-commerce spend in 2020
projected 2020-2024 CAGR

45
Figure 18. Historic and projected e-commerce volume, Morocco, 2018-2024, USD millions
Source: Interviews, AMI analysis
What is driving Morocco’s e-commerce growth in 2021?
�� High internet connectivity: An undeniable advantage in Morocco is high internet penetration at 64%, so most of the population has access to the web for e-commerce shopping .
�� Bank accounts: Over half of Morocco maintains a bank account, better than most countries on the African continent, which is conducive for digital payment use in general . Moroccans have traditionally withdrawn funds from ATMs to make purchases in cash, although this practice is declining as card transactions increase .
�� Growing financial inclusion: 2015 legislation broadened the definition of “payment institutions” to allow non-bank contenders to offer cards and payment solutions to consumers, such as digital wallets . This has broadened the base of people owning a digital account, which has supported the growth of wallets as a payment method in e-commerce, up to 8% of spend in 2020 compared to 2% in 2018 .

46
How Moroccans pay
Based on Morocco’s primordial market culture, it makes sense that cash payments have been and are still influential in e-commerce . Even so, online debit card purchases have accelerated in recent years, growing from 3% of e-commerce sales in 2018 to a larger 33% in 2020 . This is supported by rapid debit card issuance: Morocco sees an average of one million new debit cards issued each year .
Credit card use is still in the nascent stages in Morocco, providing opportunity areas for global merchants . Many Moroccan merchants do not accept credit cards, so to work around that and provide something similar to credit, they offer deferred debit card payments that allow shoppers to pay off their total purchase balance monthly . This has been popular for domestic e-commerce and Black Friday sales or promotions, which Moroccans happily take advantage of .
Figure 19. E-commerce volume by payment method, Morocco, 2020, USD MN

47
Today, merchants who rely on international credit card processing can only access 10% of Moroccan e-commerce volume . Merchants must connect to local payment methods to fully access this emerging market opportunity .
Relevant regulatory developments
Despite belonging to the top five banking markets in Africa alongside South Africa, Nigeria, Egypt, and Angola, regulations have historically been outdated in Morocco . In recent years, the government has made attempts to modernize regulations, such as the Central Bank’s expansion of the legal definition of “payment institutions’’ in 2015 to encourage digital payments . To attract foreign investment, several government agencies cooperated to launch Morocco Digital 2020, an initiative to promote the North African country as a hub for digital innovation .
Essential takeaways about Morocco
�� With high internet penetration, majority of the population having bank accounts, plus legislation promoting digitization, Morocco has the tools to grow from a fledgling e-commerce market to a major player .
�� In many cases, trust must be established between consumers and merchants before a transaction takes place in Morocco . Especially with the prevalence of fraud, companies must develop secured platforms to earn consumer loyalty .
�� ●Although cash-on-delivery still appeals to many, digital payments, especially debit cards, are growing rapidly and represent the best opportunity for international merchants to serve the digitizing Moroccan population .

48
Market size, growth, COVID-19 impact
As the most populous country in Africa (203 million people), Nigeria is one of the continent’s leading e-commerce and digital payments markets . It has produced some of the continent’s top e-commerce companies, including Jumia, a marketplace that has expanded to 13 other African markets since 2012 . Growing mobile phone and Internet connectivity continues to raise the number of Nigerians willing to buy online, which today totals more than 80 million . It is estimated that 80 million more Nigerians will come online in the next five years, constituting the largest e-commerce opportunity on the African continent today .
The development and expansion of local payment methods for e-commerce, including debit cards and bank transfers, will encourage the population to participate in the growing digital economy—especially considering that a measly 3% of the population owns a credit card . Credit cards are used among affluent Nigerians to make cross-border purchases for products they cannot get locally, but their use is negligible in the local market . In total, the Nigerian e-commerce market reached $34 billion in 2020, up by 32% over 2019 .
During 2020, mobility restrictions put in place due to COVID-19 helped spur e-commerce growth, particularly in categories like groceries and other essential items . Millions of Nigerian consumers
and businesses ventured into e-commerce for the first time in 2020 to fulfill basic needs. In sync with this trend, leading Nigerian fintech and payment players Flutterwave, Paystack, Remita, and Opay launched e-commerce platforms in 2020 to help small merchants easily sell online . COVID-19 has demonstrated to many consumers, merchants, and payment players that e-commerce can become a mainstay in everyday life for most Nigerians .
As a result, local players expect e-commerce growth to accelerate over the next 24 months, possibly surpassing $100 billion in total spend by 2024 .
Nigeria e-commerce payments overview
Source: Interviews, AMI analysis
Key stats
Domestic vs. cross-border shopping
11%89% of online sales were
to local merchants
of online sales were cross-border
E-commerce market size
$33B33%
in total e-commerce spend in 2020
projected 2020-2024 CAGR

49
Figure 20. Historic and projected e-commerce volume, Nigeria, 2018-2024, USD billions
Source: Interviews, AMI analysis
What is driving Nigeria’s e-commerce growth in 2021?
�� Organic growth: Reduced barriers to getting online thanks to expanding internet infrastructure will bring 80 million Nigerians into the digital economy in the next five years.
�� New product categories: Supermarkets grew the most in 2020, more than 50% according to local payment processors, and taught people that they can fulfill basic needs online. This has encouraged more small merchants in the grocery, food service, pharmacy, cleaning products, and home goods categories, to sell online and through social media, evangelizing e-commerce to the population overall .
�� Increased trust in digital payments: E-commerce in Nigeria was initially enabled by widespread use of cash on delivery, which was required since most people did not trust the security of online payments . This mistrust is waning, especially after the onset of the COVID-19 pandemic, during which people started to prefer electronic payment methods over cash .

50
How Nigerians pay
For years, Nigerian e-commerce has been driven by cash on delivery, mostly due to low banking penetration and trust . However, since 2012, the policies put in place by the Central Bank of Nigeria under its Cashless Nigeria initiative have aimed to modernize the payment environment by reducing the amount of physical cash circulating within the economy . This, in combination with the rise of popular e-commerce merchants, have encouraged the adoption of digital payment methods, specifically through debit cards and bank transfers . In 2020, cash on delivery represented an estimated 25% of spend, down from 47% in 2018 .
Today, debit cards are the leading form of payment for e-commerce in Nigeria, representing 26% of spend . Debit cards are massively more available than credit cards to the population overall (32% penetration of debit compared to 3% of credit) . Verve, offered by local network Interswitch, is the leading debit card with roughly 60% market share . However, Verve cards are often not enabled for e-commerce by the issuer, making Mastercard the leading network for online shopping .
Bank transfers are increasingly popular and easy to use for online shopping, enabled by the Nigeria Inter-Bank Settlement System (NIBSS) . E-shoppers can easily enter their bank account information into most merchants’ e-commerce gateways . Offline bank transfers over mobile phone, also known as USSD (Unstructured Supplementary Service Data) payments, are a growing payment method among low-income Nigerians, especially since these can be made with feature phones, which are owned by 50% of the population .
Despite Jumia launching its wallet/superapp JumiaPay and other local wallets offered by PayStack, OPay and PalmPay, digital wallets are still rarely used for e-commerce .
Figure 21. E-commerce volume by payment method, Nigeria, 2020, USD BN

51
Relevant regulatory developments
Over the past decade, the Nigerian government has embraced policies to promote the development of the digital economy, including initiatives to increase internet connectivity and reduce cash circulation . This has helped to set the stage for the growth of e-commerce and access to the digital economy overall .
Essential takeaways about Nigeria
�� Nigeria is the most populous country in Africa with a large and rapidly growing domestic e-commerce market ($34 billion), championed by homegrown e-commerce companies that have expanded across the region .
�� Debit cards are the leading e-commerce payment method, followed by bank transfers .
�� The use of credit cards is extremely low in e-commerce, limiting Nigerians’ ability to shop internationally .
�� Nigeria is set to grow aggressively in the next three years (with a 2020-2024 CAGR of 33%) as millions of Nigerians are expected to come into the digital economy .
The extremely low penetration of credit cards in Nigeria means that acceptance of local payment schemes is essential to reach local e-commerce shoppers and access $34 billion in e-commerce spend .

52
Market size, growth, COVID-19 impact
Showing ebbs and flows, 2020 was a rough year for Paraguay’s fledgling e-commerce market, with total volume falling from $219 million in 2017 to $211 million in 2020 . The landlocked country of seven million largely depends on cross-border e-commerce transactions (74% of total spend), which were interrupted during the pandemic . International marketplaces Amazon, eBay, and AliExpress top the list of online merchants where Paraguayans typically shop .
Despite overall negative growth in 2020 due to the devastation of cross-border spend, especially travel, the small domestic market has been growing at 50% per year since 2017 and continued to boom under COVID-19 . So far, Paraguayans tend to favor electronics, specialized clothing and home appliances when shopping online, although during the pandemic Paraguay also saw the increase of everyday goods like groceries and home goods . According to Bancard (leading card processor) data,
pharmacies saw a 644% increase in e-commerce, household appliances and electronic items 210%, supermarkets 172%, and couriers and transport 19% throughout 2020, while travel dropped by 43% . Although they have smaller penetration in Paraguay than in neighboring markets due to lower technology adoption, Uber and delivery-food platform PedidosYa also have a growing presence in the country . As such, Paraguay represents uncharted territory for international merchants seeking to bring a high-quality e-commerce experience to more consumers .
The majority of Paraguay’s local e-commerce action takes place in Asuncion where the entrepreneurial scene is gaining momentum despite over one-fourth of the two million people living in poverty . Paraguay has low banking and credit penetrations, but one of its advantages is that 73% of working people are under the age of 34, meaning the country is posed to adopt e-commerce methods and digital payment technologies in the coming years . Despite this negative growth between 2019 and 2020, Paraguay still shows untapped potential as one of South America’s most emergent e-commerce markets with projected 2021 growth of 60% .
Paraguay e-commerce payments overview

53
Figure 22. Historic and projected e-commerce volume, Paraguay, 2018-2024, USD millions
Source: Interviews, AMI analysis
What is driving Paraguay’s e-commerce growth in 2021?
�� Internet connectivity: The continual rise of internet penetration is one of Paraguay’s key advantages . According to SENATICS (National Secretariat of Information and Communication Technology), 86% of the population has access to the Internet, with 98% of Paraguayans primarily depending on mobile phones to browse the web . This will be conducive to international merchants selling e-commerce goods on mobile devices .
�� Startups: More citizens will gradually begin to maintain bank accounts as more Paraguayan fintechs sprout up. Bolstered by government initiatives and regional events, fintechs like Goiko, Paybit, Quo Fintech, TaxIt, Prestamos .com .py, among others, have begun bridging the divide between active and non-active members of the national economy . Some startups provide loans to SMEs while others specialize in peer-to-peer lending, all of which provide the citizens with more financial means to engage in e-commerce.
Source: Interviews, AMI analysis
Key stats Domestic vs. cross-border shopping
74%26% of online sales were
to local merchants
of online sales were cross-border
E-commerce market size
$211M50%
in total e-commerce spend in 2020
projected 2020-2024 CAGR

54
How Paraguayans pay
Credit cards saw 89% of e-commerce spend, worth about $187 million, in 2020 . Considering how the World Bank estimates only 7% penetration for credit cards in Paraguay, it reinforces that e-commerce currently has low penetration in the country—and a massive runway for growth .
Due to small banking penetration, it makes sense that cash-based payments, such as voucher systems Aquí Pago and Pago Express, inflated from 3% market share to 8% in 2020, reaching $16 million . Local payment methods are still evolving, particularly the digital wallet offered by Tigo, the national internet, mobile and television service provider . The Central Bank of Paraguay reportedly wants to work more closely with digital wallets still on the fringe in hopes of increasing their usage for e-commerce .
Figure 23. E-commerce volume by payment method, Paraguay, 2020, USD MN

55
Relevant regulatory developments
The national government is working hard to innovate its economy . In August 2019, President Mario Benítez rolled out the National Decree 2314 to create a National Innovation Strategy laying a framework to engage better with citizens . In line with this, the Paraguayan Chamber of Electronic Commerce collaborated with the eCommerce Institute to launch eCommerce Day in June 2019, which was meant to showcase regional talent while attracting development and investment into the country .
Essential takeaways about Paraguay
�� Most of Paraguay’s population remains unbanked, meaning merchants must adapt to local payment methods to reach more of the country’s population .
�� High internet and mobile penetration will foster a conducive market for future e-commerce growth despite the recent decline .
�� While credit cards currently dominate, cash payment methods and mobile money wallets like Tigo are working to incorporate more people into e-commerce; these are likely to grow in future years while the share of credit cards will wane .
Paraguay is a completely green market offering early opportunities for international merchants to bring much needed innovation and diversity into the local e-commerce market . Expected to grow 50% per year through 2024, merchants with a localized strategy could gain major market share in this nascent market .

56
Market size, growth, COVID-19 impact
Because of its smaller population than peers Colombia, Argentina, and Mexico, not to mention economic development highly concentrated in just one city, Peru is often considered the least-developed of the major Latin American markets . Nonetheless, Peru has a higher per capita GDP than Colombia ($6,977 compared to $6,428) and a higher penetration of digital payments within retail than Mexico (16% vs . 14%) . In addition, Peru is home to one of the most successful P2P platforms in Latin America, Yape, owned by Peru’s largest bank BCP and boasting over four million users (nearly 50% of Peru’s banked population) . These factors, along with 75%+ smartphone penetration, is driving one of Latin America’s most exciting e-commerce revolutions .
When COVID-19 hit in 2020, observers thought the pandemic would be particularly damaging to this digital economy, since the government shut down all retail, including e-commerce and delivery apps for the month of March and part of April . However, once e-commerce was permitted to operate, latent demand for e-commerce exploded—some report 10x YoY growth of retail e-commerce throughout April . Not only did Peruvians shop online for physical products at a rate never before seen, but the delivery economy tripled . Restaurants that had never before considered selling online flocked in droves to apps like Rappi, Glovo, and PeruEat .com . Other local delivery players like Motoboy .com came out of the woodwork to facilitate deliveries . As the head of Peru’s Chamber of E-commerce stated, “We saw the migration of a whole industry to the online channel .”
Similarly, top retailers Falabella and Ripley stepped up their delivery game, with a focus on fast, local delivery in Lima for the categories of sporting goods, home goods, technology, home office equipment, and entertainment consoles. Supermarket delivery more than doubled, with supermarket chains Wong, PlazaVea, Tottus and Vivana all pushed to maximum capacity . In addition, millions of small businesses, especially bakeries, butchers, clothing stores, stationary stores, and even beauty salons offering vouchers for future services, began selling online . Since most of these did not have a website pre-COVID, the pandemic drove an increase in sales over social media and WhatsApp using pay links—links offered by local payment facilitators that remit the user to an external checkout page to make the payment .
Online streaming and gaming also surged to accommodate families confined to their homes, namely Netflix, Amazon Prime, and Disney+ . Ride-hailing, which had been growing at tremendous speeds in Peru thanks to Uber, Beat, Cabify, and Didi, declined in 2020, along with travel, in total an estimated 37% for the year .
The result of all this is that Peruvian e-commerce grew 54% in 2020, achieving $6 .8 billion in volume . Retail growth led the charge at 40% growth overall and certain digital services grew by more than 200% (namely streaming and delivery apps), most of the latter representing cross-border spend . With new habits formed and more Peruvians than ever squarely in the digital economy, e-commerce is expected to grow 42% annually over the next several years, reaching $28 billion in 2024 .
Peru e-commerce payments overview

57
Figure 24. Historic and projected e-commerce volume, Peru, 2018-2024, USD billions
Source: Interviews, AMI analysis
What is driving Peruvian e-commerce growth in 2021?
�� Retail delivery: From supermarkets to department stores, to delivery marketplaces like Rappi, to food delivery platforms, the convenience of these services and ongoing fear of contagion will be the number-one driver of e-commerce over the next 12 months .
�� Digital P2P payments: BCP’s Yape has been a major driver of digitization in Peru, exposing banked Peruvians to mobile-based P2P as well as QR code payments for merchant purchases . Peru’s other large banks—Scotiabank, Interbank,
and BBVA—banded together to launch Plin, a competing P2P platform, in 2019 . Together, these two platforms are processing QR code payments for some 500,000 merchants . While these haven’t made large inroads into e-commerce yet, they are bleeding into new segments, such as taxis, competing for ride-hailing market share and blurring the lines between physical commerce and e-commerce .
Source: Interviews, AMI analysis
Key stats Domestic vs. cross-border shopping
18%82% of online sales were
to local merchants
of online sales were cross-border
E-commerce market size
$7B42%
in total e-commerce spend in 2020
projected 2020-2024 CAGR

58
How Peruvians pay
Peruvian e-commerce has traditionally been a credit card-heavy market, since mostly the affluent class participated in online shopping . With more than 75% market share, leading acquirer Niubiz (formerly VisaNet) has longstanding and strong relationships with top merchants for both offline and online payment acceptance . Niubiz has steadily worked on pioneering new verticals and payment technology, including QR codes and contactless payments and has supported e-commerce payment gateways to expand e-commerce . As a result of this work, credit cards have grown steadily in e-commerce and in payments overall, today representing 33% of e-commerce share .
Yet, during the COVID-19 pandemic, debit card share rose the most, reaching 24% of e-commerce volume, up from 12% in 2019, and an astounding 50% of overall card volume (including on- and offline) in 2020. This is the result of three trends: 1) Peruvians without a credit card trying the online channel for the first time; 2) an increase in the online purchase of essential goods like groceries, which are more often purchased with a debit card; and 3) many Peruvians moving away from credit cards in an effort to limit new debt in times of economic uncertainty . In total, debit e-commerce volume grew 200% in 2020 to reach 24% of total share .
Beyond cards, cash payment methods and bank transfers have been important to provide access to the underbanked . Payment platforms such as PagoEfectivo and SafetyPay lead in this space, together representing 10% of total volume . These platforms report nearly 100% growth in 2020, particularly in low-ticket purchases like online gaming and streaming . In addition, in 2019, in recognition of Peru’s large unbanked population and preference for cash, Amazon launched PayCode, a partnership with Western Union in which Peruvians can order on Amazon .com and pay in cash at local Western Union locations .
Digital wallets, namely MercadoPago and PayPal, maintain a small market share in Peru of 5% . These regional players have placed greater focus on other Latin American markets than in Peru, where competition from credit and debit cards is strong . Moving forward, it is possible that P2P platforms like Yape and Plin gain traction in e-commerce, although this is still speculative .
Figure 25. E-commerce volume by payment method, Peru, 2020, USD BN

59
Relevant regulatory developments
The largest impact Peruvian regulation has had on local e-commerce is COVID-19 quarantines, grinding all retail, including e-commerce, to a halt in March and beginning of April . The government kept the majority of the economy closed for much of the rest of the year . Amidst a second spike of cases early 2021, the government reinstated a stay-at-home order in mid-February, ordering all retail to close except essential categories (supermarkets, pharmacies) and for restaurants to operate delivery service only . This will continue to support e-commerce sales throughout 2021 .
Beyond COVID-19, local regulation has been favorable to e-commerce, with none of the restrictive policies observed in other markets, such as taxes on digital goods and transactions or a lockdown on ride-hailing and delivery services .
Essential takeaways about Peru
�� With latent demand for e-commerce suddenly unleashed during the COVID-19 pandemic, Peru’s local market was valued at $6 .8 billion in 2020 . Growing at over 40% annually, it will reach $28 billion in 2024 .
�� COVID-19 served to migrate millions of consumers, as well as merchants, to the online channel, setting the stage for years of high growth and channel development .
�� Debit cards surged the most during COVID-19, opening up e-commerce for millions in a market where only ~10% of adults have a credit card .
�� Cash payment methods remain an important tool to reach the un- and underbanked, especially for high demand and growing services like streaming and gaming .
Peru is one of Latin America’s fastest-growing e-commerce markets, expanding by 54% in 2020 . Continued digitization of both the banked and underbanked will make Peru increasingly attractive to global merchants over the next several years . Tapping into local payment methods such as debit cards and cash payment platforms is critical to reach this digitizing population and 67% of total e-commerce volume .

60
Market size, growth, COVID-19 impact
South Africa’s e-commerce market has been slow to take off, considering it is Africa’s second-largest economy after Nigeria and fifth-largest population. Its isolated geographic location—combined with an economy centered around mineral exports—have contributed to its small $2 .4 billion e-commerce market size in 2018 . The 2020 COVID-19 pandemic, however, has helped to jump-start this sleepy market . With high transmission rates and a corresponding Level 5 lockdown through 2020, South Africans, who typically prefer malls over online shopping, accelerated their online purchasing of physical goods as well as digital entertainment . As a result, e-commerce grew by 36% in 2020, reaching $4 .1 billion and showing its long-term growth potential, with continual supply chain improvements and technological investments contributing .
Local e-commerce development is being driven by only a handful of merchants, the leader being online retailer Takealot .com, which maintains over one fourth of the industry’s market share . During the pandemic, online retailers experienced a boom thanks to the average cart size increasing by over 30%, more elderly consumers shopping online, and more customers from areas outside of urban centers Cape Town, Johannesburg, and Durban . Once exposed to a positive online shopping experience—as well as cheaper prices
than those offered in stores—consumers are likely to return to the channel, promoting long-term growth . This, combined with streamlined internet connectivity and improving logistics, will provide more robust access to e-commerce nationwide .
International merchants have a particular advantage in South Africa because the local e-commerce market is still developing and few merchants are providing high-quality service . Here, international merchants have the opportunity to seize upon the digital momentum created by COVID-19 and find a captive market.
South Africa e-commerce payments overview
Source: Interviews, AMI analysis
Key stats
Domestic vs. cross-border shopping
10%90% of online sales were
to local merchants
of online sales were cross-border
E-commerce market size
$4B22%
in total e-commerce spend in 2020
projected 2020-2024 CAGR
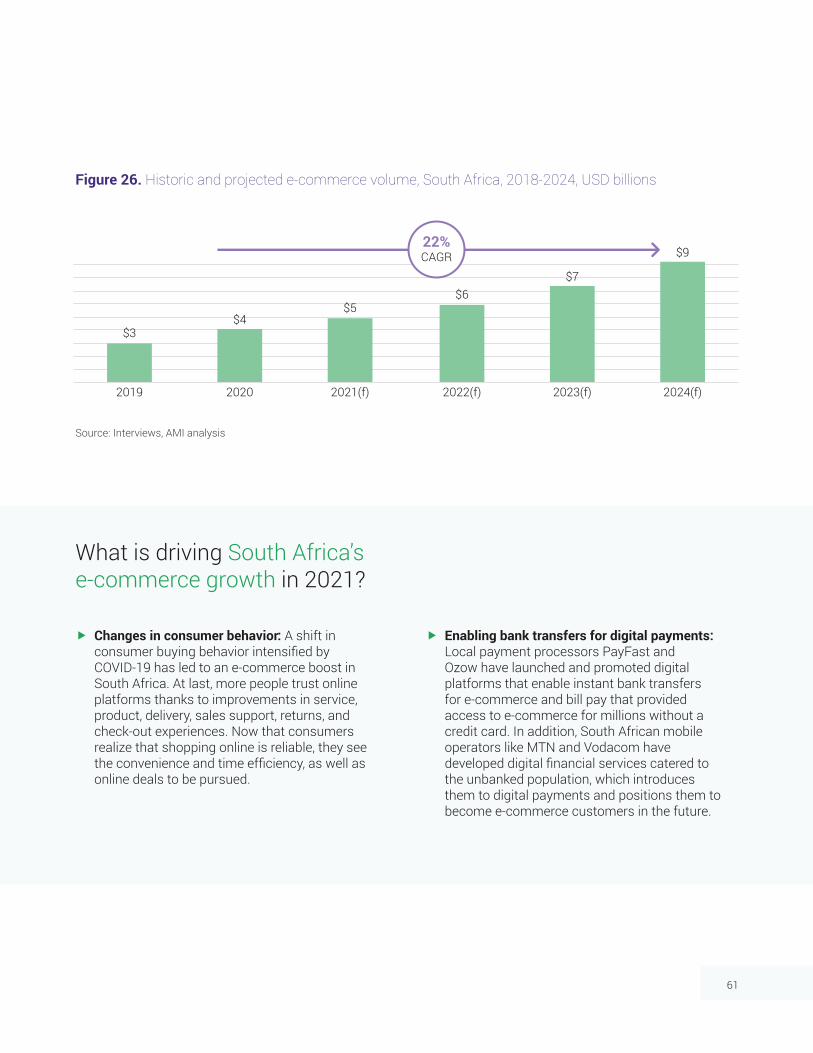
61
Figure 26. Historic and projected e-commerce volume, South Africa, 2018-2024, USD billions
Source: Interviews, AMI analysis
What is driving South Africa’s e-commerce growth in 2021?
�� Changes in consumer behavior: A shift in consumer buying behavior intensified by COVID-19 has led to an e-commerce boost in South Africa . At last, more people trust online platforms thanks to improvements in service, product, delivery, sales support, returns, and check-out experiences . Now that consumers realize that shopping online is reliable, they see the convenience and time efficiency, as well as online deals to be pursued .
�� Enabling bank transfers for digital payments: Local payment processors PayFast and Ozow have launched and promoted digital platforms that enable instant bank transfers for e-commerce and bill pay that provided access to e-commerce for millions without a credit card . In addition, South African mobile operators like MTN and Vodacom have developed digital financial services catered to the unbanked population, which introduces them to digital payments and positions them to become e-commerce customers in the future .

62
How do South Africans pay?
As opposed to other African markets, cash on delivery never gained a strong foothold in South Africa, with online buyers using primarily credit and debit cards to shop online—these represent 59% of total spend . Yet, only 9% of South Africans have a credit card, meaning e-commerce is concentrated among a small affluent class . It also means that there is opportunity to increase spend by debit cards (67% penetration), which are reported by local players to have grown most rapidly during the COVID-19 pandemic . In addition, debit cards are usually not enabled for cross-border shopping, meaning that international merchants must connect locally to accept this growing payment method .
Bank transfers, today representing 19% of spend, are the leading alternative payment method in South Africa, denominated by Instant EFT, real-time account-to-account bank transfers . These are offered by various payment processors, such as PayFast and Ozow, and are attractive to merchants who receive funds immediately when accepting an Instant EDT payment . With their user-friendly interfaces, these Instant EFT platforms are growing in popularity . Digital wallets represent 11% of e-commerce spend and include products such as Mobicred, SnapScan, Zapper, and Masterpass, most of which are offered by PayFast and rely on credit/debit card and bank account rails . For many, digital wallets provide an added layer of security that is desirable in an industry with low levels of trust .
There are still few options for the unbanked to shop online in South Africa . One includes SCode—offered by PayFast—that enables e-commerce users to pay for e-commerce purchases in cash at over 6,000 retailers across the country .
Figure 27. E-commerce volume by payment method, South Africa, 2020, USD BN

63
Relevant regulatory developments
In 2014, the South African government implemented a tax on digital services provided by foreign-owned e-commerce companies . Touted as a way to support local e-commerce companies, this initiative, still in effect today, had a mixed reception because the tax allegedly fell on South African consumers rather than businesses . In other words, many decry this legislation as an attempt by the government to burden citizens with even more taxes .
Essential takeaways about South Africa
�� Internationally enabled credit cards are the leading payment method for e-commerce in South Africa, but these reach only 9% of the population, meaning the country has a massive runway for e-commerce growth within local payment methods .
�� Debit cards and bank-account based payments methods amass over 40% of total spend and are critical for reaching the middle class and those experimenting with e-commerce for the first time.
�� Improvements in local infrastructure, including delivery logistics and internet connectivity, as well as improvements in online professionalism among local merchants, will help develop the e-commerce sector further . International merchants with high-quality websites, checkout flows, and customer service can have an advantage over local players .
While credit card is the leading payment method in South African e-commerce, with a share of 38%, local payments make up the bulk of the market . Local payment integration is critical for long-term success in this emerging market, especially since credit card penetration languishes at <10% .

64
Market size, growth, COVID-19 impact
Sometimes flying under the radar, Turkey represents under-explored territory for cross-border e-commerce . Between its population of 82 million, median age of 32, and preference for payment installments, the European Interbank Card Center reports that Turkey is the fastest-growing nation in Europe for credit card use, signifying that the population is moving toward digital payments and a digital lifestyle in general . This is also demonstrated in the growth of e-commerce, which accelerated during 2020 due to the COVID-19 pandemic and is expected to explode in 2021, reaching 70% growth . Local infrastructure is supporting this boom; not only is there strong smartphone penetration at 61%, but there is also a 1:1 ratio of mobile subscriptions to citizens, meaning both digital literacy and internet connectivity are contributing factors .
There are more reasons to be bullish in Turkey’s e-commerce market, with local e-commerce merchants GittiGidiyor, Hepsiburada, Araba .com, and Trendyol driving the industry and helping consumers to become increasingly comfortable shopping online . In 2020, over 50 million Turks purchased consumer goods online while more than 55 million made digital payments . Select e-commerce retailers and marketplaces grew 90% in total sales volume .
The impact of COVID-19 has been the number one factor shifting how and where Turks spend their money . A leading online marketplace revealed that it had a 420% increase in online food and supermarket purchases in 2020, while there was also a sharp decline in hotel accommodation and transportation . In addition, there were increases in other domestic goods with diapers, pet food, cell phones, sterile gloves, vacuum cleaners, and televisions being the most in-demand items .
Turkey e-commerce payments overview
Source: Interviews, AMI analysis
Key stats
Domestic vs. cross-border shopping
8%92% of online sales were
to local merchants
of online sales were cross-border
E-commerce market size
$28B39%
in total e-commerce spend in 2020
projected 2020-2024 CAGR

65
Figure 28. Historic and projected e-commerce volume, Turkey, 2018-2024, USD billions
Source: Interviews, AMI analysis
What is driving Turkey’s e-commerce growth in 2021?
�� Age demographics: 85% of the population is under 55 years old in Turkey, signifying greater potential future growth than more mature markets such as most of Europe, which on average has an older population and slower projected e-commerce growth rates . With this younger age demographic comes greater willingness to adopt digital platforms, including e-commerce, meaning merchants can more easily access e-shoppers via both desktop and mobile .
�� Credit card installments: Turkish people are no strangers to using credit cards, which are the leading e-commerce payment method with 58% of total share of e-commerce . With this comes Turks’ fondness for paying for things in installments—around 25% of online credit card purchases for physical goods were paid in installments in 2020 .
�� Bank transfers for online payment: The increasing use of bank transfers as an online payment method, which skyrocketed to 28% of e-commerce volume compared to 5% in 2018, is also supporting growth, providing access to online shopping to Turks who do not have a credit card .
�� Improved delivery logistics: Recent improvements in delivery times have been a large driver of e-commerce growth in recent years, as online merchants and their logistics partners have expanded warehouse and shipping capacity to meet growing demand . Considering that 75% of Turks live in cities, such improvements impact the bulk of the population who shop online . Today, shoppers expect their delivery within four days, compared to a week in other parts of Europe .

66
How the Turkish pay
Compared to other growth markets, credit has been king in Turkey, with over 58 million card holders in 2020, who account for 58% of online purchases . Part of the reason for this is that Turkish consumers favor installment payments, especially for large-ticket items like electronics and furniture .
At the same time, the hard economic times brought on by COVID-19 has led some e-shoppers to shy away from credit cards toward bank transfers, locally called EFT (electronic funds transfer), in order to access e-commerce . With higher unemployment and economic uncertainty, many Turks are deciding not to take on additional credit card debt . In addition, bank transfers have increased in popularity among e-commerce newcomers who are reluctant to provide card details online . These factors have caused bank transfer penetration of e-commerce spend to reach 28% in 2020, up from 5% in 2019 .
As digital payments are on the rise, cash payment methods are getting phased out, representing only 4% of e-commerce spend in 2020 . What’s more, spend using a digital wallet and other miscellaneous payments like prepaid cards is also negligible at 1% .
Figure 29. E-commerce volume by payment method, Turkey, 2020, USD BN

67
Relevant regulatory developments
Nebulous laws, tax code, and regulations have traditionally challenged international companies from entering the Turkish market, especially since many fear that authorities could retroactively apply taxes . Over the past decade, regulators have mandated that electronic funds data, documents and other records be physically stored in Turkey for 10 years and accessible for regulatory purposes . For these reasons, many international merchants avoid Turkey if they do not have the support of a local partner .
In a bid to increase demand for domestic loans and credit cards during challenging economic times, in July 2020, Turkey’s Banking Regulation and Supervision Agency eased consumer regulations by increasing the maximum number of monthly installments and reducing monthly minimum payments . In the long run, this will support continued growth of overall consumption as the economy recovers from COVID-19 .
Essential takeaways about Turkey
�� Turkey is the youngest country in Europe with a median age of 32; young Turkish consumers are willing to adopt e-commerce payment methods, indicating future growth .
�� Although Turks are well-accustomed to using credit cards, the emergence of EFT warrants attention for merchants wanting to maximize their local footprint .
�� Turkish consumers prefer to pay for goods and services with installments based on the prominence of credit cards in society .
While 57% of the Turkish e-commerce market is readily available to merchants accepting only internationally-enabled credit cards, 43% of e-commerce spend is made using a local payment method, especially local bank transfers, which has taken share away from cash and expanded the total pie of digital payments . Merchants must connect to local banks to fully exploit this opportunity .

68
Market size, growth, COVID-19 impact
When it comes to impressive development metrics, some would consider Uruguay to be the emblematic middle-income country . With a high GDP per capita of over $16,000, (compared to $10,000 in neighboring Argentina), 91% smartphone penetration, and almost zero extreme poverty, Uruguay is admired by many . Its small population of nearly three and a half million keeps it under the radar for most global players, but Uruguay’s local e-commerce market continues to impress . It reached $2 .8 billion in total sales in 2020, growing 33% over 2019, with per capita annual e-commerce spend over $800, the highest in the region .
While in most small countries, cross-border represents a high share of total volume, Uruguay has managed to develop a bustling local market . For example, local discount coupon seller woOw! outgrew international competitor Groupon and eventually put them out of business in the country, thanks to their use of local payment methods and knowledge of the
local customers . In addition, players Mercado Libre (the leading regional marketplace) and food delivery app PedidosYa dominate in their respective verticals, with more than 40% of internet users using one of these two platforms, according to local sources . During COVID-19, online food delivery purchases in Uruguay increased by more than 50%, and Mercado Libre reported a 70% surge in total sales in 2020, along with a 28% increase in frequency of purchase and 68% growth in the average ticket size over 2019 .
The Uruguay’s Chamber of Digital Economy reported that in 2020, 52% of Uruguayans shopped online, up from 35% in 2018 . Additionally, 42% of the population used the web to pay bills and 34% frequent Uber and PedidosYa, among other apps . These numbers are on par with other regional markets, demonstrating decent e-commerce penetration among the population, with definite room to grow . Challenges within the local e-commerce market include a lack of PCI-compliant local merchants, meaning frequent redirects to external payment platforms, which increases purchase abandonment, as well as the fact that 60% of the population does not own a credit card .
Uruguaye-commerce payments overview

69
Figure 30. Historic and projected e-commerce volume, Uruguay, 2018-2024, USD billions
Source: Interviews, AMI analysis
What is driving Uruguay’s e-commerce growth in 2021?
�� Superb literacy and connectivity: Computer literacy has been high in Uruguay ever since the One Laptop per Child Program launched in 2009 for primary school students . Along those lines, for almost ten years, national telecommunications giant Antel has committed to installing the internet in every household with a fixed phone line. Such high connectivity levels have cultivated a tech-savvy population of digital natives .
�� Entrepreneurial scene: A variety of Uruguayan fintechs have diversified the domestic market and provided new tools for consumers to engage
in digital financial services. Some of these companies include Bankingly (digital banking software for banks), Interir (investment platform), and Paganza (P2P platform), among others . Together, these companies are helping to build a culture of digital payments in all verticals .
�� Latin American merchants: Local e-commerce companies that are leveraging their regional capabilities have moved into Uruguay, namely Mercado Libre, PedidosYa, Rappi, Disco (supermarket chain), and Sodimac (department store) .
Source: Interviews, AMI analysis
Key stats Domestic vs. cross-border shopping
15%85% of online sales were
to local merchants
of online sales were cross-border
E-commerce market size
$3B30%
in total e-commerce spend in 2020
projected 2020-2024 CAGR

70
How do Uruguayans pay?
For the most part, Uruguay is a credit card-heavy e-commerce market . In 2020, credit cards represented 62% of e-commerce volume . Domestic credits cards are also used (representing 10% of spend), as issuers do not always enable Visa and Mastercard credit cards for international purchasing, and the local network Oca is also popular . Credit cards are also appealing since many Uruguayans prefer to pay for e-commerce goods with installments .
Debit cards grew in 2020, attaining 16% of e-commerce spend, supported by the government initiating more involvement with banks to boost enablement of debit cards for online use . Sources at Banco Santander predict that debit cards will be the fastest-growing payment method in coming years, as new consumers who may not have a credit card come to the channel .
Certain alternative payment methods also have relevance in Uruguay, together representing 22% of spend . Mercado Pago, which arrived in Uruguay in 2016, has gained some share as a payment method, while cash-based platforms RedPagos and Abitab enable cash-based payment vouchers used by unbanked e-commerce shoppers .
Figure 31. E-commerce volume by payment method, Uruguay, 2020, USD BN

71
Relevant regulatory developments
It is widely recognized that Uruguay is the most digitized country in Latin America . At the core of this is the government’s commitment to digitization that began in 2005 with the creation of the Agency for Development of Electronic Government (AGESIC) . Not only has this agency played a central role in shaping the country’s e-commerce market, but it also implemented a digital strategy for Uruguay’s COVID-19 response, including the creation of an app to provide citizens with accurate information about the pandemic .
Multiple other governmental agencies held the Montevideo Fintech Forum in 2019 to showcase the intersection of tech and data in the country . Topics included the influx of digital banking and how to incorporate higher volumes of consumers—as well as programming for SMEs—in accessing credit, as well as financing opportunities. More financial technology will lead to heightened access to e-commerce channels .
Essential takeaways about Uruguay
�� No matter its size, Uruguay possesses all of the tools for rapid e-commerce growth in the upcoming years, with strong levels of banking, internet and smartphone penetration .
�� The use of domestic-only credit cards, as well as the frequent use of installments when paying with a credit card, makes it essential for merchants to connect to local acquirers to capture card spend .
�� Debit cards are the fastest-growing payment in Uruguay, while alternative payment methods make up over 22% of the market, demonstrating the weight of consumers who do not own a credit card .
Uruguay’s e-commerce market is set to grow by 30% a year through 2024, and local payment methods account for 48% of the market’s volume . With a tech-literate population and improving access to digital payments, Uruguay is fertile ground for international merchants looking to enter new markets .

72
Pay-ins in secondary marketsAMI conducted research and analysis on an additional set of emerging markets, their data found here:
BANGLADESH BOLIVIA CAMEROON
Domestic xborder Total Domestic xborder Total Domestic xborder Total
2020 volume . USD BN $5 .0 $0 .5 $5 .4 $1 .4 $0 .3 $1 .7 $2 .7 $0 .3 $3 .1
Projected volume . USD BN
2021 $7 .5 $2 .4 $3 .9
2022 $9 .7 $3 .4 $5 .1
2023 $12 .7 $4 .6 $7 .3
2024 $16 .6 $6 .4 $10 .5
COSTA RICA DOMINICAN REPUBLIC ECUADOR
Domestic xborder Total Domestic xborder Total Domestic xborder Total
2020 volume . USD BN $0 .6 $1 .5 $2 .1 $0 .3 $0 .9 $1 .2 $2 .9 $0 .6 $3 .6
Projected volume . USD BN
2021 $2 .8 $1 .6 $4 .9
2022 $4 .1 $2 .4 $7 .0
2023 $5 .7 $3 .3 $9 .7
2024 $8 .0 $4 .7 $13 .4
GHANA INDONESIA IVORY COAST
Domestic xborder Total Domestic xborder Total Domestic xborder Total
2020 volume . USD BN $5 .0 $0 .6 $5 .5 $19 .1 $1 .9 $21 .0 $4 .1 $0 .5 $4 .6
Projected volume . USD BN
2021 $7 .1 $27 .7 $6 .0
2022 $9 .3 $35 .4 $8 .0
2023 $13 .5 $45 .3 $11 .5
2024 $19 .4 $58 .0 $16 .8
KENYA MALAYSIA PANAMA
Domestic xborder Total Domestic xborder Total Domestic xborder Total
2020 volume . USD BN $6 .9 $0 .8 $7 .7 $3 .3 $2 .3 $5 .7 $1 .9 $0 .7 $2 .6
Projected volume . USD BN
2021 $9 .9 $7 .6 $3 .7
2022 $13 .2 $9 .8 $5 .4
2023 $18 .9 $12 .6 $7 .5
2024 $27 .4 $16 .2 $10 .6
Table 1. Secondary e-commerce market size and forecast

73
PHILIPPINES SENEGAL SRI LANKA
Domestic xborder Total Domestic xborder Total Domestic xborder Total
2020 volume . USD BN $3 .9 $1 .9 $5 .9 $1 .6 $0 .2 $1 .8 $3 .90 $6 .00 $6 .00
Projected volume . USD BN
2021 $7 .9 $2 .4 $2 .40
2022 $10 .2 $3 .2 $3 .00
2023 $13 .2 $4 .8 $3 .90
2024 $17 .1 $7 .2 $4 .90
THAILAND VIETNAM
Domestic xborder Total Domestic xborder Total
2020 volume . USD BN $0 .60 $6 .60 $7 .20 $6 .0 $0 .6 $6 .6
Projected volume . USD BN
2021 $10 .30 $8 .8
2022 $13 .00 $11 .4
2023 $16 .60 $14 .9
2024 $21 .00 $19 .4

74
Pay-outsAMI estimates the global market size for four key pay-out verticals—ride-hailing, delivery services, home rentals, and remittances—to exceed $3 .5 trillion in 2020 . With remote work on the rise (fueld by COVID-19 lockdowns) and ride-hailing, travel, and remittances, all of which suffered in 2020, expected to recover over the next 24 months, we anticipate the share of pay-outs vis-à-vis pay-ins to increase in coming years . Additionally, other verticals will grow in relevance, such as payment to streamers, influencers and affiliate marketers. This means that there will be a growing opportunity for companies to expand their payee networks globally and a growing need to be able to scale rapidly while simultaneously meeting the needs of diverse payees .
(1) Market size for the Travel vertical is for the year 2019
ESTIMATED 2020 MARKET SIZE OF SELECT PAY-OUT VERTICALS, USD MILLIONS (1)
Ride-hailing Delivery apps Travel Freelance work Remittances Total
Argentina $89 $114 $147 $877 $121 $1,348
Brazil $521 $537 $220 $6,436 $1,560 $9,274
Chile $88 $104 $91 $1,421 $270 $1,974
Colombia $145 $145 $125 $5,214 $6,191 $11,820
Egypt $92 $102 $54 $4,119 $24,381 $28,748
India $102 $1,440 $147 $564,342 $75,916 $641,947
Mexico $585 $298 $839 $10,989 $39,500 $52,211
Morocco $66 $128 $51 $2,105 $6,382 $8,732
Paraguay $7 $12 $9 $326 $556 $911
Peru $38 $41 $39 $3,199 $3,326 $6,642
Turkey $87 $153 $50 $6,016 $745 $7,051
Uruguay $4 $7 $33 $64 $195 $303
South Africa $55 $88 $153 $1,382 $840 $2,518
Nigeria $22 $89 $43 $19,822 $20,971 $40,947
TOTAL PAYOUTS MARKET $1,901 $3,258 $2,001 $626,312 $180,954 $814,426
Table 2. Pay-outs estimated market size

75

76
Lindsay LehrAssociate Managing Director
Americas Market Intelligence
llehr@americasmi .com
Contact the author