the uk’s living standards crisis
TRANSCRIPT
THE UK’S LIVING STANDARDS CRISISTHE CASE FOR A LIVING INCOME
BY SARAH ARNOLD, AIDAN HARPER AND ALFIE STIRLING

NEW ECONOMICS FOUNDATION
CONTENTSEXECUTIVE SUMMARY 2
1. THE UK’S LIVING STANDARDS CRISIS 4
1.1 MEASURING AND DEFINING LIVING STANDARDS 4
1.2 MINIMUM INCOME STANDARD 6
1.3 LIVING STANDARDS BEFORE THE PANDEMIC 6
1.4 ADVERSE CONSEQUENCES OF WEAK LIVING STANDARDS 9
2. IMPACTS OF COVID-19 AND THE INADEQUACY OF UK SOCIAL SECURITY 13
2.1 LABOUR MARKET IMPACTS OF COVID-19 13
2.2 INADEQUACY OF THE CURRENT SOCIAL SECURITY SYSTEM 14
3. QUANTIFYING THE UK’S COVID-19 LIVING STANDARDS CRISIS 18
3.1 METHODOLOGY 18
3.2 HOUSEHOLDS BELOW THE MINIMUM INCOME STANDARD 18
4. TOWARDS A LIVING INCOME 23
4.1 COMPONENTS OF A SOCIAL GUARANTEE 23
4.2 AIMS OF A LIVING INCOME 24
ENDNOTES 26
THE UK'S LIVING STANDARDS CRISIS THE CASE FOR A LIVING INCOME

EXECUTIVE SUMMARY
2
THE UK'S LIVING STANDARDS CRISIS THE CASE FOR A LIVING INCOME
NEW ECONOMICS FOUNDATION
The UK is in the midst of a crisis in living standards. Too many people do not have
reliable access to the resources they need to meet the day-to-day costs for a decent quality of life. This was true before Covid-19, but the pandemic and the associated economic downturn have seen things exacerbate over the past 12 months. New forecast modelling produced for this report shows that by the end of the year, and without a change in government policy, 32% of the UK population – 21.4 million people – will be living below a socially acceptable living standard, as measured by the Minimum Income Standard (MIS). The MIS, the UK’s only needs-based approach to measuring living standards, identifies what needs must be met for an individual to thrive in the society in which they live.
The effects of the Covid-19 pandemic followed a decade of stagnant growth in real earnings; rising housing costs for renters; and freezes, cuts, and caps to working-age benefits, particularly those received by families with children. This served to hold down the living standards of the poorest, while widening inequalities across the population as a whole, making the UK an international outlier on poverty – the extent to which the poorest families fell belowthe poverty line was the second highest among 37members of the Organisation for Economic Co-operation and Development (OECD). Across thetwo decades leading up to 2020, the poorest 10%of families saw their income grow by just 3% afterhousing costs – six times slower than the average.As a consequence, nearly three in ten people werealready living in households with incomes below theMIS, even before the pandemic began.
But the pandemic has greatly accelerated this crisis of inequality and living standards. Extended lockdowns have prevented people from working for months on end, and despite large numbers of jobs being supported through the furlough scheme, there has been a significant toll on employment and earnings. As a consequence, the number of
people relying on the social security system to help make ends meet has increased significantly, with the numbers claiming universal credit more than doubling from 2.8 million in January 2020, to an estimated 5.9 million in January 2021.
Despite a temporary uplift to the main element of universal credit of £20 a week, more people were living below the MIS in April 2021 than when the pandemic started. This is because the UK’s social security system fails comprehensively to provide an adequate income floor. It is weak by both international and historical standards. The UK safety net has one of the lowest replacement rates – the proportion of previous income restored by out-of-work benefits – of any of the 37 advanced economies in the OECD. And even with the £20 uplift, families relying on welfare will be £10.5 billion worse off at aggregate than would have been the case had the 2010–11 system still been in place.
New modelling presented for this report shows that the core problem is twofold: first, unprecedented numbers of people are set to fall below a socially acceptable standard of living by the end of this year; and second, the extent of the income shortfall for those families is extremely large.
Beneath the headline finding of nearly one in three people in the UK living below the MIS, we find the following:
• Keeping the £20 uplift to the main element of universal credit in place beyond September(which is not current government policy) prevents 600,000 people from falling belowthe MIS – but even this still leaves 20.8 million people living below an acceptable standardof living. Even using the government’s main poverty measure of households in relative low income, we find that 14.9 million people will remain in poverty, even with the uplift.
• Nearly half (45%) of all children are living below the MIS: eight in ten (82%) of children in workless families, and four in ten (40%) in working families.
• Over two-thirds of single parents (70%); more than half of all renters (50% of private renters, 63% of those in social housing); and more than a third of all families in the North East (37%), West Midlands (37%), and London (35%) are living below the same threshold.
3
THE UK'S LIVING STANDARDS CRISIS THE CASE FOR A LIVING INCOME
NEW ECONOMICS FOUNDATION
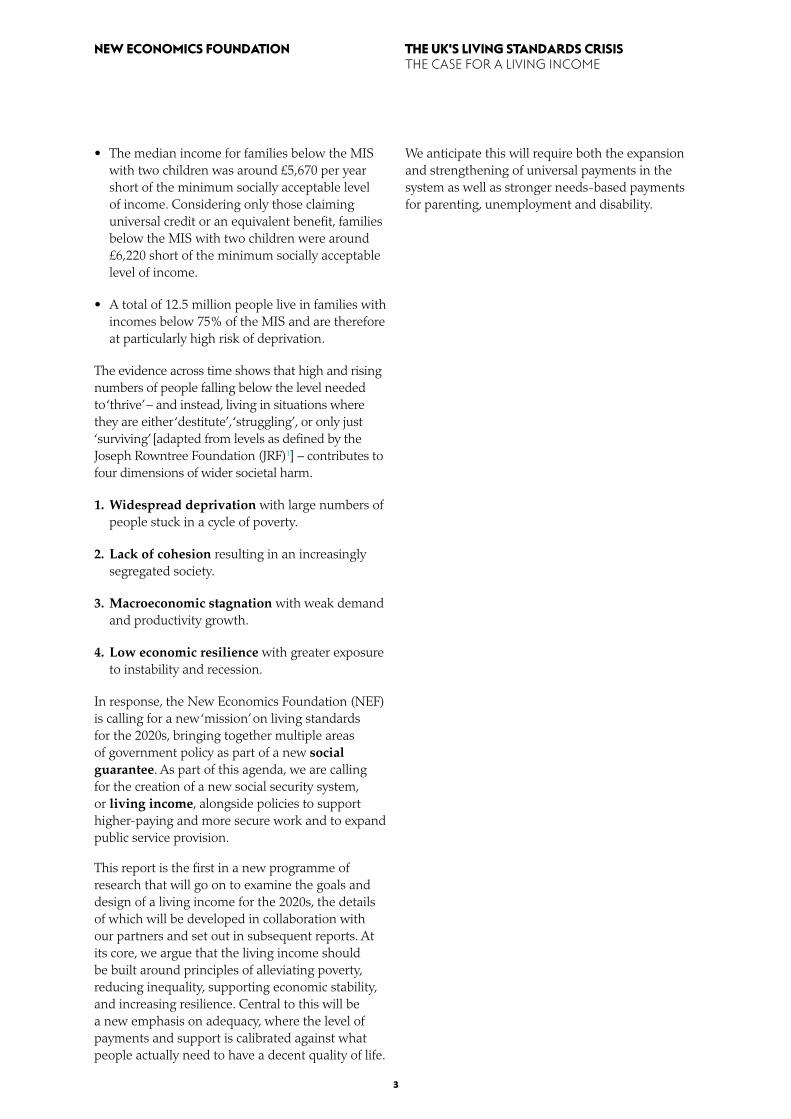
• The median income for families below the MISwith two children was around £5,670 per yearshort of the minimum socially acceptable levelof income. Considering only those claiminguniversal credit or an equivalent benefit, familiesbelow the MIS with two children were around£6,220 short of the minimum socially acceptablelevel of income.
• A total of 12.5 million people live in families withincomes below 75% of the MIS and are thereforeat particularly high risk of deprivation.
The evidence across time shows that high and rising numbers of people falling below the level needed to ‘thrive’ – and instead, living in situations where they are either ‘destitute’, ‘struggling’, or only just ‘surviving’ [adapted from levels as defined by the Joseph Rowntree Foundation (JRF)1] – contributes to four dimensions of wider societal harm.
1. Widespread deprivation with large numbers ofpeople stuck in a cycle of poverty.
2. Lack of cohesion resulting in an increasinglysegregated society.
3. Macroeconomic stagnation with weak demandand productivity growth.
4. Low economic resilience with greater exposureto instability and recession.
In response, the New Economics Foundation (NEF) is calling for a new ‘mission’ on living standards for the 2020s, bringing together multiple areas of government policy as part of a new social guarantee. As part of this agenda, we are calling for the creation of a new social security system, or living income, alongside policies to support higher-paying and more secure work and to expand public service provision.
This report is the first in a new programme of research that will go on to examine the goals and design of a living income for the 2020s, the details of which will be developed in collaboration with our partners and set out in subsequent reports. At its core, we argue that the living income should be built around principles of alleviating poverty, reducing inequality, supporting economic stability, and increasing resilience. Central to this will be a new emphasis on adequacy, where the level of payments and support is calibrated against what people actually need to have a decent quality of life.
We anticipate this will require both the expansion and strengthening of universal payments in the system as well as stronger needs-based payments for parenting, unemployment and disability.

4
THE UK'S LIVING STANDARDS CRISIS THE CASE FOR A LIVING INCOME
NEW ECONOMICS FOUNDATION
The UK is in the midst of a crisis in living standards. Too many people live below an
acceptable standard of living and are struggling to get by. They don’t have reliable access to the resources they need to meet the day-to-day costs for a decent quality of life. This was true before the Covid-19 pandemic, but the pandemic and associated economic downturn have exacerbated the living standards crisis and deepened it for many.
The economic shock associated with the pandemic led to the worst contraction in economic activity in modern times.2 The economic insecurity precipitated by that shock follows both a decade of stagnating wage growth and rising living costs, as well as freezes to working-age benefits and a reduction in the generosity of the benefits system.3 Once increases in the cost of living are taken into account, average earnings in the year prior to the pandemic had still not recovered to the levels they were at before the financial crisis.4 Meanwhile, since 2013/14, benefits have risen by significantly less than the cost of living and were completely frozen between 2015/16 and 2019/20.5 As a result of the wage and benefits squeeze, many households were under strain before the impacts of Covid-19, particularly those at the lower end of the household income distribution.6
This chapter briefly sets out some of the trends and dynamics of household incomes prior to the pandemic, before setting out four key implications of weak living standards in the UK:
1. Widespread deprivation where large numbers of people are stuck in a cycle of poverty.
2. Lack of cohesion where income inequalities have contributed to a segregated society and a deterioration of social cohesion.
3. Macroeconomic stagnation where rising inequality and weak income growth for the poorest have sucked demand out of the economy, contributing to economic stagnation and weak productivity growth.
4. Weakened resilience where the extent and prevalence of low incomes have reduced household financial resilience, making recessions both more likely and more severe.
1.1 MEASURING AND DEFINING LIVING STANDARDS
What constitutes a decent standard of living? There are multiple ways of conceptualising and evaluating living standards. An important distinction is whether we consider material dimensions, such as expenditure, income, and wealth; or non-monetary dimensions, such as life satisfaction, functioning, and capabilities; or both. This report broadly focuses on material living standards – ie the material resources people have available to meet their needs – while acknowledging that material resources are not the only indicator of quality of life.7
Poverty, then, can be considered a statement about a lack of, or inadequate, financial resources. Poverty means not being able to pay bills or put food on the table. But it goes beyond severe material deprivation or destitution, whereby people cannot afford basics, such as shelter or heating. The Joseph Rowntree Foundation (JRF) explains that there are multiple levels of poverty, and acceptable living standards are not just solely about survival.8 We can consider a range of living standards thresholds (adapted from JRF’s typology levels of poverty):
• Destitute – cannot afford to eat, keep clean, and stay warm and dry.
• Struggling – falling substantially short of a decent standard of living and likely to be experiencing some form of material deprivation, where they cannot afford certain essential items and activities.
• Surviving – getting by day-to-day but under pressure, finding it difficult to manage unexpected costs and events.
• Thriving – able to afford a decent standard of living.
1. THE UK'S LIVING STANDARDS CRISIS

5
THE UK'S LIVING STANDARDS CRISIS THE CASE FOR A LIVING INCOME
NEW ECONOMICS FOUNDATION
Assessments of living standards typically consider thresholds that define a certain standard of living and then consider the resources available to households to determine how many households fall below that threshold.9 There are broadly two families of approaches to measuring living standards: budget-standard or needs-based approaches, and income-based approaches.
• Needs-based approaches measure what is needed for an adequate standard of living directly. They use participatory research to identify ‘budget standards’ for different households by coming to a consensual agreement between experts and public opinion on the costs of baskets of goods needed by different households. For example, calculating the cost of an adequate weekly budget for food, clothes, transport, bills, and so on. This approach was used by William Beveridge in 1942 to rationalise the proposal for social security levels, stating that under the system “each will be covered for all his needs… [it should] guarantee the income needed for subsistence in all normal cases”10
• Income-based approaches use income as a proxy for what is needed for an adequate standard of living. This is usually justified on the basis that needs are relative and based on social norms: standards can be established considering the resources that others in society have available to spend. For example, the main measures of poverty used by the UK (and other governments) consider those living in poverty as those living on less than 60% of median income, whether within that year (relative) or compared to a fixed point in time (absolute).
Income-based approaches are often chosen because they are thought to be simpler and more comprehensible. However, they can become problematic because they are calculated by working backwards from an average income, rather than beginning with an assessment of standards of living. It can become hard to evaluate whether needs are in fact being met when the standard of living is taken as a percentage of average income.
The UK’s decision to define those in poverty as those living on less than 60% of median income is largely arbitrary. In the early 2000s, the UK misapplied the European standard of 50%, referring
to 50% of the mean income instead of 50% of the median income, and the mean is higher. Rather than being seen to lower its targets, the Labour government started referring to 50% of the mean alongside 60% of the median and then began to refer exclusively to the 60% median. They subsequently opted to argue for 60% as a more general standard across Europe.11
By definition, budget-based approaches are subjective, a basis on which they are sometimes criticised.12 Drawing up budget standards involve judgments about what items and quantities are needed to have an adequate standard of living.13 But without making these judgments, it is impossible to evaluate whether a policy is adequately meeting needs. As John Veit-Wilson argued, how can we know whether people have access to sufficient levels of income without determining what level of income is sufficient?14
Needs-based approaches also attempt to explicitly capture the significant variation in living costs between different households. For example, families with young children face higher childcare costs than families with older children. People with disabilities and their families in particular face additional costs, including the need for specialist goods and services, such as equipment and home adaptations, and a greater need for non-specialist goods and services, such as energy or transport. Income-based approaches tend to tackle this problem by reweighting the income threshold for a given family, for example, to take account of the number of adults and children. But the equivalisation scales used for this approach tend to be arbitrary and not based on a UK-specific analysis of living costs [the standard approach is to use figures calculated for use across Organisation for Economic Co-operation and Development (OECD) countries].15
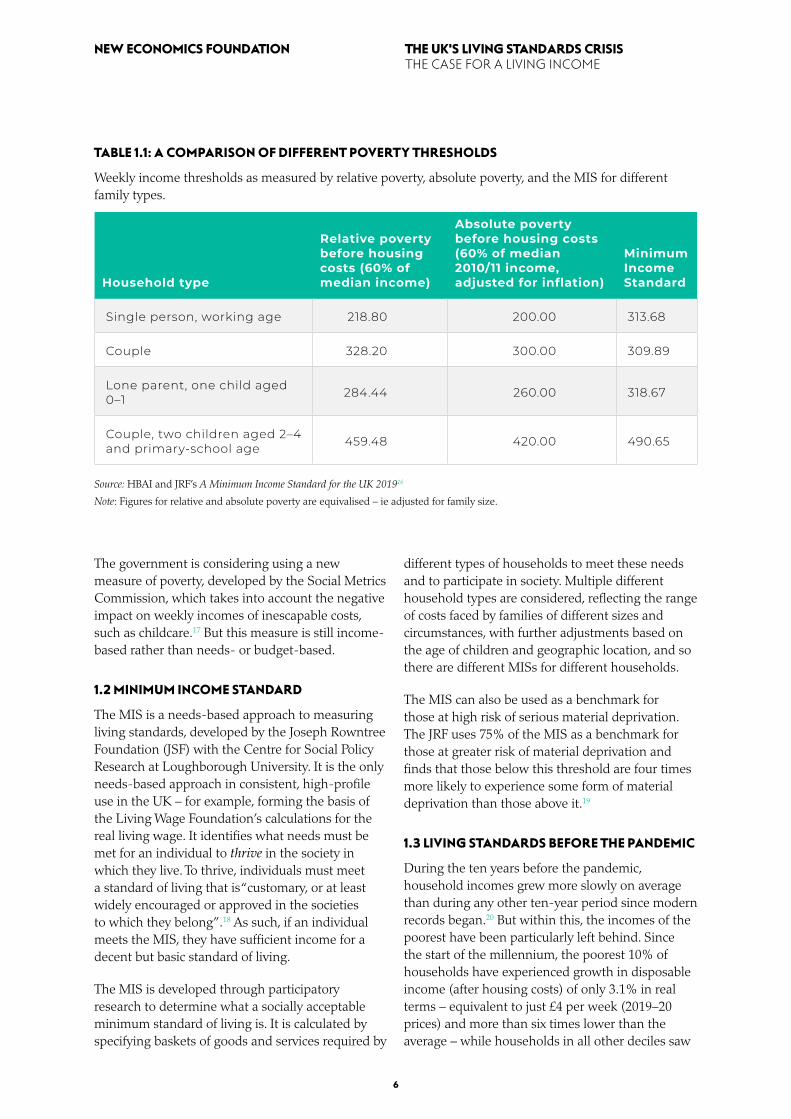
Table 1.1 compares the weekly income threshold for the Minimum Income Standard (MIS) to the income line of the government’s two main headline measures of poverty for 2019/20. As can be seen, the poverty line as measured by 60% of 2010/11 median income is lower than the MIS in all cases; for a single person it is 64% of the MIS and for a couple with two children it is 86% of the MIS. In all cases, except for a couple with children, the poverty line as measured by 60% of current median income is lower than the MIS.
6
THE UK'S LIVING STANDARDS CRISIS THE CASE FOR A LIVING INCOME
NEW ECONOMICS FOUNDATION
TABLE 1.1: A COMPARISON OF DIFFERENT POVERTY THRESHOLDS
Weekly income thresholds as measured by relative poverty, absolute poverty, and the MIS for different family types.
Household type
Relative poverty before housing costs (60% of median income)
Absolute poverty before housing costs (60% of median 2010/11 income, adjusted for inflation)
Minimum Income Standard
Single person, working age 218.80 200.00 313.68
Couple 328.20 300.00 309.89
Lone parent, one child aged 0–1 284.44 260.00 318.67
Couple, two children aged 2–4 and primary-school age 459.48 420.00 490.65
Source: HBAI and JRF’s A Minimum Income Standard for the UK 201916
Note: Figures for relative and absolute poverty are equivalised – ie adjusted for family size.
The government is considering using a new measure of poverty, developed by the Social Metrics Commission, which takes into account the negative impact on weekly incomes of inescapable costs, such as childcare.17 But this measure is still income-based rather than needs- or budget-based.
1.2 MINIMUM INCOME STANDARD
The MIS is a needs-based approach to measuring living standards, developed by the Joseph Rowntree Foundation (JSF) with the Centre for Social Policy Research at Loughborough University. It is the only needs-based approach in consistent, high-profile use in the UK – for example, forming the basis of the Living Wage Foundation’s calculations for the real living wage. It identifies what needs must be met for an individual to thrive in the society in which they live. To thrive, individuals must meet a standard of living that is “customary, or at least widely encouraged or approved in the societies to which they belong”.18 As such, if an individual meets the MIS, they have sufficient income for a decent but basic standard of living.
The MIS is developed through participatory research to determine what a socially acceptable minimum standard of living is. It is calculated by specifying baskets of goods and services required by
different types of households to meet these needs and to participate in society. Multiple different household types are considered, reflecting the range of costs faced by families of different sizes and circumstances, with further adjustments based on the age of children and geographic location, and so there are different MISs for different households.
The MIS can also be used as a benchmark for those at high risk of serious material deprivation. The JRF uses 75% of the MIS as a benchmark for those at greater risk of material deprivation and finds that those below this threshold are four times more likely to experience some form of material deprivation than those above it.19
1.3 LIVING STANDARDS BEFORE THE PANDEMIC
During the ten years before the pandemic, household incomes grew more slowly on average than during any other ten-year period since modern records began.20 But within this, the incomes of the poorest have been particularly left behind. Since the start of the millennium, the poorest 10% of households have experienced growth in disposable income (after housing costs) of only 3.1% in real terms – equivalent to just £4 per week (2019–20 prices) and more than six times lower than the average – while households in all other deciles saw
7
THE UK'S LIVING STANDARDS CRISIS THE CASE FOR A LIVING INCOME
NEW ECONOMICS FOUNDATION
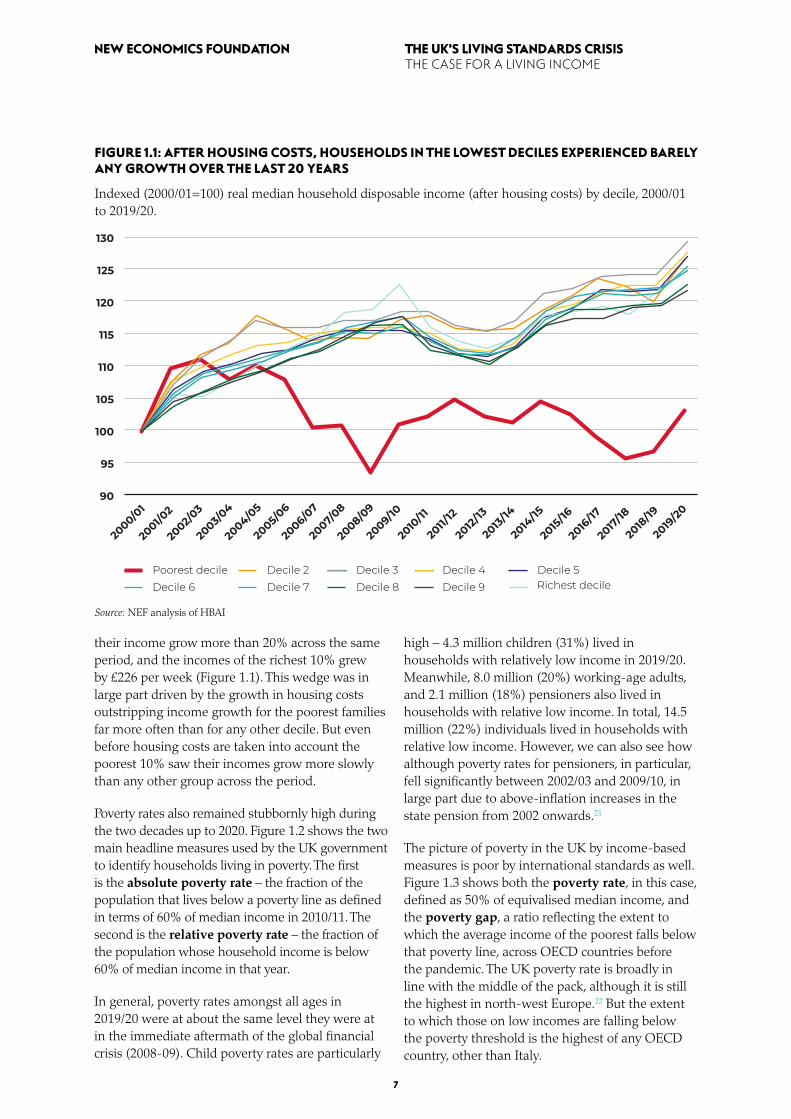
FIGURE 1.1: AFTER HOUSING COSTS, HOUSEHOLDS IN THE LOWEST DECILES EXPERIENCED BARELY ANY GROWTH OVER THE LAST 20 YEARS
Indexed (2000/01=100) real median household disposable income (after housing costs) by decile, 2000/01 to 2019/20.
Source: NEF analysis of HBAI
130
125
120
115
110
105
100
95
90
2000/0
1
2001/0
2
2002/
03
2003/
04
2004/0
5
2007/
08
2008/0
9
2009/10
2010
/11
2011/
12
2012
/13
2013
/14
2014
/15
2015
/16
2016
/17
2017
/18
2018
/19
2019
/20
2005/
06
2006/0
7
Poorest decileDecile 6
Decile 2Decile 7
Decile 3Decile 8
Decile 4 Decile 5Decile 9 Richest decile
their income grow more than 20% across the same period, and the incomes of the richest 10% grew by £226 per week (Figure 1.1). This wedge was in large part driven by the growth in housing costs outstripping income growth for the poorest families far more often than for any other decile. But even before housing costs are taken into account the poorest 10% saw their incomes grow more slowly than any other group across the period.
Poverty rates also remained stubbornly high during the two decades up to 2020. Figure 1.2 shows the two main headline measures used by the UK government to identify households living in poverty. The first is the absolute poverty rate – the fraction of the population that lives below a poverty line as defined in terms of 60% of median income in 2010/11. The second is the relative poverty rate – the fraction of the population whose household income is below 60% of median income in that year.
In general, poverty rates amongst all ages in 2019/20 were at about the same level they were at in the immediate aftermath of the global financial crisis (2008-09). Child poverty rates are particularly
high – 4.3 million children (31%) lived in households with relatively low income in 2019/20. Meanwhile, 8.0 million (20%) working-age adults, and 2.1 million (18%) pensioners also lived in households with relative low income. In total, 14.5 million (22%) individuals lived in households with relative low income. However, we can also see how although poverty rates for pensioners, in particular, fell significantly between 2002/03 and 2009/10, in large part due to above-inflation increases in the state pension from 2002 onwards.21
The picture of poverty in the UK by income-based measures is poor by international standards as well. Figure 1.3 shows both the poverty rate, in this case, defined as 50% of equivalised median income, and the poverty gap, a ratio reflecting the extent to which the average income of the poorest falls below that poverty line, across OECD countries before the pandemic. The UK poverty rate is broadly in line with the middle of the pack, although it is still the highest in north-west Europe.22 But the extent to which those on low incomes are falling below the poverty threshold is the highest of any OECD country, other than Italy.

8
THE UK'S LIVING STANDARDS CRISIS THE CASE FOR A LIVING INCOME
NEW ECONOMICS FOUNDATION
FIGURE 1.3: THE EXTENT TO WHICH THE POOREST FAMILIES IN THE UK ARE FALLING BELOW THE POVERTY THRESHOLD IS THE SECOND HIGHEST IN THE OECD.
Poverty rate (proportion of people falling below a poverty threshold of 50% of median equivalised income) and poverty gap (ratio of the average income of the poorest falling below the poverty line) across OECD countries, most recent year available (2016/17–2019/20).
0.50
0.45
0.40
0.35
0.30
0.25
0.20
0.15
0.10
0.05
0
ITA
GB
R
RO
U
USA LT
U
NO
R
ESP
CR
I
SVK
LVA
HU
N
CA
N
NLD ES
T
AU
S
LUX
BG
R
CH
L
AU
T
PO
L
GR
C
PR
T
CH
E
ISR
DEU
SWE
ISL
FRA
RU
S
IRL
FIN
CZE
SVN
BEL
DN
K
KO
R
MEX
Poverty gap Poverty rate
FIGURE 1.2: POVERTY RATES OVER THE DECADES BEFORE THE PANDEMIC
Poverty rates for pensioners, working-age adults (16–64) and children, as measured by the proportion of those in households below 60% of 2010/11 median income held constant in real terms (solid lines), and by those in households below 60% of contemporary median income (dashed lines), after housing costs, 2002/03 to 2019/20.
Source: HBAI
35.0
30.0
25.0
20.0
15.0
10.0
5.0
0.0
2002/
03
2003/
04
2004/0
5
2005/
06
2006/0
7
2007/
08
2014
/15
2015
/16
2016
/17
2017
/18
2018
/19
2019
/20
2008/0
9
2009/10
2010
/11
2011/
12
2012
/13
2013
/14
Children Working-age adults Pensioners
Source: OECD data, accessed 2021
9
THE UK'S LIVING STANDARDS CRISIS THE CASE FOR A LIVING INCOME
NEW ECONOMICS FOUNDATION
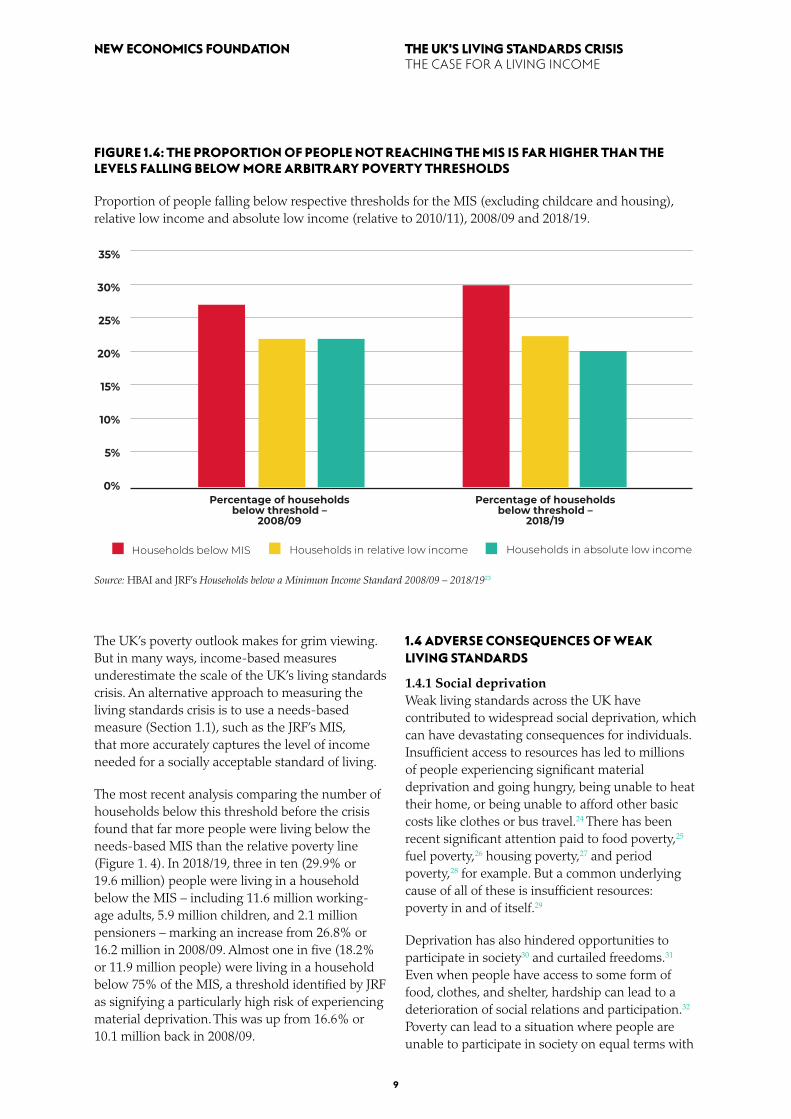
FIGURE 1.4: THE PROPORTION OF PEOPLE NOT REACHING THE MIS IS FAR HIGHER THAN THE LEVELS FALLING BELOW MORE ARBITRARY POVERTY THRESHOLDS
Proportion of people falling below respective thresholds for the MIS (excluding childcare and housing), relative low income and absolute low income (relative to 2010/11), 2008/09 and 2018/19.
Source: HBAI and JRF’s Households below a Minimum Income Standard 2008/09 – 2018/1923
The UK’s poverty outlook makes for grim viewing. But in many ways, income-based measures underestimate the scale of the UK’s living standards crisis. An alternative approach to measuring the living standards crisis is to use a needs-based measure (Section 1.1), such as the JRF’s MIS, that more accurately captures the level of income needed for a socially acceptable standard of living.
The most recent analysis comparing the number of households below this threshold before the crisis found that far more people were living below the needs-based MIS than the relative poverty line (Figure 1. 4). In 2018/19, three in ten (29.9% or 19.6 million) people were living in a household below the MIS – including 11.6 million working-age adults, 5.9 million children, and 2.1 million pensioners – marking an increase from 26.8% or 16.2 million in 2008/09. Almost one in five (18.2% or 11.9 million people) were living in a household below 75% of the MIS, a threshold identified by JRF as signifying a particularly high risk of experiencing material deprivation. This was up from 16.6% or 10.1 million back in 2008/09.
1.4 ADVERSE CONSEQUENCES OF WEAK LIVING STANDARDS
1.4.1 Social deprivationWeak living standards across the UK have contributed to widespread social deprivation, which can have devastating consequences for individuals. Insufficient access to resources has led to millions of people experiencing significant material deprivation and going hungry, being unable to heat their home, or being unable to afford other basic costs like clothes or bus travel.24 There has been recent significant attention paid to food poverty,25 fuel poverty,26 housing poverty,27 and period poverty,28 for example. But a common underlying cause of all of these is insufficient resources: poverty in and of itself.29
Deprivation has also hindered opportunities to participate in society30 and curtailed freedoms.31 Even when people have access to some form of food, clothes, and shelter, hardship can lead to a deterioration of social relations and participation.32 Poverty can lead to a situation where people are unable to participate in society on equal terms with
35%
30%
25%
20%
15%
10%
5%
0%Percentage of households
below threshold –2008/09
Percentage of householdsbelow threshold –
2018/19
Households below MIS Households in relative low income Households in absolute low income
10
THE UK'S LIVING STANDARDS CRISIS THE CASE FOR A LIVING INCOME
NEW ECONOMICS FOUNDATION
others, leading to exclusion or withdrawal from key aspects of social and civic life because of a lack of economic resources. Economic hardship affects consumption patterns and leisure time activities, and this is directly related to the possibility of making or maintaining friends or acquaintances.33
Economic insecurity and poverty can also have profound consequences for mental and physical health.34 For example, inadequate income is intrinsically linked to food poverty and poor diet, placing people at higher risk of developing chronic diseases such as hypertension and diabetes, and cardiovascular disease.35 Poverty is a significant risk factor in a wide range of psychological illnesses, and economic insecurity can both be caused by and cause mental ill health.36 Economic insecurity and the subsequent impact on the mental health of parents can also have impacts that travel through generations. Parents experiencing insecurity are more likely to exhibit a range of behaviours that can negatively impact the development of their children, perhaps due to stress.37 This may lead to a depleted ability to learn effectively in schools, which can in turn negatively affect educational attainment and future job prospects.38 It is through this process that entire families can become trapped in cycles of economic insecurity and hardship.
Moreover, poverty is expensive. According to the Department for Work & Pensions (DWP), 40% of people in 2017–19 experienced “financial difficulties” upon the roll-out of universal credit that has incurred costs for local authorities who have had to support people in hardship as a result.39 Those who fall through the gaps are more likely to be made homeless, fall into ill health, or require interventions from social services. All this comes at a cost – one report found that 20% of the spending on public services (amounting to £69 billion in 2016) is committed to dealing with the way poverty damages people’s lives.40
1.4.2 Lack of cohesionThe lack of acceptable living standards across the population has exacerbated spiralling inequality, contributing to a segregated society and a deterioration of social cohesion. This rise in inequality has important political ramifications. It can lead to the so-called capture of democratic and civic institutions, which in turn reproduces the conditions for ever-increasing inequality.41 At the same time, it can exacerbate tensions between different groups.
There are important social and political reasons for reducing inequality in and of itself. Inequality is detrimental to social cohesion as it affects how people see those around them. People in less equal societies are less likely to trust each other, less likely to engage in social or civic participation, and less likely to say they are happy.42,43 The direction of causality is likely to go both ways, but studies44,45
point to a causal effect of income inequality on these outcomes.
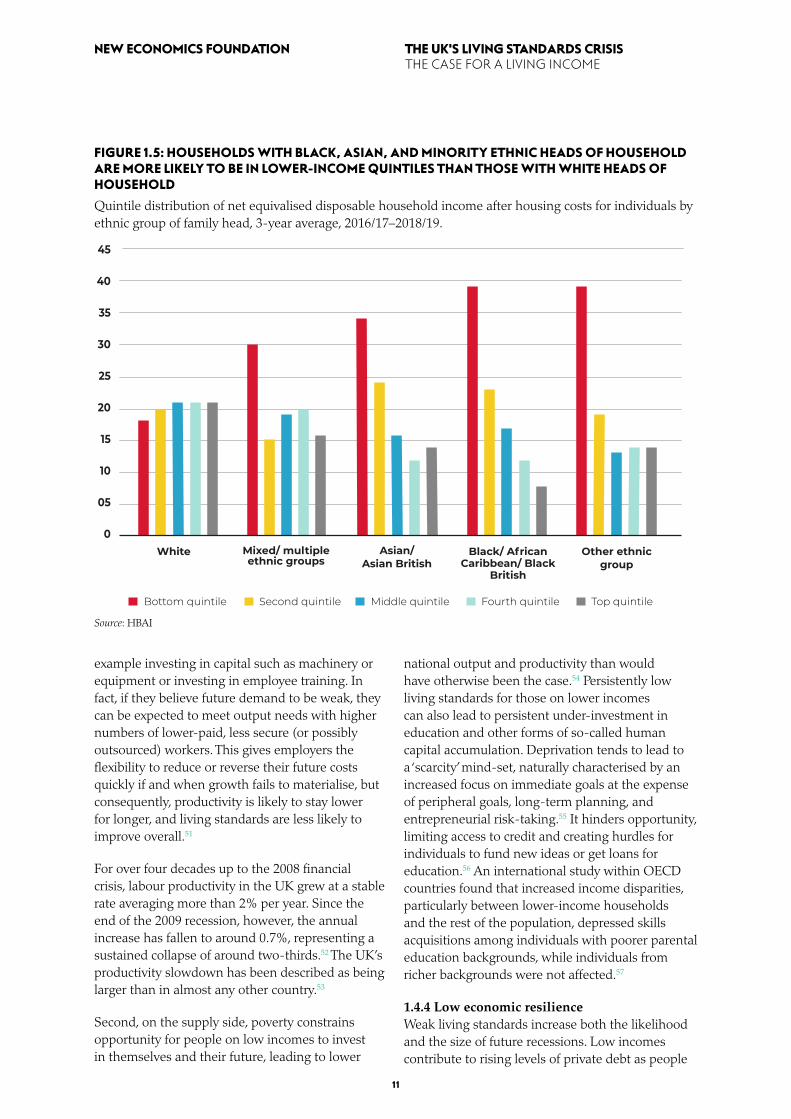
Beyond vertical inequality, ie inequality between individuals or households, there are significant and unjust horizontal inequalities, ie inequalities between groups, for example by ethnicity, or geography. For example, as Figure 1.5 shows, households with black, Asian, and minority ethnic (BAME) heads of household are more likely to be in lower-income quintiles than those with white heads of household.
Finally, the UK is one of the most regionally unbalanced countries in the industrialised world.46 There are big differences between different regions and especially local authorities, with many places still living with the legacy of de-industrialisation.47 Earnings in London are a third to a half higher than the UK average (although inequality within London is also significant, and after housing costs, the regional differential narrows somewhat).48
1.4.3 Macroeconomic stagnationIn addition to social problems, persistently low living standards have implications for the economy, too. Inequality and poverty have likely been key contributors to weak growth in both national income and labour productivity over the last decade.
There are two reasons for this. First is a persistent lack of aggregate demand – overall spending in the economy by families and firms – leading to economic stagnation and weak productivity growth.49 Over the last few decades, and particularly since the great financial crash in 2007/08, growth in aggregate demand has slowed considerably. In part, this may be due to a larger share of the gains over the last few decades going to people at the top, who tend to save more of their money than those on lower incomes.50
This also risks a self-reinforcing feedback loop. When firms are not confident of future demand, they are less likely to make long-term investments that increase output in a cost-effective way, for
11
THE UK'S LIVING STANDARDS CRISIS THE CASE FOR A LIVING INCOME
NEW ECONOMICS FOUNDATION
example investing in capital such as machinery or equipment or investing in employee training. In fact, if they believe future demand to be weak, they can be expected to meet output needs with higher numbers of lower-paid, less secure (or possibly outsourced) workers. This gives employers the flexibility to reduce or reverse their future costs quickly if and when growth fails to materialise, but consequently, productivity is likely to stay lower for longer, and living standards are less likely to improve overall.51
For over four decades up to the 2008 financial crisis, labour productivity in the UK grew at a stable rate averaging more than 2% per year. Since the end of the 2009 recession, however, the annual increase has fallen to around 0.7%, representing a sustained collapse of around two-thirds.52 The UK’s productivity slowdown has been described as being larger than in almost any other country.53
Second, on the supply side, poverty constrains opportunity for people on low incomes to invest in themselves and their future, leading to lower
national output and productivity than would have otherwise been the case.54 Persistently low living standards for those on lower incomes can also lead to persistent under-investment in education and other forms of so-called human capital accumulation. Deprivation tends to lead to a ‘scarcity’ mind-set, naturally characterised by an increased focus on immediate goals at the expense of peripheral goals, long-term planning, and entrepreneurial risk-taking.55 It hinders opportunity, limiting access to credit and creating hurdles for individuals to fund new ideas or get loans for education.56 An international study within OECD countries found that increased income disparities, particularly between lower-income households and the rest of the population, depressed skills acquisitions among individuals with poorer parental education backgrounds, while individuals from richer backgrounds were not affected.57
1.4.4 Low economic resilienceWeak living standards increase both the likelihood and the size of future recessions. Low incomes contribute to rising levels of private debt as people
FIGURE 1.5: HOUSEHOLDS WITH BLACK, ASIAN, AND MINORITY ETHNIC HEADS OF HOUSEHOLD ARE MORE LIKELY TO BE IN LOWER-INCOME QUINTILES THAN THOSE WITH WHITE HEADS OF HOUSEHOLD
Quintile distribution of net equivalised disposable household income after housing costs for individuals by ethnic group of family head, 3-year average, 2016/17–2018/19.
Source: HBAI
Bottom quintile Second quintile Middle quintile Fourth quintile Top quintile
45
40
35
30
25
20
15
10
05
0White Mixed/ multiple
ethnic groupsAsian/
Asian BritishBlack/ African
Caribbean/ BlackBritish
Other ethnicgroup
12
THE UK'S LIVING STANDARDS CRISIS THE CASE FOR A LIVING INCOME
NEW ECONOMICS FOUNDATION
rely on high-cost credit to meet basic needs. This build-up of private debt carries risks from a macroeconomic perspective because of the potential to generate financial instability.58 The propensity of debt among low-income, low-net-worth households increases the risk of widespread default, which under certain circumstances – such as those seen in 2008 – can lead to wider contagion across the financial system. Just before the crisis, unsecured household debt, ie debt other than mortgages, was the highest it had ever been, at 30.4% of household incomes, and even above the level it reached in 2008 ahead of the financial crisis (27.5%).59 High levels of debt also manifest as wider social costs of debt on health, work, homelessness, and welfare similar to those described in the previous sections. In 2014, it was estimated that the wider social costs of problem debt amount to approximately £8.3 billion a year.60
Low incomes also reduce family resources to smooth out the effects of a crisis. Empirical analysis of the extent to which different households react to changing incomes shows that poorer households are much more likely to reduce spending significantly in reaction to economic shocks, such as downturns.61 As might be expected, those who are credit constrained, have concerns about debt, or have insufficient buffers of savings in the event of an emergency are much more likely to sharply reduce consumption compared to those who have more of a buffer or are less constrained.
At aggregate, this also leads to weaker economic resilience to potential shocks, increasing the likely effects of the recession. As the current public health crisis has shown, in order to self-isolate during a pandemic, individuals must be able to afford to take time off work without losing income and falling behind on rent or other bills.62 Low incomes, low savings, and credit constraints reduce people’s ability to do this. This happens to be a particular issue in the UK, where Statutory Sick Pay (SSP) is conspicuously low by international standards, and the lowest (bar none) in the OECD during the pandemic – just 10% of previous earnings on average, compared to 100% in Germany and the USA, and 90% in France.63 This has contributed to the UK seeing one of the highest excess death rates and the most severe economic contractions in 2020 among advanced economies globally.64
There is no shortage of further recessionary risks on the horizon. Of particular concern are automation, climate breakdown, and further public health crises. Technological change brings the risk of unemployment and income loss, particularly to certain occupations.65 Climate breakdown, and the necessity of mitigating and adapting to it, will similarly lead to structural shifts. Meanwhile, experts predict that the last century of increased globalisation, urbanisation, and exploitation of the natural environment will lead to intensified risks of largescale pandemics going forward.66 While living standards in the UK remain weak, future recessions will likely be much more severe here compared with otherwise comparable countries.
13
THE UK'S LIVING STANDARDS CRISIS THE CASE FOR A LIVING INCOME
NEW ECONOMICS FOUNDATION
A s a result of the pandemic, the number claiming universal credit more than doubled
from 2.8 million in January 2020, to an estimated 5.9 million in January 2021. Yet this system pays most families between around one-third and two-thirds of a minimum level of income needed to live a decent quality of life. In this chapter, we briefly discuss the impacts of Covid-19 on the UK labour market despite the unprecedented new wage support programmes from government, and the strain this has put on a UK social security system that is both weak by internal standards and compared to the UK’s recent past.
2.1 LABOUR MARKET IMPACTS OF COVID-19
Extended lockdowns and social distancing have prevented people from working for months on end. Although households have been affected right across the earnings distribution, it has predominantly been those in already low-paid and precarious jobs who have lost the most hours or been made unemployed. The sectors worst affected by social distancing restrictions, such as cleaning, retail, hospitality, and the arts, have disproportionately high concentrations of low-paid and precarious jobs.67 Those earning below the real living wage in April 2020 were more than twice as likely to have been furloughed as those with earnings above that level.68 The employment situation of 65% of those who were in deep poverty – ie more than 50% below the poverty line – and employed before Covid has been negatively impacted, compared to only 35% of those above the poverty line and employed before the crisis.69 Higher earners have generally stayed working, spent less, and saved more. In contrast, lower-income households have been more at risk of losing
their job and have been more likely to run down their savings to maintain their consumption.70 In fact, many families on lower incomes have had to increase their spending because of school closures and other pandemic-related disruptions.71
As a consequence, the labour market has particularly affected some demographic groups over others. It is primarily those on insecure work contracts who have been most likely to face reductions in hours and earnings.72,73 Such workers are more likely to be women, young, and/or black and minority ethnic workers. For example, a survey by the Runnymede Trust found that 65% of people from an ethnic minority said they were affected financially by the pandemic, compared to 46% from a white ethnic group.74 Young black people have been particularly affected, with unemployment rates reaching 40% by April 2021.75
The government responded with several new support measures, most notably the Job Retention Scheme (JRS) and the Self-employed Income Support Scheme (SEISS), which provided a relatively effective safety net for eligible workers. The latest figures show 11.4 million jobs had been supported by the furlough scheme (as of March 2021),76 and 2.4 million self-employed people had claimed SEISS payments in the first two rounds.77
Nevertheless, the impact on jobs and earnings has been significant. Between January 2021 and March 2021, 1.262 million people were unemployed, up 258,000 on the same period the previous year. But the number of people falling out of employment was more than double at 529,000, showing that many people were no longer looking for work and so had become economically inactive rather than unemployed.78
But in many ways, these shifts in headline labour market indicators barely scratch the surface. Alongside these, as shown in Figure 2.1, the number of people needing to claim universal credit – including 38% who remained in work – more than doubled from 2.8 million in January 2020, to an estimated 5.9 million in January 2021.
2. IMPACTS OF COVID-19 AND THE INADEQUACY OF UK SOCIAL SECURITY

14
THE UK'S LIVING STANDARDS CRISIS THE CASE FOR A LIVING INCOME
NEW ECONOMICS FOUNDATION
2.2 INADEQUACY OF THE CURRENT SOCIAL SECURITY SYSTEM
The eye-watering increase in the number of people seeking support through universal credit is particularly concerning given its inadequacies as an effective safety net. In some ways, the system performed relatively well in dealing with the tremendous surge in demand, and the Department for Work & Pensions (DWP) has been rightly praised for its response.79 But the system did not do enough to provide people with sufficient incomes.
Although universal credit and working tax credits were temporarily increased in March 2020 by £20 a week, and local housing allowance uplifted to the 30th percentile of local rents, these uplifts failed to reach many. First, not everyone had access to these benefits in the first place. The universal credit rollout is only 59% complete, meaning that 3.3 million households still receive so-called legacy benefits, such as employment support allowance and jobseeker’s allowance, which did not receive any uplift.80 In addition, many migrant workers would have been excluded from receiving any
support at all – possibly up to 1.4 million – through the ‘no recourse to public funds’ policy.81
Second, for some who already claimed universal credit or successfully made a new claim, they did not receive all of the uplift since their benefits were capped. As Table 2.1 shows, over 150,000 households’ benefits were capped, the majority of whom were single parents (59%) or couples with children (24%), meaning they would have missed out on some or all of the uplift. And the increase is not just a linear function of the increase in the number of people on universal credit. While the number of people claiming universal credit roughly doubled, the number of households subject to the cap almost trebled, so proportionately more people were subject to the cap during the pandemic than before it.
Even with the £20 uplift, the UK’s social security system is also far less generous than it was a decade ago. Previous NEF analysis showed that if the 2010–11 benefits system had been maintained in real terms, families would have received £10.5 billion more in total support in 2021–22, even after
FIGURE 2.1: THE NUMBER OF PEOPLE CLAIMING UNIVERSAL CREDIT MORE THAN DOUBLED AS A RESULT OF THE PANDEMIC
Number of people on universal credit in and out of work, January 2020–January 2021 by month.
Source: Stat X-plore, Department for Work & Pensions
7,000,000
6,000,000
5,000,000
4,000,000
3,000,000
2,000,000
1,000,000
0
Jan 20
20
Apr 2020
Feb 2020
Mar 2
020
May 2
020
Jun 20
20
July
2020
Aug 2020
Sep 2020
Oct 20
20
Nov 2
020
Dec 2020
Jan 20
21
Not in employment In employment
15
THE UK'S LIVING STANDARDS CRISIS THE CASE FOR A LIVING INCOME
NEW ECONOMICS FOUNDATION
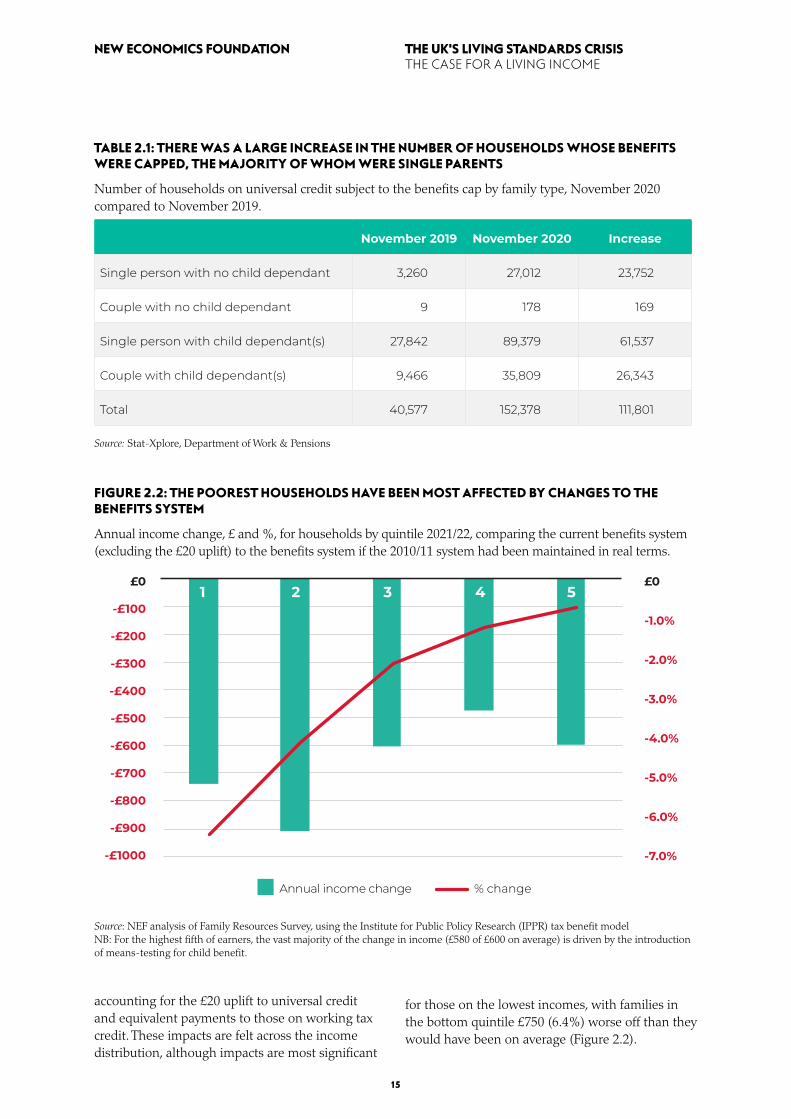
accounting for the £20 uplift to universal credit and equivalent payments to those on working tax credit. These impacts are felt across the income distribution, although impacts are most significant
for those on the lowest incomes, with families in the bottom quintile £750 (6.4%) worse off than they would have been on average (Figure 2.2).
TABLE 2.1: THERE WAS A LARGE INCREASE IN THE NUMBER OF HOUSEHOLDS WHOSE BENEFITS WERE CAPPED, THE MAJORITY OF WHOM WERE SINGLE PARENTS
Number of households on universal credit subject to the benefits cap by family type, November 2020 compared to November 2019.
November 2019 November 2020 Increase
Single person with no child dependant 3,260 27,012 23,752
Couple with no child dependant 9 178 169
Single person with child dependant(s) 27,842 89,379 61,537
Couple with child dependant(s) 9,466 35,809 26,343
Total 40,577 152,378 111,801
Source: Stat-Xplore, Department of Work & Pensions
FIGURE 2.2: THE POOREST HOUSEHOLDS HAVE BEEN MOST AFFECTED BY CHANGES TO THE BENEFITS SYSTEM
Annual income change, £ and %, for households by quintile 2021/22, comparing the current benefits system (excluding the £20 uplift) to the benefits system if the 2010/11 system had been maintained in real terms.
Source: NEF analysis of Family Resources Survey, using the Institute for Public Policy Research (IPPR) tax benefit model NB: For the highest fifth of earners, the vast majority of the change in income (£580 of £600 on average) is driven by the introduction of means-testing for child benefit.
£0
-£100
-£200
-£300
-£400
-£500
-£600
-£700
-£800
-£900
-£1000
£0
-1.0%
-2.0%
-3.0%
-4.0%
-5.0%
-6.0%
-7.0%
Annual income change % change
1 2 3 4 5
16
THE UK'S LIVING STANDARDS CRISIS THE CASE FOR A LIVING INCOME
NEW ECONOMICS FOUNDATION
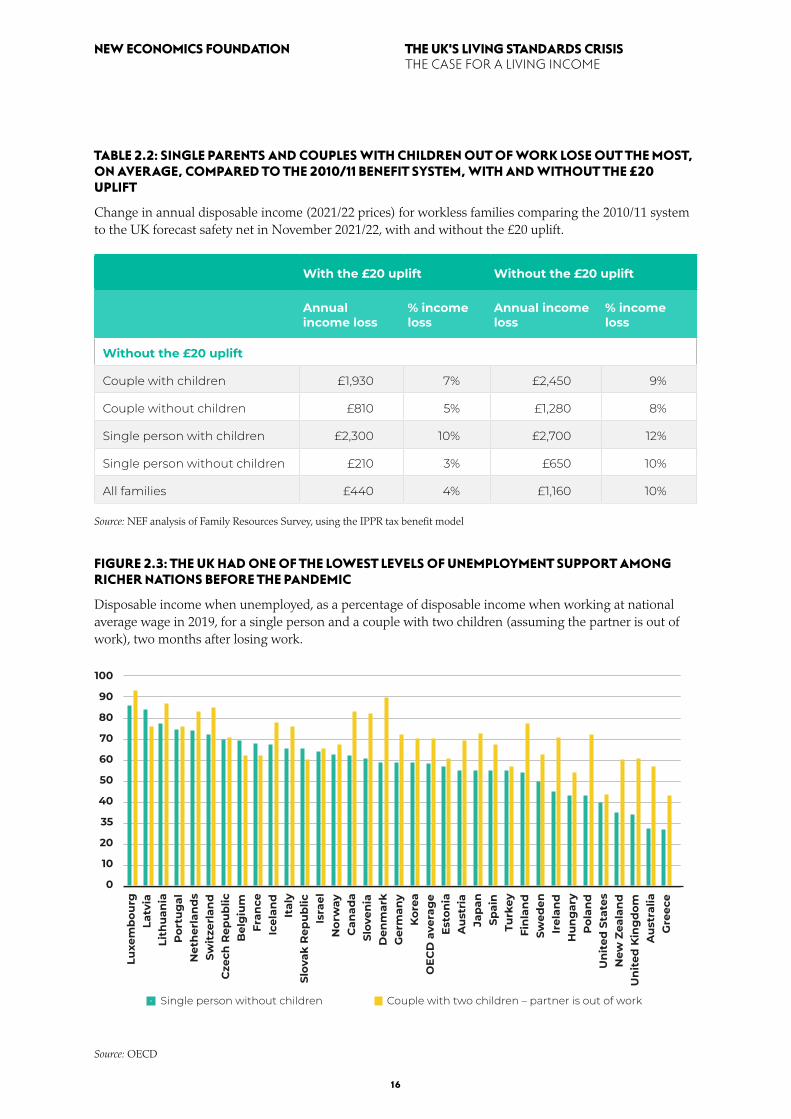
FIGURE 2.3: THE UK HAD ONE OF THE LOWEST LEVELS OF UNEMPLOYMENT SUPPORT AMONG RICHER NATIONS BEFORE THE PANDEMIC
Disposable income when unemployed, as a percentage of disposable income when working at national average wage in 2019, for a single person and a couple with two children (assuming the partner is out of work), two months after losing work.
Source: OECD
TABLE 2.2: SINGLE PARENTS AND COUPLES WITH CHILDREN OUT OF WORK LOSE OUT THE MOST, ON AVERAGE, COMPARED TO THE 2010/ 11 BENEFIT SYSTEM, WITH AND WITHOUT THE £20 UPLIFT
Change in annual disposable income (2021/22 prices) for workless families comparing the 2010/ 11 system to the UK forecast safety net in November 2021/22, with and without the £20 uplift.
With the £20 uplift Without the £20 uplift
Annual income loss
% income loss
Annual income loss
% income loss
Without the £20 uplift
Couple with children £1,930 7% £2,450 9%
Couple without children £810 5% £1,280 8%
Single person with children £2,300 10% £2,700 12%
Single person without children £210 3% £650 10%
All families £440 4% £1,160 10% Source: NEF analysis of Family Resources Survey, using the IPPR tax benefit model
Single person without children Couple with two children – partner is out of work
100
90
80
70
60
50
40
35
20
10
0
Latv
iaLu
xem
bou
rg
Por
tug
alLi
thu
ania
Swit
zerl
and
Net
her
lan
ds
Bel
giu
mC
zech
Rep
ub
lic
Icel
and
Fran
ce
Slov
ak R
epu
blic
Ital
y
Nor
way
Isra
el
Slov
enia
Can
ada
Ger
man
yD
enm
ark
OEC
D a
vera
ge
Kor
ea
Au
stri
aEs
ton
ia
Spai
nJa
pan
Fin
lan
dTu
rkey
Irel
and
Swed
en
Pol
and
Hu
ng
ary
New
Zea
lan
dU
nit
ed S
tate
s
Un
ited
Kin
gd
om
Gre
ece
Au
stra
lia

17
THE UK'S LIVING STANDARDS CRISIS THE CASE FOR A LIVING INCOME
NEW ECONOMICS FOUNDATION
The figures presented show the distributional income impact for all families, regardless of work status. If we consider just those out of work, we see that by the end of this year, families will be on average £1,160 per year (10% of their income) worse off compared with if the 2010–11 system was still in place (Table 2.2). Even if the £20 uplift were to be extended beyond September, these families would still be £440 per year (4%) worse off. However, the impact of cuts has been felt differently across different household types. Workless families with children, and particularly single parents, are much worse off, with the latter losing on average £2,700 a year compared with the old system. Even with the £20 uplift, this group will be £2,300 worse off compared to the 2010/11 system.
The UK’s social security system is also weak by international comparison. The UK differs from many other countries in that unemployment benefits bear little resemblance to prior earnings. In many other European countries, such as Germany and France, there is a significant element of social security that is contributory, where eligibility depends on past work history. This is often significantly higher than the non-contributory, typically means-tested element of social security.82 While the UK has some contributory benefits, based on a minimum contribution in the form of National Insurance payments – ie the new-style jobseeker’s allowance, the new-style
employment and support allowance, and statutory maternity pay – these are a small part of the total working-age welfare budget: £7.1 billion in 2019/20, or 7% of the total working-age welfare budget.83
As Figure 2.3 shows, before the pandemic, people working on the national average wage in Latvia would receive 84% of their former wage if they lost their job, two months after losing it. It was 74% in the Netherlands, 69% in Belgium, and 68% in France. In Britain, you would only receive 34%, the third-lowest rate amongst OECD countries. Even in the USA, for those with access to support, the average rate was 40%. And the recent temporary increases have not changed the overall story of the UK lagging behind otherwise comparable economies on this front.84
Overall, all this contributes to the UK having an income floor that provides too little for families to have an adequate quality of life. Support from the current system for costs outside housing and formal childcare comes to less than a third (32%) of the level needed to meet the MIS for workless single-adult households (both with or without children), and less than two-thirds (57%) for a couple with two children. As Figure 2.4 shows, the distance between universal credit payments and an adequate income level barely closes even with the £20 uplift.
FIGURE 2.4: THE MAIN ELEMENTS OF UNIVERSAL CREDIT ARE SIGNIFICANTLY LESS THAN THE MINIMUM INCOME STANDARD
Weekly value of MIS excluding rent and childcare for 2020, compared to the income floor provided by universal credit excluding housing and childcare for the 2020/21 financial year, for selected workless families.
Source: NEF analysis of JRF’s A Minimum Income Standard for the UK 202085
Single person, over 25,no children
MIS excluding rent and childcare (2020) Main element of universal credit excluding the £20 upliftMain element of universal credit with the £20 uplift
450
400
350
300
250
200
150
100
50
0Couple over 25,
no children Lone parent, onechild aged 0 – 1
Couple, two children aged 2 – 4
and primary-school age
18
THE UK'S LIVING STANDARDS CRISIS THE CASE FOR A LIVING INCOME
NEW ECONOMICS FOUNDATION
The combination of Covid labour market impacts and a weak safety net (Chapter 2) has seen a
significant acceleration in the UK’s longstanding living standards crisis (Chapter 1). A new forecast analysis prepared for this report shows that without a change in government policy 32% of the UK population – 21.4 million people – will be living in households below the threshold needed for a decent standard of living by November 2021. Even if the £20 uplift to universal credit is maintained, 31% of individuals (20.8 million people) will still be living below the Minimum Income Standard (MIS).
3.1 METHODOLOGY
Following the Joseph Rountree Foundation (JRF) and Centre for Research in Social Policy (CRSP) –approach, NEF has conducted a new analysis to provide a forecast estimate for the number of people falling below the MIS in the autumn of 2021. We use calculations of the appropriate MIS according to family type, kindly provided by the CRSP at the University of Loughborough (although we simplify it slightly and group families into 12 types — single person, single person with one to four children inclusive, couple, couple with one to four children inclusive, single pensioner, and couple pensioner). The most up-to-date MIS calculations available are for 2020, and so we uprate these to give 2021 benchmarks using expected inflation (CPI – Consumer Price Index) for April 2021 from the most recent estimates from the Office of Budgetary Responsibility.
We forecast household incomes in November 2021 under current government policy, assuming the furlough scheme ends in September 2021, and there are no further Self-employed Income Support Scheme (SEISS) payments from the end of
September. We assume the minimum income floor in universal credit is no longer suspended, but we show results with and without the £20 uplift being extended beyond September 2021. Household incomes are estimated using the Institute for Public Policy Research (IPPR) tax benefit model and data from the Department for Work & Pensions (DWP) Family Resources Survey.
3.2 HOUSEHOLDS BELOW THE MINIMUM INCOME STANDARD
Our results show that by November 2021, when the emergency pandemic support has been removed, it is expected that nearly one in three (32%) of households, equivalent to 21.4 million people, will be living in households below the MIS (Table 3.1). Nearly one in five (19%) will be living in households below 75% of the MIS and will therefore be at particularly high risk of material deprivation. A high proportion of children are projected to be living in households with income below this socially acceptable standard – 6.7 million children (45%) will be living in households with income below the MIS and 3.5 million children (23%) will be living in households at particularly high risk of material deprivation.
The results also show that the £20 uplift, although an important lifeline for some, is insufficient to protect many from falling below a socially acceptable living standard. Even if the uplift were to be extended beyond September, 20.8 million people including 43.4% (6.5 million) of all children would be living below the MIS by November 2021. The £20 uplift keeps roughly 700,000 people, including 200,000 children from falling below the MIS, and it keeps 1.0 million people including 100,000 children from falling below 75% of the MIS. Based on NEF modelling, by the government’s current headline measure of poverty, the £20 uplift prevents 600,000 people from falling into poverty, but 14.9 million will remain in poverty even with the uplift, by the government’s measure of relative poverty, after housing costs. 20.8 million people will be in households below the MIS with the £20 uplift maintained.
Families with different compositions, employment status, geography, and housing tenure all have different likelihoods of being below the MIS (Table 3.2). Eight in ten children in workless families, and four in ten in working families (45% overall)
3. QUANTIFYING THE UK'S COVID-19 LIVING STANDARDS CRISIS

19
THE UK'S LIVING STANDARDS CRISIS THE CASE FOR A LIVING INCOME
NEW ECONOMICS FOUNDATION
are living below a socially acceptable standard of living. Meanwhile 70% of single parents, more than half of all renters, and more than a third of all families in the North East, West Midlands, and London are living below the same threshold. Of particular concern is that more than half of children in workless families are at risk of being below 75% of the MIS and at particularly high risk of material deprivation.
It is also clear from the analysis that significant numbers of people in working families are living below the MIS or at particular risk of significant material deprivation. In total, 40% of children and 27% of adults in working families are below the
MIS, and the corresponding figures for below 75% of the MIS are 21% and 15%, respectively. Clearly, work is insufficient to provide a route out of poverty for many – and even when at least one person in a household is working, it may be that they are unable to work full-time due to their circumstances, particularly caring responsibilities or costs of care.
The current crisis is not just characterised by the numbers of people below the MIS, but also the extent to which they are below the threshold too (Figure 3.1). The average single person with an income under the MIS is 33%, or £68 per week, below the adequate income line, equivalent to £3,540 over the course of a year. For a single
TABLE 3.1: EVEN WITH THE £20 UPLIFT, NEARLY ONE IN THREE PEOPLE IN THE UK WILL BE LIVING IN FAMILIES WITH INCOMES BELOW THE MIS BY THE NOVEMBER 2021
Proportion and number of people, working-age adults, and children, living in households with net disposable income below the MIS, November 2021, with and without the continuation of the £20 universal credit uplift (we also show the proportion under 60% of median incomes for comparison).
Without the £20 uplift
With the £20 uplift Difference
% under MIS
All 31.7% 30.7% 1.0%
Working-age adults 31.5% 30.1% 1.5%
Children 44.7% 43.4% 1.4%
# under MIS (millions)
All 21.4 20.8 0.7
Working-age adults 11.7 11.1 0.5
Children 7.0 6.8 0.2
% under 75% MIS
All 18.6% 17.1% 1.4%
Working-age adults 26.2% 23.9% 2.3%
Children 23.0% 22.1% 0.9%
# under 75% MIS (millions)
All 12.5 11.6 1.0
Working-age adults 9.7 8.9 0.9
Children 3.6 3.5 0.1
% under 60% median income AHC
All 23.0% 22.1% 0.9%
Working-age adults 31.7% 30.6% 1.1%
Children 23.0% 22.1% 0.9%
# under 60% median income AHC (millions)
All 15.5 14.9 0.6
Working-age adults 11.8 11.3 0.4
Children 3.6 3.5 0.1
Source: NEF analysis of JRF/CRSP MIS and Family Resources Survey using the IPPR tax benefit model and 2018-based population projections from the Office for National Statistics (ONS). Figures are rounded to one decimal place and therefore may not sum exactly.
20
THE UK'S LIVING STANDARDS CRISIS THE CASE FOR A LIVING INCOME
NEW ECONOMICS FOUNDATION
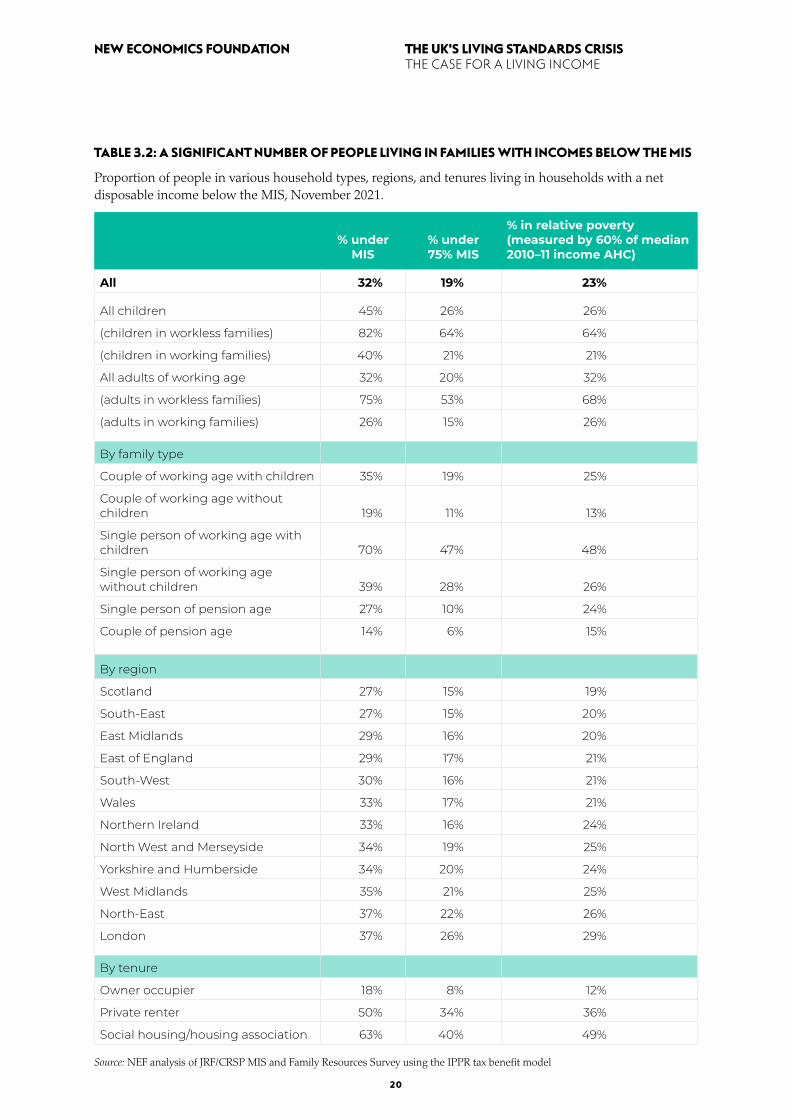
TABLE 3.2: A SIGNIFICANT NUMBER OF PEOPLE LIVING IN FAMILIES WITH INCOMES BELOW THE MIS
Proportion of people in various household types, regions, and tenures living in households with a net disposable income below the MIS, November 2021.
% under
MIS% under 75% MIS
% in relative poverty (measured by 60% of median 2010–11 income AHC)
All 32% 19% 23%
All children 45% 26% 26%
(children in workless families) 82% 64% 64%
(children in working families) 40% 21% 21%
All adults of working age 32% 20% 32%
(adults in workless families) 75% 53% 68%
(adults in working families) 26% 15% 26%
By family type
Couple of working age with children 35% 19% 25%
Couple of working age without children 19% 11% 13%
Single person of working age with children 70% 47% 48%
Single person of working age without children 39% 28% 26%
Single person of pension age 27% 10% 24%
Couple of pension age 14% 6% 15%
By region
Scotland 27% 15% 19%
South-East 27% 15% 20%
East Midlands 29% 16% 20%
East of England 29% 17% 21%
South-West 30% 16% 21%
Wales 33% 17% 21%
Northern Ireland 33% 16% 24%
North West and Merseyside 34% 19% 25%
Yorkshire and Humberside 34% 20% 24%
West Midlands 35% 21% 25%
North-East 37% 22% 26%
London 37% 26% 29%
By tenure
Owner occupier 18% 8% 12%
Private renter 50% 34% 36%
Social housing/housing association 63% 40% 49% Source: NEF analysis of JRF/CRSP MIS and Family Resources Survey using the IPPR tax benefit model

21
THE UK'S LIVING STANDARDS CRISIS THE CASE FOR A LIVING INCOME
NEW ECONOMICS FOUNDATION
FIGURE 3.1: THERE IS A SIGNIFICANT DISTANCE BETWEEN INCOME NEEDED TO MEET THE MIS AND MEDIAN INCOMES FOR THOSE FALLING BELOW THE THRESHOLD
2021 MIS (excluding rent, council tax, and water) compared to the average net disposable income after housing costs for those below the MIS.
FIGURE 3.2: THERE IS AN EVEN MORE SIGNIFICANT DISTANCE BETWEEN INCOME NEEDED TO MEET THE MIS AND MEDIAN INCOMES FOR THOSE FALLING BELOW THE THRESHOLD, FOR THOSE ON UNIVERSAL CREDIT OR EQUIVALENT BENEFITS
2021 MIS (excluding rent, council tax, and water) compared to the average net disposable income after housing costs for those below the MIS, for those on universal credit or the legacy benefits it is due to replace.
Source: NEF analysis of JRF/CRSP MIS and Family Resources Survey using the IPPR tax benefit model
500
450
400
350
300
250
200
150
100
50
0Single Couple Lone parent
2 childrenCouple
2 children
Below MIS by£90/week£4,700/year
Below MIS by£167 /week£8,700/year
Food and drink Travel day-to-day
Household goods and services, eg furniture and internet
Clothing
Average net income after housing costs for those under 75% MIS
Average net income after housing costs for those under MIS
Social and cultural participation, eg holiday
Housing costs and fuel (excluding rent, council tax and water)
Personal goods and services including health, eg dental
500
450
400
350
300
250
200
150
100
50
0Couple
2 childrenLone parent
2 childrenCoupleSingle
Food and drink Travel day-to-day
Household goods and services, eg furniture and internet
Clothing
Average net income after housing costs for those under 75% MIS
Average net income after housing costs for those under MIS
Social and cultural participation, eg holiday
Housing costs and fuel (excluding rent, council tax and water)
Personal goods and services including health, eg dental
Lorem ipsum
Below MIS by£120/week£6,250/year
Below MIS by£168/week£8,700/year
22
THE UK'S LIVING STANDARDS CRISIS THE CASE FOR A LIVING INCOME
NEW ECONOMICS FOUNDATION
parent with two children, those below the MIS are on average 36% below it, which is equivalent to £131 below it per week or £6,810 per year. For comparison, disposable median incomes are £431 per week for single people without children (more than double the MIS) and £340 for a single parent with two children (93% of the MIS).
For those on universal credit or equivalent benefits it is due to replace, the difference is even more stark. Figure 3.2 shows the distance between the MIS and incomes for claimants of these benefits, particularly for those without children. The average single person claiming universal credit or equivalent benefits with an income under the MIS is 44%, or £90 per week below the adequate income line, equivalent to £4,700 over the course of a year. A single parent below the MIS and claiming benefits is still 36% below the adequate income line, perhaps reflecting that many single parents below the MIS claim some form of benefit to top up their income.
As previous chapters have shown, the scale of the UK’s living standards crisis only becomes apparent when analysed using a needs-based approach like the Minimum Income Standard (MIS). And with weak living standards across the board come the multiple dimensions of harm from material deprivation, reduced social cohesion, long-term economic stagnation, and depleted resilience during crisis – such as the Covid-19 pandemic.
In response, NEF is calling for a new ‘mission’ – supported across multiple areas of government policy – to lift all families from states of ‘destitute’, ‘struggling’, and ‘surviving’ to one where they are actively ‘thriving’ (Chapter 1). We refer to this as a new social guarantee.86
23
THE UK'S LIVING STANDARDS CRISIS THE CASE FOR A LIVING INCOME
NEW ECONOMICS FOUNDATION
4. TOWARDS A LIVING INCOME
4.1 COMPONENTS OF A SOCIAL GUARANTEE
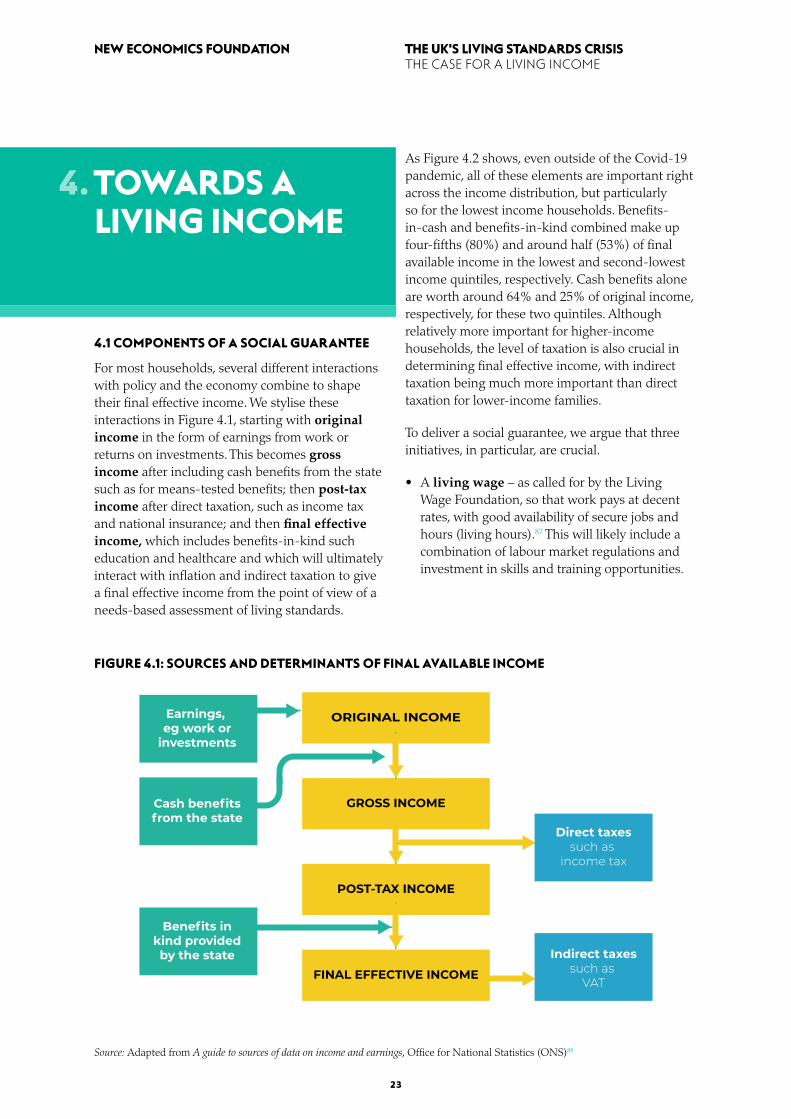
For most households, several different interactions with policy and the economy combine to shape their final effective income. We stylise these interactions in Figure 4.1, starting with original income in the form of earnings from work or returns on investments. This becomes gross income after including cash benefits from the state such as for means-tested benefits; then post-tax income after direct taxation, such as income tax and national insurance; and then final effective income, which includes benefits-in-kind such education and healthcare and which will ultimately interact with inflation and indirect taxation to give a final effective income from the point of view of a needs-based assessment of living standards.
FIGURE 4.1: SOURCES AND DETERMINANTS OF FINAL AVAILABLE INCOME
Source: Adapted from A guide to sources of data on income and earnings, Office for National Statistics (ONS)88
As Figure 4.2 shows, even outside of the Covid-19 pandemic, all of these elements are important right across the income distribution, but particularly so for the lowest income households. Benefits-in-cash and benefits-in-kind combined make up four-fifths (80%) and around half (53%) of final available income in the lowest and second-lowest income quintiles, respectively. Cash benefits alone are worth around 64% and 25% of original income, respectively, for these two quintiles. Although relatively more important for higher-income households, the level of taxation is also crucial in determining final effective income, with indirect taxation being much more important than direct taxation for lower-income families.
To deliver a social guarantee, we argue that three initiatives, in particular, are crucial.
• A living wage – as called for by the Living Wage Foundation, so that work pays at decent rates, with good availability of secure jobs and hours (living hours).87 This will likely include a combination of labour market regulations and investment in skills and training opportunities.
ORIGINAL INCOME
GROSS INCOME
POST-TAX INCOME
FINAL EFFECTIVE INCOME
Earnings, eg work or
investments
Benefits inkind providedby the state
Direct taxessuch as
income tax
Indirect taxessuch as
VAT
Cash benefitsfrom the state

24
THE UK'S LIVING STANDARDS CRISIS THE CASE FOR A LIVING INCOME
NEW ECONOMICS FOUNDATION
FIGURE 4.2: BENEFITS-IN-CASH OR BENEFITS-IN-KIND ARE A PARTICULARLY IMPORTANT SOURCE OF INCOME FOR FAMILIES IN THE TWO POOREST QUINTILES OF THE POPULATION
Gross UK household income (original income), taxes, cash benefits, tax credits, and in-kind benefits by quintile and for all people for 2018/19 in nominal prices (left axis), and value of cash benefits and tax credits as a proportion of original income (right axis).
Source: NEF analysis of the ONS, Effects of taxes and benefits on UK household income: financial year ending 201989
• Universal services – a significant expansion of benefits-in-kind in the form of public services, particularly in the areas of most pronounced market failure, such as childcare, housing, and social care.90 As previous work has shown, there is a strong case to expand universal access to free services as far as possible.91
• A living income – a major overhaul of the social security system so that it is calibrated against need and supports people into work. A living income will ensure that everyone has enough income for a decent quality of life, whether in or out of work, by guaranteeing a sufficient minimum income for all. This will likely require a strengthening of universal payments as well as stronger needs-based payments for parenting, unemployment and disability.
4.2 AIMS OF A LIVING INCOME
The fundamental idea behind a living income is that there should be an income floor that is sufficient to experience a decent standard of living below which nobody should fall. The calculation for living standards should identify what needs must be met for an individual to thrive in the society in which they live, such as the methods used to develop the MIS.
This report is the first in a new series of research that will examine the goals, options, and design of a living income in further detail. However, at a high level, the ambition for a living income is clear. At its core, it must help to address the four key dimensions of harm arising from weak living standards discussed briefly in Chapter 1: widespread deprivation, a lack of social cohesion,
160,000
120,000
80,000
40,000
0
-40,000
-80,000
100%
75%
50%
25%
0
-25%
-50%
Bottom Second Third Fourth Top All individuals
In-kind benefits Original income
Indirect taxes
Cash benefits and tax credits as a proportion of original income
Cash beneifts and cash credits
Direct taxes
25
THE UK'S LIVING STANDARDS CRISIS THE CASE FOR A LIVING INCOME
NEW ECONOMICS FOUNDATION
macroeconomic stagnation, and low economic resilience. This can be summarised across four broad goals:
• Alleviate poverty by significantly improving the level of social security support available through providing a generous income floor sufficient to experience a decent standard of living. The living income should reflect variations in family size and living costs, and support people who are less able to participate in the traditional labour market, for example due to ill health or caring for others. The system should also support work for those seeking it; empower people to demand better quality, more secure work; and ensure they can keep more of what they earn.
• Reduce inequality and ensure low- and middle-income households share in rising prosperity by considering social security reform alongside reform to the tax system. This should consider both income and wealth inequality. It should consider the relative distribution of resources by gender, ethnicity, and geography to support the equalisation of power and resources within and between households.
• Support economic stability by smoothing living standards and aggregate demand over the economic cycle, providing greater automatic stimulus in recessions, and supporting economic recovery. This will require more generous social security funded through well-designed taxation that minimises adverse impacts on wider economic activity, such as by focusing on economic rents.
• Increase resilience of the system to better insure against risks, such as ill health or unemployment, by reducing reliance on credit to smooth incomes during either personal or economy-wide crises.
In forthcoming reports, these high-level goals will be used to develop more specific design principles for reform, based on a more detailed analysis of both current and past social security and the aims of a living income as part of a social guarantee.
ENDNOTES1 JRF. (2016). UK poverty: causes, costs and solutions. London:
Joseph Rowntree Foundation.
2 OBR. (2021). Economic and fiscal outlook – March 2021. Office for Budget Responsibility. Retrieved from https://obr.uk/efo/economic-and-fiscal-outlook-march-2021/
3 Bourquin, P., Joyce, R., & Keiller, A. (2020). Living standards, poverty and inequality in the UK: 2020. London: Institute for Fiscal Studies.
4 ONS. (2019). Employee earnings in the UK: 2019. Office for National Statistics. Retrieved from https://www.ons.gov.uk/employmentandlabourmarket/peopleinwork/earningsandworkinghours/bulletins/annualsurveyofhoursandearnings/2019
5 McInnes, R. (2019). 2019 benefits uprating. Retrieved from https://commonslibrary.parliament.uk/research-briefings/cbp-8458/
6 Brewer, M., Corlett, A., Handscomb, K., & Tomlinson, D. (2021). The living standards outlook. London: The Resolution Foundation.
7 Nussbaum, M. (1988). Nature, functioning and capability: Aristotle on political distribution. Oxford Studies in Ancient Philosophy, 6, 145–84.
8 JRF. (n.d.). What is poverty? Joseph Rowntree Foundation. Retrieved from https://www.jrf.org.uk/our-work/what-is-poverty [accessed 2 June 2021].
9 House of Commons. (2015). Measuring living standards. Retrieved from https://post.parliament.uk/research-briefings/post-pn-491/
10 Beveridge, W. (1942). Beveridge report: social insurance and allied services. Retrieved from: https://www.sochealth.co.uk/national-health-service/public-health-and-wellbeing/beveridge-report/
11 Spicker, P. (2012). Why refer to poverty as a proportion of median income? Journal of Poverty and Social Justice, 20(2), 165–177.
12 Stroud, P. (2018). A new measure of poverty for the UK. London: Social Metrics Commission.
13 Bradshaw, J., Mitchell, D., & Morgan, J. (1987). Evaluating adequacy: the potential of budget standards. Journal of Social Policy, 16(2), 165–181.
14 Veit-Wilson, J. (1998). Setting adequacy standards: How governments define minimum incomes. Bristol: The Policy Press.
15 OECD. (n.d.). What are equivalence scales? Organisation for Economic Co-operation and Development. Retrieved from https://www.oecd.org/els/soc/OECD-Note-EquivalenceScales.pdf [accessed 2 June 2021].
16 Hirsch, D. (2019). A Minimum Income Standard for the United Kingdom in 2019. York: Joseph Rowntree Foundation.
17 DWP. (2021). Development of a new measure of poverty: statistical notice. Department for Work & Pensions. Retrieved from https://www.gov.uk/government/statistics/development-of-a-new-measure-of-poverty-statistical-notice/development-of-a-new-measure-of-poverty-statistical-notice
18 Townsend, P. (1979). Poverty in the United Kingdom. London: Penguin.
19 Hirsch, D., Padley, M., & Valadez, L. (2016).) A poverty indicator based on a Minimum Income Standard. Loughborough: Centre for Research in Social Policy.
20 Bourquin, P., Joyce, R., & Keiller, A. (2020). Living standards, poverty and inequality in the UK: 2020. London: Institute for Fiscal Studies.
21 Thurley, D. (2021). State pension uprating. Briefing Paper. London: House of Commons Library.
22 OECD. (n.d.). Poverty rate and poverty gap indicator. Organisation of Economic Co-operation and Development. Retrieved from https://www.oecd-ilibrary.org/social-issues-migration-health/poverty-rate/indicator/english_0fe1315d-en [accessed 28 May 2021].
23 Hirsch, D. & Stone, J. (2021). Households below a Minimum Income Standard: 2008-09 – 2018-19. London: Joseph Rowntree Foundation.
24 DWP. (2021). Households below average income: an analysis of the income distribution FYE 1995 to FYE 2020. Department for Work & Pensions. Retrieved from https://www.gov.uk/government/statistics/households-below-average-income-for-financial-years-ending-1995-to-2020/households-below-average-income-an-analysis-of-the-income-distribution-fye-1995-to-fye-2020
25 Tyler, G. (2021). Food banks in the UK. House of Commons Library. Retrieved from https://commonslibrary.parliament.uk/research-briefings/cbp-8585/
26 Bolton, P. & Hinson, S. (2020). Fuel poverty. House of Commons Library. Retrieved from https://commonslibrary.parliament.uk/research-briefings/cbp-8730/
27 Scottish Government. (2019). Rent affordability in the affordable housing sector. A literature review. The Scottish Government. Retrieved from https://www.gov.scot/publications/rent-affordability-affordable-housing-sector-literature-review/pages/5/
28 Period Poverty. (n.d.). Supporting women crisis. Period. Retrieved from https://periodpoverty.uk/ [accessed 2 June 2021].
29 Crossley, S., Garthwaite, K., & Patrick, R. (2019). The fragmentation of poverty in the UK: What’s the problem? A working paper. Retrieved from https://static1.squarespace.com/static/5d3ef1aa7c54410001ea5ef3/t/5d9a73f33fc8223140de167b/1570403322350/UK+Poverty+-+what%27s+the+problem+Working+Paper+FINAL.pdf
30 Ferragina, E., Tomlinson, M., & Walker, R. (2013). Poverty, participation and choice: The legacy of Peter Townsend. York: Joseph Rowntree Foundation.
31 Spicker, P. (1985). Why freedom implies equality. Journal of Applied Philosophy, 2(2).
32 Levitas, R., Pantazis, C., Fahmy, E., Gordon, D., Lloyd, E., & Patsios, D. (2007). The multi-dimensional analysis of social exclusion. London: Department for Communities and Local Government (DCLG).
33 Mood, C. & Jonsson, J. (2016). The social consequences of poverty: An empirical test on longitudinal data. Social Indicators Research, 127, 633–652.
34 Toge, A. & Bell, R. (2016). Material deprivation and health: a longitudinal study. BMC Public Health, 16, 747.
35 Harrington, J., Lutomski, J., Molcho, M., & Perry, I. (2009). Food poverty and dietary quality: Is there a relationship? Journal of Epidemiology & Community Health, 63, 16.
36 Fell, B. & Hewstone, M. (2015). Psychological perspectives on poverty. Retrieved from https://www.jrf.org.uk/report/psychological-perspectives-poverty
37 Ainsworth, M. (1978). Patterns of attachment: A psychological study of the strange situation. New York: Lawrence Erlbaum.
26
THE UK'S LIVING STANDARDS CRISIS THE CASE FOR A LIVING INCOME
NEW ECONOMICS FOUNDATION
38 Geddes, H. (2018).) Attachment and learning – the links between early experiences and responses in the classroom. International Journal of Nurture in Education, 4(1), 15–21.
39 Department for Work & Pensions. (2018). Rolling out Universal Credit. London: National Audit Office.
40 Bramley, G., Hirsch, D., Littlewood, M., & Watkins, D. (2016). Counting the cost of UK poverty. York: Joseph Rowntree Foundation.
41 OECD. (2017). Preventing policy capture: Integrity in public decision making. Organisation for Economic Co-operation and Development. OECD Publishing.
42 Salverda, W., Nolan, B., & Smeeding, T. (eds). (2009). The Oxford Handbook of Economic Inequality. Oxford: Oxford University Press.
43 Pryor F. L. (2012). The impact of income inequality on values and attitudes. The Journal of Socio-Economics, 41(5), 615–622. Retrieved from https://www.sciencedirect.com/science/article/abs/pii/S1053535712000510
44 Zagorski, K., Evans, M., Kelley, J., & Piotrowska, K. (2014). Does national income inequality affect individuals’ quality of life in Europe? Inequality, happiness, finances, and health. Social Indicators Research, 117, 1089–1110..
45 Elgar, F. & Aitken, N. (2011). Income inequality, trust and homicide in 33 countries. European Journal of Public Health, 21(2), 241–246
46 McCann, P. (2019).) Perceptions of regional inequality and the geography of discontent: insights from the UK. Regional Studies, 54(2). Retrieved from https://www.tandfonline.com/doi/full/10.1080/00343404.2019.1619928#_i5
47 IFS. (2020). Catching up or falling behind? Geographical inequalities in the UK and how they have changed in recent years. Institute of Fiscal Studies. Retrieved from https://www.ifs.org.uk/inequality/geographical-inequalities-in-the-uk/
48 Ibid.
49 Stirling, A. (2019). Time for demand: Boosting productivity with public investment, minimum wages and paid holiday. London: New Economics Foundation.
50 Bivens, J. (2017). Inequality is slowing US economic growth. Washington: Economic Policy Unit.
51 Stirling, A. (2019). Time for demand: Boosting productivity with public investment, minimum wages and paid holiday. London: New Economics Foundation.
52 Ibid.
53 Haldane, A. (2018). The UK’s productivity problem: Hub no spokes. London: Bank of England.
54 Cingano, F. (2014). Trends in income inequality and its impact on economic growth. OECD Social, Employment and Migration Working Papers. No. 163, OECD Publishing.
55 Shafir, E. & Mullainathan, S. (2013). Scarcity: Why having too little means so much. New York: Times Books.
56 Shahin, F. (2011). Ten reasons to care about economic inequality. London: New Economics Foundation.
57 Cingano, F. (2014). Trends in income inequality and its impact on economic growth. OECD Social, Employment and Migration Working Papers, No. 163, OECD Publishing.
58 Dafermos, Y. (2017). Debt cycles, instability and fiscal rules: a Godley–Minsky synthesis. Cambridge Journal of Economics, 42(5), 1277–1313.
59 TUC. (2019). Unsecured debt hits new peak of £15,400 per household – new TUC analysis. Trades Union Congress. Retrieved from https://www.tuc.org.uk/news/unsecured-debt-hits-new-peak-%C2%A315400-household-%E2%80%93-new-tuc-analysis
60 Stepchange. (2014). Transforming lives: A review of the social impact of debt advice for UK individuals and families, evaluated using SROI. Retrieved from https://www.stepchange.org/Portals/0/documents/media/reports/Transforming_lives.pdf
61 Bunn, P., Le Roux, J., Reinold, K., & Surico, P. (2017). The consumption response to positive and negative income changes. London: Bank of England.
62 TUC. (2020). TUC: More than 4 in 10 workers would be plunged into financial hardship if forced to self-isolate. Trades Union Congress. Retrieved from https://www.tuc.org.uk/news/tuc-more-4-10-workers-would-be-plunged-financial-hardship-if-forced-self-isolate
63 Sasse, T. (2021). The government must step up its support for people told to self-isolate. London: Institute for Government. Retrieved from https://www.instituteforgovernment.org.uk/blog/government-support-self-isolate
64 Iacobucci, G. (2021). Covid-19: UK had one of Europe’s highest excess death rates in under 65s last year. BMJ, 372.
65 Kurer, T. & Gallego, A. (2019). Distributional consequences of technological change: Worker-level evidence. Research & Politics, 6(1), 1–9.
66 Jamison, D. T., Gelband, H., Horton, S., Prabhat, J., Ramanan, L., Mock, C. N., & Nugent, R. (eds). (2017). Disease control priorities: Improving health and reducing poverty. Washington: World Bank Group.
67 Kikuchi, L. & Khurana, I. (2020). The Jobs at Risk Index (JARI). London: Autonomy. Retrieved from https://autonomy.work/portfolio/jari/
68 Wilson, T. & Buzzeo, J. (2021). Laid low: The impacts of the Covid-19 crisis on low-paid and insecure workers. London: Institute for Employment Studies.
69 SMC. (2020). Measuring poverty 2020: A report of the Social Metrics Commission. London: The Legatum Institute.
70 Brewer, M., Corlett, A., Handscomb, K., & Tomlinson, D. (2021). The living standards outlook 2021. London: The Resolution Foundation.
71 Brewer, M. & Patrick, R. (2021). Pandemic pressures: Why families on a low income are spending more during Covid-19. London: The Resolution Foundation.
72 Hu, Y. (2020). Intersecting ethnic and native–migrant inequalities in the economic impact of the COVID-19 pandemic in the UK. Research in Social Stratification and Mobility, 68, 100528.
73 Francis-Devine, B. & Powell, A. (2021). Coronavirus: Impact on the labour market. London: House of Commons Library.
74 Haque, Z., Becares, L., & Treloar, N. (2020). Over-exposed and under-protected: The devastating impact of COVID-19 on black and minority ethnic communities in Great Britain. London: Runnymede Trust.
75 Ibid.
76 HM Revenue & Customs. (2021). Coronavirus Job Retention Scheme statistics: March 2021. Retrieved from https://www.gov.uk/government/statistics/coronavirus-job-retention-scheme-statistics-march-2021/coronavirus-job-retention-scheme-statistics-march-2021
27
THE UK'S LIVING STANDARDS CRISIS THE CASE FOR A LIVING INCOME
NEW ECONOMICS FOUNDATION

77 HM Revenue & Customs. (2021). Self-Employment Income Support Scheme statistics: November 2020. Retrieved from https://www.gov.uk/government/statistics/self-employment-income-support-scheme-statistics-november-2020/self-employment-income-support-scheme-statistics-november-2020
78 ONS. (2021). Labour market overview, UK: May 2021. Office for National Statistics. Retrieved from https://www.ons.gov.uk/employmentandlabourmarket/peopleinwork/employmentandemployeetypes/bulletins/uklabourmarket/may2021
79 Brewer, M., Handscomb, K., & Shah, K. (2021). In need of support? Lessons from the Covid-19 crisis for our social security system. London: Resolution Foundation.
80 House of Commons Library. (2021). Constituency data: Universal credit rollout. London: House of Commons Library. Retrieved from https://commonslibrary.parliament.uk/constituency-data-universal-credit-roll-out/
81 UK Parliament. (2020). Unequal impact? Coronavirus and BAME people. Retrieved from https://publications.parliament.uk/pa/cm5801/cmselect/cmwomeq/384/38409.htm
82 Brewer, M., Handscomb, K., & Shah, K. (2021). In need of support? Lessons from the Covid-19 crisis for our social security system. London: Resolution Foundation.
83 Ibid.
84 Ibid.
85 Hirsch, D., Padley, M., Davis, A., & Shepherd, C. (2021). A Minimum Income Standard for the United Kingdom in 2020. London: Joseph Rowntree Foundation.
86 Coote, A. & Button, D. (forthcoming). London: New Economics Foundation.
87 Living Wage Foundation. (n.d.) Living hours: Providing security of hours alongside a real living wage. Retrieved from https://www.livingwage.org.uk/living-hours [accessed 2 June 2021].
88 ONS. (2021). A guide to sources of data on income and earnings. Office for National Statistics. Retrieved from https://www.ons.gov.uk/employmentandlabourmarket/peopleinwork/earningsandworkinghours/methodologies/aguidetosourcesofdataonearningsandincome
89 [ONS]. (2021). Effects of taxes and benefits on UK household income: financial year ending 2019. Retrieved from: https://www.ons.gov.uk/peoplepopulationandcommunity/personalandhouseholdfinances/incomeandwealth/bulletins/theeffectsoftaxesandbenefitsonhouseholdincome/financialyearending2019
90 Coote, A. & Button, D. (forthcoming). London: New Economics Foundation.
91 Coote, A. & Percy, A. (2020). The case for universal basic services. Cambridge: Polity.
28
THE UK'S LIVING STANDARDS CRISIS THE CASE FOR A LIVING INCOME
NEW ECONOMICS FOUNDATION

WRITTEN BY: Sarah Arnold, Aidan Harper and Alfie Stirling
[email protected]+44 (0)20 7820 6300 @NEFRegistered charity number 1055254
COVER IMAGE BY: Richard Johnson via iStockPhoto
PUBLISHED: June 2021
NEF is a charitable think tank. We are wholly independent of political parties and committed to being transparent about how we are funded.