the trolley bus and system designonlinepubs.trb.org/onlinepubs/sr/sr200/200-012.pdf · 34 the...
TRANSCRIPT

34
The Trolley Bus and System Design Thomas G. Matoff
After more than 20 years of neglect and decline in North America, the trolley bus has begun to enjoy a modest renaissance, The abandonment and dismemberment of existing systems in the United States and Canada have stopped. Almost a decade has now passed without serious erosion of North American trolley bus system mileage from the Chicago and Calgary abandonments of 1973 and 1975, respectively. Defying the trend to dieselization, the remaining nine U.S. and Canadian systems have replaced their postWorld War II (or even pre-World War II) equipment with contemporary rolling stock. Toronto and San Francisco have seen actual extensions of their systems take place. In Seattle, much of the system abandoned in the 1960s has been replaced, augmented by the electrification of some streets that never had trolley service. Foreign manufacturers, UMTA, and TRB are showing a fresh interest in the trolley bus. This phenomenon is not restricted to North America. Renewal is occurring in countries where trolley bus systems have traditionally been widespread--Czechoslovakia and Italy in Europe, for example. System developments have occurred recently in Latin America, and, of course, an immense number operate in the u.s.s.R. and China. New rolling stock is being developed and acquired in many countries, and system extensions are being made.
A QUESTION OF SIGNIFICANCE
Gratifying though the recent surge of trolley bus activity and renewal may be to those with an interest in the subject, it is important to view the mode--and its renaissance--in perspective. When one focuses on Toronto's Bay Street, San Francisco's Sacramento Street, or Seattle's Rainier Avenue electrifications, it is easy to imagine that trolley installation is on the rise everywhere in North America. The reality is that, on an industrywide scale, the trolley bus is not at present significant. In the United States, 98 percent of the 1,000 or so transit systems counted by the American Public Transit Association (APTA) are 100 percent motor-bus operated, primarily with diesel buses. Only the well-known and celebrated five systems in the United States (Seattle, San Francisco, Dayton, Philadelphia, and Boston) operate trolleys. APTA figures indicate that only slightly more than l percent of all originating transit passenger trips in the United States is taken on trolley buses. Total U.S. trolley bus ridership, therefore, is somewhat less than the annual fluctuation alone in overall transit patronage (l).
It has not always been this way, of course. In the early 1950s the trolley bus could truly have been said to be on its way to real significance in North America. In 1951 trolley buses represented 11 percent of the e n ti re North American bus fleet, having just emerged from a period of remarkable growth. From 1947 through 1951 the U.S. motor coach fleet remained static in size (increasing 1.3 percent in this period) despite the delivery of several thousand coaches per year. On the other hand, the trolley bus fleet increased by 50 percent in the same period largely at the expense of the streetcar. The trolley's particular niche appeared to be in the medium and medium-to-small range of cities. Forty percent of all trolleys ran in cities of 250,000 to 500,000 population, and these accounted for more than one-fourth of the buses operating in
TRB Special Report 200
cities of that size. Even in cities with a population of 500,000 to l,000,000, trolleys represented 16 percent of all buses in operation. By 1950, 15 percent of all U.S. bus transit trips was trolley trips(_~).
Today, in the entire United States, only one or less of the approximately 500 transit systems operating in cities of 500,000 population operates vehicles other than motor buses; indeed, Dayton's Miami Valley Regional Transit Authority can truly be said to be unique. The tenacity of the other four U.S. trolley bus systems can be attributed largely, if not completely, to special circumstances. Certainly, topography and cheap power played an important role in Seattle and San Francisco, as did MBTA's Harvard Square subway in Cambridge. In Philadelphia, a pro-electric city policy led to re tent ion of trolleys, albeit as a by-product of electric rail operations. But everywhere else in this country, the trolley bus has not reappeared on any of the dozens of systems it served 30 years ago. There has not yet been a single case in the United States or Canada since the 1950s where trolley buses have been introduced on a system that had completely abandoned them, or installed on a system that had never before benefited from their presence. Surely, if the mode is to be regarded as significant in national transit terms, much more must be accomplished in the way of electrification.
A reestablishment of the 11 percent fleet share of the early 1950s could be said to be a reasonable benchmark of significance. At today's level of national transit development, in itself perhaps not all that sufficient, this would mean something on the order of 6,600 coaches in operation in the United States alone, an eightfold increase. It would mean electrification on a vast scale, not just for unusual cities where topography or tunnel operation or cheap power makes trolleys especially attractive.
CAPITAL COST: MAJOR OBSTACLE
There appears to be widespread agreement that it is the high initial capital cost of a trolley bus installation that provides the major obstacle to greater use of the mode in North America. As UMTA's Electric Trolley Bus Feasibility Study emphasized, "Cost ~ is by far the most significant barrier to trolley coach expansion" (]). Particularly in the case of the great majority of potential trolley bus systems1 where unusual circumstances or policies do not exist, it is fundamentally the economic considerations that will govern consideration of trolley bus operations. The environmental advantages of the trolley and its ability to use alternative sources of power generation will probably not be sufficient in themselves to compel transit manageme.nts to embrace the mode in the face of significantly greater net costs. Only if the overall capital and operating costs are approximately equal to or lower than that ' of diesel operation is it likely that more transit systems in North America will feel justified in undertaking electrification projects. If the question of modal significance of the trolley bus is a question of expanded use, and if expansion is basically one of economics, it should be apparent that an enhanced role for the trolley bus in North America is largely dependent on setting the economic stage. The environmental benefits of the trolley bus represent a real public good, but they will in all likelihood have to be realized in most cases, particularly in view of the continuing high cost of capital, as the by-product of a fundamentally economic decision.
Many factors influence the capital cost of a

TRB Special Report 200
trolley bus overhead installation, including the type of hardware and installation specified, the availability of existing support poles, the availability of existing power distribution facilities, the degree of utility relocation required, and the general complexity of the installation. An illustrative range of $0. 5 to $1. O million per mile of two-way (double track) overhead, plus substations, can be taken as representative. As noted earlier in this paper, average per-mile estimates in Portland for a four-line, 25 route-mile system range from $650,000 to $1,200,000 depending on the supplier and the degree of pessimism in construction assumptions !il • The Portland installation would include areasonable amount of special work, new substations, and some utility relocation, and might be considered representative of the cost of installing a new overhead system of modest size in an average U.S. city. Complex trolley installations in high-cost cities under difficult circumstances, of course, can produce much higher costs. The San Francisco Municipal Railway's recent Sacramento Street electrification, for example, cost about $8 million for a 3 routemile installation (2).
Another capital cost consideration is the price tag for rolling stock. The UMTA feasibility study's market analysis noted that trolley buses tend to have an initial cost on the order of 50 percent more than a comparable motor bus. However, when viewed in the context of a life-cycle costing analysis, the considerably greater life of the trolley bus in comparison with the diesel easily offsets its additional expense. Consequently, although it is obviously a factor in managerial decisionmaking, the capital cost of rolling stock can be considered to be generally favorable to an electrification decision.
Reduced operating expenditures are also among the benefits that can be expected from electrification. The operating cost differential between diesel and trolley buses is, and for some years has been, a hotly debated topic. It is not the intention of this paper to enter into that particular debate. However, it appears that once the infrastructure is in place, all other things being equal, trolley bus operating costs are slightly lower than diesel bus operating costs on the same line, perhaps on the order of 5 to 10 percent, provided that power costs are not extraordinarily unfavorable. In the Partland analysis discussed below, a 7 percent annual operating saving over diesel operation was estimated. Based on the 1985 opening of a four-line starter system using articulated vehicles, savings were calculated to be $398, 000/year for l, 969, 704 platform miles, or approximately 20 cents/mile (§_).
A lot of longer-lived trolley buses and many more vehicle miles have to be run at a saving of perhaps 15 to 20 cents/mile to justify, on solely economic grounds, a capital investment of $0.5 to $1.0 million/mile. This is particularly true when capital itself costs 11 to 12 percent, even at municipal bond rates. Of course, other justifications for such an investment can be made; but judging from the status of the trolley bus in North America, it does not appear that these other reasons are overwhelming in most communities.
Transit systems are not rushing in droves to electrify their lines. Some of the general lack of transit industry enthusiasm can probably be put down to blind prejudice, but there can be little question that few systems have, on the basis of their current route structures, the density of service on a single route to justify electrification on economic grounds. UMTA suggested a "minimum service density requirement -of 120 or 140 two-way vehicle trips per weekday.• The 140-trip figure, or 70 round trips
35
per day, is based on a theoretical service level of 10 min during the peak, 15 min during the base period, and 30 min at night. A 15-min base level of service is not all that intensive; yet, there are not many transit systems in the United States whose 1 ines are characterized by service of that type. Certainly, there are not many in the medium-sized cities that were the trolley's stronghold 30 years ago. Even that level may not justify electrification on a solely economic basis. The UMTA analysis adds: "It appears unlikely that there are a significant number of routes and locations where trolley coaches can be justified on purely economic grounds. Thus, the minimum density level becomes a subjective decision point that is based on an implied value of environmental factors and the potential for use of energy sources other than diesel fuel."
Environmental factors and energy flexibility do have a real economic value, and transit management should take them into account in making investment decisions. However, under the stringent economic conditions that prevail in the industry today and are likely to continue, it appears unlikely that transit management can give significant weight to non-economic or, perhaps more correctly, external economic criteria in reaching investment decisions. The fate of the trolley bus--i.e., the degree to which it becomes once again a significant transit mode in North America--will depend on the degree to which it can be made a more economic choice than it largely is at present. To a great extent, this will depend on an intensification of service levels per unit of infrastructure (e.g., annual vehicle miles per route mile or daily trips). This, in turn, will depend on the structuring of the routes and service networks on which trolley operation is being considered. Without a structuring of routes to maximize service densities, it is unlikely that the pre-conditions for electrification can be met. Economically speaking, the trolley bus will not even be in the ballpark, and it will likely remain, even if fascinating and environmentally desirable, a rather insignificant transit oddity.
CREATING SERVICE DENSITY
An unfortunate service design policy appears to govern the provision of transit service to the central business districts (CBOs) of American cities. Even though the highest densities of urban development are generally found in the traditional central business district, the CBD accounts for a relatively small and often declining percentage of total regional trips (1). In order to serve this one focal point of activity, transit systems usually operate many routes, often of historic derivation, directly from surrounding areas to the CBD. The design principle relied on is ostensibly the maximization of patronage by provision of no-transfer service between the CBD and as many parts of its catchment area as possible. This strategy is intended to result in maximum patronage density on the transit lines in operation. The result, however, is often the opposite. The downtown market for public transportation, itself declining relatively or even absolutely, is split among many routes. The result is that, with the exception of quite densely populated cities, patronage is not very heavy on any one route. As a consequence, the service is not very intensive. Certainly, patronage is lower than it would be if it were concentrated on fewer routes. This is not to deny that there are in many instances routes with good service to downtown, particularly during the rush hour. However, rush-hour service also cannot provide sufficient daily bus trips to
36
economically justify intensive capital structure development of the type required for electrification. Typical off-peak service--rnidday, evenings, and weekends--generally is too low to result in justification of this kind.
Furthermore, because most of the service is oriented to the CBD, little is designed to meet other transportation needs in the region, which may represent 90 percent of all the person-trips being made. As a consequence, the transit share of this large market is minuscule, often less than 5 percent. Portland's Tri-Met offers a typical example. In a city that Sunset magazine trumpeted as having "the best transit system of any city its size," Tri-Met has a 30 percent weekday modal split to downtown. Downtown Portland, however, attracts or produces fewer than 10 percent of the total weekday persontrips made in the metropolitan area. Of the other 90 percent of the trips, approximately 1 percent is made by transit. The net modal split is thus only about 4 percent {B).
This situation - can also be viewed in reverse in the context of systems that have frequent service on downtown routes throughout the day. This can occur in cities where not all routes tapping a CBD's hinterland run directly downtown. In these cases, principal focal points such as the CBD are served by fewer routes carrying not only passengers generated along the routes themselves, but also passengers transferring from routes serving other parts of the urban area. The literature on transit network design and effectiveness has not always dealt with practical transit design strategies. However, some recent work has begun to lead to the conclusion that there are two fundamental systems, or transit system design strategies, that can be used more effectively to exploit both the downtown market and, in addition, the much larger . market for potential transit use that exists with non-downtown trips. These two techniques are the timed transfer focal point system and the grid system. ._.
Briefly, the timed transfer focal point system is one in which local routes serving neighborhoods in outlying areas focus on transit centers. These transit centers are linked with the CBD, and with one another, by trunk lines. Trunk line buses, and the buses serving local feeder routes, going in both directions on all lines, are scheduled to meet at the transit centers so that easy, quick, and predictable transfers can be made by passengers corning from any line and going to any other line in any direction. As a result, routes serve two purposes: {a) a local access function to the transit center, ideally located at an outlying activity center such as a shopping center or local business district, and {b) a feeder function to trunk routes serving the downtown. A main characteristic of a timed transfer focal point network is the concentration of downtown patronage on relatively few routes.
The grid system has similar properties. Classically, the gr id consists of a network of east-west and north-south routes that are operated frequently. Passengers can travel between any two points on the system over a fairly direct path of travel, using lines that operate frequently and generally with no more than one transfer. Once again, the orientation of routes in non-downtown directions, performing instead a crosstown function in and between non-downtown areas, results in fewer routes going directly to the CBD. But because the CBD is usually the most intensively developed part of the urban area, it generates more ridership, and this patronage is concentrated on fewer routes. The routes can be operated more intensively.
The timed transfer focal point system is generally appropriate in suburban or low-density situa-
TRB Special Report 200
tions where base period service with headways of 15 min or less on most routes is not feasible. The grid network, which is based on the concept of random transferring and short headways, offers a high standard of service, but is only economically feasible in higher-density areas where many lines operating at 10- to 15-min base headways or less are justified {~. In either case, the principal characteristic of these techniques is diversification of public transportation to make it more useful for the majority of trips being made in contemporary American rnetropoli tan areas--the non-downtown trips. This is done by deliberately not running all routes downtown. But, paradoxically, these techniques also result in fewer, well-served routes going to the CBD {!Q).
A usual objection to systems of this type made by the public and often agreed to by transit management is that it requires many people to transfer for downtown trips. This objection is raised even though such transfers would be between routes having scheduled transfer coordination at transit centers specifically designed for them, in the case of the timed transfer system, or between routes that are frequently operated, in the case of the grid system. The necessity of making passengers transfer between two routes, particularly where at present there is a direct route to the CBD, appears to scare away transit management. There is a great fear that the introduction of the transfer will result in passenger complaints and loss of patronage and that transferring is inherently evil.
Fortunately, there is a growing body of material available that indicates that properly designed transfers can be a positive element in system design. Transit systems based on the timed transfer principle, e.g., in Edmonton, in suburban Vancouver, and in the western suburbs of Portland, have proved to be remarkably successful. In these cases, the introduction of transfers has not inhibited the growth of transit ridership. To the contrary, the enhanced connectivity of the transit network and the increase in the number of potential destinations inherent in such a system have increased transit ridership. In the case of suburban Coquitlarn, for example, east of Vancouver, British Columbia, a per capita ridership of approximately 45 riders per year was achieved within 3 months of startup of the system, even though for most passengers transferring was required (11). This level of transit use is similar to that found in some large American cities, but was achieved in a low-density suburban environment. In Edmonton, the timed transfer system has been the basis for a successful development of the entire city transit system. In the case of the Westside network in suburban Portland, the introduction of a timed transfer system, together with an improvement o.f service, resulted in a 40 percent increase in ridership within 1 year of startup. This can be contrasted with the B percent ridership growth that occurred outside the affected area {~ •
In a similar manner, the operation of a grid network of frequently operated routes makes possible a desirable level of service to many possible destinations, resulting in a relatively high level of ridership. Far from being a barrier to transit ridership, the design of systems to enhance transfers, to make transfers possible, is a positive attribute. If transfers inhibit patronage, one would expect systems that require transferring to have low patronage. Although, of course, many variables are at work, it has been observed by Weisman that a positive, if modest, correlation exists between per capita ridership and the transfer ratio or percentage of all initial passengers who go on to transfer (13). Obviously, the introduction of un-
TRB Special Report 200
necessary transfers is not desirable. However, it is fairly clear that systems designed to provide a service that is attractive for non-downtown trips, either through the timed transfer system or through the introduction of a grid route structure and crosstown service, will have higher patronage and will also have higher transfer ratios.
A result of the introduction of the multidestinat ional system is the creation of a higher level of service on fewer routes serving the CBD, and this higher level of service can justify capital development--either for rail service or for trolley bus systems. The fact that network orientation and capital development are intimately linked has been pointed out in a number of studies. Bakker, for example, makes this point in Advantages and Exper iences of Timed Transfers <..!j_). Thompson (15) points out the same thing in Planning Considerations for Alternative Transit Route Structure: "All transitlevel travel to the downtown from the entire metropolitan area, therefore, is limited to this small number of routes. As a result extremely heavy passenger loads may occur on them and they may have to be highly developed in order to cope with the patronage thrust on them. The patronage may easily be of sufficient magnitude to warrant conversion to rail "--or, one might add, to trolley buses.
Analyses of the potential electrification of diesel routes are frequently made in terms of a more or less existing route structure. This was the case, for example, with the analysis of trolley buses conducted on the Tri-Met system in 1976. However, in light of the favorable system results of the grid and timed transfer focal point concepts, it appears that the trunking character is tics inherent in such concepts could more easily lead to the level of service that would justify electrification. If the advantages of trolley coach operation are seen to be desirable by a transit system, then it should also be desirable to reorient the system in such a way as to accomplish multidestination transportation objectives and at the same time set the stage for electrification. The UMTA State of the Art study hints at this (!§_). Configurations of routes involving branches that are only very lightly served are suggested for modification in order to bring the lines, as a whole, into . the density required for trolley bus operation. However, instead of considering the trolley on an individual basis, it would probably be more productive to consider the introduction of the trolley bus as a part of a reorientation of the overall route structure. In this way, not only are trunklines created that justify electrification, but also systems are developed that can attract more patronage as a whole.
TROLLEY BUSES FOR PORTLAND: THE CASE OF TRI-MET
The Tri-County Metropolitan Transportation District of Oregon (Tri-Met) is the agency that provides public transportation service in and around the Portland metropolitan area. The system operates approximately 625 diesel buses, of which 87 are articulated. It provides service over an area of approximately 1,000 miles in Multnomah, Clackamas, and Washington counties in Oregon. It provides approximately 5,700 hr of platform service per weekday and some 22 million miles of service per year.
Historically, Portland had a moderate-sized trolley bus system consisting of 10 of the principal city routes, requiring at peak strength 191 trolleys for operation. The zenith of the trolley bus system was reached in the early 1950s; the entire transit system declined thereafter and electric operations ended in 1958. Tri-Met was formed in 1969 in order to take over the operations of the faltering Rose
37
City Transit Company that had operated the trolley bus system in its final years, which then carried on with motor coaches alone.
Tri-Met embarked on a program of service improvement and extensive building of patronage, largely through education of the public concerning fares, expansion of service, and diesel fleet modernization. This strategy was generally successful in meeting its objective. Tri-Met was able, in the next 10 years, to almost triple patronage, so that, in comparison with the approximately 15 million passengers carried in 1969-1970, by 1982 approximately 42 million passengers were being carried annually. It was in the context of this improvement of service and growth of the system that the issue of a new trolley bus system began to be raised. In part, the issue arose because of the strong environmental awareness in Orec:ion, in part because of the specific interests of a number of citizen groups. The call was heard for the introduction of electrified service on at least some of Tri-Met's principal urban lines. At the same time, Tri-Met was also embarking on analyses of possible regional, light rail lines, so that, far from being contrary to the direction of system development that had been estab-1 ished, trolley buses were viewed as a possible complement to a light rail operation (ill.
An early staff report, which looked at trolley buses in a general way in 1973, reported favorably on the possible introduction of this mode to the Tri-Met system. Subsequently, in 1976, largely as a result of citizen pressure on the district to pursue a possible electrification strategy, a more detailed study was conducted for Tri-Met by DeLeuw Cather and Company. This evaluation study specifically examined electrification of four lines (Sandy Boulevard, Hawthorne-Foster, 23rd Avenue, and Jackson Park) and rather thoroughly looked into the economic, operational, and environmental issues related to possible trolley operation. At that time, Tri-Met was 5 or 6 years into its program for developing patronage and improving service, but had not yet committed itself to a program of network restructuring. A profusion of duplicative routes and compound branches was in operation. As a result, service on the individual city routes was not very young. Although environmental advantages were real and the operating costs of the coaches themselves were lower, the study concluded that the introduction of trolley buses would have resulted in net additional capital and operating costs of $1.0 to $2.5 million/year over the cost of diesel operation. The trolley bus issue was put aside for the moment, and the district's energies focused on light rail evaluation and bus system expansion.
In the meantime, restructuring and growth continued on the city system. Gradual rationalization of the historically evolved city network began, and trunk development started. In 1979 and 1980, as part of the preparation of Tri-Met' s first 5-year transit development program (TDP), another general staff analysis of trolley bus introduction was conducted. The TDP analysis indicated that for a fiveline starter system, annualized operating costs could range from $183,000 more to $134,000 less than an equivalent diesel bus system. However, the total annualized capital costs would range from $400,000 to $800,000. It was pointed out that, conceived from Tri-Met's own point of view, the potential operating savings might offset the local match for construction. In this case, then, for the first time, specific calculation of costs and benefits of operation led to a favorable staff response. Further work would be needed, though, in order to come to a firmer conclusion. In the 1980-1982 period, significant staff effort went into the redesign of

JS
the entire city bus system serving Northwest, North, and Eastside Portland to form what is essentially a grid route structure, concentrating service on trunk routes serving downtown Portland. The final version of these improvements was adopted by the Tri-Met Board in May 1982, with introduction of service scheduled for September 5, 1982.
It is at this point that the most recent analysis of electrification possibilities took place. It is useful to look at the transit development milestones in the Portland region that were reached in the late 1970s in order to understand the context of the current trolley bus project in Portland. To begin with, it was in this period that Tri-Met and the Portland region resolved to undertake the first of a series of regional light rail transit lines--the 15-mile Banfield line connecting Portland with East Multnomah County and the city of Gresham. The regional corrunitment to such a strategy and the availability of interstate transfer funds have led to the reintroduction of electrified transit service to Portland after a lapse of some 25 years. The line is now under construction. In the sphere of network development, Tri-Met moved into a deliberately planned multidimensional strategy with the inauguration in June 1979 of a timed-transfer service based on Canadian models of Edmonton and Vancouver. This strategy, which establishes outlying transit centers on the Westside suburban network at Beaverton and Cedar Hills, led to the trunking of transit routes between those transit centers and downtown Portland, and has been an outstanding success in terms of patronage development. That success encouraged the agency to go ahead with the development of a grid network in Portland involving not only the addition of bus hours and the creation of new crosstown routes, but also the discontinuance of many of the weaker secondary radial services, which were descendants of lines that, in some cases, had been in
TRB Special Report 200
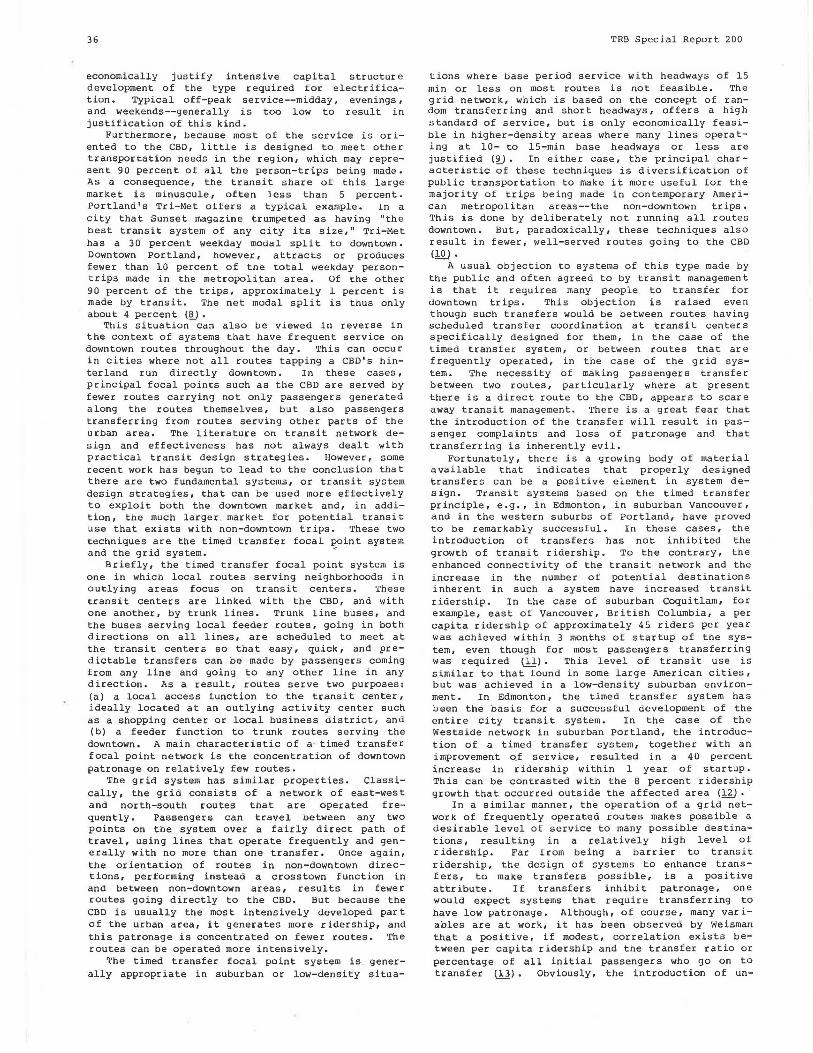
operation for many years. Remaining downtown routes are, in the main, being given a much more intensive level of service, not only making it possible for people to transfer on a random basis between urban trunk and crosstown routes, but also setting the stage for effective capital investment in modes other than the diesel bus (see Figures 1 and 2) •
The 1976 evaluation looked at four lines of approximately 54.9 wire-miles. At that time, these lines required 1,044,500 annual revenue bus-miles using standard coaches, so that the number of annual trips per route mile was approximately 19,026. On a daily basis, using 300 as an annualizing figure for weekday service, this would represent 63 trips in each direction per day or approximately 126 trips total per day. Thus, the 1976 evaluation, even though it was performed on what were at that time the heaviest lines in the system, could produce only 128 trips/day per two-way route mile of trolley system. This was at the lower end of what was later developed in the UMTA Feasibility Study as the range for potential electrification.
By comparison, the 1982 evaluation, looking forward to 1985, similarly looks at a system of 55. 9 wire-miles but an annual revenue mileage figure of 1,758,537 vehicle-miles. This is the equivalent of 31,458 annual trips/mile or approximately 105 trips/ one-way mile, or 210 trips/double-track system/ year. In comparison with the 1976 figure, this is approximately two-thirds again as dense a system as was evaluated only 6 years ago. Comparing this with the UMTA figure, the transit improvement program embarked on by Tri-Met has set the stage for potential trolley bus application. However, the post-1982 projections are based on the use of articulated coaches. If this is compared with the standard coaches in the 1976 study, it would be necessary to compensate by an additional capacity factor of 40 to 50 percent over the capacity for an equivalent num-
~r ~ . ·,
N
I ·: ·'
',
---15-Min Base Headway or Shorter
-- - - - --Base Headway Longer Than 15 Min
:···
:_.~ ... . -·
Figure 1. Tri-Met: Portland city transit routes, Spring 1982.
........
TRB Special Report 200 39
N
j ----......
,_·.
21-MT. TABOR . --. ·--.. , ... - ~
... ....
---15-Mi n Base Headway or Shorter
------Base Headway Longer Than 15 Min
- Proposed Trolley Bus Routes ·-. Figure 2. Tri-Met: Portland city transit routes, Fall 1982.
ber of standard buses. In terms of scheduled capacity, this means that the post-1985 trunk route system is 2.3 times as densely served as was the system of 1976. It is this density of service, created by the network restructuring program, that makes it possible to consider favorably for the first time the electrification of major urban routes in the Tri-Met system. (As a final note, it should be recognized that the 1976 system included branches and off-lying loops for many of the trips and that the number of trips operated over the common section of route was diluted on the other sections of lines where branches existed. Under the 1982 system and beyond, all branches and off-lying loops have been eliminated and the full intensity of service is operated over the full length of line.)
The result of the Tri-Met feasibility study is that under moderate to pessimistic assumptions, on a life-cycle costing basis, the trolley bus approach to operation of these four lines will be no more expensive from an overall economic point of view (capital plus operating cost) than the operation of diesel articulated buses on these four lines, offering a comparable level of service. Under moderate to optimistic assumptions, there would be a slight saving in total cost. Looking at the question from the point of view of Tri-Met as the operator, the opportunity to substitute federal capital funds for local operating costs could be a temptation almost too overwhelming to resist l!]l.
A word about articulated trolley bus operation in Portland is in order at this point. The trolley bus is usually identified as a potential candidate for densely operated inner-city routes characterized by frequent stops and starts, heavy passenger loadings, and a high rate of passenger turnover. It is on densely operated service that articulated buses can be used to maximize the productivity of labor without sacrificing attractive service frequencies. The through-routed 14-Sandy Boulevard/Hawthorne Boule-
vard line, even with articulated coach operation, will offer frequent rush-hour service, 12-min weekday bus service, and 15-min service on nights and weekends.
At the same time that Tri-Met is reorganizing its urban route structure, it is adopting European selfservice fare-collection techniques that permit passenger loading and unloading at all doors. In the case of the articulated diesel coach, which will be phased into operation before electrification, this will mean three double-width doors. At the time this paper was prepared, the service was not yet in operation; however, it is expected that with a great number of passengers either using transfers, prepaid tickets, or passes (the system is already nearing the 50 percent passenger usage rate for passes) , dwell times on heavy urban lines should be minimized, and the ubiquitous passenger on-and-off movement will be handled without unduly sacrificing overall schedule speed and performance. Under these circumstances, Tri-Met believes that the trolley bus could offer the optimum in operating efficiency for medium- to heavy-density urban lines operating on surface streets. The key elements in efficient operation are high-capacity trolley coach operation, the ability to take advantage of an investment in electric infrastructure by maximizing service densities, and the use of self-service fare-collection techniques to maximize efficiency and economy of operation.
SUMMARY
This paper views the design of the transit network as the basis for successful introduction of trolley c o ach operation in most American c ities . There will alwa y s be cases where steep hills, tunne ls, or other unique circumstances will make trolley buses a favored mode. However, these circumstances alone do not lead to significant use of the trolley bus in

40
overall U .s. transit operations. A more universal application of the trolley bus appears to require a level of operation denser than is found on typical American transit systems. American systems can be redesigned to maximize operating service · densities and bring the level of operation into the sphere of economic consideration of trolley bus application. If properly done, through the use of either timed transfer focal point or grid network techniques, urban trunk routes can be developed that will be strong enough to justify electrification without economic grounds, or at least to permit the consideration of electrification without economic penalty. Further refinements to optimize trunkline economies could include articulated trolley bus deployment and adoption of self-service fare-collection techniques. Such a combination of techniques is now being pursued as a transit development strategy by Tri-Met.
REFERENCES
1. Transit Fact Book. American Public Transit Association, Washington, DC, 1981, p. 40, Table 1.
2. Transit Fact Book. American Public Transit Association, Washington, DC, 1981, p. 14, Tables 18 and 19.
3. Chase, Rosen, and Wallace, Inc. The Trolley Coach: Potential Market, Capital and Operating Costs, Impacts and Barriers (Electric Trolley Bus Feasibility Study Task 2 Report). UMTA, June 1980, p. 59.
4. Tri-Met Transit Development Department Trolley Bus Project, Technical Memorandum 16: Capital Cost Estimates. Tri-Met, Portland, OR, July 1982, p. 12.
5. Interview with Carl Natvig, San Francisco Municipal Railway Planning Division.
6. Tri-Met Transit Development Department Trolley Bus Project, Technical Memorandum: Operating
TRB Special Report 200
Costs. Tri-Met, Portland, OR, June 1982, Table 5, p. 9.
7. J.R. Meyer, J.F. Kain, and M. Wohl. The Urban Transportation Problem. Harvard Univ. Press, Cambridge, MA, 1965, pp. 35-39, 84-87.
8. Summary of the Regional Transportation Plan: Draft Two. Metropolitan Service District, Portland, OR, Aug. 1980, pp. I-39, I-40, I-45.
9. B.E. Sullivan. The Timed Transfer Focal Point: A Refinement in Public Transport Service Design. UITP Revue, Vol. 25, No. 1, 1976, pp. 43-48.
10. J.B. Schneider and others. Planning and Designing a Transit Center-Based Transit System: Guidelines and Examples from Case Studies in 22 Cities. UMTA, Sept. 1980, pp. 19 and 29.
11. The Impact of New Bus Services in the Coquitlam Area. British Columbia Bureau of Transit Services, Vancouver, Oct. 1974, p. 3.
12. M. Kyte, K. Stanley, and E. Gleason. Planning, Implementation, and Evaluation of a TimedTransfer System in Portland, Oregon's Suburban Westside. Tri-Met Service Planning Department, Portland, OR, Jan. 1982.
13. M. Weisman. Variables Influencing Transit Use. Traffic Quarterly, Vol. 35, No. 3, July 1981, p. 381.
14. J.J. Bakker. Advantages and Experiences with Timed Transfers. Presented at TRB Annual Meeting, Jan. 1981, p. 89.
15. G.L. Thompson. Planning Considerations for Alternative Transit Route Structures. AIP Journal, Vol. 43, No. 2, April 1977, p. 165.
16. Chase, Rosen, and Wallace, Inc. The Trolley Coach: Development and State of the Art (Electric Trolley Bus Feasibility Study Task 1 Report). UMTA, Oct. 1979, p. 220.
17. Trolley Bus Project--Phase I, Summary Report and Staff Recommendations. Tri-Met Transit Development Department, Portland, OR, July 1982, pp. 18-21.