the trinidad and tobago economics association. the department of economics, uwi, st. augustine....
TRANSCRIPT

Trinidad and Tobago Economics Association and Department of Economics, UWI, St. Augustine.
1
INDIFFERENCE CURVE AND THE BUDGET LINE
The Trinidad and Tobago Economics Association.
The Department of Economics, UWI, St. Augustine.
April 28th, 2012
Trinidad and Tobago Economics Association and Department of Economics, UWI, St. Augustine.
2
OBJECTIVES
Presentation hopes to:
1. Introduce and Explain concept of Marginal Utility.
2. Identify the basic tenants of Indifference Curve analysis.
3. Link the theory of Indifference Curves and the Budget Line as it relates
to the consumer.
4. Identify the Income and Substitution effects.
Overall the concepts should become clearer to the student in
relation to this module as identified in the syllabus.

Trinidad and Tobago Economics Association and Department of Economics, UWI, St. Augustine.
3
WHAT IS INDIFFERENCE CURVE?
The IC shows different combinations of
goods that yields the same level of utility
(satisfaction).

Trinidad and Tobago Economics Association and Department of Economics, UWI, St. Augustine.
4
0
A
CA DB
D
C
B
INDIFFERENCE CURVEFootbal
l “Tops”
Cricket Jerseys
IC

Trinidad and Tobago Economics Association and Department of Economics, UWI, St. Augustine.
5
SHAPE OF INDIFFERENCE CURVE
Convex to the origin (similar to demand
curve).
The indifference curve is drawn on the
principle known as the marginal rate of
substitution.
Trinidad and Tobago Economics Association and Department of Economics, UWI, St. Augustine.
6
MOVEMENTS ALONG
Any combination along the indifference curve will give the
consumer the same utility. They would derive the same
satisfaction from any combination of good x and good y.
The consumer will be indifferent to any point.
As the consumer gets less of y they would want more of x.
as such, the increased quantity of x is to compensate for
the number of y’s which were given up. The converse holds
true. (Marginal rate of substitution).

Trinidad and Tobago Economics Association and Department of Economics, UWI, St. Augustine.
7
SHIFT IN THE I.C
Either a leftward or rightward shift.
Shift of the IC to the right means that the consumer is
getting more utility. The converse to that is also true.

Trinidad and Tobago Economics Association and Department of Economics, UWI, St. Augustine.
8
BUDGET LINE
Indicates three (3) things:
•We can use all of our income to buy good y.
•We can use all of our income to buy good x.
•We can use all of our income to buy some combination of
good y and good x.

Trinidad and Tobago Economics Association and Department of Economics, UWI, St. Augustine.
9
SLOPE OF BUDGET LINE.
The relevant patterns of spending between the two goods
are illustrated by the slope of the budget line. Changes in
income have no impact on the slope of the budget line.
When the price of good x increases the budget line gets
steeper or moves inwards (closer to origin). The extent of
the movement inwards depends on the increase in the price
of good x. as price of x decreases the budget line gets
flatter.

Trinidad and Tobago Economics Association and Department of Economics, UWI, St. Augustine.
10
BUDGET LINE
Cricket Jerseys
Footbal
l “Tops”
5 4 3 2 1
1 2 3 4 50
Is this possible?

Trinidad and Tobago Economics Association and Department of Economics, UWI, St. Augustine.
11
SHIFT OF THE BUDGET LINE.
An increase in income will cause the budget line to shift to
the right.
A simultaneous change in the price of both commodities
will also cause a shift in the budget line. If both prices
increase the budget line shifts to the left (need not be
proportionate) and an opposite shift should all prices
decrease.
Trinidad and Tobago Economics Association and Department of Economics, UWI, St. Augustine.
12
5. POINT OF TANGENCY
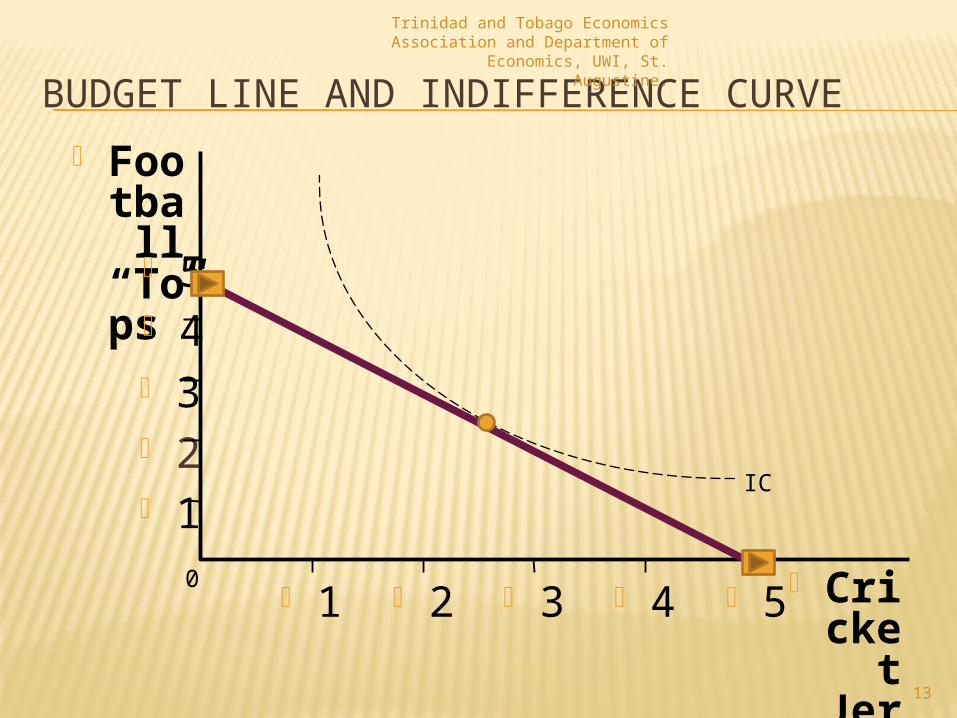
The combination of goods x and y that yields the highest
level of utility given the consumer’s income. It is
represented by the point where the IC is tangential to the
budget line.
Trinidad and Tobago Economics Association and Department of Economics, UWI, St. Augustine.
13
BUDGET LINE AND INDIFFERENCE CURVE
Cricket Jerseys
Footbal
l “Tops”
5 4 3 2 1
1 2 3 4 50
IC

14

Trinidad and Tobago Economics Association and Department of Economics, UWI, St. Augustine.
15
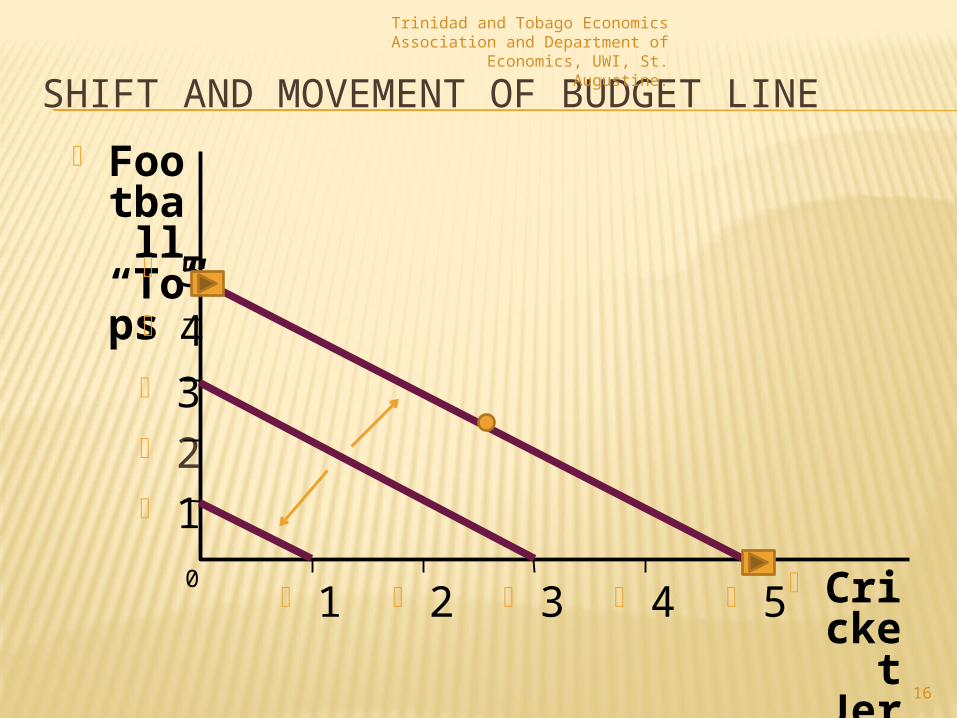
6. INCOME CONSUMPTION CURVE
As a person’s total income rises, assuming prices do not change, we anticipate the quantity purchased of each good to also increase.
Trinidad and Tobago Economics Association and Department of Economics, UWI, St. Augustine.
16
SHIFT AND MOVEMENT OF BUDGET LINE
Cricket Jerseys
Footbal
l “Tops”
5 4 3 2 1
1 2 3 4 50

Trinidad and Tobago Economics Association and Department of Economics, UWI, St. Augustine.
17
SPECIAL CASES
A normal good is a good that is bought in greater quantities as income increases. In the previous example both goods x and y were normal goods.
An inferior is one which is purchased in smaller quantities as income increases. Examples includes second hand books.

Trinidad and Tobago Economics Association and Department of Economics, UWI, St. Augustine.
18
Giffen good is one where as prices rise for a particular good, the consumer purchases more of it due to its impact on the disposable income (example potatoes).

Trinidad and Tobago Economics Association and Department of Economics, UWI, St. Augustine.
19
6. INCOME EFFECT
The reduction of the price of the good essentially increases the consumer’s purchasing power, thus leading to an increase in the quantity demanded of the commodity.
Trinidad and Tobago Economics Association and Department of Economics, UWI, St. Augustine.
20
6. SUBSTITUTION EFFECTS
Assuming a rational consumer and normal good, as the price of the good falls the consumer substitutes other goods (whose prices have not changed) with the commodity that had the price decrease.
There is an inverse relationship between price and quantity demanded, based on the above assumptions. Thus, as price falls the quantity demanded increases.
Trinidad and Tobago Economics Association and Department of Economics, UWI, St. Augustine.
21
WORKSHOP SESSIONS
The practical aspects of Indifference Curves and Budget Lines will now be explored.