the trends shaping the in a post-pandemic world
TRANSCRIPT

2021 Benchmark Report
The trends shaping the global software industry in a post-pandemic world


� Foreword
� Global Trends in Software Build Quality
� The Impact of the COVID-19 Pandemic
on Software Development
� The Burden of Technical Debt
� Conclusion
Contents
2
7
12
21
28
1
The past year has been one unlike any other. In every corner of the world, COVID-19 has
triggered a mix of responses, from business closures to mobility restrictions to total
lockdowns. These events have clearly underscored the importance of digital capabilities
in sustaining operations and keeping people connected -- for which healthy software is
vital.
The 2021 SIG Benchmark Report explores what this year of upheaval has meant for the field of software
development. For the third consecutive year, we have analyzed the data in our software analysis database
-- now containing nearly 50 billion lines of code across 6.000 systems and 280+ technologies -- to shed
light on the following questions:
� Have the dynamics of the pandemic affected how well software is built?
� Which industry has proved to be the best at building sustainable software in
our annual ranking?
� Which technology presents the highest software build quality in our annual ranking?
� How have software developers been faring during the pandemic? Has the massive shift
to remote work over the past year impacted their well-being and productivity?
Foreword
2
In addition to the pandemic impacts, our attention remains with the global trends in software
development, including the ever-growing burden of technical debt. This report therefore also
includes an estimate of costs across the field related to technical debt. We answer the burning
question: Which part of that total debt would deliver a positive ROI when renovated? Using SIG’s
updated technical debt model, we demonstrate how much can be gained by focusing renovation
efforts in a smarter way.
As part of our ongoing mission to create a healthier digital world, we are pleased to present the 2021
SIG Benchmark Report. It is our hope that this report provides an informative look at the current state
of software engineering, while providing insights to shape and guide your development strategies and
further improve the digital health of your organization.
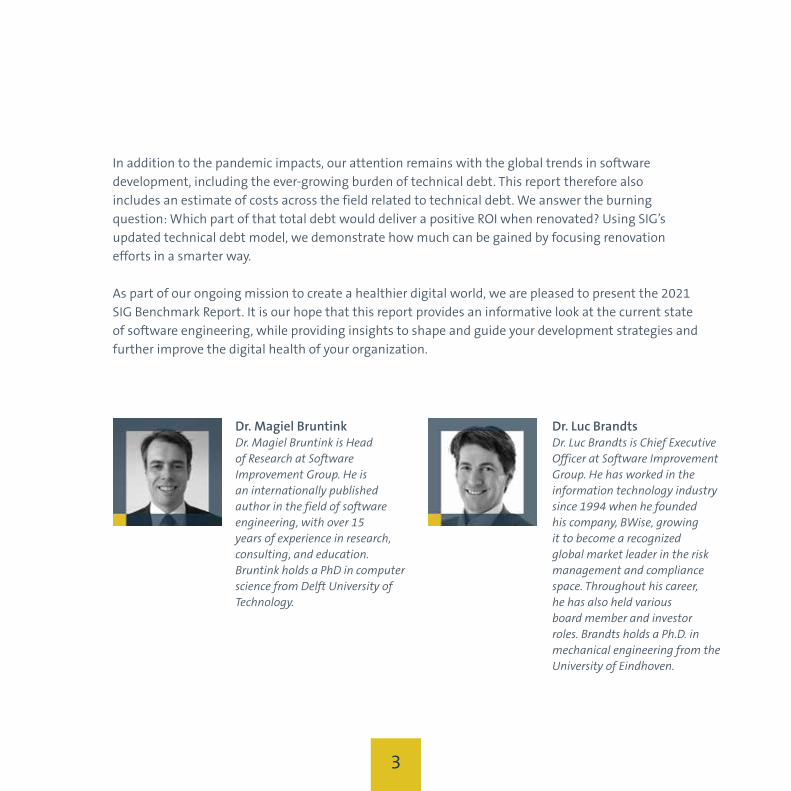
Dr. Magiel BruntinkDr. Magiel Bruntink is Head of Research at Software Improvement Group. He is an internationally published author in the field of software engineering, with over 15 years of experience in research, consulting, and education. Bruntink holds a PhD in computer science from Delft University of Technology.
Dr. Luc Brandts Dr. Luc Brandts is Chief Executive Officer at Software Improvement Group. He has worked in the information technology industry since 1994 when he founded his company, BWise, growing it to become a recognized global market leader in the risk management and compliance space. Throughout his career, he has also held various board member and investor roles. Brandts holds a Ph.D. in mechanical engineering from the University of Eindhoven.
3

Software Assurance requires both outside-in and inside-out approaches
Outside-in
External quality Internal quality
Inside-out
Software System
Functionality
Implementation“Quality is defects in use” “Quality is software construction”
Focus of most QA team,
focus on functional
suitability, correctness
and acceptance
Build quality drives
cost of ownership and
external quality
In order to fully understand the risks of a software system, it is not enough to look at the software from the outside. Rather, it’s necessary to look at all the code, only then a full understanding is possible. Seeing a demo, using the software, or trying to break in from the outside will show just the tip of the iceberg of potential trouble.
Introduction
4
+2
HHHHI
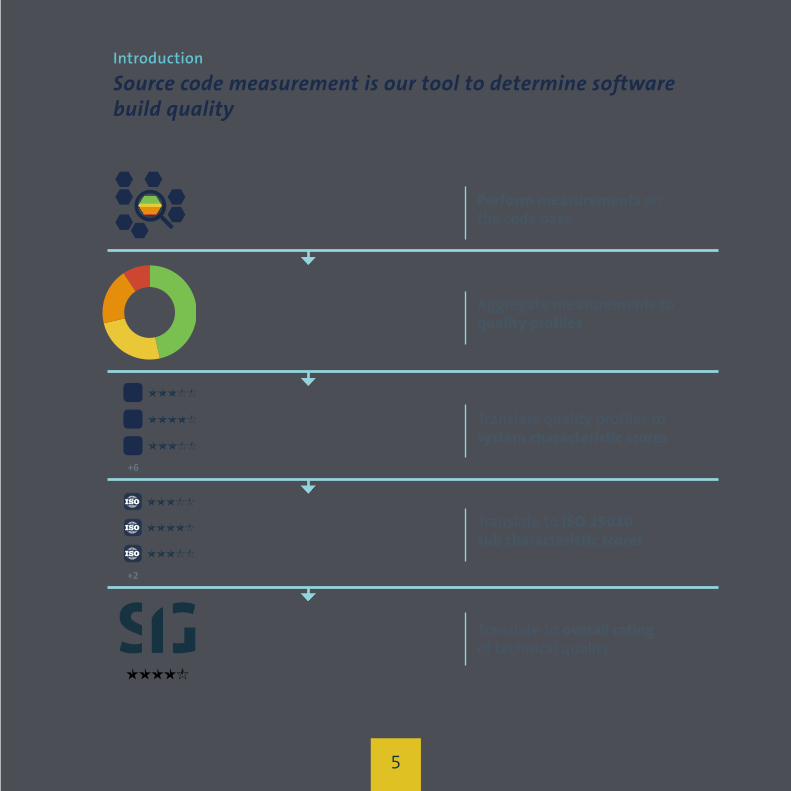
Source code measurement is our tool to determine software build quality
Perform measurements on the code base
Aggregate measurements to quality profiles
Translate quality profiles to system characteristic scores
Translate to ISO 25010 sub characteristic scores
Translate to overall rating of technical quality
1 - Measurements
2 - Quality profiles
3 - System characteristics
4 - ISO standard sub-characteristics
HHHII
HHHHI
HHHII
+6
HHHHI
HHHII
HHHII
5 - Overall rating
Introduction
SEARCH
5

SIG has the largest software analysis database in the world
6,300+ systems evaluated
235 million+ Lines of Code per week
nearly 50 billion Lines of Code in data warehouse
280+ technologies
The benchmark is formed by a certified and yearly calibrated
subset of the data in the SIG software analysis database.
Introduction
SEARCH
Clipboard-list-check
0100
6

Global Trends in Software Build Quality
The SIG software analysis database aggregates
the build quality of nearly 50 billion lines of
code across more than 6.000 different systems.
In last year’s edition of the Benchmark Report, we
observed, as we did in the prior year, that the overall
average build quality maintained a slow but steady
upward trend. We also saw Low Code technologies
taking a clear lead in the build quality race. Furthermore,
companies in the Energy, Oil, and Gas sector achieved the
highest build quality, on average. What happens when
we move our window of measurement forward by one
year? Read on!
Monitoring software build quality is a key component
of software assurance, in which you make sure that you
are on top of quality degradations, or alerted to lack of
progress of improvement efforts. This year in particular,
with the COVID-19 pandemic physically separating
teams, active software quality monitoring mitigates at
least some software concerns. At the same time, we are
reminded that our dependence on quality software has become even stronger in the virtual working
environments that many organizations scrambled to set up.
7

Software build quality continues to increase slowly, despite the pandemic
� This graph shows the overall build quality
trend, as measured by our core Maintainability
rating, expressed in stars – 5 stars representing
the highest Maintainability rating. The data
underlying this plot, which runs from 2016
until 2021-Q1, consists of 4,000 distinct
software systems.
� Software build quality, across all industries
and technology stacks, continues its upward
trend. In general, software has become easier
to change, more modular, and smaller as well.
This trend has been on the rise since 2016, even
despite the pandemic in 2020.
� For this analysis, we are looking back at history
through the lens of the most recent SIG
Maintainability Model, which was calibrated
to the most recent data. The upcoming 2021
version of the model will be somewhat stricter
to accommodate for the build quality advances
made by the industry – that will require
organizations to continually improve their
software to stay at the same level.
COVID-19
Global Trends in Software Build Quality
8

We often receive the question as to whether
performance between industries can be
evaluated and compared.
� This year’s software build quality
ranking by industry is led by Industrial
Transportation, which has moved up
from second place in last year’s analysis.
� Systems in the Telecommunications
sector place last. The industry is
dominated by large and complex
systems, which require a stronger focus
on renovation.
� Note that the most important takeaway
is whether a sector is above or below the
overall market average (a score of 3.0). An
industry’s build quality ranking is bound to
fluctuate over time, as systems come and go,
grow older and larger, and perhaps decrease
in quality. In addition, the SIG measurement
models are re-calibrated annually, further
impacting where an industry places in the
ranking.
Build Quality Ranking by Industry: Industrial Transportation leads the pack
# 2018 through 2020 Score Delta
1 Industrial Transportation 3.27 + 1
2 Banking 3.12 + 2
3 Insurance 3.10 + 3
4 Financial Services 3.09 - 1
5 Government 3.03 ==
6 Energy, Oil & Gas 3.01 - 5
7 Retail 2.85 ==
8 Software & Computer Services 2.82 + 1
9 Support Services 2.77 - 1
10 Telecommunications 2.61 ==
Scores are weighted by their (code) volume, counting only the most recent snapshot for each system measured.
Global Trends in Software Build Quality
9

Build Quality Ranking by Tech Stack: Low Code maintains narrow lead over Java/JVM technologies
# 2018 through 2020 Score Delta
1 Low Code 3.25 ==
2 Java/JVM 3.20 + 1
3 Scripting and mobile 3.18 - 1
4 Microsoft 2.92 ==
5 Packaged solutions 2.86 ==
6 BPM/Middleware 2.67 new
7 Legacy/3GL/4GL 2.37 ==
Scores are weighted by their (code) volume, counting only the most recent snapshot for each system measured.
� Since last year’s Benchmark Report,
technology stacks have maintained a mostly
stable ranking with respect to their build
quality progress. Low Code technologies
remain in the lead this year, with Legacy
technologies again placing last. Close
contenders Java/JVM and Scripting and Mobile
technologies have swapped second and third
place.
� Last year’s ranking included a single category
containing Low Code and BPM/Middleware,
which has now been split into two. The
technical differences between Low Code
technologies and BPM and Middleware have
grown too wide to keep them together.
� Low Code systems tend to be small, with a
median of just 20 person-months, while the
median Java/JVM or Microsoft-based systems
are 25% or 60% larger, respectively. Also,
currently we still include the aging VB.Net
language among the Microsoft technologies,
which may change in the next edition of this
report.
� Although there are differences in the leading
technologies, they are small and partially
driven by the observation that Low Code
systems are on average smaller than coded
systems. We recommend to use this ranking
only indicatively for technology choice in your
specific situation.
Global Trends in Software Build Quality
10


The Impact of the COVID-19 Pandemic on Software Development
For software practitioners, the widespread shift to remote work has created a more
complex operating environment, as most collaboration and work previously done in
shared office spaces was moved to home offices and teleconferencing.
Since the onset of the pandemic, we have been monitoring
the impact of this major change on core software
development metrics, such as build quality and code
production, by measuring the rate of (code) change.
In the 2020 Benchmark Report, we observed that during the
start of the pandemic, in March 2020, a surprisingly high
number of projects were outperforming themselves with
respect to both build quality and code production. We now
provide an update in this latest edition of the report – has
the improvement sustained itself, or has the new reality of
home office work created new obstacles and inefficiencies in
the longer term?
We also report on the first results of an in-depth study that
SIG has launched in cooperation with Leiden University. In
this study, we survey developers across the globe to learn
how they are coping in the new work environment, any
impacts they are experiencing on their well-being and job
performance, and the support provided by their employers.
12

Decreased coding effort observed, but slightly increased software build quality
We monitored a group of
approximately 300 systems
consistently month-over-month
and have compared their
performance during the
pandemic year (March 2020-
February 2021) to that of the
year prior (March 2019 up to
and including February 2020).
As part of this analysis, we evaluated these tracked systems’ coding effort and build quality.
� Clearly, these systems show a reduced average coding effort during the pandemic year, which is one
of the metrics relating to software productivity.
� In addition, we saw on average a slightly increased maintainability score during the pandemic year,
the core metric for software build quality.
� What does this mean? On average, less code was created or changed in the pandemic than before,
but at a slightly higher build quality level. The coding slowdown warrants a deeper dive.
The Impact of the COVID-19 Pandemic on Software Development
13
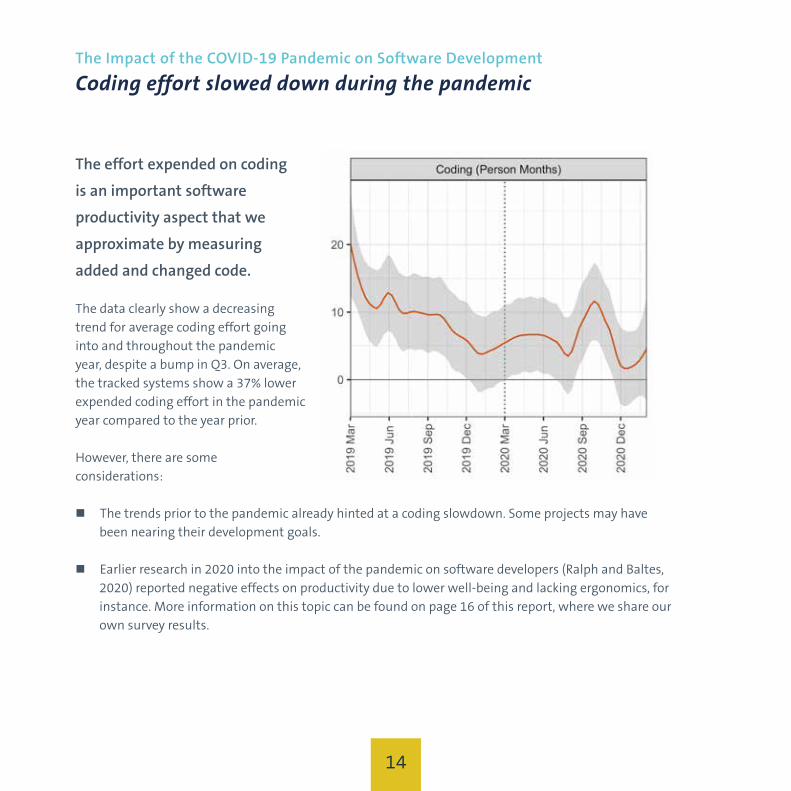
The effort expended on coding
is an important software
productivity aspect that we
approximate by measuring
added and changed code.
The data clearly show a decreasing
trend for average coding effort going
into and throughout the pandemic
year, despite a bump in Q3. On average,
the tracked systems show a 37% lower
expended coding effort in the pandemic
year compared to the year prior.
However, there are some
considerations:
� The trends prior to the pandemic already hinted at a coding slowdown. Some projects may have
been nearing their development goals.
� Earlier research in 2020 into the impact of the pandemic on software developers (Ralph and Baltes,
2020) reported negative effects on productivity due to lower well-being and lacking ergonomics, for
instance. More information on this topic can be found on page 16 of this report, where we share our
own survey results.
Coding effort slowed down during the pandemicThe Impact of the COVID-19 Pandemic on Software Development
14
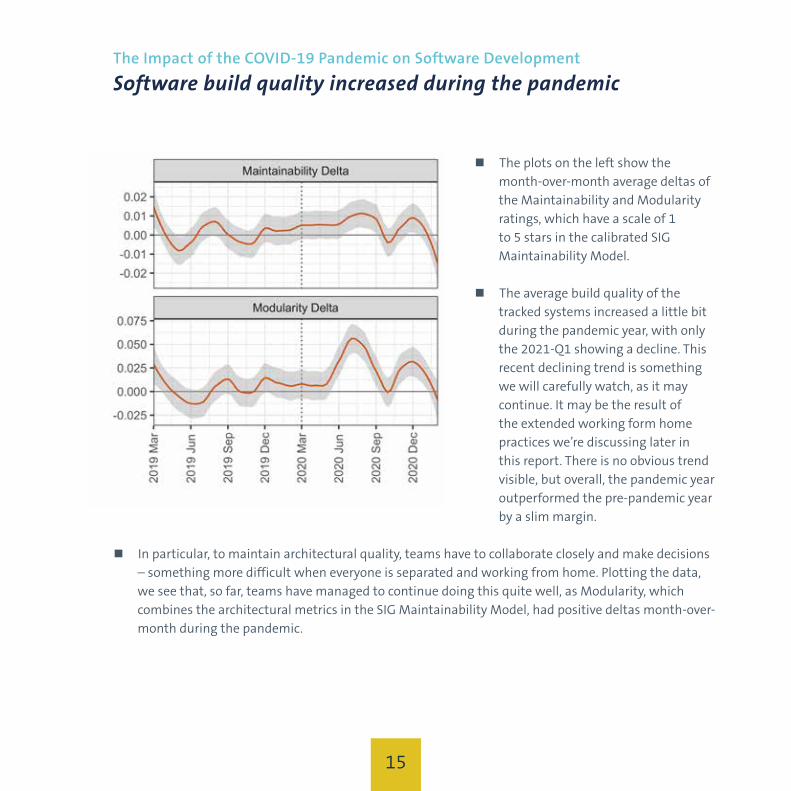
Software build quality increased during the pandemicThe Impact of the COVID-19 Pandemic on Software Development
� The plots on the left show the
month-over-month average deltas of
the Maintainability and Modularity
ratings, which have a scale of 1
to 5 stars in the calibrated SIG
Maintainability Model.
� The average build quality of the
tracked systems increased a little bit
during the pandemic year, with only
the 2021-Q1 showing a decline. This
recent declining trend is something
we will carefully watch, as it may
continue. It may be the result of
the extended working form home
practices we’re discussing later in
this report. There is no obvious trend
visible, but overall, the pandemic year
outperformed the pre-pandemic year
by a slim margin.
� In particular, to maintain architectural quality, teams have to collaborate closely and make decisions
– something more difficult when everyone is separated and working from home. Plotting the data,
we see that, so far, teams have managed to continue doing this quite well, as Modularity, which
combines the architectural metrics in the SIG Maintainability Model, had positive deltas month-over-
month during the pandemic.
15
Developers’ well-being and productivity
In March 2021, SIG began a study together with Leiden University on how the COVID-19
pandemic has impacted the productivity and well-being of software
developers.1
We are following up on a global study into these aspects performed in early 20202 by researchers Dr. Paul
Ralph and Dr. Sebastian Baltes. Using an anonymous online questionnaire, we surveyed developers to
understand:
� How are they coping mentally?
� How do they assess their job performance prior to and during the pandemic?
� How can their organizations better support them in their home offices?
In this latest edition of the Benchmark Report, we share the first outcomes of this study, which is still
ongoing. So far, the survey has received several hundred responses across 17 countries, with the top
response rates coming from the Netherlands, the US, and the UK.
� Approximately 70% of respondents work for organizations that employ more than 100 employees
� Approximately 70% of respondents hold university degrees: bachelor (46%), master (34%), or PhD (4%).
� Respondents have on average 12 years of working experience in software development, of which only
1.5 years working from home.
� 65% of respondents had not encountered COVID-19, whether personally, or through house mates,
relatives, or friends.
1 https://www.softwareimprovementgroup.com/resources/pandemic-programming2 https://paulralph.name/2020/03/27/pandemic-programming-questionnaire/
The Impact of the COVID-19 Pandemic on Software Development
16
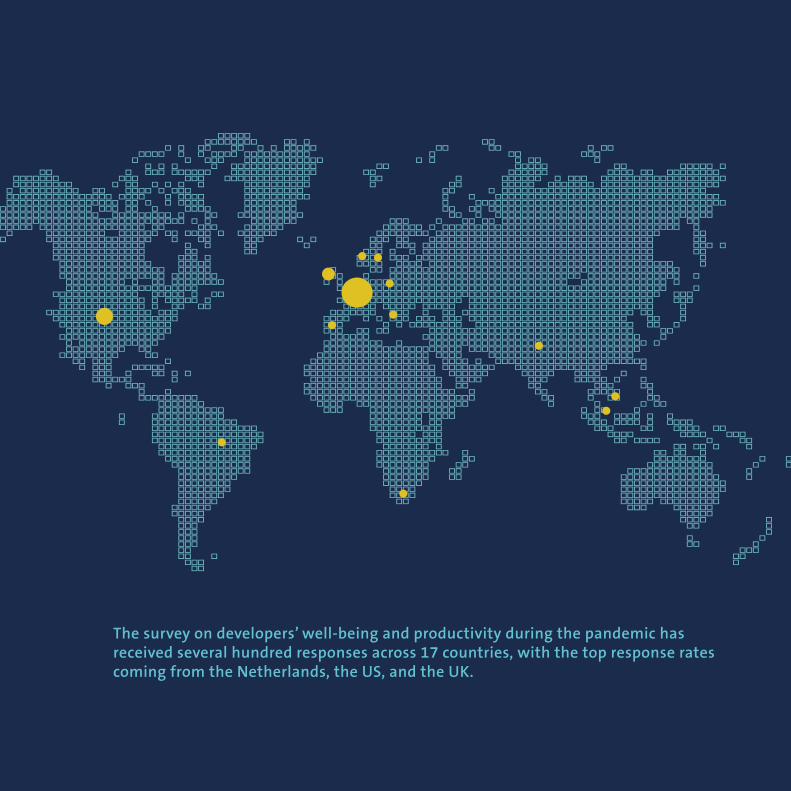
The survey on developers’ well-being and productivity during the pandemic has received several hundred responses across 17 countries, with the top response rates coming from the Netherlands, the US, and the UK.
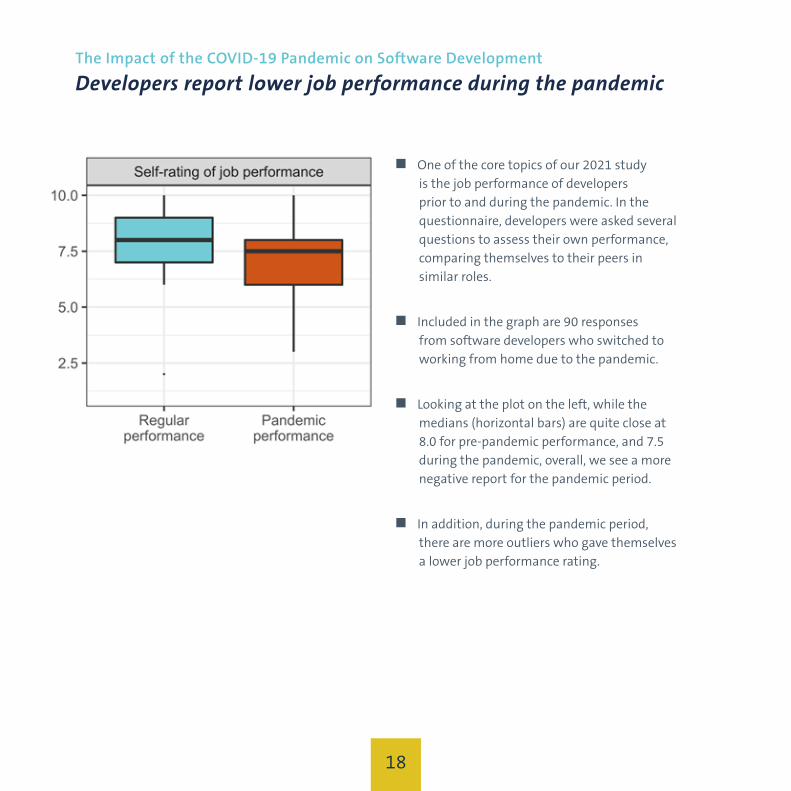
� One of the core topics of our 2021 study
is the job performance of developers
prior to and during the pandemic. In the
questionnaire, developers were asked several
questions to assess their own performance,
comparing themselves to their peers in
similar roles.
� Included in the graph are 90 responses
from software developers who switched to
working from home due to the pandemic.
� Looking at the plot on the left, while the
medians (horizontal bars) are quite close at
8.0 for pre-pandemic performance, and 7.5
during the pandemic, overall, we see a more
negative report for the pandemic period.
� In addition, during the pandemic period,
there are more outliers who gave themselves
a lower job performance rating.
Developers report lower job performance during the pandemicThe Impact of the COVID-19 Pandemic on Software Development
18
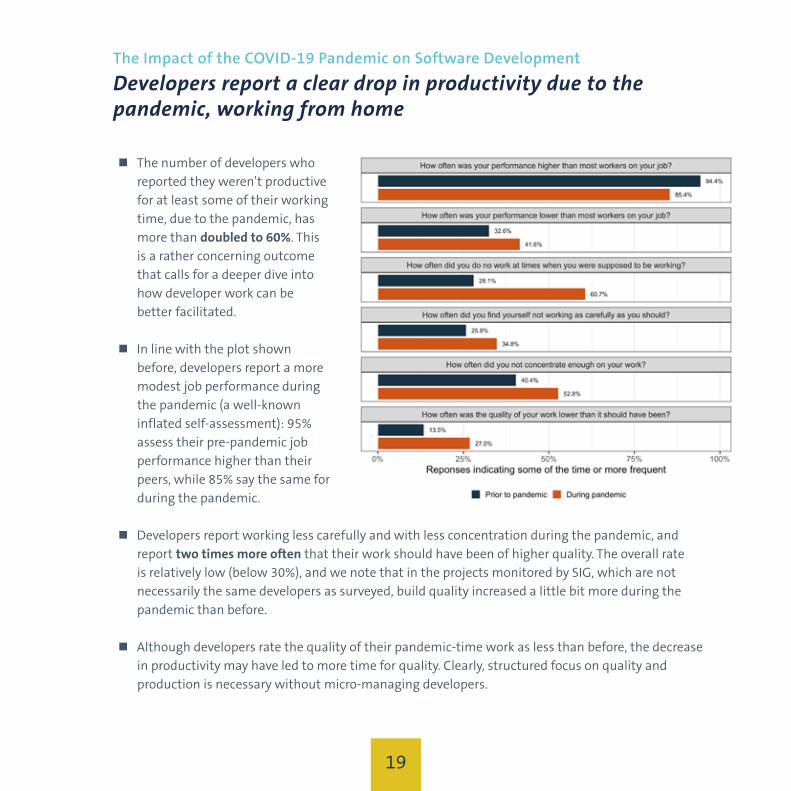
� The number of developers who
reported they weren’t productive
for at least some of their working
time, due to the pandemic, has
more than doubled to 60%. This
is a rather concerning outcome
that calls for a deeper dive into
how developer work can be
better facilitated.
� In line with the plot shown
before, developers report a more
modest job performance during
the pandemic (a well-known
inflated self-assessment): 95%
assess their pre-pandemic job
performance higher than their
peers, while 85% say the same for
during the pandemic.
� Developers report working less carefully and with less concentration during the pandemic, and
report two times more often that their work should have been of higher quality. The overall rate
is relatively low (below 30%), and we note that in the projects monitored by SIG, which are not
necessarily the same developers as surveyed, build quality increased a little bit more during the
pandemic than before.
� Although developers rate the quality of their pandemic-time work as less than before, the decrease
in productivity may have led to more time for quality. Clearly, structured focus on quality and
production is necessary without micro-managing developers.
Developers report a clear drop in productivity due to the pandemic, working from home
The Impact of the COVID-19 Pandemic on Software Development
19

#Support considered (potentially) helpful
%
1Buying new equipment we need to
work from home54
2Paying for some or all of my internet
charges48
3Reassuring that they understand if
work performance suffers43
4Taking equipment (e.g. monitors)
home from my workplace35
5Providing activities to occupy staff
member's children35
#Support considered helpful
but not available%
1Buying new equipment we need to
work from home47
2Paying for some or all of my internet
charges45
3Providing activities to occupy staff
member's children35
4Encouraging the use of work time
for professional training29
5Sending food to staff working from
home27
Developers’ top-requested support measures often not provided by their organizations
� Participants were asked to respond to 22
different statements regarding the support they
are receiving from their organizations. They
were asked to say whether the support is indeed
available to them, and whether they consider it
useful.
� In the tables here, we show the top 5 measures
considered most helpful (left) and the measures
that are most often lacking by the developers’
organizations (right). The majority (70%) of
developers are employed by organizations of 100
employees or more.
� 3 of the top 5 most helpful support measures are
often not available: purchasing equipment to
better facilitate working from home; paying for
internet costs; and helping with childcare. These
are clear areas where developers’ organizations
could focus to improve the working from home
experience of their staff.
� Organizations have adequately reassured their
staff of understanding potential impacts on
job performance resulting from remote work.
Furthermore, they are also providing for suitable
work environments by allowing employees to
borrow office equipment.
%s represent percentage of respondents included after data cleaning
The Impact of the COVID-19 Pandemic on Software Development
20

The Burden of Technical DebtThe term ‘technical debt’ is a metaphor for
describing technical deficiencies in source code.
It refers to the amount of deficiencies in internal
quality that make it harder to modify and extend
the system further and retain various qualities such
as maintainability, security, and availability.
The debt metaphor was introduced to clarify three main issues
of technical debt:
1. Technical debt can be acceptable, and even useful, to take
on (i.e. allow for a certain amount of deficiencies in the
code), e.g. to meet a shipping deadline or test a prototype
-- just as a company can take on financial debt to meet its
goals (sooner).
2. Technical debt can require “interest payments,” or, in
other words, the amount of time and resources you lose afterwards on developing or maintaining
the system, since you have to deal with technical limitations in your code base. This “interest”
compounds, since technical deficiencies often propagate to later code additions and changes,
creating a growing amount of technical debt that slows down development.
3. Technical debt can be paid back, by refactoring or renovating code to remove the technical
deficiencies and improve its quality. However, this requires spending development effort that yields
no visible improvements to the end-user and product owner: it is often challenging to convince them
that this is necessary to avoid going ‘technically bankrupt’ in the long run.
21

Low Visibility, High Impact
Technical debt in a software system represents all the quality-related deficiencies in that system.
Technical debt can be quantified: the cost of repairing all quality deficiencies in a software system1.
Repairing all deficiencies is unrealistic for technical and economic reasons, but the remaining technical
debt can slow you down.
High technical debt leads to expensive maintenance (as well as more defects and increased time to
market).
We will address the following two challenges of dealing with technical debt:
1. Technical debt is hidden, even for developers ARROW-RIGHT We need to make it visible to other stakeholders
2. There is way too much technical debt to remove it all ARROW-RIGHT We need to identify relevant technical debt
1 Nugroho, A., Visser, J. and Kuipers, T. (2011) ‘An empirical model of technical debt and interest’, in Proceedings - International Conference on Software Engineering, pp. 1–8. doi: 10.1145/1985362.1985364.
deve
lopm
ent e
ffort
time
interest of technical debt Actual maintenance effort
Optimal maintenance effort
interest of technical debt
optimal maintenance effort
The cost and long term consequences
for all stakeholders is reflected by the
interest of technical debt.
The interest is the difference between:
1. The total effort needed for
development given a system’s actual
maintainability
2. The effort needed in the absence of
technical debt
The Burden of Technical Debt
22

� We use the term renovation for improving source code by removing technical debt. In this report,
we consider 2.500 systems measured in the past 3 years in the scenario where each system would
be renovated to recommended levels (4 stars). We estimated the investment effort, maintenance
benefits, and the Return on Investment (RoI).
� Benefits come from the reduced effort
required to maintain the improved
code. The maintenance level is further
quantified by the actual and historic
amount of code changes. If the change
rate is close to 0 for a system, renovation
will not pay off with maintenance cost
alone.
� In the graph we see that the majority
of systems have an RoI below 100%,
meaning that there is no positive
business case (within a five-year period)
for renovating them.
For the majority of systems, renovating technical debt does not pay back in 5 years by reduced maintenance only
RoI =Reduced Maintenance Effort
Renovation Investment
The Burden of Technical Debt
Positive businesscases to increase to4 star quality
23
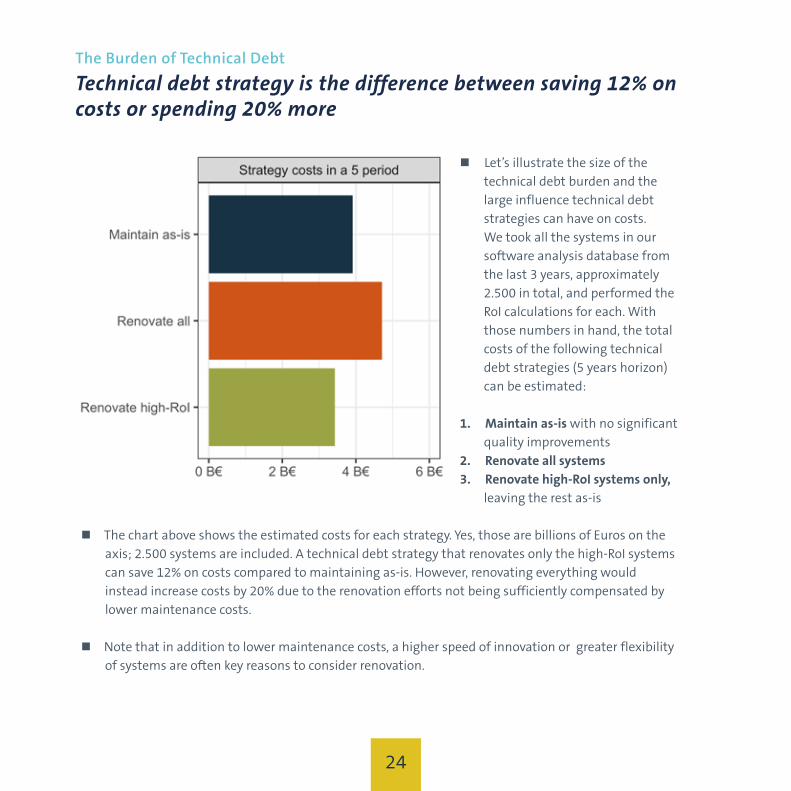
Technical debt strategy is the difference between saving 12% on costs or spending 20% more
� Let’s illustrate the size of the
technical debt burden and the
large influence technical debt
strategies can have on costs.
We took all the systems in our
software analysis database from
the last 3 years, approximately
2.500 in total, and performed the
RoI calculations for each. With
those numbers in hand, the total
costs of the following technical
debt strategies (5 years horizon)
can be estimated:
1. Maintain as-is with no significant
quality improvements
2. Renovate all systems
3. Renovate high-RoI systems only,
leaving the rest as-is
� The chart above shows the estimated costs for each strategy. Yes, those are billions of Euros on the
axis; 2.500 systems are included. A technical debt strategy that renovates only the high-RoI systems
can save 12% on costs compared to maintaining as-is. However, renovating everything would
instead increase costs by 20% due to the renovation efforts not being sufficiently compensated by
lower maintenance costs.
� Note that in addition to lower maintenance costs, a higher speed of innovation or greater flexibility
of systems are often key reasons to consider renovation.
The Burden of Technical Debt
24

� Now that we have seen that technical debt renovation needs a strong focus in order to be cost-
effective, let’s zoom in a bit on the underlying technology stacks.
� Intuitively, renovating old and large legacy systems, which are almost never changed, would hardly
pay off with just reduced maintenance costs within a 5 year period. In the chart, this is clearly
the case: the relative costs of renovating all is highest for most technology stacks considered.
Maintenance cost savings
can be achieved by
renovating select systems,
but renovating all would
sometimes result in
massive overspends.
� Systems built in more
modern technologies
with a higher average
build quality level, smaller
system size, and higher
code change rate, could
benefit from overall
renovation efforts, but still
focusing on only high-RoI
systems reduces costs
further.
Technology stacks influence technical debt strategy outcomesThe Burden of Technical Debt
25
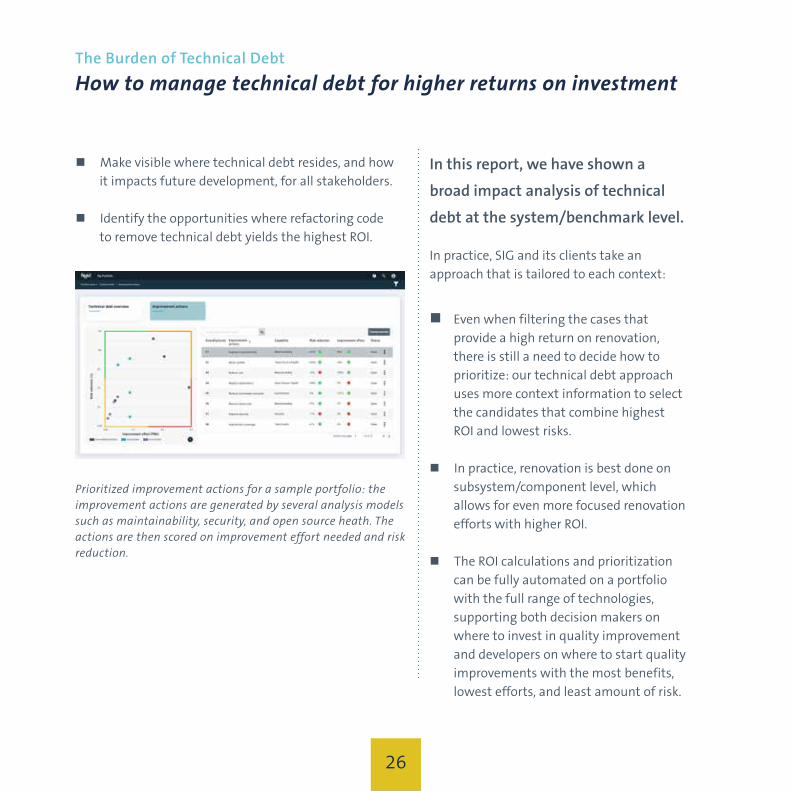
How to manage technical debt for higher returns on investment
� Make visible where technical debt resides, and how
it impacts future development, for all stakeholders.
� Identify the opportunities where refactoring code
to remove technical debt yields the highest ROI.
Prioritized improvement actions for a sample portfolio: the improvement actions are generated by several analysis models such as maintainability, security, and open source heath. The actions are then scored on improvement effort needed and risk reduction.
In this report, we have shown a
broad impact analysis of technical
debt at the system/benchmark level.
In practice, SIG and its clients take an
approach that is tailored to each context:
� Even when filtering the cases that
provide a high return on renovation,
there is still a need to decide how to
prioritize: our technical debt approach
uses more context information to select
the candidates that combine highest
ROI and lowest risks.
� In practice, renovation is best done on
subsystem/component level, which
allows for even more focused renovation
efforts with higher ROI.
� The ROI calculations and prioritization
can be fully automated on a portfolio
with the full range of technologies,
supporting both decision makers on
where to invest in quality improvement
and developers on where to start quality
improvements with the most benefits,
lowest efforts, and least amount of risk.
The Burden of Technical Debt
26

ConclusionDespite perhaps the biggest change to the working life of software practitioners due to the
COVID-19 pandemic, the field has hardly been standing still. The most significant takeaways from
this third annual SIG Benchmark Report:
� Global software build quality has maintained its upward trend Overall, global software build quality has continued to trend upward, even in these uncertain
pandemic times. That is what we observed for the teams and systems that are monitored by
SIG. We also see indications, however, both measured in code and reported (anonymously) by
developers, that work may have slowed down due to remote working. This warrants a closer look by
organizations, while considering their own context and software portfolios.
� Developers’ remote work needs are largely being left unfilled While organizations have been supporting their developers with understanding of potential lower
performance due to working from the home office, various key developer needs, such as covering for
new (home office) equipment, internet charges, and child care, aren’t being met.
� Technical debt requires the attention of every CIO or software portfolio owner Technical debt, a useful metaphor in discussing accrued build quality issues, remains an impactful
perspective that requires the attention of every CIO or software portfolio owner. We revealed how
remediation strategies should be informed by return-on-investment estimates based on historical
code change and build quality analysis. The cost difference is estimated at saving 12% on costs or
spending 20% more, depending on the successful focus of renovation effort on cases with a high
ROI. Furthermore, the technology stacks used also have a strong influence of the outcome in these
strategies.
28

Colophon
Copyright © 2021
by Software Improvement Group (SIG)
Authors: Dr. Luc Brandts and Dr. Magiel Bruntink
The information in this document may not be copied
or published, distributed or reproduced in any way
whatsoever without the prior written consent of SIG or
the legal consent of the owner.
Design: Plushommes
Art/Photos: Rawpixel
29

Fred. Roeskestraat 115
1076 EE Amsterdam
The Netherlands
www.softwareimprovementgroup.com
Getting software r ight for a healthier digital world