the trade-enhancing effect of non-tariff …foodandagriculturejournal.com/vol5.no3.pp9.pdf · the...
TRANSCRIPT

International Journal of Food and Agricultural Economics
ISSN 2147-8988, E-ISSN: 2149-3766
Vol. 5, No. 3, 2017, pp. 9-26
9
THE TRADE-ENHANCING EFFECT OF NON-TARIFF
MEASURES ON VIRGIN OLIVE OIL
Eyal Ronen
University of Warsaw, Faculty of Economic Sciences, Poland.
Email: [email protected]
Abstract
Over the last 15 years, the global trade of virgin olive oil (VOO) seems to face a
stringent regulatory regime, mainly through the imposition of TBT and SPS measures.
Such a development should have adversely impacted global levels of VOO trade.
However, evidence shows that the world's imports of VOO have more than quadrupled
in value since 2000. Alongside this trend, the share of VOO imports gradually shifts from
traditional sources (mainly EU) to New World producing countries, such as Argentina,
Australia, the USA, and Chile. By extracting data from hundreds of NTM regulations, as
well as all possible registered bilateral trade flows between 2002 to 2014, this paper aims
to empirically explore to what extent particular NTMs impact imports of VOO. The
results indicate that while tariffs remain a stringent barrier, most NTMs have a positive
impact on imports, rather than enhancing restrictiveness. The paper asserts that the
majority of NTMs respond to consumers' demand for higher food safety standards and
protection of human health, while increasing available information and transparency.
That, in turn, leads to an expansion in the magnitude of imports of VOO products.
Keywords: Non-Tariff Measures, Sanitary and phytosanitary, Technical Barriers to
Trade, Virgin Olive Oil
JEL Classifications: F13, F14, Q17, Q18
1) Introduction
The agreements on Sanitary and Phytosanitary (SPS) and Technical Barriers to Trade
(TBT) of the World Trade Organization (WTO) were designed to provide the member
countries with the freedom to choose a particular measure that allows them to achieve
legitimate policy objectives, such as the protection of human health and the environment.
However, these instruments should be levied only to the extent necessary to achieve the
desired purpose while the prohibitive effects on trade are kept to a minimum. Meanwhile,
over the past two decades, the Dispute Settlement Body of the WTO reports a growing
number of trade disputes, related either to SPS or TBT measures which created
unnecessary trade barriers (WTO, 2012).
The influence of SPS and TBT measures on international market access are more
complicated than those of traditional trade barriers, such as tariffs and countervailing
duties. The pivotal role of SPS and TBT measures ranges from alleviating asymmetric
information in the marketplace (i.e. labelling requirements) to mitigating risk in the
consumption of particular products and enhancing the sustainability of the eco-system.
Accordingly, SPS measures and TBTs are likely to impact both consumers' and
producers’ preferences and modify their decisions. Consequently, while NTMs may

The Trade-Enhancing Effect of …
10
create unnecessary trade barriers and significantly impede market access for agricultural
products from particular sources, it may also enhance consumers’ demand via risk
mitigation or quality assurance, and possibly serve as trade catalysts.
The paper aims to provide an empirical framework for examining the inclusive effects
of a variety of SPS and TBT measures, collectively organized into seven subgroups, on
the imports of a particular sector. To achieve this objective, the olive oil sector has been
chosen as a case study. Notably, the paper refers to the subcategory of virgin olive oil
(VOO), which despite being the highest quality of olive oil, accounts for over 85% of the
total olive oil exports. This sector is of particular interest given the intensified regulation
environment it operates in, as well as the dynamic developments that have occurred
during the last three decades against the background of the surge in global consumption.
Moreover, a special interest is attributed to the shift in the variety of production sources,
after hundreds of years of absolute dominance of the Mediterranean basin countries
(predominantly Spain, Italy, and Greece).
The significant growing demand for VOO, highlights the increasing popularity of the
Mediterranean diet, for its highly beneficial nutritional and culinary properties due to its
unique composition in containing fatty acids and antioxidants. Accumulated evidence
demonstrate that demand for VOO has more than quadrupled since the new millennium,
primarily in countries outside the EU. Furthermore, the consumption of VOO is expected
to further increase significantly in near future. Additional notable trend is the shift of
imports of VOO, from the traditional exporting countries to the ‘New World’ producing
countries, such as Argentina, Australia, the USA, and Chile. This development which is
clearly generated by the growing demand for affordable products, as well as the
consumers’ interest in diversified supply sources, creates another challenge for producers
of VOO.
The novelty of this paper arises from the detailed analysis of trade regulations and
their impact on global trade flows of VOO. This type of analysis is especially useful for
identifying which regulations (most) efficiently achieve a magnifying effect, in contrast
to those which pose a restrictive barrier to trade. Moreover, it also allows to determine
the extent to which these measures can serve as trade catalysts for the relevant
stakeholders.
The main contribution of the paper is the empirical validation it provides to the trade-
enhancing impact of a wide range of regulatory measures on VOO imports. It does so by
building a panel data which consists of thousands of possible NTMs, affecting all possible
bilateral trade flows between the years 2002 to 2014. The estimation results reveal that
while tariffs remain a stringent barrier, most TBT and SPS measures are associated with
a positive impact on imports rather than increasing restrictiveness. The paper asserts that
while aiming to achieve better food safety, human and animal health, and protection of
the environment, the majority of NTMs generate additional economic benefits. Through
risk mitigation, quality assurance and increased traceability, as well as information and
transparency, numerous regulatory measures virtually enhance consumer demand,
resulting in an expansion in the demand for VOO imports.
The paper is comprised of five sections. Following the introduction, the second
section portrays the characterization of the VOO sector and the policy measures which
affect its trade across countries. The third section outlines the relevant literature review,
which examine the relations between tariffs, NTMs, and olive oil trade. The fourth section
presents the econometric methodology which was chosen to conduct the analysis,
accompanied by a discussion of the results of the estimations, and a comparison of the

E. Ronen
11
exports by EU producing countries to non-EU producing countries. The last section
underlines the key findings which can be drawn from the research.
2. The Global Trade of Virgin Olive Oil
2.1 Background and Characteristics
Edible olive seems to have co-existed with humans for millennia, with its origins
traced along the eastern Mediterranean coast, which is nowadays Turkey, Syria, Lebanon,
Palestine, and Israel. After their introduction to Greece, Egypt, and western Turkey,
olives continued to move westward into Italy, France, Spain, Portugal, Algeria, Tunisia,
and Morocco. Since then, through the days of the Roman Empire, olive planting and oil
processing facilities have spread around the Mediterranean basin, which remain up to
recent years, the main region of olive oil production and largest market of consumption.
Table 1. EU vs. Non-EU countries, Olive Oil Statistics
2000 2008 2015
Volume Share Volume Share Volume Share
EU
Production (1,000
tonnes) 1.879 79,1% 1.939 72,6% 1.435 58,4%
Consumption (1,000
tonnes) 1.728 70,7% 1.866 67,7% 1.605 55%
Exports, Virgin
Olive Oil ($ Mil.) 1.293 84,8% 3.884 81,5% 4.730 78,6%
Imports, Virgin
Olive Oil ($ Mil.) 1.112 71,8% 3.284 66,3% 3.979 63,5%
Per Capita
Consumption (kg) 3,74 3,21
Non-
EU
Production (1,000
tonnes) 496 20,9% 730,5 27,4% 1.024 41,6%
Consumption (1,000
tonnes) 714 29,3% 887 32,2% 1.312 45%
Exports, Virgin
Olive Oil ($ Mil.) 232 15,2% 884 18,5% 1.286 21,4%
Imports, Virgin
Olive Oil ($ Mil.) 436 28,2% 1.667 33,7% 2.286 36,5%
Per Capita
Consumption (kg) 0,15 0,21
Source: WITS and the International Olive Council, Nov. 2016
The dominant producing countries of olive oil (OO) nowadays are Spain, Italy, and
Greece, which account for more than half of the global production. Spain is also the
leading exporter of VOO, with a share of 52% of the world's exports, followed by Italy,
Portugal, and Greece. Spain’s significant growth in production is a result of the vast
plantations and investments made during the 1980s, thanks to the incentives for
production, export, and storage provided within the EU Common Agricultural Policy.
Trailing behind the EU are Tunisia, Turkey, Syria and Morocco, countries that gradually
gain a grip of the world’s production of OO. Table 1 shows the gradual shift in output
share from the EU to non-EU producing countries, which currently account for about
The Trade-Enhancing Effect of …
12
42% of the global volume produced.
In the last 20 years, several notable developments were associated with olive oil. The
most significant development is the growing popularity of the Mediterranean diet, mainly
due to its acknowledged nutritional properties, but also as a response to the growing threat
caused by global obesity (also known as the ‘silent killer’). Notably, the most valuable
benefits are attributed to the quality of VOO. Coupled with improvements in cultivation
and the use of oil-mill technologies, this has generated a substitution drift from generic
olive oil towards VOO.
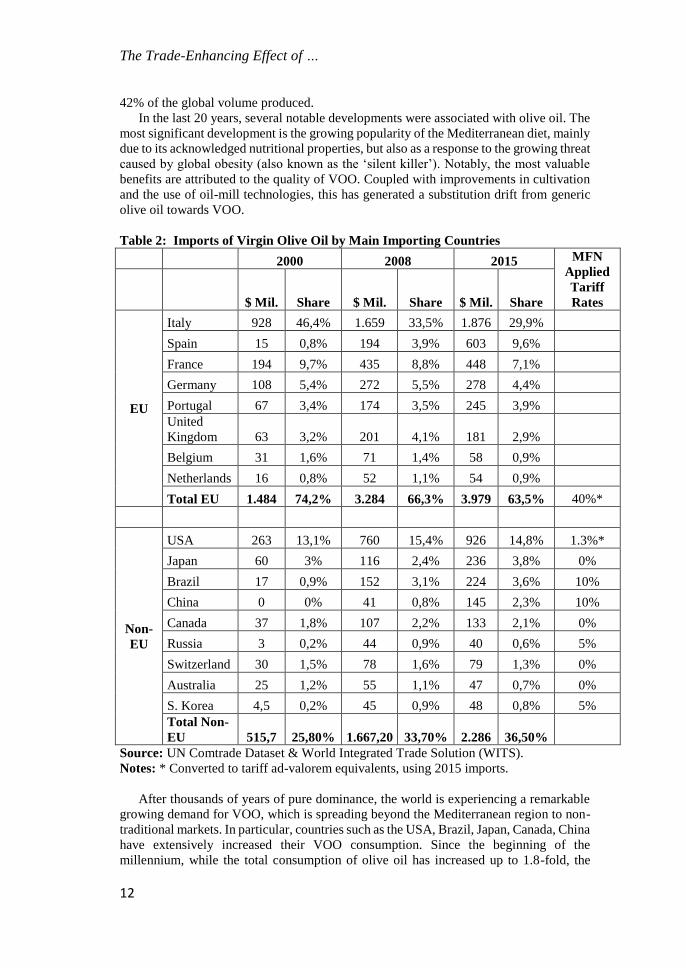
Table 2: Imports of Virgin Olive Oil by Main Importing Countries
2000 2008 2015 MFN
Applied
Tariff
Rates $ Mil. Share $ Mil. Share $ Mil. Share
EU
Italy 928 46,4% 1.659 33,5% 1.876 29,9%
Spain 15 0,8% 194 3,9% 603 9,6%
France 194 9,7% 435 8,8% 448 7,1%
Germany 108 5,4% 272 5,5% 278 4,4%
Portugal 67 3,4% 174 3,5% 245 3,9%
United
Kingdom 63 3,2% 201 4,1% 181 2,9%
Belgium 31 1,6% 71 1,4% 58 0,9%
Netherlands 16 0,8% 52 1,1% 54 0,9%
Total EU 1.484 74,2% 3.284 66,3% 3.979 63,5% 40%*
Non-
EU
USA 263 13,1% 760 15,4% 926 14,8% 1.3%*
Japan 60 3% 116 2,4% 236 3,8% 0%
Brazil 17 0,9% 152 3,1% 224 3,6% 10%
China 0 0% 41 0,8% 145 2,3% 10%
Canada 37 1,8% 107 2,2% 133 2,1% 0%
Russia 3 0,2% 44 0,9% 40 0,6% 5%
Switzerland 30 1,5% 78 1,6% 79 1,3% 0%
Australia 25 1,2% 55 1,1% 47 0,7% 0%
S. Korea 4,5 0,2% 45 0,9% 48 0,8% 5%
Total Non-
EU 515,7 25,80% 1.667,20 33,70% 2.286 36,50%
Source: UN Comtrade Dataset & World Integrated Trade Solution (WITS).
Notes: * Converted to tariff ad-valorem equivalents, using 2015 imports.
After thousands of years of pure dominance, the world is experiencing a remarkable
growing demand for VOO, which is spreading beyond the Mediterranean region to non-
traditional markets. In particular, countries such as the USA, Brazil, Japan, Canada, China
have extensively increased their VOO consumption. Since the beginning of the
millennium, while the total consumption of olive oil has increased up to 1.8-fold, the

E. Ronen
13
share of consumption of olive oil by non-EU countries has soared 4-fold to 45% of the
world’s consumption (IOC, 2016). The highest growth rate in consumption is recorded
in Japan (1400%), and the biggest in terms of volume is the USA, which jumped from 88
to 308 thousand metric tons.
Obviously, the increase in demand for VOO is accompanied by a rise in imports to
supply this consumption. The global imports of VOO, as reported in Table 2 account for
USD 6.3 billion (2015). Excluding intra-EU trade, the rest of the worlds’ imports of VOO
accounts for 36.5% of the total imports. That represents a dramatic surge of over 500%
since the beginning of the millennium. In 2015, the largest EU importers of VOO were
Italy, Spain, France, and Germany, while outside the EU, the biggest importers are the
USA with 14% of the global imports, followed by Japan, Brazil, China and Canada.
Interestingly, the annual growth of VOO imports, in the non-EU countries, since the year
2000, is over 10%, with Brazil demonstrating the fastest annual growth rate of 22.9%,
followed by Japan with 11.9%.
Figure 1. World imports of Virgin Olive Oil, By Origin, (Excl. Intra-EU Trade)
An additional trend is the gradual shift of VOO imports from traditional sources in
the EU to ‘New World’ producing countries. Among these countries, the most noteworthy
sources of VOO are Tunisia, Morocco, Syria, Turkey, and Algeria. Yet, growing demand
is emerging from developed countries such as Argentina, Chile, USA, Australia, and
others. By 2015, non-EU countries are responsible for approximately 40% of the world
OO production. Moreover, the evidence presented in Figure 1 shows that between the
years 2002 and 2014, excluding intra-EU trade, imports arriving from Non-EU exporters
more than tripled their share in the global imports of VOO. Figure 1 displays the growth
in the share of imports from non-EU sources in particular to countries such as the USA,
Brazil, Japan, Canada and China. With the rise in the presence of non-EU producers on
the international arena, these countries are beginning to exercise a more significant
influence on designing trade policies.

The Trade-Enhancing Effect of …
14
2.2 Policy Measures Affecting the Trade of Virgin Olive Oil
With the exception of the EU, the global applied tariff rates on VOO are relatively
low and range between 0 and 10%. Tariff rates of zero are applied on VOO imports
entering Japan, Australia, Canada, Switzerland and others. While the USA imposes ad-
valorem tariffs equivalent of 1.3%, the EU charge an equivalent tariff of approximately
40% (2015). Yet, only a negligible share of EU’s imports is subject to full MFN rates, as
the majority benefit from preferential trade agreements. Statistical evidence validates that
while the average MFN tariff rates on VOO have declined from 9% in 2002 to 5.5% in
2015, the use of TBT and SPS measures affecting the VOO appear to be on the rise
(Figure 2).
Source: Authors calculations based on data of the World Bank and WTO I-TIP.
Figure 2. Evolution of NTMs & MFN Applied Tariffs on Virgin Olive Oil
The regulatory landscape is filled with wide range of NTMs, which partly serve to
protect domestic producers against foreign competition, but undeniably also act to
improve the quality of VOO products entering local markets. Such measures are designed
to protect human health, increase consumers’ welfare, afford adequate information and
increase risk assurance for consumers, as well as provide protection from counterfeit.
Numerous examples of illegal products confiscated, after failing to follow national
standards, were reported in recent years. To combat such endeavours, countries apply a
broad range of regulations and procedures, among which labelling requirements,
standards and marketing order, as well as food safety regulation. While often these policy
measures are grouped as SPS or TBT measures, the proposed research allows to
differentiate between subgroups of NTMs in order to examine the effective impact of
each individual measure on VOO imports.
The global minimum requirements for olive oil are covered by the Codex
Alimentarius Standard for Olive Oils and Olive Pomace Oils. Also known as the “Food

E. Ronen
15
Code”, it aims to develop science-based harmonized international food standards, to
protect consumer health and promote fair practices, in the least trade-distorting manner.
The Food Code covers composition and quality factors for various types of olive oil,
including food additives, contaminants, labelling requirements, physical features and
methods of analysis and sampling. Evidence show that not only that food safety standards
imposed by developed countries are stringent compared to the Food Code, but also, these
standards have become increasingly stricter over time.
For example, Maximum Residue Limits (MRLs) were introduced to control harmful
damage caused due to the widespread dissemination of pesticides for improving
agricultural productivity. In general, MRLs are determined by national regulatory
agencies, whether on their own or based on the Food Code. The European Regulation
from 1991 and its amendments from 2015 classifies eight quality categories of olive oil
to define which may be granted access to the EU market. Similarly, Australia and Japan
have MRLs which are more stringent than the Codex MRLs, whereas other countries set
their standards near or follow the exact Codex wordings.
Another example of a NTMs may be the labelling requirements, which were originally
intended to provide better traceability information, but also inform more knowledgeable
consumers regarding their preferences. Along with labelling requirements, there is a
growing importance of organic and fair trade schemes, which resulted in the demand for
such products to follow organic certification requirements. For instance, for the olive oil
to be marketed as organic-certified in the EU, it must contain the EUs organic logo, after
complying with the EU regulation for organic farming and marketing.
3. Literature Review
An extensive literature on the effects of NTMs on import flows has evolved in the last
two decades, primarily due to the proliferation in the use of trade-related regulatory
measures. Supplementary conceivable explanations involve the global reduction of
tariffs; the growing demand for transparency and reporting requirements on the
application of NTMs by WTO; and the harmonization of regulations, as a result of PTAs
signed and implemented by various countries. Lastly, the valuable advancement in
estimation methodologies allow the quantification of trade impact of NTMs and provide
a strong base for comparison across countries or within sectors.
The economic literature, however, provides an indecisive response regarding how and
to what extent these policy regulations, affect trade in the myriad of agriculture or food
products. Particularly, it is often uncertain whether these regulatory measures necessarily
hamper trade, mainly through the associated compliance costs of stringent regulations.
Alternatively, these measures may raise consumers’ confidence in the safety associated
with the product, while creating a positive feedback which. This may result in the
expansion of imports of a particular product which has initially been subject to a stringent
measure.
The ambiguous trade effect of NTMs evidently differs across sectors, and varies
among countries, depending on the economic development level. Disdier et al. (2008),
examine the impact of SPS and TBT on 30 disaggregated Agri-food products imported
to OECD members and find a significantly adverse effect on 10 industries. Yet, SPS and
TBTs can have no impact (as found in 12 industries) or even a positive effect, as these
measures carry information and provide confidence in the imported products. While
OECD exporters are not significantly affected by SPS and TBTs in their exports to other
OECD countries, developing and least developed countries’ exports are negatively and
significantly affected. Furthermore, EU imports seem to be more negatively influenced
by tariffs and SPS and TBTs than imports of other OECD countries.
The Trade-Enhancing Effect of …
16
In the large share of surveyed literature, a trade-reducing impact of food safety
standards on Agri-food products is observed. In particular, the heterogeneity of standards
is associated with an adverse effect on trade. Winchester et al. (2012) validate the
significant trade-restrictive effect of stringent MRLs for plant products in importing
countries compared to exporting countries. Further, Chen et al. (2006) determine that in
developing countries, the testing procedures and lengthy inspection times significantly
reduce firms’ propensity to export to developed countries, predominantly in agricultural
firms. Moreover, the compliance costs associated with SPS measures tend to create a
comparative disadvantage for the small and medium-sized firms. Fontagné et al. (2013)
show that SPS compliance costs create market entry prohibition and increase the
probability to exit the restricted market by 2%.
By contrast, several scholars acknowledge the trade-enhancing effects of NTMs due
to their beneficial impact on public health, well-being, animal welfare, food safety and
sustainable environment. Josling et al.(2004) find that in nations where consumer
awareness to such features is valued, demand is stimulated for products under such
policies. Another key channel through which NTMs may positively affect trade flows is
the correction of market imperfections (Thilmany and Barrett, 1997). Moreover, as
countries differ in their capacity to meet with foreign standards, some countries may
enjoy a competitive advantage. Henson and Jaffee, (2008) show that exporters facing
stricter food safety standards incur compliance costs which may be offset by benefits
from the enhancement of food management capacity. Supplementing this, Swinnen and
Vandemoortele (2011) acknowledge the trade-augmenting role of food standards, and
Chevassus-Lozza et al. (2008), report positive trade effects of sanitary measures, despite
some negative or insignificant impacts of phytosanitary and quality measures.
Xiong and Beghin (2014) highlight the gradually challenged ‘standards-as-barriers’
perception, by the ‘two faces of standards’ approach. Consequently, even if there is a cost
involved in complying with standards, the trade-enhancing effects may be larger. The
effects of MRLs regulations imposed by high-income OECD countries jointly enhance
the import demand and hinder foreign exporters’ supply. Although the net effect is
positive for most countries, it is smaller for developing countries. This implies that
exporters from developing countries face greater difficulty than their competitors from
developed countries when food safety standards exist in export markets.
In his review of the economic literature and surveys on the trade effects of
international and national standards as well as regulations of various products, across
countries, Swann (2010) provides valuable insights. First, compared to national standards
and regulations, which tend to negatively impact imports, in most of the economic
literature, international standards and regulations are found to have a positive effect on
imports. With respect to data based on surveys, the effects of national standards on
imports can be either positive or negative. Nevertheless, the effects of national regulations
on domestic imports are mostly found to be negative.
Michalek et al. (2005) analyse the effects of three EU approaches for dealing with
TBTs for the new member states (CEEC) and the Mediterranean countries. Their results
suggest that the Harmonization Approach and the New Approach are likely to increase
trade, while the Mutual Recognition approach (MR) tends to reduce trade. The effect of
MR may seem surprising, since supportive studies find it the most efficient method to
overcome TBTs. Their interpretation highlights the reverse direction of causation
connection, i.e. that MR may be introduced in sectors when trade flows are relatively low
but there are few TBTs, meaning little to be gained from a policy other than MR.
As increased cooperation among countries reduces regulation heterogeneity,
importers may gain market share at the expense of domestic producers. Liu and Yue
(2012) argue that the EU’s adoption of the Hazard Analysis Critical Control Point

E. Ronen
17
(HACCP) standard was a catalyst for orange juice imports. It resulted in increased
imports, reduced sales of domestic producers, and improved consumer welfare. By
contrast, Anders and Caswell (2009) find a negative effect of a HACCP food safety
standard on the overall seafood imports. However, a differentiation by exporting country
shows negative effects for developing countries, but positive effects for developed
countries.
Drogué and Federica (2012) finds that reducing the heterogeneity between MRLs has
a trade-enhancing impact on apples and pears, however, the impact differs depending on
the exporter. Nevertheless, regulatory harmonization where previously a country did not
have a standard may imply new or higher costs for existing producers and an increase in
the stringency. This was the case with the harmonization of MRLs for aflatoxin in the EU
in 2002, which meant that aflatoxin standards became more stringent in most countries
(Xiong and Beghin 2012; Otsuki et al. 2001). According to the latter, the new EU
regulation on aflatoxins will reduce trade flows by 63% compared to when the Food Code
standards are followed.
In recent years, several attempts have been undertaken to study the effects of various
regulatory policies on consumers’ willingness to pay (WTP) for OO across and within
countries. Labelling and Geographical Origin Certification seem to affect consumers'
purchasing decisions. Menapace et al. (2011) underline that EU consumers have a greater
WTP for Geographical Indication (GI) than non-GI labelled products. Dekhili et al.
(2011) assert that ‘official cues’ are more important for consumers of non-producing
countries, whereas consumers from producing countries choose OO based on origin and
‘sensory cues’ (e.g., colour and appearance). The Origin information and traceability as
reported on the label is important as consumers are increasingly concerned about food
safety (Krystallis and Ness, 2005). Higher value is also placed on quality assurances, such
as MRLs, and ‘Protected Designation of Origin’ labels, which improve the signalling of
credence to consumers (Combris et al.,2010).
Sandalidou et al. (2002) find that the ‘Organic certification’ of OO in Greece is
positively perceived by consumers, irrespective of the continued unsatisfactory level of
information. Gil and Sofer (2006) observed that information about the conventional
product (“reference price”) increased the perceived value of the Organic OO for Spanish
consumers. Cicia et al. (2005) valued at one euro per bottle the attribute of Italian product
origin (COOL) ascribed by Italian consumers. Dekhili and d’Hauteville (2009) highlight
consumers’ preference for traditionally known brands and private labels. By contrast,
Kavallari et al. (2011) find that bulk olive oil is more likely to enter the German and the
UK markets compared to similar packaged and branded products.
As seen in the review, the extensive and divergent studies which were reviewed
reinforce the assertion that some regulatory measures are not necessarily protectionist,
and at times actually boost imports. Yet, empirical validation regarding the impact of a
wide range of regulatory measures on a particular agriculture sector is rare. The current
research attempts to fill this gap by empirically studying the influence of various
subgroups of SPS and food related TBT measures on the virgin olive oil sector. In
particular, it encompasses a large dataset of national regulations in order to underpin
further their trade-enhancing impact on imports of VOO during the years 2002-2014.
4. Econometric Methodology and Data
In the empirical econometric analysis, the determinants of imports of VOO are
examined with respect to various explanatory variables. Among these variables, some are
directly related to the olive oil sector, such as production, tariffs and NTMs which fall
under the broad umbrella of the TBT and SPS practices, while others variables are

The Trade-Enhancing Effect of …
18
standard in gravity modelling. The size of the sample which was developed for this
purpose is comprised of approximately 2,600 observations, encompassing imports panel
data of 160 importing countries, during the years 2002 to 2014.
The econometric methodology applied in this analysis is the following:
𝑙𝑛 IMPORTS𝑖𝑗𝑡 = 𝛼𝑖,𝑛1 𝑙𝑛GDP𝑖𝑡
+ 𝛼𝑖,𝑛2 𝑙𝑛PROD𝑗𝑡
+ 𝛼𝑖,𝑛3 𝑙𝑛GDPpc𝑖𝑡
+ 𝛼𝑖,𝑛4 𝑙𝑛TARIFF𝑖𝑡
+ 𝛼𝑖,𝑛5 𝑙𝑛DIST𝑖𝑗𝑡
+ 𝛼𝑖,𝑛6 𝑙𝑛POP𝑖𝑗𝑡
+ 𝛼𝑖,𝑛7 Comlang𝑖𝑗𝑡
+ 𝛼𝑖,𝑛8 Contig𝑖𝑗𝑡
+ 𝛼𝑖,𝑛9 Comcur𝑖𝑗𝑡
+ 𝛼𝑖,𝑛10RTA + 𝛼𝑖,𝑛
11NTM𝑥𝑖𝑗𝑡 + ε 𝑖, 𝑛
For the purpose of this study, a log-linear transformation of the ordinary least squares
(OLS) model has been employed. The dependent variable in all the specifications is ln
IMPORTS ijt, which is the natural logarithm of the import values of VOO to country i
from country j in a particular year t. From an empirical perspective, both the presence of
zero flows and heteroskedasticity in the idiosyncratic error term are matters to take into
consideration due to their possible effect on gravity-type estimations (Silva and Tenreyro,
2006). The solution to that has been to add an additional estimation using a Tobit model
to correct for the presence of zero trade flows bias (Martin and Pham, 2008). Moreover,
the paper assumes an additive error in specification and estimates the model using the
Poisson pseudo-maximum likelihood estimator (PPML).
The econometric analysis is comprised of a vector of variables, which may account
for control variables explaining the imports of VOO. The first control variable in the
analysis is denoted as lnGDPi,t , which is the natural logarithm transformation of the
Gross Domestic Product (GDP) of the importing country i in a particular year t. As the
theory predicts, the correlation between imports of VOO and the variable is expected to
be positive and significant, in line with the view that larger markets foster higher volumes
of trade. The second major control variable is Production (denotes lnPRODj,ti), which
represents the output of VOO, allowing to capture the exporting country’s supply
capacity. A positive coefficient for production of is expected, in line with the view that
larger producers export higher volumes of VOO. The variable lnGDPpci,t , represents the
GDP per capita in the importing country I, and is likely to be positive since increasing
income lead to higher demand for VOO.
The fourth control variable is denoted as ln(1+TARIFFi,n), which is a vector of the
Most Favoured Nations (MFN) applied tariffs on VOO. Specifically, it provides the tariff
rates on the 6-digit HS classification 150910. Data is provided for each of the importing
country, depending on the source of import (i.e. a particular importing country may have
dissimilar applied tariff rates to two exporting countries, depending on benefits granted
by different trade agreements). As the theory predicts, the correlation between imports
and tariffs is expected to be negative and significant, since the higher a tariff rate (i.e.
higher costs on imports), the smaller the demand for VOO.
Several additional gravity variables were extracted from the CEPII database (Mayer
and Zignano, 2011). ‘Distance’ is measured in km between the sample countries
economic centres. Common language, currency and contiguous are dummy variables that
take the value 1 when two countries share the same language, currency or are contiguous,
correspondingly, and zero otherwise. In all cases, proximity among countries contributes
to decreasing transaction costs and enhances imports. An additional dummy variable
RTA takes the value 1 if a regional trade agreement exists between the importing and the
exporting countries, to reflect the positive influence on imports of the recent proliferation
of trade agreements in the last three decades. Therefore, except for distance, the
coefficient signs are expected to be positive and significant.

E. Ronen
19
As mentioned, the most significant set of variables is the NTMs, which were obtained
following a careful analysis of hundreds of relevant regulations, extracted from I-TIP.
The entire database provides information on over 25,000 measures, which were screened
in order to identify only the particular regulations containing SPS and food related TBTs
that affect trade in VOO. The regulations were allocated to four subgroups which fall
under the scope of the TBT measures, and three subgroups which fall under SPS
measures. Each dummy variable takes the value 1 if a particular policy measure imposed
by an importing country i affects the exports of VOO from country j. It is important to
note that these dummy variables indicate the mere existence of particular regulatory
measures, over time, regardless the stringency level or (dis)similarity of these regulations
among countries.
5. Estimation Results
5.1 Regression Results – Virgin Olive Oil
The results of the regression analysis for the entire sample of countries are presented
in Table 3. The first two columns report OLS estimates in log form; however, the second
column adds a list of dummy variables, which represent the impact of NTMs on the
imports. The third column presents Tobit estimates, and the fourth column reports PPML
estimates. Lastly, year fixed effects were added to all the specifications, to control for
considerable seasonal fluctuations and climate sensitivity on olive cultivation, which may
potentially bias the results.
While the estimated coefficients from the OLS and the Tobit models are relatively
similar, most coefficients obtained from the PPML model differ from those obtained with
the other model. The substantial advantage of the PPML model is that it allows us to deal
with sample selection bias that may result from excluding zero observations. Although
selection bias rarely affects the sign of the variable, it often influences the magnitude,
statistical significance and economic interpretation of the marginal effects (Haq et al.,
2013). In the rest of this subsection, unless specified otherwise, the results refer to the
estimates from the PPML model. Notably, once the NTMs are introduced, the goodness-
of-fit as measured by R-squared increase by a supplementary of 18% and 7.7% in the
OLS and PPML specifications, respectively.
The estimation coefficients of ‘TARIFF’ are found to be negative and economically
significant, however, the magnitude varies according to the specifications. While a
relatively small impact of 1.6% is found in the basic OLS, adding the impact of NTMs
increases its negative elasticity to 6.4% to 6.8% (OLS and the Tobit specification,
respectively). Parameter estimates of GDP are statistically significant and have the
expected positive sign. The results concerning VOO supply as captured by ‘Prod’
underline the substantial and positive contribution of olive oil production at the exporting
country on imports of VOO. The estimates are statistically significant and range between
96% and 97% in the first two specifications, and 8% at the PPML model.
With respect to the gravity variables, the estimates are in line with previous studies
(Disdier, et al., 2008 and Grant and Boys, 2012). The role of geographical distance is
inversely related to imports of VOO; however, significantly larger when using OLS and
Tobit estimators. The estimated elasticity is approx. between 0.77-0.79, whereas the
PPML estimate is much lower (0.067). As seen in most of the literature, socio-economic
variables such as GDP per capita are main determinants of consumer’s willingness to pay
a premium for healthier olive oil (Gil and Soler, 2006). The difference in the size of the
population between the importing country and the exporting country of VOO is found to
influence positively and statistically significant. Lastly, the variables ‘Comlang’ and

The Trade-Enhancing Effect of …
20
‘Contig’ are statistically significant, at the 1% level, and positively impact imports of
VOO as expected. Surprisingly, ‘Comcur’ is likely to negatively affect imports of VOO,
and ‘RTA’ does not meaningfully affect such imports.
Table 3. Regression Results
OLS (No
NTMs) OLS Tobit PPML
ln GDP 0.179*** 0.177*** 0.167*** 0.017***
(3.95) (3.99) (3.93) (4.12)
ln PROD 0.789*** 0.969*** 0.957*** 0.080***
(36.75) (49.83) (51.15) (47.86)
ln GDPpc 0.683*** 0.726*** 0.744*** 0.055***
(11.91) (11.13) (11.88) (9.16)
ln TARIFF -0.016*** -0.068*** -0.064*** -0.006***
(-6.08) (-10.31) (-9.98) (-8.15)
ln DIST -0.481*** -0.792*** -0.768*** -0.067***
(-6.88) (-14.82) (-14.97) (-13.83)
ln POP 0.506*** 0.701*** 0.700*** 0.054***
(12.27) (17.80) (18.53) (14.02)
Comlang 1.696*** 1.147*** 1.149*** 0.097***
(16.11) (10.27) (10.70) (8.54)
Contig 1.076*** 1.511*** 1.525*** 0.105***
(4.12) (8.20) (8.69) (7.89)
Comcur -0.260* -0.253* -0.233* -0.018
(-2.07) (-2.15) (-2.06) (-1.67)
RTA -0.136 0.051 0.02 0.007
(-1.09) (0.40) (0.16) (0.59)
SPS MRLs 0.390** 0.374** 0.040***
(3.08) (3.09) (3.69)
SPS Human Health 0.293** 0.270* 0.023*
(2.61) (2.51) (2.55)
SPS Food Additives -0.172 -0.16 -0.009
(-1.65) (-1.61) (-1.01)
TBT Food Standards 0.305*** 0.313*** 0.022**
(3.41) (3.65) (3.02)
TBT Conformity Ass. -0.21 -0.276 -0.01
(-0.43) (-0.59) (-0.24)
TBT Consumer Info. 0.15 0.148 0.021
(0.61) (0.63) (1.01)
TBT Label 0.005 0.007 -0.003
(0.06) (0.09) (-0.45)
R2 0.453 0.633 0.639
N 2.601 2.601 2.601 2.601
Notes: t statistics in parentheses. p-value (* p<0.05, ** p<0.01, *** p<0.001)
As the hypothesis suggests, the estimated coefficients of the Sanitary and
Phytosanitary measures, if statistically significant, are found to be positive. The most
predominant sub-category of NTM is the MRLs requirements with estimated coefficients
which are statistically significant and positive. Generally, ‘MRLs’ enhance the import

E. Ronen
21
demand by reducing the potential risks caused by pests, and ensuring higher food safety,
but it also expected to reduce export supply by imposing additional controlling costs. The
net effect of MRLs as expected is stronger for the former. The effect of ‘Human health’
is found to be positive and statistically significant at 10% level of statistical significance,
however, it affects VOO imports to a lesser extent compared to ‘MRLs’. Analysing the
trade effects of TBTs reveals that ‘food standards' is the only sub-category that has a
statistically significance and positive effect in all specifications. Interestingly, TBT
measures that focus on labelling requirements were found insignificant in all the models.
Finally, it should be expressed that the estimations are to be interpreted with some
caution, given that they reflect the underlying assumptions of the models, databases and
the particular policy specifications which have been modelled, as detailed in the paper.
5.2 Regressions Results – Virgin Olive Oil, EU vs. Non-EU
This part of the paper disentangles the impact of various NTMs on imports of VOO,
according to the major import sources. The two clusters are the EU exporting countries
of VOO to Non-EU markets and other VOO manufacturers who export to EU markets.
This exercise aims to examine whether “a retaliation effect” exist, that is to say, non-EU
exporters may face tougher import regulation compared to the regulatory requirements
imposed on EU exporters due to the growing presence of the former in VOO arena. Notice
that the sample used for EU exporters excludes internal EU trade flows, to avoid the
positive effect associated with regulatory homogeneity in the EU single market.
The results of the comparison are presented in Table 4. The estimations which proxy
the supply side of the equation, are relatively similar in terms of magnitude and direction
to the EU exporters, which is not surprising given that most VOO exporters are
Europeans. The estimated coefficients of GDP were significantly trade-enhancing for
non-EU exporters, yet meaningless for EU exporters. Nevertheless, the level of income
per capita of the importing country is positive and likely to affect more significantly the
EU exporters, compared to non-EU exporters. Concerning the geographical and
supplementary gravity variables, the impact is fairly similar to the previous findings.
The results of the analysis, seem to reject the “retaliation effect” proposition, since
both groups of exporters face a relatively similar adverse effect of tariff barriers. The
coefficients found in the OLS model and the Tobit specification imply that a 1% tariff
reduction is associated with 6-7% higher VOO imports. In terms of economic
magnitudes, it means that an increase in tariffs from 1% to their mean level of 6.5% (a
550% increase) decreases VOO imports by 37%, which is a considerable impact.
More importantly, the coefficients of NTMs, despite the asymmetrically impact on
exporters according their source, are found to effect VOO imports positively. In
particular, EU exporters enjoy a significantly positive effect of MRLs requirements;
mainly due to their capacity to meet stricter requirements in their neighbour EU markets.
Similarly, SPS measures dealing with food additives are found to affect EU exporters
positively, yet when imposed by the European Commission, they adversely affect non-
EU exporters. TBT measures in the form of food standards are associated with 3.1%
higher imports of VOO, yet insignificantly affect imports from EU producing countries.

The Trade-Enhancing Effect of …
22
Table 4. Regression Results, EU vs. Non-EU Exporters
EU Exporters Non-EU Exporters
OLS Tobit PPML OLS Tobit PPML
ln GDP 0.027
(0.26)
0.058
(0.62)
0.008
(0.92)
0.337***
(4.64)
0.314***
(4.52)
0.033***
(4.73)
ln PROD 0.953***
(26.98)
0.927*** 0.077*** 0.683*** 0.679*** 0.065***
(27.77) (23.19) (13.58) (14.09) (13.94)
ln GDPpc 1.148*** 1.119*** 0.080*** 0.233* 0.261* 0.02
(9.57) (10.00) (7.17) (2.11) (2.46) (1.89)
ln TARIFF -0.067*** -0.061*** -0.006*** -0.067*** -0.064*** -0.007***
(-8.02) (-7.68) (-6.05) (-5.45) (-5.44) (-4.58)
ln DIST -0.621*** -0.592*** -0.046*** -0.495*** -0.463*** -0.050***
(-5.40) (-5.51) (-4.64) (-4.78) (-4.65) (-4.89)
ln POP 0.837*** 0.794*** 0.057*** 0.423*** 0.436*** 0.039***
(8.84) (8.98) (6.16) (7.03) (7.57) (6.93)
Comlang 1.555*** 1.494*** 0.118*** 1.169*** 1.176*** 0.112***
(7.37) (7.61) (5.93) (6.81) (7.13) (6.65)
Contig 1.076* 1.061* 0.086** 1.480*** 1.527*** 0.117**
(2.08) (2.21) (2.71) (3.74) (4.05) (2.90)
Comcur -0.1 -0.099 -0.007 -0.394 -0.331 -0.036
(-0.47) (-0.50) (-0.38) (-1.83) (-1.60) (-1.62)
RTA 0.373 0.374 0.032 0.22 0.16 0.023
(1.73) (1.87) (1.53) (1.00) (0.77) (1.19)
SPS MRLs 0.688*** 0.653*** 0.048*** 0.336 0.335 0.03
(3.51) (3.58) (3.41) (1.71) (1.79) (1.80)
SPS Food
Additives
0.348 0.338 0.029 -0.525** -0.483* -0.042*
-1.88 -1.95 -1.84 (-2.68) (-2.58) (-2.39)
SPS Human
Health
0.292 0.287 0.023 0.592** 0.510* 0.054*
(1.55) (1.63) (1.49) (2.66) (2.39) (2.44)
TBT Food
Standards
0.005 0.028 -0.003 0.420* 0.433** 0.035*
(0.03) (0.20) (-0.24) (2.57) (2.78) (2.48)
TBT
Consumer
Info.
-0.153 -0.065 -0.013 0.526 0.419 0.059*
(-0.45) (-0.21) (-0.40) (1.34) (1.12) (1.97)
TBT
Conformity
Ass.
-0.505 -0.646 -0.028 0.035 0.02 0.013
(-0.81) (-1.11) (-0.49) (0.04) (0.03) (0.23)
TBT Label -0.054 -0.012 -0.012 0.02 0.05 -0.005
(-0.36) (-0.09) (-0.97) -0.14 -0.29 (-0.33)
R2 0.722 0.694 0.403 0.417
N 669 669 669 976 976 976
Notes: t statistics in parentheses. p-value (* p<0.05, ** p<0.01, *** p<0.001)

E. Ronen
23
6. Conclusions
The paper aims to examine, whether, and to what extent, NTMs can serve as trade
boosters rather than create unnecessary trade barriers. To perform such analysis, the paper
provides an empirical framework which incorporates all bilateral imports of virgin olive
oil (VOO) during the period of 2002-2014. It examines a spectrum of possible
determinants, which can explain the trade flows of VOO, while further investigating
beyond the realm of the traditional trade policies. Predominantly, it focuses on the actual
impact of a wide range of regulatory measures on the imports flow. This dataset of NTMs
was extracted following a detailed screening process of all potential regulations affecting
VOO. This provides an opportunity to identify which type of regulatory measure affects
the level of bilateral trade the most. Moreover, it allows to differentiate which regulatory
instruments could be associated with trade-enhancement, and which policy measures
impede trade.
At the outset, the analysis highlights the restrictive role of tariffs on VOO imports.
Further, it validates the positive impact of most of the gravity explanatory variables. As
The results of this study validate the hypothesis of this paper, that while serving legitimate
public policy objectives, the majority of NTMs actually do not necessarily impose
restrictiveness on imports. The results highlight the statistically and economically
significant support for the demand-enhancing effect of regulatory measures, and in
particular of MRL requirements. Likewise, a significant positive contribution is
associated with human health regulations and food standards. Furthermore, a
differentiation by source of VOO exporters, uncovers the asymmetrical yet, positive
impact of NTMs on VOO imports. EU countries are affected mainly by MRL regulations,
while “New World” producing countries are positively affected by human health
requirements and adversely affected by the EU's food additives regulations.
These findings have two policy implications. First, despite the extensive
heterogeneity among countries regarding the implementation of various regulatory
measures, in fact, the mere existence of regulations does not necessarily impedes
international trade in their cumulative effects. Second, the implementation of measures
related to food safety, human health, information and transparency, may, in turn, actually
expand the magnitude of trade amid countries.
Acknowledgment
The author wishes to express his sincere appreciation to Jan Jakub Michałek, as well
as to Jan Hagemejer, both of the Faculty of Economic Sciences, University of Warsaw,
for their valuable feedbacks, encouragement and effective guidance. A special thanks
goes to Mahdi Ghodsi of The Vienna Institute for International Economic Studies (wiiw),
for his tremendous assistance which allowed to kick off this research paper.
References
Anders S. M., & Caswell J. A. (2009). Standards-As-Barriers versus Standards-As-
Catalysts: Assessing the Impact of HACCP Implementation on U.S. Seafood Imports.
American Journal of Agricultural Economics, 91(2): 310-321.
Chen, M.X., T. Otsuki, & J.S. Wilson (2006). Do Standards Matter for Export Success?.
Policy Research Working Papers, No. 3809, World Bank, Washington, DC.
Chevassus-Lozza E., Latouche K., Majkovic D., & Unguru M. (2008). The Importance
of EU- 15 Borders for CEECs Agri-Food Exports: The Role of Tariffs and Non-Tariff
Measures in the Pre-Accession Period. Food Policy. 33(6): 595-606.

The Trade-Enhancing Effect of …
24
Cicia G., Del Giudice T., & Scarpa R. (2005). Welfare Loss due to Lack of Traceability
in Extra virgin Olive Oil: a Case Study. Cahiers Options Mediterranennes, 64: 19-32.
Combris P., Seabra P.A., Fragata A., & Giraud-Heraud E. (2010). Does Taste Beat Food
Safety? Evidence from the ”Pera Rocha” Case in Portugal. Journal of Food Products
Marketing, 16: 60-78.
Dekhili S., & d’Hauteville F. (2009). Effect of the Region of Origin on the Perceived
Quality of Olive Oil: An Experimental Approach Using a Control Group. Food Qual
Preference, 20(7): 525-532.
Dekhili S., Sirieix L., & Cohen E. (2011). How Consumers Choose Olive Oil: The
Importance of Origin Cues. Food Quality and Preference, 22(8): 757-762.
Del Giudice T., Cavallo C., Caracciolo F., & Cicia G. (2015). What attributes of extra
virgin olive oil are really important for consumers: a meta-analysis of consumers
stated preferences. Agricultural and Food Economics, 3(20): 1-15.
Disdier A.C., Fontagné L., & Mimouni M. (2008). The Impact of Regulations on
Agricultural Trade: Evidence from the SPS and TBT Agreements. American Journal
of Agricultural Economics, 90(2): 336-350.
Disdier A.C., & Head K. (2008). The Puzzling Persistence of the Distance Effect on
Bilateral Trade. The Review of Economics and Statistics 90(1): 37-48.
Drogué, S., &DeMaria, F. (2012). Pesticide residues and trade, the apple of discord? Food
Policy, 37(6): 641-649.
FAO (2017. Food and Agriculture Organization FAOSTAT online statistical service.
Rome: FAO- http://faostat.fao.org/
Fontagné L., Orefice G., Piermartini R., & Rocha N. (2013). Product Standards and
Margins of Trade: Firm-level Evidence. CEPII Working Paper, Paris: CEPII.
Grbler, J., Ghodsi, M., & Stehrer, R. (2016). Assessing the Impact of Non-Tariff
Measures on Imports.
Gil J.M., Soler, F. (2006). Knowledge and Willingness to Pay for Organic Food in Spain:
Evidence from Experimental Auctions. Food Economics - Acta Agriculturae
Scandinavica, Section C, 3(3- 4). 109-124.
Gourdon J., & Nicita A. (2012): NTMs: Interpreting the New Data: Non-Tariff Measures
- A Fresh Look at Trade Policys New Frontier. edited by Cadot et. al. CEPR and the
World Bank.
Grant J. H., & Boys K. A. (2012). Agricultural Trade and the GATT/WTO: Does
Membership Make a Difference?. American Journal of Agricultural Economics,
94(1): 1-24.
Guimaraes M. H. (2012). Non-Tariff Measures in the European Union: Evidence from
the Agri- Food Sector. Agricultural Economics Review, 13.
Haq Z.U., Meilke, K., & Cranfield, J. (2013). Selection Bias in a Gravity Model of Agri-
food Trade. European Review of Agricultural Economics, 40(2): 331-360.
Henson S.J., & Jaffee S. (2008). Understanding Developing Country Strategic Responses
to the Enhancement of Food Safety Standards. The World Economy, 31(4): 548-568.
International Olive Council. (IOC), Data on Production and Consumption from Nov.
2016.
Josling T., Roberts D., & Orden D. (2004). Food Regulation and Trade. Toward a Safe
and Open Global System. Institute for International Economics. Journal of
International Economic Law, 8(3): 793-802.
Kavallari A., Maas S., & Schmitz P. M. (2011). Examining the Determinants of Olive Oil
Demand in Nonproducing Countries: Evidence from Germany and the UK. Journal
of Food Products Marketing, 17: 355-372.
Krystallis A., & Ness M. (2005). Consumer Preferences for Quality Foods from a South
European Perspective: A Conjoint Analysis Implementation on Greek Olive Oil. Int

E. Ronen
25
Food Agribusiness Manage Rev 8(2): 62-91.
Liu, L., Yue, C. (2012). Investigating the Impact of SPS Standards on Trade Using a VES
Model. European Review of Agricultural Economics, 39(3): 511-528.
Martin W., & Pham C.S. (2008). Estimating the Gravity Equation When Zero Trade
Flows are Frequent. MPRA Working Paper 9453, University Library of Munich.
Mayer T., Zignago S. (2011). Notes on CEPIIs distances measures: The GeoDist
database. CEPII Working Paper 2011-25, CEPII.
Menapace L., Colson G., Grebitus C., & Facendola M. (2011). Consumers’ Preferences
for Geographical Origin Labels: Evidence from the Canadian Olive Oil Market.
European Review of Agricultural Economics, 38: 193-212.
Michalek J.J., Hagemejer J., Roshal V., Rothert J., Tovias A., Pugacewicz A., &
Vancauteren M. (2005). Comparative Analysis of Importance of Technical Barriers
to Trade (TBT) for Central and Eastern European Countries and Mediterranean
Partner Countries Exports to the EU. FEMISE Research Paper, 22-03, Warsaw
University, Warsaw.
Otsuki T., Wilson J. S., & Sewadeh M. (2001). What Price Precaution? European
Harmonisation of Aflatoxin Regulations and African Groundnut Exports. European
Review of Agricultural Economics, 28(3): 263-284.
Sandalidou E., Baourakis G., & Siskos Y. (2002). Customers Perspectives on the Quality
of Organic Olive Oil in Greece-A Satisfaction Evaluation Approach. British Food
Journal, 104: 391-406.
Silva J.M.C.S, & Tenreyro S. (2006). The Log of Gravity. The Review of Economics and
Statistics, 88(4): 641-58.
Swann G. P. (2010). International Standards and Trade: A Review of the Empirical
Literature. OECD Trade Policy Papers, No. 97, OECD Publishing.
Swinnen J.F.M., & Vandemoortele T. (2011). Trade and the Political Economy of Food
Standards. Journal of Agricultural Economics, 62(2): 259-280.
Thilmany D., & Barrett C. (1997). Regulatory Barriers in an Integrating World Food
Market. Review of Agricultural Economics, 19: 91-107.
UNCTAD (2013). Non-Tariff Measure to Trade: Economic and Policy Issues for
Developing Countries. (UNCTAD/DITC/TAB/2012/1). New York and Geneva.
United Nations Publications, ISSN 1817-1214.
USITC (2013). Olive Oil: Conditions of Competition between US and Major Foreign
Supplier Industries. Investigation No. 332-537, USITC Publication 4419.
Winchester N., Rau M.L., Goetz C., Larue B., Otsuki T., Shutes K., Wieck C., Burnquist
H.L., Pinto de Souza M.J., & Nunes de Faria R. (2012). The Impact of Regulatory
Heterogeneity on Agri-food Trade. The World Economy, 35(8): 973-93.
World Trade Organization (2012). Trade and Public Policies: A Closer Look at Non-
Tariff Measures in the 21st Century. Geneva: WTO.
World Trade Organization (2013). Tariff Download Facility: http://tariffdata.wto.org/
Xiong B., & Beghin J.C. (2012). Does European Aflatoxin Regulation Hurt Groundnut
Exporters from Africa?. European Review of Agricultural Economics, 39(4): 589-
609.
Xiong B., & Beghin J.C. (2014). Disentangling Demand-Enhancing and Trade-Cost
Effects of Maximum Residue Regulations. Economic Inquiry, 52(3): 1190-1203.

The Trade-Enhancing Effect of …
26
Appendix
Table 5. Variables and Sources
Variable Definition Source
IMPORTS
Bilateral Imports of Virgin Olive Oil
($), HS Classification 150910
The World Integrated Trade Solution
(WITS), The World Bank
TARIFF MFN applied tariffs, of Virgin Olive
Oil, HS classification 150910
The World Integrated Trade
Solution (WITS), The World Bank
NTMs TBT / SPS Measures, By Subgroups,
Dummy Variable
The Integrated Trade Intelligence
Portal (I-TIP) World Trade
Organization
PROD Production VOO, Crops processed
(1,000 tonnes)
Food and Agriculture Organization
(FAOSTAT)
CONS Consumption of Olive Oil International Olive Council (IOC)
GDP Gross Domestic Product, Current
prices (Bil. $) International Monetary Fund (IMF)
GDPpc Gross Domestic Product per capita, in
current prices ($) International Monetary Fund (IMF)
DIST. Distance between capitals (km).
Centre d’Etudes Prospectives et
d’Informations Internationales (CEPII)
POP. Population (mil.)
Comlang Common Language, dummy.
Contig Countries are Contiguous, dummy.
Comcur Common Currency, dummy.
RTA Regional Trade Agreement, dummy.
D_EU Dummy Variable 0=Non EU Member
States. 1=EU Member State
The European Commission
Year FE Fixed effects of years
Exporter FE Fixed effects of exporters
Table 6. Statistical Description
Variables Mean Std. Dev. Min Max Observations
IMPORTS 3,594 33,266 0 1,118,144 12,100
TARIFF 6.54 12.9 0 261 9,006
GDP 104,994 2,595,613 184 16,700,000 11,849
PRODUCTION 166 337.3 0 1,615 1,977
GDPpc 28,291 17,056 223.6 114,665 11,923
CONSUMPTION 251 261.3 0 848 7,722
SPS MRLs 0.1909 0.393 0 1 6,238
SPS Food Additives 0.2373 0.425 0 1 6,238
SPS Human Health 0.6759 0.468 0 1 6,238
TBT Food Standards 0.5763 0.494 0 1 6,238
TBT Consumer Info. 0.0348 0.183 0 1 6,238
TBT Conformity Ass. 0.0053 0.073 0 1 6,238
TBT Label 0.5186 0.45 0 1 6,238