the total economic impact™ of microsoft defender atp
TRANSCRIPT

A Forrester Total Economic Impact™
Study Commissioned By Microsoft
April 2019
The Total Economic Impact™ Of Microsoft Defender ATP
Cost Savings And Business Benefits Enabled By Microsoft Defender ATP

Table Of Contents Executive Summary 1
Key Findings 1
TEI Framework And Methodology 4
The Microsoft Defender ATP Customer Journey 5
Interviewed Organizations 5
Key Challenges 5
Key Results 6
Composite Organization 7
Analysis Of Benefits 8
Benefit 1: SecOps And IT Efficiency Gains 8
Benefit 2: Business End User Productivity Gain 9
Benefit 3: Previous Endpoint Protection And Avoidance Of New Capability Purchases 11
Unquantified Benefits 12
Flexibility 13
Analysis Of Costs 14
Cost 1: Cost To License Microsoft Defender ATP 14
Financial Summary 15
Microsoft Defender ATP: Overview 16
Appendix A: Total Economic Impact 17
Appendix C: Endnotes 18
Project Director:
Henry Huang
ABOUT FORRESTER CONSULTING
Forrester Consulting provides independent and objective research-based
consulting to help leaders succeed in their organizations. Ranging in scope from a
short strategy session to custom projects, Forrester’s Consulting services connect
you directly with research analysts who apply expert insight to your specific
business challenges. For more information, visit forrester.com/consulting.
© 2019, Forrester Research, Inc. All rights reserved. Unauthorized reproduction
is strictly prohibited. Information is based on best available resources.
Opinions reflect judgment at the time and are subject to change. Forrester®,
Technographics®, Forrester Wave, RoleView, TechRadar, and Total Economic
Impact are trademarks of Forrester Research, Inc. All other trademarks are the
property of their respective companies. For additional information, go to
forrester.com.

1 | The Total Economic Impact™ Of Microsoft Defender ATP
Executive Summary
Microsoft Defender Advanced Threat Protection (ATP) is an endpoint
security solution that helps organizations prevent, detect, and remediate
advanced threats utilizing cloud-powered analytics. Microsoft
commissioned Forrester Consulting to conduct a Total Economic Impact™
(TEI) study and examine the potential ROI enterprises may realize by
deploying Microsoft Defender ATP. The purpose of this study is to provide
readers with a framework to evaluate the potential financial impact of the
solution at their organizations.
Forrester’s prior research indicates that employee endpoints continue to
be one of the most targeted enterprise assets by attackers.1 Organizations
must look to incorporate modern endpoint protection platform (EPP) and
endpoint detection and response (EDR) solutions such as Microsoft
Defender ATP to protect against growingly complex threats that defeat
traditional endpoint security solutions.
To better understand the benefits, costs, and risks associated with this
investment, Forrester interviewed several customers with years of
experience using Microsoft Defender ATP.
Our findings indicate that enterprise security teams that deployed
Microsoft Defender ATP were able to improve their enterprise security
posture by preventing attacks through advanced threat-hunting capabilities
and by reducing the attack surface area. Additionally, security teams were
able to improve the efficiency of investigation and response capabilities
through automation.
Prior to using Microsoft Defender ATP, customers were using traditional
on-premises and cloud solutions that could not keep up with the ever-
evolving threat landscape. Organizations cited performance utilization
issues that hampered the productivity of end users and required additional
agents for support. Customers looked into simplifying their security, using
one vendor instead of multiple disparate solutions. One IT security
architect stated, “We were aware and conscious that as malware evolves,
we need also to ensure that our security evolves to protect our employees
and essentially fill our gaps.”
Following the deployment of Microsoft Defender ATP, an enterprise
architect said: “Our mission is to secure the financial future of our
customers. We need to ensure that we are secure to keep that trust. It
[Microsoft Defender ATP] helps our cyber security with better threat
tracking and breach avoidance, making us more trustworthy to both
regulators and customers.”
Key Findings
Quantified benefits. The following risk-adjusted present value (PV)
quantified benefits are representative of those experienced by the
companies interviewed:
Key Benefits Of Defender ATP (Three-Year PV) SecOps and IT efficiency gains:
$601,792
Business end user productivity recovery:
$3,135,789 Sunset software and new capability purchase avoidance:
$2,347,912

2 | The Total Economic Impact™ Of Microsoft Defender ATP
› Security and IT operations realized efficiency gains. Organizations
that had conducted proof of concept (POC) with Microsoft Defender ATP
often ran the new solution against existing on-premises and cloud EPP
and EDR solutions showing that Microsoft Defender ATP had significant
improvements over previous solutions. With improved threat telemetry,
automation, and intelligent remediation, the organizations soon found
that they were able to address endpoint threats faster in the analysis
and triage stage as well as being able to deflect help desk incidents. The
efficiency impact over three years is worth more than $600K PV to an
organization.
› Business end users were less plagued by external threats and
regained productivity. The better protection, detection, and response
capabilities of Microsoft Defender ATP led to increased uptime for
business users. Where end users relied on help desk in the past when
malware and viruses slipped by traditional EPP defenses, threats
including those of the zero-day variety were now contained by Microsoft
Defender ATP, helping end users vastly avoid the remediation calls and
procedures. The end user productivity recovery is valued at $3.1 million
PV.
› Savings from retired EPP solutions and expenditure avoidance on
modern EDR capabilities. Organizations that moved to Microsoft
Defender ATP found themselves able to sunset their existing EPP
solutions, resulting in eliminated ongoing licensing costs, service and
support costs, and solution management costs. In addition, by deploying
Microsoft Defender ATP, these organizations benefit from behavioral-
based EDR capabilities including automation, avoiding the need to
purchase individual, siloed solutions. This capability, measured over
three years, is worth $2.3 million PV.
Unquantified benefits. The interviewed organizations experienced the
following benefit, which is not quantified for this study:
› Avoidance of breach and regulatory ramifications. Some customers
indicated that they feared the weakest link within their security schema
was at their endpoints. Similarly, Forrester’s Global Business
Technographics® Security Survey in 2018 indicated that this area to be
of the highest likelihood to be breached — at 33%.2 The potential
regulatory fines and brand value erosion can incur an enormous cost
that Microsoft Defender ATP plays a significant role to mitigate.
Costs. The interviewed organizations experienced the following risk-
adjusted PV costs:
› Cost of licensing. Microsoft Defender ATP is acquired through the
upgrade from Windows 10 Enterprise E3 to E5. For an organization of
approximately 15,000 users and growing, the relative costs would be
$2.1 million dollars at list pricing over three years PV. Few other costs
were realized to adopt Microsoft Defender ATP as automated
deployment resulted in lower cost to deploy and manage than previous
EPP and EDR solutions.
Forrester’s interviews with four existing customers and subsequent
financial analysis found that an organization based on these interviewed
organizations experienced benefits of $6.1 million over three years versus
costs of $2.1 million, adding up to a net present value (NPV) of $4.0 million
and an ROI of 194%.
ROI 194%
Benefits PV $6.1 million
NPV $4.0 million
Payback <6 months

3 | The Total Economic Impact™ Of Microsoft Defender ATP
$601.8K
$3.1M
$2.3M
SecOps and IT efficiencygains
Business end userproductivity recovery
Sunsetted legacy endpointprotection and avoidance of
new purchases
Benefits (Three-Year)

4 | The Total Economic Impact™ Of Microsoft Defender ATP
TEI Framework And Methodology
From the information provided in the interviews, Forrester has constructed
a Total Economic Impact™ (TEI) framework for those organizations
considering implementing Microsoft Defender ATP.
The objective of the framework is to identify the cost, benefit, flexibility, and
risk factors that affect the investment decision. Forrester took a multistep
approach to evaluate the impact that Microsoft Defender ATP can have on
an organization:
DUE DILIGENCE Interviewed Microsoft stakeholders and Forrester analysts to gather data relative to Microsoft Defender ATP.
CUSTOMER INTERVIEWS Interviewed four organizations using Microsoft Defender ATP to obtain data with respect to costs, benefits, and risks.
COMPOSITE ORGANIZATION Designed a composite organization based on characteristics of the interviewed organizations.
FINANCIAL MODEL FRAMEWORK Constructed a financial model representative of the interviews using the TEI methodology and risk-adjusted the financial model based on issues and concerns of the interviewed organizations.
CASE STUDY Employed four fundamental elements of TEI in modeling Microsoft Defender ATP’s impact: benefits, costs, flexibility, and risks. Given the increasing sophistication that enterprises have regarding ROI analyses related to IT investments, Forrester’s TEI methodology serves to provide a complete picture of the total economic impact of purchase decisions. Please see Appendix A for additional information on the TEI methodology.
The TEI methodology
helps companies
demonstrate, justify,
and realize the
tangible value of IT
initiatives to both
senior management
and other key
business
stakeholders.
DISCLOSURES
Readers should be aware of the following:
This study is commissioned by Microsoft and delivered by Forrester Consulting.
It is not meant to be used as a competitive analysis.
Forrester makes no assumptions as to the potential ROI that other
organizations will receive. Forrester strongly advises that readers use their own
estimates within the framework provided in the report to determine the
appropriateness of an investment in Microsoft Defender ATP.
Microsoft reviewed and provided feedback to Forrester, but Forrester maintains
editorial control over the study and its findings and does not accept changes to
the study that contradict Forrester’s findings or obscure the meaning of the
study.
Microsoft provided the customer names for the interviews but did not participate
in the interviews.

5 | The Total Economic Impact™ Of Microsoft Defender ATP
The Microsoft Defender ATP Customer
Journey
BEFORE AND AFTER THE MICROSOFT DEFENDER ATP INVESTMENT
Interviewed Organizations
For this study, Forrester conducted four interviews with Microsoft
Defender ATP customers. Interviewed customers include the following:
Key Challenges
Forrester consistently heard that customers of Microsoft came from
environments where it was increasingly difficult to defend and respond
against modern threats. Previous on-premises and cloud-based solutions
were no longer sufficient and required the use of advanced measures to
protect enterprises. Even worse, malware and threats frequently
breached the endpoint perimeter undetected, oftentimes proliferating
within the network and compounding issues.
Some key factors that made these previous solutions ineffective for the
interviewees are as follows:
› Endpoint protection was inadequate with the evolution of
malicious threats. The on-premises and cloud-based solutions that
organizations deployed were no longer sufficient to protect against
modern, sophisticated attacks from organized threat actors such as
crime groups and government entities. The threat and attack vectors
have become increasingly complex, requiring advanced behavioral
analysis and machine learning to truly detect malicious activity —
especially in the case of zero-day threats. One interviewee recounted
an event where over 1 terabyte of data was lost to malicious malware
that could have been avoided with Microsoft Defender ATP.
› High resource utilization was inhibiting business users from
reaching their maximum productivity. Traditional endpoint security
solutions at the interviewed organizations utilized on-premises agents
that sapped endpoint resources away, while in some cases providing
spotty detection. Users constantly complained of sluggish
performance, which was described by one interviewee as users who
stare at their screen waiting for documents to launch. Further
exacerbating the issue, numerous business users spent time with the
IT help desk to remediate the issues that were missed by previous
solutions — many of which became serious issues requiring advanced
remediation by the time that users noticed something was amiss.
INDUSTRY INTERVIEWEE REVENUE ENDPOINTS
Financial services Product owner, managed devices
$1B+ 18,000 laptop devices and an additional 8K mobile devices
Technology Enterprise endpoint security engineer
$10B+ 120,000 laptop devices
Consumer goods Infrastructure engineer $1B+ 11,000 desktops and 3K+ laptop of mobile devices
Retail food services IT security architect $100M+ 1,200+ varied endpoints
“Our old solution had a poor hit
rate, frequent false positives,
and was a heavy burden to
our system. Combined with a
major incident, we decided it
was time to pursue the
Microsoft solution.”
Infrastructure engineer, consumer
goods company
“We were aware and conscious
that as malware evolves, we
need also to ensure that our
security evolves to protect our
employees and essentially fill
our gaps. . . . That was the
main driver for us to move to
the Microsoft solution.”
IT security architect, retail food
servicer

6 | The Total Economic Impact™ Of Microsoft Defender ATP
› Lack of a single source of intelligence collection on endpoints
and other security mechanisms. Previously deployed tools provided
some detection capabilities, but they fell short in providing telemetry
beyond the malware or virus information. Modern security
professionals need additional telemetry on the threat’s effect on data,
along with exact user activity on the network, and how it all correlates
on a timeline so that they can dig deeper to harden defenses on key
areas. This was extremely difficult or not possible with previously
deployed solutions as its telemetry was not shared with other security
components. As a result, security operators needed to perform
significant triage and analytical work with disparate information silos to
gain any meaningful insight. In effect, responding and becoming
proactive with endpoint security measures was out of the question.
Key Results
The interviews revealed that key results from the Microsoft Defender
ATP investment include:
› Advanced detection methods and automation decreased security
risk and increased SecOps efficiency. The improved detection
engine of Microsoft Defender ATP stopped significantly more threats
than the previous solutions. Advanced persistent threats and zero-day
threats were also stopped. More importantly, however, much of these
threats were treated automatically, decreasing the effort that SecOps
and IT Ops needed to spend on investigation and remediation.
Advanced threat-hunting became the new priority for security
professionals to further strengthen the security posture of the
organization.
› Consolidated data to produce more insightful analyses. Risk
analysis and reporting became a much simpler process. The single
pane of glass that Microsoft Defender ATP offers across all of the
Windows security features provided transparency and new insights,
allowing organizational leaders to improve business decision making
and reduce risk. Furthermore, there was a marked decrease in the
overall effort to manage and protect endpoints. An engineer described
Microsoft Defender ATP as being, “easier to manage with constant
updates, easier to identify with greater visibility across multiple
Microsoft security tools, and easier to control.”
› End users enjoyed fewer downtimes and improved productivity.
Multiple factors contributed to an increase in end user productivity
following the migration to Microsoft Defender ATP: 1) fewer false
positives generated from previous anti-virus solutions that at times
would block productive activities; 2) decreased remediation efforts as
fewer machines now need to be reflashed/rebuilt; and 3) heavy weight
on-premises agents became a thing of the past and systems were no
longer bogged down. Cumulatively, end users were now recovering
thousands of productivity hours annually.
“If I need to look in 15 different
management tools and
maintain them all, then we’ll
lose track. That is one of the
great advantages of Microsoft,
so that you can make your
automated investigation and
it’s so much easier because
it’s integrated with everything
and will be in the same portal.”
Infrastructure engineer, consumer
goods company
“Microsoft Defender ATP is
much easier [to manage] and
requires a smaller team to
handle, block, and investigate
than our previous
environment. In fact, it’s
allowing us to do an auto-
investigation when it sees
something that it deems
necessary to do so. That helps
gather the information and
make things easier to handle”
Enterprise endpoint engineer,
technology company

7 | The Total Economic Impact™ Of Microsoft Defender ATP
Composite Organization
Based on the interviews, Forrester constructed a TEI framework, a
composite company, and an associated ROI analysis that illustrates the
areas financially affected. The composite organization is representative
of the four companies that Forrester interviewed and is used to present
the aggregate financial analysis in the next section. The composite
organization that Forrester synthesized from the customer interviews has
the following characteristics:
The composite organization. This is a Fortune 500, multibillion-dollar
B2B organization. As a whole, the organization has a strong brand,
global operations, and is well-respected among its peers in the industry.
It has a workforce that is highly mobile, utilizing mostly Windows-based
laptops. Many of these endpoints traverse off the corporate network from
time to time and require up-to-date protection 24/7.
The composite organization is in the process of setting up a central
security operations center (SOC) and intends to improve its security
posture to tackle regulatory and client-demanded compliance measures.
Recently the organization migrated from Windows 7 to Windows 10,
leveraging many of the built-in security features such as BitLocker,
Windows Hello, and Microsoft Defender ATP — which all provide an
abundance of telemetry due to the integrated nature of these tools to the
operating system. This was imperative to the organization as it needed to
scale its security efforts without drastically increasing difficult-to-hire
security professionals.
Deployment characteristics. The deployment of Microsoft Defender
ATP was set in three stages:
› An initial POC was performed that included running Microsoft Defender
ATP on some pilot systems while the remainder of endpoints ran the
previous EPP and EDR solutions. After finding improved protection,
detection, and response capabilities on Microsoft Defender ATP, the
green light was given for procurement of Windows 10 with Microsoft
Defender ATP.
› Windows 10 E5, which is the Windows license that includes Microsoft
Defender ATP, was deployed to both existing and all new endpoints.
The entire process took four months, mainly due to the timing of the
Windows 10 OS rollout, rather than any difficulty with Microsoft
Defender ATP. Agents did not need to be manually deployed as it was
already built into Windows 10 itself and just needed to be enabled.
› Initial optimization of Microsoft Defender ATP took less than two weeks
to reach operational speed, but fine-tuning the optimization is an
ongoing process to continuously improve the organizational security
posture.
Key assumptions
• 15,000 total endpoints
• 15,000 business end
users
• 15 minutes spent per
security related help
desk call

8 | The Total Economic Impact™ Of Microsoft Defender ATP
The table above shows the total of all benefits across the areas listed below, as well as present values (PVs) discounted at 10%. Over three years, the composite organization expects risk-adjusted total benefits to be a PV of nearly $4.6 million.
Analysis Of Benefits
QUANTIFIED BENEFIT DATA AS APPLIED TO THE COMPOSITE
Benefit 1: SecOps And IT Efficiency Gains
Traditional endpoint protection platforms provided marginal defenses to
the organizations interviewed. The detection rates from the previous
solutions could not keep pace with the evolving malware and attack
schemes. Many interviewees stated that they had no idea if their existing
solution was able to keep up with the evolving schemes and felt that they
could not depend on the previous solution to detect advanced threats.
Following bakeoffs where their previous solutions and Microsoft
Defender ATP (WDATP) ran in parallel, it became clear that many of the
benefits of the cloud-based Microsoft Defender ATP solution were
superior. Collectively, we found Microsoft Defender ATP to be able to:
› Increase detection efficacy, with the rate more than double that of
previous solutions in some cases. Advanced persistent threats
(APT) and zero-day threats were among the types of threats that
were more frequently detected.
› Automatically contained and remediate on 97% of post-breach
detections. This eliminates many of the manual tasks associated
with attack response — helping SecOps and IT Ops to move onto
other value producing tasks like advanced threat-hunting or
operations support.
› Minimize the need for IT help desk to reimage or rebuilt endpoint
systems due to higher and faster catch rate with a lower total dwell
time. Previous solutions required nearly 35% of breached systems
to be reimaged/rebuilt. In addition, IT help desk calls.
› Provide rich telemetry of attacks so that SecOps can take the right
course of response action and do deep threat analyses.
An Enterprise endpoint security engineer stated: “We have new found
visibility. The [Microsoft Defender ATP] EDR capabilities raise alerts
based on behavior and can act more quickly on issues. The capabilities it
gives us are much more in-depth that other solutions that we’ve tried.”
With these drivers applied to the composite organization over a three-
year period, the composite gained a benefit value of $601,792 PV.
Microsoft Defender ATP
eliminates noise and
protects against advanced
threats so that SecOps
and IT Ops can work on
other productive tasks like
threat-hunting and bug
elimination.
Total Benefits
REF. BENEFIT YEAR 1 YEAR 2 YEAR 3 TOTAL PRESENT VALUE
Atr SecOps and IT efficiency gains
$230,983 $242,567 $254,672 $728,222 $601,792
Btr Business end user productivity recovery
$1,203,661 $1,263,851 $1,327,069 $3,794,582 $3,135,789
Ctr Sunset previous endpoint protection and avoidance of new purchases
$903,200 $946,200 $991,379 $2,840,779 $2,347,912
Total benefits (risk-adjusted) $2,337,844 $2,452,618 $2,573,120 $7,363,582 $6,085,493
9 | The Total Economic Impact™ Of Microsoft Defender ATP
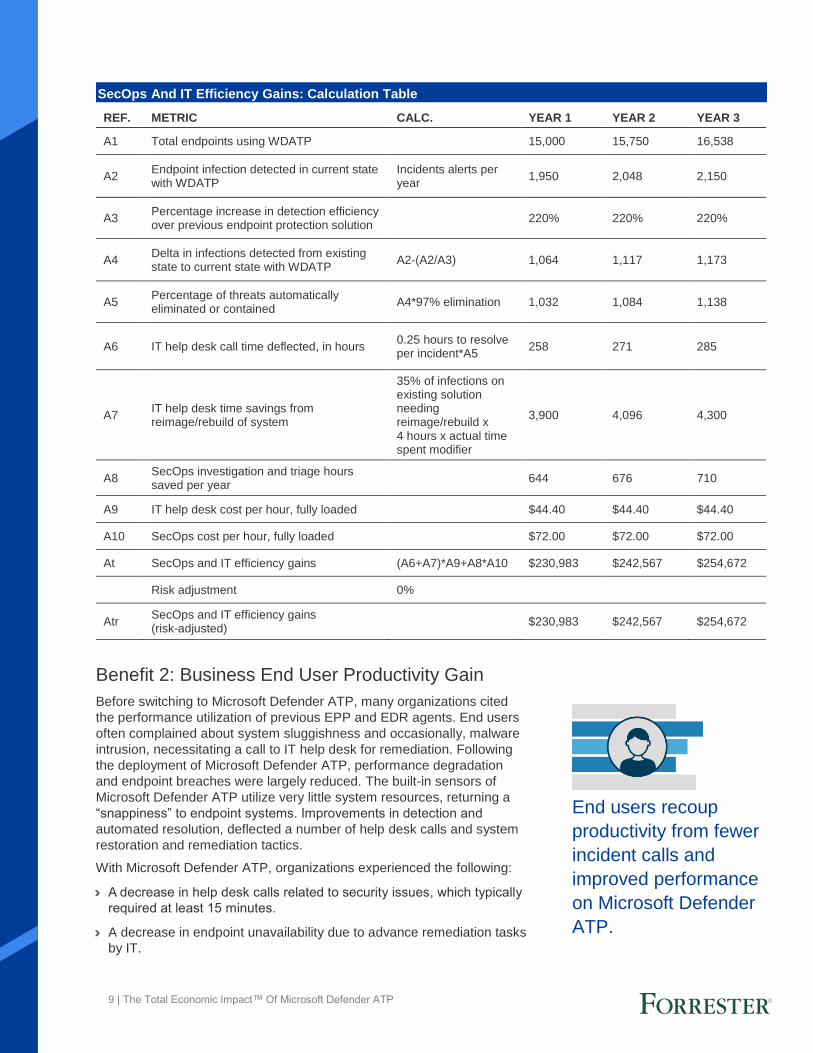
Benefit 2: Business End User Productivity Gain
Before switching to Microsoft Defender ATP, many organizations cited
the performance utilization of previous EPP and EDR agents. End users
often complained about system sluggishness and occasionally, malware
intrusion, necessitating a call to IT help desk for remediation. Following
the deployment of Microsoft Defender ATP, performance degradation
and endpoint breaches were largely reduced. The built-in sensors of
Microsoft Defender ATP utilize very little system resources, returning a
“snappiness” to endpoint systems. Improvements in detection and
automated resolution, deflected a number of help desk calls and system
restoration and remediation tactics.
With Microsoft Defender ATP, organizations experienced the following:
› A decrease in help desk calls related to security issues, which typically
required at least 15 minutes.
› A decrease in endpoint unavailability due to advance remediation tasks
by IT.
SecOps And IT Efficiency Gains: Calculation Table
REF. METRIC CALC. YEAR 1 YEAR 2 YEAR 3
A1 Total endpoints using WDATP 15,000 15,750 16,538
A2 Endpoint infection detected in current state with WDATP
Incidents alerts per year
1,950 2,048 2,150
A3 Percentage increase in detection efficiency over previous endpoint protection solution
220% 220% 220%
A4 Delta in infections detected from existing state to current state with WDATP
A2-(A2/A3) 1,064 1,117 1,173
A5 Percentage of threats automatically eliminated or contained
A4*97% elimination 1,032 1,084 1,138
A6 IT help desk call time deflected, in hours 0.25 hours to resolve per incident*A5
258 271 285
A7 IT help desk time savings from reimage/rebuild of system
35% of infections on existing solution needing reimage/rebuild x 4 hours x actual time spent modifier
3,900 4,096 4,300
A8 SecOps investigation and triage hours saved per year
644 676 710
A9 IT help desk cost per hour, fully loaded $44.40 $44.40 $44.40
A10 SecOps cost per hour, fully loaded $72.00 $72.00 $72.00
At SecOps and IT efficiency gains (A6+A7)*A9+A8*A10 $230,983 $242,567 $254,672
Risk adjustment 0%
Atr SecOps and IT efficiency gains (risk-adjusted)
$230,983 $242,567 $254,672
End users recoup
productivity from fewer
incident calls and
improved performance
on Microsoft Defender
ATP.

10 | The Total Economic Impact™ Of Microsoft Defender ATP
Impact risk is the risk that the business or technology needs of the organization may not be met by the investment, resulting in lower overall total benefits. The greater the uncertainty, the wider the potential range of outcomes for benefit estimates.
› A decrease in endpoint performance utilization due to additional EPP
and EDR agent resource use — amounting to a collective 10 minutes
or more per workday.
For the composite organization, Forrester assumes the above
characteristics from interviewees and the following:
› Advanced endpoint remediation affecting end user productivity is
halved from total remediation time as extra available endpoint units are
available for short-term lending.
› Malicious malware that was not detected by the previous EPP and
EDR tools had protracted dwell times, and potentially caused
increased performance degradation. As the characteristics and
activities of these malware varied, this has not been calculated
quantitatively.
› Productivity lost to endpoint performance degradation is spread loosely
across entire workdays and is likely difficult to piece into substantial
periods of productivity. As such, we anticipate that only 5% of the time
recovered can actually be utilized effectively. Users’ experience,
however, will be greatly improved.
This case study also accounts for impact risk factors that affect this
benefit category:
› User time, that is lost to workstations requiring advanced remediation,
can differ greatly based upon the number of extra machines available.
› Productivity lost to high resource utilization can vary from one solution
to another.
To account for these risks, Forrester adjusted this benefit downward by
15%, yielding a total three-year, risk-adjusted total PV of $3.1 million.

11 | The Total Economic Impact™ Of Microsoft Defender ATP
Benefit 3: Previous Endpoint Protection And
Avoidance Of New Capability Purchases
In investigating the possibility of adopting Microsoft Defender ATP, many
of the interviewed organizations determined that they would be able to
eliminate the license and support costs associated with their older
subscription-based EPP and EDR solutions. These organizations found
that while they paid for subscriptions, the rate at which the solutions were
updated with new intelligence was just not conducive to stopping or
finding threats — especially of the zero-day variety. Furthermore, to bring
capabilities up to a level that could provide adequate detection and
monitoring, these organizations would have required additional tools that
would have made little financial sense as an aggregate endpoint
solution.
Following the switch to Microsoft Defender ATP, these previous systems
were sunsetted, eliminating the associated ongoing costs of licensing,
maintenance, and support. When applied to the composite, the cost of
these retired components resulted in savings of over $900K per year or
$2,347,912 PV over the course of three years.
Business End User Productivity Recovery: Calculation Table
REF. METRIC CALC. YEAR 1 YEAR 2
YEAR 3
B1 Endpoint infections not detected by previous solution
A4 1,064 1,117 1,173
B2 Time spent on help desk calls B1*0.25 hours per call 266 279 293
B3 Time spent on advanced remediation
A7/2 1,950 2,048 2,150
B4 End user productivity hours saved from endpoint remediation acceleration
B2+B3 2,216 2,327 2,443
B5
Productivity time lost to previous endpoint solution CPU load and effect on application performance, in hours per year
10 minutes per day/ 60 minutes in hour* 250 days of work
42 42 42
B6 Total full-time end users 15,000 15,750 16,538
B7 Average hourly wage of internal business user
$70K*1.2x benefits modifier/2,000 hours
$42.00 $42.00 $42.00
B8 Percent capture of productivity from high resource utilization elimination
5% 5% 5%
Bt Business end user productivity recovery
(B4*B7)+(B5*B6*B7*B8) $1,416,072 $1,486,884 $1,561,258
Risk adjustment ↓15%
Btr Business end user productivity recovery (risk-adjusted)
$1,203,661 $1,263,851 $1,327,069
With Microsoft Defender
ATP, the need to
purchase additional, and
frequently disparate,
tools for EPP and EDR
can be eliminated.

12 | The Total Economic Impact™ Of Microsoft Defender ATP
Unquantified Benefits
Forrester’s interviews and analysis of Microsoft customers pointed to an
additional benefit that could not be reasonably quantified but is still
important to note.
Some interviewees either at their current organization or in a previous
capacity indicated prior breaches and incidents, which align with our
general findings of other surveyed organizations:
› According the 2018 Study on Megatrends in Cybersecurity, from
Ponemon Institute, less than half of IT security practitioners believed,
in 2018, that they can protect their organizations from cyber threats —
this percentage is down from 59% three years ago.3 And according to
Forrester’s Global Business Technographics Security Survey in 2018,
over 40% of breaches in 2018 were the result of external attacks.4 The
majority of data lost is personally identifiable information (PII),
according to our survey — meaning brand reputation is in the direct
line of sight for harm, not to mention regulatory fines following in line.
This study has not quantified the value of brand erosion or the
remediation costs, but assuming that the data breach is PII-related, the
costs are likely to be in the millions for an average enterprise.
› Dwell time of malicious breaches using traditional EPP and EDR tools
could not be quantified, as malware can stay dormant or act
maliciously from the start. Additionally, organizations could not
reasonably estimate the dwell time of breaches that they could not
previously detect. Nevertheless, the effects of these threats that are
now neutralized by Microsoft Defender ATP could have had profound
differences for many organizations using previous tools.
Previous Endpoint Protection And Avoidance Of New Capability Purchases: Calculation Table
REF. METRIC CALC. YEAR 1 YEAR 2 YEAR 3
C1 Cost of previous endpoint protection license A1*$40/seat $600,000 $630,000 $661,520
C2 Cost of service and support for previous EPP solution
C1*20% $120,000 $126,000 $132,304
C3 Management of existing previous EPP solution 30% utilization of 1x SecOps FTE
$43,200 $43,200 $43,200
C4 Cost avoidance of detection capabilities above and beyond previous solution
$140,000 $147,000 $154,355
Ct Previous endpoint protection and avoidance of new capability purchases
C1+C2+C3+C4 $903,200 $946,200 $991,379
Risk adjustment 0%
Ctr Previous endpoint protection and avoidance of new capability purchases (risk-adjusted)
$903,200 $946,200 $991,379
Risk management is
increasingly difficult with
growingly complex
threats, especially at the
perimeter. Microsoft
Defender ATP can
protect against
reputational harm and
regulatory penalties by
being the first line of
defense.

13 | The Total Economic Impact™ Of Microsoft Defender ATP
Flexibility, as defined by TEI, represents an investment in additional capacity or capability that could be turned into business benefit for a future additional investment. This provides an organization with the "right" or the ability to engage in future initiatives but not the obligation to do so.
Flexibility
The value of flexibility is clearly unique to each customer, and the
measure of its value varies from organization to organization. There are
multiple scenarios in which a customer might choose to implement
Microsoft Defender ATP and later realize additional uses and business
opportunities, including:
› Cloud updated security intelligence and analyses without having
to worry about integration issues with the OS. With updates on
traditional systems happening multiple times through the day, it makes
it difficult for some organizations to trust that the updates are going to
work properly with their integrations and on the OS. With Microsoft
being the provider of the OS, which enables near-instant access to the
latest security intelligence for both the EPP and EDR scenarios,
continuity is much more likely to persist.
› REST API integration into SIEM and native integration to
Microsoft System Center Configuration Manager (SCCM).
Microsoft provides the ability for organizations to easily connect to
popular SIEMs for information and event collection. While Microsoft
Defender ATP has built-in visualization for the endpoint, organizations
using third-party products to secure other workloads (e.g., email) —
especially those with SOCs — will want to integrate Microsoft Defender
ATP data to SIEMs for a more centralized view of the entire security
landscape. Further still, the provided APIs pave the way for further
orchestration and automation for a comprehensive incident response
workflow.
Flexibility would also be quantified when evaluated as part of a specific
project (described in more detail in Appendix A).

14 | The Total Economic Impact™ Of Microsoft Defender ATP
The table above shows the total of all costs across the areas listed below, as well as present values (PVs) discounted at 10%. Over three years, the composite organization expects risk-adjusted total costs to be a PV of slightly under $2.1 million.
Analysis Of Costs
QUANTIFIED COST DATA AS APPLIED TO THE COMPOSITE
Cost 1: Cost To License Microsoft Defender ATP
Microsoft Defender ATP is a component of Windows 10 Enterprise E5
license. Organizations can expect Microsoft Defender ATP to fully
integrate with other Windows 10 security features creating a
consolidated and comprehensive approach to endpoint security.
The cost of client access license (CAL) is typically assessed on an
annual basis. With consideration that most organizations are either on
Windows 10 or moving to Windows 10, the incremental cost to include
Microsoft Defender ATP is $53 per license or $795,000 for the first year,
for the composite organization. We have assumed FTE growth of 5%
annually at the composite and the license costs are reflective of this in
Years 2 and 3.
It is important to note that additive costs of management have not been
included, as interviewed organizations believe this cost to be similar, if
not less than that of alternative solution sets available currently — thanks
in large to automation and the intelligent-handling of threats.
Measured over a three-year horizon, organizations that deploy Microsoft
Defender ATP can expect a cost of $2,071,141 PV at list-level pricing.
Total Costs
REF. COST YEAR 1 YEAR 2 YEAR 3 TOTAL PRESENT VALUE
Dtr Cost to license Microsoft Defender ATP
$795,000 $834,750 $876,514 $2,506,264 $2,071,141
Total costs (risk-adjusted) $795,000 $834,750 $876,514 $2,506,264 $2,071,141
Cost To License Microsoft Defender ATP: Calculation Table
REF. METRIC CALC. INITIAL YEAR 1 YEAR 2 YEAR 3
D1 Cost delta of E5 licenses over E3 $795,000 $834,750 $876,514
Dt Cost to license WDATP D1 $795,000 $834,750 $876,514
Risk adjustment 0%
Dtr Cost to license WDATP (risk-adjusted)
$0 $795,000 $834,750 $876,514
Microsoft Defender ATP is an incremental license upgrade that fully integrates with other Windows 10 security features like BitLocker and identity management.

15 | The Total Economic Impact™ Of Microsoft Defender ATP
The financial results calculated in the Benefits and Costs sections can be used to determine the ROI, NPV, and payback period for the composite organization's investment. Forrester assumes a yearly discount rate of 10% for this analysis.
Financial Summary
CONSOLIDATED THREE-YEAR RISK-ADJUSTED METRICS
Cash Flow Chart (Risk-Adjusted)
-$2.0 M
-$1.0 M
$1.0 M
$2.0 M
$3.0 M
$4.0 M
$5.0 M
$6.0 M
Initial Year 1 Year 2 Year 3
Cashflows
Total costs
Total benefits
Cumulative net benefits
These risk-adjusted ROI,
NPV, and payback period
values are determined by
applying risk-adjustment
factors to the unadjusted
results in each Benefit and
Cost section.
Cash Flow Table (Risk-Adjusted)
INITIAL YEAR 1 YEAR 2 YEAR 3 TOTAL PRESENT VALUE
Total costs $0 ($795,000) ($834,750) ($876,514) ($2,506,264) ($2,071,141)
Total benefits $0 $2,337,844 $2,452,618 $2,573,120 $7,363,582 $6,085,493
Net benefits $0 $1,542,844 $1,617,868 $1,696,606 $4,857,318 $4,014,352
ROI 194%
Payback period <6 months

16 | The Total Economic Impact™ Of Microsoft Defender ATP
Microsoft Defender ATP: Overview
The following information is provided by Microsoft. Forrester has not validated any claims and does not endorse
Microsoft or its offerings.

17 | The Total Economic Impact™ Of Microsoft Defender ATP
Appendix A: Total Economic Impact
Total Economic Impact is a methodology developed by Forrester
Research that enhances a company’s technology decision-making
processes and assists vendors in communicating the value proposition
of their products and services to clients. The TEI methodology helps
companies demonstrate, justify, and realize the tangible value of IT
initiatives to both senior management and other key business
stakeholders.
Total Economic Impact Approach
Benefits represent the value delivered to the business by the
product. The TEI methodology places equal weight on the
measure of benefits and the measure of costs, allowing for a
full examination of the effect of the technology on the entire
organization.
Costs consider all expenses necessary to deliver the
proposed value, or benefits, of the product. The cost category
within TEI captures incremental costs over the existing
environment for ongoing costs associated with the solution.
Flexibility represents the strategic value that can be
obtained for some future additional investment building on
top of the initial investment already made. Having the ability
to capture that benefit has a PV that can be estimated.
Risks measure the uncertainty of benefit and cost estimates
given: 1) the likelihood that estimates will meet original
projections and 2) the likelihood that estimates will be
tracked over time. TEI risk factors are based on “triangular
distribution.”
The initial investment column contains costs incurred at “time 0” or at the
beginning of Year 1 that are not discounted. All other cash flows are discounted
using the discount rate at the end of the year. PV calculations are calculated for
each total cost and benefit estimate. NPV calculations in the summary tables are
the sum of the initial investment and the discounted cash flows in each year.
Sums and present value calculations of the Total Benefits, Total Costs, and
Cash Flow tables may not exactly add up, as some rounding may occur.
Present value (PV)
The present or current value of (discounted) cost and benefit estimates given at an interest rate (the discount rate). The PV of costs and benefits feed into the total NPV of cash flows.
Net present value (NPV)
The present or current value of (discounted) future net cash flows given an interest rate (the discount rate). A positive project NPV normally indicates that the investment should be made, unless other projects have higher NPVs.
Return on investment (ROI)
A project’s expected return in percentage terms. ROI is calculated by dividing net benefits (benefits less costs) by costs.
Discount rate
The interest rate used in cash flow analysis to take into account the time value of money. Organizations typically use discount rates between 8% and 16%.
Payback period
The breakeven point for an investment. This is the point in time at which net benefits (benefits minus costs) equal initial investment or cost.

18 | The Total Economic Impact™ Of Microsoft Defender ATP
Appendix C: Endnotes
1 Source: “The Forrester Wave™: Endpoint Security Suites, Q2 2018,” Forrester Research, Inc., June 21, 2018. 2 Source: Forrester Analytics Global Business Technographics Security Survey, 2018. 3 Source: “2018 Study on Global Megatrends in Cybersecurity,” Ponemon Institute LLC, February 2018 (https://www.raytheon.com/sites/default/files/2018-02/2018_Global_Cyber_Megatrends.pdf). 4 Source: Forrester Analytics Global Business Technographics Security Survey, 2018.