the tokyo gas group business activities and material balance
TRANSCRIPT
Note: The sum of individual environmental data may not be equal to the total due to the way figures are rounded.
The Tokyo Gas Group Business Activities and MaterialBalance
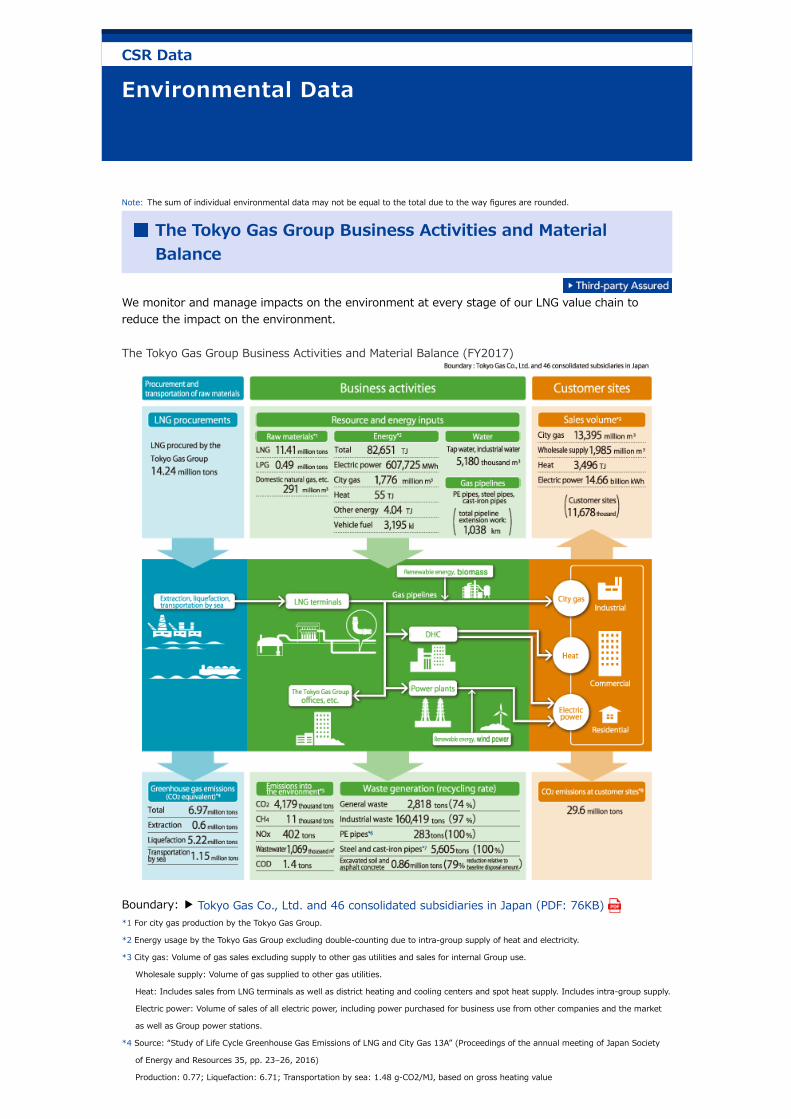
We monitor and manage impacts on the environment at every stage of our LNG value chain toreduce the impact on the environment.
The Tokyo Gas Group Business Activities and Material Balance (FY2017)
Boundary: ▶ Tokyo Gas Co., Ltd. and 46 consolidated subsidiaries in Japan (PDF: 76KB) *1 For city gas production by the Tokyo Gas Group.
*2 Energy usage by the Tokyo Gas Group excluding double-counting due to intra-group supply of heat and electricity.
*3 City gas: Volume of gas sales excluding supply to other gas utilities and sales for internal Group use.
Wholesale supply: Volume of gas supplied to other gas utilities.
Heat: Includes sales from LNG terminals as well as district heating and cooling centers and spot heat supply. Includes intra-group supply.
Electric power: Volume of sales of all electric power, including power purchased for business use from other companies and the market
as well as Group power stations.
*4 Source: “Study of Life Cycle Greenhouse Gas Emissions of LNG and City Gas 13A” (Proceedings of the annual meeting of Japan Society
of Energy and Resources 35, pp. 23–26, 2016)
Production: 0.77; Liquefaction: 6.71; Transportation by sea: 1.48 g-CO2/MJ, based on gross heating value
CSR Data

City Gas Feedstock (LNG/LPG) City Gas Sales
Heat Sales Power Sales
*5 CO2, CH4, NOx: Excludes double-counting due to intra-group supply.
Volume of wastewater: Specified wastewater and domestic sewage.
*6, 7 PE pipes, Steel and cast-iron pipes: Tokyo Gas on a non-consolidated basis.
*8 Gas sales volume multiplied by emission intensity.
▶ The Tokyo Gas Group Business Activities and Material Balance (FY2017) (PDF: 184KB)
(1) Usage of Energy and Water/Emissions into theAtmosphere and Water System
Use of Energy and Water/Emissions into the Atmosphere and WaterSystems
Feedstock and Sales Volume
Category Unit FY2013 FY2014 FY2015 FY2016 FY2017
City gas feedstock(Note 1)
LNG Thousand tons 11,057 11,513 11,411 11,583 11,407
LPG Thousand tons 418 441 438 434 491
Sales volume
City gas (Note 2)
Million m3 14,527 15,358 15,263 15,571 15,380
Heat (Note 3)
TJ 3,353 3,287 3,251 3,451 3,496
Power (Note 4)
Billion kWh 9.71 10.61 10.96 12.65 14.66
Note 1: For city gas production by the Tokyo Gas Group.
Note 2: Volume of gas sales including supply to other gas utilities and excluding sales for internal Group use.
Note 3: Includes sales volume from LNG terminals, in addition to district heating and cooling centers and spot heat supply. Also includes
intra-group supply.
Note 4: Volume of sales of all electric power, including power purchased for business use from other companies and the market as well as
Group power stations.
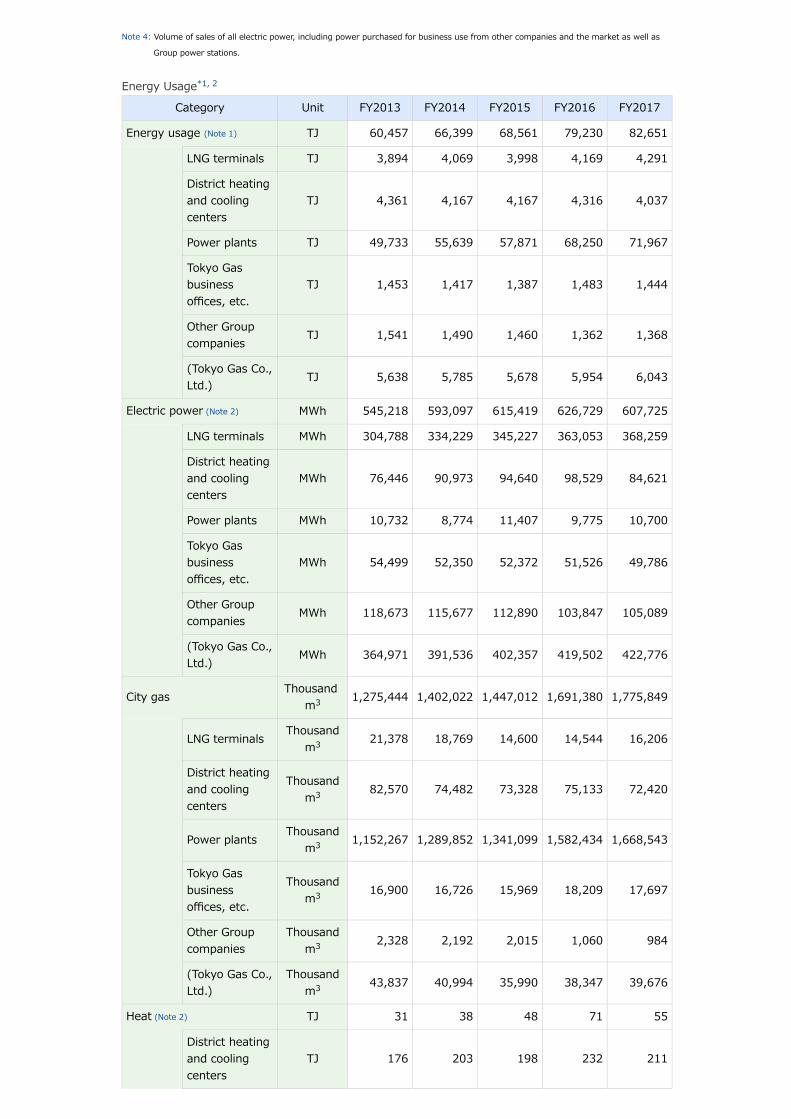
Energy Usage*1, 2
Category Unit FY2013 FY2014 FY2015 FY2016 FY2017
Energy usage (Note 1) TJ 60,457 66,399 68,561 79,230 82,651
LNG terminals TJ 3,894 4,069 3,998 4,169 4,291
District heatingand coolingcenters
TJ 4,361 4,167 4,167 4,316 4,037
Power plants TJ 49,733 55,639 57,871 68,250 71,967
Tokyo Gasbusinessoffices, etc.
TJ 1,453 1,417 1,387 1,483 1,444
Other Groupcompanies TJ 1,541 1,490 1,460 1,362 1,368
(Tokyo Gas Co.,Ltd.) TJ 5,638 5,785 5,678 5,954 6,043
Electric power (Note 2) MWh 545,218 593,097 615,419 626,729 607,725
LNG terminals MWh 304,788 334,229 345,227 363,053 368,259
District heatingand coolingcenters
MWh 76,446 90,973 94,640 98,529 84,621
Power plants MWh 10,732 8,774 11,407 9,775 10,700
Tokyo Gasbusinessoffices, etc.
MWh 54,499 52,350 52,372 51,526 49,786
Other Groupcompanies MWh 118,673 115,677 112,890 103,847 105,089
(Tokyo Gas Co.,Ltd.) MWh 364,971 391,536 402,357 419,502 422,776
City gasThousand
m3 1,275,444 1,402,022 1,447,012 1,691,380 1,775,849
LNG terminals Thousandm3 21,378 18,769 14,600 14,544 16,206
District heatingand coolingcenters
Thousandm3 82,570 74,482 73,328 75,133 72,420
Power plants Thousandm3 1,152,267 1,289,852 1,341,099 1,582,434 1,668,543
Tokyo Gasbusinessoffices, etc.
Thousandm3 16,900 16,726 15,969 18,209 17,697
Other Groupcompanies
Thousandm3 2,328 2,192 2,015 1,060 984
(Tokyo Gas Co.,Ltd.)
Thousandm3 43,837 40,994 35,990 38,347 39,676
Heat (Note 2) TJ 31 38 48 71 55
District heatingand coolingcenters
TJ 176 203 198 232 211

Tokyo Gasbusinessoffices, etc.
TJ 89 85 88 93 95
Other Groupcompanies TJ 167 158 166 195 195
(Tokyo Gas Co.,Ltd.) TJ 99 94 96 102 104
Other fuels TJ 5.40 5.23 5.80 4.89 4.04
LNG terminals TJ 0.18 0.22 0.68 0.50 0.53
Tokyo Gasbusinessoffices, etc.
TJ 0.64 0.64 0.60 1.34 0.50
Other Groupcompanies TJ 4.59 4.37 4.52 3.04 3.01
(Tokyo Gasbusinessoffices, etc.)
TJ 0.85 0.86 1.28 1.84 1.03
Fuels forvehicles
Gasoline kL 3,571 3,282 3,219 3,342 3,195
(Tokyo Gas Co.,Ltd.)
kL 1,461 1,425 1,444 1,420 1,335
Diesel oil kL 228 219 208 198 249
(Tokyo Gas Co.,Ltd.) kL 37 35 41 47 59
City gas Thousandm3 218 203 175 135 133
(Tokyo Gas Co.,Ltd.)
Thousandm3 185 172 142 124 124
LPG kL 295 280 220 142 114
(Tokyo Gas Co.,Ltd.) kL - - - - -
LNG cryogenic energyThousand
tons 2,659 2,289 2,364 2,678 2,890
Cryogenicpowergeneration
Thousandtons
796 460 724 785 787
Portion sent tosubsidiariesand affiliates
Thousandtons
821 853 852 820 820
BOG treatment,etc.
Thousandtons
1,042 976 788 1,073 1,283

Energy Usage (by Fuel Type) Energy Usage (by Business)
Water Usage (Tap Water and Industrial Water)
Note 1: Excludes double counting by intra-group supply of heat and electricity.
Note 2: Excludes double counting by intra-group supply.
Water Usage
Category Unit FY2013 FY2014 FY2015 FY2016 FY2017
Tap water and industrial water Thousandm3 6,023 5,751 5,388 5,017 5,180
LNG terminals Thousandm3 1,542 1,662 1,457 1,138 1,125
District heating andcooling centers
Thousandm3 1,597 1,439 1,459 1,552 1,507
Power plant Thousandm3 1,890 1,703 1,569 1,492 1,765
Tokyo Gas businessoffices, etc.
Thousandm3 607 572 537 544 506
Other Group companies Thousandm3 387 375 366 290 276
(Tokyo Gas Co., Ltd.) Thousandm3 2,192 2,276 2,036 1,726 1,674
Seawater LNG terminalsThousand
m3 795,227 784,406 773,963 781,879 784,651
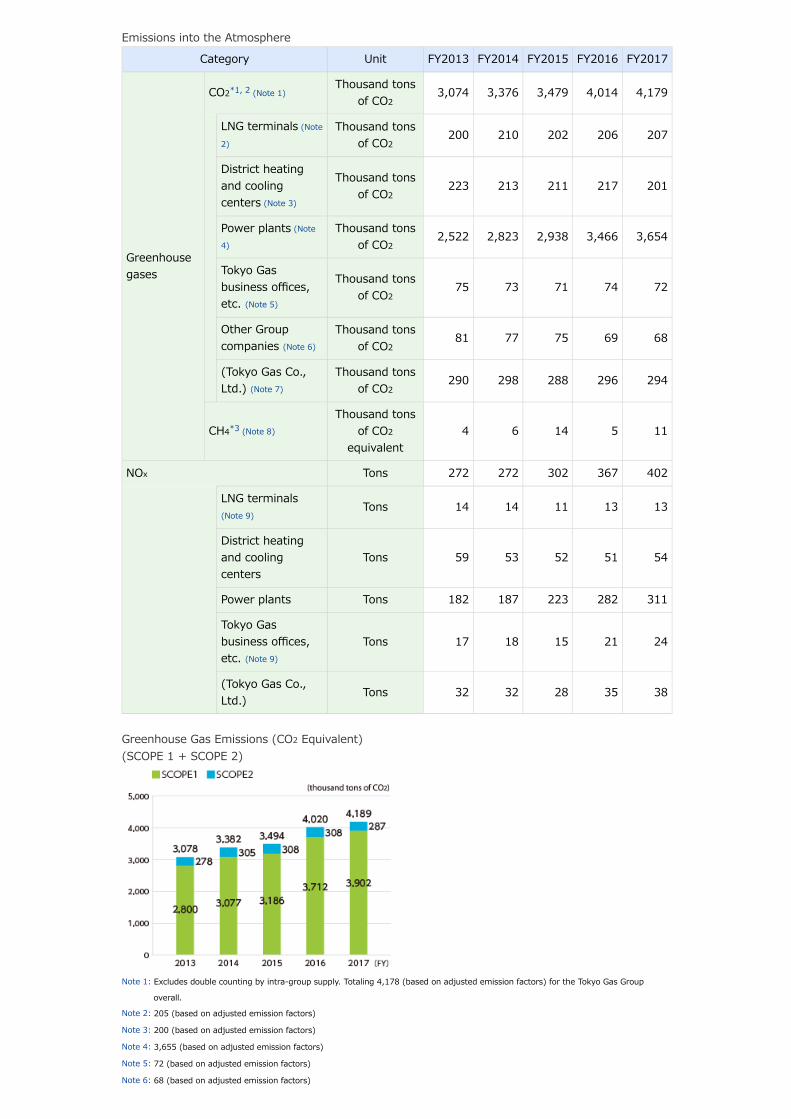
Greenhouse Gas Emissions (CO2 Equivalent)(SCOPE 1 + SCOPE 2)
Emissions into the Atmosphere
Category Unit FY2013 FY2014 FY2015 FY2016 FY2017
Greenhousegases
CO2*1, 2 (Note 1)Thousand tons
of CO23,074 3,376 3,479 4,014 4,179
LNG terminals (Note
2)
Thousand tonsof CO2
200 210 202 206 207
District heatingand coolingcenters (Note 3)
Thousand tonsof CO2
223 213 211 217 201
Power plants (Note
4)
Thousand tonsof CO2
2,522 2,823 2,938 3,466 3,654
Tokyo Gasbusiness offices,etc. (Note 5)
Thousand tonsof CO2
75 73 71 74 72
Other Groupcompanies (Note 6)
Thousand tonsof CO2
81 77 75 69 68
(Tokyo Gas Co.,Ltd.) (Note 7)
Thousand tonsof CO2
290 298 288 296 294
CH4*3 (Note 8)
Thousand tonsof CO2
equivalent4 6 14 5 11
NOx Tons 272 272 302 367 402
LNG terminals(Note 9)
Tons 14 14 11 13 13
District heatingand coolingcenters
Tons 59 53 52 51 54
Power plants Tons 182 187 223 282 311
Tokyo Gasbusiness offices,etc. (Note 9)
Tons 17 18 15 21 24
(Tokyo Gas Co.,Ltd.) Tons 32 32 28 35 38
Note 1: Excludes double counting by intra-group supply. Totaling 4,178 (based on adjusted emission factors) for the Tokyo Gas Group
overall.
Note 2: 205 (based on adjusted emission factors)
Note 3: 200 (based on adjusted emission factors)
Note 4: 3,655 (based on adjusted emission factors)
Note 5: 72 (based on adjusted emission factors)
Note 6: 68 (based on adjusted emission factors)

Note 7: 293 (based on adjusted emission factors)
Note 8: About 425 tons of CH4 emissions
Note 9: Emissions from facilities that generate soot and smoke specified in the Air Pollution Control Act.
Greenhouse Gas Emissions from Feedstock Procurement (SCOPE 3)
Category Unit FY2013 FY2014 FY2015 FY2016 FY2017
LNG procured Million tons 12.80 13.97 13.87 14.25 14.24
Greenhouse gas(CO2
equivalent)(Note)
Extraction Million tons ofCO2
0.57 0.62 0.58 0.60 0.60
Liquefaction Million tons ofCO2
5.84 6.38 5.08 5.22 5.22
Marinetransport
Million tons ofCO2
1.38 1.50 1.12 1.15 1.15
Note: Calculated based on greenhouse gas emission intensity throughout the lifecycle, from extraction of natural gas to processing and
transportation, as analyzed by the LCA approach.
• FY2012–14 emission intensity
Extraction: 0.81; Liquefaction: 8.36; Transportation by sea: 1.97 g-CO2/MJ, based on gross heating value
Source: “Future Forecast for Life Cycle Greenhouse Gas Emissions of LNG and City Gas 13A” (Japan Society of Energy and Resources,
presentation report 28 (2), pp. 51–56, 2007)
• Emission intensity from FY2015Extraction: 0.77; Liquefaction: 6.71; Transportation by sea: 1.48 g-CO2/MJ, based on gross heating valueSource: “Study of Life Cycle Greenhouse Gas Emissions of LNG and City Gas 13A” (Proceedings of the annual meeting of Japan Society
of Energy and Resources 35, pp. 23–26, 2016)
CO2 Emissions and Emissions Reduction at Customer Sites (SCOPE 3)
Category Unit FY2011 FY2012 FY2013 FY2014 FY2015 FY2016 FY2017
CO2
Totalamount
milliontons of CO2
26.94 27.09 27.67 29.36 28.96 29.43 29.60
AmountofreductionrelativetoFY2011
milliontons of CO2
Baseline 0.87 1.52 3.29 3.43 3.94 4.04
Energy Usage and CO2 Emissions Associated with Cargo Transportation (Tokyo Gas Co., Ltd.)(SCOPE 3)
Category Unit FY2013 FY2014 FY2015 FY2016 FY2017
Transportation amount million tons-km 93.12 94.59 98.42 85.70 82.72
Energy usage (crude oilequivalent) kL 3,258 3,275 3,354 3,165 3,055
Energy usage intensity kL/milliontons-km 35.0 34.6 34.1 36.9 36.9
CO2 emissions tons-CO2 8,576 8,615 8,810 8,267 7,993
Emissions into Water Systems
Category Unit FY2013 FY2014 FY2015 FY2016 FY2017
Wastewater thousandm3 1,106 1,116 1,091 1,090 1,069
LNG terminals (Note)thousand
m3 242 265 287 291 242
District heating and coolingcenters
thousandm3 321 325 330 354 330

Wastewater COD (Chemical Oxygen Demand)
Power plants thousandm3 544 525 474 445 498
(Tokyo Gas Co., Ltd.) thousandm3 249 273 296 300 258
COD tons 1.9 1.9 1.6 1.4 1.4
LNG terminals tons 1.2 1.2 1.2 1.0 0.9
Power plants tons 0.6 0.6 0.5 0.4 0.4
(Tokyo Gas Co., Ltd.) tons 1.2 1.2 1.2 1.0 0.9
Note: Data are for wastewater discharges from wastewater treatment facilities and sewage discharges.
Conversion Factor, etc.CO2 Emission Factor
Category Unit FY2013 FY2014 FY2015 FY2016 FY2017
City gas (Tokyo Gas 13A)(Note 1)
kg-CO2/m3 2.21
Purchased electricity (average of allpower sources) (Note 2)
kg-CO2/kWh 0.525etc.
0.530etc.
0.505 etc.
0.500etc.
0.486etc.
Heat(Note 3)
Steam (excluding industrialuse), hot water, cold water kg-CO2/MJ 0.057
Industrial steam kg-CO2/MJ 0.060
Otherfuels(Note 3)
Heavy oil A kg-CO2/L 2.71
Diesel kg-CO2/L 2.58
Kerosene kg-CO2/L 2.49
Gasoline kg-CO2/L 2.32
LPG kg-CO2/kg 3.00Note 1: Calculated based on the typical composition of city gas (type 13A) supplied by the Tokyo Gas (15°C, gauge pressure of 2 kPa).
Note 2: Emission factors from electric power companies, released in accordance with the ministerial ordinance stipulated by the Act on
Promotion of Global Warming Countermeasures.
Note 3: Calculated using the unit calorific value released in accordance with the ministerial ordinance stipulated by the Act on Promotion of
Global Warming Countermeasures, and multiplying this amount by the emission factor per unit calorific value and by 44/12.
Unit Calorific Value
Category Unit FY2013 FY2014 FY2015 FY2016 FY2017
City gas (Tokyo Gas 13A)(Note 1)
MJ/m3N 45.00
Purchasedelectricity
Daytime electricity MJ/kWh 9.97
Nighttime electricity MJ/kWh 9.28
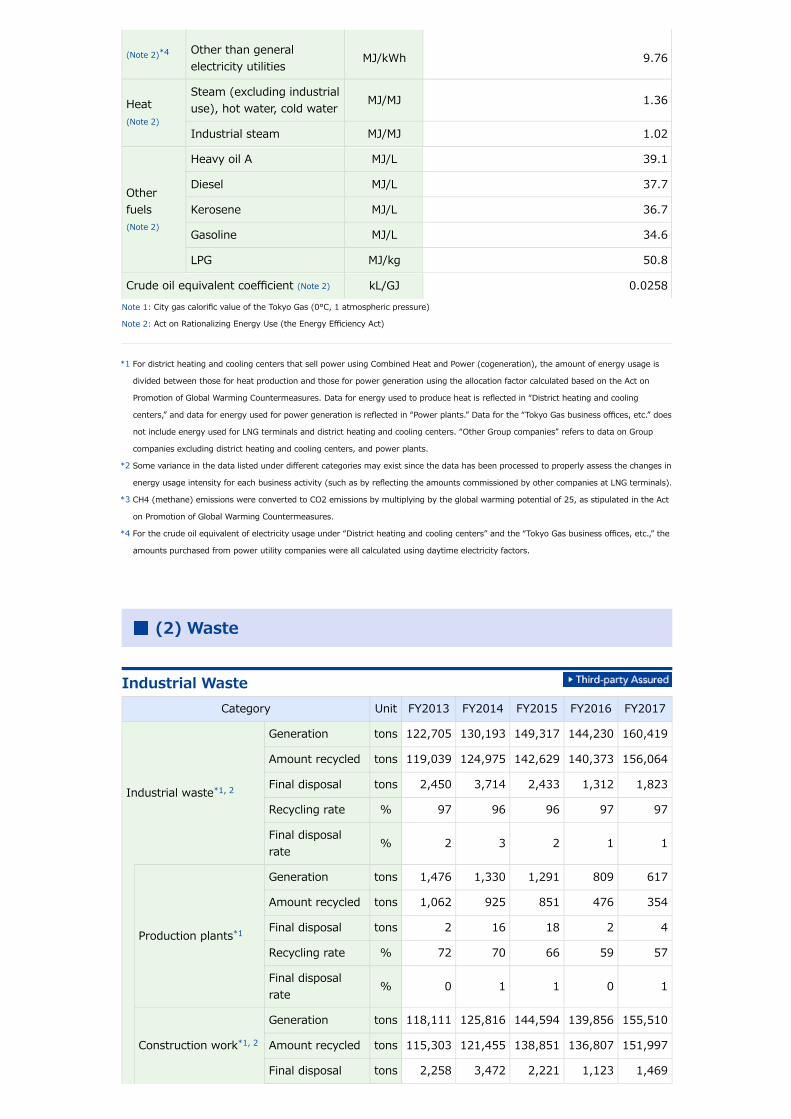
(Note 2)*4 Other than generalelectricity utilities MJ/kWh 9.76
Heat(Note 2)
Steam (excluding industrialuse), hot water, cold water MJ/MJ 1.36
Industrial steam MJ/MJ 1.02
Otherfuels(Note 2)
Heavy oil A MJ/L 39.1
Diesel MJ/L 37.7
Kerosene MJ/L 36.7
Gasoline MJ/L 34.6
LPG MJ/kg 50.8
Crude oil equivalent coefficient (Note 2) kL/GJ 0.0258Note 1: City gas calorific value of the Tokyo Gas (0°C, 1 atmospheric pressure)
Note 2: Act on Rationalizing Energy Use (the Energy Efficiency Act)
*1 For district heating and cooling centers that sell power using Combined Heat and Power (cogeneration), the amount of energy usage is
divided between those for heat production and those for power generation using the allocation factor calculated based on the Act on
Promotion of Global Warming Countermeasures. Data for energy used to produce heat is reflected in “District heating and cooling
centers,” and data for energy used for power generation is reflected in “Power plants.” Data for the “Tokyo Gas business offices, etc.” does
not include energy used for LNG terminals and district heating and cooling centers. “Other Group companies” refers to data on Group
companies excluding district heating and cooling centers, and power plants.
*2 Some variance in the data listed under different categories may exist since the data has been processed to properly assess the changes in
energy usage intensity for each business activity (such as by reflecting the amounts commissioned by other companies at LNG terminals).
*3 CH4 (methane) emissions were converted to CO2 emissions by multiplying by the global warming potential of 25, as stipulated in the Act
on Promotion of Global Warming Countermeasures.
*4 For the crude oil equivalent of electricity usage under “District heating and cooling centers” and the “Tokyo Gas business offices, etc.,” the
amounts purchased from power utility companies were all calculated using daytime electricity factors.
(2) Waste
Industrial WasteCategory Unit FY2013 FY2014 FY2015 FY2016 FY2017
Industrial waste*1, 2
Generation tons 122,705 130,193 149,317 144,230 160,419
Amount recycled tons 119,039 124,975 142,629 140,373 156,064
Final disposal tons 2,450 3,714 2,433 1,312 1,823
Recycling rate % 97 96 96 97 97
Final disposalrate % 2 3 2 1 1
Production plants*1
Generation tons 1,476 1,330 1,291 809 617
Amount recycled tons 1,062 925 851 476 354
Final disposal tons 2 16 18 2 4
Recycling rate % 72 70 66 59 57
Final disposalrate % 0 1 1 0 1
Construction work*1, 2
Generation tons 118,111 125,816 144,594 139,856 155,510
Amount recycled tons 115,303 121,455 138,851 136,807 151,997
Final disposal tons 2,258 3,472 2,221 1,123 1,469

Industrial Waste (All) Industrial Waste (Production Plants)
Industrial Waste (Construction Work) Industrial Waste (Business Offices, etc.)
Recycling rate % 98 97 96 98 98
Final disposalrate % 2 3 2 1 1
Business offices,etc.*1
Generation tons 3,118 3,046 3,431 3,565 4,292
Amount recycled tons 2,674 2,595 2,926 3,090 3,713
Final disposal tons 190 226 194 187 350
Recycling rate % 86 85 85 87 86
Final disposalrate % 6 7 6 5 8
Tokyo Gas Co., Ltd.
Generation tons 4,137 4,430 4,462 4,449 5,950
Amount recycled tons 3,647 3,719 3,629 3,701 4,638
Final disposal tons 194 360 431 389 981
Recycling rate % 88 84 81 83 78
Final disposalrate % 5 8 10 9 16
Results by Major Sites (FY2017)
LNG terminals (Negishi, Sodegaura, Ohgishima, Hitachi)
Category Generation(tons)
Amountrecycled(tons)
Finaldisposal(tons)
Recyclingrate (%)
Finaldisposalrate (%)
Sludge 125.3 23.5 0.0 18.8 0.0
Scrap metal 10.6 10.6 0.0 99.9 0.1
Waste oil 6.3 6.0 0.0 94.9 0.1

Waste plastics 12.4 8.2 0.1 65.8 0.4
Specially controlled industrial waste 1.3 0.3 0.0 22.7 0.0
Other 0.7 0.4 0.0 56.7 0.3
Total 156.5 48.8 0.1 31.2 0.0
District Heating and Cooling Centers
Category Generation(tons)
Amountrecycled(tons)
Finaldisposal(tons)
Recyclingrate (%)
Finaldisposalrate (%)
Sludge 17.9 7.6 2.8 42.2 15.4
Scrap metal 26.3 26.3 0.0 100.0 0.0
Waste oil 13.4 12.1 1.1 90.0 7.9
Waste plastics 8.8 8.8 0.0 100.0 0.0
Other 2.8 2.8 0.0 100.0 0.0
Total 69.3 57.5 3.8 83.1 5.5
Waste from Construction Work*2
Category Generation(tons)
Amountrecycled(tons)
Final disposal(tons)
Recyclingrate (%)
Finaldisposalrate (%)
Debris 82,346 81,175 637 98.6 0.8
Sludge 2,905 1,412 132 48.6 4.6
Scrap metal 1,932 1,924 4 99.6 0.2
Woodchips 432 397 32 91.7 7.5
Waste plastics 832 668 149 80.3 17.9
Glass, concrete, ceramic waste 59,927 59,605 320 99.5 0.5
Paper waster 195 183 12 93.7 6.1
Other 6,941 6,635 181 95.6 2.6
Total 155,510 151,997 1,469 97.7 0.9
Business Offices, etc.*1
CategoryGeneration
(tons)
Amountrecycled(tons)
Final disposal(tons)
Recyclingrate (%)
Finaldisposalrate (%)
Scrap metal 1,090 1,077 11 98.8 1.0
Waste plastics 1,389 1,163 214 83.7 15.4
Waste oil 349 346 2 99.2 0.5
Sludge 352 101 59 28.8 16.8
Glass, concrete, ceramic waste 162 126 36 77.7 22.3
Debris 76 68 8 89.1 10.1
Other 874 832 21 95.2 2.4
Total 4,292 3,713 350 86.5 8.2
*1 Data for “Production plants” include that from business offices that produce city gas and other products, district heating and cooling
centers, and power plants. Data for “Construction work” are for construction taken on by Group companies as original contractors. Data
for “Business offices, etc.” include all data other than that from “Production plants” and “Construction work.”
*2 Including construction work for customers of our subsidiaries and affiliates.
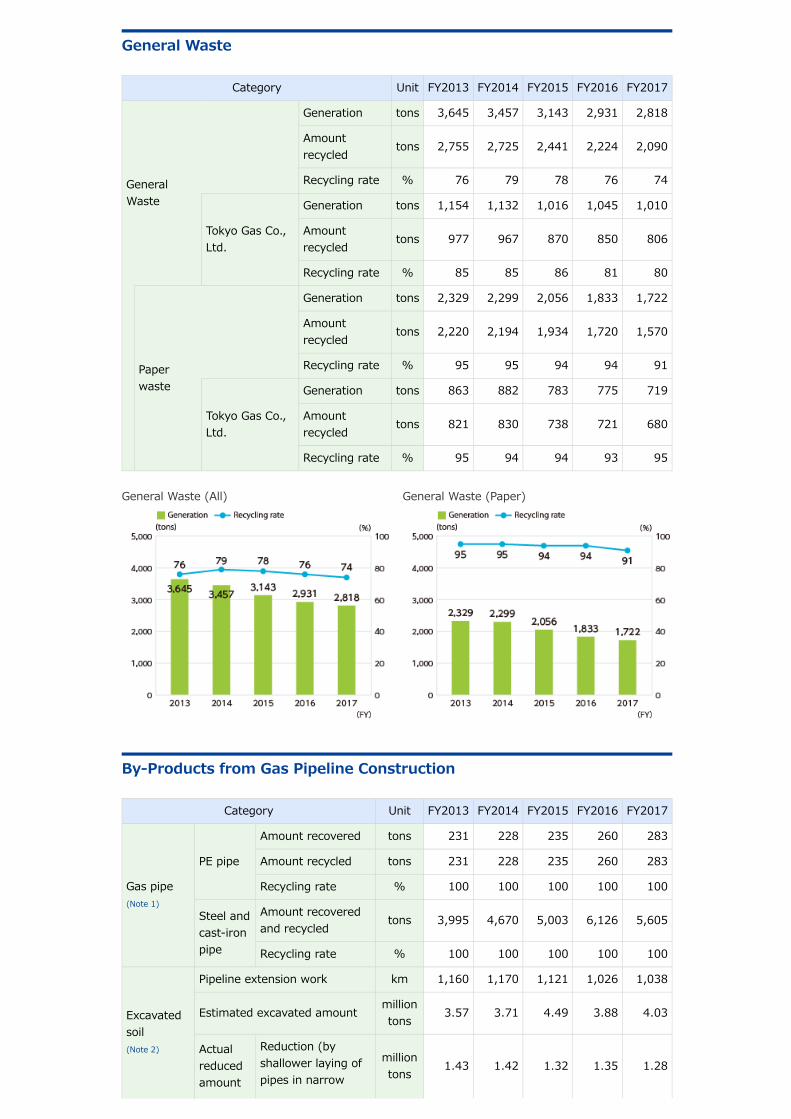
General Waste (All) General Waste (Paper)
General Waste
Category Unit FY2013 FY2014 FY2015 FY2016 FY2017
GeneralWaste
Generation tons 3,645 3,457 3,143 2,931 2,818
Amountrecycled tons 2,755 2,725 2,441 2,224 2,090
Recycling rate % 76 79 78 76 74
Tokyo Gas Co.,Ltd.
Generation tons 1,154 1,132 1,016 1,045 1,010
Amountrecycled tons 977 967 870 850 806
Recycling rate % 85 85 86 81 80
Paperwaste
Generation tons 2,329 2,299 2,056 1,833 1,722
Amountrecycled tons 2,220 2,194 1,934 1,720 1,570
Recycling rate % 95 95 94 94 91
Tokyo Gas Co.,Ltd.
Generation tons 863 882 783 775 719
Amountrecycled tons 821 830 738 721 680
Recycling rate % 95 94 94 93 95
By-Products from Gas Pipeline Construction
Category Unit FY2013 FY2014 FY2015 FY2016 FY2017
Gas pipe(Note 1)
PE pipe
Amount recovered tons 231 228 235 260 283
Amount recycled tons 231 228 235 260 283
Recycling rate % 100 100 100 100 100
Steel andcast-ironpipe
Amount recoveredand recycled tons 3,995 4,670 5,003 6,126 5,605
Recycling rate % 100 100 100 100 100
Excavatedsoil(Note 2)
Pipeline extension work km 1,160 1,170 1,121 1,026 1,038
Estimated excavated amount milliontons 3.57 3.71 4.49 3.88 4.03
Actualreducedamount
Reduction (byshallower laying ofpipes in narrow
milliontons 1.43 1.42 1.32 1.35 1.28

trenches and non-open-cut method)
Reuse (generatedsoil)
milliontons 0.49 0.52 0.84 0.62 0.61
Recycle (improvedsoil, regenerationtreatment)
milliontons 1.1 1.15 1.33 1.27 1.27
Total reductionamount
milliontons 3.02 3.09 3.49 3.24 3.16
Rate of reductionamount(comparison toestimatedexcavated amount)
% 84 83 78 83 79
Residual soil (actual amount) milliontons 0.55 0.62 1.0 0.64 0.86
Rate of residual soil(comparison to estimatedexcavated amount)
% 16 17 22 17 21
Tokyo GasCo., Ltd.(Note 2)
Pipeline extension work km 1,064 1,065 1,020 973 1,003
Estimated excavated amount milliontons 3.33 3.47 4.25 3.75 3.94
Actualreducedamount
Reduction (byshallower laying ofpipes in narrowtrenches and non-open-cut method)
milliontons 1.36 1.35 1.25 1.31 1.24
Reuse (generatedsoil)
milliontons 0.45 0.47 0.79 0.61 0.61
Recycle (improvedsoil, regenerationtreatment)
milliontons 1.07 1.12 1.31 1.26 1.25
Total reductionamount
milliontons 2.89 2.94 3.35 3.18 3.10
Rate of reductionamount(comparison toestimatedexcavated amount)
% 87 85 79 85 78
Residual soil (actual amount) milliontons 0.45 0.52 0.90 0.57 0.85
Rate of residual soil(comparison to estimatedexcavated amount)
% 13 15 21 15 22
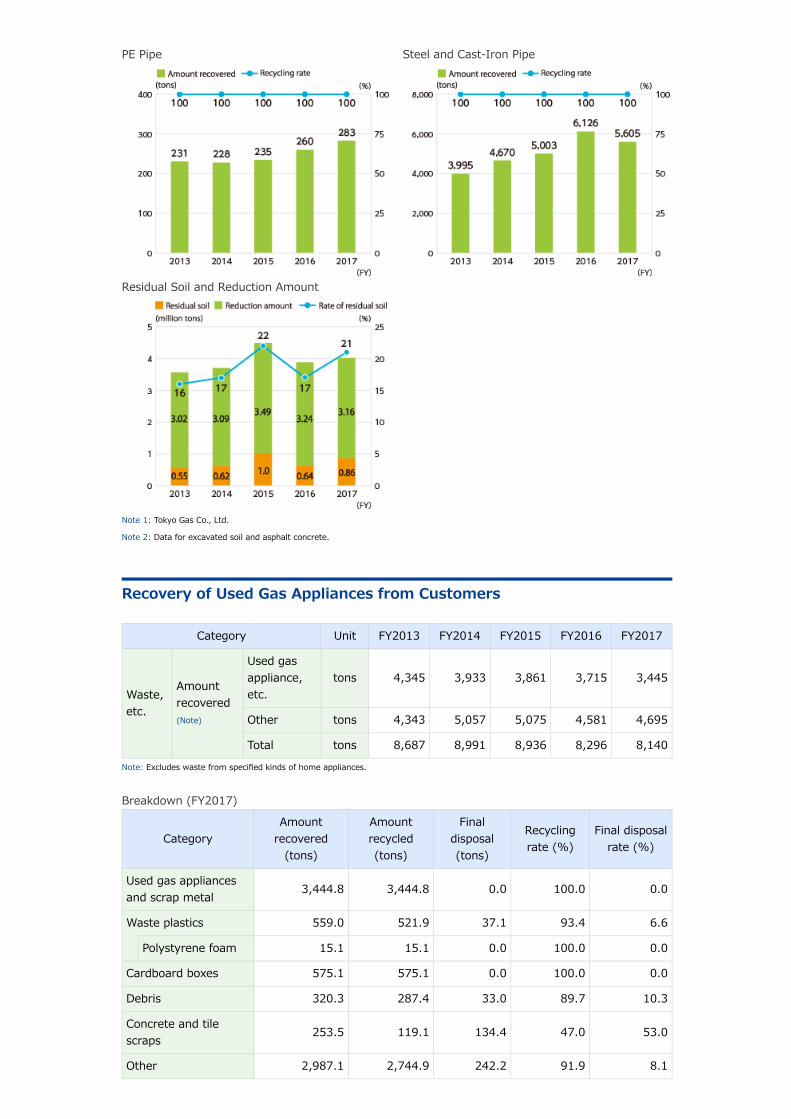
PE Pipe Steel and Cast-Iron Pipe
Residual Soil and Reduction Amount
Note 1: Tokyo Gas Co., Ltd.
Note 2: Data for excavated soil and asphalt concrete.
Recovery of Used Gas Appliances from Customers
Category Unit FY2013 FY2014 FY2015 FY2016 FY2017
Waste,etc.
Amountrecovered(Note)
Used gasappliance,etc.
tons 4,345 3,933 3,861 3,715 3,445
Other tons 4,343 5,057 5,075 4,581 4,695
Total tons 8,687 8,991 8,936 8,296 8,140
Note: Excludes waste from specified kinds of home appliances.
Breakdown (FY2017)
CategoryAmount
recovered(tons)
Amountrecycled(tons)
Finaldisposal(tons)
Recyclingrate (%)
Final disposalrate (%)
Used gas appliancesand scrap metal 3,444.8 3,444.8 0.0 100.0 0.0
Waste plastics 559.0 521.9 37.1 93.4 6.6
Polystyrene foam 15.1 15.1 0.0 100.0 0.0
Cardboard boxes 575.1 575.1 0.0 100.0 0.0
Debris 320.3 287.4 33.0 89.7 10.3
Concrete and tilescraps 253.5 119.1 134.4 47.0 53.0
Other 2,987.1 2,744.9 242.2 91.9 8.1

Our environmental protection costs in fiscal 2017 totaled 5.7 billion yen, a decrease of 1.7 billionyen from the previous fiscal year.Investments totaled 970 million yen, down 1.78 billion yen from the previous year due in part to ourpassing the peak investment phase for the Toyosu Smart Energy Center.Expenses totaled 4.72 billion yen, an increase of 70 million yen from the previous fiscal year. Theeconomic effect totaled 11.09 billion yen, a decrease of 1.39 billion yen from the previous fiscal yearattributable mainly to decreased cost savings resulting from a reduction in excavated soil.
Environmental Accounting of Tokyo Gas on a Non-Consolidated Basis (FY2017 Results)Period: April 2017 to March 2018Boundary: Tokyo Gas Co., Ltd.Standard of reference: Environmental Accounting Guidelines 2005 issued by Japanʼs Ministry of theEnvironment, and “Manual for the Introduction of Environmental Accounting in City Gas Business”prepared by the Japan Gas Association
Environmental Protection Costs(Unit: million yen)
Categories ofEnvironmental
Protection CostsInvestment Expenses Difference
Major items (examples)FY
2016FY
2017FY
2016FY
2017Investment Expenses
Companybusiness
Pollutionprevention
Capital investment,maintenanceexpenses,depreciation costs,personnel expenses,etc., for preventionof air pollution,water pollution,noise pollution, etc.
515 40 380 479 -475 99
Globalenvironmentalprotection
Capital investment,maintenanceexpenses,depreciation costs,personnel expenses,etc., for energyconservation,effective use ofenergy, protection ofthe ozone layer, etc.
1,653 381 674 608 -1,273 -66
Resourcerecycling
Capital investment,maintenanceexpenses,depreciation costs,personnel expenses,etc., forreduction/recyclingof excavated soil,waste control, etc.
8 5 454 369 -3 -86
Total 8,139.7 7,693.2 446.5 94.5 5.1
(3) Environmental Accounting

Environmentalmanagement
Costs for greenpurchasing,environmentaleducation,development andoperation of theEnvironmentalManagementSystem,environmentalorganizations, etc.
0 0 313 305 0 -8
Other
Costs associatedwith greenificationand soilrehabilitation inaccordance with theFactory Location Actand ordinances
42 10 526 466 -32 -60
Customersites
EnvironmentalR&D
Costs for researchand development oftechnologies tominimizeenvironmentalimpact and high-efficiency appliancesand systems
514 469 1,029 1,374 -46 345
Recycling ofused gasappliances
Costs of recoveryand recycling of soldgas appliances,packaging, etc.
0 0 8 7 0 0
Socialactionprograms
Voluntary greenification, landscapeconservation, nature conservation,beautification, support of localenvironmental activities,environmental advertising, disclosureof environmental information
17 69 1,258 1,108 52 -150
Total 2,750 973 4,642 4,716 -1,777 74Note: Since decimal places have been rounded off to the nearest whole number, the calculated total and amount of increase or decrease
may not match.
”Expenses” include depreciation costs of 721 million yen in fiscal 2016 and 652 million yen in fiscal 2017. Since the costs for
environmental R&D are extracted from those for environmental protection, they may differ from the figures stated in the financial
report. Capital investment by Tokyo Gas Co., Ltd. (non-consolidated basis) was 165.4 billion yen, while the sales volume was 1,598.9
billion yen.
Main differences from the previous fisical year:• Pollution prevention
The decrease in investment was due mainly to decreased investment by the productiondepartment.
• Global environmental protectionThe decrease in investment was due mainly in part to our passing the peak investment phasefor the Toyosu Smart Energy Center.

Level of Environmental Burden
Level of Environmental Burden
Category FY2016 FY2017
Companybusiness
Pollution prevention
NOX (Plants) mg/m3 0.5 0.5
NOX (district heating and coolingcenters) g/GJ 7.1 6.6
COD (Plants) mg/m3 0.0 0.0
Global environmentalprotection
Energy usage intensity (plants)GJ/million m3 206 209
Heat sales intensity (district heatingand cooling centers) GJ/GJ 2.0 2.0
Energy usage (business offices) TJ 938 902
Resource recycling
Excavated soil (thousand tons) 573 846
Industrial waste (tons) 4,449 5,950
General waste (tons) 1,045 1,010
Customersites
Environmental R&D(Reference figures)CO2 emissions reduction (milliontons-CO2)
394 404
Recycling of used gasappliances
(Reference figures)Recovery of used gas appliances andscrap metal by SRIMS (tons)
3,715 3,445
Note: The level of environmental burden is based on environmental performance data.
Economic Effect(Unit: million yen)
Economic effect FY2016 FY2017 Difference
Cost reduction from the operation of energy-saving equipment 482 532 50
Cost reduction from a reduction in the amount of excavated soil 11,664 10,222 -1,442
Sale of valuables 277 309 32
Other (cost reduction from water conservation) 57 29 -28
Total 12,480 11,092 -1,388
Note: The total and difference figures may not be equal to actual calculation results because the numbers are rounded off to the nearest
integer.
Main differences from the previous fisical year: • Economic effect
The economic effect decreased from the previous fiscal year due mainly to lower cost savingsresulting from reductions in excavated soil.
Compliance with Local Government Ordinances on theEnvironment and Energy
Tokyo Gas prepares and publishes the following plans and reports in accordance with the ordinancesof local authorities.
Tokyo
Global Warming Action Plan (Large Establishments)• FY2018 Hamamatsucho (Head Office) Building• FY2018 Senju Techno Station
• Global Warming Action Report (Small/Medium-Sized Establishments)
Environmental Energy Reporting Program• Energy Status Reports• Environmental Energy Plans
Saitama Pref. FY2018 Global Warming Action Plan Report
Kanagawa Pref. FY2018 Report on Results of Action against Global Warming in Business
Yokohama City FY2018 Report on State of Action against Global Warming
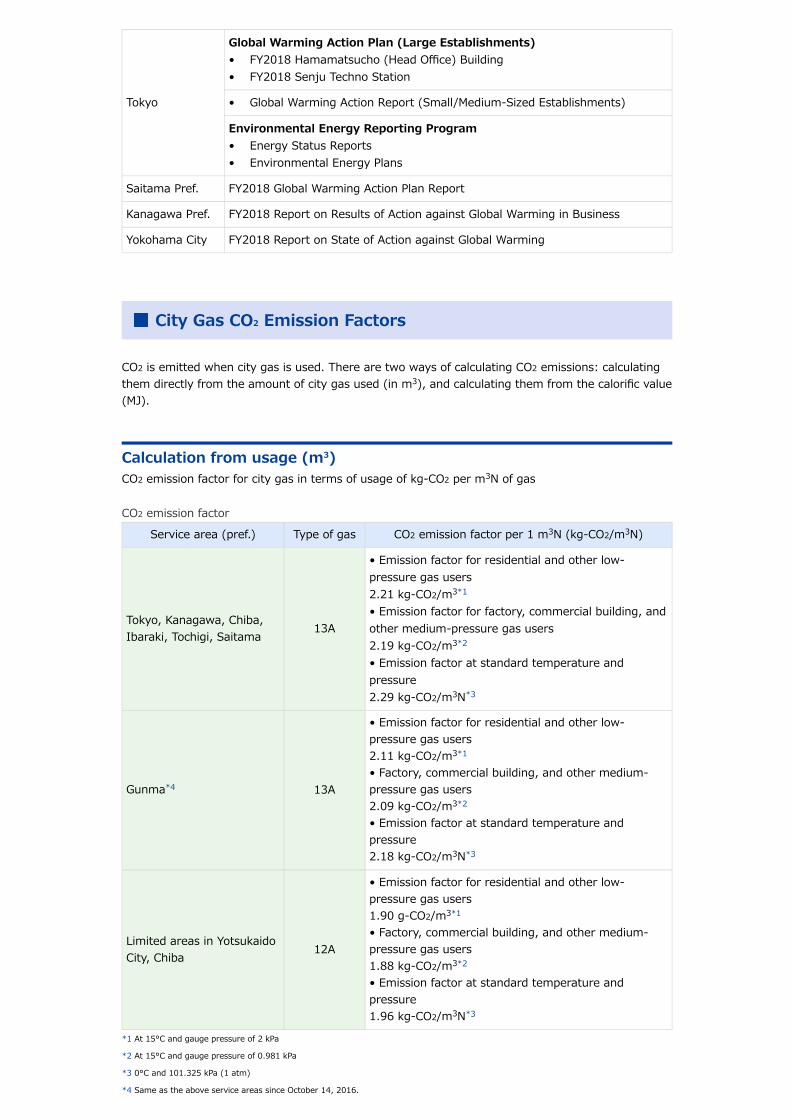
City Gas CO2 Emission Factors
CO2 is emitted when city gas is used. There are two ways of calculating CO2 emissions: calculatingthem directly from the amount of city gas used (in m3), and calculating them from the calorific value(MJ).
Calculation from usage (m3)CO2 emission factor for city gas in terms of usage of kg-CO2 per m3N of gas
CO2 emission factor
Service area (pref.) Type of gas CO2 emission factor per 1 m3N (kg-CO2/m3N)
Tokyo, Kanagawa, Chiba,Ibaraki, Tochigi, Saitama 13A
• Emission factor for residential and other low-pressure gas users2.21 kg-CO2/m3*1
• Emission factor for factory, commercial building, andother medium-pressure gas users2.19 kg-CO2/m3*2
• Emission factor at standard temperature andpressure2.29 kg-CO2/m3N*3
Gunma*4 13A
• Emission factor for residential and other low-pressure gas users2.11 kg-CO2/m3*1
• Factory, commercial building, and other medium-pressure gas users2.09 kg-CO2/m3*2
• Emission factor at standard temperature andpressure2.18 kg-CO2/m3N*3
Limited areas in YotsukaidoCity, Chiba
12A
• Emission factor for residential and other low-pressure gas users1.90 g-CO2/m3*1
• Factory, commercial building, and other medium-pressure gas users1.88 kg-CO2/m3*2
• Emission factor at standard temperature andpressure1.96 kg-CO2/m3N*3
*1 At 15°C and gauge pressure of 2 kPa
*2 At 15°C and gauge pressure of 0.981 kPa
*3 0°C and 101.325 kPa (1 atm)
*4 Same as the above service areas since October 14, 2016.

Calculation from calorific value (MJ)CO2 emission factor for city gas in terms of kg-CO2 per MJ of gasOr CO2 emission factor for city gas in terms of kg-C per MJ of gas
Unit calorific values and CO2 emission factors
Service area (pref.) Type of gas
Calorific valueper 1 m3NMJ/m3N(kcal/m3N)
CO2 emissionfactor per 1 MJ ofcalorific value(kg-CO2/MJ)
C emissionfactor per 1 MJof calorific value(kg-C/MJ)
Tokyo, Kanagawa, Chiba,Ibaraki, Tochigi, Saitama 13A 45 (10,750) 0.0509 0.0139
Gunma* 13A 43.14 (10,306) 0.0506 0.0138
Limited areas in YotsukaidoCity, Chiba 12A 38.52 (9,200) 0.0509 0.0139
*Same as the above service areas since October 14, 2016.
For more details▶ Calculation of CO2 emission factors from proportional composition of city gas (PDF: 356KB)
Assessment of CO2 Emissions Reduction due to Reductionsin Purchased Electricity
Amount of Thermal Power Generation Varies According to ElectricityUsageIn Japan, the electricity supplied by electric utilities is generated primarily by thermal power, nuclearpower and hydroelectric power plants. Nuclear power plants operate at full capacity except whenundergoing a routine inspection, while the annual power output of hydroelectric power plants isdetermined by the amount of rainfall. The electricity supply is adjusted by operations at thermalpower plants. Therefore, in terms of total annual output, it is most likely to be thermal powergeneration that is cut when electricity use is reduced through energy-saving measures.
For more details▶ GHG Protocol Guidelines
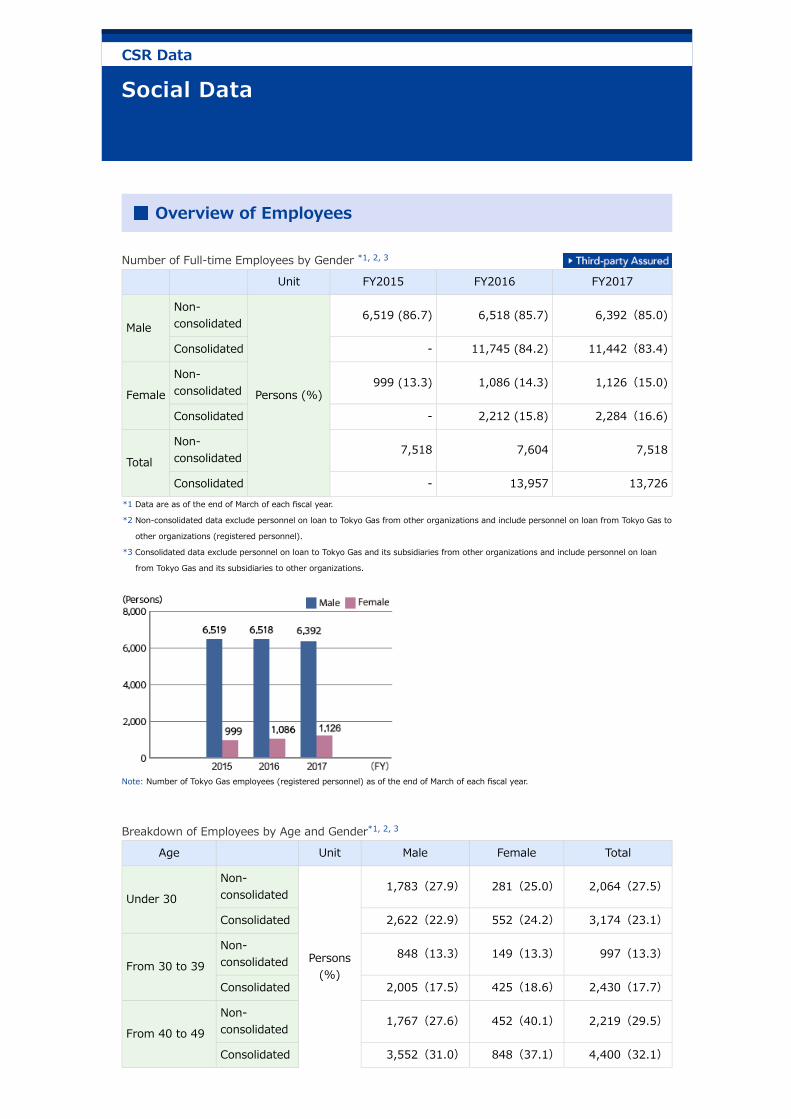
Overview of Employees
Number of Full-time Employees by Gender *1, 2, 3
Unit FY2015 FY2016 FY2017
Male
Non-consolidated
Persons (%)
6,519 (86.7) 6,518 (85.7) 6,392(85.0)
Consolidated - 11,745 (84.2) 11,442(83.4)
Female
Non-consolidated 999 (13.3) 1,086 (14.3) 1,126(15.0)
Consolidated - 2,212 (15.8) 2,284(16.6)
Total
Non-consolidated 7,518 7,604 7,518
Consolidated - 13,957 13,726*1 Data are as of the end of March of each fiscal year.
*2 Non-consolidated data exclude personnel on loan to Tokyo Gas from other organizations and include personnel on loan from Tokyo Gas to
other organizations (registered personnel).
*3 Consolidated data exclude personnel on loan to Tokyo Gas and its subsidiaries from other organizations and include personnel on loan
from Tokyo Gas and its subsidiaries to other organizations.
Note: Number of Tokyo Gas employees (registered personnel) as of the end of March of each fiscal year.
Breakdown of Employees by Age and Gender*1, 2, 3
Age Unit Male Female Total
Under 30
Non-consolidated
Persons(%)
1,783(27.9) 281(25.0) 2,064(27.5)
Consolidated 2,622(22.9) 552(24.2) 3,174(23.1)
From 30 to 39
Non-consolidated 848(13.3) 149(13.3) 997(13.3)
Consolidated 2,005(17.5) 425(18.6) 2,430(17.7)
From 40 to 49
Non-consolidated 1,767(27.6) 452(40.1) 2,219(29.5)
Consolidated 3,552(31.0) 848(37.1) 4,400(32.1)
CSR Data

From 50 to 59
Non-consolidated 1,925(30.1) 241(21.4) 2,166(28.8)
Consolidated 3,143(27.5) 452(19.8) 3,595(26.2)
60 and over
Non-consolidated 69(1.1) 3(0.2) 72(1.0)
Consolidated 120(1.0) 7(0.3) 127(0.9)
Total
Non-consolidated 6,392 1,126 7,518
Consolidated 11,442 2,284 13,726*1 Data are as of the end of March 2018.
*2 Non-consolidated data are for Tokyo Gas employees (registered personnel).
*3 Consolidated data exclude personnel on loan to Tokyo Gas and its subsidiaries from other organizations and include personnel on loan
from Tokyo Gas and its subsidiaries to other organizations.
Average Age by Gender *1, 2, 3
Unit FY2015 FY2016 FY2017
Male
Non-consolidated
Age
42.1 41.4 40.7
Consolidated - 41.8 41.2
Female
Non-consolidated 41.6 41.1 40.6
Consolidated - 39.9 40.0*1 Data are as of the end of March of each fiscal year.
*2 Non-consolidated data are for Tokyo Gas employees (registered personnel).
*3 Consolidated data exclude personnel on loan to Tokyo Gas and its subsidiaries from other organizations and include personnel on loan
from Tokyo Gas and its subsidiaries to other organizations.
*Number of Tokyo Gas employees (registered personnel) are as of the end of March of each fiscal year.
Average Length of Employment by Gender *1, 2, 3
Unit FY2015 FY2016 FY2017
Male
Non-consolidated
Age
21.1 19.7 19.3
Consolidated - 17.1 16.7
Female
Non-consolidated 19.9 18.7 19.3
Consolidated - 14.4 14.7*1 Data are as of the end of March of each fiscal year.
*2 Non-consolidated data are for Tokyo Gas employees (registered personnel).
*3 Consolidated data exclude personnel on loan to Tokyo Gas and its subsidiaries from other organizations and include personnel on loan
from Tokyo Gas and its subsidiaries to other organizations.

*Number of Tokyo Gas employees (registered personnel) are as of the end of March of each fiscal year.
Ratio of Women in Management*1, 2
*1 Number of Tokyo Gas employees (registered personnel) are as of April 1 of each fiscal year.
*2 Employees in supervisory positions, or employees of equivalent status.
Hiring of New Graduates *1, 2
Unit
Breakdown ofFY2016 Hires
Breakdown ofFY2017 Hires
Breakdown ofFY2018 Hires
Male Female Male Female Male Female
Undergraduateand Graduate*3
Non-consolidated
Persons
156 51 167 53 126 60
Consolidated - - - - 218 126
High School
Non-consolidated
74 10 27 4 18 2
Consolidated - - - - 62 11
Total
Non-consolidated
230 61 194 57 144 62
Consolidated - - - - 280 137*1 Data are as of April 1 of each fiscal year.
*2 Non-consolidated data are for Tokyo Gas employees (registered personnel).
*3 Including technical college graduates.
Hiring of Mid-Career Personnel*1, 2
Unit May 2015 toApril 2016
May 2016 toApril 2017
May 2017 toApril 2018
Male
Non-consolidated
Persons
5 12 12
Consolidated - - 231
Female
Non-consolidated 0 2 1
Consolidated - - 73

Total
Non-consolidated 5 14 13
Consolidated - - 304*1 Data includes contract employees who became regular employees.
*2 Non-consolidated data are for Tokyo Gas employees (registered personnel).
Hiring of People with Disabilities *1, 2, 3
Unit March 2016 March 2017 March 2018
Number ofpersons hired(percentage oftotal employees)
Persons(%) 137 (2.00) 153 (2.10) 150 (2.10)
*1 Data are for regular and contract employees at Tokyo Gas.
*2 Figures are as of the first day of the month shown for each fiscal year.
*3 Figure has risen to 167 people, or 2.35% of the workforce, as of June 2018.
State of Reemployment after Mandatory Retirement
Unit FY2015 FY2016 FY2017
Total number of retired employees*1 Persons 319 348 273
Number of reemployed*2
Tokyo Gas*3
Persons(%)
241(75.5) 251(72.1) 203(74.4)
Subsidiaries 26(8.2) 42(12.1) 46(16.8)
Total 267(83.7) 293 249(91.2)
*1 Number of employees who left the company at the mandatory retirement age of 60.
*2 Number of people hired as “career employees” (contract employees rehired after reaching mandatory retirement age).
*3 Data are for Tokyo Gas on a non-consolidated basis.
Major Programs and Number of Users *1
Programs Outline Item UnitFY2015 FY2016 FY2017
Male Female Male Female Male Female
Parentalleave
Until the end ofApril immediatelyfollowing thechildʼs 3rd birthday
Number ofusers Persons 2 83 2 65 5 45
Percentagereturningto work*2
% 100 100 100 100 100 92
Shorterhours forparents ofsmallchildren
Flextime programavailable duringpregnancy anduntil the childcompletes the 6thgrade
Number ofusers Persons 213 3 224 3 214
Nursingcare leave
Up to 3 years toprovide care for arelative within thesecond degree ofkinship
Number ofusers Persons 3 0 4 0 1
Nursingcare work
Flextime programavailable up to 3years to providecare for a relativewithin the seconddegree of kinship
Number ofusers Persons 0 0 3 0 2
Leave toaccompanypartner
For employeesaccompanying aspouse posted
Number ofusers Persons 4 4 3

overseas
Communityserviceleave
Special paid leavefor up to 5 dayswithin 1 year
Cumulativenumber ofusers
Persons 88 48 58
Sabbaticalsystem
Commemorativegift and paid leavefor employees whoreach the ages of30, 35, 40 and 50
Number ofusers Persons 594 514 673
*1 Data are for Tokyo Gas on a non-consolidated basis.
*2 Percentage of employees taking parental leaves each fiscal year who returned to work at the company
Number of Employees Leaving the Company *1, 2
Unit FY2015 FY2016 FY2017
Male(Percentage of employeesleaving the company)
Non-consolidated
Persons(%)*3
36(0.52) 58(0.86) 29(0.43)
Consolidated -(-) -(-) 206(-)
Female (Percentage of employeesleaving the company)
Non-consolidated 9 (0.89) 9(0.85) 9 (0.79)
Consolidated -(-) -(-) 112(-)
Total(Percentage of employeesleaving the company)
Non-consolidated 45(0.57) 67(0.86) 38(0.49)
Consolidated -(-) -(-) 318(-)
*1 Non-consolidated data are for Tokyo Gas employees (registered personnel).
*2 Consolidated data exclude personnel on loan to Tokyo Gas and its subsidiaries from other organizations and include personnel on loan
from Tokyo Gas and its subsidiaries to other organizations.
*3 The percentage of people leaving the company is calculated as follows: number of regular employees leaving for personal reasons (as of
March 31 of each fiscal year)/number of regular employees (as of April 1 of each fiscal year).
Number of Temporary and Contract Employees *1, 2
Unit FY2016 FY2017 FY2018
Contractemployees
Persons(%)
1,608 (16.0) 1,728 1,670
Male 1,067 (10.6) 1,153 1,131
Female 541 (5.4) 575 539
Temporary employees 652 (6.5) 642 558
Total 2,260 (22.5) 2,370 2,228
Grand total (regular employees +sum of above) 10,048 10,195 9,746
*1 Data are as of April 1 of each fiscal year.
*2 Percentage figures show the ratio to grand total (total number of employees of Tokyo Gas as of April 1 of each fiscal year).
Average Annual Salary*
Unit FY2015 FY2016 FY2017
Average annual salary 10,000 yen 649 640 636
*Figures exclude the salary of personnel in management positions.
Average Overtime Hours
Unit FY2015 FY2016 FY2017
Average monthly overtime hours Hours/person 16.1 16.6 15.9
Days of Paid Leave Taken per Year
Unit FY2015 FY2016 FY2017
Days of paid leave taken per year Days/person 15.2 15.5 15.1

Number of Employees with Right to Collective Bargaining (Employees Excluding Management)*
Unit FY2015 FY2016 FY2017
Number of employees Persons 7,313 7,199 6,937
*Data are as of April 1 of each fiscal year.
Average Annual Training Hours*
Unit FY2015 FY2016 FY2017
Average annual training hours Hours/person 15.8 18.2 13.5
*Data on training provided by the Personnel Department (excludes training provided independently by other departments).
Implementation of Occupational Safety and HealthEducation Programs
Implementation of Occupational Safety and Health Education Programs
Details Unit FY2015 FY2016 FY2017
Level-specific training on safety andhealth and on safety planning
New employeetraining
Persons
298 291 252
Safety and healthtraining fornew managers
165 306 243
Risk management seminar on safety and health (generalmanager level) 360 390 476
Statutory foreman training 172 156 151
Statutory training for safety administrators at the time ofappointment 51 41 36
Hygiene supervisor training 85 75 74
Traffic safety and driving training (for new drivers, personsinvolved in accidents and others) 904 898 789
Safe driving with attendant instructors utilizing drive recorders 599 795 798
Seminars on promoting health 3,347 2,510 2,731
Overview of Accidents and Injuries
Change in Number of Work-related Injuries, Number of Traffic Accidents, Rate of Lost Work-timeInjuries, and Severity Rate*1
Unit FY2015 FY2016 FY2017
Work-related injuries*2
Cases28 23 38
Traffic accidents 110 141 134
Rate of lost work-time injuries*3, 5
-0.49 0.41 0.36
Severity rate*4, 5, 6 0.007 0.003 0.002
*1 Data are for regular and semi-regular employees of Tokyo Gas.
*2 Includes accidents not resulting in lost worktime.
*3 Rate of people taking work leave per 1 million total actual working hours.

*4 Number of workdays lost as a result of accidents/injuries per 1,000 total actual working hours.
*5 Includes injuries due to traffic accidents caused by others.
*6 Lost workdays are counted based on standards placed by the Japanese Ministry of Health, Labour and Welfare.
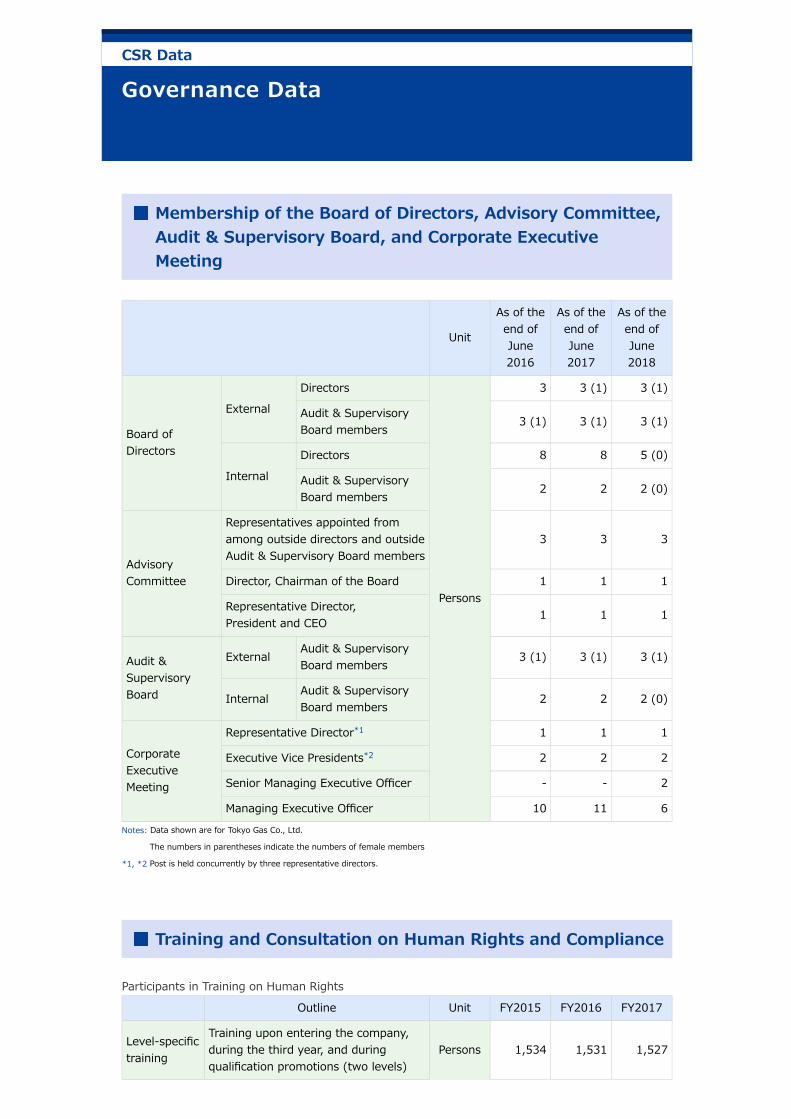
Membership of the Board of Directors, Advisory Committee,Audit & Supervisory Board, and Corporate ExecutiveMeeting
Unit
As of theend ofJune2016
As of theend ofJune2017
As of theend ofJune2018
Board ofDirectors
External
Directors
Persons
3 3 (1) 3 (1)
Audit & SupervisoryBoard members 3 (1) 3 (1) 3 (1)
Internal
Directors 8 8 5 (0)
Audit & SupervisoryBoard members 2 2 2 (0)
AdvisoryCommittee
Representatives appointed fromamong outside directors and outsideAudit & Supervisory Board members
3 3 3
Director, Chairman of the Board 1 1 1
Representative Director,President and CEO 1 1 1
Audit &SupervisoryBoard
External Audit & SupervisoryBoard members 3 (1) 3 (1) 3 (1)
InternalAudit & SupervisoryBoard members 2 2 2 (0)
CorporateExecutiveMeeting
Representative Director*1 1 1 1
Executive Vice Presidents*2 2 2 2
Senior Managing Executive Officer - - 2
Managing Executive Officer 10 11 6Notes: Data shown are for Tokyo Gas Co., Ltd.
The numbers in parentheses indicate the numbers of female members
*1, *2 Post is held concurrently by three representative directors.
Training and Consultation on Human Rights and Compliance
Participants in Training on Human Rights
Outline Unit FY2015 FY2016 FY2017
Level-specifictraining
Training upon entering the company,during the third year, and duringqualification promotions (two levels)
Persons 1,534 1,531 1,527
CSR Data
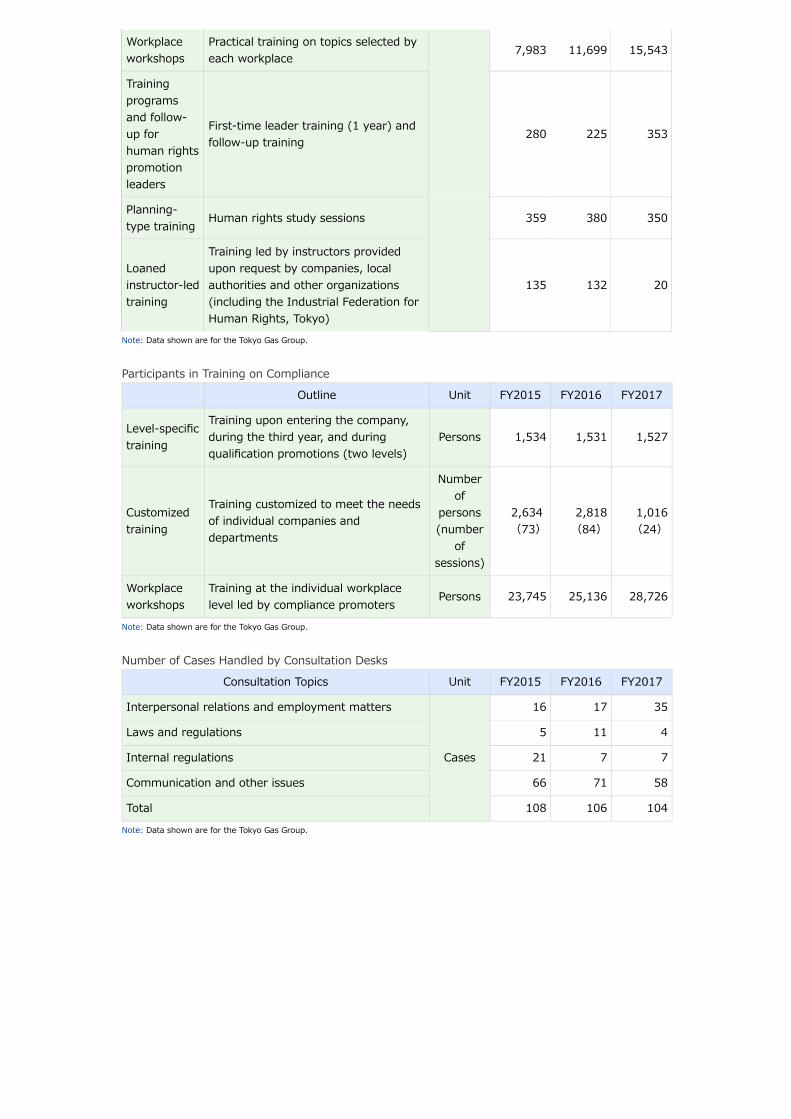
Workplaceworkshops
Practical training on topics selected byeach workplace 7,983 11,699 15,543
Trainingprogramsand follow-up forhuman rightspromotionleaders
First-time leader training (1 year) andfollow-up training 280 225 353
Planning-type training Human rights study sessions 359 380 350
Loanedinstructor-ledtraining
Training led by instructors providedupon request by companies, localauthorities and other organizations(including the Industrial Federation forHuman Rights, Tokyo)
135 132 20
Note: Data shown are for the Tokyo Gas Group.
Participants in Training on Compliance
Outline Unit FY2015 FY2016 FY2017
Level-specifictraining
Training upon entering the company,during the third year, and duringqualification promotions (two levels)
Persons 1,534 1,531 1,527
Customizedtraining
Training customized to meet the needsof individual companies anddepartments
Numberof
persons(number
ofsessions)
2,634 (73)
2,818(84)
1,016(24)
Workplaceworkshops
Training at the individual workplacelevel led by compliance promoters Persons 23,745 25,136 28,726
Note: Data shown are for the Tokyo Gas Group.
Number of Cases Handled by Consultation Desks
Consultation Topics Unit FY2015 FY2016 FY2017
Interpersonal relations and employment matters
Cases
16 17 35
Laws and regulations 5 11 4
Internal regulations 21 7 7
Communication and other issues 66 71 58
Total 108 106 104
Note: Data shown are for the Tokyo Gas Group.
Social Data Environmental Data
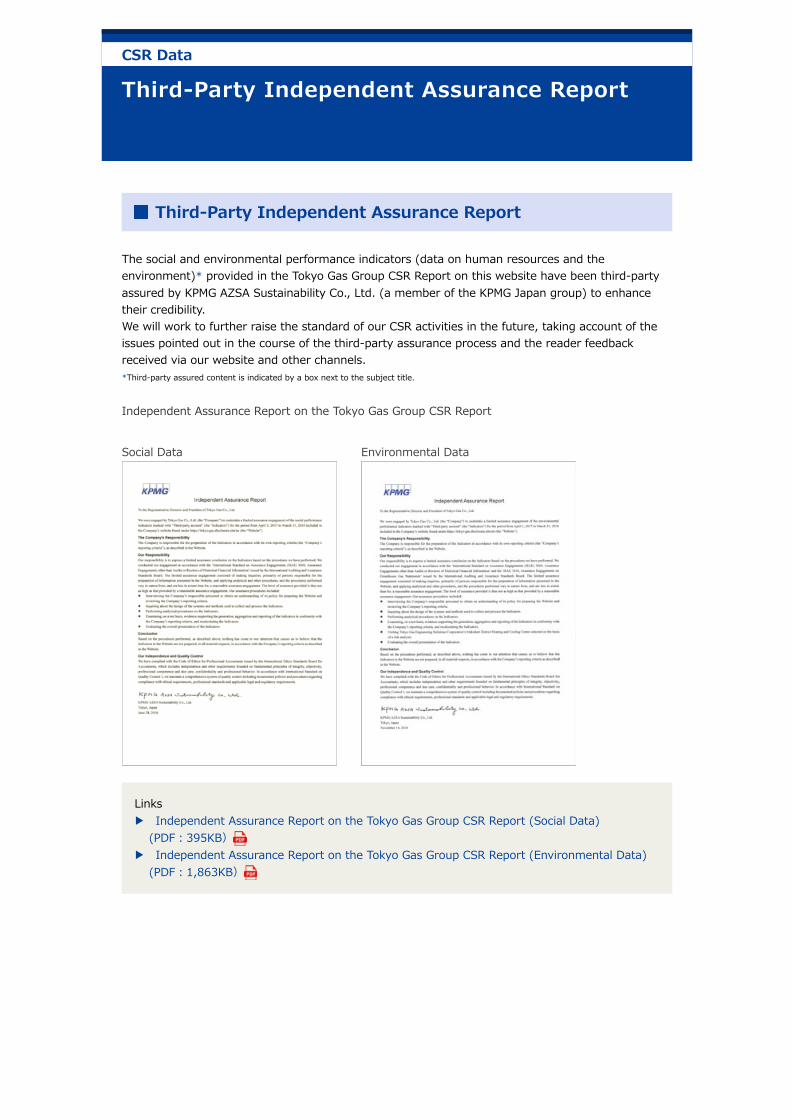
Third-Party Independent Assurance Report
The social and environmental performance indicators (data on human resources and theenvironment)* provided in the Tokyo Gas Group CSR Report on this website have been third-partyassured by KPMG AZSA Sustainability Co., Ltd. (a member of the KPMG Japan group) to enhancetheir credibility.We will work to further raise the standard of our CSR activities in the future, taking account of theissues pointed out in the course of the third-party assurance process and the reader feedbackreceived via our website and other channels.*Third-party assured content is indicated by a box next to the subject title.
Independent Assurance Report on the Tokyo Gas Group CSR Report
Links▶ Independent Assurance Report on the Tokyo Gas Group CSR Report (Social Data)
(PDF︓395KB)▶ Independent Assurance Report on the Tokyo Gas Group CSR Report (Environmental Data)
(PDF︓1,863KB)
CSR Data