the tioga group cigma
TRANSCRIPT

THE TIOGA GROUP
1
THE TIOGA GROUP
Tioga
DATE
CIGMA
Containerized Intermodal Goods Movement Assessment: 2008
An assessment of the issues and trends impacting th e transportation of containerized products throughout the logistic chain of N.A.
RON SUCIKTHE TIOGA GROUP
Presentation toSandhouse Gang
Northwestern University Transportation Center
Sept. 16, 2008
Tioga
2
CIGMA 2008Containerized Intermodal Goods Movement Assessment
Narvik, Norway
Vostochny, Russia
Hong Kong, China
Singapore
Rotterdam, Netherlands
Prince Rupert, Canada
SavannahNorfolk
New York
Los Angeles
Lazaro Cardenas
Punto Colonet
North China
HOUSTON Bombay
Sydney NS
Transportation Issues and Trends in the North American Logistic ChainTransportation Issues and Trends in the North American Logistic Chain

THE TIOGA GROUP
2
Tioga
3
So what is CIGMA & Why do the study?
• CIGMA is a composite assessment of the issues and t rends impacting the movement of containerized products in to North America.
• Every facet of the transportation chain deals with various issues and trends in their own best interest and th ese actions interrelate to other components of the transportation chain.
• These entities initiating the first actions are not cognizant of the effect their actions may have on the other e lements of the transportation chain.
Tioga
4
Background history of CIGMA!• 1997 First Transload Study
• 26 Retailers - will look for alternative to POLALB• Transloading of ISO to DOMCONs to increase• Inland Empire and Import Warehouse Development
• 2000 Transload Study Update• 2nd Tier of Steamship Lines lack inland intmdl infrastr ucture• Transloading peaking• Alameda Corridor increasaing 0n-dock infrastructure• All water thru Panama Canal to Gulf and East Coast
• 2003 Transload Study Morphs into Trade Flow Study• Plans for Prince Rupert• 2002 Lockout surges AWEC• EC DC respond to 36% US pop. Logistics Parks Devel op
• 2006 Trade Flow Update• IPI off-dock & AWEC = dropping Transloading percent age• Congestion becoming the issue

THE TIOGA GROUP
3
Tioga
5
Why do CIGMA in 2008?
• 2008 Issues Affecting Trade Flow Movement• Higher IPI Rates• Increased Bunker Charges• Continued Diversion of Traffic AWEC
• 2008 Issues Affecting Traffic Through LA/LB• TWIC Program• ILWU Contract Negotiations• Ports Clean Truck Issues and Proposed Fees• Port Infrastructure Cargo Fees• Lowenthal Ports Fees• SCAG RTP Port Container Fee• SCAG RTP Railroad User Fee
Tioga
6
2006 vs. 2007 Inbnd/Outbnd Loads
Volume Change
Percent Change
Volume Change
Percent Change
Port 2006 2007 2006 2007Los Angeles 4,408,185 4,410,169 1,984 0.0% 1,423,620 1,607,643 184,023 12.9%Long Beach 3,719,680 3,704,593 (15,087) -0.4% 1,290,843 1,574,241 283,398 22.0%Oakland 877,649 870,284 (7,365) -0.8% 840,127 909,633 69,506 8.3%Vancouver 1,120,780 1,180,711 59,931 5.3% 762,388 857,550 95,162 12.5%Seattle 799,138 810,453 11,315 1.4% 438,806 503,690 64,884 14.8%Takoma 746,327 694,032 (52,295) -7.0% 368,229 445,871 77,642 21.1%Portland 89,693 110,741 21,048 23.5% 124,791 149,387 24,596 19.7%Total 11,761,452 11,780,983 19,531 0.2% 5,248,804 6,048,015 799,211 15.2%
Inbound/Import Loads (TEU)
Outbound/Export Loads (TEU)
2006 versus 2007 Inbound/Outbound Loads for West Co ast Ports
Volume Change
Percent Change
Volume Change
Percent Change
Port 2006 2007 2006 2007New York & New Jersey 2,508,993 2,619,592 110,599 4.4% 1,299,285 1,477,903 178,618 13.7%Virginia Ports 862,278 901,943 39,665 4.6% 579,728 657,412 77,684 13.4%Charleston 901,478 778,331 (123,147) -13.7% 662,257 628,771 (33,486) -5.1%Savannah 866,189 1,074,024 207,835 24.0% 782,446 1,005,367 222,921 28.5%Houston 654,165 683,602 29,437 4.5% 613,999 706,099 92,100 15.0%Total 5,793,103 6,057,492 264,389 4.6% 3,937,715 4,475,552 537,837 13.7%
2006 versus 2007 Inbound/Outbound Loads for Largest East & Gulf Coast PortsInbound/Import
Loads (TEU)Outbound/Export
Loads (TEU)

THE TIOGA GROUP
4
Tioga
7
San Pedro Bay Cargo Forecast - LALB
25 Yr %2005 2010 2015 2020 2025 2030 05-10 10-20 20-30 05-30
ImportsEast Coast 9,653 12,215 14,982 18,164 22,174 27,670 4.8 4.0 4.3 4.3West Coast 8,976 13,262 18,181 24,305 32,258 43,657 8.1 6.2 6.0 6.5SubTotal 18,629 25,477 33,163 42,468 54,432 71,327 6.5 5.2 5.3 5.5
ExportsEast Coast 5,170 6,497 7,465 8,477 9,688 11,188 4.7 2.7 2.8 3.1West Coast 3,331 4,178 4,908 5,523 6,190 7,012 4.6 2.8 2.4 3.0SubTotal 8,501 10,675 12,373 14,001 15,877 18,200 4.7 2.7 2.7 3.1
TotalEast Coast 14,823 18,712 22,446 26,641 31,861 38,858 4.8 3.6 3.8 3.9West Coast 12,307 17,440 23,089 29,828 38,447 50,669 7.2 5.5 5.4 5.8Grand Total 27,130 36,152 45,536 56,469 70,309 89,527 5.9 4.6 4.7 4.9
000 Loaded TEU CAGR %
Tioga
8
Export Complexities – 2007 & 2008
• WC Ports up 15.4% - EC Ports up 14.4%
• Drivers – Devaluation of dollar & demand for export grains
• Decline in imports decreases availability of contai ners
• Ship capacity affected by deployment & export weigh ts

THE TIOGA GROUP
5
Tioga
9
Inland Market Regions
Tioga
10
Inland Routing ExamplesOrigin Destination Ocean Route Port Intact or Transload Inland Route
China Northeast TransPac WC LA/LB Intact 40' Rail IntermodalTransPac WC LA/LB Transload 53' Cont Rai IntermodalTransPac WC Oakland Intact 40' Rail IntermodalTransPac WC Oakland Transload 53' Cont Rai IntermodalTransPac WC Seattle/Tacoma Intact 40' Rail IntermodalTransPac WC Seattle/Tacoma Transload 53' Cont Rai IntermodalAll Water EC NY & NJ Intact 40' Truck
China Southwest TransPac WC LA/LB Intact 40' Rail IntermodalTransPac WC LA/LB Transload 53' Cont Rai IntermodalAll Water GC Houston Intact 40' Truck
China West Coast TransPac WC LA/LB Intact 40' TruckTransPac WC Oakland Intact 40' TruckTransPac WC Seattle/Tacoma Intact 40' Truck
China Midwest TransPac WC LA/LB Intact 40' Rail IntermodalTransPac WC LA/LB Transload 53' Cont Rai IntermodalTransPac WC Okland Intact 40' Rail IntermodalTransPac WC Oakland Transload 53' Cont Rai IntermodalTransPac WC Seattle/Tacoma Intact 40' Rail IntermodalTransPac WC Seattle/Tacoma Transload 53' Cont Rail Intermodal
Europe Midwest Atlantic EC NY & NJ Intact 40' Rail IntermodalAtlantic EC NY & NJ Intact 40' TruckAtlantic EC Virginia Intact 40' Rail IntermodalAtlantic EC Virginia Intact 40' TruckAtlantic EC Baltimore Intact 40' Rail IntermodalAtlantic EC Baltimore Intact 40' Truck

THE TIOGA GROUP
6
Tioga
11
Choice of route and strategy subject to many factor s
• Rising fuel costs
• Profitability concerns on marginal services
• Changing balances of domestic equipment for translo ading
• Development of inland logistics parks Railroad inte rmodal capacity and strategy
• Concerns over long-term port capacity and congestio n potential
• Devaluation of the dollar
Tioga
12
What is the origin of my cargo? Should I go Panama o r Suez?What size ship should I use? What port can handle th e ship?
Narvik, Norway
Vostochny, Russia
Hong Kong, China
Singapore
Rotterdam, Netherlands
Prince Rupert, Canada
SavannahNorfolk
New York
Los Angeles
Lazaro Cardenas
Punto Colonet
North China
HOUSTON Bombay
Sydney NS

THE TIOGA GROUP
7
Tioga
13
Tioga
14
Ocean Carrier Vessel Size and Capacity
• The additions in 2007 of 399 cellular ships totalin g 1,362, 572 TEU pushed the total of available container cap acity over the 10 million TEU mark in 2007. The top 20 ( by capacity) steamship companies reached 10,099,145 TE U by May 6, 2008.
• Although some of the order numbers are hard to veri fy AXS-Alphaliner reported last October that in the pr evious five months orders for 100 of the VLCS of 12,500-13 ,500 TEU were concluded since the first batch of eight s hips that had been ordered by CSAV in May of 2007.
• The breakdown by year of delivery for these 100 shi ps stands as follows:
• 2010 = 29 units 2011 = 52 units 2012 = 19 units

THE TIOGA GROUP
8
Tioga
15
Emma Maersk 14000 TEU Vessel
So Which U.S. Port Can Handle the Emma Class Vessel s?
Tioga
16
Near Dock Staging Area – Port of LA
Slide Courtesy POLA
ON DOCK RAIL

THE TIOGA GROUP
9
Tioga
17
OUT THE PORT GATETO THE TRANSLOADER OR OTR
Tioga
18
AFTER THE TRANSLOAD DO YOU GO BACK TO THE RAIL-------- OR OVER THE ROAD
THE TIOGA GROUP
10
Tioga
19
Did the increase in IPI Rates Promote Transloading?
• With increases in IPI rates and higher bunker charg es it was expected that steamship companies would be encourag ing more transloading to reduce their inland costs.
• Comments from the steamship companies do not suppor t that premise as the carriers would slow down or mak e fewer calls rather than drop a port of call.
• Existing infrastructure on the WC and especially in San Pedro with abundance of on-dock capabilities would seem to favor continued movement of containers directly from the ships to an on-dock railcar and movement in tra ins directly Eastbound to the warehouses and distributi on centers in the Heartland of the country.
Tioga
20
What About Increased Bunker Charges?
• Bunker prices have tripled within the last three ye ars and as of May of 2008 had increased 87% since the beginnin g of 2007 and now represent as much as 50-60 percent of total ship operating costs, depending on the type of ship and service.
• Belief higher bunker charges would result in the cu tting back of some of the AWEC resulting in a return of s ome of the traffic that had migrated to the all-water serv ices.
• Comments from the steamship companies do not suppor t that premise as the carriers would slow down or mak e fewer calls rather than drop a port of call.

THE TIOGA GROUP
11
Tioga
21
z
Megapolitans
Sources: Population, employment, and real estate growth forecasts by Robert Lang and Arthur Nelson of the Metropolitan Institute at Virginia Tech
and Phil Hopkins of Global Insight; Business 2.0, November 2005
East Coast -West Coast TEUcost line equilibrium
I-35 Corridor +40%
Gulf Coast Belt +31%
Cascadia +38%
Norcal +35%
Southland +35%
Valley of the Sun +81%
Great Lakes Horseshoe +10%
Atlantic Seaboard
+12%
I-85 Corridor +35%
Southern Florida +52%
Tioga
22
Chicago
St Louis
Memphis
Charleston
Population density makes intermodal rail an essential part of freight movement
• Eastern U.S. region holds 66% of the U.S. population
• Approximately 75% of U.S. consumption takes place in the East
Source: Global Insight
Projected population growth will increase volume and capacity requirements
2006 Population
Miami
New York
Jacksonville
New Orleans
Population in Major Metropolitan Areas
GT 10,000,000
5,000,000 – 10,000,000
2,500,000 – 5,000,000
1,500,000 – 2,500,000
1,000,000 – 1,500,000
THE TIOGA GROUP
12
Tioga
23
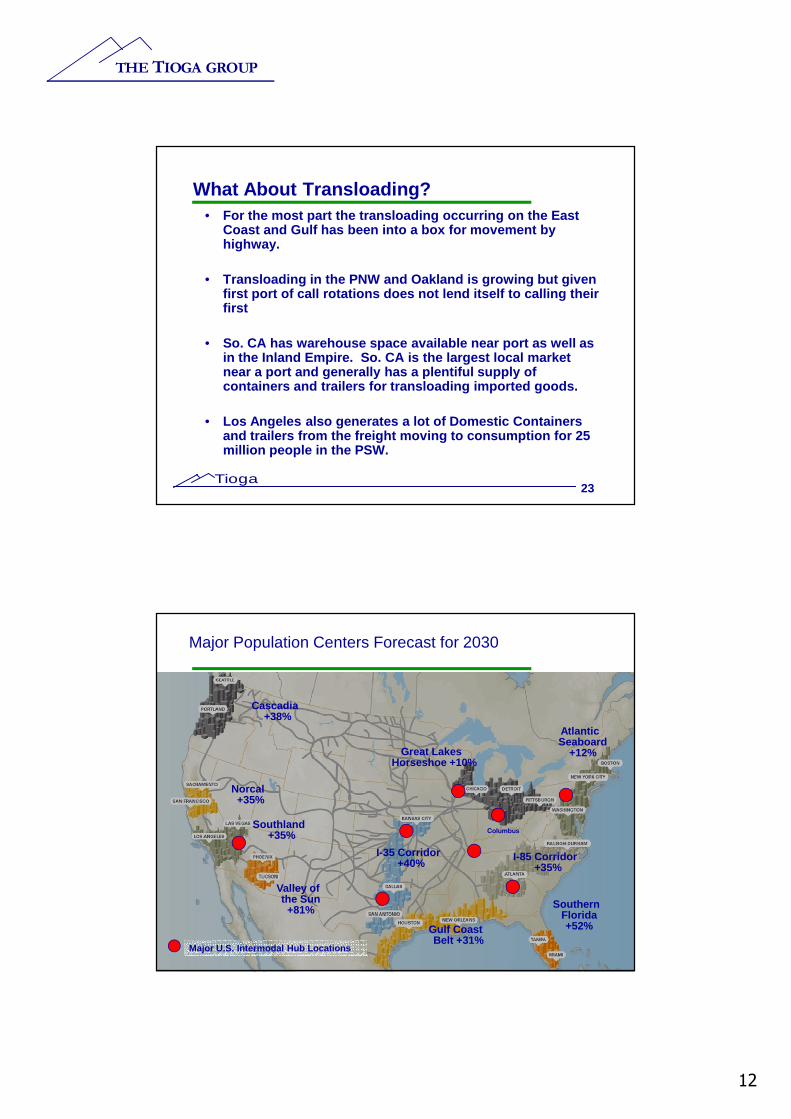
What About Transloading?• For the most part the transloading occurring on the East
Coast and Gulf has been into a box for movement by highway.
• Transloading in the PNW and Oakland is growing but given first port of call rotations does not lend itself t o calling their first
• So. CA has warehouse space available near port as w ell as in the Inland Empire. So. CA is the largest local market near a port and generally has a plentiful supply of containers and trailers for transloading imported g oods.
• Los Angeles also generates a lot of Domestic Contai ners and trailers from the freight moving to consumption for 25 million people in the PSW.
Tioga
24
Major Population Centers Forecast for 2030
Columbus
I-35 Corridor +40%
Gulf Coast Belt +31%
Cascadia +38%
Norcal +35%
Southland +35%
Valley of the Sun +81%
Great Lakes Horseshoe +10%
Atlantic Seaboard
+12%
I-85 Corridor +35%
Southern Florida +52%
Major U.S. Intermodal Hub Locations

THE TIOGA GROUP
13
Tioga
25
ARRIVE BY RAIL AND SHUTTLE TO THE DC
Tioga
26
LOGISTICS PARK COMPLEX
THE TIOGA GROUP
14
Tioga
27
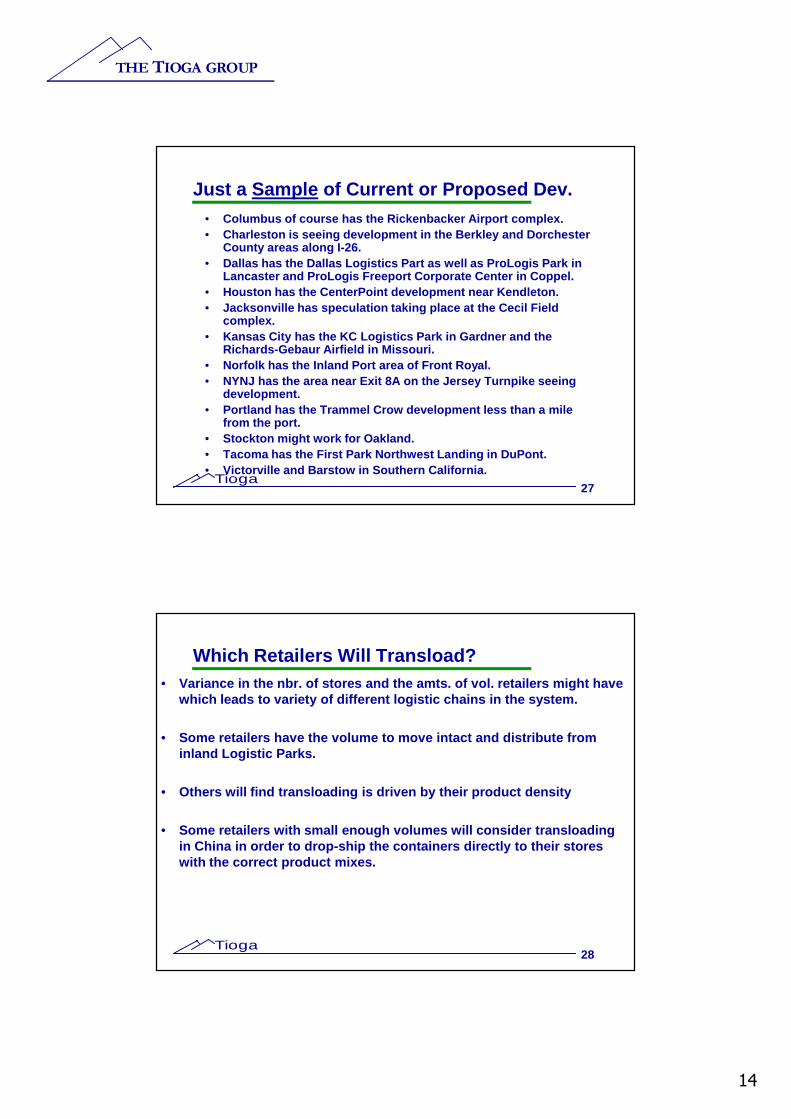
Just a Sample of Current or Proposed Dev.• Columbus of course has the Rickenbacker Airport com plex.• Charleston is seeing development in the Berkley and Dorchester
County areas along I-26.• Dallas has the Dallas Logistics Part as well as Pro Logis Park in
Lancaster and ProLogis Freeport Corporate Center in Coppel.• Houston has the CenterPoint development near Kendle ton.• Jacksonville has speculation taking place at the Ce cil Field
complex.• Kansas City has the KC Logistics Park in Gardner an d the
Richards-Gebaur Airfield in Missouri.• Norfolk has the Inland Port area of Front Royal. • NYNJ has the area near Exit 8A on the Jersey Turnpi ke seeing
development. • Portland has the Trammel Crow development less than a mile
from the port.• Stockton might work for Oakland.• Tacoma has the First Park Northwest Landing in DuPo nt.• Victorville and Barstow in Southern California.
Tioga
28
Which Retailers Will Transload?• Variance in the nbr. of stores and the amts. of vol . retailers might have
which leads to variety of different logistic chains in the system.
• Some retailers have the volume to move intact and d istribute from inland Logistic Parks.
• Others will find transloading is driven by their pr oduct density
• Some retailers with small enough volumes will consi der transloading in China in order to drop-ship the containers direc tly to their stores with the correct product mixes.

THE TIOGA GROUP
15
Tioga
29
DELIVER THE PRODUCT TO THE STORE
Tioga
30
What About Those Motor Carriers?• UP Streamline product provides an opportunity to ut ilize or in some
cases sample the rail intermodal product.
• End of 2007 est. 92,000 units of excess capacity in the industry. Over supply will eventually meet the current demand by b usiness failures, carriers parking equipment and delays in replacing older tractors.
• Is this result of shippers driving down the charges of motor carriers as long as there was a surplus of carriers? Some carr iers believe there could be “day of reckoning” coming as this fall out of motor carriers will force the shippers to finally have to pay the higher fees.
• This “rude awakening” scenario goes along with the theme we have been seeing as railroads increase IPI rates and the steamship companies try to recover their higher bunker charge s. The leverage the shippers once held over the transportation indu stry may be coming to an end and the field of realistic costing may be coming into being.

THE TIOGA GROUP
16
Tioga
31
ISSUES AFFECTING TRADE FLOW MOVEMENT THROUGH PORTS OF LOS ANGELES AND LONG BEACH
• TWIC Program• ILWU Contract Negotiations• Ports Clean Truck Fee• Ports Infrastructure Cargo Fee• Lowenthal Ports Fee• SCAG RTP Port Container Fee• SCAG RTP Railroad User Fee
These fees are in addition to the two existing fees already on books. The Pier Pass $50/TEU applied to movemen ts of containers during peak traffic periods and the cont ainer fee applied to containers moving by rail to retire the debt on the 20-mile Alameda Corridor.
Tioga
32
ISSUES AFFECTING TRADE FLOW MOVEMENT THROUGH WEST COAST PORTS
• TWIC Program
Transportation Worker Identification Credentials:
Estimates that as much as 25% of local drayage driv ers will be disqualified and could lead to a shortage of drivers to move the containers on and off the Port Complex.

THE TIOGA GROUP
17
Tioga
33
ISSUES AFFECTING TRADE FLOW MOVEMENT THROUGH WEST COAST PORTS
• ILWU Contract Negotiations
The International Longshore Workers and Warehouse U nion
The ILWU six year contract expires in July. Negoti ations have started and there is hope of an early settlement. ILWU workers for the first time in 2007 experienced making less money than the previous yea r due to the reduction in the number of imports handled.
Most retailers have already put alternative logisti cs options in place since the 2002 lock-out. Smaller importers are hoping fo r smooth negotiations with no disruptions.
Tioga
34
ISSUES AFFECTING TRADE FLOW MOVEMENT THROUGH PORTS OF LOS ANGELES AND LONG BEACH
• Ports Clean Truck Fee
Scheduled for implementation originally June of 200 8. It may have been moved back to October of 2008 with recent meet ings. $35/TEU with funds to be used to help operators pur chase new trucks that meet the ports strict diesel emission g uidelines.
Who Pays? Beneficial Cargo Owners

THE TIOGA GROUP
18
Tioga
35
ISSUES AFFECTING TRADE FLOW MOVEMENT THROUGH PORTS OF LOS ANGELES AND LONG BEACH
• Ports Infrastructure Cargo Fee
Scheduled for implementation at the Ports’ in Janua ry of 2009 in the amount of $15/TEU. Funding to be applied to ne eded infrastructure improvements in the immediate area.
Who pays? Beneficial Cargo Owner
Tioga
36
ISSUES AFFECTING TRADE FLOW MOVEMENT THROUGH PORTS OF LOS ANGELES AND LONG BEACH
• Lowenthal Ports Fee
Proposed legislation by California Senator Alan Low enthal that would impose a $30/TEU fee on containers moving thr ough the Ports of Los Angeles, Long Beach and Oakland. The funds to be applied toward infrastructure improvements in roadw ays and tracks in outlaying areas.
Who Pays? Beneficial Cargo Owner

THE TIOGA GROUP
19
Tioga
37
ISSUES AFFECTING TRADE FLOW MOVEMENT THROUGH PORTS OF LOS ANGELES AND LONG BEACH
• SCAG RTP Port Container Fee
Southern California Association of Governments:Regional Transportation Plan:
Another $30/TEU Port Container Fee to eventually be applied to infrastructure improvement.
Who Pays? Ports and Railroads
Tioga
38
ISSUES AFFECTING TRADE FLOW MOVEMENT THROUGH PORTS OF LOS ANGELES AND LONG BEACH
• SCAG RTP Railroad User Fee
Southern California Association of Governments:Regional Transportation Plan:
Another $15/TEU Container Fee with the funds to eve ntually be applied to infrastructure improvements.
Who Pays? Railroads

THE TIOGA GROUP
20
Tioga
39
Take Away Points from Northwestern Presentation
• Continued diversion AWEC stimulating shorthaul inte rmodal & Motor Carrier traffic from East Coast ports.
• Transloading percentage will increase slightly.
• Opportunity for truck builders with demand for new equipment as ‘Green Truck’ issue ripples through the industry .
• As economy strengthens probably shortages of domest ic containers may develop.
• Retailers continue to expand in population growth a reas.
• Motor Carriers trying to stimulate Railroad interes t in short haul lanes like the Kansas City, KS to Marion, OH.
THE TIOGA GROUP
Tioga
DATE
NEOMODAL TERMINALWHEELING AND LAKE ERIE RAILROADNAVARRE, OHIO IN NORTHEAST OHIO
28 ACRE FACILITY WITH 16 ACRES ADJACENT FOR CY800 ACRES FOR LOGISTIC PARK NEARBY
THE TIOGA GROUP
21
Tioga
41
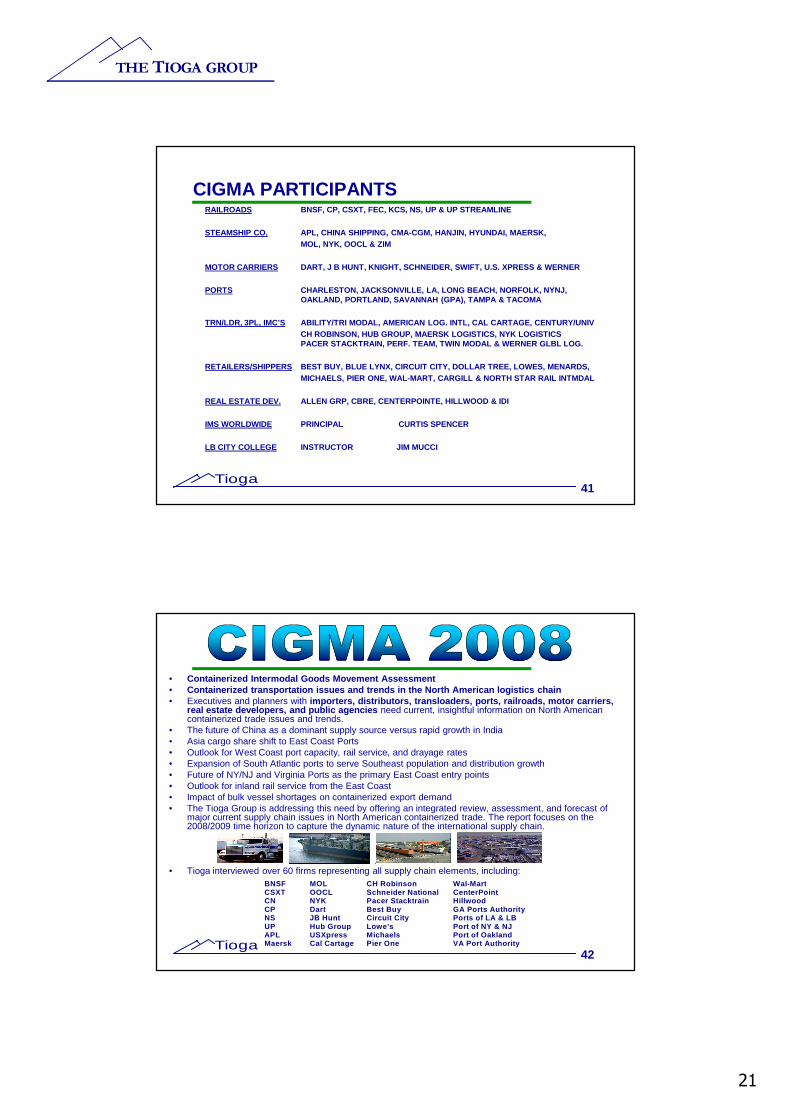
CIGMA PARTICIPANTSRAILROADS BNSF, CP, CSXT, FEC, KCS, NS, UP & UP STREAMLINE
STEAMSHIP CO. APL, CHINA SHIPPING, CMA-CGM, HANJIN, HYUNDAI, MAER SK, MOL, NYK, OOCL & ZIM
MOTOR CARRIERS DART, J B HUNT, KNIGHT, SCHNEIDER, SWIFT, U.S. XPRE SS & WERNER
PORTS CHARLESTON, JACKSONVILLE, LA, LONG BEACH, NORFOLK, NYNJ, OAKLAND, PORTLAND, SAVANNAH (GPA), TAMPA & TACOMA
TRN/LDR, 3PL, IMC’S ABILITY/TRI MODAL, AMERICAN LOG. INTL, CAL CARTAGE, CENTURY/UNIVCH ROBINSON, HUB GROUP, MAERSK LOGISTICS, NYK LOGIS TICSPACER STACKTRAIN, PERF. TEAM, TWIN MODAL & WERNER G LBL LOG.
RETAILERS/SHIPPERS BEST BUY, BLUE LYNX, CIRCUIT CITY, DOLLAR TREE, LOW ES, MENARDS,MICHAELS, PIER ONE, WAL-MART, CARGILL & NORTH STAR RAIL INTMDAL
REAL ESTATE DEV. ALLEN GRP, CBRE, CENTERPOINTE, HILLWOOD & IDI
IMS WORLDWIDE PRINCIPAL CURTIS SPENCER
LB CITY COLLEGE INSTRUCTOR JIM MUCCI
Tioga
42
• Containerized Intermodal Goods Movement Assessment • Containerized transportation issues and trends in th e North American logistics chain• Executives and planners with importers, distributors, transloaders, ports, railr oads, motor carriers,
real estate developers, and public agencies need current, insightful information on North American containerized trade issues and trends.
• The future of China as a dominant supply source versus rapid growth in India• Asia cargo share shift to East Coast Ports• Outlook for West Coast port capacity, rail service, and drayage rates• Expansion of South Atlantic ports to serve Southeast population and distribution growth• Future of NY/NJ and Virginia Ports as the primary East Coast entry points• Outlook for inland rail service from the East Coast• Impact of bulk vessel shortages on containerized export demand• The Tioga Group is addressing this need by offering an integrated review, assessment, and forecast of
major current supply chain issues in North American containerized trade. The report focuses on the 2008/2009 time horizon to capture the dynamic nature of the international supply chain.
• Tioga interviewed over 60 firms representing all supply chain elements, including:BNSF CSXT CN CP NS UP APL Maersk
MOL OOCL NYK Dart JB Hunt Hub Group USXpress Cal Cartage
CH Robinson Schneider National Pacer Stacktrain Best Buy Circuit City Lowe’s Michaels Pier One
Wal-Mart CenterPoint Hillwood GA Ports Authority Ports of LA & LB Port of NY & NJ Port of Oakland VA Port Authority

THE TIOGA GROUP
22
Tioga
43
• CIGMA 2008 addresses critical needs…..• Importers must react to foreign production costs, ocean and inland transport costs, port issues, and market dynamics• Ocean carriers must react to vessel economics, routing demand, fuel cost, and port capacity• Rail carriers must react to capacity constraints, port volume, and transloading trends• Motor carriers must react to driver shortages, fuel cost, emissions regulations, and security requirements.• Commercial real estate developers must react to land availability, transportation trends, and trade outlook• Public agencies must allocate scarce infrastructure funds and mitigate impacts• ….for critical information.• Import growth projections• Import production sources - China, other Asia, and India• Ocean routing trends for West Coast, all-water East & Gulf Coast, Panama, and Suez Canal services• Vessel size trends, fuel cost, and ocean carrier network changes• Port issues and capacity with major focus on West Coast Ports • Import distribution and transloading trends• Rail intermodal pricing, capacity, and contract issues• Motor carrier driver supply, fuel cost, security, and environmental issues• Ordering Reports• The CIGMA 2008 report will be available beginning July 1st at $500 per copy or $400 each for five or more copies.
Educational institutions can purchase the report for $250 per copy. Complete the form below and fax to The Tioga Group at 1-215-557-2145. An invoice will be included with the report(s). Email questions to [email protected] or call 1-215-557-2142. To order by credit card please go to this link:
• https://www.IntermodalofChicago.org/secure/TiogaGro up.asp
• Name ________________________________________ Position_________________________• Company or Educational Inst ______________________________________________________• Address ______________________________________________________________________• City ____________________________________________ State ________ Zip _____________• Telephone _____________________Email __________________________________________• Number of Copies ______ Check price $500 $400 $250 Total Cost $ _________
Tioga
44
THE CIGMA REPORT 2008
THANK YOU FOR YOUR TIME
Any interest or questions regarding the
CIGMAreport by The Tioga Group can be made to
The Tioga Group, Inc.1617 JFK Blvd
Suite 1252Philadelphia, PA 19103
215-775-2142