the thermodynamics of aqueous potassium … archive/files/merge/vol-49...the thermodynamics of...
TRANSCRIPT

The Thermodynamics of Aqueous Potassium Carbonate/Piperazine for CO2 Capture
J. Tim Cullinane and Gary T. Rochelle
Department of Chemical Engineering
The University of Texas at Austin, Austin, Texas 78712 Introduction
Concern over global warming has sparked the development of technologies for the capture and sequestration of greenhouse gases. Amine-based solvents in absorber/stripper processes have been developed as one option for separating CO2 from waste gas streams. A new aqueous solvent containing potassium carbonate (K2CO3) and piperazine (PZ) shows promise as a commercially viable solvent, possessing favorable equilibrium behavior and a low heat of absorption.
The equilibrium in these solvents can be represented with the reactions shown below. PZ is a cyclic diamine, forming a variety of species. Carbonate and bicarbonate are also present in significant quantities. The pH in useful solutions varies from 8 to 13.
PZH+ + H2O ↔ PZ + H3O+
PZ + CO2(aq) + H2O ↔ PZCOO- + H3O+
H+PZCOO- + H2O ↔ PZCOO- + H3O+
PZCOO- + CO2 + H2O ↔ PZ(COO-)2 + H3O+
CO2(aq) + 2·H2O ↔ HCO3- + H3O+
HCO3- + H2O ↔ CO3
2- + H3O+
2·H2O ↔ H3O+ + OH-
CO2(g) ↔ CO2(aq) The evaluation of this solvent for use in a commercial system
depends on the ability to effectively model rates of CO2 absorption, energy requirements, and absorption capacity, requiring a thorough understanding of equilibrium behavior. This work identifies important equilibrium characteristics of the solvent at various concentrations (0.0 to 6.2 m K+ and 0.0 to 3.6 m PZ) and temperatures (25 to 80oC) and develops a rigorous thermodynamic model applicable over these ranges. Experimental
Electrolyte NRTL Model. The equilibrium modeling of the solutions was accomplished using the electrolyte NRTL model, originally developed by Chen et al. (1). Previous work has used this model extensively for aqueous electrolyte solutions and acid gas systems (2, 3).
Liquid Speciation. The equilibrium distribution of piperazine and its carbamates was quantified with the use of 1H spectra from a Varian INOVA 500 NMR. Samples were prepared with 80% H2O, 20% D2O, K2CO3 or KHCO3, and PZ.
Vapor-Liquid Equilibrium. The equilibrium vapor pressure of CO2, PCO2*, was determined with a wetted-wall column. A description of the equipment can be found in previous work (4, 5). Nitrogen and CO2 are fed into the column where it contacts the flowing solvent. The outlet concentration of CO2 is measured using IR spectroscopy. By adjusting the CO2 partial pressure in the gas stream, absorption and desorption conditions can be obtained and a flux of CO2 can be calculated. Interpolating to a flux of zero allows the calculation of PCO2*. Results and Discussion
An equilibrium model was developed for K+/PZ mixtures using existing literature data and new experimental investigations. Boiling point elevation, activity of water, and PCO2* data were used to regress parameters relevant to K2CO3/KHCO3 solutions (6, 7, 8). PCO2* data for aqueous PZ is available from Bishnoi (4). Speciation in aqueous
PZ was previously found by Ermatchkov (9). Additional data for K+/PZ solutions were investigated in this work.
Parameters for the model are shown in Table 1. In this work, default parameters for water-ion pair and ion pair-water interations are 8.0 and -4.0 respectively. Molecule-molecule interactions are 0.0. The model reference temperature is 353K; therefore, A represents a binary interaction parameter, τ, at 353K and B represents a temperature dependence in the form B·(1/T – 1/353). The regressed parameters show minor variations from default values. Confidence intervals are generally less than 10% for A and 50% for B.
Table 1. Regressed Binary Interaction Parameters in the
Electrolyte NRTL Model for K+/PZ Mixtures Interaction A, τ353K σA B σB
H2O, (K+ CO32-) 9.36 0.21 867 560
(K+ CO32-), H2O -4.49 0.04 -331 90
H2O, (K+ HCO3-) 7.68 0.04 2410 Indet.
(K+ HCO3-), H2O -3.40 Indet. -404 80
H2O, PZ 12.90 0.25 -3321 Indet. PZ, H2O 0.92 0.13 -837 Indet.
(PZH+ PZCOO-), H2O -4.47 0.42 * N/A H2O, (PZH+ PZ(COO-)2) 5.46 0.81 * N/A (PZH+ PZ(COO-)2), H2O * N/A -625 380
H2O, (K+ PZCOO-) 11.21 0.27 -6921 1110 H2O, (K+ PZ(COO-)2) 7.72 0.29 -2098 920 H2O, (PZH+ HCO3
-) 8.93 0.10 * N/A H2O, (PZH+ CO3
-) * N/A 7987 1270 (PZH+ CO3
2-), H2O -6.40 0.59 * N/A * Default parameter used. Indet. = Indeterminate
Proton NMR was used to speciate various K+/PZ mixtures. As
shown in Figure 1, the addition of 5.0 m K+ to 2.5 m PZ dramatically changes the distribution of PZ species. Over equivalent partial pressures, the presence of more CO2 converts free PZ to PZCOO- and PZ(COO-)2. Conversely, the carbonate/bicarbonate buffer reduces the protonation of PZ and PZCOO- resulting in an overall increase in reactive amine species.
Loading (mol CO2/(mol K+ + mol PZ))0.4 0.5 0.6 0.7
[Am
ine]
or [
CO
2 Spe
cies
] (m
)
0.01
0.1
1
P CO
2* (ba
r) o
r [O
H- ] (
m)
0.00001
0.0001
0.001
0.01
0.1PZ
PZCOO-
PZ(COO-)2
OH-
H+PZ
H+PZCOO-
CO32-
HCO3-
PCO2*
Figure 1. Electrolyte NRTL Prediction of Speciation of 5.0 m K+/2.5 m PZ at 60oC
Prepr. Pap.-Am. Chem. Soc., Div. Fuel Chem. 2004, 49 (1), 360
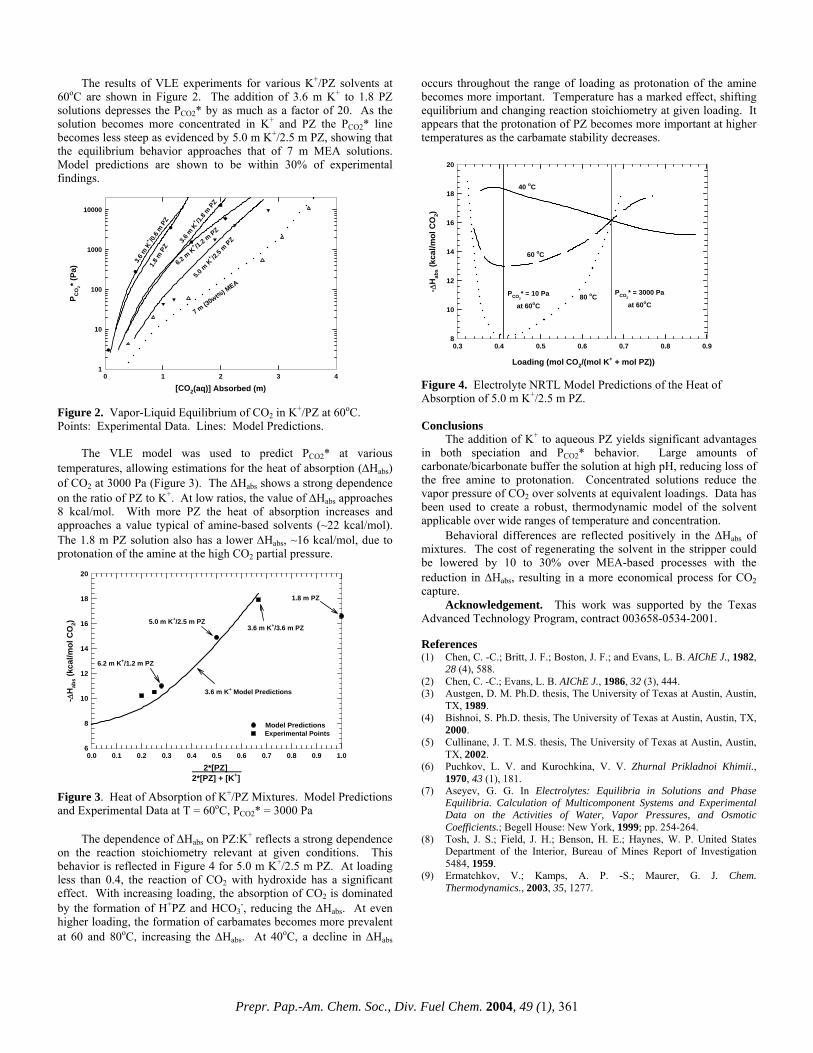
The results of VLE experiments for various K+/PZ solvents at 60oC are shown in Figure 2. The addition of 3.6 m K+ to 1.8 PZ solutions depresses the PCO2* by as much as a factor of 20. As the solution becomes more concentrated in K+ and PZ the PCO2* line becomes less steep as evidenced by 5.0 m K+/2.5 m PZ, showing that the equilibrium behavior approaches that of 7 m MEA solutions. Model predictions are shown to be within 30% of experimental findings.
[CO2(aq)] Absorbed (m)0 1 2 3 4
P CO
2* (Pa
)
1
10
100
1000
10000
1.8 m
PZ
3.6 m
K+ /0.
6 m P
Z
3.6 m
K+ /1.
8 m P
Z
5.0 m
K+ /2.
5 m PZ
7 m (30wt%) MEA
6.2 m K
+ /1.2 m PZ
Figure 2. Vapor-Liquid Equilibrium of CO2 in K+/PZ at 60oC. Points: Experimental Data. Lines: Model Predictions.
The VLE model was used to predict PCO2* at various temperatures, allowing estimations for the heat of absorption (∆Habs) of CO2 at 3000 Pa (Figure 3). The ∆Habs shows a strong dependence on the ratio of PZ to K+. At low ratios, the value of ∆Habs approaches 8 kcal/mol. With more PZ the heat of absorption increases and approaches a value typical of amine-based solvents (~22 kcal/mol). The 1.8 m PZ solution also has a lower ∆Habs, ~16 kcal/mol, due to protonation of the amine at the high CO2 partial pressure.
2*[PZ] 2*[PZ] + [K+]
0.0 0.1 0.2 0.3 0.4 0.5 0.6 0.7 0.8 0.9 1.0
- ∆H
abs (
kcal
/mol
CO
2)
6
8
10
12
14
16
18
20
Model PredictionsExperimental Points
3.6 m K+ Model Predictions
1.8 m PZ
5.0 m K+/2.5 m PZ3.6 m K+/3.6 m PZ
6.2 m K+/1.2 m PZ
Figure 3. Heat of Absorption of K+/PZ Mixtures. Model Predictions and Experimental Data at T = 60oC, PCO2* = 3000 Pa
The dependence of ∆Habs on PZ:K+ reflects a strong dependence
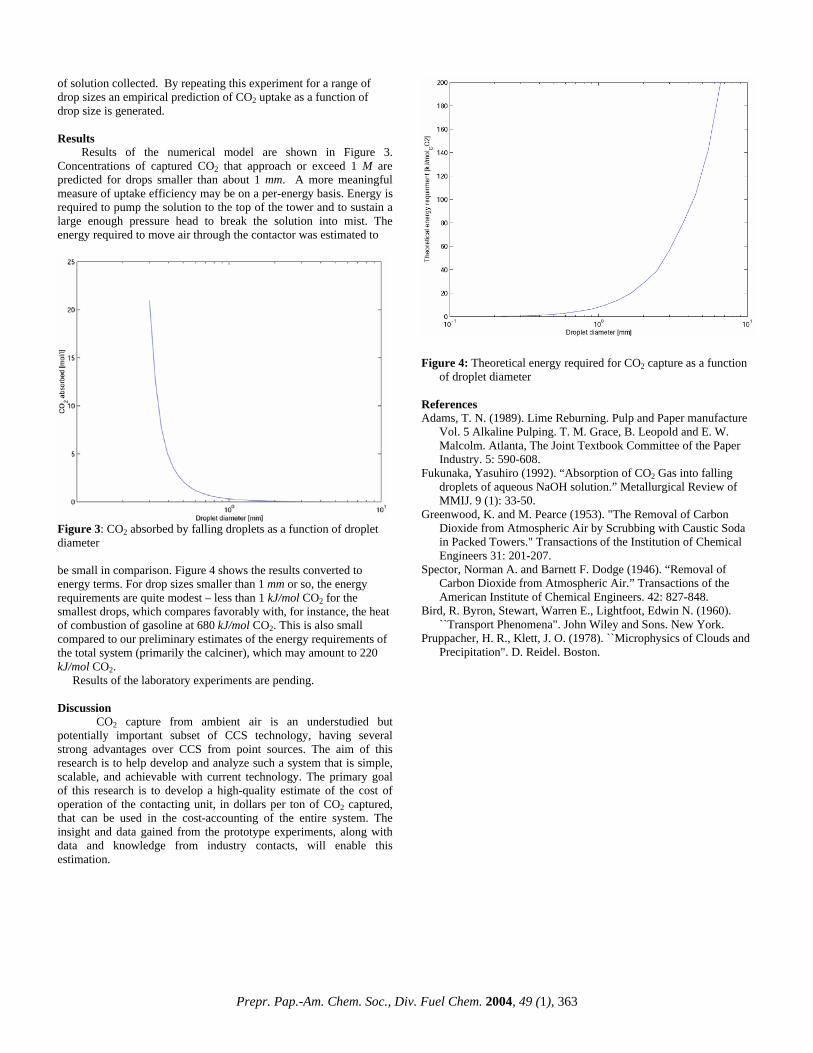
on the reaction stoichiometry relevant at given conditions. This behavior is reflected in Figure 4 for 5.0 m K+/2.5 m PZ. At loading less than 0.4, the reaction of CO2 with hydroxide has a significant effect. With increasing loading, the absorption of CO2 is dominated by the formation of H+PZ and HCO3
-, reducing the ∆Habs. At even higher loading, the formation of carbamates becomes more prevalent at 60 and 80oC, increasing the ∆Habs. At 40oC, a decline in ∆Habs
occurs throughout the range of loading as protonation of the amine becomes more important. Temperature has a marked effect, shifting equilibrium and changing reaction stoichiometry at given loading. It appears that the protonation of PZ becomes more important at higher temperatures as the carbamate stability decreases.
Loading (mol CO2/(mol K+ + mol PZ))
0.3 0.4 0.5 0.6 0.7 0.8 0.9
- ∆H
abs (
kcal
/mol
CO
2)
8
10
12
14
16
18
20
40 oC
60 oC
80 oCPCO2* = 10 Pa
at 60oC
PCO2* = 3000 Pa
at 60oC
Figure 4. Electrolyte NRTL Model Predictions of the Heat of Absorption of 5.0 m K+/2.5 m PZ. Conclusions
The addition of K+ to aqueous PZ yields significant advantages in both speciation and PCO2* behavior. Large amounts of carbonate/bicarbonate buffer the solution at high pH, reducing loss of the free amine to protonation. Concentrated solutions reduce the vapor pressure of CO2 over solvents at equivalent loadings. Data has been used to create a robust, thermodynamic model of the solvent applicable over wide ranges of temperature and concentration.
Behavioral differences are reflected positively in the ∆Habs of mixtures. The cost of regenerating the solvent in the stripper could be lowered by 10 to 30% over MEA-based processes with the reduction in ∆Habs, resulting in a more economical process for CO2 capture.
Acknowledgement. This work was supported by the Texas Advanced Technology Program, contract 003658-0534-2001. References (1) Chen, C. -C.; Britt, J. F.; Boston, J. F.; and Evans, L. B. AIChE J., 1982,
28 (4), 588. (2) Chen, C. -C.; Evans, L. B. AIChE J., 1986, 32 (3), 444. (3) Austgen, D. M. Ph.D. thesis, The University of Texas at Austin, Austin,
TX, 1989. (4) Bishnoi, S. Ph.D. thesis, The University of Texas at Austin, Austin, TX,
2000. (5) Cullinane, J. T. M.S. thesis, The University of Texas at Austin, Austin,
TX, 2002. (6) Puchkov, L. V. and Kurochkina, V. V. Zhurnal Prikladnoi Khimii.,
1970, 43 (1), 181. (7) Aseyev, G. G. In Electrolytes: Equilibria in Solutions and Phase
Equilibria. Calculation of Multicomponent Systems and Experimental Data on the Activities of Water, Vapor Pressures, and Osmotic Coefficients.; Begell House: New York, 1999; pp. 254-264.
(8) Tosh, J. S.; Field, J. H.; Benson, H. E.; Haynes, W. P. United States Department of the Interior, Bureau of Mines Report of Investigation 5484, 1959.
(9) Ermatchkov, V.; Kamps, A. P. -S.; Maurer, G. J. Chem. Thermodynamics., 2003, 35, 1277.
Prepr. Pap.-Am. Chem. Soc., Div. Fuel Chem. 2004, 49 (1), 361

CO2 EXTRACTION FROM AMBIENT AIR USING ALKALI-METAL HYDROXIDE SOLUTIONS: NICHE
MARKETS TO INDUSTRIAL SCALE IMPLEMENTATION
Gregory V. Lowry1, Joshuah Stolaroff1, and David Keith2
1Civil & Environmental Engineering, and
2Engineering & Public Policy Carnegie Mellon University
Pittsburgh, PA 15213 Introduction Global climate change is one of the most serious environmental problems facing the world. In order to mitigate climate change, deep reductions in carbon dioxide (CO2) emissions will be required in the coming decades. This necessity is at odds with fossil fuels’ overwhelming dominance as an energy source. By capturing and storing CO2 in sinks other than the atmosphere, atmospheric CO2 levels can be stabilized or lowered while fossil fuels and their associated infrastructure are phased out more slowly and thus at lower social cost. Given the extent of emissions reductions needed to stabilize atmospheric CO2 concentrations and the inertia involved in shifting the world's primary energy sources, carbon capture and storage (CCS) will likely constitute a substantial share of emissions reductions in the near- to medium-term. Nearly all current research on CCS focuses on capturing CO2 from large, stationary sources, such as power plants, as it is produced. Such plans usually entail capturing CO2 from flue gas, compressing it, and transporting it via pipeline to a sequestration site. In contrast, the research proposed here focuses on capturing CO2 directly from ambient air. The capture unit can be located at a favorable sequestration site, avoiding the need for a CO2-transportation infrastructure. This strategy has the advantage that CO2 emissions from any sector can be captured: power plants which are difficult to retrofit, point sources in locations where new infrastructure is expensive or impractical to build, and diffuse sources such as automobiles. Previous research by our group indicated that dilute aqueous alkali-metal solutions derived from CaO- and MgO-rich waste streams (e.g. steel slag and concrete waste) effectively removed CO2 from ambient air. The economic of CO2 extraction from air using these wastes can be favorable under certain conditions, but the mass of carbon that can be captured and sequestered is small. The aim of this research is to design and analyze an industrial scale system for capturing CO2 from ambient air that uses well-understood technologies available today, that is simple and inexpensive, and that is scalable to handle a significant fraction of anthropogenic CO2 emissions. With these goals, the scheme depicted in Figure 1 has been devised as a basis for analysis. In it, air is forced through a cooling-tower-like structure where an aqueous sodium hydroxide (NaOH) solution is sprayed and collected by gravity. The NaOH droplets absorb CO2 from the air, yielding NaHCO3(aq). The collected solution is piped to a batch reactor for a sodium-calcium exchange process. The regenerated NaOH is recycled to the contactor and the CaCO3 formed is sent to the Calciner. Upon heating the CaCO3, CO2 is driven off in a pure stream and pressurized for sequestration. The CaO formed is then recycled to the Na-Ca exchanger. The Na-Ca exchange process is well-understood and currently used at industrial scales in the pulp and paper industry with almost the precise parameters required for this scheme (Adams, 1989). The
calcining (regenerating the CaO) and hydroxylation steps are also well-understood processes used at industrial scales in the pulp and paper industry (ibid.) and during cement manufacture. The contactor is the least-specified component of the system and, as such, the subject of this research. A diagram of the proposed contactor is shown in Figure 2. The design is feasible in principle – CO2 capture at ambient concentration with NaOH solution has been demonstrated
Figure 1: Proposed process for capturing CO2 from ambient air.
Figure 2: Detail of the Contactor (Fukunaka, 1992; Spector, 1946; Greenwood, 1953), but the energy and material requirements are not known. Methods Numerical model. A numerical model was constructed of a single falling droplet of NaOH solution. The droplet falls by gravity through 100 m of air with a uniform velocity of 1 m/s. Mass transfer of CO2 into the drop was modeled with boundary layer theory. Resistance in the liquid layer was considered to be negligible because internal circulation in drops of the size range considered is relatively fast (Pruppacher, 1978). Mass transfer through the air boundary layer was estimated with an empirical relation developed for raindrops (Bird, et al, 1960) and integrated over the fall of the drop. Experimental. To confirm the theoretical calculations, experimental measurements of CO2 uptake are performed. Droplets of 1M NaOH solution are ejected from an electrostatically-charged nozzle fed by a syringe pump. Droplet diameters between 0.3 and 1.5 mm are achieved with voltages of 3-6 kV. Droplets fall through a measured distance of atmospheric air and are collected in a buffered (pH~6) solution so that subsequent CO2 uptake is negligible. The total carbonate in the buffered solution is measured using a model 1100 Total Organic Carbon (TOC) analyzer (OI Analytical). The analyzer acidifies the sample to pH<2 to convert all inorganic carbon to CO2, purges the sample with N2, and measures the resulting CO2 with a nondispersive infrared detector (NDIR). Uptake of CO2 per drop is calculated based on total CO2 captured and the total volume
Prepr. Pap.-Am. Chem. Soc., Div. Fuel Chem. 2004, 49 (1), 362
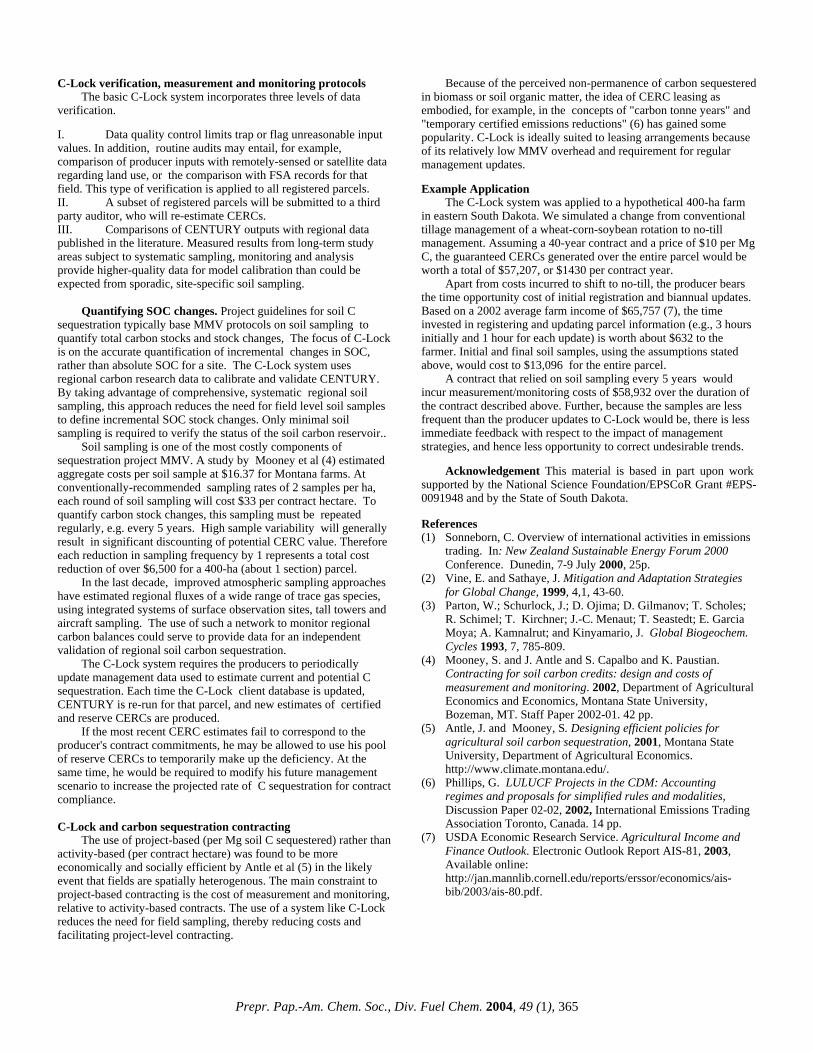
of solution collected. By repeating this experiment for a range of drop sizes an empirical prediction of CO2 uptake as a function of drop size is generated. Results
Results of the numerical model are shown in Figure 3. Concentrations of captured CO2 that approach or exceed 1 M are predicted for drops smaller than about 1 mm. A more meaningful measure of uptake efficiency may be on a per-energy basis. Energy is required to pump the solution to the top of the tower and to sustain a large enough pressure head to break the solution into mist. The energy required to move air through the contactor was estimated to
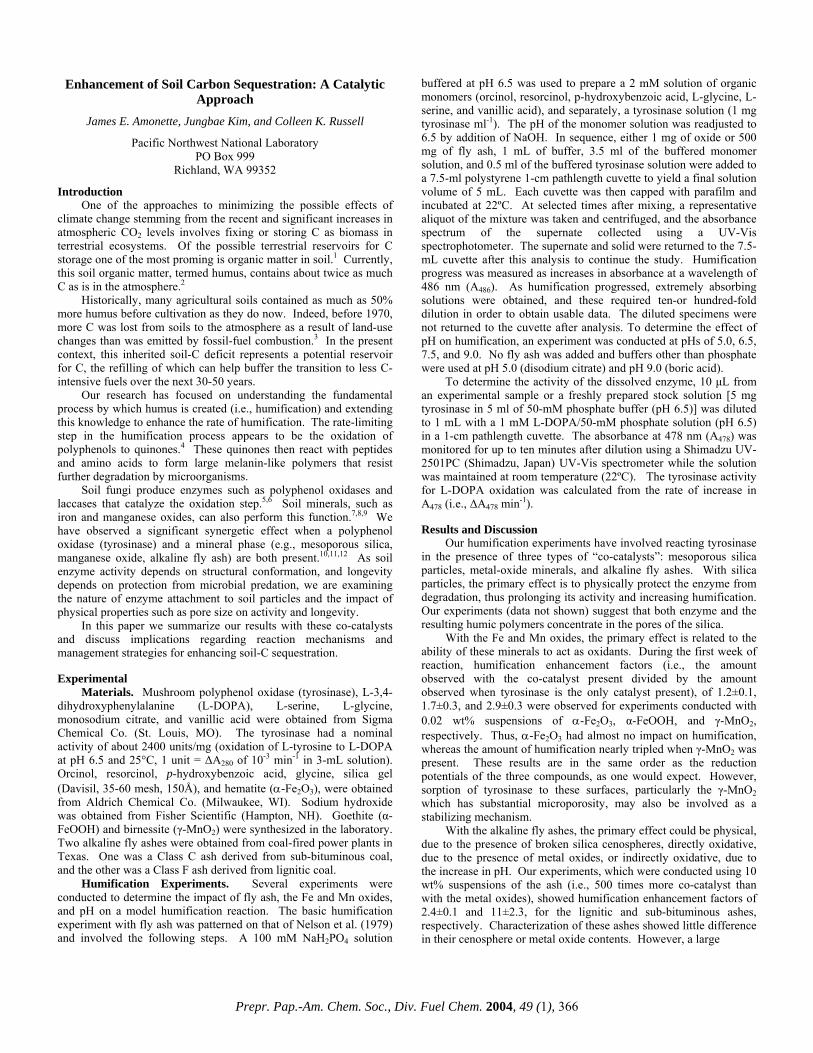
Figure 3: CO2 absorbed by falling droplets as a function of droplet diameter be small in comparison. Figure 4 shows the results converted to energy terms. For drop sizes smaller than 1 mm or so, the energy requirements are quite modest – less than 1 kJ/mol CO2 for the smallest drops, which compares favorably with, for instance, the heat of combustion of gasoline at 680 kJ/mol CO2. This is also small compared to our preliminary estimates of the energy requirements of the total system (primarily the calciner), which may amount to 220 kJ/mol CO2. Results of the laboratory experiments are pending. Discussion
CO2 capture from ambient air is an understudied but potentially important subset of CCS technology, having several strong advantages over CCS from point sources. The aim of this research is to help develop and analyze such a system that is simple, scalable, and achievable with current technology. The primary goal of this research is to develop a high-quality estimate of the cost of operation of the contacting unit, in dollars per ton of CO2 captured, that can be used in the cost-accounting of the entire system. The insight and data gained from the prototype experiments, along with data and knowledge from industry contacts, will enable this estimation.
Figure 4: Theoretical energy required for CO2 capture as a function
of droplet diameter References Adams, T. N. (1989). Lime Reburning. Pulp and Paper manufacture
Vol. 5 Alkaline Pulping. T. M. Grace, B. Leopold and E. W. Malcolm. Atlanta, The Joint Textbook Committee of the Paper Industry. 5: 590-608.
Fukunaka, Yasuhiro (1992). “Absorption of CO2 Gas into falling droplets of aqueous NaOH solution.” Metallurgical Review of MMIJ. 9 (1): 33-50.
Greenwood, K. and M. Pearce (1953). "The Removal of Carbon Dioxide from Atmospheric Air by Scrubbing with Caustic Soda in Packed Towers." Transactions of the Institution of Chemical Engineers 31: 201-207.
Spector, Norman A. and Barnett F. Dodge (1946). “Removal of Carbon Dioxide from Atmospheric Air.” Transactions of the American Institute of Chemical Engineers. 42: 827-848.
Bird, R. Byron, Stewart, Warren E., Lightfoot, Edwin N. (1960). ``Transport Phenomena". John Wiley and Sons. New York.
Pruppacher, H. R., Klett, J. O. (1978). ``Microphysics of Clouds and Precipitation". D. Reidel. Boston.
Prepr. Pap.-Am. Chem. Soc., Div. Fuel Chem. 2004, 49 (1), 363

C-LOCK: AN ONLINE SYSTEM TO MAXIMIZE THE VALUE OF AGRICULTURAL CARBON
SEQUESTRATION FOR PRODUCERS AND PURCHACERS
Patrick R. Zimmerman1, Maribeth Price2, Karen Updegraff1 and
William J. Capehart1
(1) Institute of Atmospheric Sciences
(2) Department of Geology, South Dakota School of Mines and Technology
501 E. St. Joseph St., Rapid City, SD 57701-3995
Introduction Many industrial and energy firms are interested in lowering
their future exposure to financial risk, in the event that greenhouse gas emission caps are implemented. Emissions offsets generated by landowners who retire cropland or move to less intensive tillage, thereby increasing the amount of organic carbon (SOC) stored in soils, have good investment potential. However, soil carbon trades to date have been idiosyncratic events associated with large uncertainties and therefore low prices for the sellers. Institutional deficiences, issues of measurement, monitoring and verification (MMV), and compliance enforcement all conspire to raise offset costs for buyers and lower payments to sellers (1,2).
By standardizing the estimation of SOC sequestered on individual parcels, and subjecting each estimate to rigorous uncertainty analysis and validation, the C-Lock system reduces the risk associated with trades of carbon emission reduction credits (CERCs). Because of reduced dependence on field-level sampling to determine changes in SOC, the system facilitates low-cost performance-based MMV of sequestration projects. This helps to reduce transaction costs and increase the value of soil carbon sequestration for landowners.
An overview of C-Lock and a demonstration application to a South Dakota farm highlights its MMV advantages and potential cost savings compared to sampling-based protocols.
The C-Lock System
C-Lock is comprised of a web interface, a client database, a GIS database and the CENTURY soil carbon model (3), which are linked by a system of Shell and Perl scripts. A Monte Carlo-based repeated simulation procedure is used for uncertainty analysis.
C-Lock will ultimately be licensed to a private entity who will provide administrative and certification services. This entity will need to populate soil, climate and crop history databases and possibly calibrate CENTURY for states other than South Dakota in which the system is applied.
Process Summary. The client creates a private account via a secure web interface. The spatial coordinates of the registered parcel link client data to GIS databases. The client selects management options for defined time blocks between 1900 and 1989 via drop-down menus. For 1990 to the present he is required to specify annual crop and management parameters, including tillage and fertilizer schedules, although default parameter values are available for common crops. The client may specify a future date to which he would like to estimate carbon sequestration. Management parameters specified for 1990-1999 are recycled to create future scenarios.
The location of the client parcel links it to a GIS database of climate (monthly temperature and precipitation) and soil data. Generalized management data for historical time blocks are selected based on the climate zone (MLRA) in which the parcel is located.
The client-specific and general management data, climate and soil parameters are used to create parameter and event-schedule files for CENTURY, which models SOC dynamics over a specified period as a function of substrate, climate, cover type and management. A 3000-year base run is used to establish a stable pre-agricultural SOC pool. Agricultural disturbance begins around 1900. The degree of disturbance is specified through client-selected management options. Sensitivity testing has indicated that specific crops or tillage schedules have less impact on long-term SOC depletion than does the fact that annual tillage occurs.
Based on client input and the GIS-derived soil, climate and management parameters, the CENTURY model produces estimates of soil C that allow the calculation of credits for net C sequestration. However, because of the uncertainty inherent in the estimation of many input parameters and in the modeling process itself, the CENTURY model is run for a given parcel not just once but at least 200 times. Monte Carlo sampling of the most uncertain input parameters, such as soil texture or of parameters describing cultivation impacts, allows the construction of well-defined confidence intervals for credits estimated on a given parcel.
An important advantage of the model-based approach is that it can ensure that the additionality criterion for carbon offset projects is met. While most offset or emissions reduction projects use a simple mean (e.g. 1985-89) emissions rate as the emissions baseline, this approach has shortcomings in a terrestrial C sequestration project. Preliminary tests have indicated that the use of a baseline emissions rate is likely to bias calculated CERCs, since terrestrial emissions are subject to the vagaries of weather. Atypical growing conditions during the baseline period could result in unrealistically high or low estimates of C sequestration..
Therefore, in order to factor out all non-anthropogenic effects on soil C dynamic, the client-defined scenario is modeled in parallel with a business-as-usual (BAU) scenario. Through 1989 the client and BAU scenarios are identical; beginning in 1990 the client scenario is defined by management parameters specified for each year by the client, but the BAU scenario recycles the management option selected by the client for the 1982-1989 time block. Thus, rather than establishing a baseline emissions rate C-Lock establishes a baseline management scenario. The client and BAU scenarios are both subjected to Monte Carlo analysis, using exactly identical "random" weather and parameter files. Consequently any difference in soil C between the two scenarios is due exclusively to management effects.
The client report summarizes trends in soil C resulting from the client-defined CENTURY run, and cumulative CERCs for each decade of the specified contract period. The reported CERCs are based on the 200-iteration Monte Carlo run. Likely ranges of accrued CERCs are defined by the 95 percent confidence intervals for Monte Carlo output, as described below.
Certification of CERCs. C-Lock produces two independent distributions of Monte Carlo output, which are used to define a pool of marketable CERCs associated with a high degree of confidence. These are CERCs that fall between the upper 95th percentile of the BAU output range and the lower 95th percentile of the client output range. These represent the minimum level of CERCs that can be guaranteed at the 95 percent confidence level. A reserve pool of CERCs is based on the upper 95th percentile of the client scenario and the lower 95th percentile of the BAU scenario.
Prepr. Pap.-Am. Chem. Soc., Div. Fuel Chem. 2004, 49 (1), 364
C-Lock verification, measurement and monitoring protocols The basic C-Lock system incorporates three levels of data
verification.
I. Data quality control limits trap or flag unreasonable input values. In addition, routine audits may entail, for example, comparison of producer inputs with remotely-sensed or satellite data regarding land use, or the comparison with FSA records for that field. This type of verification is applied to all registered parcels. II. A subset of registered parcels will be submitted to a third party auditor, who will re-estimate CERCs. III. Comparisons of CENTURY outputs with regional data published in the literature. Measured results from long-term study areas subject to systematic sampling, monitoring and analysis provide higher-quality data for model calibration than could be expected from sporadic, site-specific soil sampling.
Quantifying SOC changes. Project guidelines for soil C sequestration typically base MMV protocols on soil sampling to quantify total carbon stocks and stock changes, The focus of C-Lock is on the accurate quantification of incremental changes in SOC, rather than absolute SOC for a site. The C-Lock system uses regional carbon research data to calibrate and validate CENTURY. By taking advantage of comprehensive, systematic regional soil sampling, this approach reduces the need for field level soil samples to define incremental SOC stock changes. Only minimal soil sampling is required to verify the status of the soil carbon reservoir..
Soil sampling is one of the most costly components of sequestration project MMV. A study by Mooney et al (4) estimated aggregate costs per soil sample at $16.37 for Montana farms. At conventionally-recommended sampling rates of 2 samples per ha, each round of soil sampling will cost $33 per contract hectare. To quantify carbon stock changes, this sampling must be repeated regularly, e.g. every 5 years. High sample variability will generally result in significant discounting of potential CERC value. Therefore each reduction in sampling frequency by 1 represents a total cost reduction of over $6,500 for a 400-ha (about 1 section) parcel.
In the last decade, improved atmospheric sampling approaches have estimated regional fluxes of a wide range of trace gas species, using integrated systems of surface observation sites, tall towers and aircraft sampling. The use of such a network to monitor regional carbon balances could serve to provide data for an independent validation of regional soil carbon sequestration.
The C-Lock system requires the producers to periodically update management data used to estimate current and potential C sequestration. Each time the C-Lock client database is updated, CENTURY is re-run for that parcel, and new estimates of certified and reserve CERCs are produced.
If the most recent CERC estimates fail to correspond to the producer's contract commitments, he may be allowed to use his pool of reserve CERCs to temporarily make up the deficiency. At the same time, he would be required to modify his future management scenario to increase the projected rate of C sequestration for contract compliance.
C-Lock and carbon sequestration contracting
The use of project-based (per Mg soil C sequestered) rather than activity-based (per contract hectare) was found to be more economically and socially efficient by Antle et al (5) in the likely event that fields are spatially heterogenous. The main constraint to project-based contracting is the cost of measurement and monitoring, relative to activity-based contracts. The use of a system like C-Lock reduces the need for field sampling, thereby reducing costs and facilitating project-level contracting.
Because of the perceived non-permanence of carbon sequestered in biomass or soil organic matter, the idea of CERC leasing as embodied, for example, in the concepts of "carbon tonne years" and "temporary certified emissions reductions" (6) has gained some popularity. C-Lock is ideally suited to leasing arrangements because of its relatively low MMV overhead and requirement for regular management updates.
Example Application
The C-Lock system was applied to a hypothetical 400-ha farm in eastern South Dakota. We simulated a change from conventional tillage management of a wheat-corn-soybean rotation to no-till management. Assuming a 40-year contract and a price of $10 per Mg C, the guaranteed CERCs generated over the entire parcel would be worth a total of $57,207, or $1430 per contract year.
Apart from costs incurred to shift to no-till, the producer bears the time opportunity cost of initial registration and biannual updates. Based on a 2002 average farm income of $65,757 (7), the time invested in registering and updating parcel information (e.g., 3 hours initially and 1 hour for each update) is worth about $632 to the farmer. Initial and final soil samples, using the assumptions stated above, would cost to $13,096 for the entire parcel.
A contract that relied on soil sampling every 5 years would incur measurement/monitoring costs of $58,932 over the duration of the contract described above. Further, because the samples are less frequent than the producer updates to C-Lock would be, there is less immediate feedback with respect to the impact of management strategies, and hence less opportunity to correct undesirable trends.
Acknowledgement This material is based in part upon work
supported by the National Science Foundation/EPSCoR Grant #EPS-0091948 and by the State of South Dakota. References (1) Sonneborn, C. Overview of international activities in emissions
trading. In: New Zealand Sustainable Energy Forum 2000 Conference. Dunedin, 7-9 July 2000, 25p.
(2) Vine, E. and Sathaye, J. Mitigation and Adaptation Strategies for Global Change, 1999, 4,1, 43-60.
(3) Parton, W.; Schurlock, J.; D. Ojima; D. Gilmanov; T. Scholes; R. Schimel; T. Kirchner; J.-C. Menaut; T. Seastedt; E. Garcia Moya; A. Kamnalrut; and Kinyamario, J. Global Biogeochem. Cycles 1993, 7, 785-809.
(4) Mooney, S. and J. Antle and S. Capalbo and K. Paustian. Contracting for soil carbon credits: design and costs of measurement and monitoring. 2002, Department of Agricultural Economics and Economics, Montana State University, Bozeman, MT. Staff Paper 2002-01. 42 pp.
(5) Antle, J. and Mooney, S. Designing efficient policies for agricultural soil carbon sequestration, 2001, Montana State University, Department of Agricultural Economics. http://www.climate.montana.edu/.
(6) Phillips, G. LULUCF Projects in the CDM: Accounting regimes and proposals for simplified rules and modalities, Discussion Paper 02-02, 2002, International Emissions Trading Association Toronto, Canada. 14 pp.
(7) USDA Economic Research Service. Agricultural Income and Finance Outlook. Electronic Outlook Report AIS-81, 2003, Available online: http://jan.mannlib.cornell.edu/reports/erssor/economics/ais-bib/2003/ais-80.pdf.
Prepr. Pap.-Am. Chem. Soc., Div. Fuel Chem. 2004, 49 (1), 365
Enhancement of Soil Carbon Sequestration: A Catalytic Approach
James E. Amonette, Jungbae Kim, and Colleen K. Russell
Pacific Northwest National Laboratory
PO Box 999 Richland, WA 99352
Introduction
One of the approaches to minimizing the possible effects of climate change stemming from the recent and significant increases in atmospheric CO2 levels involves fixing or storing C as biomass in terrestrial ecosystems. Of the possible terrestrial reservoirs for C storage one of the most proming is organic matter in soil.1 Currently, this soil organic matter, termed humus, contains about twice as much C as is in the atmosphere.2
Historically, many agricultural soils contained as much as 50% more humus before cultivation as they do now. Indeed, before 1970, more C was lost from soils to the atmosphere as a result of land-use changes than was emitted by fossil-fuel combustion.3 In the present context, this inherited soil-C deficit represents a potential reservoir for C, the refilling of which can help buffer the transition to less C-intensive fuels over the next 30-50 years.
Our research has focused on understanding the fundamental process by which humus is created (i.e., humification) and extending this knowledge to enhance the rate of humification. The rate-limiting step in the humification process appears to be the oxidation of polyphenols to quinones.4 These quinones then react with peptides and amino acids to form large melanin-like polymers that resist further degradation by microorganisms.
Soil fungi produce enzymes such as polyphenol oxidases and laccases that catalyze the oxidation step.5,6 Soil minerals, such as iron and manganese oxides, can also perform this function.7,8,9 We have observed a significant synergetic effect when a polyphenol oxidase (tyrosinase) and a mineral phase (e.g., mesoporous silica, manganese oxide, alkaline fly ash) are both present.10,11,12 As soil enzyme activity depends on structural conformation, and longevity depends on protection from microbial predation, we are examining the nature of enzyme attachment to soil particles and the impact of physical properties such as pore size on activity and longevity.
In this paper we summarize our results with these co-catalysts and discuss implications regarding reaction mechanisms and management strategies for enhancing soil-C sequestration. Experimental
Materials. Mushroom polyphenol oxidase (tyrosinase), L-3,4-dihydroxyphenylalanine (L-DOPA), L-serine, L-glycine, monosodium citrate, and vanillic acid were obtained from Sigma Chemical Co. (St. Louis, MO). The tyrosinase had a nominal activity of about 2400 units/mg (oxidation of L-tyrosine to L-DOPA at pH 6.5 and 25°C, 1 unit = ∆A280 of 10-3 min-1 in 3-mL solution). Orcinol, resorcinol, p-hydroxybenzoic acid, glycine, silica gel (Davisil, 35-60 mesh, 150Å), and hematite (α-Fe2O3), were obtained from Aldrich Chemical Co. (Milwaukee, WI). Sodium hydroxide was obtained from Fisher Scientific (Hampton, NH). Goethite (α-FeOOH) and birnessite (γ-MnO2) were synthesized in the laboratory. Two alkaline fly ashes were obtained from coal-fired power plants in Texas. One was a Class C ash derived from sub-bituminous coal, and the other was a Class F ash derived from lignitic coal.
Humification Experiments. Several experiments were conducted to determine the impact of fly ash, the Fe and Mn oxides, and pH on a model humification reaction. The basic humification experiment with fly ash was patterned on that of Nelson et al. (1979) and involved the following steps. A 100 mM NaH2PO4 solution
buffered at pH 6.5 was used to prepare a 2 mM solution of organic monomers (orcinol, resorcinol, p-hydroxybenzoic acid, L-glycine, L-serine, and vanillic acid), and separately, a tyrosinase solution (1 mg tyrosinase ml-1). The pH of the monomer solution was readjusted to 6.5 by addition of NaOH. In sequence, either 1 mg of oxide or 500 mg of fly ash, 1 mL of buffer, 3.5 ml of the buffered monomer solution, and 0.5 ml of the buffered tyrosinase solution were added to a 7.5-ml polystyrene 1-cm pathlength cuvette to yield a final solution volume of 5 mL. Each cuvette was then capped with parafilm and incubated at 22ºC. At selected times after mixing, a representative aliquot of the mixture was taken and centrifuged, and the absorbance spectrum of the supernate collected using a UV-Vis spectrophotometer. The supernate and solid were returned to the 7.5-mL cuvette after this analysis to continue the study. Humification progress was measured as increases in absorbance at a wavelength of 486 nm (A486). As humification progressed, extremely absorbing solutions were obtained, and these required ten-or hundred-fold dilution in order to obtain usable data. The diluted specimens were not returned to the cuvette after analysis. To determine the effect of pH on humification, an experiment was conducted at pHs of 5.0, 6.5, 7.5, and 9.0. No fly ash was added and buffers other than phosphate were used at pH 5.0 (disodium citrate) and pH 9.0 (boric acid).
To determine the activity of the dissolved enzyme, 10 µL from an experimental sample or a freshly prepared stock solution [5 mg tyrosinase in 5 ml of 50-mM phosphate buffer (pH 6.5)] was diluted to 1 mL with a 1 mM L-DOPA/50-mM phosphate solution (pH 6.5) in a 1-cm pathlength cuvette. The absorbance at 478 nm (A478) was monitored for up to ten minutes after dilution using a Shimadzu UV-2501PC (Shimadzu, Japan) UV-Vis spectrometer while the solution was maintained at room temperature (22ºC). The tyrosinase activity for L-DOPA oxidation was calculated from the rate of increase in A478 (i.e., ∆A478 min-1). Results and Discussion
Our humification experiments have involved reacting tyrosinase in the presence of three types of “co-catalysts”: mesoporous silica particles, metal-oxide minerals, and alkaline fly ashes. With silica particles, the primary effect is to physically protect the enzyme from degradation, thus prolonging its activity and increasing humification. Our experiments (data not shown) suggest that both enzyme and the resulting humic polymers concentrate in the pores of the silica.
With the Fe and Mn oxides, the primary effect is related to the ability of these minerals to act as oxidants. During the first week of reaction, humification enhancement factors (i.e., the amount observed with the co-catalyst present divided by the amount observed when tyrosinase is the only catalyst present), of 1.2±0.1, 1.7±0.3, and 2.9±0.3 were observed for experiments conducted with 0.02 wt% suspensions of α-Fe2O3, α-FeOOH, and γ-MnO2, respectively. Thus, α-Fe2O3 had almost no impact on humification, whereas the amount of humification nearly tripled when γ-MnO2 was present. These results are in the same order as the reduction potentials of the three compounds, as one would expect. However, sorption of tyrosinase to these surfaces, particularly the γ-MnO2 which has substantial microporosity, may also be involved as a stabilizing mechanism.
With the alkaline fly ashes, the primary effect could be physical, due to the presence of broken silica cenospheres, directly oxidative, due to the presence of metal oxides, or indirectly oxidative, due to the increase in pH. Our experiments, which were conducted using 10 wt% suspensions of the ash (i.e., 500 times more co-catalyst than with the metal oxides), showed humification enhancement factors of 2.4±0.1 and 11±2.3, for the lignitic and sub-bituminous ashes, respectively. Characterization of these ashes showed little difference in their cenosphere or metal oxide contents. However, a large
Prepr. Pap.-Am. Chem. Soc., Div. Fuel Chem. 2004, 49 (1), 366

difference in their titrateable alkalinity (pH 6.5) was observed, with that of the sub-bituminous fly ash (13.4 mmol g-1) being about 4.6 times larger than that of the lignitic fly ash (2.9 mmol g-1), the same factor by which their humification enhancement factors differed. Moreover, for the 0.5-g quantities used in the humification experiments, the alkalinity of both fly ashes was substantially greater than the capacity of the phosphate buffer (ca. 0.5 mmol) resulting in substantial pH increases in these experiments as the fly ashes equilibrated with the humic monomer solution. These results led us to investigate the effect of pH alone on the humification reaction.
Humification experiments at pHs of 5, 6.5, 7.5, and 9 clearly showed a substantial effect of alkaline pH on humification (Fig. 1a). Essentially no humification occurred at pH 5, whereas maximal humification occurred at pH 9. Humification occurred primarily during the first 72-96 hours, and thereafter, little change was observed. Measurement of the enzyme activity during the experiment showed that activity held steady for perhaps 48-60 hours and then dropped rapidly to zero by 96 hours (Fig. 1b). The enzyme activity at pH 9, however, was consistently smaller than that for any other pH, even though the same trend with time was observed. In the absence of tyrosinase, negligible amounts of humification were observed in all but the pH-9 treatments (Fig. 1c), where maximum humification was still only about 5% of that observed when tyrosinase was present.
These results confirm the sequential two-step nature of the humification process, i.e., oxidation of phenolic groups followed by condensation of the resulting quinones with amino acids to form melanins. High pH enhances the process primarily through its effect on the condensation step. Thus, maximum humification rates were obtained at pH 9 even though the enzyme activities were relatively low, whereas no humification was observed at pH 5 when enzyme activities were higher than at pH 9 (Fig. 1a,b). Tyrosinase is needed for the reaction to occur at a useful rate (Fig. 1c), but the level of tyrosinase activity seems less important than high pH in determining the yield of humic polymers. The manner by which condensation is enhanced likely relates to the speciation of the reactants at high pH. Quinones are stabilized, and the pKa of aliphatic amine groups is near 10. It could be that the anionic form of the amino acids (i.e., a neutral amine group) is critical to the condensation step.
Conclusions
We conclude that co-catalysis of humification occurs by three mechanisms involving physical stabilization of tyrosinase, direct oxidation of the monomers, and promotion of the oxidation and condensation steps by alkaline pH. Although tyrosinase activity is greatest at neutral pHs, the large pH dependence of the condensation step drives the overall reaction to maximum rates under alkaline conditions. Liming of soils to slightly alkaline pH should enhance net carbon sequestration. Alkaline fly ash is a potential liming agent for soils provided that the carbon costs associated with transportation from the source are less than the organic carbon that is humified.
Acknowledgments. Research supported in part by the U. S. Department of Energy’s (DOE) National Energy Technology Laboratory, in part by the DOE’s Office of Biological and Environmental Research (OBER) through the Carbon Sequestration in Terrestrial Ecosystems (CSiTE) project, and in part by the U. S. Department of Agriculture through the Consortium for Agricultural Soils Mitigation of Greenhouse Gases (CASMGS) project. Research was performed at the W.R. Wiley Environmental Molecular Sciences Laboratory, a national scientific user facility at the Pacific Northwest National Laboratory (PNNL) sponsored by the DOE-OBER. The PNNL is operated for the DOE by Battelle Memorial Institute under contract DE AC06 76RL01830.
Figure 1. Effect of pH on rates of humification and on tyrosinase activity: a) humification with tyrosinase present; b) tyrosinase activity during the humification experiment; and c) humification in the absence of tyrosinase. References (1) Metting, F. B. Jr.; Smith, J. L.; Amthor, J. S.; and Isaurralde, R. C.
Climatic Change 2001, 51, 11. (2) Eswaran, H.; Reich, P. F.; Kimble, J. M.; Beinroth, F. H.; Padmanabhan,
E.; and Moncharoen, P. In Global Climate Change and Pedogenic Carbonates; Lal, R., Kimble, J. M., Eswaran, H. and Stewart, B. A. Eds.; Lewis Publishers: Boca Raton, FL 2000. pp. 15-25.
(3) Houghton, R. A.; Hobbie, J. E.; Melillo, J. M.; Moore, B.; Peterson, B. J.; Shaver, G. R., and Woodwell, G. M. Ecol. Monogr. 1983, 53, 235.
(4) Stevenson, F. J. Humus chemistry: genesis, composition, reactions. 2nd ed. Wiley: New York. 1994.
(5) Martin, J. P.; and Haider, K. Soil Sci. 1969, 107, 260. (6) Martin, J. P.; and Haider, K. Soil Sci. 1971, 111, 54. (7) Shindo, H.; and Huang, P. M. Soil Sci. Soc. Am. J. 1984, 48, 927. (8) Stone, A. T.; and Morgan, J. J. Environ. Sci. Technol. 1984, 18, 617. (9) McBride, M. B. Soil Sci. Soc. Am. J. 1987, 51, 1466. (10) Amonette, J. E.; Capp, J. A.; Lüttge, A.; Baer, D. R.; and Arvidson, R. S.
In Annual Report 1999, Environmental Dynamics and Simulation, PNNL-13206/UC-400, 2000; pp. 3-23 to 3-27.
(11) Amonette, J. E.; Kim, J.; Russell, C. K.; Palumbo, A. V.; and Daniels, W. L. Proc. 2nd Ann. Conf. Carbon Sequest., Alexandria, VA. 2003.
(12) Amonette, J. E.; Kim, J.; Russell, C. K.; Palumbo, A. V.; and Daniels, W. L. Proc. 2003 Int. Ash Util. Symp. Lexington, KY. 2003.
Prepr. Pap.-Am. Chem. Soc., Div. Fuel Chem. 2004, 49 (1), 367
Can We Sequester Large Quantities of Atmospheric Carbon in the Arctic Permafrost?
Professor Alex T. Wilson
Dept. of Geosciences University of Arizona
Tucson, Arizona 85721 Introduction
A band of Boreal Forest stretches around the Northern Hemisphere land masses. The northern section of this forest becomes stunted trees, which thin out, and muskeg (bog) begins to appear. This area is called the Taiga. Still further north, the trees give way to the Tundra. The Arctic Tundra covers 13 million square kilometers. The surface of the tundra comprises a thin layer of peat, which is thawed and frozen during each annual cycle. By the end of an Arctic winter, everything is completely frozen. During the summer, the surface of the Arctic bog thaws. This thawed layer is called the active layer and its thickness is a constant for a given climate regime. The region under the active layer remains permanently frozen and is called permafrost. It may be hundreds of feet thick.
The plants that grow in this “active layer” have adequate water and a reasonable amount of sunlight, but have a very small supply of nutrients. Since the tundra plants are underlain by permanently frozen ground, the only nutrient supply is via the air. If some way could be found to supply nitrogenous fertilizer to these plants, it would lead to a great increase in the plant production rate. This would raise the level of the surface, which in turn would raise the surface of the permafrost, since the active layer is of constant thickness. The rising of the surface of the permafrost would trap organic matter, removing it from interacting with the atmosphere. This would lead to the permanent sequestration of atmospheric carbon in the permafrost. This paper suggests how this might be done on a scale that could make a large contribution to the mitigation of the Greenhouse Problem.
Plant Growth Rates in the Tundra
The plant growth or dry matter production rates in the Arctic tundra are incredibly low – of the order of 10 lbs/acre/yr. Compare this to 5,000 lbs./acre /yr on temperate grazing land. The Arctic tundra has adequate water and comparable solar energy, albeit 24 hours a day and only in the summer. The problem is that the nutrient supply is extremely low. The tundra plants are underlain by frozen material and the only nutrient supply is via the air.
The principal source of utilizable nitrogen is probably from the Aurora Borealis--a few pounds of N per acre per year. The most critical nutrient is nitrogen. If nitrogenous fertilizer could be added to these plants, the dry matter production rate would increase, and the surface of the peat would rise. This would cause the permafrost surface to rise, which would lead to the entrapment of large quantities of atmospheric carbon.
The most economical source of nitrogen would be to operate high temperature gas turbines fueled by the abundant quantities of natural gas and methane-water clathrates found in the Arctic. If atmospheric air is heated to high temperatures, for example by lightning, by the Aurora Borealis, by passing through an electric plasma arc, or in a gas turbine, nitrogen is oxidized to nitric oxide and nitrogen dioxide (NOx).
In the natural environment, these rapidly convert to nitrate, and would result in very efficient foliar application (directly to the leaves) of nitrate to the tundra plants. The foliar application of this
fertilizer could result in up to a hundredfold increase in the growth rate of tundra plants.
Nitrogen can be oxidized by direct combustion at very high temperatures. Since the reaction is endothermic, the proportion of oxidized nitrogen at equilibrium rises rapidly with the temperature. With the air at atmospheric pressure, the amount oxidized is 1.2 % by volume at 2000 C, and 5.3 % at 3000 C. This was the basis of the industrial fixation of nitrogen. (Birkeland-Eyde process, which used a plasma arc).
Special high-temperature gas turbines could be developed using ceramic parts. By adjusting the temperature of operation of the gas turbines, the amount of fixation and hence the carbon dioxide composition of the Earth’s atmosphere could be controlled. The thermodynamic efficiency of a power station is proportional to the difference of the absolute temperature of the turbine and the absolute temperature of the discharge, divided by the absolute temperature of the turbine. Hence, it is desirable for power plants to operate at as high a temperature as possible. In populated areas temperatures are limited by NOx emissions.
In the Arctic tundra the soils, lakes and rivers are all very acidic due to the presence of humic acid. The overall reaction consumes atmospheric nitrogen and produces basic nitrogen compounds, which will lead to the overall reduction of total acidity. Evidence That Power Stations Can Increase the Growth Rate of Tundra Plants
BP-Alaska has been operating gas turbines at its installation at Prudhoe Bay for the last 30 years. This installation is in the middle of the Central Alaska Caribou Herd range. In 1970, the herd had 3000 animals. At present, the herd has grown to 36,000—a twelve-fold increase. The arctic caribou herds range in distinct areas with little interchange of animals among herds. The Central Arctic Caribou Herd occupies a 15,000 square mile area around Prudhoe Bay, and the herd ranges on 10 million acres in which is situated the BP-Alaska oil field operation at Prudhoe Bay. The adjacent herds have increased slightly but less than a factor of two.
Assume that each caribou consumes 2.5 tons of above-ground dry matter per year. As noted above, in 1970 the herd had 3000 members. This represents a “carrying capacity” of one caribou/3000 ac. This implies a dry matter production rate of 2 lb/ac for this tundra area in its original state. At present, the herd has increased by a factor of 12 – a remarkable feat by normal agricultural standards. As stated earlier, the increase in the Central Alaska Caribou Herd could be interpreted as a sizable increase in the above-ground dry-matter production rate. There should be a new lens of peat in this area, which could prove direct evidence of sequestered atmospheric carbon.
Clearly, the Prudhoe Bay “experiment” is an important pilot project and should be studied in detail. (Interestingly, BP Alaska has tried to keep its NOx levels as low as possible.) The increase in caribou numbers implies an above-ground dry matter production rate of 24lb/ac/yr. This represents an increase in the total production rate of 110,000 tons/year. To determine the amount of carbon sequestered, we should double this figure, since most plants have as much growth below the ground as above, and multiply by 0.4 (peat contains about 40% carbon).
The implication is that the Prudhoe Bay turbines are sequestering 100,000 tons of atmospheric carbon per year. We might be able to increase this by an order of magnitude. If we burn one ton of carbon (as methane) in a gas turbine situated in tundra muskeg, how many tons of carbon will be sequestered as frozen peat? On the basis of passing the methane through at a 8% fuel/air
Prepr. Pap.-Am. Chem. Soc., Div. Fuel Chem. 2004, 49 (1), 368

ratio, and with the turbine operating at a temperature of 2000 C, we would fix 1.2% of the contained nitrogen, which would be ¼ ton. On the assumption that permafrost peat has a C/N ratio of 800 and that we lose half the nitrogen fixed (through denitrification and other losses), we might expect to remove 100 tons of carbon (as CO2) from the atmosphere. If the turbine could be operated at 3000 C, this number would be 440 tons of carbon sequestered for each ton of methane carbon burned.Advantages of Sequestering Carbon With High-Temperature Gas Turbines
This could be a method of controlling, rather than reducing, the CO2 composition of the atmosphere. In addition, it can be done at no net cost to the public; in fact, it can be done at a profit. And this method will enhance and not harm the tundra ecosystem, which comprises 10% of the Earth’s land surface. The Current Importance of the Tundra in Sequestration
Since the end of the last ice age, more than 400 gigatons of carbon has been accumulated as frozen peat in the Arctic permafrost. This represents more than 60 times the amount of carbon put into the atmosphere every year by humankind. If the temperature of the Arctic is allowed to rise (which seems to be happening now) the thickness of the active layer will increase, the surface of the permafrost will melt, and large quantities of carbon will be released to the Earth’s atmosphere.
However, even if the temperature of the Arctic rises, we could still prevent the permafrost from melting by making the surface plants grow more rapidly, as is previously described. The Potential Future of the Tundra It is interesting to note that the tundra is the only remaining region of our planet with adequate sunlight and water that has not been agriculturally exploited by humankind.
If this proposal was implemented, a possible future scenario might be the following: The tundra would have methane–burning gas turbine power stations at 200 mile intervals on large natural gas pipelines. The turbines would be large and high-temperature, designed to throw their plume high into the atmosphere to get as much coverage as possible. As the productivity rises, other nutrients may be required (e.g. trace elements) and a solution of these could be sprayed into the turbine discharge.
Transmission lines would send electric power to southern population centers. The increased productivity of the tundra would enable reindeer (a domesticated version of caribou) and musk ox ranching, adding to the Arctic economy and providing an additional source of high-quality protein for marketing to the world. Finally, the gas turbine stations would be adjustable to control the carbon dioxide composition of the atmosphere to produce an optimum temperature for the Earth – which might be different than that of the present.
The Current Opportunity In the Energy Bill before Congress there is a proposal to build a very large natural gas pipeline from Prudhoe Bay to Chicago. This will present a low cost opportunity to set up such a system as proposed above. It offers an opportunity to use large quantities of Alaskan natural gas without any net addition of carbon dioxide to the atmosphere. Further, it would act as a model for using eastern Siberian natural gas in China. There are large deposits of natural gas and vast areas of tundra immediately to the north of China, which could yield large amounts of energy with no addition of carbon to the atmosphere. In fact, it would almost certainly have the net effect of removing carbon from the atmosphere. This may be an alternative to China’s use of its coal deposits.
Prepr. Pap.-Am. Chem. Soc., Div. Fuel Chem. 2004, 49 (1), 369

COMMENTS ON THE WEST COAST REGIONAL PARTNERSHIP AND RELATED ACTIVITIES
Terry Surles
Director and CEO, Pacific International Center for High Technology
Research (PICHTR), Public Interest Energy Research (PIER) Program Director, California Energy Commission (CEC), 1516 9th
Street, Sacramento, CA 95814-5512
The California Energy Commission has recently been given one of the regional CO2 sequestration partnerships from the US Department of Energy (DOE). The purpose of this talk will be to provide an overview of DOE’s efforts in developing a sustained program commencing in 1997. There will also be a discussion on some of the related sequestration efforts by the Energy Commission and its partners which includes Oregon, Alaska, Washington, and Nevada, Electricity Innovation Institute, BP, Shell/AERA, Occidental Petroleum, Lawrence Berkeley and Lawrence Livermore National, Kinder-Morgan, and utility partners. The discussion will focus on the need for a balanced portfolio to address atmospheric carbon dioxide concentration increases within the sequestration area. The discussion will also focus on the need to address key technological and infrastructure barriers, as well as addressing environmental, institutional, regulatory, and public perception issues for terrestrial, geological, and ocean sequestration.
Prepr. Pap.-Am. Chem. Soc., Div. Fuel Chem. 2004, 49 (1), 370

REACTIVITY OF SERPENTINE IN CO2-BEARING SOLUTIONS: APPLICATION TO CO2
SEQUESTRATION J. William Carey, Hans-Joachim Ziock, and George D. Guthrie, Jr.
Earth and Environmental Sciences Los Alamos National Laboratory
Los Alamos, NM Introduction
Fossil fuels produce CO2, which is a significant greenhouse gas that contributes to global warming. Environmentally benign use of fossil fuels requires that CO2 be captured and sequestered. The reactivity of CO2 with minerals is important to several sequestration strategies. These include aboveground mineralization in which mined rock is reacted with CO2 to form permanent carbonates and belowground geologic sequestration in which the amount of in situ mineralization is an important factor in repository performance. As part of a general investigation of mineral reactivity in the H2O-CO2 system, we have investigated the reactivity of serpentine [Mg3Si2O5(OH)4] with H2O and CO2 as a function of pH and the addition of potential catalyzing agents (weak acids). Serpentine is a prime candidate for aboveground mineralization but could also occur as a caprock for the injection of CO2 belowground. Experimental
Mineral reactivity studies were conducted in an externally heated, stirred batch reactor (1.8 L Parr autoclave) with a high-pressure CO2 atmosphere applied using a gas-booster pump. All of the experiments described were conducted at 150 ºC and 2300 psi (15.9 MPa) for periods of 2 to 10 hours. The reactor included a sampling device for extracting fluids during the course of the experiment. Speciation and equilibrium calculations for the fluids were conducted using the Geochemist’s Workbench software package with activity coefficients based on the Debey-Hückel equation. The software database was modified to include a more accurate representation of the solubility of CO2 at elevated pressure. Results and Discussion
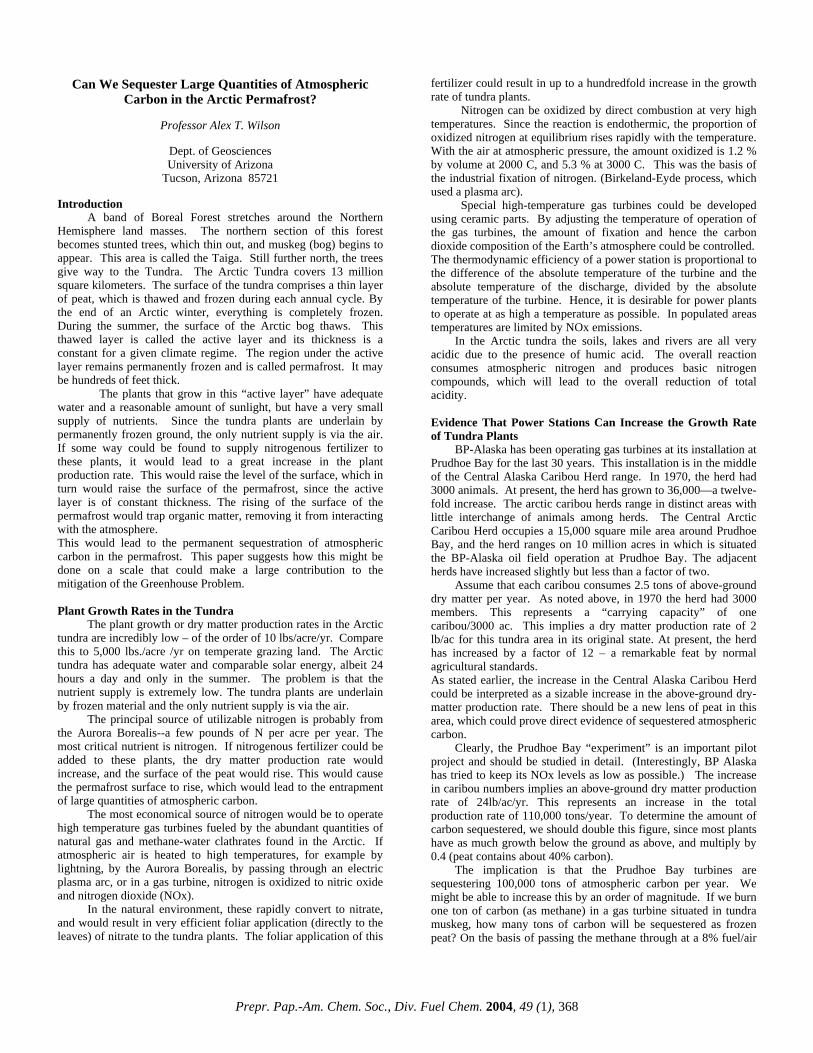
Thermodynamic calculations indicate that in CO2-rich fluids serpentine should react to produce magnesite (MgCO3) and silica at moderate temperatures and pressures, including those used in our experiments. Many of our experiments were conducted in de-ionized water (DI) or systems containing 1 m NaCl or 1 m NaCl + 0.64 m NaHCO3. None of these simple systems yielded detectable magnesite (0.1-0.2 wt%) over the course of the experiments, and x-ray diffraction analysis of the run products showed that the serpentine was unchanged.
However, experiments with strong acid (HCl) completely destroyed the serpentine and produced solutions rich in Mg2+ but from which no carbonate could be directly formed. Back-scattered electron imagery showed that the acid leached the Mg2+ from the serpentine, leaving behind a husk of amorphous silica. The leaching effect is highly desirable because it produces an insoluble residue of silica that could be easily separated with the magnesite, if the Mg2+ could be precipitated with CO2.
In an attempt to preserve the aggressive effects of HCl but operate at more moderate pH, the reactivity of serpentine with a series of weak organic and inorganic acids was investigated (Table 1). Some of these acids re also known to be effective chelating agents. None of these experiments with weak acids produced magnesite, although many produced solutions very rich in total Mg. Because of a lack of thermodynamic data, it was not possible to
calculate the equilibrium speciation for these solutions. We suspect that many of these solutions contained Mg-ligand complexes that could not be displaced by the carbonic acid generated by the dissolution of CO2. In other cases, a precipitate formed that was less soluble than magnesite under our experimental conditions.
Table 1. Organic and Inorganic Acids Used to Enhance Serpentine Reactivity
Solution† Dissolution Extent Comment Citric Acid Large increase Mg-citrate too strong EDTA Large increase Mg-EDTA too strong Oxalic acid Large increase Mg-oxalate insoluble Phosphoric acid Large increase Mg-phosphate insoluble Formic acid Large increase Solution too acidic Ascorbic acid Moderate increase No carbonate Maleic acid Moderate increase No carbonate Tartaric acid Moderate increase No carbonate Glycine Moderate increase No carbonate Pthalic acid Moderate increase No carbonate Malonic acid Moderate increase No carbonate Aspartic acid Moderate increase No carbonate Iminodiacetic acid Small increase No carbonate Acetic acid Small increase No carbonate Asparagine Small increase No carbonate Salicylate Small increase No carbonate †NaOH was used in many of the solutions to moderate the pH
Thermodynamic Analysis. Measured solution compositions were used to make equilibrium calculations for experiments in DI, NaCl-NaHCO3, and Na-acetate (Figure 1). These three cases span a range of pH and ionic strength. The DI experiment produced the lowest calculated pH and highest activity of Mg2+, and the NaCl-NaHCO3 experiment produced the highest pH and lowest activity of Mg2+. All of the experiments had solutions that were calculated to be at saturation or supersaturated with magnesite, although none yielded magnesite identifiable by x-ray diffraction.
Figure 1. Thermodynamic calculations of solution activities based on measured solution compositions for batch reactor experiments at 150 ºC, 2300 psi total pressure CO2 (approximated as with a fugacity of 12.5 Mpa). All of the experiments are saturated or supersaturated with magnesite.
These results suggested a nucleation barrier to the formation of
magnesite. However, the Na-acetate experiment was repeated with the addition of 20 wt% magnesite seeds. The x-ray diffraction result
Prepr. Pap.-Am. Chem. Soc., Div. Fuel Chem. 2004, 49 (1), 371

(19.8 wt% magnesite) was indistinguishable from no reaction. In addition, the solution composition was not significantly different than in the unseeded experiment (Figure 1).
The experiment with magnesite seeds indicates that nucleation of magnesite is not rate limiting. This is consistent with experiments on other Mg-oxide phases (see below) that generate magnesite.
Kinetics of Dissolution. The lack of observable precipitation could be explained if the rate of serpentine dissolution was sufficient to reach saturation but insufficient to produce a measurable quantity of magnesite. Carey et al.1 obtained rates of dissolution for serpentine at far from equilibrium condtions (and in the absence of CO2), including activation energies, that allow prediction of the evolution of Mg concentration in the batch reactor experiments (Figure 2). These calculations show that as much as 5-10 wt% magnesite could be produced based solely on the dissolution rate of serpentine. These calculations are conservative since the observed concentration of Mg is higher than the predicted concentrations. Consequently, a purely dissolution-limited process does not explain the lack of magnesite.
Figure 2. Measured solution compositions for batch reactor experiments at 150 ºC, 2300 psi total pressure CO2 compared with the Mg concentration at saturation of magnesite and a calculated dissolution path based on the kinetic measurements of Carey et al1.
Observations of the Reactivity of Other Mg-Oxides. The reactivity of serpentine can be compared with other Mg-bearing silicates and oxides. Periclase (MgO) and brucite [Mg(OH)2] are readily carbonated; forsterite (MgSiO4), with structurally isolated SiO4 tetrahedra, carbonates to a significant degree; enstatite (MgSiO3), with structural chains of SiO4 tetrahedra, carbonates slowly; while serpentine, which consists of sheets of SiO4 tetrahedra, is unreactive. These observations indicate that the greater the degree of silica polymerization, the less reactive is the Mg-silicate.
Methods of Inducing Reactivity in Serpentine. Three energy-intensive methods have been identified that allow carbonation of serpentine. Heat-treatment to 650 ºC dehydroxylates serpentine, disrupting the structure, and permits significant carbonation over a several hour period. Although the heat-treated serpentine can be carbonated, the resulting solution composition is indistinguishable from an experiment using raw serpentine (Figure 1). If the serpentine is heated to 840 ºC and the structure is allowed to recrystallize (to forsterite, enstatite and amorphous residue), then the degree of reactivity is reduced. Intense mechanical grinding, which renders serpentine nearly x-ray amorphous, also permits substantial carbonation2. These observations indicate that structural disruption of serpentine enhances reactivity.
A third method for inducing reactivity utilizes a strong acid (e.g., concentrated HCl) to leach the Mg2+ from the serpentine,
followed by neutralization of the solution with a strong base (e.g., NaOH) to saturate the solution with magnesite. By analogy with thermal and mechanical treatments, it appears that a strong acid can effectively “disrupt” the structure (i.e., render the Mg2+ accessible).
None of these methods are likely to be a solution for CO2 sequestration. They require too much energy or consume too much material. If the cost of sequestration becomes too high, alternative forms of energy become economically favorable.
Conclusions
The exact kinetic factors limiting the reactivity of serpentine remain obscure. Our observations indicate that rate of dissolution of serpentine cannot explain the limited reactivity. We have also shown that nucleation and growth of magnesite occurs in other Mg-oxides and in thermally or mechanically treated serpentine and so limitations due to magnesite cannot explain the lack of carbonation of serpentine.
Our data suggest two possible explanations. We note that Mg-oxides, Mg-silicates with a lower degree of silica polymerization, and thermally and mechanically treated serpentine yield magnesite. On dissolution in water, all of these compounds produce (or are likely to produce) more Mg2+ than serpentine does and, upon exposure to CO2, will be more supersaturated with magnesite than serpentine. In other words, the driving force for the conversion of these materials to magnesite is greater than that for unaltered serpentine. Perhaps, this greater degree of supersaturation overcomes some kinetic barrier, such as the release of Mg2+ from the structure or the growth of the Mg-carbonate.
Our second suggestion is that serpentine reacts differently because of the greater degree of silica polymerization (or effectively the lower ratio of Mg to Si). In this model, only the near-surface Mg is accessible for dissolution and precipitation of magnesite. Further growth of magnesite relies on extracting Mg from greater depths in the serpentine crystal where it is effectively shielded by a silica-rich carapace on the serpentine crystal. As a consequence, only a miniscule amount (unmeasurable by x-ray diffraction) of magnesite is produced. Thermal and mechanical treatment of serpentine disrupts the crystal structure thus yielding defects in the silica-enriched carapace. These defects allow for diffusion of Mg2+ and the growth of magnesite. The effectiveness of acid may arise from the ability of H+ ions to penetrate the silica carapace and reasct with the interior Mg-oxy-hydroxy octahedra. This reaction may induce intracrystalline swelling thereby disrupting the carapace. Weak acids promote dissolution (Table 1) but their effectiveness appears to be limited by the reduced concentration of H+ and the formation of stable Mg-ligand complexes.
Acknowledgement. We thank the National Energy and Technology Laboratory of the Department of Energy for their financial support. References (1) Carey, J.W., Rosen, E.P., Bergfeld, D., Chipera, S.J., Counce, D.A.,
Snow, M.G., Ziock, H.J., Guthrie, G.D., Jr. Experimental Studies of the Serpentine Carbonation Reaction. Proc. 28th Interna. Tech.l Conf. on Coal Util. & Fuel Sys. 2003.
(2) O’Connor W.K., Dahlin, D.C., Nilsen, D.N., Gerdemann, S.J. Rush, G.E., Penner, L.R., Walters, R.P., Turner, P.C. Continuing studies on direct aqueous mineral carbonation for CO2 sequestration. Proc. 28th Interna. Tech.l Conf. on Coal Util. & Fuel Sys. 2003.
Prepr. Pap.-Am. Chem. Soc., Div. Fuel Chem. 2004, 49 (1), 372

COMPARISON OF PHYSICAL AND CHEMICAL ACTIVATION OF SERPENTINE FOR ENHANCED
CO2 SEQUESTRATION
M. Mercedes Maroto-Valer1, Matthew E. Kuchta1, Yinzhi Zhang1, John M. Andrésen1, Daniel J. Fauth2
1The Energy Institute and Department of Energy and Geo-
Environmental Engineering, The Pennsylvania State University, University Park, PA 16802, 2U.S. Department of Energy, National
Energy Technology Laboratory, Pittsburgh, PA 15236
Introduction In response to rising atmospheric concentrations of carbon
dioxide (CO2) and concerns over possible global climate change, focus has been placed on carbon sequestration. Mineral carbonation, the reaction of magnesium-rich minerals with CO2 to form stable mineral carbonates, is a novel and promising approach to carbon sequestration. Suitable feedstocks include olivine (Mg2SiO4) and serpentine (Mg3Si2O5(OH)4) minerals, although serpentine exists in far greater quantities. The reaction of serpentine with CO2 to form magnesite (MgCO3), silica (SiO2) and water is shown in Equation 1.
Mg3Si2O5(OH)4 + 3CO2 3MgCO3 + 2SiO2 + 2H2O (1)
The mineral carbonation approach offers several inherent advantages: the long term stability of benign mineral carbonates; the vast capacity of natural resources; and the overall process being exothermic, and therefore potentially economically viable. However, the reaction kinetics are a substantial drawback. Previous studies have required extensive communition of the raw minerals (<37 µm), heat treatment (600-650°C), high temperatures (>155°C), high partial pressures (>125 atm), and long reaction times (>6 hours) to overcome the kinetics barriers.
The objective of this research was to investigate the effectiveness of various pretreatment methods aimed to promote and accelerate carbonation reaction rates and efficiencies through surface activation and moisture removal. Previous studies have shown that mineral dissolution rates are surface controlled, and the carbonation reaction stops when the magnesium at the mineral’s surface becomes depleted and/or blocked by mass transfer resistance.1,2 It has also been demonstrated that the inherent water content of serpentine is detrimental to the carbonation process.1-3 Therefore, it was envisioned that an increase in surface area and decrease in moisture would result in higher reaction rates and efficiencies. This would allow the integration of various synergistic features for the development of a cost-effective sequestration technology, including accelerating the carbonation efficiency without extensive mineral particle communition or heat treatment and lowering the temperature and pressure conditions of the carbonation reactions.
A series of activation experiments were performed on a serpentine mineral to promote its carbonation reactivity. Physical activation was performed with steam, and chemical activations utilized a suite of acids. Several studies were designed to increase the surface area of the mineral and reduce its inherent moisture content, while additional investigations involved the extraction of magnesium from the serpentine to form magnesium-rich solutions and solid magnesium hydroxide (Mg(OH)2). Carbonation studies were then performed with the activated serpentines and solutions. Experimental
Sample Overview. The serpentine sample was provided by the Department of Energy - Albany Research Center and originally obtained from the Cedar Hills Quarry, which lies along the border between Pennsylvania and Maryland. It was ground to minus 75µm,
and a major portion of the iron was removed through a magnetic separation process.
Physical Activation. Physical activation was performed with steam at 650°C in a horizontal tube furnace for 3 hours. Water was supplied by a HPLC pump at 0.5 mL/min and carried by N2 at 300 mL/min.
Chemical Activation. Chemical activations were performed with a suite of acids: HCl, H2SO4, H3PO4, and CH3COOH. Initial activations using HCl, H2SO4, and H3PO4 were conducted at ambient temperature for 24 hours. Around 200 g of serpentine were reacted with 200 mL of acid in a 2 L beaker and continuously mixed with a magnetic stir bar. Three magnesium extractions were performed at 50°C for 8 hours – two with H2SO4 to form MgSO4 solutions and one with CH3COOH to form a Mg(CH3COO)2 solution. The extractions were carried out by reacting 50 g of serpentine with 340 mL of distilled water and either 92 g of H2SO4 or 57.5 g of CH3COOH. Mg(OH)2 was precipitated from the leachate of one of the H2SO4 extractions by adding NaOH.
Thermogravimetric Analysis (TGA). TGA analyses were performed using a Perkin Elmer TGA 7. The studies were conducted in a non-oxidizing atmosphere of nitrogen (N2) at atmospheric pressure. Analyses were conducted over a temperature range of 25°C to 900°C, with a constant heating rate of 10°C/minute.
X-ray Diffraction (XRD). XRD analyses were carried out on a Scintag Pad V unit with a vertical theta/2-theta goniometer. The unit utilized a Cu-Kα X-ray source and was operated at a voltage of 35 kV and a current of 30 mA. A quartz zero background holder was used to mount the powder samples during XRD analyses. The samples were analyzed over a 2-theta range of 5.0° to 90.0°, with a step-scan rate of 0.1°/minute. Peaks were identified using the ICDD Powder Diffraction Files.
Inductively Coupled Plasma-Atomic Emission Spectroscopy (ICP-AES). ICP-AES analyses were performed with a Leeman Labs PS3000UV inductively coupled plasma spectrophotometer. Both solutions and solid samples were analyzed, with the solid samples being dissolved by a lithium metaborate fusion technique before analysis. The loss on ignition (LOI) values were calculated by measuring the weight loss of the samples upon heating to 750°C in a muffle furnace for approximately 12 hours, followed by cooling in a dessicator.
Brunauer, Emmett, and Teller Surface Area Analysis (BET). BET surface area analyses were carried out using a Quantachrome Autosorb-1 Model ASIT adsorption apparatus. Adsorption isotherms were obtained under N2 at a temperature of 77K. The BET surface areas were calculated using the adsorption points at the relative pressures (P/Po) 0.05 - 0.25.
Scanning Electron Microscopy (SEM). A HITACHI S-3500N was used to conduct the SEM analyses. Experiments were performed using secondary electrons under high vacuum and an accelerating voltage of 20 kV. Images were taken at magnification levels up to 10,000 times, with a working distance of 7-9 mm. The powder samples were mounted on a holder using carbon tape. In addition, the samples were spattered with a thin layer of gold to provide an electrically conductive surface.
Carbonation Experiments. All carbonation experiments were performed at the National Energy Technology Lab (NETL) in Pittsburgh, PA. High temperature and pressure analyses were carried out in a 1 L Hastelloy C-2000 continuous-stirred-tank-reactor (CSTR) unit, while low temperature and pressure carbonation reactions were performed in a 500 mL Hastelloy C-276 CSTR vessel. In a representative high temperature and pressure experiment, 30 g of serpentine and 360 g of buffer solution were charged into the 1 L CSTR, and it was sealed and purged with gaseous CO2. Liquid CO2 was injected through a side port until a pressure of 126 atm was
Prepr. Pap.-Am. Chem. Soc., Div. Fuel Chem. 2004, 49 (1), 373

reached. A gas booster pump was used to maintain a relatively constant CO2 pressure. The unit was heated to 155°C and the carbonation reaction was allowed to proceed for 1 hour. In a representative low temperature and pressure experiment, 180 mL of sample, including buffer, were charged into the 500 mL CSTR, and it was sealed and purged with gaseous CO2. Liquid CO2 was injected through a side port until a pressure of 45 atm was reached, and the unit was kept at 20°C. The reaction was allowed to proceed until the CO2 pressure stabilized. At the end of all carbonation tests, the remaining CO2 was vented, and the carbonated slurry was flushed from the CSTR and filtered to separate the solids. The solids were washed and dried overnight at 105°C. Carbonation efficiency calculations were based on the concentration of MgO in the starting serpentine solids and the weight gain due to carbonate formation. For the aqueous samples, the conversion was determined by the amount of magnesium that was recovered as magnesium carbonate in the precipitate that formed after carbonation.
Results and Discussion
Characterization of parent and activated serpentine samples XRD results indicated that the primary phase present in the serpentine feed sample was antigorite, (Mg,Fe2++)3Si2O5(OH)4. The serpentine was determined to be approximately 39% MgO by weight, with moisture accounting for nearly 14% of the remaining weight. BET surface area analysis reported a surface area of only 8m2/g.
After activation, forsterite (Mg2SiO4) was the primary phase present in the mineral, along with smaller amounts of antigorite. As expected, physical activation with steam removed much of the moisture from the sample, and the activated serpentine was determined to be 2.6% moisture by weight. An additional 43% of the sample was MgO by weight. The effect on the surface area was minimal (15.8 m2/g).
The HCl, H2SO4, and H3PO4 activated serpentines became slightly amorphous after activation, and antigorite was identified as the primary mineral phase present within the samples. The chemical activations did not effectively reduce the moisture content of the minerals, with moisture accounting for approximately 11% of each sample by weight. Surface areas were increased by up to two orders of magnitude, ranging between 80 m2/g for the HCl activated serpentine and 330 m2/g for the H2SO4 activated serpentine. However, chemical treatments resulted in a net loss of MgO from the serpentine, with the MgO content being reduced to as low as 12% by weight for the H2SO4 activated serpentine. Thus, although the chemical treatments of serpentine were effective in raising the surface area of the mineral, they essentially decreased the mineral MgO content, and therefore decreased the amount of CO2 that could potentially be sequestered by the treated serpentine.
The characterization results from the acid treated solids indicated the possibility of extracting the magnesium into solution as Mg2+ ions. In particular, over 70% of the magnesium was removed during treatment with H2SO4. Consequently, three additional chemical treatments were performed to produce solutions with high
Mg2+ ion concentrations. Two MgSO4 solutions were produced by reacting serpentine
with H2SO4, and one of the solutions was used to produce solid Mg(OH)2. The MgSO4 solution that was directly carbonated had a magnesium concentration of 13,000 ppm by volume. The precipitated Mg(OH)2 was determined to be approximately 35% MgO by weight. Na2SO4, which formed during precipitation with NaOH, and moisture accounted for much of the remaining sample weight. XRD results indicated that the sample consisted primarily of Mg(OH)2 and Na2SO4. The magnesium concentration of the Mg(CH3COO)2 solution was found to be 5,250 ppm by volume. As the ICP-AES results indicate, both H2SO4 and CH3COOH were effective in creating a solution with Mg2+ ions being the dominant species, although treatment with H2SO4 resulted in a much higher Mg2++ dissolution.
Carbonation studies Table 1 contains a summary of the
carbonation reaction conditions and conversions for the untreated and activated serpentines and solutions. The chemically activated serpentines (HCl, H2SO4, and H3PO4) did not sequester any CO2. In fact, the amount of sample that was recovered at the end of the carbonation experiments was less than that which was originally placed in the reactor. This small weight loss was accredited to the removal of moisture during the experiments. Similarly, the carbonation of the Mg(CH3COO)2 solution did not result in the formation of a carbonate. The amount of precipitate that formed in the solution was negligible. A sizeable amount of precipitate formed in the carbonated MgSO4 solution. However, XRD analysis of this precipitate identified limited amounts of magnesium carbonate minerals. The primary constituent was determined to be Na2SO4. Further investigation into the roles of each chemical species present within the carbonation solutions is necessary to determine why the Mg2+ ions in the MgSO4 and Mg(CH3COO)2 solutions did not react with CO2 to form carbonates.
On the other hand, the untreated parent serpentine, the physically activated serpentine, and the Mg(OH)2 solution underwent varying degrees of carbonation. The untreated parent sample underwent a 7% conversion at 155°C and 126 atm in 1 hour. Under identical conditions, the steam activated serpentine underwent a 60% conversion, illustrating the benefit of removing moisture from the serpentine. However, high temperature treatment is very energy intensive. CO2 was also sequestered during the carbonation of the Mg(OH)2 solution. Based on the amount of magnesium recovered in the precipitate after the 3.5 hour reaction, the carbonation efficiency was estimated to be at least 53%.
Carbonation products varied for the reactions and included magnesite (MgCO3) and several hydrated magnesium carbonate minerals. The high temperature and pressure reactions with the untreated parent sample and the physically activated serpentine resulted in the formation of MgCO3. The rhombohedral-shaped MgCO3 crystals that formed during the carbonation of the physically activated serpentine are shown in Figure 1.
Table 1. Summary of Carbonation Experiments with Physically and Chemically Activated Serpentine Sample Temperature (˚C) Pressure (atm) Time (hr) Buffer Composition Conversion
Untreated Parent Serpentine 155 126 1 0.6 M NaHCO3; 1.0 M NaCl 7 Steam Activated Serpentine 155 126 1 0.6 M NaHCO3; 1.0 M NaCl 59 HCl Activated Serpentine 155 126 1 0.6 M NaHCO3; 1.0 M NaCl ---
H2SO4 Activated Serpentine 155 126 1 0.6 M NaHCO3; 1.0 M NaCl --- H3PO4 Activated Serpentine 155 126 1 0.6 M NaHCO3; 1.0 M NaCl ---
Mg(CH3COO)2 Solution 20 45 4 1.34 g NaOH --- MgSO4 Solution 20 36 6 8.11 g NaOH ---
Mg(OH)2 Solution 20 45 3.5 Reverse Osmosis Water 53
Prepr. Pap.-Am. Chem. Soc., Div. Fuel Chem. 2004, 49 (1), 374
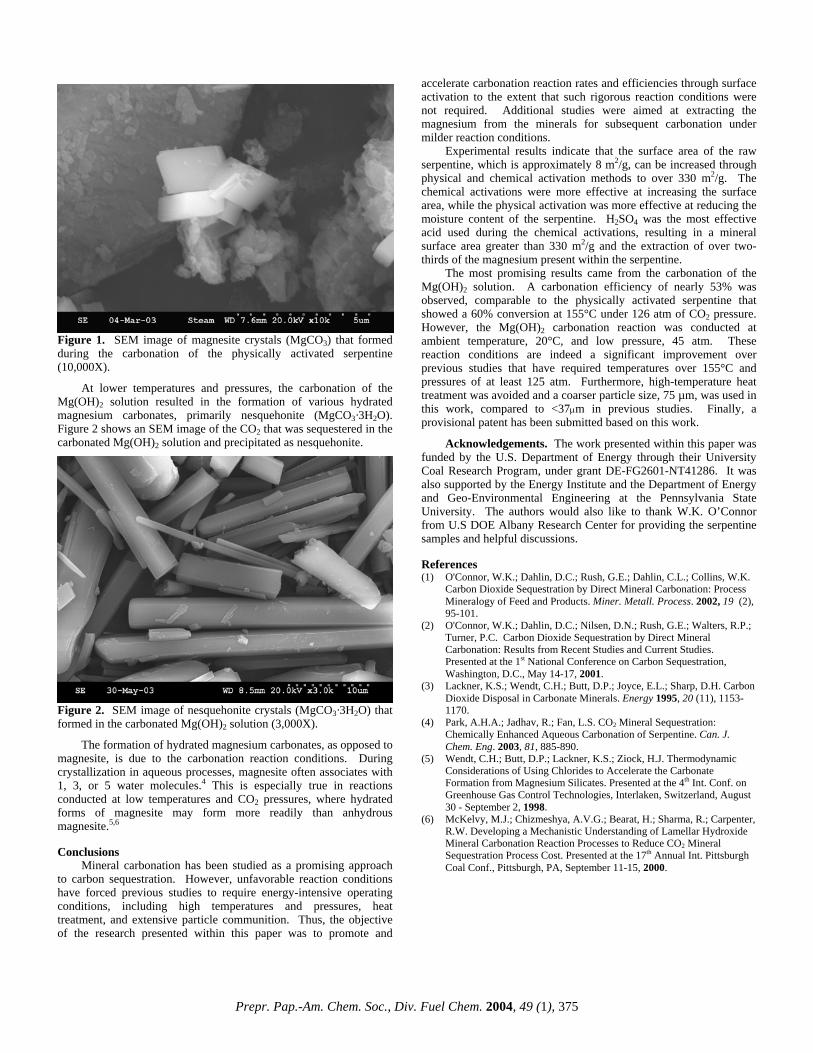
Figure 1. SEM image of magnesite crystals (MgCO3) that formed during the carbonation of the physically activated serpentine (10,000X).
At lower temperatures and pressures, the carbonation of the Mg(OH)2 solution resulted in the formation of various hydrated magnesium carbonates, primarily nesquehonite (MgCO3·3H2O). Figure 2 shows an SEM image of the CO2 that was sequestered in the carbonated Mg(OH)2 solution and precipitated as nesquehonite.
Figure 2. SEM image of nesquehonite crystals (MgCO3·3H2O) that formed in the carbonated Mg(OH)2 solution (3,000X).
The formation of hydrated magnesium carbonates, as opposed to magnesite, is due to the carbonation reaction conditions. During crystallization in aqueous processes, magnesite often associates with 1, 3, or 5 water molecules.4 This is especially true in reactions conducted at low temperatures and CO2 pressures, where hydrated forms of magnesite may form more readily than anhydrous magnesite.5,6
Conclusions
Mineral carbonation has been studied as a promising approach to carbon sequestration. However, unfavorable reaction conditions have forced previous studies to require energy-intensive operating conditions, including high temperatures and pressures, heat treatment, and extensive particle communition. Thus, the objective of the research presented within this paper was to promote and
accelerate carbonation reaction rates and efficiencies through surface activation to the extent that such rigorous reaction conditions were not required. Additional studies were aimed at extracting the magnesium from the minerals for subsequent carbonation under milder reaction conditions.
Experimental results indicate that the surface area of the raw serpentine, which is approximately 8 m2/g, can be increased through physical and chemical activation methods to over 330 m2/g. The chemical activations were more effective at increasing the surface area, while the physical activation was more effective at reducing the moisture content of the serpentine. H2SO4 was the most effective acid used during the chemical activations, resulting in a mineral surface area greater than 330 m2/g and the extraction of over two-thirds of the magnesium present within the serpentine.
The most promising results came from the carbonation of the Mg(OH)2 solution. A carbonation efficiency of nearly 53% was observed, comparable to the physically activated serpentine that showed a 60% conversion at 155°C under 126 atm of CO2 pressure. However, the Mg(OH)2 carbonation reaction was conducted at ambient temperature, 20°C, and low pressure, 45 atm. These reaction conditions are indeed a significant improvement over previous studies that have required temperatures over 155°C and pressures of at least 125 atm. Furthermore, high-temperature heat treatment was avoided and a coarser particle size, 75 µm, was used in this work, compared to <37µm in previous studies. Finally, a provisional patent has been submitted based on this work.
Acknowledgements. The work presented within this paper was funded by the U.S. Department of Energy through their University Coal Research Program, under grant DE-FG2601-NT41286. It was also supported by the Energy Institute and the Department of Energy and Geo-Environmental Engineering at the Pennsylvania State University. The authors would also like to thank W.K. O’Connor from U.S DOE Albany Research Center for providing the serpentine samples and helpful discussions. References (1) O'Connor, W.K.; Dahlin, D.C.; Rush, G.E.; Dahlin, C.L.; Collins, W.K.
Carbon Dioxide Sequestration by Direct Mineral Carbonation: Process Mineralogy of Feed and Products. Miner. Metall. Process. 2002, 19 (2), 95-101.
(2) O'Connor, W.K.; Dahlin, D.C.; Nilsen, D.N.; Rush, G.E.; Walters, R.P.; Turner, P.C. Carbon Dioxide Sequestration by Direct Mineral Carbonation: Results from Recent Studies and Current Studies. Presented at the 1st National Conference on Carbon Sequestration, Washington, D.C., May 14-17, 2001.
(3) Lackner, K.S.; Wendt, C.H.; Butt, D.P.; Joyce, E.L.; Sharp, D.H. Carbon Dioxide Disposal in Carbonate Minerals. Energy 1995, 20 (11), 1153-1170.
(4) Park, A.H.A.; Jadhav, R.; Fan, L.S. CO2 Mineral Sequestration: Chemically Enhanced Aqueous Carbonation of Serpentine. Can. J. Chem. Eng. 2003, 81, 885-890.
(5) Wendt, C.H.; Butt, D.P.; Lackner, K.S.; Ziock, H.J. Thermodynamic Considerations of Using Chlorides to Accelerate the Carbonate Formation from Magnesium Silicates. Presented at the 4th Int. Conf. on Greenhouse Gas Control Technologies, Interlaken, Switzerland, August 30 - September 2, 1998.
(6) McKelvy, M.J.; Chizmeshya, A.V.G.; Bearat, H.; Sharma, R.; Carpenter, R.W. Developing a Mechanistic Understanding of Lamellar Hydroxide Mineral Carbonation Reaction Processes to Reduce CO2 Mineral Sequestration Process Cost. Presented at the 17th Annual Int. Pittsburgh Coal Conf., Pittsburgh, PA, September 11-15, 2000.
Prepr. Pap.-Am. Chem. Soc., Div. Fuel Chem. 2004, 49 (1), 375
CO2 MITIGATION VIA ACCELERATED LIMESTONE WEATHERING
Greg H. Raua,b, Kevin G. Knaussb, William H. Langerc,
Ken Caldeirab
aInstitute of Marine Sciences, University of California,
Santa Cruz, CA 95064 bEnergy and Environment Directorate, LLNL,
Livermore, CA 94550 cUS Geological Survey, Denver, CO 80225
Introduction
The climate and environmental impacts of our current, carbon-intensive energy usage demands that effective and practical energy alternatives and CO2 mitigation strategies be found.1,2 As part of this effort, various means of capturing and storing CO2 generated from fossil-fuel-based energy production are being investigated.3 One of the proposed methods involves a geochemistry-based capture and sequestration process4,5 that hydrates point-source, waste CO2 with water to produce a carbonic acid solution. This in turn is reacted and neutralized with limestone, thus converting the original CO2 gas to calcium bicarbonate in solution, the overall reaction being: CO2(g) + CaCO3(s) + H2O(l) => Ca2+
(aq) + 2HCO3-(aq). (1)
The dissolved calcium bicarbonate produced is then released and diluted in the ocean where it would add minimally to the large, benign pool of these ions already present in seawater.
Such a process is geochemically equivalent to continental and marine carbonate weathering which can otherwise naturally consume most anthropogenic CO2, but over many millennia.6-8 We identify the enhanced form of this process as Accelerated Weathering of Limestone or AWL. Previously, it has been shown that AWL can effectively convert a significant fraction of US CO2 emissions to long-term storage as bicarbonate in the ocean, while avoiding or possibly reversing environmental impacts associated with either the ongoing passive or the proposed active injection of CO2 into the ocean.5,9 Being analogous to the wide-spread use of wet limestone to desulfurize flue gas, AWL reactors could be retrofitted to many existing coastal power plants at a typical cost estimated to be $20-$30/tonne CO2 mitigated.4,10
Limestone and Seawater Availability and Cost
Based on reaction 1, it would take 2.3 tonnes of calcium carbonate and 0.3 tonnes of water to react 1 tonne of CO2 to form 2.8 tonnes of HCO3
- in solution. It is envisioned that abundant and inexpensive limestone (containing 92-98% CaCO3) would be used. US production of this mineral is presently 109 tonnes/yr, with reserves sufficient to satisfy US demand for many decades if not centuries. Channeling the entire yearly US limestone production to AWL could consume roughly 18% of the annual CO2 generated by electricity production in the US.
However, currently more than 20% of US limestone production and processing results in waste limestone fines (<10 mm) that have little or no market value and are accumulating at limestone mining and processing sites.11,12 This suggests that a sizeable, free or low-cost source of limestone could be available for AWL whose use could also help alleviate the significant limestone waste problem.
Because of the significant quantities of water required to react the CO2 and to carry and dilute the resulting bicarbonate (>104 tonnes H2O/tonne CO2; ref. 4), AWL reactors in close proximity to seawater would be at a distinct advantage. About 12% of CO2 emissions from US electricity production occurs at plants within 10 km of the US coastline.10 Fortuitously, the majority of this coastline
is also within 400 km of known limestone reserves.13 This is especially true of the southern and eastern seaboard that also has the highest density of coastal US power plants and coastal electricity-related CO2 production. For example there is more than 20 GW of fossil-fueled power generation (≈100 billion tonnes CO2 emitted/yr) by coastal power plants in Florida10, a state that is almost entirely underlain by carbonate deposits.14
In such ideal settings, if both limestone and its transportation costs were negligible, the CO2 mitigation cost offered by AWL could be $3 - $4/tonne CO2 based on previous cost analyses.4,10 This would especially pertain if the hundreds of millions of gallons of seawater already pumped and used for cooling by these plants each day were in turn used as a “free” AWL water source. This cost is significantly lower than most other current or proposed abiotic technologies.3 However, the number of ideal sites and hence the volume of CO2 that could be treated at this very attractive cost would be small. Considering water, limestone, and transportation cost in more typical coastal settings suggests that 10-20% of US energy CO2 emissions could be mitigated at $20-$30/tonne. This is still very cost-competitive with other methods, especially considering that the cost of conventional amine CO2 capture (not required for AWL) is generally >$30/tonne CO2 (ref. 15).
The preceding assumes an AWL reactor sited at the source of waste CO2 (i.e. a power plant) and to which limestone and seawater are transported. Alternatively, CO2 generated at inland locations could be transported to coastal AWL reactors sited at or near limestone quarries. Transport of CO2 is inexpensive ($0.06 tonne-1 km-1, ref. 16) relative to the cost of transporting the AWL- equivalent (2.5 tonnes) of limestone. However, this would require initial CO2 separation, capture, and liquefaction, with the associated technology and energy costs that are presently significant, as mentioned above. Still, if inexpensive CO2 capture/separation is developed, piping CO2 to coastal AWL reactors could prove cost-competitive with other forms of CO2 sequestration such as underground storage, especially in regions where the underlying geology is not amenable to CO2 retention.
Reaction Rates and Densities
The results of experiments in our laboratory yielded limestone dissolution rates ranging from roughly 10-7 to 10-5 mols m-2 s-1 with positive sensitivity to flow rate, stir rate, and CO2 concentration. Dissolution rates in seawater were equal to or higher than those in distilled water under otherwise identical conditions.
Assuming a reaction rate of 10-6 mols m-2 s-1 is achievable in large-scale reactors, a bed of 1mm-diameter limestone particles (typical of waste limestone fines discussed above) yields an surface area/volume of ≥4.4 x10³ m2/m3. Therefore a maximum of 60 m3 of such limestone particles would be needed to react 1 tonne of CO2 per day. For a cubic reactor volume (roughly 4m x 4m x 4m), this equates to an areal reaction rate of at least 15 tonnes CO2 m-2 day-1, or about a million times greater than optimum biotic CO2 uptake and sequestration rates.16 The experiments suggest that this density of CO2 conversion to HCO3
- could be increased by as much as an order of magnitude by increasing stirring and flushing rate, though at added energy and cost penalties. Effectiveness
Using a box model of ocean chemistry and transport Caldeira and Rau5 showed that the release of the bicarbonate-charged effluent from carbonate dissolution would more effectively sequester CO2 over the long term relative to direct CO2 injection at equivalent ocean depths. This has been subsequently confirmed for releases at several different ocean locations and depths in a 3-D ocean general circulation model (Figure 1). Injection of pure CO2 at great depth in
Prepr. Pap.-Am. Chem. Soc., Div. Fuel Chem. 2004, 49 (1), 376
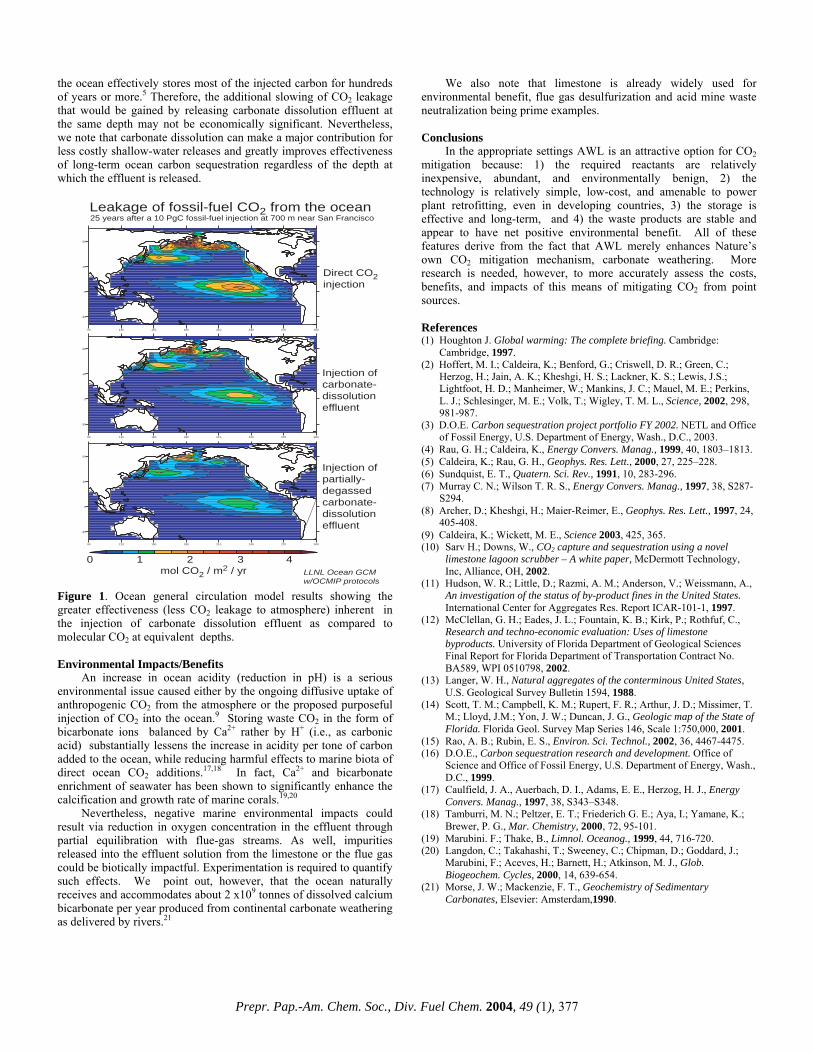
the ocean effectively stores most of the injected carbon for hundreds of years or more.5 Therefore, the additional slowing of CO2 leakage that would be gained by releasing carbonate dissolution effluent at the same depth may not be economically significant. Nevertheless, we note that carbonate dissolution can make a major contribution for less costly shallow-water releases and greatly improves effectiveness of long-term ocean carbon sequestration regardless of the depth at which the effluent is released.
90 120 150 180 210 240 270 300
-30
0
30
60
90 120 150 180 210 240 270 300
-30
0
30
60
90 120 150 180 210 240 270 300
-30
0
30
60
Direct CO2injection
Injection ofcarbonate-dissolutioneffluent
Injection ofpartially-degassedcarbonate-dissolutioneffluent
Leakage of fossil-fuel CO2 from the ocean25 years after a 10 PgC fossil-fuel injection at 700 m near San Francisco
1 2 3 40mol CO2 / m2 / yr LLNL Ocean GCM
w/OCMIP protocols Figure 1. Ocean general circulation model results showing the greater effectiveness (less CO2 leakage to atmosphere) inherent in the injection of carbonate dissolution effluent as compared to molecular CO2 at equivalent depths. Environmental Impacts/Benefits
An increase in ocean acidity (reduction in pH) is a serious environmental issue caused either by the ongoing diffusive uptake of anthropogenic CO2 from the atmosphere or the proposed purposeful injection of CO2 into the ocean.9 Storing waste CO2 in the form of bicarbonate ions balanced by Ca2+ rather by H+ (i.e., as carbonic acid) substantially lessens the increase in acidity per tone of carbon added to the ocean, while reducing harmful effects to marine biota of direct ocean CO2 additions.17,18 In fact, Ca2+ and bicarbonate enrichment of seawater has been shown to significantly enhance the calcification and growth rate of marine corals.19,20
Nevertheless, negative marine environmental impacts could result via reduction in oxygen concentration in the effluent through partial equilibration with flue-gas streams. As well, impurities released into the effluent solution from the limestone or the flue gas could be biotically impactful. Experimentation is required to quantify such effects. We point out, however, that the ocean naturally receives and accommodates about 2 x10⁹ tonnes of dissolved calcium bicarbonate per year produced from continental carbonate weathering as delivered by rivers.21
We also note that limestone is already widely used for environmental benefit, flue gas desulfurization and acid mine waste neutralization being prime examples.
Conclusions
In the appropriate settings AWL is an attractive option for CO2 mitigation because: 1) the required reactants are relatively inexpensive, abundant, and environmentally benign, 2) the technology is relatively simple, low-cost, and amenable to power plant retrofitting, even in developing countries, 3) the storage is effective and long-term, and 4) the waste products are stable and appear to have net positive environmental benefit. All of these features derive from the fact that AWL merely enhances Nature’s own CO2 mitigation mechanism, carbonate weathering. More research is needed, however, to more accurately assess the costs, benefits, and impacts of this means of mitigating CO2 from point sources. References (1) Houghton J. Global warming: The complete briefing. Cambridge:
Cambridge, 1997. (2) Hoffert, M. I.; Caldeira, K.; Benford, G.; Criswell, D. R.; Green, C.;
Herzog, H.; Jain, A. K.; Kheshgi, H. S.; Lackner, K. S.; Lewis, J.S.; Lightfoot, H. D.; Manheimer, W.; Mankins, J. C.; Mauel, M. E.; Perkins, L. J.; Schlesinger, M. E.; Volk, T.; Wigley, T. M. L., Science, 2002, 298, 981-987.
(3) D.O.E. Carbon sequestration project portfolio FY 2002. NETL and Office of Fossil Energy, U.S. Department of Energy, Wash., D.C., 2003.
(4) Rau, G. H.; Caldeira, K., Energy Convers. Manag., 1999, 40, 1803–1813. (5) Caldeira, K.; Rau, G. H., Geophys. Res. Lett., 2000, 27, 225–228. (6) Sundquist, E. T., Quatern. Sci. Rev., 1991, 10, 283-296. (7) Murray C. N.; Wilson T. R. S., Energy Convers. Manag., 1997, 38, S287-
S294. (8) Archer, D.; Kheshgi, H.; Maier-Reimer, E., Geophys. Res. Lett., 1997, 24,
405-408. (9) Caldeira, K.; Wickett, M. E., Science 2003, 425, 365. (10) Sarv H.; Downs, W., CO2 capture and sequestration using a novel
limestone lagoon scrubber – A white paper, McDermott Technology, Inc, Alliance, OH, 2002.
(11) Hudson, W. R.; Little, D.; Razmi, A. M.; Anderson, V.; Weissmann, A., An investigation of the status of by-product fines in the United States. International Center for Aggregates Res. Report ICAR-101-1, 1997.
(12) McClellan, G. H.; Eades, J. L.; Fountain, K. B.; Kirk, P.; Rothfuf, C., Research and techno-economic evaluation: Uses of limestone byproducts. University of Florida Department of Geological Sciences Final Report for Florida Department of Transportation Contract No. BA589, WPI 0510798, 2002.
(13) Langer, W. H., Natural aggregates of the conterminous United States, U.S. Geological Survey Bulletin 1594, 1988.
(14) Scott, T. M.; Campbell, K. M.; Rupert, F. R.; Arthur, J. D.; Missimer, T. M.; Lloyd, J.M.; Yon, J. W.; Duncan, J. G., Geologic map of the State of Florida. Florida Geol. Survey Map Series 146, Scale 1:750,000, 2001.
(15) Rao, A. B.; Rubin, E. S., Environ. Sci. Technol., 2002, 36, 4467-4475. (16) D.O.E., Carbon sequestration research and development. Office of
Science and Office of Fossil Energy, U.S. Department of Energy, Wash., D.C., 1999.
(17) Caulfield, J. A., Auerbach, D. I., Adams, E. E., Herzog, H. J., Energy Convers. Manag., 1997, 38, S343–S348.
(18) Tamburri, M. N.; Peltzer, E. T.; Friederich G. E.; Aya, I.; Yamane, K.; Brewer, P. G., Mar. Chemistry, 2000, 72, 95-101.
(19) Marubini. F.; Thake, B., Limnol. Oceanog., 1999, 44, 716-720. (20) Langdon, C.; Takahashi, T.; Sweeney, C.; Chipman, D.; Goddard, J.;
Marubini, F.; Aceves, H.; Barnett, H.; Atkinson, M. J., Glob. Biogeochem. Cycles, 2000, 14, 639-654.
(21) Morse, J. W.; Mackenzie, F. T., Geochemistry of Sedimentary Carbonates, Elsevier: Amsterdam,1990.
Prepr. Pap.-Am. Chem. Soc., Div. Fuel Chem. 2004, 49 (1), 377
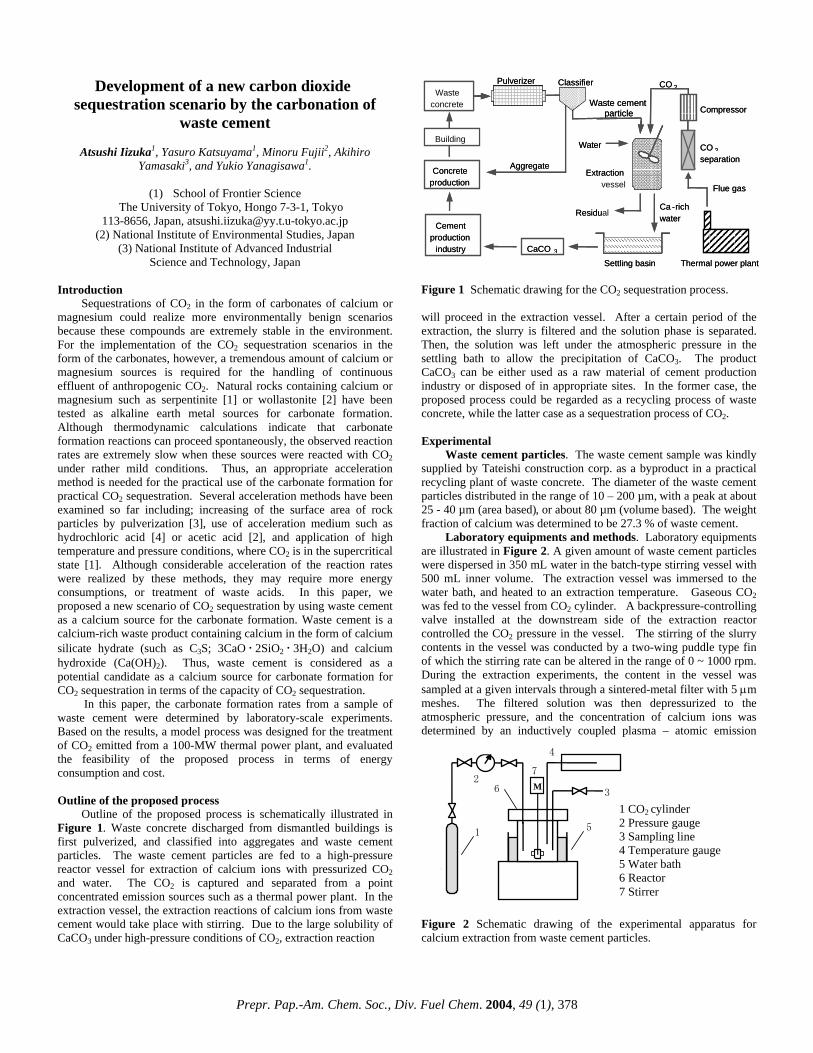
Development of a new carbon dioxide sequestration scenario by the carbonation of
waste cement Compressor
CO 2 separation
Thermal power plant
Flue gas
Extraction vessel
Settling basin
Ca - rich water
CaCO 3
Pulverizer
Waste cement particle
Waste concrete
CO 2
Water
Aggregate
Classifier
Cement production
industry
Concrete production
Residual
Building
Compressor
CO 2 separation
Thermal power plant
Flue gas
Extraction
Settling basin
Ca - rich water
CaCO 3
Pulverizer
Waste cement particle
Waste concrete
Waste concrete
CO 2
Water
Aggregate
Classifier
Cement production
industry
Concrete production
Residu
Building Atsushi Iizuka1, Yasuro Katsuyama1, Minoru Fujii2, Akihiro
Yamasaki3, and Yukio Yanagisawa1.
(1) School of Frontier Science The University of Tokyo, Hongo 7-3-1, Tokyo
113-8656, Japan, [email protected] (2) National Institute of Environmental Studies, Japan
(3) National Institute of Advanced Industrial Science and Technology, Japan
Introduction
Sequestrations of CO2 in the form of carbonates of calcium or magnesium could realize more environmentally benign scenarios because these compounds are extremely stable in the environment. For the implementation of the CO2 sequestration scenarios in the form of the carbonates, however, a tremendous amount of calcium or magnesium sources is required for the handling of continuous effluent of anthropogenic CO2. Natural rocks containing calcium or magnesium such as serpentinite [1] or wollastonite [2] have been tested as alkaline earth metal sources for carbonate formation. Although thermodynamic calculations indicate that carbonate formation reactions can proceed spontaneously, the observed reaction rates are extremely slow when these sources were reacted with CO2 under rather mild conditions. Thus, an appropriate acceleration method is needed for the practical use of the carbonate formation for practical CO2 sequestration. Several acceleration methods have been examined so far including; increasing of the surface area of rock particles by pulverization [3], use of acceleration medium such as hydrochloric acid [4] or acetic acid [2], and application of high temperature and pressure conditions, where CO2 is in the supercritical state [1]. Although considerable acceleration of the reaction rates were realized by these methods, they may require more energy consumptions, or treatment of waste acids. In this paper, we proposed a new scenario of CO2 sequestration by using waste cement as a calcium source for the carbonate formation. Waste cement is a calcium-rich waste product containing calcium in the form of calcium silicate hydrate (such as C3S; 3CaO・2SiO2・3H2O) and calcium hydroxide (Ca(OH)2). Thus, waste cement is considered as a potential candidate as a calcium source for carbonate formation for CO2 sequestration in terms of the capacity of CO2 sequestration.
In this paper, the carbonate formation rates from a sample of waste cement were determined by laboratory-scale experiments. Based on the results, a model process was designed for the treatment of CO2 emitted from a 100-MW thermal power plant, and evaluated the feasibility of the proposed process in terms of energy consumption and cost. Outline of the proposed process
Outline of the proposed process is schematically illustrated in Figure 1. Waste concrete discharged from dismantled buildings is first pulverized, and classified into aggregates and waste cement particles. The waste cement particles are fed to a high-pressure reactor vessel for extraction of calcium ions with pressurized CO2 and water. The CO2 is captured and separated from a point concentrated emission sources such as a thermal power plant. In the extraction vessel, the extraction reactions of calcium ions from waste cement would take place with stirring. Due to the large solubility of CaCO3 under high-pressure conditions of CO2, extraction reaction
Figure 1 Schematic drawing for the CO2 sequestration process. will proceed in the extraction vessel. After a certain period of the extraction, the slurry is filtered and the solution phase is separated. Then, the solution was left under the atmospheric pressure in the settling bath to allow the precipitation of CaCO3. The product CaCO3 can be either used as a raw material of cement production industry or disposed of in appropriate sites. In the former case, the proposed process could be regarded as a recycling process of waste concrete, while the latter case as a sequestration process of CO2. Experimental
Waste cement particles. The waste cement sample was kindly supplied by Tateishi construction corp. as a byproduct in a practical recycling plant of waste concrete. The diameter of the waste cement particles distributed in the range of 10 – 200 µm, with a peak at about 25 - 40 µm (area based), or about 80 µm (volume based). The weight fraction of calcium was determined to be 27.3 % of waste cement.
Laboratory equipments and methods. Laboratory equipments are illustrated in Figure 2. A given amount of waste cement particles were dispersed in 350 mL water in the batch-type stirring vessel with 500 mL inner volume. The extraction vessel was immersed to the water bath, and heated to an extraction temperature. Gaseous CO2 was fed to the vessel from CO2 cylinder. A backpressure-controlling valve installed at the downstream side of the extraction reactor controlled the CO2 pressure in the vessel. The stirring of the slurry contents in the vessel was conducted by a two-wing puddle type fin of which the stirring rate can be altered in the range of 0 ~ 1000 rpm. During the extraction experiments, the content in the vessel was sampled at a given intervals through a sintered-metal filter with 5 µm meshes. The filtered solution was then depressurized to the atmospheric pressure, and the concentration of calcium ions was determined by an inductively coupled plasma – atomic emission
Figure 2 Schematic drawing of the experimental apparatus for calcium extraction from waste cement particles.
1
2
3
4
5
6
7
M
1
2
3
7
5
6
4
1 CO2 cylinder 2 Pressure gauge 3 Sampling line 4 Temperature gauge5 Water bath 6 Reactor 7 Stirrer
Prepr. Pap.-Am. Chem. Soc., Div. Fuel Chem. 2004, 49 (1), 378
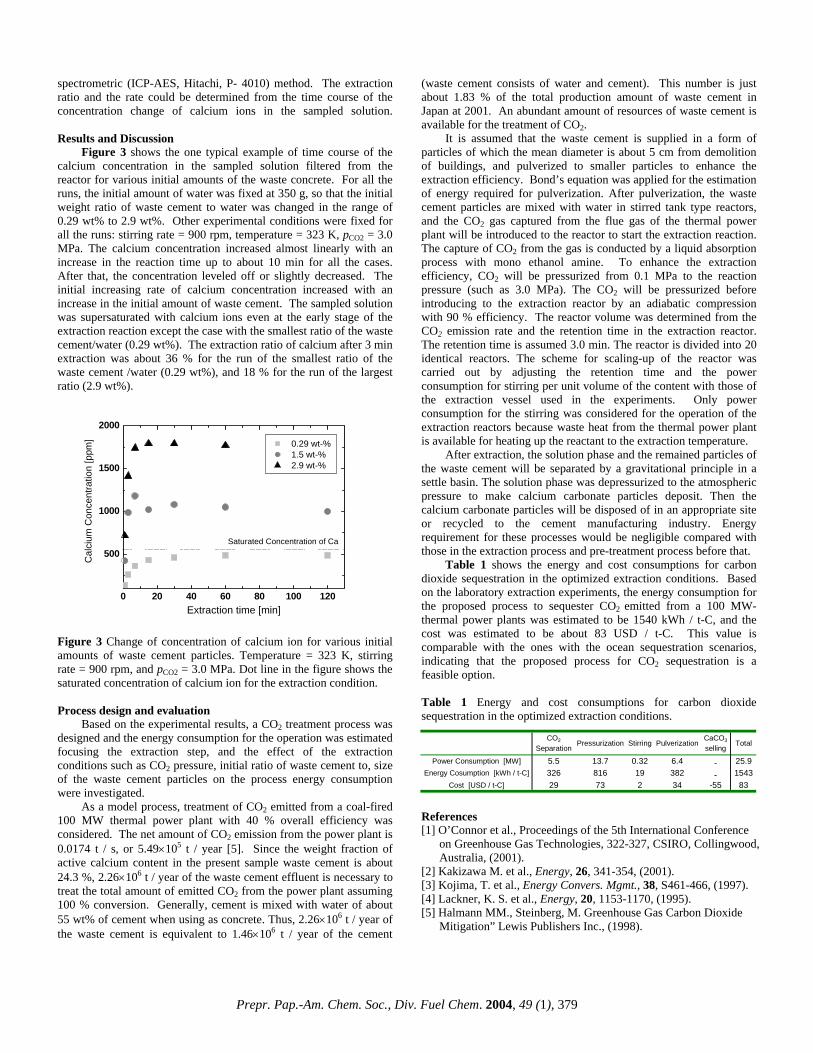
spectrometric (ICP-AES, Hitachi, P- 4010) method. The extraction ratio and the rate could be determined from the time course of the concentration change of calcium ions in the sampled solution. Results and Discussion Figure 3 shows the one typical example of time course of the calcium concentration in the sampled solution filtered from the reactor for various initial amounts of the waste concrete. For all the runs, the initial amount of water was fixed at 350 g, so that the initial weight ratio of waste cement to water was changed in the range of 0.29 wt% to 2.9 wt%. Other experimental conditions were fixed for all the runs: stirring rate = 900 rpm, temperature = 323 K, pCO2 = 3.0 MPa. The calcium concentration increased almost linearly with an increase in the reaction time up to about 10 min for all the cases. After that, the concentration leveled off or slightly decreased. The initial increasing rate of calcium concentration increased with an increase in the initial amount of waste cement. The sampled solution was supersaturated with calcium ions even at the early stage of the extraction reaction except the case with the smallest ratio of the waste cement/water (0.29 wt%). The extraction ratio of calcium after 3 min extraction was about 36 % for the run of the smallest ratio of the waste cement /water (0.29 wt%), and 18 % for the run of the largest ratio (2.9 wt%).
Figure 3 Change of concentration of calcium ion for various initial amounts of waste cement particles. Temperature = 323 K, stirring rate = 900 rpm, and pCO2 = 3.0 MPa. Dot line in the figure shows the saturated concentration of calcium ion for the extraction condition. Process design and evaluation
Based on the experimental results, a CO2 treatment process was designed and the energy consumption for the operation was estimated focusing the extraction step, and the effect of the extraction conditions such as CO2 pressure, initial ratio of waste cement to, size of the waste cement particles on the process energy consumption were investigated.
As a model process, treatment of CO2 emitted from a coal-fired 100 MW thermal power plant with 40 % overall efficiency was considered. The net amount of CO2 emission from the power plant is 0.0174 t / s, or 5.49×10⁵ t / year [5]. Since the weight fraction of active calcium content in the present sample waste cement is about 24.3 %, 2.26×10⁶ t / year of the waste cement effluent is necessary to treat the total amount of emitted CO2 from the power plant assuming 100 % conversion. Generally, cement is mixed with water of about 55 wt% of cement when using as concrete. Thus, 2.26×10⁶ t / year of the waste cement is equivalent to 1.46×10⁶ t / year of the cement
(waste cement consists of water and cement). This number is just about 1.83 % of the total production amount of waste cement in Japan at 2001. An abundant amount of resources of waste cement is available for the treatment of CO2.
It is assumed that the waste cement is supplied in a form of particles of which the mean diameter is about 5 cm from demolition of buildings, and pulverized to smaller particles to enhance the extraction efficiency. Bond’s equation was applied for the estimation of energy required for pulverization. After pulverization, the waste cement particles are mixed with water in stirred tank type reactors, and the CO2 gas captured from the flue gas of the thermal power plant will be introduced to the reactor to start the extraction reaction. The capture of CO2 from the gas is conducted by a liquid absorption process with mono ethanol amine. To enhance the extraction efficiency, CO2 will be pressurized from 0.1 MPa to the reaction pressure (such as 3.0 MPa). The CO2 will be pressurized before introducing to the extraction reactor by an adiabatic compression with 90 % efficiency. The reactor volume was determined from the CO2 emission rate and the retention time in the extraction reactor. The retention time is assumed 3.0 min. The reactor is divided into 20 identical reactors. The scheme for scaling-up of the reactor was carried out by adjusting the retention time and the power consumption for stirring per unit volume of the content with those of the extraction vessel used in the experiments. Only power consumption for the stirring was considered for the operation of the extraction reactors because waste heat from the thermal power plant is available for heating up the reactant to the extraction temperature.
0 20 40 60 80 100 120
500
1000
1500
2000
Saturated Concentration of Ca
Cal
cium
Con
cent
ratio
n [p
pm]
Extraction time [min]
0.29 wt-% 1.5 wt-% 2.9 wt-%
After extraction, the solution phase and the remained particles of the waste cement will be separated by a gravitational principle in a settle basin. The solution phase was depressurized to the atmospheric pressure to make calcium carbonate particles deposit. Then the calcium carbonate particles will be disposed of in an appropriate site or recycled to the cement manufacturing industry. Energy requirement for these processes would be negligible compared with those in the extraction process and pre-treatment process before that.
Table 1 shows the energy and cost consumptions for carbon dioxide sequestration in the optimized extraction conditions. Based on the laboratory extraction experiments, the energy consumption for the proposed process to sequester CO2 emitted from a 100 MW- thermal power plants was estimated to be 1540 kWh / t-C, and the cost was estimated to be about 83 USD / t-C. This value is comparable with the ones with the ocean sequestration scenarios, indicating that the proposed process for CO2 sequestration is a feasible option. Table 1 Energy and cost consumptions for carbon dioxide sequestration in the optimized extraction conditions.
CO2
SeparationPressurization Stirring Pulverization
CaCO3
sellingTotal
Power Consumption [MW] 5.5 13.7 0.32 6.4 - 25.9Energy Cosumption [kWh / t-C] 326 816 19 382 - 1543
Cost [USD / t-C] 29 73 2 34 -55 83
References [1] O’Connor et al., Proceedings of the 5th International Conference
on Greenhouse Gas Technologies, 322-327, CSIRO, Collingwood, Australia, (2001).
[2] Kakizawa M. et al., Energy, 26, 341-354, (2001). [3] Kojima, T. et al., Energy Convers. Mgmt., 38, S461-466, (1997). [4] Lackner, K. S. et al., Energy, 20, 1153-1170, (1995). [5] Halmann MM., Steinberg, M. Greenhouse Gas Carbon Dioxide
Mitigation” Lewis Publishers Inc., (1998).
Prepr. Pap.-Am. Chem. Soc., Div. Fuel Chem. 2004, 49 (1), 379

Review of Novel Methods for Carbon Dioxide Separation from Flue and Fuel Gases
Evan J. Granite
United States Department of Energy, National Energy Technology
Laboratory, Pittsburgh, PA 15236-0940 Introduction The President recently announced the U.S. Global Climate Change Initiative (GCCI) to reduce greenhouse gas (GHG) intensity by 18% by 2012.1 The GCCI proposal would slow the growth in U.S. emissions of carbon dioxide. Alkaline sorbents and scrubbing solutions are often employed to separate carbon dioxide from various gas matrices. Cryogenic separation of carbon dioxide is also commonly used. A comprehensive review of carbon dioxide capture methods is given by White.2-4 Novel methods could have the potential to reduce the cost of carbon dioxide sequestration. These methods include electrochemical, membrane, enzymatic, photosynthesis, and catalytic routes for CO2 separation or conversion.2-5 This paper reviews some of the more novel methods for carbon dioxide separation from flue and fuel gas streams. These methods include electrochemical pumps, photosynthesis, membranes, and biomimetic-enzyme approaches to CO2 separation. Electrochemical pumps discussed include carbonate and proton conductors. The various bioreactors employed for photosynthesis are surveyed. Selective membranes for hydrogen separation are discussed as a method for carbon dioxide concentration in fuel gas streams. The selective membranes include mixed ionic-electronic (solid electrolyte-metal) films as well as palladium-based materials. Biomimetic methods utilizing the enzyme carbonic anhydrase are reviewed. The fundamental mechanisms behind these techniques will be explained, and recent advances in these methods are emphasized. Future research directions are suggested and an extensive list of references is provided. Electrochemical Pumps for Separation of CO2 from Flue Gas Carbonate Ion Pumps The molten carbonate and aqueous alkaline fuel cells have been studied for use in separating carbon dioxide from both air and flue gases.6-13 Operation of the molten carbonate fuel cell in a closed circuit mode (with application of an external emf) will result in the transport of carbonate ions across the membrane.6-13 The molten carbonate electrochemical separator requires oxidizing conditions for the formation of carbonate from carbon dioxide, and is less applicable for direct separation of CO2 from fuel gases. This pioneering work was first performed by Winnick .6-8 Winnick proposed the use of molten carbonate fuel cell membranes for separation of carbon dioxide from air for space flight (Sky Lab).6-8 Winnick first examined molten carbonate membranes for separation of CO2 from power plant flue gas.6-8 More recently the Osaka Research Institute in Japan , British Petroleum in the UK, and Ansaldo Fuel Cells in Italy have also experimented with molten carbonate electrochemical systems for CO2 capture from flue gas.9-13
There are several advantages of molten carbonate electrochemical cells for CO2 separation. A large knowledge base exists for the use and application of molten carbonate from its use in fuel cells. Molten carbonate is nearly 100% selective for the transport of carbonate anions at elevated temperatures. It exhibits high conductivity of around 1 S/cm at 1100ΕF, or equivalently a diffusivity of 10-5 cm2/sec for the carbonate anion.6-8 The parasitic power requirements for the separation of carbon dioxide from power plant flue gases are low and estimated to be less than 5%.8 The cost
for CO2 capture from flue gas was estimated at $20/ton in 1990 by Winnick .8 Unfortunately there are major disadvantages in the application of molten carbonate electrochemical cells for separation of carbon dioxide from power plant flue gas. Molten carbonate is a corrosive paste. The high temperatures, along with the extremely corrosive nature of the molten carbonate, make fabrication and handling extremely difficult. The small applied voltages allowable in order to avoid decomposition of the molten carbonate result in low currents. The current represents the flux of carbonate anions across the membrane. This necessitates the use of huge stacks to obtain a significant flux of carbonate ions across the device.8-13 Sulfur dioxide present in flue gas poisons the cell, resulting in sulfate formation.8-13 There are also severe problems with electrolyte segregation and electrode degradation in the severe high temperature flue gas environment.8-13
A solid electrolyte membrane for the separation of carbon dioxide from flue gas could solve many of the problems associated with molten carbonate.14-16 Solid electrolytes are solid ionic conductors, and are used in sensors, catalyst studies, and fuel cells.17 Millions are used in automobiles as the oxide air-fuel ratio sensors. Most solid electrolytes are ceramics. Solid electrolytes often operate at lower temperatures than molten carbonate cells. A solid electrolyte would be easier to handle, have far reduced corrosion problems, and would possess a longer operating life than its molten carbonate counterpart. The development of a highly conductive carbonate ion solid electrolyte is an area of active research.14-16 The possibility of using alkali carbonate or alkaline earth carbonate solid electrolytes for the separation of carbon dioxide from flue gas is discussed by Granite.14-16 Granite and Pennline propose doping alkaline earth carbonates in order to increase the ionic conductivity by orders of magnitude.14-16 Recent evidence suggests that it will be difficult to obtain mobile carbonate anions within a solid electrolyte matrix. Electrochemical Pumps for Concentrating CO2 from Fuel Gas Proton Pumps Hydrogen gas can be produced by IGCC plants, steam gasification reactions, the pyrolysis of coal, the electrolysis of water, and biochemically. Each of these processes generate hydrogen with associated impurities, such as carbon monoxide, carbon dioxide, methane, nitrogen, water, and oxygen. Oxygen must be removed from hydrogen streams in order to avoid explosion hazards. Previous hydrogen purification processes involved the step-wise removal of the impurities through absorption processes such as MEA (ethanolamine) washing to remove the carbon dioxide, TEG (glycol) dehydration of the gas, as well as the catalytic (Pt) removal of trace oxygen. A far simpler and potentially more cost-effective means of hydrogen separation and carbon dioxide concentration can be accomplished in one step by an electrochemical pump.17-22 These electrochemical pumps are efficient, silent, and non-polluting. The electrochemical pumps can be based upon the readily available β@ alumina, nafion, and barium cerium oxide solid electrolytes.17-22 An analysis of the electrochemical hydrogen pump, similar to the analysis of the carbon dioxide pump above, follows The application of an external EMF (voltage) to a proton-conducting solid electrolyte through a closed circuit will cause hydrogen to be selectively transported (pumped) to/or from a metal electrode. The rate of hydrogen transport is given by the current
Prepr. Pap.-Am. Chem. Soc., Div. Fuel Chem. 2004, 49 (1), 242

(flux of protons) across the membrane as:
flux of H2 = I/2F (1)
where F is Faraday=s constant, 96,487 coulombs/mole. There are several factors which limit the transport of hydrogen (current) across the membrane, and these are the conductivity of the electrolyte, thermodynamic stability of the electrolyte, and the electrode kinetics. For an ohmic membrane (V = IR), current is inversely proportional to the resistance or proportional to the conductivity. The doped barium cerium oxide, BaCe0.9Y0.1O2.95, has a conductivity of 10-1 ohm-1cm-1 at 1832ΕF.18-20 The conductivity of β@ alumina is 10-6 ohm-1cm-1 at 212ΕF. 17,21-22 Nafion (polymer electrolyte) is typically employed at temperatures of around 212ΕF. The higher conductivity of the doped barium cerium oxide allows a higher flux of protons to be pumped to a metal electrode. The maximum value for the applied external voltage is determined by the decomposition potential of the solid electrolyte. This is found from the thermodynamic stability, the free energy of formation, ∆Gf, of the material, namely:
∆Gf = -nFE (2)
where E is the maximum applied voltage. More stable electrolytes can be subjected to higher applied voltages. Typically a one to two volt potential can be applied to a ceramic membrane. Therefore, the rate of transport of protons across the membrane is limited by both the conductivity (resistance) and stability of the electrolyte. Electrode kinetics also plays a key role in the rate of separation of hydrogen. Consider the example of a closed β@ alumina electrochemical cell having palladium electrodes. Hydrogen must be first adsorbed from the impure gas stream on to the palladium electrode. Hydrogen then dissociates to hydrogen atoms. Charge transfer occurs, with protons forming. The protons migrate across the electrolyte under the influence of the externally applied field (voltage). Finally, the protons reverse the earlier steps, and form hydrogen gas at the opposite palladium electrode. At the interface between the gas, metal electrode, and solid electrolyte (the three-phase boundary), the overall reaction can be written as:
H2(gas) ≡ 2 H+ + 2 e- (3)
Therefore an electrode must efficiently adsorb and dissociate hydrogen so as to not limit the rate of hydrogen transport across the electrolyte. The electrode must be porous to allow gas to diffuse in and out, yet continuous, to avoid short-circuits. Electrodes can be formed by thermal decomposition of organometallic precursor compounds on the electrolyte surface or with metal pastes. The overall resistance of the pump is the sum of the resistances due to the electrode, electrolyte, and the electrode and electrolyte contact. Overall resistance can be minimized by: 1. use of a thin electrolyte and electrodes, 2. having intimate contact between electrode and electrolyte, and 3. selecting an electrolyte with high conductivity. The power consumed by the membrane separator is given by:
Power = VI = I2R
For the lab-scale separator, with an applied voltage of around one volt, and a resulting current in the milliamp range, the power requirements will be on the order of milliwatts. Granite and Jorne applied external voltages to β@ alumina and barium cerium oxide membranes to obtain the selective transport of deuterium from D2-N2 mixtures. 17, 21-22 Balachandran recently applied an external voltage to a yttria-doped barium cerium oxide membrane to obtain the selective transport of protons.18-20 The mechanism of proton conduction by SrCe0.95Y0.05O3-δ is discussed by Balachandran.20
Conclusions The novel CO2 capture technologies have advantages and disadvantages when installed in a power-generation system. Initial evaluations by Herzog 23 indicate that certain technologies for CO2 control from flue gas from conventional PC-fired power plants create a substantial thermal efficiency power loss. A study by Kosugi24 investigated the various technologies by using a graphical evaluation and review technique. The target CO2 capture technologies were compared for different levels of development. Although some of the technologies presently have larger penalties than others, future research and development will improve the projected energy efficiencies. Electrochemical membranes have the potential to economically separate carbon dioxide from flue gas. Material science issues such as reducing corrosion (molten carbonate pumps) and increasing conductivity (solid electrolyte pumps) need to be addressed. More research on electrochemical methods for the separation of carbon dioxide from flue and fuel gases is recommended. Acknowledgement. The author thanks NETL colleagues Henry Pennline, Curt White, Brian Strazisar, Jim Hoffman, and Rich Hargis for helpful suggestions. References 1) S. Global Climate Change Initiative information available on
the web at http://www.epa.gov A President Bush Announces Clear Skies & Global Climate Change Initiatives@ 2002, Feb. 14, http://www.epa.gov/epahome/headline2_021402.htm .
2) White, C.M.; Strazisar, B.R.; Granite, E.J.; Hoffman, J.S.; Pennline, H.W. Separation and Capture of CO2 from Large Stationary Sources and Sequestration in Geological Formations-Coalbeds and Deep Saline Aquifers, J. A&WMA 2003, 53, 645-715.
3) White, C.M.; Strazisar, B.R.; Granite, E.J.; Hoffman, J.S.; Pennline, H.W. Separation and Capture of CO2 from Large Stationary Sources and Sequestration in Geological Formations-A Summary of the 2003 Critical review, EM 2003, June, 29-34.
4) Chow, J.C.; Watson, J.G.; Herzog, A.; Benson, S.M.; Hidy, G.M.; Gunter, W.D.; Penkala, S.J.; White, C.M. Critical Review Discussion - Separation and Capture of CO2 from Large Stationary Sources and Sequestration in Geological Formations, J. A&WMA 2003, 53, 1172-1182.
5) Granite, E.J. A Review of Novel Methods for Carbon Dioxide Separation From Flue and Fuel Gases, 20th Int. Pitt. Coal Conf., 2003, paper 29-1, Pittsburgh, PA.
6) Winnick, J.; Toghiani, H.; Quattrone, P. Carbon Dioxide Concentration for Manned Spacecraft Using a Molten Carbonate Electrochemical Cell; AIChE J. 1982, 28(1), 103-111.
Prepr. Pap.-Am. Chem. Soc., Div. Fuel Chem. 2004, 49 (1), 243
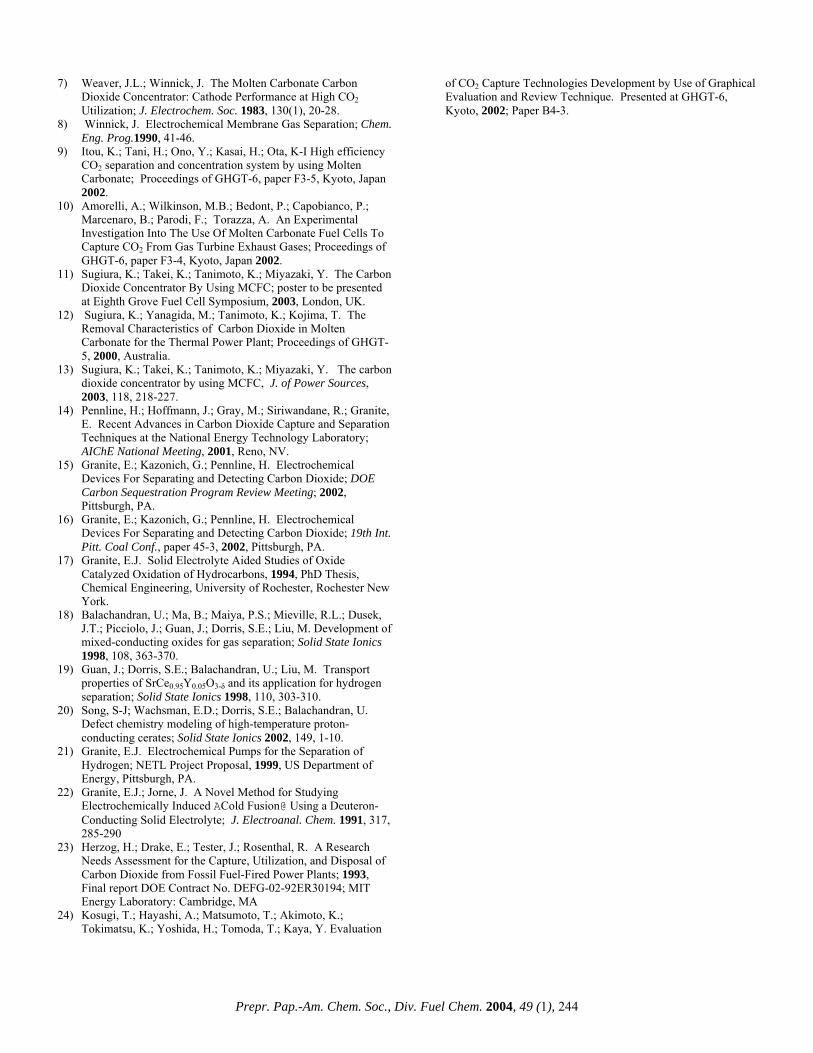
7) Weaver, J.L.; Winnick, J. The Molten Carbonate Carbon Dioxide Concentrator: Cathode Performance at High CO2 Utilization; J. Electrochem. Soc. 1983, 130(1), 20-28.
8) Winnick, J. Electrochemical Membrane Gas Separation; Chem. Eng. Prog.1990, 41-46.
9) Itou, K.; Tani, H.; Ono, Y.; Kasai, H.; Ota, K-I High efficiency CO2 separation and concentration system by using Molten Carbonate; Proceedings of GHGT-6, paper F3-5, Kyoto, Japan 2002.
10) Amorelli, A.; Wilkinson, M.B.; Bedont, P.; Capobianco, P.; Marcenaro, B.; Parodi, F.; Torazza, A. An Experimental Investigation Into The Use Of Molten Carbonate Fuel Cells To Capture CO2 From Gas Turbine Exhaust Gases; Proceedings of GHGT-6, paper F3-4, Kyoto, Japan 2002.
11) Sugiura, K.; Takei, K.; Tanimoto, K.; Miyazaki, Y. The Carbon Dioxide Concentrator By Using MCFC; poster to be presented at Eighth Grove Fuel Cell Symposium, 2003, London, UK.
12) Sugiura, K.; Yanagida, M.; Tanimoto, K.; Kojima, T. The Removal Characteristics of Carbon Dioxide in Molten Carbonate for the Thermal Power Plant; Proceedings of GHGT-5, 2000, Australia.
13) Sugiura, K.; Takei, K.; Tanimoto, K.; Miyazaki, Y. The carbon dioxide concentrator by using MCFC, J. of Power Sources, 2003, 118, 218-227.
14) Pennline, H.; Hoffmann, J.; Gray, M.; Siriwandane, R.; Granite, E. Recent Advances in Carbon Dioxide Capture and Separation Techniques at the National Energy Technology Laboratory; AIChE National Meeting, 2001, Reno, NV.
15) Granite, E.; Kazonich, G.; Pennline, H. Electrochemical Devices For Separating and Detecting Carbon Dioxide; DOE Carbon Sequestration Program Review Meeting; 2002, Pittsburgh, PA.
16) Granite, E.; Kazonich, G.; Pennline, H. Electrochemical Devices For Separating and Detecting Carbon Dioxide; 19th Int. Pitt. Coal Conf., paper 45-3, 2002, Pittsburgh, PA.
17) Granite, E.J. Solid Electrolyte Aided Studies of Oxide Catalyzed Oxidation of Hydrocarbons, 1994, PhD Thesis, Chemical Engineering, University of Rochester, Rochester New York.
18) Balachandran, U.; Ma, B.; Maiya, P.S.; Mieville, R.L.; Dusek, J.T.; Picciolo, J.; Guan, J.; Dorris, S.E.; Liu, M. Development of mixed-conducting oxides for gas separation; Solid State Ionics 1998, 108, 363-370.
19) Guan, J.; Dorris, S.E.; Balachandran, U.; Liu, M. Transport properties of SrCe0.95Y0.05O3-δ and its application for hydrogen separation; Solid State Ionics 1998, 110, 303-310.
20) Song, S-J; Wachsman, E.D.; Dorris, S.E.; Balachandran, U. Defect chemistry modeling of high-temperature proton-conducting cerates; Solid State Ionics 2002, 149, 1-10.
21) Granite, E.J. Electrochemical Pumps for the Separation of Hydrogen; NETL Project Proposal, 1999, US Department of Energy, Pittsburgh, PA.
22) Granite, E.J.; Jorne, J. A Novel Method for Studying Electrochemically Induced ACold Fusion@ Using a Deuteron-Conducting Solid Electrolyte; J. Electroanal. Chem. 1991, 317, 285-290
23) Herzog, H.; Drake, E.; Tester, J.; Rosenthal, R. A Research Needs Assessment for the Capture, Utilization, and Disposal of Carbon Dioxide from Fossil Fuel-Fired Power Plants; 1993, Final report DOE Contract No. DEFG-02-92ER30194; MIT Energy Laboratory: Cambridge, MA
24) Kosugi, T.; Hayashi, A.; Matsumoto, T.; Akimoto, K.; Tokimatsu, K.; Yoshida, H.; Tomoda, T.; Kaya, Y. Evaluation
of CO2 Capture Technologies Development by Use of Graphical Evaluation and Review Technique. Presented at GHGT-6, Kyoto, 2002; Paper B4-3.
Prepr. Pap.-Am. Chem. Soc., Div. Fuel Chem. 2004, 49 (1), 244
SILICALITE – 1 ZEOLITE MEMBRANES FOR CO2 SEPARATION
Margaret E. Welk*, François Bonhomme, Tina M. Nenoff
Chemical and Biological Technologies, Sandia National Laboratories, P.O. Box 5800, MS 0734, Albuquerque, NM 87185-
0734, USA *Presenting Author. Tel.: +1-505-284-9630; fax: +1-505-844-1480.
E-mail: [email protected]. Introduction
Much effort has recently been devoted to the synthesis of inorganic zeolite membranes because of their potential applications in the domains of gas separation, pervaporation, reverse osmosis or in the development of chemical sensors and catalytic membranes.1, , , ,2 3 4 5 Specifically, development of new technologies for H2 separation and purification has a high priority for the future of H2 as a fuel source. H2 is commonly produced by the reformation of hydrocarbons and must be purified, while CO2 is created as a by-product; CO2 must subsequently be sequestered. Zeolite membranes in particular combine pore size and shape selectivity with the inherent mechanical, thermal, and chemical stability necessary for long term separations.
The effective pore size distribution of the zeolite membrane, and hence its separation performance, is intrinsically governed by the choice of the zeolitic phase.6, , ,7 8 9 This applies when molecular size exclusion sieving is dominant and no other diffusion pathways bypass the network of well defined zeolitic channels; otherwise viscous flow through grain boundaries prevails. Zeolite membranes are typically synthesized on porous substrates by two different methods: 10 one step hydrothermal reaction on a pristine substrate from an aluminosilicate gel or by seed-promoted hydrothermal crystallization of the zeolitic layer. In both cases, the synthesis is affected by many complex interrelated factors such as the overall composition, concentration and viscosity of the gel, its pH, the source of silica and its degree of polymerization, the temperature and duration of the reaction. The optimization of these parameters is crucial to obtaining reliably “defect free” membranes. We report here on the synthesis of silicalite membranes on porous alumina disk supports, their characterization and their permeation performance for pure He, SF6, H2, CO2, O2, CH4, N2, and CO gases. We also show the reproducibility of the permeation values and the durability of a number of these films. Experimental
Gases. Reagent grade pure gases were purchased from Trigas. H2, CO2, O2, CH4, N2, CO were used to test the permeation characteristics of the membranes for reforming gases. SF6 was used to detect defects, He was used to purge and clean the unit.
Permeation Measurements. The membrane permeations were measured at room temperature using pure gases and a constant trans-membrane pressure of 16 PSI controlled by a backpressure regulator. The membrane was sealed in a Swagelok fitting using Viton O-rings. The gas flow through the membrane was measured using an acoustic displacement flowmeter (ADM 2000 from J&W) and a digital bubble flowmeter (HP-9301). Between permeation measurements with different pure gases (SF6, H2, CO2, O2, CH4, N2, CO), the whole system is purged, flushed with Helium and evacuated several times. The ideal gas selectivity was calculated as the ratio of the permeances in the steady regime.
Characterization Techniques. The zeolite membranes and seeds were characterized by X-ray diffraction (Siemens D500 diffractometer, Cu Kα radiation, Bragg-Brentano geometry) and by
Scanning Electron Microscopy (JEOL–6300V equipped with a Link Gem Oxford 6699 EDAX attachment).
Membrane Synthesis. In this work, the growth of the silicalite (Al-free ZSM-5) membrane on the porous support is achieved by secondary hydrothermal synthesis on supports seeded by rubbing.
The α-alumina substrates supplied by Inocermic Gmbh have a 1.8 micron average pore size, a diameter of 13 mm and a thickness of 1mm. The alumina substrates were first cleaned ultrasonically in acetone, rinsed in DI water and calcined at 1000°C overnight to remove any contaminants. All membranes in this work were obtained using seeded substrates to promote the nucleation and growth of the zeolite layer.
Tetra Propyl Ammonium (TPA) templated silicalite seeds were prepared under mild hydrothermal conditions in order to limit the size of the crystallites.11 A rubbing method of seeding was used. The seeded alumina substrates were then heated in air to 500°C for 6 hours, and then cooled to room temperature using a ramp rate of 4°C /min to remove the TPA template and attach the seeds to the substrate. They were then stored in a desiccator for later use.
A hydrothermal gel is used in a secondary growth step to produce a defect free membrane. The silicon source for the membrane synthesis is colloidal silica Ludox SM-30 (Aldrich); the organic template used is Tetra Propyl Ammonium (TPA) from TPAOH and TPABr (both from Alfa Aesar), and NaOH is the alkalinity source. Each gel was aged while being stirred at room temperature for 24 hours.
The seeded substrates were held vertically in the Teflon lined Parr reactor using Teflon holders to prevent sedimentation on top of the membrane. The homogenous gel was then poured in the reactor until the membrane was fully immersed. The hydrothermal syntheses were carried out in Parr reactors with a 23ml Teflon liner at temperature ranging from 160°C to 180°C and reaction time from 12 hours to 48 hours.
After synthesis, the membrane was washed with DI water and dried in air at 50°C for a few hours. A permeation test on the as-synthesized membrane allows the rapid assessment of its quality before the time consuming calcination step. At that stage, a good quality membrane should be gas-tight, or impermeable, for SF6. The SF6 kinetic diameter of 5.5 Å is slightly larger than the pores of the zeolite (minimum diameter 5.1 Å) thus SF6 diffusion indicates the presence of membrane defects.12 Any existing defects (partial coverage of the substrate and micro-cracks) can be repaired by a second hydrothermal synthesis step, using a shorter reaction time and more diluted starting gel. These modifications to the original synthesis parameters help to avoid the growth of columnar zeolite crystals (or agglomerates of crystals) on top of the first layer, as they would not contribute to the plugging of the existing cracks or voids in the film. The membranes presented here were gas-tight prior to calcination and did not require a second hydrothermal treatment.
Once the adequacy of the membrane was established, the organic template was removed from the membrane pores by calcination in air. The calcined membranes are whitish in color, indicating that no carbon deposit is present on the surface. Results and Discussion
Examination of the membranes by SEM showed dense coverage of zeolite crystals on the alumina support. The thickness of the crystalline layer is on average 10 microns and was found to be fairly uniform throughout the membrane.
An interesting feature of these membranes is that the permeance
Prepr. Pap.-Am. Chem. Soc., Div. Fuel Chem. 2004, 49 (1), 245
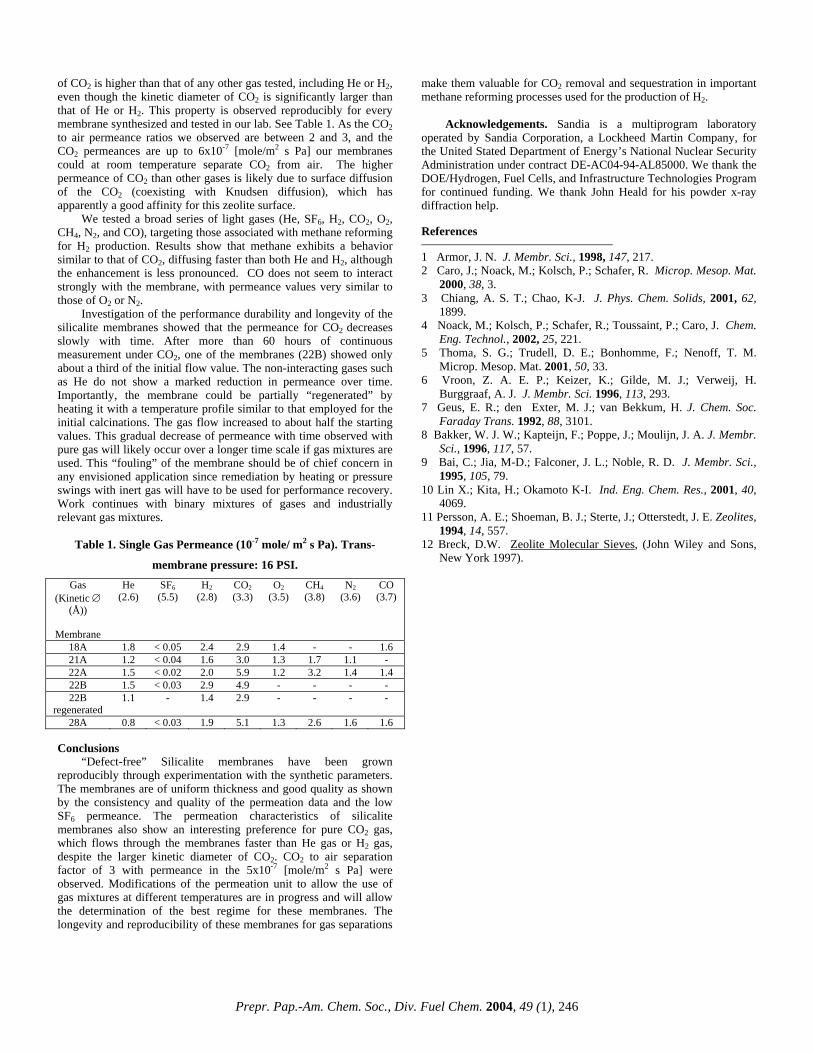
of CO2 is higher than that of any other gas tested, including He or H2, even though the kinetic diameter of CO2 is significantly larger than that of He or H2. This property is observed reproducibly for every membrane synthesized and tested in our lab. See Table 1. As the CO2 to air permeance ratios we observed are between 2 and 3, and the CO2 permeances are up to 6x10⁻⁷ [mole/m2 s Pa] our membranes could at room temperature separate CO2 from air. The higher permeance of CO2 than other gases is likely due to surface diffusion of the CO2 (coexisting with Knudsen diffusion), which has apparently a good affinity for this zeolite surface.
We tested a broad series of light gases (He, SF6, H2, CO2, O2, CH4, N2, and CO), targeting those associated with methane reforming for H2 production. Results show that methane exhibits a behavior similar to that of CO2, diffusing faster than both He and H2, although the enhancement is less pronounced. CO does not seem to interact strongly with the membrane, with permeance values very similar to those of O2 or N2.
Investigation of the performance durability and longevity of the silicalite membranes showed that the permeance for CO2 decreases slowly with time. After more than 60 hours of continuous measurement under CO2, one of the membranes (22B) showed only about a third of the initial flow value. The non-interacting gases such as He do not show a marked reduction in permeance over time. Importantly, the membrane could be partially “regenerated” by heating it with a temperature profile similar to that employed for the initial calcinations. The gas flow increased to about half the starting values. This gradual decrease of permeance with time observed with pure gas will likely occur over a longer time scale if gas mixtures are used. This “fouling” of the membrane should be of chief concern in any envisioned application since remediation by heating or pressure swings with inert gas will have to be used for performance recovery. Work continues with binary mixtures of gases and industrially relevant gas mixtures.
Table 1. Single Gas Permeance (10-7 mole/ m2 s Pa). Trans-
membrane pressure: 16 PSI. Gas
(Kinetic ∅ (Å))
Membrane
He (2.6)
SF6 (5.5)
H2 (2.8)
CO2 (3.3)
O2 (3.5)
CH4 (3.8)
N2 (3.6)
CO (3.7)
18A 1.8 < 0.05 2.4 2.9 1.4 - - 1.6 21A 1.2 < 0.04 1.6 3.0 1.3 1.7 1.1 - 22A 1.5 < 0.02 2.0 5.9 1.2 3.2 1.4 1.4 22B 1.5 < 0.03 2.9 4.9 - - - - 22B
regenerated 1.1 - 1.4 2.9 - - - -
28A 0.8 < 0.03 1.9 5.1 1.3 2.6 1.6 1.6 Conclusions
“Defect-free” Silicalite membranes have been grown reproducibly through experimentation with the synthetic parameters. The membranes are of uniform thickness and good quality as shown by the consistency and quality of the permeation data and the low SF6 permeance. The permeation characteristics of silicalite membranes also show an interesting preference for pure CO2 gas, which flows through the membranes faster than He gas or H2 gas, despite the larger kinetic diameter of CO2. CO2 to air separation factor of 3 with permeance in the 5x10⁻⁷ [mole/m2 s Pa] were observed. Modifications of the permeation unit to allow the use of gas mixtures at different temperatures are in progress and will allow the determination of the best regime for these membranes. The longevity and reproducibility of these membranes for gas separations
make them valuable for CO2 removal and sequestration in important methane reforming processes used for the production of H2.
Acknowledgements. Sandia is a multiprogram laboratory
operated by Sandia Corporation, a Lockheed Martin Company, for the United Stated Department of Energy’s National Nuclear Security Administration under contract DE-AC04-94-AL85000. We thank the DOE/Hydrogen, Fuel Cells, and Infrastructure Technologies Program for continued funding. We thank John Heald for his powder x-ray diffraction help. References 1 Armor, J. N. J. Membr. Sci., 1998, 147, 217. 2 Caro, J.; Noack, M.; Kolsch, P.; Schafer, R. Microp. Mesop. Mat.
2000, 38, 3. 3 Chiang, A. S. T.; Chao, K-J. J. Phys. Chem. Solids, 2001, 62,
1899. 4 Noack, M.; Kolsch, P.; Schafer, R.; Toussaint, P.; Caro, J. Chem.
Eng. Technol., 2002, 25, 221. 5 Thoma, S. G.; Trudell, D. E.; Bonhomme, F.; Nenoff, T. M.
Microp. Mesop. Mat. 2001, 50, 33. 6 Vroon, Z. A. E. P.; Keizer, K.; Gilde, M. J.; Verweij, H.
Burggraaf, A. J. J. Membr. Sci. 1996, 113, 293. 7 Geus, E. R.; den Exter, M. J.; van Bekkum, H. J. Chem. Soc.
Faraday Trans. 1992, 88, 3101. 8 Bakker, W. J. W.; Kapteijn, F.; Poppe, J.; Moulijn, J. A. J. Membr.
Sci., 1996, 117, 57. 9 Bai, C.; Jia, M-D.; Falconer, J. L.; Noble, R. D. J. Membr. Sci.,
1995, 105, 79. 10 Lin X.; Kita, H.; Okamoto K-I. Ind. Eng. Chem. Res., 2001, 40,
4069. 11 Persson, A. E.; Shoeman, B. J.; Sterte, J.; Otterstedt, J. E. Zeolites,
1994, 14, 557. 12 Breck, D.W. Zeolite Molecular Sieves, (John Wiley and Sons,
New York 1997).
Prepr. Pap.-Am. Chem. Soc., Div. Fuel Chem. 2004, 49 (1), 246

Regenerable Aqua Ammonia Process for CO2 Sequestration
James T. Yeh1, Kevin P. Resnik2, and Henry W. Pennline1
(1) National Energy Technology Laboratory, U.S. Dept. of Energy, NETL P.O. Box 10940, Pittsburgh, PA 15236-0940, Fax: 412-386-
6004 [email protected], (2) National Energy Technology Laboratory, Parsons Project Services, Inc
Introduction
The monoethanolamine (MEA) process is currently the most widely-used industrial process for CO2 purification for various commercial applications. If the source of CO2 comes from fossil fuel combustion, the cost of CO2 capture is acceptable by current users because of the high value of the final product. However, the MEA process is considered to be too expensive for greenhouse gas reduction purposes because of the excessively high quantity of CO2 that must be captured from coal-burning power plants. Additionally, the regeneration step of the MEA process is energy intensive, and the CO2 product has little commercial value due to the anticipated overproduction.
It is envisioned that the MEA process could be replaced with an aqua ammonia process to capture all three major acid gases (SO2, NOx, and CO2, plus HCl and HF), that may exist in the flue gas. Since SO2 and NOx emissions must comply to certain limitations, a single process to capture all acidic gases is expected to reduce the total cost and complexity of emission control systems. Currently CO2 is not regulated in the United States, although a limit on CO2 emissions in the future could become a reality. Unlike the MEA process, the aqua ammonia process is not expected to have degradation problems due to SO2 and oxygen. In addition, the ammonia solution has a higher CO2 loading capacity than MEA. A rich ammonia solution requires much less thermal energy to regenerate than a rich MEA solution.
Very few research reports in the usage of ammonia for CO2 capture are available. China has combined an aqueous NH3 solution and CO2 gas to produce ammonium bicarbonate (ABC) fertilizer for about 40 years. Currently (2003), 43% of the fertilizer used in China is ABC [1]. Bai and Yeh [2] reported on the study of CO2 absorption by aqueous ammonia and the resultant CO2 loading capacity. Yeh and Bai [3] compared CO2 loading capacity of aqueous ammonia and MEA solutions.
The following reactions show the reaction byproducts between CO2 and aqueous ammonia: 2 NH3 + CO2 ↔ NH2COONH4 (1) NH2COONH4 + CO2 + 2H2O ↔ 2NH4HCO3 (2) NH2COONH4 + H2O ↔ NH4HCO3 + NH3 (3) NH3 + H2O + CO2 ↔ NH4HCO3 (4) 2NH3 + H2O + CO2 ↔ (NH4)2CO3 (5) (NH4)2CO3 + CO2 + H2O ↔ 2NH4HCO3 (6)
In this study, experiments were conducted to determine the CO2 loading of aqueous ammonia solutions that were subjected to three absorption and regeneration cycles. A reasonable loading was determined and used in the preparation of a process flow diagram for the process as a basis of comparison to the current MEA process. Studies of the regeneration of prepared solutions of ABC and ammonium carbonate (AC) were also conducted.
Experimental Absorption. The absorption tests take place in a semi-batch
bubble reactor equipped with a mixer operating at 1600 rpm. A simulated flue gas consisting of 15%vol CO2 and 85%vol N2 is bubbled through ⅜” tubing at a flow rate of 7300 sccm. The absorber is a 3-liter glass container filled with 1500-ml aqueous ammonia solution. The temperature of the solution is controlled by pumping water from a recirculating heater through an immersed ¼” tubing coil. Typically, absorption tests were conducted at 27oC. The reactor pressure is maintained at 1 psig to supply motive energy to the gas analysis system. A reflux condenser dries the gas to a dewpoint of approximately -12oC. The gas is bubbled through the reactor until the CO2 concentration is 95% of the inlet, or the flow stops due to plugging of the gas inlet tubing as a result of precipitation of the ABC. Data from an infrared CO2 gas analyzer is analyzed to determine the amount absorbed as a function of time.
Regeneration. Regeneration tests utilize much of the same equipment, with the following exceptions. The ¼” heating coil is replaced with a ⅜” coil to increase the heat transfer. The mixer is replaced with a magnetic stirrer. A 2000 ml reactor is used to minimize the headspace and gas residence time. Although the regeneration is performed in a batch mode, the gas inlet is rerouted to the reactor’s vent line and metered nitrogen acts as a sweep gas to the analyzer. The temperature of the solution to be regenerated is ramped from ambient to at least 82oC, with stops at 49oC, 54oC, 60oC, and 71oC.
Test Matrix. In the first series of tests, regeneration experiments with mixtures of ABC and AC were conducted to determine the amount of CO2 evolved from the solution as a function of temperature.
In the second series of tests, aqueous ammonia solutions containing 7%, 10.5%, and 14% ammonia are prepared by diluting a 28% NH3 solution. An absorption test is conducted. The saturated (rich) liquid is then regenerated at 82oC. The lean solution is used in an absorption test. The absorption / regeneration cycle is repeated for a total of three times (approaching a steady-state condition), and the totalized amount of CO2 absorbed or regenerated is calculated. Results and Discussion
Figure 1 shows the amount of CO2 liberated by thermal regeneration from standard solutions of ABC and AC as a function of temperature. The dependent variable in Figure 1 represents the total percentage of the original carbon in the solution that was evolved up to that temperature. It is evident that as the proportion of bicarbonate in the solution increases, the CO2 is more easily regenerated. It is demonstrated that as much as 60% of the carbon in the solution can be regenerated, which in a continuous process would free the ammonia for the absorption cycle.
Table 1 shows the effect of cycling various initial compositions of ammonia on the absorption and regeneration capacity for each step of the three-step cycling process.
Table 1. CO2 Absorbed (g/g solution) per
Cycle at Varying NH3 Concentrations Initial NH3 (%) 7.0 10.5 14.0 1st Absorption 0.111 0.141 0.157 2nd Absorption 0.044 0.054 0.067 3rd Absorption 0.039 0.053 0.068
Prepr. Pap.-Am. Chem. Soc., Div. Fuel Chem. 2004, 49 (1), 247

For each of the three initial NH3 concentrations, the data show that after the first cycle, the amount of CO2 absorbed is converging to a constant value. It is important to note that the NH3 concentration listed is the initial NH3 concentration for the solution. As expected, there is an evaporation of NH3 into the vent gas from the reactor, primarily during the first absorption cycle, partially explaining the reduction in the capacity of the solution to absorb CO2 in subsequent cycles. For example, based on mass balance calculations, 36% of the NH3 was lost during the first absorption cycle with an initial NH3 concentration of 14%. After the three absorption/regeneration cycles, the residual solution contained approximately 8% ammonia. It is believed that incomplete regeneration of the solution is responsible for the remainder of the absorption capacity loss.
Figure 1. Regeneration Test Summary
0
10
20
30
40
50
60
40 50 60 70 80 90 100
Solution Temperature (oC)
% C
evo
lved
20% ABC, 0% AC15% ABC, 5% AC10% ABC, 10% AC5% ABC, 15% AC0% ABC, 20% AC
The heat required for regeneration is a combination of sensible
heat, heat of reaction, and latent heat of vaporization. Table 2 shows the relative contribution from these energy requirements for both MEA and aqueous ammonia solutions. Three potential reactions could be responsible for liberation of CO2 during the thermal regeneration: 2NH4HCO3(aq) ↔ (NH4)2CO3(aq)+CO2+H2O Hr= 6.4 kcal/mol (7) NH4HCO3(aq) ↔NH3(aq) + H2O + CO2(g) Hr= 24.1 kcal/mol (8) (NH4)2CO3(aq) ↔2NH3(aq)+H2O+CO2(g) Hr= 15.3 kcal/mol (9)
Due to current uncertainty of the dominant regeneration reaction, the three potential reactions are compared in Table 2.
Based on the CO2 loading data derived from the cycling tests and the calculated energy requirements, a basic process flow diagram for an aqueous ammonia process was developed. The proposed process flow diagram is shown in Figure 2, and a comparable MEA process flow diagram is shown in Figure 3.
Table 2. Regeneration Energy Required of an 8% Aqua Ammonia Process Compared to Current 20% MEA Technology
∆Hrx (kcal/mol)
Sensible Heat* (kcal/mol)
Heat of Vaporization (kcal/mol)
Total (kcal/mol)
Reduction from MEA process (%)
MEA 20.0 79.4 18.9 118.3 0 NH3 (eq. 7) 6.4 36,0 0 42.4 64 NH3 (eq. 8) 24.1 36.0 0 60.1 49 NH3 (eq. 9) 15.3 36.0 0 51.3 57 * Sensible heat = mass of solution(g/mol CO2) * Cp (assume .001 kcal/g-oC) * ∆Trx (oC)
Absorption can take place between 16oC and 38oC in the aqua ammonia process. The CO2-rich stream is pumped through a heat exchanger to the regenerator, where the solution is heated to 82oC and CO2 gas is released from the heated solution. The pure CO2 can be collected for later sequestration. The CO2-lean solution from the regenerator is recycled back to the absorber for reuse. During the
regeneration, not all of the CO2 in the solution will be released. A similar procedure is used in the MEA process.
The advantages of the aqua ammonia process include: a lower liquid flow rate, lowering capital equipment and pumping costs; no stripping steam is required for the regeneration; a higher CO2 capture capacity per gram of solution; and a lower heat of reaction. The last three advantages result in a potential regeneration energy savings of up to 64% compared to the current MEA process.
Figure 2. Process Flow Diagram for Aqua NH3 CO2Capture Process
AB
SOR
BER
REG
ENER
ATO
R
1 ATM27°C
1 ATM82°C
Flue Gas
Treated Gas CO2
HEATEXCHANGER
10% CO25-10% O2
HEATER
Llean= 0.41 mol CO2/mol NH3= 0.08 g CO2/g NH3 solution
8 wt %NH3
0.07 g CO2/g NH3 solutioncirculated
1020 cal/g CO2regenerated
Lrich = 0.75 mol CO2/mol NH3= 0.15 g CO2/g NH3 solution
Figure 3. Process Flow Diagram for Typical MEA CO2Capture Process
AB
SOR
BER
REG
ENER
ATO
R
1 ATM55°C
2 ATM120°C
Flue Gas
Treated Gas CO2
HEATEXCHANGER
10% CO25-10% O2
HEATER
Llean= 0.15 mol CO2/mol MEA= 0.022 g CO2/g MEA solution
20 wt % MEA
0.036 g CO2/g MEA solutioncirculated
2690 cal/g CO2regenerated
Lrich = 0.4 mol CO2/mol MEA= 0.058 g CO2/g MEA solution
Reclaimer
Conclusions Carbon dioxide transfer capacities of aqueous ammonia solutions and monoethanolamine (MEA) solutions were compared. The CO2 carrying capacity in grams of CO2 per gram of NH3 solution circulated is 0.07 as compared with 0.036 grams of CO2 per gram of MEA solution, thus the energy requirement for liquid mass circulation of an ammonia solution is approximately 50% that of an MEA solution for equal weight of CO2 carried. In another comparison, the thermal energy required to regenerate CO2 from the rich solution is substantially less as compared to the MEA process. References [1] Zhang, Zemin , et al – New Type of Nitrogen Fertilizer-Long Lasting
Ammonium bicarbonate, Chemical Industry Publishing, Beijing, China, January, 2000. IBSN 7-5025-2619-6.
[2] Bai, H. and A.C. Yeh, Removal of CO2 Greenhouse Gas by Ammonia Scrubbing. I.E.C.Res., Vol. 36, No.6, 1997. [3] Yeh, A.C. and H. Bai, Comparison of Ammonia and Monoethanolamine Solvents to Reduce CO2 Greenhouse Gas Emissions. The Science of Total Environment, pp 121-133, 1999.
Prepr. Pap.-Am. Chem. Soc., Div. Fuel Chem. 2004, 49 (1), 248

ABSORPTION CHARACTERISTIC OF CONTINUOUS CO2 ABSORPTION PROCESS
Sung-Youl Park, Byoung-Moo Min, Jong-Sup Lee, Sung-Chan Nam,
Keun-Hee Han and Ju-Soo Hyun
Combustion Gas Clean-up Technology Center Korea Institute of Energy Research
71-2, Jang-Dong, Yuseong-Gu, Daejeon, Korea Introduction
Carbon dioxide is widely recognized as a major component of greenhouse gas contributing to global warming and produced in large quantity from various industrial sources, including fossil fuel firing electric power generation, steel production, chemical and petrochemical manufacturing, cement production, etc. Due to the increased CO2 mediated global warming problems, strong and adverse affects on the development of a large number of industries in the near future are expected. As a means of mitigating the global warming, removal of CO2 from industrial flue gas is considered important. The means of CO2 removal include absorption by chemical solvents, physical absorption, cryogenic separation, membrane separation and etc. Among these methods, CO2 absorption by alkanol amine(MEA) aqueous solution has been considered as the most efficient way and various research activities were conducted by this method and most commercial processes for the bulk removal of CO2 from gaseous streams involve the use of amines1,2,3. Traditionally, only random packings are used as the gas-liquid contacting media inside the absorption and regeneration towers. It has been suggested that using high efficiency column packings in these towers could substantially improve the efficiency of the gas treating process which reduce its capital cost. Hydrodynamics and mass transfer characteristics, including flooding capacities, gas and liquid mass transfer coefficients, interfacial area and liquid hold up are essential for evaluating the effectiveness of the tower packings and also important for the reliable design and operation of the CO2 absorption processes4. Experimental
CO2 Absorption Process. The configuration of apparatus used in this experiment has typical arrangement of CO2 absorption process as shown in Figure 1.
Figure 1. Simplified diagram of CO2 absorption process. The facility consists of diesel oil boiler, flue gas reservoir, flue
gas supply pump, packed column absorber, sieve tray stripper, re-boiler for absorbent regeneration by evaporation, preheater for heating of CO2 rich absorbent before stripping, heat exchanger for
CO2 rich and regenerated absorbent and condensers for vent gas of absorber and stripper.
Flue Gas and Absorbent. Flue gas used in this experiment is generated from the combustion of kerosene. After cooling, the generated flue gas is transferred to flue gas storage reservoir and then supplied to CO2 absorber under flow rate control by dry gas flow meter. Boiler operation is appropriately manipulated to prevent soot generation and keep CO2 concentration of flue gas about 12vol%.
Absorbent used in this experiment is prepared by the mixing of MEA with distillated water. 99.0wt% MEA(Nippon Sakubai) is diluted to 30wt% of aqueous MEA solution. Before absorbent loading, absorber and stripper is cleaned by distillated water and nitrogen.
Packing Material. As a packing material, raschig ring, intalox saddle and Pro-Pak is randomly packed in absorber. Physical properties of the packing material are shown in Table 1.
Table 1. Physical Properties of Packing Material
Packing material Raschig ring Intallox saddle Pro-Pak Size (inch) 1/4 3/8 1/4 Packing density (kg/m3) 960 801 336 Specific surface area (m2/m3) 710 801 1220 Void fraction (%) 62 67 96
Measurement and Analysis Methods. Flue gas flow rate is
measured by dry gas flow meter and absorbent flow rate is measured by liquid flow meter. Analysis of flue gas components is performed for absorber inlet and stripper outlet. CO2, O2 and N2 of flue gas are analyzed by on-line gas chromatograph(HP6890) equipped with TCD and packed column(Carboxen 1000). Results and Discussion
The design of absorption column and similar equipment is necessarily based on information concerning the diffusion from one to the other of two phases being contacted5. Operating hold-up is an important factor in gas-liquid mass transfer. Operating hold-up is defined as the difference between total hold-up and static hold-up. Static hold-up is the liquid volume per unit volume of the bed which does not drain from the packing when the liquid supply to the column is stopped6. Operating hold-up and flue gas pressure drop of absorber using different types of packing material was measured and shown in Figure 2.
Flue gas flow rate [ L/min ]
0 10 20 30 40 50 60
Abs
orbe
nt h
old
up [
ml ]
0
200
400
600
800
1000
Flue
gas
pre
ssur
e dr
op [
cmH
2O ]
0
10
20
30
40
Raschig ringIntalox saddlePro-pak
Packing material
Absorbent : 30 wt% MEAPacking material : Pro-PakPreheater temperature : 90 oCReboiler temperature : 95 oC
CO2Vent
Absorber StripperPre-HeaterCooler
Heat Exchanger
Re-boiler
CondenserCondenser
Flue Gas
Figure 2. Operating hold-up and flue gas pressure drop of packing materials under different flue gas flow rate.
Prepr. Pap.-Am. Chem. Soc., Div. Fuel Chem. 2004, 49 (1), 249
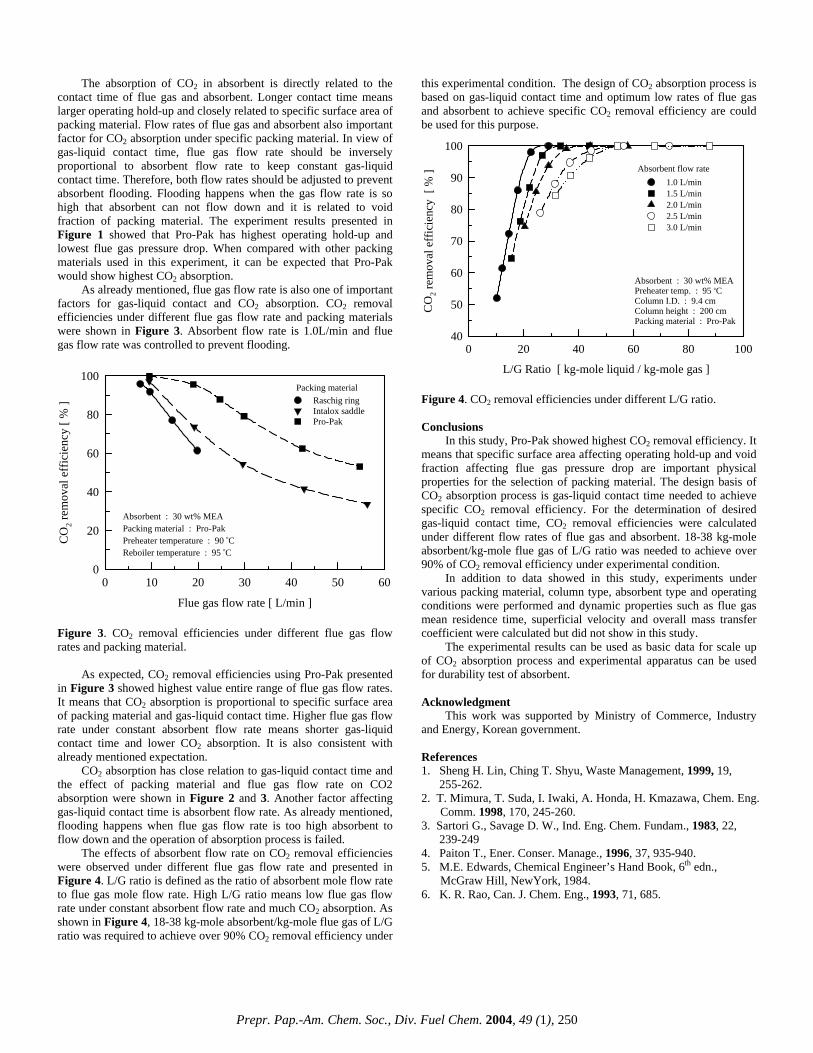
The absorption of CO2 in absorbent is directly related to the contact time of flue gas and absorbent. Longer contact time means larger operating hold-up and closely related to specific surface area of packing material. Flow rates of flue gas and absorbent also important factor for CO2 absorption under specific packing material. In view of gas-liquid contact time, flue gas flow rate should be inversely proportional to absorbent flow rate to keep constant gas-liquid contact time. Therefore, both flow rates should be adjusted to prevent absorbent flooding. Flooding happens when the gas flow rate is so high that absorbent can not flow down and it is related to void fraction of packing material. The experiment results presented in Figure 1 showed that Pro-Pak has highest operating hold-up and lowest flue gas pressure drop. When compared with other packing materials used in this experiment, it can be expected that Pro-Pak would show highest CO2 absorption.
As already mentioned, flue gas flow rate is also one of important factors for gas-liquid contact and CO2 absorption. CO2 removal efficiencies under different flue gas flow rate and packing materials were shown in Figure 3. Absorbent flow rate is 1.0L/min and flue gas flow rate was controlled to prevent flooding.
Figure 3. CO2 removal efficiencies under different flue gas flow rates and packing material.
As expected, CO2 removal efficiencies using Pro-Pak presented
in Figure 3 showed highest value entire range of flue gas flow rates. It means that CO2 absorption is proportional to specific surface area of packing material and gas-liquid contact time. Higher flue gas flow rate under constant absorbent flow rate means shorter gas-liquid contact time and lower CO2 absorption. It is also consistent with already mentioned expectation.
CO2 absorption has close relation to gas-liquid contact time and the effect of packing material and flue gas flow rate on CO2 absorption were shown in Figure 2 and 3. Another factor affecting gas-liquid contact time is absorbent flow rate. As already mentioned, flooding happens when flue gas flow rate is too high absorbent to flow down and the operation of absorption process is failed.
The effects of absorbent flow rate on CO2 removal efficiencies were observed under different flue gas flow rate and presented in Figure 4. L/G ratio is defined as the ratio of absorbent mole flow rate to flue gas mole flow rate. High L/G ratio means low flue gas flow rate under constant absorbent flow rate and much CO2 absorption. As shown in Figure 4, 18-38 kg-mole absorbent/kg-mole flue gas of L/G ratio was required to achieve over 90% CO2 removal efficiency under
this experimental condition. The design of CO2 absorption process is based on gas-liquid contact time and optimum low rates of flue gas and absorbent to achieve specific CO2 removal efficiency are could be used for this purpose.
Absorbent : 30 wt% MEAPreheater temp. : 95 oCColumn I.D. : 9.4 cmColumn height : 200 cmPacking material : Pro-Pak
Absorbent flow rate
L/G Ratio [ kg-mole liquid / kg-mole gas ]
0 20 40 60 80 100
CO
2 rem
oval
eff
icie
ncy
[ %
]
40
50
60
70
80
90
100
1.0 L/min1.5 L/min2.0 L/min2.5 L/min3.0 L/min
Figure 4. CO2 removal efficiencies under different L/G ratio. Conclusions
In this study, Pro-Pak showed highest CO2 removal efficiency. It means that specific surface area affecting operating hold-up and void fraction affecting flue gas pressure drop are important physical properties for the selection of packing material. The design basis of CO2 absorption process is gas-liquid contact time needed to achieve specific CO2 removal efficiency. For the determination of desired gas-liquid contact time, CO2 removal efficiencies were calculated under different flow rates of flue gas and absorbent. 18-38 kg-mole absorbent/kg-mole flue gas of L/G ratio was needed to achieve over 90% of CO2 removal efficiency under experimental condition.
Flue gas flow rate [ L/min ]
0 10 20 30 40 50 6 In addition to data showed in this study, experiments under various packing material, column type, absorbent type and operating conditions were performed and dynamic properties such as flue gas mean residence time, superficial velocity and overall mass transfer coefficient were calculated but did not show in this study.
0
CO
2 rem
oval
eff
icie
ncy
[ % ]
0
20
40
60
80
100Packing material
Absorbent : 30 wt% MEAPacking material : Pro-PakPreheater temperature : 90 oCReboiler temperature : 95 oC
Raschig ringIntalox saddlePro-Pak
The experimental results can be used as basic data for scale up of CO2 absorption process and experimental apparatus can be used for durability test of absorbent. Acknowledgment
This work was supported by Ministry of Commerce, Industry and Energy, Korean government. References 1. Sheng H. Lin, Ching T. Shyu, Waste Management, 1999, 19,
255-262. 2. T. Mimura, T. Suda, I. Iwaki, A. Honda, H. Kmazawa, Chem. Eng.
Comm. 1998, 170, 245-260. 3. Sartori G., Savage D. W., Ind. Eng. Chem. Fundam., 1983, 22,
239-249 4. Paiton T., Ener. Conser. Manage., 1996, 37, 935-940. 5. M.E. Edwards, Chemical Engineer’s Hand Book, 6th edn.,
McGraw Hill, NewYork, 1984. 6. K. R. Rao, Can. J. Chem. Eng., 1993, 71, 685.
Prepr. Pap.-Am. Chem. Soc., Div. Fuel Chem. 2004, 49 (1), 250
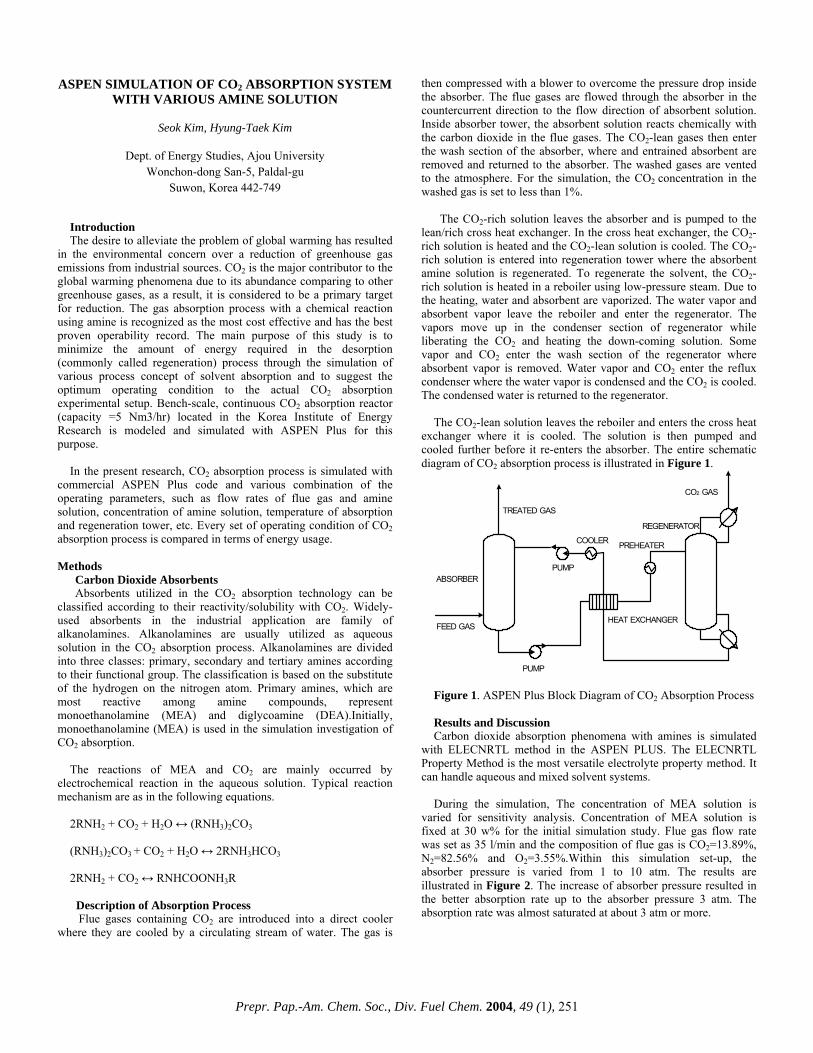
ASPEN SIMULATION OF CO2 ABSORPTION SYSTEM WITH VARIOUS AMINE SOLUTION
Seok Kim, Hyung-Taek Kim
Dept. of Energy Studies, Ajou University
Wonchon-dong San-5, Paldal-gu Suwon, Korea 442-749
Introduction The desire to alleviate the problem of global warming has resulted
in the environmental concern over a reduction of greenhouse gas emissions from industrial sources. CO2 is the major contributor to the global warming phenomena due to its abundance comparing to other greenhouse gases, as a result, it is considered to be a primary target for reduction. The gas absorption process with a chemical reaction using amine is recognized as the most cost effective and has the best proven operability record. The main purpose of this study is to minimize the amount of energy required in the desorption (commonly called regeneration) process through the simulation of various process concept of solvent absorption and to suggest the optimum operating condition to the actual CO2 absorption experimental setup. Bench-scale, continuous CO2 absorption reactor (capacity =5 Nm3/hr) located in the Korea Institute of Energy Research is modeled and simulated with ASPEN Plus for this purpose.
In the present research, CO2 absorption process is simulated with
commercial ASPEN Plus code and various combination of the operating parameters, such as flow rates of flue gas and amine solution, concentration of amine solution, temperature of absorption and regeneration tower, etc. Every set of operating condition of CO2 absorption process is compared in terms of energy usage.
Methods
Carbon Dioxide Absorbents Absorbents utilized in the CO2 absorption technology can be
classified according to their reactivity/solubility with CO2. Widely-used absorbents in the industrial application are family of alkanolamines. Alkanolamines are usually utilized as aqueous solution in the CO2 absorption process. Alkanolamines are divided into three classes: primary, secondary and tertiary amines according to their functional group. The classification is based on the substitute of the hydrogen on the nitrogen atom. Primary amines, which are most reactive among amine compounds, represent monoethanolamine (MEA) and diglycoamine (DEA).Initially, monoethanolamine (MEA) is used in the simulation investigation of CO2 absorption.
The reactions of MEA and CO2 are mainly occurred by
electrochemical reaction in the aqueous solution. Typical reaction mechanism are as in the following equations.
2RNH2 + CO2 + H2O ↔ (RNH3)2CO3 (RNH3)2CO3 + CO2 + H2O ↔ 2RNH3HCO3 2RNH2 + CO2 ↔ RNHCOONH3R
Description of Absorption Process Flue gases containing CO2 are introduced into a direct cooler
where they are cooled by a circulating stream of water. The gas is
then compressed with a blower to overcome the pressure drop inside the absorber. The flue gases are flowed through the absorber in the countercurrent direction to the flow direction of absorbent solution. Inside absorber tower, the absorbent solution reacts chemically with the carbon dioxide in the flue gases. The CO2-lean gases then enter the wash section of the absorber, where and entrained absorbent are removed and returned to the absorber. The washed gases are vented to the atmosphere. For the simulation, the CO2 concentration in the washed gas is set to less than 1%.
The CO2-rich solution leaves the absorber and is pumped to the
lean/rich cross heat exchanger. In the cross heat exchanger, the CO2-rich solution is heated and the CO2-lean solution is cooled. The CO2-rich solution is entered into regeneration tower where the absorbent amine solution is regenerated. To regenerate the solvent, the CO2-rich solution is heated in a reboiler using low-pressure steam. Due to the heating, water and absorbent are vaporized. The water vapor and absorbent vapor leave the reboiler and enter the regenerator. The vapors move up in the condenser section of regenerator while liberating the CO2 and heating the down-coming solution. Some vapor and CO2 enter the wash section of the regenerator where absorbent vapor is removed. Water vapor and CO2 enter the reflux condenser where the water vapor is condensed and the CO2 is cooled. The condensed water is returned to the regenerator.
The CO2-lean solution leaves the reboiler and enters the cross heat
exchanger where it is cooled. The solution is then pumped and cooled further before it re-enters the absorber. The entire schematic diagram of CO2 absorption process is illustrated in Figure 1.
HEAT EXCHANGER
ABSORBER
TREATED GAS
COOLER PREHEATER
REGENERATOR
PUMP
CO2 GAS
PUMP
FEED GAS
Figure 1. ASPEN Plus Block Diagram of CO2 Absorption Process Results and Discussion Carbon dioxide absorption phenomena with amines is simulated
with ELECNRTL method in the ASPEN PLUS. The ELECNRTL Property Method is the most versatile electrolyte property method. It can handle aqueous and mixed solvent systems.
During the simulation, The concentration of MEA solution is
varied for sensitivity analysis. Concentration of MEA solution is fixed at 30 w% for the initial simulation study. Flue gas flow rate was set as 35 l/min and the composition of flue gas is CO2=13.89%, N2=82.56% and O2=3.55%.Within this simulation set-up, the absorber pressure is varied from 1 to 10 atm. The results are illustrated in Figure 2. The increase of absorber pressure resulted in the better absorption rate up to the absorber pressure 3 atm. The absorption rate was almost saturated at about 3 atm or more.
Prepr. Pap.-Am. Chem. Soc., Div. Fuel Chem. 2004, 49 (1), 251
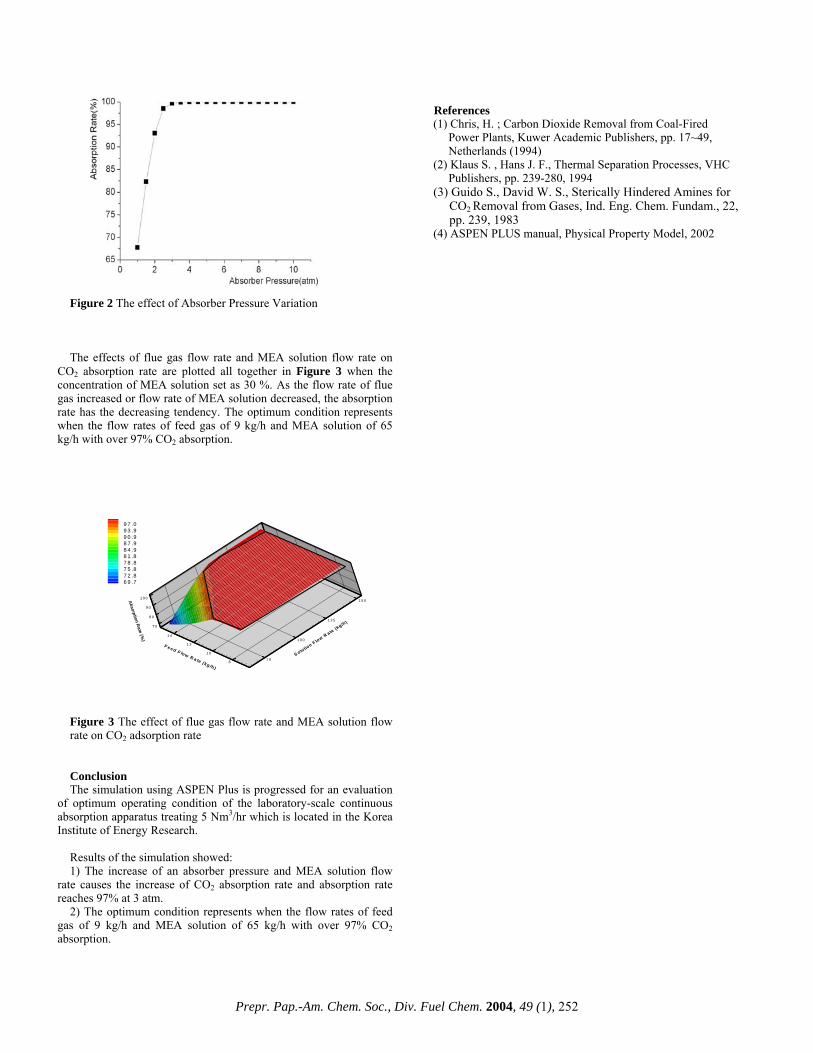
Figure 2 The effect of Absorber Pressure Variation The effects of flue gas flow rate and MEA solution flow rate on
CO2 absorption rate are plotted all together in Figure 3 when the concentration of MEA solution set as 30 %. As the flow rate of flue gas increased or flow rate of MEA solution decreased, the absorption rate has the decreasing tendency. The optimum condition represents when the flow rates of feed gas of 9 kg/h and MEA solution of 65 kg/h with over 97% CO2 absorption.
7 0
8 0
9 0
1 0 0A b so rp tio nR
a te(%
)
7 5
1 0 0
1 2 5
1 5 0
S o lu tion F low R a te
(kg /h )
8
1 0
1 2
1 4
F e e d F lo w R a te (kg /h )
9 7 .09 3 .99 0 .98 7 .98 4 .98 1 .87 8 .87 5 .87 2 .86 9 .7
Figure 3 The effect of flue gas flow rate and MEA solution flow rate on CO2 adsorption rate Conclusion The simulation using ASPEN Plus is progressed for an evaluation
of optimum operating condition of the laboratory-scale continuous absorption apparatus treating 5 Nm3/hr which is located in the Korea Institute of Energy Research.
Results of the simulation showed: 1) The increase of an absorber pressure and MEA solution flow
rate causes the increase of CO2 absorption rate and absorption rate reaches 97% at 3 atm.
2) The optimum condition represents when the flow rates of feed gas of 9 kg/h and MEA solution of 65 kg/h with over 97% CO2 absorption.
References (1) Chris, H. ; Carbon Dioxide Removal from Coal-Fired Power Plants, Kuwer Academic Publishers, pp. 17~49, Netherlands (1994) (2) Klaus S. , Hans J. F., Thermal Separation Processes, VHC Publishers, pp. 239-280, 1994 (3) Guido S., David W. S., Sterically Hindered Amines for CO2 Removal from Gases, Ind. Eng. Chem. Fundam., 22, pp. 239, 1983 (4) ASPEN PLUS manual, Physical Property Model, 2002
Prepr. Pap.-Am. Chem. Soc., Div. Fuel Chem. 2004, 49 (1), 252

PLAINS CO2 REDUCTION (PCOR) PARTNERSHIP
Thomas A. Erickson, John A. Harju, Edward N. Steadman
Energy & Environmental Research Center 15 North 23rd Street
Grand Forks, ND 58203
The Energy & Environmental Research Center (EERC) is leading one of seven regional partnerships developed by the U.S. Department of Energy (DOE) to assess regional carbon sequestration opportunities. The Plains CO2 Reduction (PCOR) Partnership (which is a designated DOE Regional Carbon Sequestration Partnership [RCSP]) is focused on addressing future sequestration options from a holistic viewpoint, including source characterization, infrastructure needs, deployment, issues, public outreach, sink characterization, environmental impacts, long-term issues, and monitoring. The PCOR Partnership region includes North Dakota, South Dakota, Minnesota, Montana, and Wyoming, as well as the Canadian provinces of Saskatchewan and Manitoba (see Figure 1). The partnership is focused on a wide range of geological and terrestrial sequestration opportunities for both current CO2 sources and future industrial and utility point sources.
Figure 1. PCOR Partnership region. As shown in Table 1, the PCOR Partnership features a diverse, multipartner team under EERC leadership that brings together the key government, private sector, technical, and outreach groups needed to undertake the activities in the four performance tasks. The PCOR Partnership team is well suited to assess the regional baseline and infrastructure and to involve stakeholders in developing action plans for future demonstration projects. The PCOR Partnership team includes 1) industry sponsors that provide cost share and serve as advisors; 2) research partners that are funded under the PCOR Partnership venture; and 3) collaborators that, in most cases, provide in-kind support. The industry sponsors have significant and active operations in all five states of the region. The knowledge base, expertise, and hands-on experience of the PCOR Partnership research team encompass the entire region.
Table 1. PCOR Partnership Team Industry Sponsors Research Partners Basin Electric Power Cooperative Center for Energy & Economic Development (CEED) Great River Energy Montana–Dakota Utilities Co. North Dakota Industrial Commission (NDIC) Otter Tail Power Company U.S. Department of Energy
Dakota Gasification Company EERC Fischer Oil and Gas, Inc. Interstate Oil and Gas Compact Commission Nexant, Inc. North Dakota State University Prairie Public Television Western Governors’ Association
Collaborators
Amerada Hess Corporation Bechtel Corporation Chicago Climate Exchange Eagle Operating, Inc. Environment Canada Minnesota Pollution Control Agency Montana Department of Environmental Quality Montana Public Service Commission
Natural Resources Trust NDIC Oil and Gas Division North Dakota Department of Health North Dakota Geological Survey North Dakota Petroleum Council Petroleum Technology Transfer Council Tesoro Refinery
Figure 2. PCOR Partnership project in the context of DOE’s 3-phase RCSP program. The Phase I goals of the PCOR Partnership are being accomplished through a 3-step approach (see Figure 2). Step 1 is characterizing technical issues and the public’s understanding and attitudes concerning CO2 sequestration, including development of a database on sources, sinks, separation and transportation options, regulatory permitting requirements, and environmental benefits and risks. Step 2 will identify regional opportunities for sequestration and inform the public about options and risk. Step 3 will develop a detailed action plan for implementing Phase II demonstration projects in the PCOR Partnership region. The PCOR partners will contribute over the life of the project through working groups designated to focus on key topical areas.
Prepr. Pap.-Am. Chem. Soc., Div. Fuel Chem. 2004, 49 (1), 253

A conceptual model has been developed to characterize the sequestration opportunities in the PCOR region and determine the best projects for demonstration and verification in Phase II demonstration projects. As shown in Figure 3, detailed characterization data will be provided to stakeholders, and sequestration opportunities will be evaluated on the basis of technical and economic feasibility. The potential sequestration projects will then be ranked on the basis of overall deployment feasibility. It is anticipated that several sequestration opportunities will be selected for Phase II demonstration projects.
Figure 3. PCOR Partnership model.
Prepr. Pap.-Am. Chem. Soc., Div. Fuel Chem. 2004, 49 (1), 254
AMINOPROPYL-FUNCTIONALISED SILICAS AS HIGH CAPACITY CO2 ADSORBENTS
Gregory P Knowles, Jeremy V Graham, Seamus W Delaney and Alan L Chaffee
School of Chemistry, Monash University, Victoria, Australia
Introduction
One approach to reduce greenhouse gas emissions from fossil fuel combustion and so maintain the future viability of coal fired power generation is to capture and then sequester the product CO2. Thus, there is growing interest in the development of improved CO2 capture and separation technologies. The development of high capacity, CO2 selective adsorbents that can be used in pressure swing adsorption (PSA) processes is one way forward.
Adsorbents based on high surface area inorganic supports that incorporate basic organic groups, usually amines, are of particular interest. The interaction between the basic surface and acidic CO2 molecules may result in the formation of surface ammonium carbamates (Figure 1)1-3. Thus, in dry CO2, adsorption capacities are limited to 1 mole CO2 for every 2 moles surface bound amine groups. Therefore it is desirable to develop adsorbents with the highest possible concentration of basic nitrogen groups accessible to CO2.
Figure 1. Surface reaction of tethered amine groups with CO2.
A number of groups have now reported the preparation of 3-aminopropyl-functionalised silicas based on the derivatisation of mesoporous amorphous silica gels3-7 and/or mesoporous periodic framework structures like SBA-152,5, MCM-411,8,9 and MCM-486. Such mesoporous substrates are attractive because they possess pores that are (believed to be) large enough to access with derivatising reagents. Post-functionalization, they (are believed to) still retain sufficient porosity to facilitate rapid gas diffusion to and from the surface as required by the PSA process.
The specific CO2 adsorption capacities reported for any of these materials to date are not outstanding. However, there is insufficient data in the literature to distinguish whether the limitation in CO2 adsorption capacity is due to sub-optimal coverage of the mesopore surface with amine groups, due to poor accessibility of CO2 to the surface amine groups, due to geometric constraints limiting the acid-base interaction at the surface and/or other unknown factors.
This report describes an investigation into the effects of mesopore structure (e.g., pore geometry, pore spacing, pore volume, surface area and surface silanol concentration) on the extent of surface functionalization and consequent CO2 adsorption capacities. A new approach to characterizing the extent of surface modification (per unit of substrate surface area) is described and applied to the prepared materials, providing a better understanding of the modification and adsorption phenomena. Experimental
Silica substrates. Amorphous silica gel 40 (Sigma Aldrich) was treated at 475 °C to give silica substrates S2 with a surface silanol concentration of 2.0 (i.e., 2 hydroxy groups per nm2)10.
Mesoporous periodic structures of the HMS type were prepared via a neutral templating technique using dodecylamine11. For HMS substrate H2, the template was removed by calcination at 475°C. By analogy with the work of van der Voort et al10 this material is also estimated to possess 2 silanol groups per nm2. For HMS substrates
H5a, H5b and H5c, the template was removed via EtOH extraction. Following treatment at 150°C under vacuum, it is estimated that these substrates possess approximately 5 silanol groups per nm2.
Substrates H2 and H5a-c all gave XRD peaks expected for HMS materials and indicated pore center separations of 46, 44, 32 and 38Å, respectively.
Preparation of aminopropyl-functionalised substrates. Approx. 1g of each pre-dried substrate was dispersed in 100 ml dry toluene and treated with variable quantities of aminopropyl-trimethoxysilane (apts), always in molar excess relative to the estimated silanol content of the substrate. Treatment proceeded at room temperature for 2 hours in most cases. The product was collected, washed with several volumes of dry toluene, then dried at 150°C for 24 hours under vacuum to complete the surface modification and also to remove residual solvent and silane.
Characterization of Materials. N2 adsorption/desorption experiments were conducted at –196°C using a Micromeritics ASAP 2010 instrument. Total pore volumes were calculated from the N2 volume adsorbed at P/P0= 0.995. BET surface areas were determined from N2 volume adsorbed over the partial pressure range 0.08 – 0.12. BJH pore diameters were determined from the N2 volume desorbed between P/P0 = 1 and P/P0 = 0.15. Elemental analyses were determined by CMAS Pty Ltd, Belmont, Vic. for C and N. X-Ray diffraction (XRD) data were recorded using a Scintag X-Ray Diffractometer. For HMS materials, the distance between pore centers (s) was calculated from the distance between d100 symmetry planes (d) for the major diffraction peak between 1 and 5 (2θ ) as follows: s=2d*30.5.
Carbon Dioxide Adsorption. CO2 adsorption experiments were conducted on a Setaram Thermogravimetric Analyzer (TGA). Typically, samples were dried at 150 ºC, then cooled to 20ºC under a flow of dry Ar. The gas flow was then switched to a mixture containing 90% CO2 and 10% Ar. Adsorption capacities were determined from the weight increase observed after 10 minutes.
Extent of Surface Modification (tether-loading). The extent of substrate modification by apts treatment was characterized as the number of tethers per nm2 of substrate surface area (‘tether-loading’). The tether-loading was calculated by assuming a cylindrical pore model based on the BJH pore radius (rprod), the N content (Nprod) and the surface area (SAprod) of the product, together with the BJH pore radius (rsub) of the substrate, according to the following equation:
Ntethers
rr
SAtethers
sub
prodmnmgmSA
molgNAtomicWtmolatomsggN
sub prod
prod
##**#
).(10*).().].([).(10*023.6*).(
221812
1
1231
−−
−
−−
=
Results and Discussion Table 1 provides basic preparation and characterization details
for each of the substrate and product materials used in this study. The results show that, in each case, treatment with apts led to
reduction in pore volume, pore diameter and surface area and also led to an increase in both N and C content. The x-ray diffraction patterns for the HMS product materials were only slightly broadened relative to their corresponding substrates, demonstrating that the ordered framework structure was retained throughout modification.
The molar C/N ratios of the modified materials are consistent with the formation of tethers that (on average) are linked to the surface in either a tridentate fashion, or else in a bidentate fashion where the third methoxy group from apts has been hydrolysed (as illustrated in Figure 1) or crosslinked to an adjacent tether. However, given the density of silanol groups at the surface (2 to 5 per nm2), tridentate coordination is considered unlikely.
It is noted that the H5c-p96 material has a higher N content (mass basis) than any other aminopropyl-functionalised silica material reported to date. Nevertheless, the H5c-p96 material has a
Prepr. Pap.-Am. Chem. Soc., Div. Fuel Chem. 2004, 49 (1), 255

lower tether-loading than values reported for similar, but lower surface area substrates4,7. This suggests that it should be possible to prepare materials with still higher N content.
Table 1. Basic Preparation and Characterization Details for Substrate and Product Materials*
Vol apts
added ml.g-1
SA
m2.g-1
Pore Vol
ml.g-1
BJH dia. Å
N mass
%
C mass
%
CO2 adsorb mass%
Typical Std Dev
± 0.1 ± 10 ±0.02 ± 0.4 ± <0.1
± <0.1
± 0.1
S2 567 0.67 36.8 - 0.0 1.57 S2-p2 1.25 419 0.45 36.3 1.6 4.3 2.74 H2 909 1.06 29.6 - 0.5 2.17 H2-p2 4.0 706 0.66 23.2 2.5 6.9 3.50 H5a 762 1.02 30.0 <0.1 3.2 2.18 H5a-p2 4.0 638 0.60 25.2 2.7 7.0 4.02 H5b 1268 - 24.1 <0.1 0.0 n/a H5b-p2 3.0 1194 - 20.3 2.3 8.5 3.14 H5c 1198 - 20.6 - 2.66 H5c-p2 4.0 1176 - 20.4 2.1 6.4 3.80 H5c-p24 4.0 1125 - 19.0 3.2 9.4 6.31 H5c-p96 4.0 1113 - 19.5 3.4 9.3 5.70 H5c-p96r 4.0 1195 - 19.3 3.3 9.3 6.14 * p: product; 2/24/96: 2/24/96h treatment @ RT; 96r: 96h treatment @ reflux
Figure 2 illustrates the tether-loading of the various product materials as a function of the quantity of silane added to the reaction mixture per unit substrate surface area. As illustrated by the trend line, the results show that the higher quantities lead to improved tether-loadings (for 2h treatment of HMS substrates).
It can be noted that products from substrates with both low (2.0) and high (5.0) silanol content fall on this trend line, indicating that, within the range of preparative procedures investigated, higher silanol content does not necessarily lead to higher tether loadings.
The product prepared from amorphous silica, S2-p2, gave a substantially higher tether-loading than for the HMS derived products at low silane concentration. It is thought that the morphology of the amorphous silica, i.e., the greater accessibility of the mesopores and the larger average pore diameter, permits better entry and faster diffusion of reagent molecules.
Figure 2 also indicates that longer treatment times (H5c-p24) lead to improved tether-loadings for the HMS substrates, presumably because additional time helps to overcome diffusion limitations within the mesopores. However, extending the treatment beyond 24 hours (H5c-p96) or to higher temperature (H5c-p96r) does not lead to any further increase in tether-loading. Thus, it appears that for these conditions equilibrium loadings have been achieved.
It is interesting that the apparent equilibrium loadings for the HMS substrates are lower than for Silica 40 at the same apts concentration. The reason is unclear, but one possibility is that the sharper internal curvature of the HMS cylinders makes it more likely that initially adsorbed apts-tethers will block access of subsequent apts groups to the surface.
Table 1 also lists the CO2 adsorption capacity determined for each material on a mass % basis. To our knowledge the capacity reported for H5c-p24 (6.31%) is the highest yet reported for any apts functionalised material4,5,11,12. All products exhibited capacities that correspond to a CO2/N molar ratio of ~0.5, consistent with the postulated carbamate mechanism. Marginally greater CO2/N ratios observed for products with lower tether-loadings are probably due to the occurrence of some additional CO2 adsorption at surface silanol sites.
00.20.40.60.8
11.2
1.41.6
0 2 4 6
v(silane)/ ? L.m -2 )
#tet
hers
.nm
-2
S2-pH2-pH5a-pH5b-pH5c-p
H5c-p24H5c-p96H5c-p96rf
Figure 2. Tether-loading of aminopropyl-functionalised mesoporous
Figure 3 shows the CO2 adsorption capacity of each material as a function of tether-loading. There is a general increase in capacity at higher loadings. However, the most significant observation is that the higher surface area substrates lead to apts modified products with the best CO2 adsorption capacities (on a mass basis).
0
1
2
3
4
5
6
7
0 0.5 1 1.5 2
#tethers.nm-2CO
2 ads
cap
acity
/ m
%
56790976212681198
Figure 3. The CO2 adsorption capacity of materials prepared from the various substrates as denoted by substrates surface area.
Conclusions The characterization of these organic-inorganic hybrid
adsorbents on the basis of substrate surface area has usefully enhanced our understanding of the factors which have, so far, limited the extent of surface functionalization and, consequently, the CO2 adsorption capacities that can be achieved. In the course of this work, we have prepared hybrid adsorbents (of this type) with the highest N loadings and highest CO2 adsorption capacities so far reported and expect to be able to improve upon this further.
Acknowledgements. The authors thank Mr Alex Perisa, who assisted the preparation of S2-p2, and also acknowledge the financial support of the Australian Research Council.
References (1) Delaney, S.W.; Knowles, G.P.; Chaffee, A.L. Am. Chem. Soc., Div. Fuel
Chem., 2002, 47, 65-66. (2) Chang, A.C.C; Chuang, S.S.C; McMahan, G.; Soong, Y. Energy &
Fuels, 2003, 17, 468-473. (3) Leal, O.; Bolivar, C.; Ocalles, C.; Garcia, J.J.; Espidel, Y. Inorganica
Chimica Acta, 1995, 240, 183-189. (4) Walcarius, A.; Etienne, M.; Bessiere, J. Chem Mater, 2002, 14, 2757-
2766. (5) McKittrick, M.W.; Jones, C. Chem. Mater. 2003, 15, 1132-1139. (6) Huang, H.Y.; Yang, R.T.; Chinn, D.; Munson, C.L. Ind. Eng. Chem.
Res., 2003, 42(12), 2427-2433. (7) Vranken, K.C.; Van Der Voort, P.; Possemiers, K.; Vansant, E.F. J. Coll.
& Interf. Sci. 1995, 174, 86-91. (8) Yoshitake, H.; Yokoi, T.; Tatsumi, T. Chem. Mater., 2003, 15, 4536-8 (9) Lin, X.; Chuah, G.K.; Jaenicke, S. J. Molec. Catal. A: Chem. 1999, 150,
287-294. (10) Van der Voort, P.; Gillis-D’Hamers, J.; Vranken, H.C.; Vansant, E.G.
J.Chem.Soc, Faraday Trans 1991, 87 (24), 3899-3905. (11) Tanev,P.T.; and Pinnavaia,T.J. Science 1995, 267, 865-867.
Prepr. Pap.-Am. Chem. Soc., Div. Fuel Chem. 2004, 49 (1), 256

Improved Immobilized Carbon Dioxide Capture Sorbents
M. L. Gray1*, Y. Soong1, K. J. Champagne1, H. Pennline1, J.
Baltrus1,R.W. Stevens, Jr.2, R. Khatri2, S. S. C. Chuang2, and T. Filburn3
1US Department of Energy, National Energy Technology Laboratory,
P.O. Box 10940, Pittsburgh, PA, 15236. [email protected](412) 386-4826, Fax (412) 386-4808.
2Chemical Engineering Department, University of Akron, Akron, OH, 44325-3906.
3College of Engineering, University of Hartford, CT, 06117
Introduction The rise of greenhouse gases (i.e. CO2, CO, SO2 and NOx) [1] in our atmosphere is promoted by the combustion of fossil fuels for the generation of electricity. Carbon dioxide is considered to be the one of the major greenhouse gases that is directly influencing the global climate changes that are occurring within the earth’s ozone layer. It is estimate that 36% of the United State’s anthropogenic CO2 [2] is produced from coal-fired power plant. Consequently, the capture of CO2 from flue-gas streams is an essential step for the carbon management for sequestrating CO2 from our environment. The capture and separation of CO2 can be achieved by using solvents, cryogenic techniques, membranes, and solid sorbents. The large-scale operation of these technologies is energy intensive when applied to capturing CO2 in a dilute stream, such as flue gas, which consist of 15 volume % CO2 for most coal combustion systems. Amine-based [3-4] wet scrubbing systems have been proposed as capture techniques for CO2 removal from flue gas streams, but are energy intensive due to the large amount of water needed in these systems. Excessive water is required because of the mechanism, corrosiveness and air flow problems created by the use of monoethanolamine (MEA), diethanolamine (DEA), or methyldiethanolamine (MDEA) in these aqueous-based, CO2-capture systems. The proposed reaction sequences [5] in aqueous system using primary, secondary, and tertiary alkanolamines reacting with dissolve CO2 are shown below.
Figure 1. Proposed reaction sequence for the capture of carbon dioxide by liquid amine- based systems. According to Figure 1, the majority of the CO2 captured will result in the formation of bicarbonate in these liquid amine capture systems. In aqueous media, there is a requirement of 2 moles of amine/ mole of CO2 for the formation of stable bicarbonate compounds resulting in the capture of CO2. Solid-amine CO2 sorbents may have similar reactions with gaseous CO2, water vapor, and the amine site on its surface. As a result, immobilized amine sorbents (IAS) are being used in aircraft,
submarine, and spacecraft technologies [6-9]. However, the cost of these sorbents is too expensive for large-scale applications in the utility industry. Thus, SBA-15, a novel amine-based sorbent and a reformulated immobilized amine sorbent (R-IAS), are currently being examined as a cost efficient sorbent for the capture of CO2 from gas streams containing moisture. Consequently, a comparison performance study of the SBA-15, R-IAS and the IAS sorbents will be discussed within this paper. Experimental Preparation of the R-IAS. The reformulated immobilized amine sorbent (R-IAS) was prepared by the method described in the literature [8-9]. The exact composition of the secondary amine used in this sorbent will not be discussed due to pending patent applications. Preparation of SBA-15. SBA-15 was prepared by using TEOS (tetraethylorthosilicate) as a silica precursor, Pluronic P123 (PEO20PPO70PEO20, poly(ethylene glycol)-block-poly(propylene glycol)-block-poly(ethylene glycol) as a template, TMB (1,2,3-trimethyl benzene) as an expander, and HCl to control pH. [10-11] The specific steps for preparation of SBA-15 consist of :(1) dissolving 4.0 g of Pluronic P123 in 30 g of water and 120 ml (2.0 M) of HCl solution at room temperature, (2) mixing the resultant solution with 30 g TMB at 35 oC for 2 hours, (3) adding 8.5 g TEOS into the resultant homogeneous solution and stirring it at 35 oC for 22 hours, (4) aging the solution without stirring at 120 oC for 24 hours, and (5) calcining the resultant solid particles from filtering the aging solution in flowing air at –270 oC /min to 500 oC and holding it 500 oC hour for 6 hours. [10-12] The surface area of the SBA-15 was determined by N2 BET measurement at 77 K. Preparation and Characterization of the Sorbent. SBA-15 grafted with γ -aminopropyltriethoxysilane (APTS) was prepared by impregnating an APTS/toluene solution into SBA-15. [13] The impregnated sample was heated at 423 K for 20 h in a vacuum oven to obtain APTS-SBA-15. ATPTS-SBA-15 denotes the SBA-15 grafted with APTS. X-ray photoelectron spectra (XPS) of SBA-15 and APTS-SBA-15 were determined by a PHI5600ci instrument with monochromatic Al Kα X-rays.
2RNH2 + CO2
RNHCO CO2 Capture Capacity. The chemical CO2 capture capacities were determined by the combination of Temperature Programmed Desorption (TPD) and Mass Spectroscopy (MS) analyses. The adsorption of CO2 was achieved in the presence of moisture at 25 oC and the total desorption of CO2 was achieved over the temperature range of 30 – 60 oC. The composition of the experimental gas stream used in these test runs was 10% CO2/H2O/He. The detailed operating conditions for this procedure were previously described in the literature. [14-15] XPS Analysis. The amount of nitrogen (N1s Peak) on the surface of the amine-enriched sorbent was determined by XPS analysis. The XPS analysis were conducted at 1 X 10⁻⁸ torr with the surface analysis depth range from 30 -50 angstroms. Under these conditions the chemically and the strongly adsorbed amines can be determined for each of the CO2 capture sorbents. The details of this experimental procedure have been reported in the literature. [16]
2Carbamate
3Bicarbonate
- RNH3 +
RNH3 + HCO - + RNH2
2RNH3 + CO3 2-
CarbonatepH
H2O
low temp
heat
Prepr. Pap.-Am. Chem. Soc., Div. Fuel Chem. 2004, 49 (1), 257

Results an Discussion Preliminary results of these types of sorbents have been reported early in the literature. [17] Initially, the performance of the prepared amine-enriched silicon sorbent (SBA-15) and the reformulated immobilized amine sorbent (R-IAS) were compared to an existing industrial solid amine sorbent (IAS). Each sorbent was placed in a 10% CO2/H2O/He stream and TPD and MS analyses were conducted to determine the performance of these CO2 capture sorbents. The adsorption/desorption of CO2 for these sorbents were determined over the temperature range of 25 – 60 oC. According to the TPD/MS analysis, all of the sorbents were successful in the capture of CO2 from the moist experimental gas streams. The comparison of the CO2 capture performances and XPS results for these sorbents are summarized in Table 1.
Table 1: TPD CO2 Desorption and XPS Data of the Amine- Enriched Sorbents
Sorbents µmol/g CO2
captured XPS % Nitrogen
(N1s peak) SBA-15-fresh 2011.4 7.1 SBA-15-1st Regeneration
1908.5 NA
SBA-15-2nd Regeneration
1748.3 NA
IAS-fresh 1603.9 17.7 IAS- 1st Regeneration 1922.6 NA IAS-2nd Regeneration 1528.1 NA R-IAS-fresh 4188.1 21.9 R-IAS-1st Regeneration
2690.2 NA
R-IAS-2nd Regeneration
2169.4 NA
As shown in Table 1, the SBA-15 had a lower % nitrogen value of 7.1 verses the IAS % nitrogen value of 17.7. The SBA-15 sorbent was prepared with a primary amine (propyl amine type) while the exact type of the amine used in the IAS was unknown. Despite the differences in the nitrogen values, the sorbents had similar average CO2 capture capacities. The SBA-15 and the IAS sorbents were regenerated at 60 oC over two additional test runs and the average CO2 capture capacity values were 1889.4 µmol/g and 1820.8 µmol/g, respectively. However, there was a significant improvement in the performance of the R-IAS sorbent over the other sorbents when tested under similar conditions. With the increase in the secondary amine loading in the R-IAS which is indicate by the higher % nitrogen value of 21.9, the average CO2 capacity was increased to 3015.6 µmol/g. It is assumed that the higher CO2 capture capacity of the R-IAS can be attributed to the increase loading of the secondary amine. Furthermore, the use of a secondary amine appears to have superior performance over sorbent prepared with primary amine. Currently, additional research for the preparation of SBA-15 and R-IAS sorbents using different secondary amines are now underway and will be reported on in future publications. Conclusions Preliminary results indicate that the R-IAS has a higher average CO2 capture capacity over the SBA-15 sorbent and IAS which is currently being used environmental CO2 controlled life sorbent. It was determined the higher amine loading and the uses of secondary amines improved the CO2 capture capacity of these types on immobilized amine sorbents.
References (1) Marland G., Pippin A., Energy Systems and Policy, 1990,
14, 319. (2) Stringer, J. C. Opportunity for Carbon Control in the
Electrical Power Industry, In Carbon Management: Implication for R&D in the Chemical Sciences and Technology, National Research Council, 2001, p.60.
(3) Blauwhoff, P. M. M., Versteeg, G. F., Van Swaaij, W. P. M. Chem. Eng. Sci. 1984, 39, p. 207-225.
(4) Tontiwachwuthikul, P., Meisen, A., Lim, C. J., J. Chem. Eng. Data, 1991, 36, p. 130-133.
(5) Hook, R. J., Ind. Eng. Chem. Res., 36, 1997, pp. 1779-1790.
(6) Veawab, A., Tontiwachwuthikul, P., Chakma, A., Ind. Eng. Chem. Res., 1999, 38, p. 3917-3924.
(7) Satyapal, S., Filburn, T., Trela, J., Strange, J., Energy Fuels, 2001, 15, p. 250-255.
(8) Birbara, P. J., Filburn, T. P., Nalette, T. A., US patent 5, 876, 488, 1999.
(9) Birbara, P. J., Nalette, T. A., US Patent 5,492,683, 1996. (10) Stucky, G. D.; Chmelka, B. F.; Zhao, D.; Melosh, N.; Huo,
Q.; Feng, J.; Yang, P.; Pine, D.; Margolese, D.; Lukens, W., Jr.; Fredrickson, G. H.; Schmidt-Winkel, P. PCT Int. Appl. 9937705, 1999.
(11) Morey, M. S.; O'Brien, S.; Schwarz, S.; Stucky, G. D. Chemistry of Materials 2000, 12, 898-911.
(12) Luan, Z.; Maes, E. M.; Heide, P. A. W. v. d.; Zhao, D.; Czernuszewicz, R. S.; Kevan, L. Chemistry of Materials 1999, 11, 3680-3686.
(13) Vrancken, K. C.; Possemiers, K.; Van Der Voort, P.; Vansant, E. F. Colloids Surf., A, 1995, 98, 235-241.
(14) Chuang, S. S. C.; Brundage, M. A.; Balakos, M. W.,Srinivas,G. Appl. Spectrosc., 1995, 98, 235-241.
(15) Soong, Y., Gray, M. L., Siriwardane, R. V., Champagne, K. J.,Stevens, Jr., R. W., Toochinda, P., and Chuang, S. S. C. “Novel Amine Enriched Solid Sorbents for Carbon Dioxide Capture,” Fuel preprint, 2001, 46 (1), pp. 285.
(16) Gray, M. L., Champagne, K. J., Soong, Y., Killmeyer, R. P., Baltrus, J., Maroto-Valer, M. M., Andersen, J. M., Ciocco, M.V., and Zandhuis, P.H., ACS Chapter Book, “ Environmental Challenges and Greenhouse Gas Control for Fossil Fuel Utilization in the 21st Century”, Kluwer Academic / Plenum Publishers, 2002, p. 403.
(17) M. L. Gray, Y. Soong K. J. Champagne, H. Pennline, J. Baltrus, R. W. Stevens, R. Kharti and S. S. C. Chuang “Capture of Carbon Dioxide by Solid Amine Sorbents” accepted 9/4/2003, International Journal of Environmental and Pollution, unpublished.
Prepr. Pap.-Am. Chem. Soc., Div. Fuel Chem. 2004, 49 (1), 258
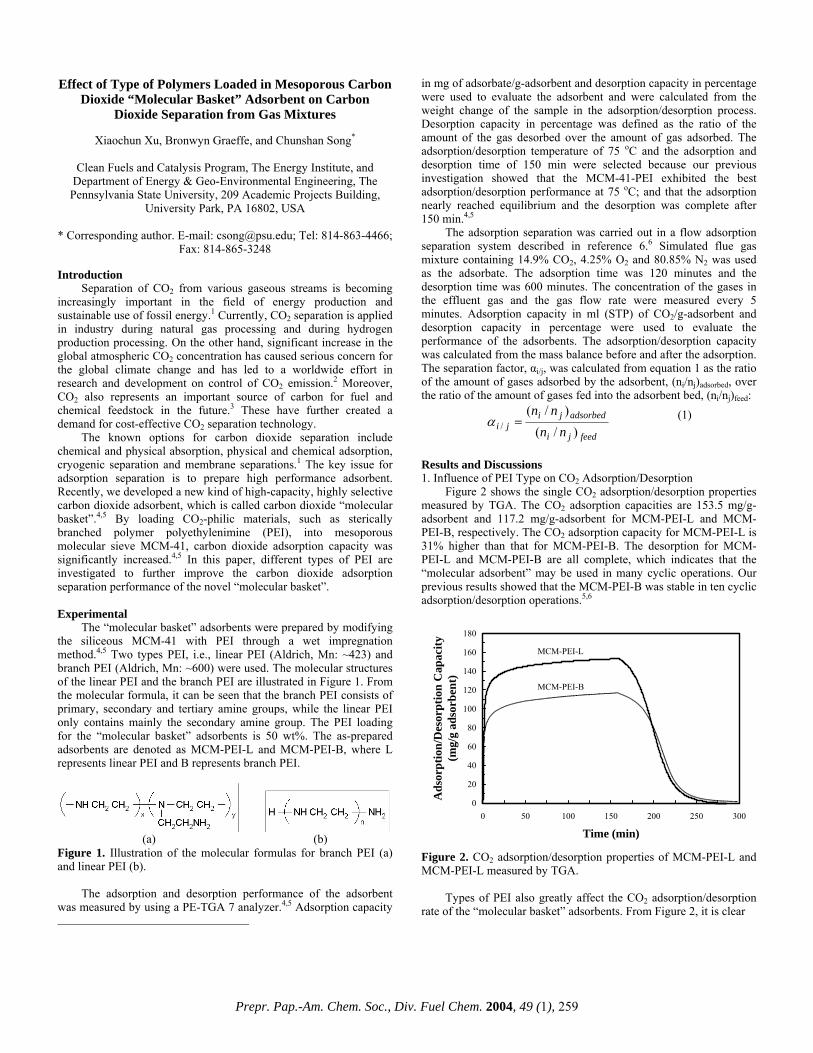
Effect of Type of Polymers Loaded in Mesoporous Carbon Dioxide “Molecular Basket” Adsorbent on Carbon
Dioxide Separation from Gas Mixtures
Xiaochun Xu, Bronwyn Graeffe, and Chunshan Song*
Clean Fuels and Catalysis Program, The Energy Institute, and
Department of Energy & Geo-Environmental Engineering, The Pennsylvania State University, 209 Academic Projects Building,
University Park, PA 16802, USA * Corresponding author. E-mail: [email protected]; Tel: 814-863-4466;
Fax: 814-865-3248 Introduction
Separation of CO2 from various gaseous streams is becoming increasingly important in the field of energy production and sustainable use of fossil energy.1 Currently, CO2 separation is applied in industry during natural gas processing and during hydrogen production processing. On the other hand, significant increase in the global atmospheric CO2 concentration has caused serious concern for the global climate change and has led to a worldwide effort in research and development on control of CO2 emission.2 Moreover, CO2 also represents an important source of carbon for fuel and chemical feedstock in the future.3 These have further created a demand for cost-effective CO2 separation technology.
The known options for carbon dioxide separation include chemical and physical absorption, physical and chemical adsorption, cryogenic separation and membrane separations.1 The key issue for adsorption separation is to prepare high performance adsorbent. Recently, we developed a new kind of high-capacity, highly selective carbon dioxide adsorbent, which is called carbon dioxide “molecular basket”.4,5 By loading CO2-philic materials, such as sterically branched polymer polyethylenimine (PEI), into mesoporous molecular sieve MCM-41, carbon dioxide adsorption capacity was significantly increased.4,5 In this paper, different types of PEI are investigated to further improve the carbon dioxide adsorption separation performance of the novel “molecular basket”. Experimental
The “molecular basket” adsorbents were prepared by modifying the siliceous MCM-41 with PEI through a wet impregnation method.4,5 Two types PEI, i.e., linear PEI (Aldrich, Mn: ~423) and branch PEI (Aldrich, Mn: ~600) were used. The molecular structures of the linear PEI and the branch PEI are illustrated in Figure 1. From the molecular formula, it can be seen that the branch PEI consists of primary, secondary and tertiary amine groups, while the linear PEI only contains mainly the secondary amine group. The PEI loading for the “molecular basket” adsorbents is 50 wt%. The as-prepared adsorbents are denoted as MCM-PEI-L and MCM-PEI-B, where L represents linear PEI and B represents branch PEI.
(a) (b)
Illustration of the molecular formulas for branch PEI (a)
adsorbent was measured by using a PE-TGA 7 analyzer.4,5 Adsorption capacity
Figure 1. and linear PEI (b).
The adsorption and desorption performance of the
ate the adsorbent and were calculated from the weight change of the sample in the adsorption/desorption process. Deso
me was 600 minutes. The concentration of the gases in the
in mg of adsorbate/g-adsorbent and desorption capacity in percentage were used to evalu
rption capacity in percentage was defined as the ratio of the amount of the gas desorbed over the amount of gas adsorbed. The adsorption/desorption temperature of 75 oC and the adsorption and desorption time of 150 min were selected because our previous investigation showed that the MCM-41-PEI exhibited the best adsorption/desorption performance at 75 oC; and that the adsorption nearly reached equilibrium and the desorption was complete after 150 min.4,5
The adsorption separation was carried out in a flow adsorption separation system described in reference 6.6 Simulated flue gas mixture containing 14.9% CO2, 4.25% O2 and 80.85% N2 was used as the adsorbate. The adsorption time was 120 minutes and the desorption ti
effluent gas and the gas flow rate were measured every 5 minutes. Adsorption capacity in ml (STP) of CO2/g-adsorbent and desorption capacity in percentage were used to evaluate the performance of the adsorbents. The adsorption/desorption capacity was calculated from the mass balance before and after the adsorption. The separation factor, αi/j, was calculated from equation 1 as the ratio of the amount of gases adsorbed by the adsorbent, (ni/nj)adsorbed, over the ratio of the amount of gases fed into the adsorbent bed, (ni/nj)feed:
feedji
adsorbedjiji nn
nn)/(
)/(/ =α (1)
Results and Discussions 1. Influence of PEI Type on CO2 Adso sorp
Figure 2 shows the single CO2 adsorption/desorption properties measured by TGA. The CO2 adsorption capacities are 153.5 mg/g-
sorbent and 117.2 mg/g-adsorbent for MCM-PEI-L and MCM-O adsorption capacity for MCM-PEI-L is
for MCM-PEI-
rption/De tion
adPEI-B, respectively. The C 231% higher than that for MCM-PEI-B. The desorption
L and MCM-PEI-B are all complete, which indicates that the “molecular adsorbent” may be used in many cyclic operations. Our previous results showed that the MCM-PEI-B was stable in ten cyclic adsorption/desorption operations.5,6
0
20
40
60
80
100
120
140
160
180
ion
Cap
acity
MCM-PEI-L
0 50 100 150 200 250 300
Time (min)
Ads
orpt
ion/
Des
orpt
(mg/
g ad
sorb
ent)
MCM-PEI-B
Figure 2. CO2 adsorption/desorption properties of MCM-PEI-L and MCM-PEI-L measured by TGA.
Types of PEI also greatly affect the CO2 adsorption/desorption
rate of the “molecular basket” adsorbents. From Figure 2, it is clear
Prepr. Pap.-Am. Chem. Soc., Div. Fuel Chem. 2004, 49 (1), 259

that CO desorption rate for MCM-PEI-L is faster than that for MCM
adsorption, is not clear from Figure 2. In order to clarify the CO2 adsorption kinetics, CO2 adsorption in the first 5 minutes is plotted and shown in Figure 3. Obviously, the rate of CO2 adsorption for MCM-PEI-L is much faster than that for MCM-PEI-B. Since different types of amines groups have different heats of adsorption, the difference in the CO2 adsorption/desorption capacity and in the adsorption/desorption rate of the “molecular basket” adsorbents may be explained by the different types of amine groups in the PEI. The fast adsorption and desorption kinetic is important for the adsorption separation.
2-PEI-B. However, the difference in CO2 adsorption rate for
MCM-PEI-L and MCM-PEI-B, especially at the beginning of the
0
20
40
60
80
100
120
140
0 1 2 3 4 5
Time (min)
Ads
orpt
ion/
Des
orpt
ion
Cap
acity
(m
g/g
adso
rben
t)
MCM-PEI-L
MCM-PEI-B
0
2
4
6
8
10
12
14
16
0 20 40 60 80 100 12
Time (min)
CO
2 C
once
ntra
tion
(%)
0
MCM-PEI-LMCM-PEI-B
Figure 4. Comparison of CO2 breakthrough curves in the separation of CO2 from simulated flue gas for MCM-PEI-L and MCM-PEI-B. Operating condition: Weight of adsorbent: 2.0 g; Feed flow rate: 10 ml/min; Temperature: 75 oC.
0
10
20
30
40
50
60
70
80
90
100
0 60 120 180 240 300 360
Time (min)
Des
orpt
ion
Perc
enta
ge (%
)
0
1
2
3
4
5
6
7
Des
orpt
ion
Rat
e (m
l/min
)
MCM-PEI-BMCM-PEI-LMCM-PEI-BMCM-PEI-L
Figure 5. Comparison of CO2 desorption in the separation of CO2 from simulated flue gas for MCM-PEI-L and MCM-PEI-B. (◊, □) desorption percentage, (■, ▲) desorption rate. Operation condition: Weight of adsorbent: 2.0 g; Temperature: 75 oC; Sweep gas flow rate: 50 ml/min. References (1) Office of Science and Office of Fossil Energy, U.S.D.O.E. Carbon sequeatration. State of the Science. Washingtn, DC, 1999. (2) Azar, C.; Rodhe, H. Science 1997, 276, 1818. (3) Song, C.; Gaffney, A. M.; Fujimoto, K. CO2 Conversion and Utilization., 2002; Vol. 809. (4) Xu, X. C.; Song, C. S.; Andresen, J. M.; Miller, B. G.; Scaroni, A. W. Microporous and Mesoporous Materials 2003, 62, 29–45. (5) Xu, X. C.; Song, C. S.; Andresen, J. M.; Miller, B. G.; Scaroni, A. W. Energy & Fuels 2002, 16, 1463. (6) Xu, X. C.; Song, C. S.; Andresen, J. M.; Miller, B. G.; Scaroni, A. W. International Journal of Environmental Technology and Management 2003, in press.
Figure 3. Comparison of the CO2 adsorption kinetics of MCM-PEI-L and MCM-PEI-B measured by TGA. 2. Effect of PEI Type on CO2 Separation from Simulated Flue Gas
Figure 4 compares the breakthrough curve of CO2 in the separation of CO2 from simulated flue gas, which contains 14.9% CO2, 4.25% O2 and 80.85% N2, for MCM-PEI-L and MCM-PEI-B. At the beginning of the separation, CO2 is completely adsorbed by the “molecular basket” adsorbents and the CO2 concentration is below the detection limit of the gas chromatography, i.e. < 100 ppm. After 55 minutes of adsorption, CO2 began to breakthrough for MCM-PEI-B, while CO2 is still completely adsorbed for MCM-PEI-L. The breakthrough time for MCM-PEI-L is 90 minutes. The calculated CO2 breakthrough capacities are 67.1 ml/g-adsorbent and 40.9 ml/g-adsorbent for MCM-PEI-L and MCM-PEI-B, respectively. The CO2 breakthrough capacity for MCM-PEI-L is 64% higher than that for MCM-PEI-B. Both adsorbents hardly adsorb any N2 and O2. The estimated separation factors for CO2/N2 and CO2/O2 are larger than 1000.
Figure 5 compares the desorption performance of MCM-PEI-L and MCM-PEI-B. For both adsorbents, the adsorbed CO2 can all be desorbed in 6 hours. However, the rate for CO2 desorption for the two adsorbent is different. The MCM-PEI-L desorbs CO2 faster than the MCM-PEI-B, which is in accordance with that observed in the TGA measurements. Conclusions
Highly effective CO2 “molecular basket” adsorbent can be prepared by using mesoporous molecular sieve MCM-41 and polyethylene imine with a linear structure. The adsorbent with linear PEI shows not only a higher CO2 adsorption capacity, but also a faster CO2 adsorption/desorption rate, than those for the “molecular basket” adsorbent with branched PEI.
Prepr. Pap.-Am. Chem. Soc., Div. Fuel Chem. 2004, 49 (1), 260
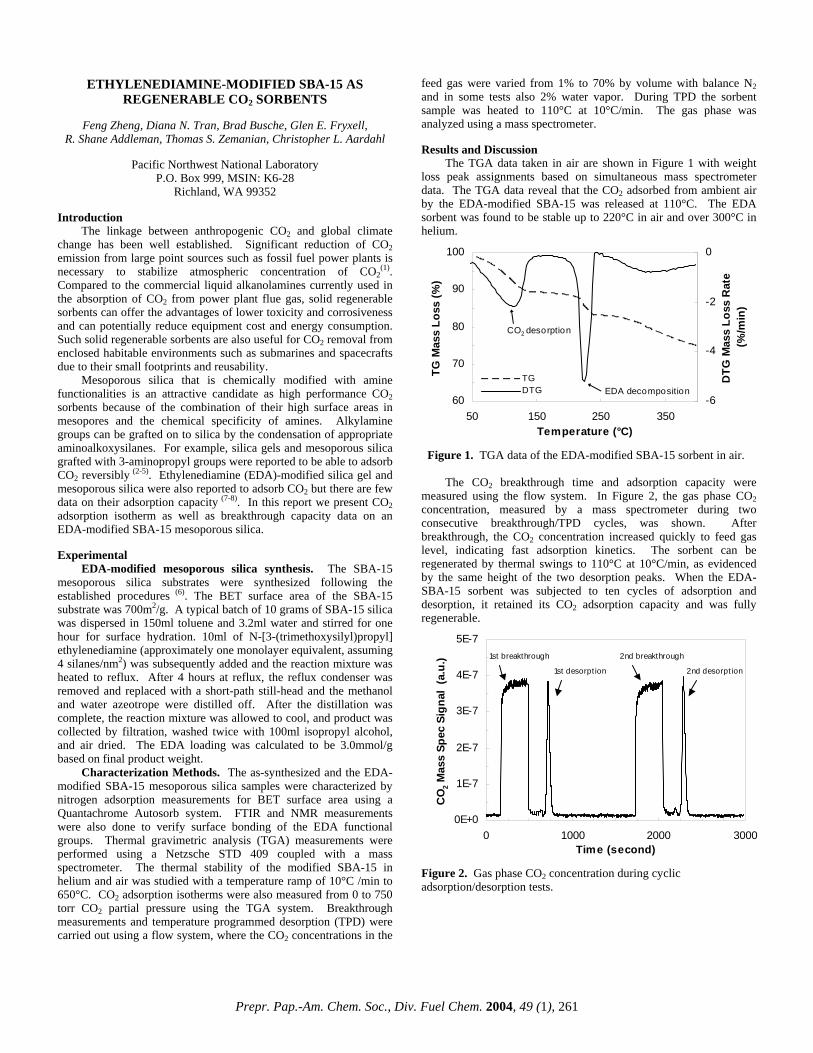
ETHYLENEDIAMINE-MODIFIED SBA-15 AS REGENERABLE CO2 SORBENTS
Feng Zheng, Diana N. Tran, Brad Busche, Glen E. Fryxell,
R. Shane Addleman, Thomas S. Zemanian, Christopher L. Aardahl
Pacific Northwest National Laboratory P.O. Box 999, MSIN: K6-28
Richland, WA 99352 Introduction
The linkage between anthropogenic CO2 and global climate change has been well established. Significant reduction of CO2 emission from large point sources such as fossil fuel power plants is necessary to stabilize atmospheric concentration of CO2
(1). Compared to the commercial liquid alkanolamines currently used in the absorption of CO2 from power plant flue gas, solid regenerable sorbents can offer the advantages of lower toxicity and corrosiveness and can potentially reduce equipment cost and energy consumption. Such solid regenerable sorbents are also useful for CO2 removal from enclosed habitable environments such as submarines and spacecrafts due to their small footprints and reusability.
Mesoporous silica that is chemically modified with amine functionalities is an attractive candidate as high performance CO2 sorbents because of the combination of their high surface areas in mesopores and the chemical specificity of amines. Alkylamine groups can be grafted on to silica by the condensation of appropriate aminoalkoxysilanes. For example, silica gels and mesoporous silica grafted with 3-aminopropyl groups were reported to be able to adsorb CO2 reversibly (2-5). Ethylenediamine (EDA)-modified silica gel and mesoporous silica were also reported to adsorb CO2 but there are few data on their adsorption capacity (7-8). In this report we present CO2 adsorption isotherm as well as breakthrough capacity data on an EDA-modified SBA-15 mesoporous silica. Experimental
EDA-modified mesoporous silica synthesis. The SBA-15 mesoporous silica substrates were synthesized following the established procedures (6). The BET surface area of the SBA-15 substrate was 700m2/g. A typical batch of 10 grams of SBA-15 silica was dispersed in 150ml toluene and 3.2ml water and stirred for one hour for surface hydration. 10ml of N-[3-(trimethoxysilyl)propyl] ethylenediamine (approximately one monolayer equivalent, assuming 4 silanes/nm2) was subsequently added and the reaction mixture was heated to reflux. After 4 hours at reflux, the reflux condenser was removed and replaced with a short-path still-head and the methanol and water azeotrope were distilled off. After the distillation was complete, the reaction mixture was allowed to cool, and product was collected by filtration, washed twice with 100ml isopropyl alcohol, and air dried. The EDA loading was calculated to be 3.0mmol/g based on final product weight.
Characterization Methods. The as-synthesized and the EDA-modified SBA-15 mesoporous silica samples were characterized by nitrogen adsorption measurements for BET surface area using a Quantachrome Autosorb system. FTIR and NMR measurements were also done to verify surface bonding of the EDA functional groups. Thermal gravimetric analysis (TGA) measurements were performed using a Netzsche STD 409 coupled with a mass spectrometer. The thermal stability of the modified SBA-15 in helium and air was studied with a temperature ramp of 10°C /min to 650°C. CO2 adsorption isotherms were also measured from 0 to 750 torr CO2 partial pressure using the TGA system. Breakthrough measurements and temperature programmed desorption (TPD) were carried out using a flow system, where the CO2 concentrations in the
feed gas were varied from 1% to 70% by volume with balance N2 and in some tests also 2% water vapor. During TPD the sorbent sample was heated to 110°C at 10°C/min. The gas phase was analyzed using a mass spectrometer. Results and Discussion
The TGA data taken in air are shown in Figure 1 with weight loss peak assignments based on simultaneous mass spectrometer data. The TGA data reveal that the CO2 adsorbed from ambient air by the EDA-modified SBA-15 was released at 110°C. The EDA sorbent was found to be stable up to 220°C in air and over 300°C in helium.
60
70
80
90
100
50 150 250 350Temperature (°C)
TG M
ass
Loss
(%)
-6
-4
-2
0
DTG
Mas
s Lo
ss R
ate
(%/m
in)
TGDTG
CO2 desorption
EDA decomposition
Figure 1. TGA data of the EDA-modified SBA-15 sorbent in air. The CO2 breakthrough time and adsorption capacity were
measured using the flow system. In Figure 2, the gas phase CO2 concentration, measured by a mass spectrometer during two consecutive breakthrough/TPD cycles, was shown. After breakthrough, the CO2 concentration increased quickly to feed gas level, indicating fast adsorption kinetics. The sorbent can be regenerated by thermal swings to 110°C at 10°C/min, as evidenced by the same height of the two desorption peaks. When the EDA-SBA-15 sorbent was subjected to ten cycles of adsorption and desorption, it retained its CO2 adsorption capacity and was fully regenerable.
0E+0
1E-7
2E-7
3E-7
4E-7
5E-7
0 1000 2000 3000Time (second)
CO
2 Mas
s Sp
ec S
igna
l (a
.u.) 1st breakthrough 2nd breakthrough
1st desorpt ion 2nd desorpt ion
Figure 2. Gas phase CO2 concentration during cyclic adsorption/desorption tests.
Prepr. Pap.-Am. Chem. Soc., Div. Fuel Chem. 2004, 49 (1), 261

The isothermal adsorption capacity data on the EDA-SBA-15 sorbent are summarized in Figure 3. The EDA-SBA-15 silica adsorbs around 20mg/g of CO2 at 25°C and 1 atm with 15% CO2 (by volume) in N2 in the flow system. At the same partial pressure of pure CO2, the sorbent uptakes about 25 mg/g of CO2 at 22°C based on the TGA data. At 1 atm CO2 partial pressure, the adsorption capacity is 86 mg/g, which is lower than the stoichiometric chemisorption capacity of 132mg/g based on the initial estimate of 3.0mmol/g EDA loading, but compares favorably to the capacity of the aminopropyl-modified silica sorbents previously reported (20 to 90 mg/g at 1 atm CO2 partial pressure at room temperature). It is believed that the actual available EDA loading on the EDA-SBA-15 sorbent is lower than 3.0mmol/g and can be increased by improvements in synthesis.
0
20
40
60
80
0 100 200 300 400 500 600CO2 Partial Pressure (torr)
CO
2 Ads
orpt
ion
Cap
acity
(mg/
g) 2% water 25°C (Breakthrough)
0% water 25°C (Breakthrough)
Isotherm 22°C (TGA)
Figure 3. CO2 adsorption isotherms of the EDA-SBA-15 sorbent.
The adsorption isotherm based on the TGA data agrees with the
capacity data from breakthrough tests within experimental error. The presence of 2% water vapor in some of the breakthrough tests did not influence the CO2 uptake. This behavior, although different from those of previously reported aminopropyl-modified silica, is expected as each EDA group contains two amine groups and can adsorb one CO2 molecule. Two aminopropyl groups are necessary to bond one CO2 molecule if no water is present. Carbamate formation on EDA-SBA-15 is of the intramolecular type that does not involve water molecules, and it should proceed faster than on aminopropyl-modified silica sorbents. It is believed that by tailoring the amine groups, CO2 adsorption capacity and kinetics can be further improved.
Conclusions
We have synthesized an EDA-modified SBA-15 mesoporous silica and characterized its CO2 adsorption properties. The CO2 adsorption capacity of the EDA-SBA-15 sorbent is around 20mg/g at 25°C and 1 atm with 15% CO2 (by volume) in N2. This is comparable to the adsorption capacity of aminopropyl-modified mesoporous silica. However, while the adsorption of the latter decreases in the absence of water, the CO2 adsorption capacity of the EDA-modified mesoporous silica is not influenced by humidity. Additionally, the EDA functional group allows CO2 capture via intramolecular carbamate formation and therefore favorable kinetics. By tailoring the amine groups, it is expected that CO2 adsorption capacity and kinetics can be further improved.
Acknowledgement. Pacific Northwest National Laboratory is operated by Battelle for the U.S. Department of Energy under Contract DE-AC06-76RLO 1830.
References (1) White, C. M; Strazisar, B. R.; Granite, E. J.; Hoffman, J. S.; Pennline, H.
W. J. Air Waste Management Association 2003, 53, 645-715. (2) Burwell, R. L.; Leal, O. J.Chem.Soc., Chem.Commun. 1974, 342. (3) Leal, O.; Bolivar, C.; Ovalles, C.; Garcia, J. J.; Espidel, Y. Inorganica
Chimica Acta 1995, 240(1-2), 183-189. (4) Huang, H. Y.; Yang, R. T.; Chinn, D.; Munson, C. L. Industrial &
Engineering Chemistry Research 2003, 42(12), 2427-2433. (5) Chang, A. C. C.; Chuang, S. S. C.; Gray, M.; Soong, Y. Energy & Fuels
2003, 17(2), 468-473. (6) Zhao, D.; Huo, Q.; Feng, J.; Chmelka, B. F.; Stucky; G.D., J. Am. Chem.
Soc. 1998, 120, 6024-6036. (7) Aresta M.; Dibenedetto, A. 6th International Conference on
Greenhouse Gas Control Technologies; Tokyo, 2002. (8) Chaffee, A. L.; Delaney, S. W.; Knowles, G.P. Abstracts of Papers of
the American Chemical Society 223: 076-FUEL Part 1 April 7, 2002.
Prepr. Pap.-Am. Chem. Soc., Div. Fuel Chem. 2004, 49 (1), 262
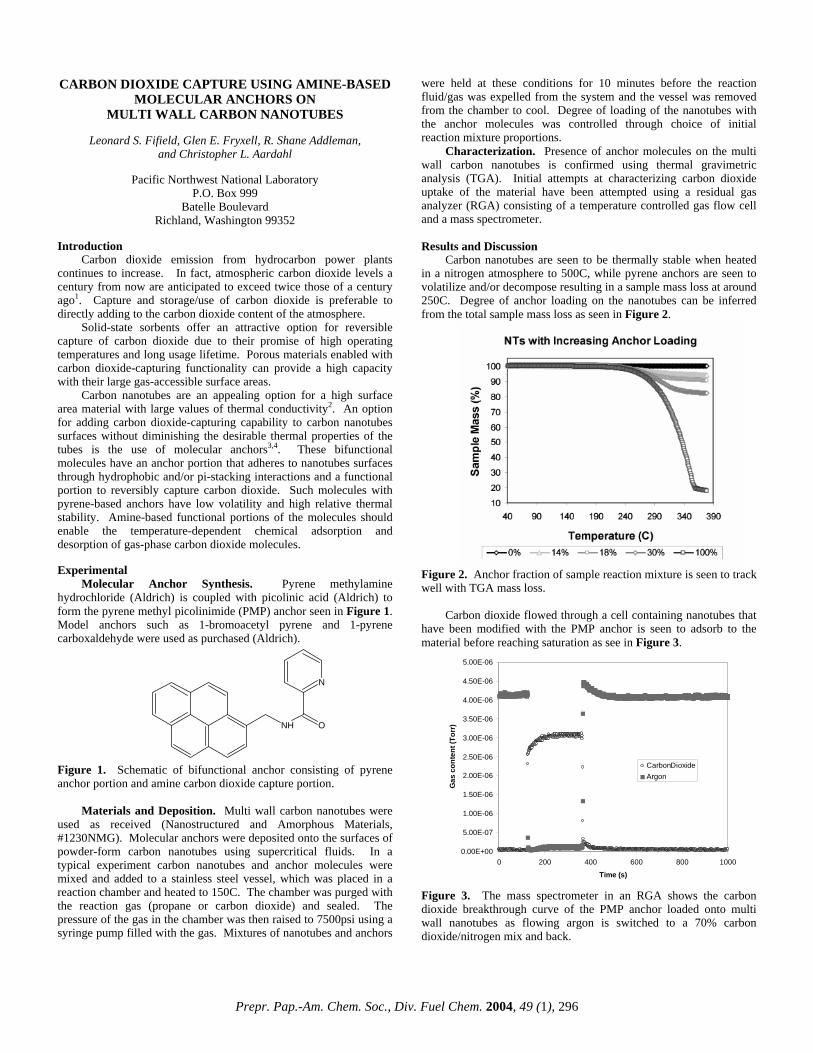
CARBON DIOXIDE CAPTURE USING AMINE-BASED MOLECULAR ANCHORS ON
MULTI WALL CARBON NANOTUBES
Leonard S. Fifield, Glen E. Fryxell, R. Shane Addleman, and Christopher L. Aardahl
Pacific Northwest National Laboratory
P.O. Box 999 Batelle Boulevard
Richland, Washington 99352 Introduction
Carbon dioxide emission from hydrocarbon power plants continues to increase. In fact, atmospheric carbon dioxide levels a century from now are anticipated to exceed twice those of a century ago1. Capture and storage/use of carbon dioxide is preferable to directly adding to the carbon dioxide content of the atmosphere.
Solid-state sorbents offer an attractive option for reversible capture of carbon dioxide due to their promise of high operating temperatures and long usage lifetime. Porous materials enabled with carbon dioxide-capturing functionality can provide a high capacity with their large gas-accessible surface areas.
Carbon nanotubes are an appealing option for a high surface area material with large values of thermal conductivity2. An option for adding carbon dioxide-capturing capability to carbon nanotubes surfaces without diminishing the desirable thermal properties of the tubes is the use of molecular anchors3,4. These bifunctional molecules have an anchor portion that adheres to nanotubes surfaces through hydrophobic and/or pi-stacking interactions and a functional portion to reversibly capture carbon dioxide. Such molecules with pyrene-based anchors have low volatility and high relative thermal stability. Amine-based functional portions of the molecules should enable the temperature-dependent chemical adsorption and desorption of gas-phase carbon dioxide molecules. Experimental
Molecular Anchor Synthesis. Pyrene methylamine hydrochloride (Aldrich) is coupled with picolinic acid (Aldrich) to form the pyrene methyl picolinimide (PMP) anchor seen in Figure 1. Model anchors such as 1-bromoacetyl pyrene and 1-pyrene carboxaldehyde were used as purchased (Aldrich).
NH O
N
Figure 1. Schematic of bifunctional anchor consisting of pyrene anchor portion and amine carbon dioxide capture portion.
Materials and Deposition. Multi wall carbon nanotubes were used as received (Nanostructured and Amorphous Materials, #1230NMG). Molecular anchors were deposited onto the surfaces of powder-form carbon nanotubes using supercritical fluids. In a typical experiment carbon nanotubes and anchor molecules were mixed and added to a stainless steel vessel, which was placed in a reaction chamber and heated to 150C. The chamber was purged with the reaction gas (propane or carbon dioxide) and sealed. The pressure of the gas in the chamber was then raised to 7500psi using a syringe pump filled with the gas. Mixtures of nanotubes and anchors
were held at these conditions for 10 minutes before the reaction fluid/gas was expelled from the system and the vessel was removed from the chamber to cool. Degree of loading of the nanotubes with the anchor molecules was controlled through choice of initial reaction mixture proportions.
Characterization. Presence of anchor molecules on the multi wall carbon nanotubes is confirmed using thermal gravimetric analysis (TGA). Initial attempts at characterizing carbon dioxide uptake of the material have been attempted using a residual gas analyzer (RGA) consisting of a temperature controlled gas flow cell and a mass spectrometer.
Results and Discussion
Carbon nanotubes are seen to be thermally stable when heated in a nitrogen atmosphere to 500C, while pyrene anchors are seen to volatilize and/or decompose resulting in a sample mass loss at around 250C. Degree of anchor loading on the nanotubes can be inferred from the total sample mass loss as seen in Figure 2.
Figure 2. Anchor fraction of sample reaction mixture is seen to track well with TGA mass loss.
Carbon dioxide flowed through a cell containing nanotubes that have been modified with the PMP anchor is seen to adsorb to the material before reaching saturation as see in Figure 3.
0.00E+00
5.00E-07
1.00E-06
1.50E-06
2.00E-06
2.50E-06
3.00E-06
3.50E-06
4.00E-06
4.50E-06
5.00E-06
0 200 400 600 800 1000
Time (s)
Gas
con
tent
(Tor
r)
CarbonDioxideArgon
Figure 3. The mass spectrometer in an RGA shows the carbon dioxide breakthrough curve of the PMP anchor loaded onto multi wall nanotubes as flowing argon is switched to a 70% carbon dioxide/nitrogen mix and back.
Prepr. Pap.-Am. Chem. Soc., Div. Fuel Chem. 2004, 49 (1), 296

Conclusions Carbon nanotubes modified with molecular anchors are pursued
as an attractive option for high capacity carbon dioxide sorbent materials. Model compounds based on pyrene anchors have been shown to modify the surface of multi wall carbon nanotubes and can efficiently be deposited using supercritical fluids. A pyrene-based anchor with amine functionality has been synthesized and initial attempts to characterize its effectiveness in capturing carbon dioxide have been made. Determination of the carbon dioxide isotherm of PMP anchors on multi wall carbon nanotubes, as well as the kinetics and magnitude of carbon dioxide uptake on the material, will enable an evaluation of the potential of this material system relative to other carbon dioxide sorbent systems. Alternative amine forms and alternate anchor moieties may be used to optimized performance of the promising molecular anchor on carbon nanotube approach.
Acknowledgement. Grateful acknowledgement is made to Phillip A. Sullivan and Jennifer Craig of the Larry R. Dalton group at the University of Washington Chemistry Department for help in synthesis of the PMP molecular anchor. LF acknowledges fellowship funding from the University of Washington/ Pacific Northwest National Laboratory Joint Institute of Nanoscience and Nanotechnology. The Pacific Northwest National Laboratory is operated by Batelle for the United States Department of Energy. References (1) Hoffert, M.I.; Calderia, K.; Benford, G.; Criswell, D.R.; Green, C.;
Herzog, H.; Jain, A.K.; Kheshgi, H.S.; Lackner, K.S.; Lewis, J.S.; Lightfoot, H.D.; Manheimer, W.; Mankins, J.C.; Mauel, M.E.; Perkins, L.J.; Schlesinger, M.E.; Volk, T.; Wigley,T.M.L. Science 2002, 298, 981.
(2) Baughman, R.H., Zakhidov, A.A.; de Heer, W.A. Science 2002, 297, 787.
(3) Katz, E. J. Electroanal. Chem. 1994, 365, 157. (4) Chen, R.J.; Zhang, Y., Wang, D.; Dai, H. J. Am. Chem. Soc. 2001, 123,
3838.
Prepr. Pap.-Am. Chem. Soc., Div. Fuel Chem. 2004, 49 (1), 297

CO2 CAPTURE USING ANTHRACITE BASED SORBENTS
Zhong Tang, M. Mercedes Maroto-Valer and Yinzhi Zhang
The Energy Institute and the Department of Energy and Geo-Environmental Engineering, Pennsylvania State University,
209 Academic Projects Bldg., University Park, PA 16802 1. Introduction
Activated carbons are sorbents used in a wide range of household, medical, industrial, military and scientific applications, including gas-phase and liquid-phase processes. The activation process together with the intrinsic nature of the precursors strongly determines the characteristics of the resulting activated carbons. Anthracites have inherent chemical properties, fine structure and relatively low price that make them excellent raw materials for the production of activated carbons 1-5.
New solid-based sorbents are currently being investigated for CO2 capture. Special attention is being paid to the cost of the sorbent, due to the large amount of sorbent required to control CO2 emissions. In this work, it is anticipated that high- surface-area powdered anthracites, which have been amine impregnated will satisfy this need and provide a superior low-cost CO2 sorbent. Accordingly, this paper focuses on the optimization of steam activation of anthracites to produce high surface area activated carbons (AC) and characterize their CO2 capture capacity. 2. Experimental
2.1 sample characterization and activation. One Pennsylvania anthracite (PSOC-1468) was obtained from the Penn State Coal Bank. Table 1 shows the proximate and ultimate analyses results, as provided by the Penn State Coal Bank. The anthracite was screened and the sample with particle size between 150-250µm was used for producing the activated carbon by steam activation. A fluidized bed was used for the activation experiments. The activation temperature was 850oC, and the steam concentration was 65.8% in the feeding gas stream. The porosity of the samples was characterized by conducting N2 adsorption isotherms at 77K using a Quantachrome adsorption apparatus, Autosorb-1 Model ASIT. The total pore volume, Vt was calculated from the amount of vapor adsorbed at relative pressure of 0.95, and the total surface area St was calculated using the multi-point BET equation in the relative pressure range 0.05-0.35. The micropore (<2nm) size distribution and mesopore (2-50nm) size distribution were calculated by the DFT and BJH methods, respectively.
2.2 CO2 adsorption/desorption studies. The adsorption and desorption performance of the produced activated anthracites (ACs) was conducted using a PE-TGA 7 thermogravimetric analyzer. The weight change of the adsorbent was followed to determine the adsorption and the desorption performance of the ACs. In a typical adsorption/desorption study, about 20-25mg of the AC was placed in a small platinum pan, heated to 100oC in N2 atmosphere at a flow rate of 100mL/min, and held at that temperature for 30 minutes. Then the temperature was adjusted to the desired adsorption temperature and 99.8% bone-dry CO2 adsorbate was introduced at a flow rate of 100mL/min. After adsorption, the gas was switched to 99.995% pure N2 at a flow rate of 100mL/min to perform the desorption at the same temperature. Adsorption capacity in mg-adsorbate/g-adsorbent and desorption capacity in percentage were used to evaluate the adsorbent, where these values are calculated from the weight change of the sample in the TGA adsorption/desorption process.
3. Results and Discussion
3.1 Effect of activation time on the porosity of the activated anthracites In this study, the activation temperature was selected at 850oC according to previous studies conducted by the authors5. The typical isotherms of the resultant activated carbon with different activation time are shown in Figure 1. For comparison, the isotherm of the raw sample is also presented in Figure 1.
Figure 1 shows that the activation dramatically increases the surface area and pore volume of the anthracite. All the isotherms of ACs are Type I according to the BDDT (Brunauer, Deming, Deming, Teller) Classification6. This indicates that the ACs made from anthracite have many micropores and only a few mesopores. With increasing activation time, the isotherm shows a
more open keen at lower relative pressure of the isotherm, indicating a broader pore size distribution with larger micropores and increasing mesoporosity.
0
50
100
150
200
250
300
0.0 0.2 0.4 0.6 0.8 1.0
P/P0
Vol
ume
(mL
/g),
STP
2hrs 2.5hrs 3hrs3.5hrs Raw
Figure 1. N2-77K isotherms of the raw anthracite and its steam activated carbons produced at 850oC using different activation times.
Figures 2 and 3 show the micropore and mesopore size distribution of
the activated anthracites, respectively. It can be seen that there are no micropores and few mesopores for the raw anthracite. In contrast, after activation, there is a significant amount of mesopores in the ACs (Figures 2 and 3). For the AC after 2 hours activation time, there is a large peak between 0.4-1.0nm. For the ACs produced after 2.5 and 3.0 hours activation time, the peak between 0.4-1.0nm is still there, and there are some additional peaks at 1.6 and 2.0 nm, and also a peak at 2.4 for the AC sample produced after 3 hours steam activation. Furthermore, for the AC sample produced after 3 hours activation time, the largest peak moves to 1.2nm, and the height of the peaks at 1.6, 2.0 and 2.4nm increases. Due to technical limitations of the instrument, it is not possible to get adsorption data at very low relative pressure, and therefore the pore size distribution < 0.4nm cannot be calculated by the DFT method. However, the results indicate that the pore development during activation includes pore opening followed by pore enlargement.
0.00E+00
5.00E-02
1.00E-01
1.50E-01
2.00E-01
2.50E-01
3.00E-01
3.50E-01
4.00E-01
4.50E-01
5.00E-01
0 1 2 3 4 5 6
Pore width (nm)
dV(w
) (m
L/n
m/g
)
2hrs2.5hrs3hrs3.5hrsRaw
Figure 2. Micropore size distribution of the raw anthracite and its steam activated carbons produced at 850oC using different activation times.
0.00E+00
2.00E-02
4.00E-02
6.00E-02
8.00E-02
1.00E-01
1.20E-01
1 10 100 1000
Pore Diameter (nm)
Dv(
log
r) (m
L/g
, ST
P)
2hrs2.5hrs3.0hrs3.5hrsRaw
Figure 3. Mesopore size distribution of the raw anthracite and its steam activated carbons produced at 850oC using different activation times.
Figure 3 shows that all the ACs with different activation time have the same mesopore distribution profile. This indicates that the ACs have similar mesopore structure and mesopore size.
Prepr. Pap.-Am. Chem. Soc., Div. Fuel Chem. 2004, 49 (1), 298

The surface areas and pore volumes for the activated carbons produced by steam activation of anthracite are presented in Table 2. It can be seen that the surface and pore volume first increase with increasing activation time and get to a maximum value after 3.0 hours activation (928m2/g and 0.442mL/g), and then decrease with increasing activation time (855m2/g and 0.412mL/g for AC with 3.5 hours activation time). However, the ratio of micropore surface area over total surface area and the ratio of micropore volume over total pore volume keep decreasing with increasing activation time. For instance, the ratio of micropore surface area decreases from 98.0% to 95.3%, when increasing the activation time from 2 to 3.5 hours. Similarly, the ratio of micropore volume to total pore volume decreases from 95.6% to 90.3% when increasing the activation time from 2 to 3.5 hours. This indicates that larger pores were produced with increasing activation time.
3.2 CO2 adsorption/desorption of the activated anthracites Table 3 lists the CO2 adsorption and desorption results of the ACs at 30 and 75°C. Because the CO2 adsorption is mainly a physical process, the adsorption capacity decreases with increasing adsorption temperature, and the CO2 capture capacity of the ACs at 30°C is about half to one-third to that of the ACs at 75°C. It can be seen that at 75°C, the AC with 2.0 hours activation time has the highest CO2 capture value (26.32mg-CO2/g-AC), while at 30°C, AC after 3.5 hours activation has the highest CO2 capture value (60.90mg-CO2/g-AC). However, it was expected that the AC with the highest surface area would give the highest CO2 capture value. Table 2 shows that the surface area of AC after 2.0hrs activation is only 540m2/g, which is the smallest among the four ACs studied here. Furthermore, the surface area of AC after 3.5hours activation is also not the highest among the ACs.
If all the total pore volume was effectively used to adsorb CO2, it can be calculated that the theoretical maximum amount of the CO2 adsorbed by the ACs would be 232.7mg/g, 334.2mg/g, 412.4mg/g and 384.2mg/g for the four ACs produced here after 2.0, 2.5, 3.0, and 3.5 hours, respectively. For this calculation it is considered that the liquid density of CO2 is 0.93g/L, and the adsorbed CO2 changes to the liquid phase due to capillary condensation7. However, Table 3 shows that the adsorbed amount of the CO2 is much lower than the theoretical values. This indicates that not all the surface area or the pore volume of the AC contribute to the adsorption of the CO2 and only some pores are used to adsorb CO2. However, it remains unclear whether the preferred pore size is close to the CO2 molecular diameter (0.208nm) or whether it should be larger than the CO2 molecular diameter. Finally, Table 3 shows that for all the samples the desorption is higher than 97%, indicating that these ACs can readily desorb the CO2 and be reused.
4. Conclusions An anthracite sample (PSOC-1468) was selected for this study to make
activated carbon as adsorbents for CO2 capture. A lab scale fluidized bed was used for the activation and the activation temperature used was 850oC. The N2-77K isotherms show that the ACs made from anthracite have highly developed microporosity and a small amount of mesopores. The surface area can get up to 928m2/g with 3 hours activation time. However, extending the activation time beyond 3 hours decreases the surface area. A TGA instrument was used to characterize the CO2 capture capacity at 30 and 75oC. The CO2 capture capacity was 60mg-CO2/g-sorbent for the AC with 3.5 hours activation time at 30oC adsorption temperature. Contrary to expected, the CO2 capture results do not show any clear relationship with the surface area. The desorption capacity of the ACs are very high (>97%), indicating that these samples can be reused for CO2 capture.
Acknowledgements This work is funded by the US Department of Energy (DOE) through a grant of the Consortium for Premium Carbon Products from Coal (CPCPC) at Penn State University.
REFERENCES (1) Gergova, K.; Eser, S. and Schobert, H.H., Preparation and
characterization of activated carbon from anthracite, Energy & Fuels, 1993, 7, 661-668
(2) Mittelmeijer-Hazeleger, M. and Martin-Martinez J., Microporsity development by CO2 activation of an anthracite studied by physical adsorption of gases, mercury porosimetry, and scanning electron microscopy, Carbon, 1992, 30(4), 695-709
(3) Spencer, D. and Wilson J., Porosity studies on activated carbons from anthracite, Fuel, 1976, 55, 291-296
(4) Pis, J.; Parra, J.; Puente, G.; Rubiera, F. and Pajares J., Development of macroporosity in activated carbons by effect of coal preoxidation and burn-off, Fuel, 1998, 77(6), 625-630
(5) Maroto-Valer, M.M and Schobert, H.H., Optimizing the routes for the productionof actvated carbons from anthracites, In: Prospects for Coal science in the 21st Century (Li, B.Q. and Liu, Z.Y. (eds)), pp909, Shanxi Science and Technology Press, Taiyuan, China 1999
(6) Do, Duong D., Adsorption Analysis: Equilibria and Kinetics (Series on Chemical Engineering, Series Editor: Ralph T. Yang), Imperial College Press, London 1998
(7) Cazorla-Amorós, D.; Alcañiz-Monge, J. and Linares-Solano, A., Charaterization of Activated Carbon Fibers by CO2 Adsorption, Langmuir, 1996, 12, 2820-2824
Table 1. Proximate and ultimate analyses of the anthracite sample used (PSOC-1468). Proximate analysis Ultimate analysis
Moisture Ash Volatile Fixed C C H N S O Wt% wt% wt% wt% % % % % % 4.51 6.83 3.65 89.52 96.2 1.40 0.84 0.49 1.55
Table 2. Surface areas and pore volumes of the raw anthracite and its steam activated carbons produced at 850oC using different activation times.
Sample number Activation time, hr
St
m2/g Smi
m2/g Vt
mL/g Vmi
mL/g Average pore diameter,
nm Raw 1
1 2.0 540 529 0.250 0.239 1.85 2 2.5 762 733 0.360 0.330 1.89 3 3.0 928 891 0.442 0.406 1.91 4 3.5 855 814 0.412 0.372 1.93
Table 3. CO2 capture results for the produced ACs at 30 and 75oC.
30oC 75oC AC sample Adsorption
mg-CO2/g-sorbente Desorption
% Adsorption
mg-CO2/g-sorbente Desorption
% Raw 38.21 89 16.05 100
2.0hrs 58.52 97 26.32 97 2.5hrs 58.51 97 24.24 98 3.0hrs 53.14 99 21.55 99 3.5hrs 60.90 99 21.68 99
Prepr. Pap.-Am. Chem. Soc., Div. Fuel Chem. 2004, 49 (1), 299

Influence of Moisture on Carbon Dioxide Separation from Simulated Flue Gas by A Novel “Molecular Basket”
Adsorbent
Xiaochun Xu, Chunshan Song*, Bruce G. Miller and Alan W. Scaroni
Clean Fuels and Catalysis Program, The Energy Institute, and
Department of Energy & Geo-Environmental Engineering, Pennsylvania State University, 209 Academic Projects Building,
University Park, PA 16802, USA * Contact author. E-mail: [email protected]; Fax: 814-865-3248
Introduction
Because of its low energy requirements, cost advantages and ease of applicability over a relatively wide range of temperature and pressure, adsorption separation is receiving increasing attention in the separation of CO2 from various gas mixtures. Preparation of high-capacity, high-selective CO2 adsorbents is a key factor to realize the energy-efficient adsorption separation. Recently, a new kind of high-capacity, highly-selective CO2 adsorbents based on a “molecular basket” concept have been developed in our laboratory.1-3 The adsorption separation of a simulated flue gas mixture, which contains 14.9% CO2, 4.25% O2 and 80.85% N2, showed that a high CO2 adsorption capacity of 91 ml (STP)/g-PEI and high CO2/O2 and CO2/N2 separation selectivity of 180 and >1000, respectively. The CO2 adsorption capacity and CO2/O2, CO2/N2 separation selectivity with the CO2 “molecular basket” are much higher than those of the existing adsorbents, such as zeolites and activated carbons, etc. However, several challenges still need to be overcome toward practical application. One of such challenges is the moisture, which is an important component in the gas mixtures of interest, such as flue gas and the gas from reforming for hydrogen production. On the one hand, moisture may react with the active adsorption species of amine groups in the “molecular basket” adsorbent. Therefore, moisture may compete with CO2 to react with the active adsorption sites. Clarkson et al suggested that CO2/CH4 selectivity was greater for dry coals than for moisture-equilibrated coals.4 On the other hand, the “basket” material of MCM-41 may not be stable under hydrothermal conditions. The preservation of the MCM-41 structure is critically important for the adsorption separation performance of this novel “molecular basket” adsorbent.2 In this paper, the adsorption separation of CO2 from simulated moist flue gas mixture containing CO2, O2, N2 and moisture by using the novel “molecular basket” adsorbent is reported. The effects of moisture on the adsorption separation performance and the stability of the CO2 “molecular adsorbent” are discussed.
Experimental
“Molecular basket” adsorbent was prepared by loading 50 wt% branched polyethylenimine (PEI, Aldrich, Mn=600) into the mesoporous molecular sieve MCM-41 (MCM-41-PEI-50).2 The adsorption separation was carried out in a flow adsorption system.3 Simulated dry flue gas mixture contained 14.9% CO2, 4.25% O2 and 80.85% N2. Simulated moist flue gas mixture was prepared by adding moisture to the simulated dry flue gas mixture. The amount of moisture in the gas mixture was controlled by using a liquid syringe pump.
In a typical adsorption/desorption process, 2.0 g adsorbent was placed in the adsorption column. Before the adsorption separation experiment, the adsorbent was heated up to 100 oC in helium flow overnight to remove any CO2 or moisture adsorbed. The temperature
was then decreased to 75 oC and the simulated dry or moist flue gas mixture was introduced with a flow rate of 10 ml/min. Generally, the adsorption was carried out for 240 minutes. After the adsorption, helium with a flow rate of 50 ml/min was used to perform the desorption at the same temperature. The time for desorption was 300 minutes. The concentration of the gases in the effluent gas mixture was analyzed by on-line GC. Gas flow rate was measured every five minutes. Adsorption capacity in ml (STP) of adsorbate/g adsorbent and desorption capacity in percentage were used to evaluate the adsorbent. The adsorption/desorption capacity was calculated from the mass balance before and after the adsorption. The separation factor, αi/j, was calculated from equation 1 as the ratio of the amount of gases adsorbed by the adsorbent, (ni/nj)adsorbed, over the ratio of the amount of gases fed into the adsorbent bed, (ni/nj)feed:
αi / j =(ni /n j )adsorbed
(ni /n j) feed
(1)
“Molecular basket” adsorbent before and after adsorption separation was characterized by X-ray diffraction (XRD). The XRD patterns were obtained on a Scintag Pad V using Cu Kα radiation. Results and Discussions 1. Adsorption separation of CO2 from simulated moist flue gas
Figure 1 compares the CO2 breakthrough curve, where the amount of CO2 is followed as the fraction of the CO2 concentration in the effluent gas from the adsorption column, C, over that of the CO2 concentration in the feed, C0, during the separation of CO2 from the simulated flue gas mixtures without moisture and with ~ 10% moisture at 75 oC and ambient pressure. In the presence of moisture, the “molecular basket” adsorbent can still effectively adsorb CO2. At the beginning of the separation, CO2 was completely adsorbed by the adsorbent and the CO2 concentration was below the detection limit of the gas chromatography, i.e. < 100 ppm. After 60 minutes of adsorption, CO2 breakthrough was observed in the effluent gas. Compared with the adsorption separation of CO2 from simulated dry flue gas mixture under the same conditions, the breakthrough time increased when a moist gas mixture was used, which indicates that moisture has a promoting effect on the adsorption of CO2 by the “molecular basket” adsorbent. Even after 120 minutes adsorption, the “molecular basket” adsorbent still adsorbed ~ 20% of CO2 from the simulated moist flue gas mixture, whereas only 5% of CO2 adsorbed from the simulated dry flue gas mixture. CO2 adsorption capacity increased from 90.4 ml (STP)/g-PEI for simulated dry flue gas mixture to 129.9 ml (STP)/g-PEI for simulated moist flue gas mixture. The increase in the CO2 adsorption capacity may be explained by the formation of bicarbonate under the moist condition, rather than carbonate under dry condition.
2. Effect of moisture concentrations in the simulated flue gas mixture on the adsorption separation
Figure 2 shows the relationship between the CO2 adsorption capacity and the moisture concentrations in the simulated flue gas mixture. Since the simulated moist flue gas mixture was prepared by adding moisture to the simulated dry flue gas mixture, CO2 concentration in the simulated moist flue gas mixture decreased with the increase of moist concentration. However, although the feed CO2 concentration decreased, CO2 adsorption capacity increased with the increase of moist concentration in the simulated flue gas mixture. At low moisture concentration, CO2 adsorption capacity increased rapidly with the increase of the moisture concentration in the feed. The CO2 adsorption capacity was 90.4 ml (STP)/g-PEI when dry flue gas mixture was used. When 6% moisture was added to dry flue gas mixture, CO2 adsorption capacity increased to 109 ml (STP)/g-PEI, which was ~20% higher than that when dry flue gas mixture was
Prepr. Pap.-Am. Chem. Soc., Div. Fuel Chem. 2004, 49 (1), 300

used. When the feed moisture concentration further increased to ~ 10%, CO2 adsorption capacity increased steadily to 127.4 ml (STP)/g-PEI, which was ~20% higher than that of when the moisture concentration was ~6% and ~40% higher than that of when dry flue gas mixture was used. However, when the moisture concentration increased to 16%, the increase in CO2 adsorption capacity recessed. CO2 adsorption capacity was only ~5% higher than that of when the moisture concentration was ~10%. It is interesting to note that, when the feed concentration of moisture is lower than that of the CO2, CO2 adsorption capacity increases rapidly with the increase of moisture concentration. When the feed concentration of moisture becomes larger than that of the CO2, CO2 adsorption capacity can hardly be further increased by the excess water.
0
0.1
0.2
0.3
0.4
0.5
0.6
0.7
0.8
0.9
1
0 40 80 120 160 200 240
Time (min)
C/C
0
Without moistureWith moisture
Figure 1. Comparison of CO2 breakthrough curves with/without moisture in the simulated flue gas. Temperature: 75 oC; Feed flow rate: 10 ml/min. Dry feed composition: 14.9% CO2, 4.25% O2 and 80.85% N2; Moist feed composition: 13.55% CO2, 3.86% O2, 72.72% N2 and 9.87% H2O.
80
90
100
110
120
130
140
0 2 4 6 8 10 12 14 16
Water content (%)
CO
2 ads
orpt
ion
capa
city
, m
l (ST
P)/g
-PE
I
12
12.5
13
13.5
14
14.5
15
15.5
16
Feed
CO
2 con
cent
ratio
n (%
)
Figure 2. The influence of moisture concentrations in the simulated flue gas mixture on the CO2 adsorption separation. Operation condition: Weight of adsorbent: 2.0 g; Temperature: 75 oC; Feed flow rate: 10 ml/min. 3. Cyclic adsorption/desorption and stability of the adsorbent
For practical application, the adsorbent should not only possess high adsorption capacity and high selectivity, but also show stable performance for hundreds of adsorption/desorption cycles. In our experiment, the cyclical adsorption/desorption was carried out, and the results are shown in Figure 3. During the 10 cycles of separation, CO2 adsorption capacity hardly changed, which indicated that the
desorption was complete and the adsorbent was stable in the cyclic separation process. CO2 adsorption capacity varied between 138 to 145 ml (STP)/g-PEI. Furthermore, the adsorption selectivity did not change either in the 10 cycles of operation. The stable adsorption and desorption performance suggests that the novel “molecular basket” adsorbent is promising for practical applications.
The structure of MCM-41 and MCM-41-PEI before and after adsorption separation was characterized by XRD (not shown). The structure of MCM-41 alone collapsed only after 1 cycle operation under 10% moisture, while the structure of MCM-41 for MCM-41-PEI preserved even after 10 cycles of operation. This indicated that loading of PEI into the channels of MCM-41 protect the structure of MCM-41. It is well known that the MCM-41 is unstable in the presence of moisture even at medium temperature. Since PEI is more hydrophilic than MCM-41, the adsorption of water by PEI is stronger than that of by MCM-41. When PEI is loaded into the channels of MCM-41, water prefers to be adsorbed by PEI. Therefore, the structure of MCM-41 was protected. The preservation of the MCM-41 structure is critically important for the adsorption separation performance of this novel “molecular basket” adsorbent.2
0
20
40
60
80
100
120
140
160
180
200
0 1 2 3 4 5 6 7 8 9 10 11
Cyclic time
CO
2 ads
orpt
ion
capa
city
, m
l (ST
P)/g
-PE
I
Figure 3. Stability of the “molecular basket” adsorbent in the cyclic CO2 adsorption/desorption separations. Temperature: 75 oC; Feed flow rate: 10 ml/min; Moist flue gas composition: 12.97% CO2, 3.75% O2, 70.16% N2 and 13.12% H2O Conclusions
Moisture has a promoting effect on the adsorption separation of CO2 from simulated flue gas mixture by the novel CO2 “molecular basket” based on MCM-41-PEI-50. Maximum promoting effect of moisture appears at moisture concentrations approaching that of CO2 in the flue gas. The cyclic adsorption/desorption separation results show that the novel “molecular basket” adsorbent is stable in the cyclic operations of CO2 adsorption separation from moist flue gas.
Acknowledgement. Funding for the work was provided by the U.S. Department of Defense (via an interagency agreement with the U.S. Department of Energy) and the commonwealth of Pennsylvania under Cooperative Agreement No. DE-FC22-92PC92162.
References (1) Xu, X. C.; Song, C. S.; Andresen, J. M.; Miller, B. G.; Scaroni, A. W. Energy & Fuels 2002, 16, 1463. (2) Xu, X. C.; Song, C. S.; Andresen, J. M.; Miller, B. G.; Scaroni, A. W. Microporous and Mesoporous Materials 2003, 62, 29–45. (3) Xu, X. C.; Song, C. S.; Andresen, J. M.; Miller, B. G.; Scaroni, A. W. International Journal of Environmental Technology and management 2003, in press. (4) Clarkson, C. R.; Bustin, R. M. International Journal of Coal Geology 2000, 42, 241.
Prepr. Pap.-Am. Chem. Soc., Div. Fuel Chem. 2004, 49 (1), 301

MOLECULAR MODELING OF HMS HYBRID MATERIALS FOR CO2 ADSORPTION
Alan L. Chaffee
School of Chemistry, Monash University 3800, Victoria, Australia
Introduction
Hexagonal mesoporous silicas (HMS) and related structures (MCM-41, SBA-15, etc) which have long-range periodicity, yet poorly defined short-range order, possess very high surface areas and well hydroxylated surfaces that are amenable to functionalisation.
The grafting, or tethering, of organic groups onto the surface leads to novel inorganic-organic hybrid materials with a variety of potential applications in gas separation, selective adsorption, sensing devices, microelectronics, non-linear optical devices, etc1.
Surface functionalisation by alkylamino groups is of particular interest, since interactions between the basic surface which is formed and mildly acidic CO2 molecules may provide a means of selectively adsorbing and separating CO2 from combustion (flue) gas streams2.
This molecular modeling study was commenced to aid the synthesis and design of such hybrid materials, by providing insight into the geometric constraints and the molecular mobility limitations that apply: (a) when functionalising reagents are brought into proximity of mesoporous silica surfaces and (b) during adsorbate-adsorbent interactions after surface functionalisation.
Experimental
This molecular dynamics (MD) study made use of the Materials Studio3 suite of programs, in particular the molecular simulation program DISCOVER and the COMPASS forcefield4.
MD runs were carried out using a 1 fs time-step. Equilibration runs (typically 10,000 steps) were carried out prior to production runs of 100,000 steps (total of 100ps). Simulations were carried out at constant volume and temperature (NVT ensemble). Non-bonding Van der Waals and electrostatic interaction energies were calculated using the Ewald summation method5. Typically, every 200th configuration was saved for analytical purposes. The simulation temperature was varied according to the purpose of the run. Results and Discussion
Model preparation. The initial structure for the simulations was generated from a superlattice based on α-quartz using a procedure similar to that described by Kleestorfer et al6. A hexagonal periodic cell (a=49.10Å, b=49.10Å, c=5.402Å, α= 90˚, β= 90˚, γ= 120˚) was created and used as the progenitor for all HMS models.
A series of HMS models, with varying pore diameter, were prepared by removing successive layers of Si and O atoms from the core of the superlattice. Si atoms with incomplete bonding configurations were fully saturated with hydroxy (OH) groups. The OH saturated models contained ~ 9 OH groups per nm2 of internal surface. Model construction was, in each case, followed by geometry optimisation (energy minimization), equilibration and, then, a production MD run (100ps at 373K).
The models can be conveniently presented as pseudo-2D cross-sections due to the shallow thickness of the periodic cell in the c-direction (~5.4Å). Figure 1 illustrates one frame from an MD simulation of a fully hydrated mesopore that is 30Ǻ in diameter.
Dehydration of fully hydrated mesopores. In Figure 1
adjacent OH pairs are connected by green lines. These mark the distance between the O of one OH group and the H of the adjacent OH group. When these atoms are close enough (<2.5Å) an H-bond is formed.
The circles surround OH group pairs that came closest in proximity during the first MD run at 373K. Their close proximity was deduced by plotting the ‘length distribution’ (frequency versus separation distance) for both of the two H-bonding atom pairs that are formed by adjacent OH groups. This plot is shown in Figure 2 for one adjacent pair. The plot shows that the adjacent H and O atoms are frequently close enough to form H-bonds and, hence it is assumed, in sufficient proximity for dehydration to occur.
Dehydration at the 6 circled locations by removal of water, leaving Si-O-Si linkages, reduced the surface silanol number from ~9 to ~7 OH/ nm2.
Iterative replication of the procedure outlined above led to a series of partially dehydrated HMS models with silanol numbers in the range 2.5-7 OH/nm2. For this purpose the molecular dynamic (MD) simulations were carried out at progressively higher temperatures (438, 498, 623 and 723K) chosen to correlate with the documented relationship between surface silanol concentration and pretreatment temperature for silica gel7.
Preparing hybrid surfaces. When trimethoxyaminopropyl-
silane is introduced into the mesopores, modeling results suggest that it spreads out over the surface, forming plenty of H-bonds (the blue dashed lines in Figure 3). It can be speculated that the formation of this ‘surface film’ may limit the number of silane molecules that can coordinate to and, hence, react with the surface OH groups. This may be one reason why tether loadings reported8 for aminoalkylsilanes are not as high as would be expected if all surface silanols were accessible.
Hybrid material models were prepared by attachment of aminopropyl-silyl tethers to the surface, in a bidentate fashion, at silanol sites that provided the greatest (calculated) energy relief. The model illustrated in Figure 4 has 1.6 tethers per nm2 and possesses a number of structural features (pore diameter, surface area, tether concentration) that are common to materials prepared in our laboratory8.
It can also be seen that a number of the tethered aminogroups are still hugging the surface, a feature which is indicative of H-bonding interactions between the nitrogen (small blue circles) and the residual silanol groups.
Interactions with CO2. Figure 4 also illustrates some of the
interactions that may occur between the hybrid surface and gas-phase CO2 when they are brought into proximity of each other. There is a clear tendency for CO2 to form H-bonds - both with the tethered amine groups and with residual surface OH groups. The figure illustrates a situation where one CO2 molecule (highlighted in yellow) becomes confined (on the MD timescale) in a structural pocket that might also be thought of as an ‘energy-well’. It can be seen (Figure 5) that the mean square displacement versus time for this CO2 molecule is substantially less than that for the average of all CO2 molecules.
Conclusions
Visualisation and analysis of simulated molecular behaviour at the gas-solid interface offers fresh perspectives towards understanding the molecular interactions in these systems. This is enabling the development of improved synthetic strategies that will lead to improved CO2 adsorption capacities.
Acknowledgements. The author acknowledges group colleagues for many stimulating discussions that helped frame and refine the questions addressed by molecular simulation. The financial support of the Australia Research Council is gratefully acknowledged.
Prepr. Pap.-Am. Chem. Soc., Div. Fuel Chem. 2004, 49 (1), 302

Figure 1. Cross-section of a fully hydroxylated 30Ǻ diameter HMS mesopore.
00.10.20.30.40.50.60.70.80.9
1
1 1.5 2 2.5 3 3.5 4 4.5 5Distance (Ǻ)
Freq
uenc
y
04a 04b
Figure 2. Length distribution for both H-bonds (a and b) that form across the hydroxy pair labeled 4 (refer Figure 1).
Figure 3. Molecular model illustrating H-bonding (blue-dashed lines) between trimethoxyaminopropylsilanes and a partially dehydrated (5 OH/nm2) mesopore surface.
Figure 4. Molecular model illustrating H-bonding interactions between CO2 molecules and the mesopore surface. The yellow CO2 molecule appears to be confined by strong H-bonding.
050
100150200250300350400450500
0 20 40 60 80 100
Time (ps)
Mea
n sq
uare
dis
plac
emen
t (Å2 ) Ave for all CO2
'Confined' CO2'Free' CO2
Figure 5. Mean square displacement characterizing (a) the average molecular motion of all CO2 molecules and (b) the molecular motion of selected individual CO2 molecules (‘confined’ and ‘free’). Data correspond to the simulation illustrated by Figure 4. References (1) Sayari, A., Studies in Surface Science in Catalysis, 1996, 102, 1-46. (2) Delaney, SW; Knowles, GP and Chaffee, AL, Am Chem Soc, Div Fuel
Chem, Prepr, 2002, 47, 65-66. (3) Materials Studio is a product of Accelrys, Inc., San Diego, CA (4) Sun, H, J. Phys. Chem..B, 1998, 102, 7338-64. (5) Tosi, M. P., Solid State Physics, 1964, 16, 107. (6) Kleestorfer, K.; Vinek, H.; Jentys, A. J. Mol. Cat. A: Chemical, 2001,
166, 53-57 (7) van der Voort, P; Gillis-D’Hamers, I.; Vrancken, K.-C., J Chem Soc Faraday Trans., 1991, 87, 3899-3905 (8) Knowles, G.P.; Graham, J.V.; Delaney, S.W.; Chaffee, AL, Am Chem
Soc, Div Fuel Chem, Prepr, 2004, 49, this issue.
Prepr. Pap.-Am. Chem. Soc., Div. Fuel Chem. 2004, 49 (1), 303
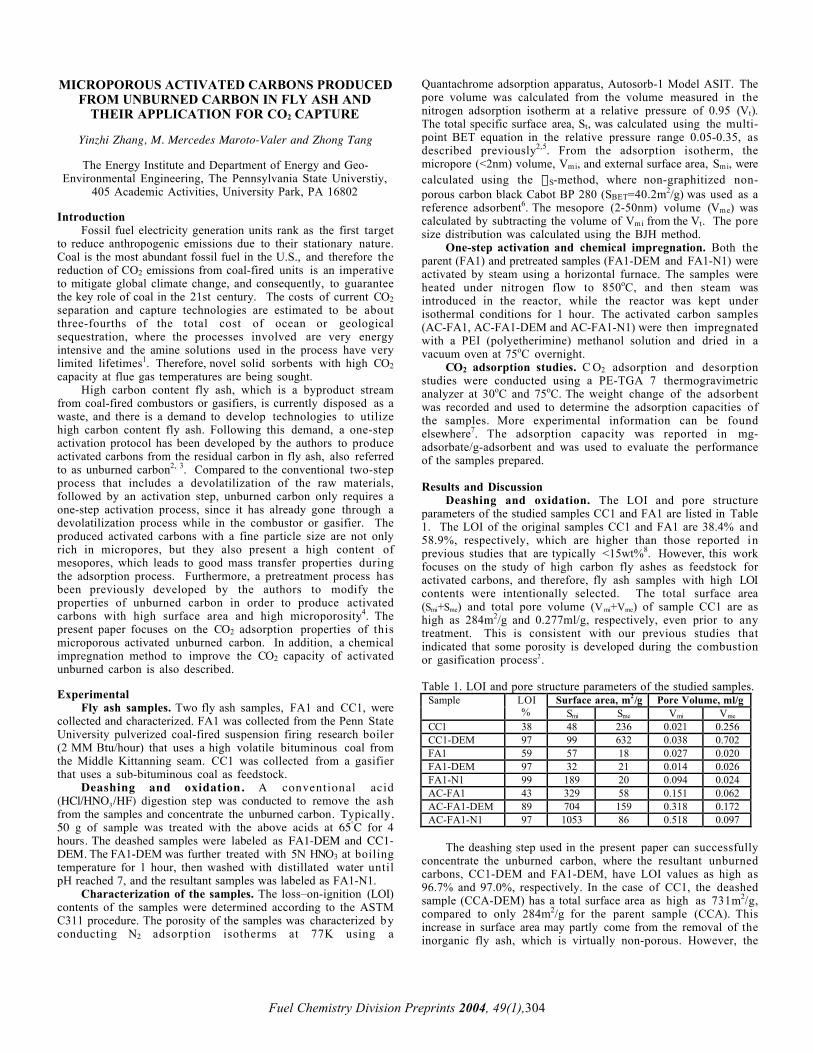
Fuel Chemistry Division Preprints 2004, 49(1),304
MICROPOROUS ACTIVATED CARBONS PRODUCEDFROM UNBURNED CARBON IN FLY ASH AND
THEIR APPLICATION FOR CO2 CAPTURE
Yinzhi Zhang, M. Mercedes Maroto-Valer and Zhong Tang
The Energy Institute and Department of Energy and Geo-Environmental Engineering, The Pennsylvania State Universtiy,
405 Academic Activities, University Park, PA 16802
IntroductionFossil fuel electricity generation units rank as the first target
to reduce anthropogenic emissions due to their stationary nature.Coal is the most abundant fossil fuel in the U.S., and therefore thereduction of CO2 emissions from coal-fired units is an imperativeto mitigate global climate change, and consequently, to guaranteethe key role of coal in the 21st century. The costs of current CO2
separation and capture technologies are estimated to be aboutthree-fourths of the total cost of ocean or geologicalsequestration, where the processes involved are very energyintensive and the amine solutions used in the process have verylimited lifetimes1. Therefore, novel solid sorbents with high CO2
capacity at flue gas temperatures are being sought.High carbon content fly ash, which is a byproduct stream
from coal-fired combustors or gasifiers, is currently disposed as awaste, and there is a demand to develop technologies to utilizehigh carbon content fly ash. Following this demand, a one-stepactivation protocol has been developed by the authors to produceactivated carbons from the residual carbon in fly ash, also referredto as unburned carbon2, 3. Compared to the conventional two-stepprocess that includes a devolatilization of the raw materials,followed by an activation step, unburned carbon only requires aone-step activation process, since it has already gone through adevolatilization process while in the combustor or gasifier. Theproduced activated carbons with a fine particle size are not onlyrich in micropores, but they also present a high content ofmesopores, which leads to good mass transfer properties duringthe adsorption process. Furthermore, a pretreatment process hasbeen previously developed by the authors to modify theproperties of unburned carbon in order to produce activatedcarbons with high surface area and high microporosity4. Thepresent paper focuses on the CO2 adsorption properties of thismicroporous activated unburned carbon. In addition, a chemicalimpregnation method to improve the CO2 capacity of activatedunburned carbon is also described.
ExperimentalFly ash samples. Two fly ash samples, FA1 and CC1, were
collected and characterized. FA1 was collected from the Penn StateUniversity pulverized coal-fired suspension firing research boiler(2 MM Btu/hour) that uses a high volatile bituminous coal fromthe Middle Kittanning seam. CC1 was collected from a gasifierthat uses a sub-bituminous coal as feedstock.
Deashing and oxidation. A conventional acid(HCl/HNO3/HF) digestion step was conducted to remove the ashfrom the samples and concentrate the unburned carbon. Typically,50 g of sample was treated with the above acids at 65°C for 4hours. The deashed samples were labeled as FA1-DEM and CC1-DEM. The FA1-DEM was further treated with 5N HNO3 at boilingtemperature for 1 hour, then washed with distillated water untilpH reached 7, and the resultant samples was labeled as FA1-N1.
Characterization of the samples. The loss–on-ignition (LOI)contents of the samples were determined according to the ASTMC311 procedure. The porosity of the samples was characterized byconducting N2 adsorption isotherms at 77K using a
Quantachrome adsorption apparatus, Autosorb-1 Model ASIT. Thepore volume was calculated from the volume measured in thenitrogen adsorption isotherm at a relative pressure of 0.95 (Vt).The total specific surface area, St, was calculated using the multi-point BET equation in the relative pressure range 0.05-0.35, asdescribed previously2,5. From the adsorption isotherm, themicropore (<2nm) volume, Vmi, and external surface area, Smi, werecalculated using the aS-method, where non-graphitized non-porous carbon black Cabot BP 280 (SBET=40.2m2/g) was used as areference adsorbent6. The mesopore (2-50nm) volume (Vme) wascalculated by subtracting the volume of Vmi from the Vt. The poresize distribution was calculated using the BJH method.
One-step activation and chemical impregnation. Both theparent (FA1) and pretreated samples (FA1-DEM and FA1-N1) wereactivated by steam using a horizontal furnace. The samples wereheated under nitrogen flow to 850oC, and then steam wasintroduced in the reactor, while the reactor was kept underisothermal conditions for 1 hour. The activated carbon samples(AC-FA1, AC-FA1-DEM and AC-FA1-N1) were then impregnatedwith a PEI (polyetherimine) methanol solution and dried in avacuum oven at 75oC overnight.
CO2 adsorption studies. C O2 adsorption and desorptionstudies were conducted using a PE-TGA 7 thermogravimetricanalyzer at 30oC and 75oC. The weight change of the adsorbentwas recorded and used to determine the adsorption capacities ofthe samples. More experimental information can be foundelsewhere7. The adsorption capacity was reported in mg-adsorbate/g-adsorbent and was used to evaluate the performanceof the samples prepared.
Results and DiscussionDeashing and oxidation. The LOI and pore structure
parameters of the studied samples CC1 and FA1 are listed in Table1. The LOI of the original samples CC1 and FA1 are 38.4% and58.9%, respectively, which are higher than those reported inprevious studies that are typically <15wt%8. However, this workfocuses on the study of high carbon fly ashes as feedstock foractivated carbons, and therefore, fly ash samples with high LOIcontents were intentionally selected. The total surface area(Smi+Sme) and total pore volume (V mi+Vme) of sample CC1 are ashigh as 284m2/g and 0.277ml/g, respectively, even prior to anytreatment. This is consistent with our previous studies thatindicated that some porosity is developed during the combustionor gasification process2.
Table 1. LOI and pore structure parameters of the studied samples.Surface area, m2/g Pore Volume, ml/gSample LOI
% Smi Sme Vmi Vme
CC1 38 48 236 0.021 0.256CC1-DEM 97 99 632 0.038 0.702FA1 59 57 18 0.027 0.020FA1-DEM 97 32 21 0.014 0.026FA1-N1 99 189 20 0.094 0.024AC-FA1 43 329 58 0.151 0.062AC-FA1-DEM 89 704 159 0.318 0.172AC-FA1-N1 97 1053 86 0.518 0.097
The deashing step used in the present paper can successfullyconcentrate the unburned carbon, where the resultant unburnedcarbons, CC1-DEM and FA1-DEM, have LOI values as high as96.7% and 97.0%, respectively. In the case of CC1, the deashedsample (CCA-DEM) has a total surface area as high as 731m2/g,compared to only 284m2/g for the parent sample (CCA). Thisincrease in surface area may partly come from the removal of theinorganic fly ash, which is virtually non-porous. However, the
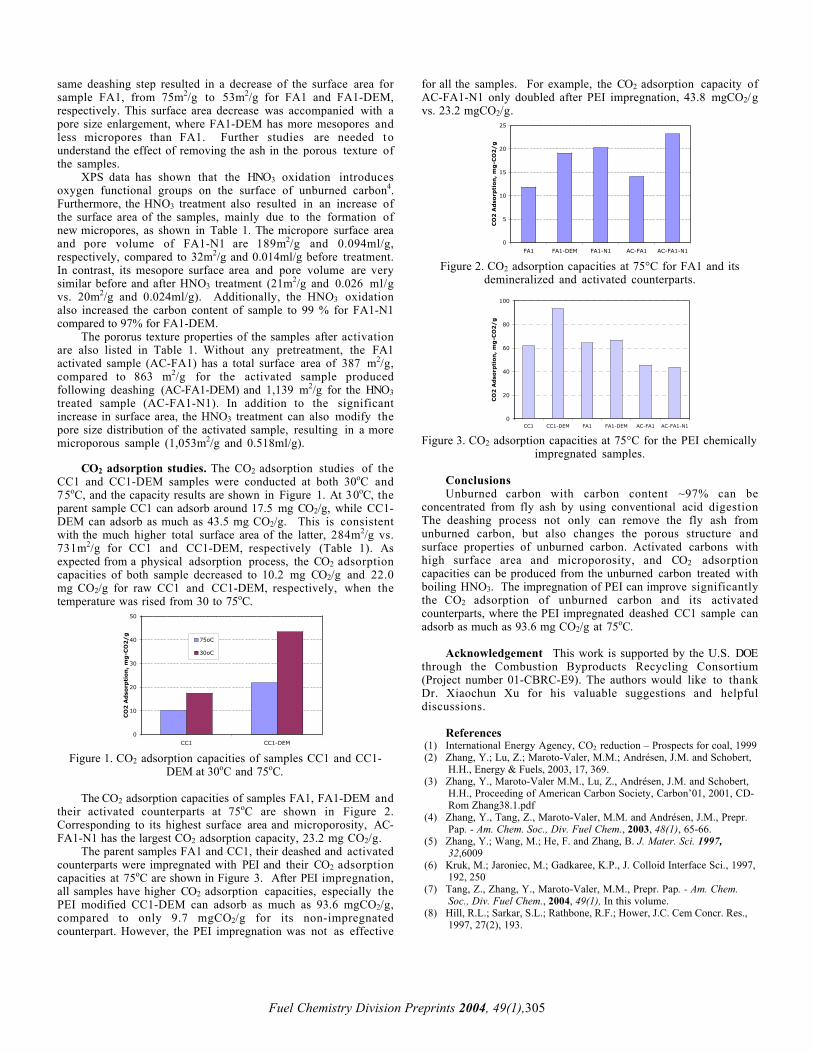
Fuel Chemistry Division Preprints 2004, 49(1),305
same deashing step resulted in a decrease of the surface area forsample FA1, from 75m2/g to 53m2/g for FA1 and FA1-DEM,respectively. This surface area decrease was accompanied with apore size enlargement, where FA1-DEM has more mesopores andless micropores than FA1. Further studies are needed tounderstand the effect of removing the ash in the porous texture ofthe samples.
XPS data has shown that the HNO3 oxidation introducesoxygen functional groups on the surface of unburned carbon4.Furthermore, the HNO3 treatment also resulted in an increase ofthe surface area of the samples, mainly due to the formation ofnew micropores, as shown in Table 1. The micropore surface areaand pore volume of FA1-N1 are 189m2/g and 0.094ml/g,respectively, compared to 32m2/g and 0.014ml/g before treatment.In contrast, its mesopore surface area and pore volume are verysimilar before and after HNO3 treatment (21m2/g and 0.026 ml/gvs. 20m2/g and 0.024ml/g). Additionally, the HNO3 oxidationalso increased the carbon content of sample to 99 % for FA1-N1compared to 97% for FA1-DEM.
The pororus texture properties of the samples after activationare also listed in Table 1. Without any pretreatment, the FA1activated sample (AC-FA1) has a total surface area of 387 m2/g,compared to 863 m2/g for the activated sample producedfollowing deashing (AC-FA1-DEM) and 1,139 m2/g for the HNO3
treated sample (AC-FA1-N1). In addition to the significantincrease in surface area, the HNO3 treatment can also modify thepore size distribution of the activated sample, resulting in a moremicroporous sample (1,053m2/g and 0.518ml/g).
CO2 adsorption studies. The CO2 adsorption studies of theCC1 and CC1-DEM samples were conducted at both 30oC and75oC, and the capacity results are shown in Figure 1. At 30oC, theparent sample CC1 can adsorb around 17.5 mg CO2/g, while CC1-DEM can adsorb as much as 43.5 mg CO2/g. This is consistentwith the much higher total surface area of the latter, 284m2/g vs.731m2/g for CC1 and CC1-DEM, respectively (Table 1). Asexpected from a physical adsorption process, the CO2 adsorptioncapacities of both sample decreased to 10.2 mg CO2/g and 22.0mg CO2/g for raw CC1 and CC1-DEM, respectively, when thetemperature was rised from 30 to 75oC.
0
10
20
30
40
50
CC1 CC1-DEM
CO
2 A
dso
rpti
on
, m
g-C
O2
/g
75oC
30oC
Figure 1. CO2 adsorption capacities of samples CC1 and CC1-DEM at 30oC and 75oC.
The CO2 adsorption capacities of samples FA1, FA1-DEM andtheir activated counterparts at 75oC are shown in Figure 2.Corresponding to its highest surface area and microporosity, AC-FA1-N1 has the largest CO2 adsorption capacity, 23.2 mg CO2/g.
The parent samples FA1 and CC1, their deashed and activatedcounterparts were impregnated with PEI and their CO2 adsorptioncapacities at 75oC are shown in Figure 3. After PEI impregnation,all samples have higher CO2 adsorption capacities, especially thePEI modified CC1-DEM can adsorb as much as 93.6 mgCO2/g,compared to only 9.7 mgCO2/g for its non-impregnatedcounterpart. However, the PEI impregnation was not as effective
for all the samples. For example, the CO2 adsorption capacity ofAC-FA1-N1 only doubled after PEI impregnation, 43.8 mgCO2/gvs. 23.2 mgCO2/g.
0
5
10
15
20
25
FA1 FA1-DEM FA1-N1 AC-FA1 AC-FA1-N1
CO
2 A
dso
rpti
on
, m
g-C
O2
/g
Figure 2. CO2 adsorption capacities at 75°C for FA1 and itsdemineralized and activated counterparts.
0
20
40
60
80
100
CC1 CC1-DEM FA1 FA1-DEM AC-FA1 AC-FA1-N1
CO
2 A
dso
rpti
on
, m
g-C
O2
/g
Figure 3. CO2 adsorption capacities at 75°C for the PEI chemicallyimpregnated samples.
ConclusionsUnburned carbon with carbon content ~97% can be
concentrated from fly ash by using conventional acid digestionThe deashing process not only can remove the fly ash fromunburned carbon, but also changes the porous structure andsurface properties of unburned carbon. Activated carbons withhigh surface area and microporosity, and CO2 adsorptioncapacities can be produced from the unburned carbon treated withboiling HNO3. The impregnation of PEI can improve significantlythe CO2 adsorption of unburned carbon and its activatedcounterparts, where the PEI impregnated deashed CC1 sample canadsorb as much as 93.6 mg CO2/g at 75oC.
Acknowledgement This work is supported by the U.S. DOEthrough the Combustion Byproducts Recycling Consortium(Project number 01-CBRC-E9). The authors would like to thankDr. Xiaochun Xu for his valuable suggestions and helpfuldiscussions.
References(1) International Energy Agency, CO2 reduction – Prospects for coal, 1999(2) Zhang, Y.; Lu, Z.; Maroto-Valer, M.M.; Andrésen, J.M. and Schobert,
H.H., Energy & Fuels, 2003, 17, 369.(3) Zhang, Y., Maroto-Valer M.M., Lu, Z., Andrésen, J.M. and Schobert,
H.H., Proceeding of American Carbon Society, Carbon’01, 2001, CD-Rom Zhang38.1.pdf
(4) Zhang, Y., Tang, Z., Maroto-Valer, M.M. and Andrésen, J.M., Prepr.Pap. - Am. Chem. Soc., Div. Fuel Chem., 2003, 48(1), 65-66.
(5) Zhang, Y.; Wang, M.; He, F. and Zhang, B. J. Mater. Sci. 1997,32,6009
(6) Kruk, M.; Jaroniec, M.; Gadkaree, K.P., J. Colloid Interface Sci., 1997,192, 250
(7) Tang, Z., Zhang, Y., Maroto-Valer, M.M., Prepr. Pap. - Am. Chem.Soc., Div. Fuel Chem., 2004, 49(1), In this volume.
(8) Hill, R.L.; Sarkar, S.L.; Rathbone, R.F.; Hower, J.C. Cem Concr. Res.,1997, 27(2), 193.
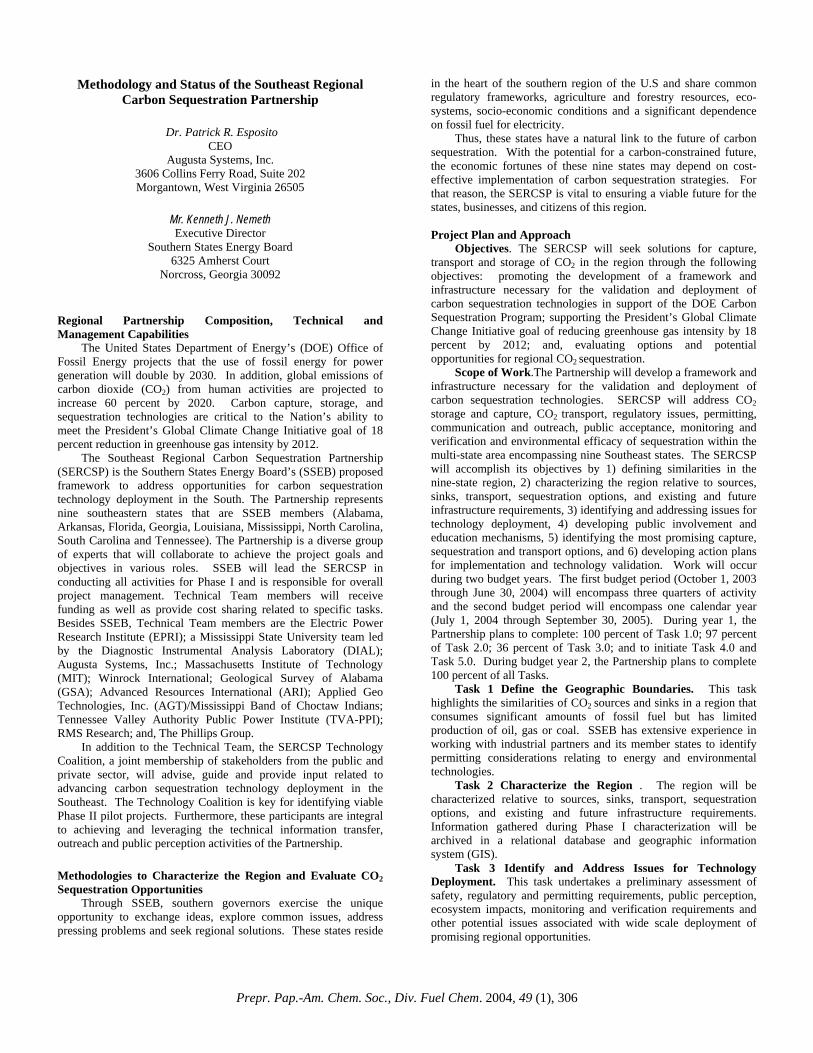
Methodology and Status of the Southeast Regional Carbon Sequestration Partnership
Dr. Patrick R. Esposito
CEO Augusta Systems, Inc.
3606 Collins Ferry Road, Suite 202 Morgantown, West Virginia 26505
Mr. Kenneth J. Nemeth Executive Director
Southern States Energy Board 6325 Amherst Court
Norcross, Georgia 30092
Regional Partnership Composition, Technical and Management Capabilities
The United States Department of Energy’s (DOE) Office of Fossil Energy projects that the use of fossil energy for power generation will double by 2030. In addition, global emissions of carbon dioxide (CO2) from human activities are projected to increase 60 percent by 2020. Carbon capture, storage, and sequestration technologies are critical to the Nation’s ability to meet the President’s Global Climate Change Initiative goal of 18 percent reduction in greenhouse gas intensity by 2012.
The Southeast Regional Carbon Sequestration Partnership (SERCSP) is the Southern States Energy Board’s (SSEB) proposed framework to address opportunities for carbon sequestration technology deployment in the South. The Partnership represents nine southeastern states that are SSEB members (Alabama, Arkansas, Florida, Georgia, Louisiana, Mississippi, North Carolina, South Carolina and Tennessee). The Partnership is a diverse group of experts that will collaborate to achieve the project goals and objectives in various roles. SSEB will lead the SERCSP in conducting all activities for Phase I and is responsible for overall project management. Technical Team members will receive funding as well as provide cost sharing related to specific tasks. Besides SSEB, Technical Team members are the Electric Power Research Institute (EPRI); a Mississippi State University team led by the Diagnostic Instrumental Analysis Laboratory (DIAL); Augusta Systems, Inc.; Massachusetts Institute of Technology (MIT); Winrock International; Geological Survey of Alabama (GSA); Advanced Resources International (ARI); Applied Geo Technologies, Inc. (AGT)/Mississippi Band of Choctaw Indians; Tennessee Valley Authority Public Power Institute (TVA-PPI); RMS Research; and, The Phillips Group.
In addition to the Technical Team, the SERCSP Technology Coalition, a joint membership of stakeholders from the public and private sector, will advise, guide and provide input related to advancing carbon sequestration technology deployment in the Southeast. The Technology Coalition is key for identifying viable Phase II pilot projects. Furthermore, these participants are integral to achieving and leveraging the technical information transfer, outreach and public perception activities of the Partnership.
Methodologies to Characterize the Region and Evaluate CO2 Sequestration Opportunities
Through SSEB, southern governors exercise the unique opportunity to exchange ideas, explore common issues, address pressing problems and seek regional solutions. These states reside
in the heart of the southern region of the U.S and share common regulatory frameworks, agriculture and forestry resources, eco-systems, socio-economic conditions and a significant dependence on fossil fuel for electricity.
Thus, these states have a natural link to the future of carbon sequestration. With the potential for a carbon-constrained future, the economic fortunes of these nine states may depend on cost-effective implementation of carbon sequestration strategies. For that reason, the SERCSP is vital to ensuring a viable future for the states, businesses, and citizens of this region.
Project Plan and Approach
Objectives. The SERCSP will seek solutions for capture, transport and storage of CO2 in the region through the following objectives: promoting the development of a framework and infrastructure necessary for the validation and deployment of carbon sequestration technologies in support of the DOE Carbon Sequestration Program; supporting the President’s Global Climate Change Initiative goal of reducing greenhouse gas intensity by 18 percent by 2012; and, evaluating options and potential opportunities for regional CO2 sequestration.
Scope of Work.The Partnership will develop a framework and infrastructure necessary for the validation and deployment of carbon sequestration technologies. SERCSP will address CO2 storage and capture, CO2 transport, regulatory issues, permitting, communication and outreach, public acceptance, monitoring and verification and environmental efficacy of sequestration within the multi-state area encompassing nine Southeast states. The SERCSP will accomplish its objectives by 1) defining similarities in the nine-state region, 2) characterizing the region relative to sources, sinks, transport, sequestration options, and existing and future infrastructure requirements, 3) identifying and addressing issues for technology deployment, 4) developing public involvement and education mechanisms, 5) identifying the most promising capture, sequestration and transport options, and 6) developing action plans for implementation and technology validation. Work will occur during two budget years. The first budget period (October 1, 2003 through June 30, 2004) will encompass three quarters of activity and the second budget period will encompass one calendar year (July 1, 2004 through September 30, 2005). During year 1, the Partnership plans to complete: 100 percent of Task 1.0; 97 percent of Task 2.0; 36 percent of Task 3.0; and to initiate Task 4.0 and Task 5.0. During budget year 2, the Partnership plans to complete 100 percent of all Tasks.
Task 1 Define the Geographic Boundaries. This task highlights the similarities of CO2 sources and sinks in a region that consumes significant amounts of fossil fuel but has limited production of oil, gas or coal. SSEB has extensive experience in working with industrial partners and its member states to identify permitting considerations relating to energy and environmental technologies.
Task 2 Characterize the Region . The region will be characterized relative to sources, sinks, transport, sequestration options, and existing and future infrastructure requirements. Information gathered during Phase I characterization will be archived in a relational database and geographic information system (GIS).
Task 3 Identify and Address Issues for Technology Deployment. This task undertakes a preliminary assessment of safety, regulatory and permitting requirements, public perception, ecosystem impacts, monitoring and verification requirements and other potential issues associated with wide scale deployment of promising regional opportunities.
Prepr. Pap.-Am. Chem. Soc., Div. Fuel Chem. 2004, 49 (1), 306

Task 4 Develop Public Involvement and Education Mechanisms. The Partnership will develop public involvement and education mechanisms that raise awareness of sequestration opportunities in the Southeast region and provide interested stakeholders with information about supporting technology development efforts.
Task 5.0 Identify the Most Promising Capture, Sequestration and Transport Options. The Partnership will begin its assessment of the most promising options. The Partnership will analyze information gathered in the regional assessment to identify the most promising opportunities for capture, transport and sequestration of CO2. The initiative will assess and validate the most promising emerging technology developments and identify those minor modifications required to fit the technology to the regional application.
Task 6.0 Prepare Action Plans for Implementation and Technology Validation Activity. The Technical Team will prepare Action plans to implement the framework developed leading to small-scale regional technology validation field tests. In developing the plans, the Partnership will consider cost-effective approaches that provide flexibility for assessing multiple candidate technology options. This task will result in Action Plans for capture, transport and storage options. In addition, the Plans will include assessing terms of public involvement, education and acceptance, regulatory and permitting, and accounting frameworks. Finally, the Partnership will integrate the Action Plans to form a regional strategy.
Prepr. Pap.-Am. Chem. Soc., Div. Fuel Chem. 2004, 49 (1), 307
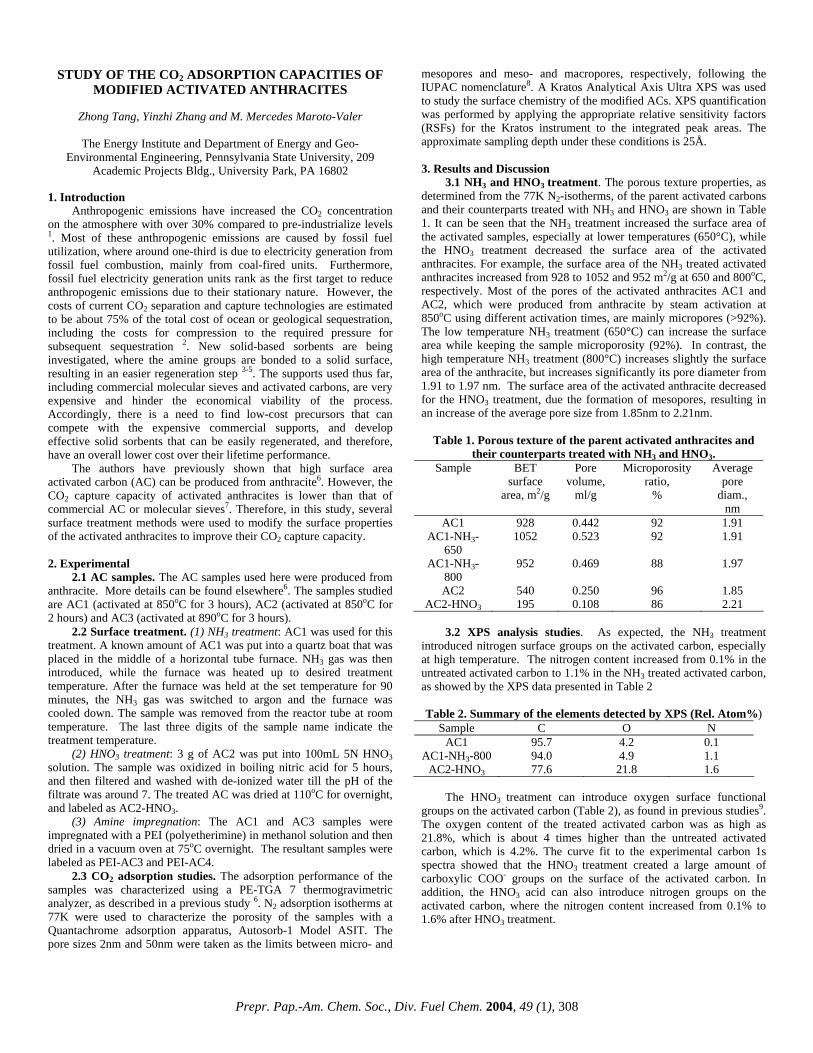
STUDY OF THE CO2 ADSORPTION CAPACITIES OF MODIFIED ACTIVATED ANTHRACITES
Zhong Tang, Yinzhi Zhang and M. Mercedes Maroto-Valer
The Energy Institute and Department of Energy and Geo-
Environmental Engineering, Pennsylvania State University, 209 Academic Projects Bldg., University Park, PA 16802
1. Introduction
Anthropogenic emissions have increased the CO2 concentration on the atmosphere with over 30% compared to pre-industrialize levels 1. Most of these anthropogenic emissions are caused by fossil fuel utilization, where around one-third is due to electricity generation from fossil fuel combustion, mainly from coal-fired units. Furthermore, fossil fuel electricity generation units rank as the first target to reduce anthropogenic emissions due to their stationary nature. However, the costs of current CO2 separation and capture technologies are estimated to be about 75% of the total cost of ocean or geological sequestration, including the costs for compression to the required pressure for subsequent sequestration 2. New solid-based sorbents are being investigated, where the amine groups are bonded to a solid surface, resulting in an easier regeneration step 3-5. The supports used thus far, including commercial molecular sieves and activated carbons, are very expensive and hinder the economical viability of the process. Accordingly, there is a need to find low-cost precursors that can compete with the expensive commercial supports, and develop effective solid sorbents that can be easily regenerated, and therefore, have an overall lower cost over their lifetime performance.
The authors have previously shown that high surface area activated carbon (AC) can be produced from anthracite6. However, the CO2 capture capacity of activated anthracites is lower than that of commercial AC or molecular sieves7. Therefore, in this study, several surface treatment methods were used to modify the surface properties of the activated anthracites to improve their CO2 capture capacity. 2. Experimental
2.1 AC samples. The AC samples used here were produced from anthracite. More details can be found elsewhere6. The samples studied are AC1 (activated at 850oC for 3 hours), AC2 (activated at 850oC for 2 hours) and AC3 (activated at 890oC for 3 hours).
2.2 Surface treatment. (1) NH3 treatment: AC1 was used for this treatment. A known amount of AC1 was put into a quartz boat that was placed in the middle of a horizontal tube furnace. NH3 gas was then introduced, while the furnace was heated up to desired treatment temperature. After the furnace was held at the set temperature for 90 minutes, the NH3 gas was switched to argon and the furnace was cooled down. The sample was removed from the reactor tube at room temperature. The last three digits of the sample name indicate the treatment temperature.
(2) HNO3 treatment: 3 g of AC2 was put into 100mL 5N HNO3 solution. The sample was oxidized in boiling nitric acid for 5 hours, and then filtered and washed with de-ionized water till the pH of the filtrate was around 7. The treated AC was dried at 110oC for overnight, and labeled as AC2-HNO3.
(3) Amine impregnation: The AC1 and AC3 samples were impregnated with a PEI (polyetherimine) in methanol solution and then dried in a vacuum oven at 75oC overnight. The resultant samples were labeled as PEI-AC3 and PEI-AC4.
2.3 CO2 adsorption studies. The adsorption performance of the samples was characterized using a PE-TGA 7 thermogravimetric analyzer, as described in a previous study 6. N2 adsorption isotherms at 77K were used to characterize the porosity of the samples with a Quantachrome adsorption apparatus, Autosorb-1 Model ASIT. The pore sizes 2nm and 50nm were taken as the limits between micro- and
mesopores and meso- and macropores, respectively, following the IUPAC nomenclature8. A Kratos Analytical Axis Ultra XPS was used to study the surface chemistry of the modified ACs. XPS quantification was performed by applying the appropriate relative sensitivity factors (RSFs) for the Kratos instrument to the integrated peak areas. The approximate sampling depth under these conditions is 25Å.
3. Results and Discussion
3.1 NH3 and HNO3 treatment. The porous texture properties, as determined from the 77K N2-isotherms, of the parent activated carbons and their counterparts treated with NH3 and HNO3 are shown in Table 1. It can be seen that the NH3 treatment increased the surface area of the activated samples, especially at lower temperatures (650°C), while the HNO3 treatment decreased the surface area of the activated anthracites. For example, the surface area of the NH3 treated activated anthracites increased from 928 to 1052 and 952 m2/g at 650 and 800oC, respectively. Most of the pores of the activated anthracites AC1 and AC2, which were produced from anthracite by steam activation at 850oC using different activation times, are mainly micropores (>92%). The low temperature NH3 treatment (650°C) can increase the surface area while keeping the sample microporosity (92%). In contrast, the high temperature NH3 treatment (800°C) increases slightly the surface area of the anthracite, but increases significantly its pore diameter from 1.91 to 1.97 nm. The surface area of the activated anthracite decreased for the HNO3 treatment, due the formation of mesopores, resulting in an increase of the average pore size from 1.85nm to 2.21nm.
Table 1. Porous texture of the parent activated anthracites and
their counterparts treated with NH3 and HNO3. Sample BET
surface area, m2/g
Pore volume,
ml/g
Microporosity ratio,
%
Average pore
diam., nm
AC1 928 0.442 92 1.91 AC1-NH3-
650 1052 0.523 92 1.91
AC1-NH3-800
952 0.469 88 1.97
AC2 540 0.250 96 1.85 AC2-HNO3 195 0.108 86 2.21
3.2 XPS analysis studies. As expected, the NH3 treatment
introduced nitrogen surface groups on the activated carbon, especially at high temperature. The nitrogen content increased from 0.1% in the untreated activated carbon to 1.1% in the NH3 treated activated carbon, as showed by the XPS data presented in Table 2
Table 2. Summary of the elements detected by XPS (Rel. Atom%)
Sample C O N AC1 95.7 4.2 0.1
AC1-NH3-800 94.0 4.9 1.1 AC2-HNO3 77.6 21.8 1.6
The HNO3 treatment can introduce oxygen surface functional
groups on the activated carbon (Table 2), as found in previous studies9. The oxygen content of the treated activated carbon was as high as 21.8%, which is about 4 times higher than the untreated activated carbon, which is 4.2%. The curve fit to the experimental carbon 1s spectra showed that the HNO3 treatment created a large amount of carboxylic COO- groups on the surface of the activated carbon. In addition, the HNO3 acid can also introduce nitrogen groups on the activated carbon, where the nitrogen content increased from 0.1% to 1.6% after HNO3 treatment.
Prepr. Pap.-Am. Chem. Soc., Div. Fuel Chem. 2004, 49 (1), 308
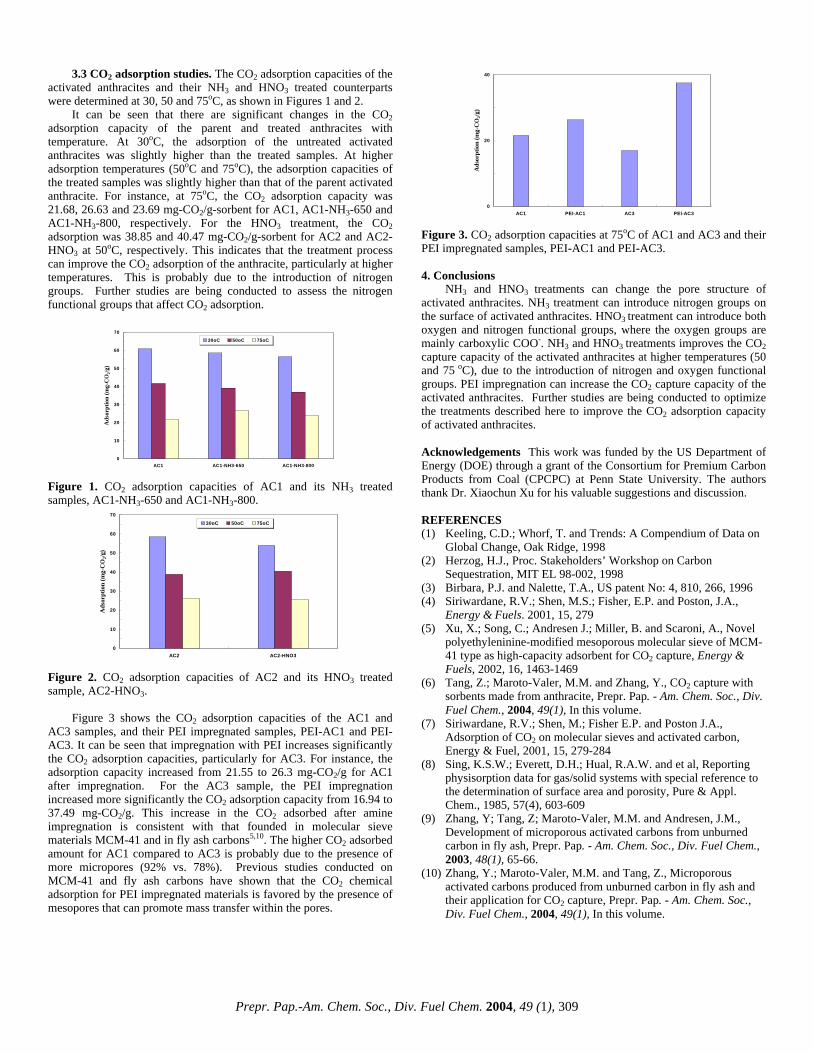
3.3 CO2 adsorption studies. The CO2 adsorption capacities of the activated anthracites and their NH3 and HNO3 treated counterparts were determined at 30, 50 and 75oC, as shown in Figures 1 and 2.
It can be seen that there are significant changes in the CO2 adsorption capacity of the parent and treated anthracites with temperature. At 30oC, the adsorption of the untreated activated anthracites was slightly higher than the treated samples. At higher adsorption temperatures (50oC and 75oC), the adsorption capacities of the treated samples was slightly higher than that of the parent activated anthracite. For instance, at 75oC, the CO2 adsorption capacity was 21.68, 26.63 and 23.69 mg-CO2/g-sorbent for AC1, AC1-NH3-650 and AC1-NH3-800, respectively. For the HNO3 treatment, the CO2 adsorption was 38.85 and 40.47 mg-CO2/g-sorbent for AC2 and AC2-HNO3 at 50oC, respectively. This indicates that the treatment process can improve the CO2 adsorption of the anthracite, particularly at higher temperatures. This is probably due to the introduction of nitrogen groups. Further studies are being conducted to assess the nitrogen functional groups that affect CO2 adsorption.
0
10
20
30
40
50
60
70
AC1 AC1-NH3-650 AC1-NH3-800
Ads
orpt
ion
(mg-
CO
2/g)
30oC 50oC 75oC
Figure 1. CO2 adsorption capacities of AC1 and its NH3 treated samples, AC1-NH3-650 and AC1-NH3-800.
0
10
20
30
40
50
60
70
AC2 AC2-HNO3
Ads
orpt
ion
(mg-
CO
2/g)
30oC 50oC 75oC
Figure 2. CO2 adsorption capacities of AC2 and its HNO3 treated sample, AC2-HNO3.
Figure 3 shows the CO2 adsorption capacities of the AC1 and
AC3 samples, and their PEI impregnated samples, PEI-AC1 and PEI-AC3. It can be seen that impregnation with PEI increases significantly the CO2 adsorption capacities, particularly for AC3. For instance, the adsorption capacity increased from 21.55 to 26.3 mg-CO2/g for AC1 after impregnation. For the AC3 sample, the PEI impregnation increased more significantly the CO2 adsorption capacity from 16.94 to 37.49 mg-CO2/g. This increase in the CO2 adsorbed after amine impregnation is consistent with that founded in molecular sieve materials MCM-41 and in fly ash carbons5,10. The higher CO2 adsorbed amount for AC1 compared to AC3 is probably due to the presence of more micropores (92% vs. 78%). Previous studies conducted on MCM-41 and fly ash carbons have shown that the CO2 chemical adsorption for PEI impregnated materials is favored by the presence of mesopores that can promote mass transfer within the pores.
0
20
40
AC1 PEI-AC1 AC3 PEI-AC3
Ads
orpt
ion
(mg-
CO
2/g)
Figure 3. CO2 adsorption capacities at 75oC of AC1 and AC3 and their PEI impregnated samples, PEI-AC1 and PEI-AC3.
4. Conclusions
NH3 and HNO3 treatments can change the pore structure of activated anthracites. NH3 treatment can introduce nitrogen groups on the surface of activated anthracites. HNO3 treatment can introduce both oxygen and nitrogen functional groups, where the oxygen groups are mainly carboxylic COO-. NH3 and HNO3 treatments improves the CO2 capture capacity of the activated anthracites at higher temperatures (50 and 75 oC), due to the introduction of nitrogen and oxygen functional groups. PEI impregnation can increase the CO2 capture capacity of the activated anthracites. Further studies are being conducted to optimize the treatments described here to improve the CO2 adsorption capacity of activated anthracites.
Acknowledgements This work was funded by the US Department of Energy (DOE) through a grant of the Consortium for Premium Carbon Products from Coal (CPCPC) at Penn State University. The authors thank Dr. Xiaochun Xu for his valuable suggestions and discussion.
REFERENCES (1) Keeling, C.D.; Whorf, T. and Trends: A Compendium of Data on
Global Change, Oak Ridge, 1998 (2) Herzog, H.J., Proc. Stakeholders’ Workshop on Carbon
Sequestration, MIT EL 98-002, 1998 (3) Birbara, P.J. and Nalette, T.A., US patent No: 4, 810, 266, 1996 (4) Siriwardane, R.V.; Shen, M.S.; Fisher, E.P. and Poston, J.A.,
Energy & Fuels. 2001, 15, 279 (5) Xu, X.; Song, C.; Andresen J.; Miller, B. and Scaroni, A., Novel
polyethyleninine-modified mesoporous molecular sieve of MCM-41 type as high-capacity adsorbent for CO2 capture, Energy & Fuels, 2002, 16, 1463-1469
(6) Tang, Z.; Maroto-Valer, M.M. and Zhang, Y., CO2 capture with sorbents made from anthracite, Prepr. Pap. - Am. Chem. Soc., Div. Fuel Chem., 2004, 49(1), In this volume.
(7) Siriwardane, R.V.; Shen, M.; Fisher E.P. and Poston J.A., Adsorption of CO2 on molecular sieves and activated carbon, Energy & Fuel, 2001, 15, 279-284
(8) Sing, K.S.W.; Everett, D.H.; Hual, R.A.W. and et al, Reporting physisorption data for gas/solid systems with special reference to the determination of surface area and porosity, Pure & Appl. Chem., 1985, 57(4), 603-609
(9) Zhang, Y; Tang, Z; Maroto-Valer, M.M. and Andresen, J.M., Development of microporous activated carbons from unburned carbon in fly ash, Prepr. Pap. - Am. Chem. Soc., Div. Fuel Chem., 2003, 48(1), 65-66.
(10) Zhang, Y.; Maroto-Valer, M.M. and Tang, Z., Microporous activated carbons produced from unburned carbon in fly ash and their application for CO2 capture, Prepr. Pap. - Am. Chem. Soc., Div. Fuel Chem., 2004, 49(1), In this volume.
Prepr. Pap.-Am. Chem. Soc., Div. Fuel Chem. 2004, 49 (1), 309

CO2 Scrubbing with Novel Lithium Zirconate Sorbents
Daniel J. Fauth, James S. Hoffman, Randall P. Reasbeck, and Henry W. Pennline
U.S. Department of Energy
National Energy Technology Laboratory (NETL) P.O. Box 10940
Pittsburgh, PA 15236-0940 Introduction
Electric power generated from the combustion of fossil fuels is accountable for over one-third of the global annual CO2 emissions. Large stationary sources are, therefore, considered credible targets for carbon sequestration. For this reason, the successful implementation of practical and cost effective CO2 separation and capture technologies are projected to have a major impact on mitigating environmental problems posed by CO2 emissions.
Existing commercial operations for removing CO2 from flue gas make use of chemical absorption with various amine solvents. Inherent deficiencies associated with this process include low CO2 loadings and significant energy requirements for CO2 release. Alternative technologies for CO2 capture are considered necessary.
One promising technology with the potential for significant development employs dry scrubbing with regenerable sorbents.1-9 These processes are cyclical since the sorbent can successfully remove the gaseous component, be regenerated, and in this step yield a concentrated stream of CO2, and then reused. Advanced processes based on dry regenerable sorbents may offer attractive benefits over existing solvent-based practices.
Lithium zirconate (Li2ZrO3), with its favorable CO2 sorption characteristics, is considered a promising material for CO2 removal at high temperature. The chemical reaction for CO2 capture using Li2ZrO3 is illustrated below. The forward reaction pathway depicts absorption of CO2, whereas regeneration is expressed as the reverse reaction path.
Li2ZrO3 (s) + CO2 (g) Li2CO3 (s) + ZrO2 (s) [1] Nakagawa and Ohashi1,2 observed Li2ZrO3 powder reacts immediately with CO2 in the temperature range of 450o to 590oC. Ohashi and Nakagawa3 also report the addition of potassium carbonate to Li2ZrO3 significantly influences its kinetic rate and increases its CO2 capture capacity. They conclude this acceleration results from the formation of a Li2CO3-K2CO3 eutectic encapsulating a solid ZrO2 core. Lin and Ida5,6 confirm these observations and offer a comprehensive double-shell model describing the mechanism for CO2 sorption/desorption on pure and potassium-doped Li2ZrO3 sorbents. In this study, we examined the influence of potassium carbonate and other alkaline carbonate eutectic agents for enhancing the direct carbonation of Li2ZrO3. Improvement in the CO2 sorption rate is important for its practical application in design and development of dry, regenerable sorbent materials for CO2 capture under operating conditions prevailing in Integrated Gasification Combined Cycle (IGCC) processes. Experimental High purity Li2ZrO3 procured from Aldrich Chemical Co. was used as the primary substrate. Thermogravimetric Analysis (TGA) with a microelectronic recording balance system (Cahn TG-131) was employed to examine the CO2 sorption properties of pure and molten salt-containing Li2ZrO3 powders. A gas cylinder supplied CO2 of
stock gas grade (99.99%) to the TGA apparatus. Sample temperature was measured and controlled with a type K thermocouple located directly below the suspended sample pan. Approximately 100 mg of Li2ZrO3 was charged into a platinum sample pan for testing. For molten salt-containing Li2ZrO3 samples, 20% by weight of carbonate (or halide) salt was physically admixed with 100 mg Li2ZrO3 prior to placing the sample into the TGA instrument. Table 1 shows the composition and eutectic temperatures of the molten salt-containing Li2ZrO3 samples.
Table 1. Composition and eutectic temperatures of molten salt-containing Li2ZrO3 sorbent materials
Sample ID
Molten salt composition (mol%) Eutectic Temp (oC)a
B1 K2CO3 38% Li2CO3 62% 488 B2 K2CO3 57.3% Li2CO3 42.7% 498 B3 Na2CO3 48% Li2CO3 52% 500 B4 KF 38% Li2CO3 62% n/a B5 K2CO3 57% MgCO3 43% 460 T1 K2CO3 26.8% Na2CO3 30.6% Li2CO3 42.5% 393 a Physical Properties Data Compilations Relevant to Energy Storage. 1. Molten Salts: Eutectic Data, U.S. Dept. of Commerce, March 1978 Prior to CO2 sorption, each sample was pre-conditioned and dried in nitrogen by elevating the temperature (at 10o/min) to 500oC and holding for 30 minutes. Upon completion of this step, the surrounding stream of N2 gas was switched to pure CO2 while maintaining a flow rate of 140cc/min. CO2 sorption testing was conducted at 500oC. The change in sample weight with time was recorded during absorption, upon which the experimental conversion of Li2ZrO3 to Li2CO3 was calculated. Regeneration of the Li2ZrO3 samples was performed by switching the feed gas back to N2 after raising the temperature to 800oC. X-ray diffraction (XRD) characterization of the modified Li2ZrO3 samples after CO2 sorption at 500oC was conducted using a PANalytical X’pert Pro powder diffractometer with a Cu X-ray source at 45 kV and 40 mA. The XRD patterns were recorded over a 2θ range of 8° to 70°. Phase identification was verified by comparison to the ICDD inorganic compound powder diffraction data base. Results and Discussion Figure 1 shows the CO2 uptake of the Aldrich Li2ZrO3 powder at 500oC after the surrounding N2 gas stream was switched to pure CO2 (Pco2 = 1atm). The pure Li2ZrO3 sample shows a steady but very slow
0
2
4
6
8
10
12
14
0 500 1000 1500Time (Minutes)
Wei
ght g
ain
(%)
0
200
400
600
800
1000
Tem
pera
ture
(o C)
Aldrich Lithium Zirconate
Figure 1. CO2 sorption profile of Aldrich Li2ZrO3 powder at 500oC Initial sample weight: 100 mg Li2ZrO3 Gas flow rate: 140cc/min Total pressure: 1 atm
Prepr. Pap.-Am. Chem. Soc., Div. Fuel Chem. 2004, 49 (1), 310

increase in sample weight upon CO2 exposure. From this figure, pure Li2ZrO3 gained nearly 11 wt % CO2 of its sample weight within 1500 minutes, which corresponds to a reaction yield of 38.3% based on equation 1. (Theoretical maximum uptake of CO2 for pure Li2ZrO3 sample equals 28.7 wt %.) After completion of the first sorption step, the Li2ZrO3 sample was successfully regenerated at 800oC in nitrogen. These results were found in good agreement with values reported by Nakagawa and Ohashi,1-3 Essaki4 et al. and Lin.5 XRD analyses identified Li2ZrO3, Li2CO3 and ZrO2 as major crystalline phases after CO2 exposure at 500oC. The influence of molten salt mixtures of alkaline and alkaline earth carbonates on the rate of CO2 sorption of the modified Li2ZrO3 powders at 500oC is illustrated in Figure 2. It should be noted that no attempt was made to optimize the dispersion of the molten salts onto the Li2ZrO3 powder. The majority of the binary eutectic containing Li2ZrO3 samples absorbed 11 to 13 wt % of CO2 of the sample weight within 60 minutes. The potassium/lithium carbonate-containing Li2ZrO3 samples (designated B1 and B2) have eutectic melting points of 488o and 498oC respectively. These samples show a much faster rate (25 times faster) of CO2 uptake compared to the pure Li2ZrO3. The binary sodium/lithium carbonate doped Li2ZrO3 sample (B3) and ternary carbonate doped Li2ZrO3 sample (T1), consisting of sodium carbonate, potassium carbonate, and lithium carbonate, with a melting point of 393oC, produced comparable rates of CO2 uptake as the potassium-containing B1 and B2 samples.
0
2
4
6
8
10
12
14
0 10 20 30 40 50 60Time (Minutes)
Wei
ght g
ain
(%)
Unmodified
K2CO3 38%, Li2CO3 62%
Na2CO3 48%, Li2CO3 % 52%KF, Li2CO3
K2CO3, MgCO3
K2CO3 57.3%, Li2CO3 42.7%
K2CO3, Li2CO3, Na2CO3
NETL Eutectic-containing Lithium Zirconate Sorbents
Figure 2 Influence of eutectic additives on rate of CO2 sorption for NETL promoted Li2ZrO3 sorbents. Reaction temperature: 500oC. The binary K2CO3-MgCO3-containing Li2ZrO3 sample (B5) has a melting point of 460oC, which is nearly 40oC lower than previous binary carbonate Li2ZrO3 samples tested. The rate along with its capacity remained high over the entire sixty minutes under a 100% CO2 flow. Sample B5 absorbed over 12% of its sample weight, corresponding to 41.7% of its theoretical maximum. Figure 3 shows a scanning electron micrograph of the spent K2CO3-MgCO3-containing Li2ZrO3 sample after CO2 sorption at 500oC. At this magnification, the single particle appears to be dense, non-porous in appearance. The mixed potassium halide/carbonate Li2ZrO3 sample (B4) gave the fastest rate (40 times faster) of CO2 uptake compared to the unmodified Li2ZrO3 sample. Under IGCC applications, sorbent kinetics is anticipated to improve due to elevated CO2 pressures. XRD analysis identified Li2CO3 and ZrO2 as major phases upon rapid quenching of carbonated B4 and B5 samples in CO2. By TEM and EDX analysis, Ohashi and Nakagawa3 report the existence of a potassium/lithium carbonate eutectic surrounding a solid Li2ZrO3 core. In the case of the pure Li2ZrO3 sample (without K2CO3 additive), formation of an impervious shell of Li2CO3 results on the outer surface of the unreactive Li2ZrO3 core. This observation
suggests diffusion resistance of CO2 through the solid Li2CO3 product layer is the rate-limiting step. In contrast, the potassium/lithium carbonate-containing Li2ZrO3 sample reacts with gaseous CO2 at 500oC to form a molten liquid outer layer and a solid interior ZrO2 shell. Therefore, the difference in CO2 sorption rate can be partially contributed to the molten carbonate layer; CO2 diffuses through the molten carbonate layer at a much faster rate. Lin and Ida5 describe a comprehensive double-shell model relating to the mechanism for CO2 sorption on potassium-doped Li2ZrO3. They conclude after the formation of the molten potassium-lithium carbonate layer and ZrO2 shell, the carbonation reaction will proceed by the diffusion of Li+ and O2- ions through the ZrO2 shell along with diffusion of CO2 through the molten carbonate layer. Strategies for reducing the depth of the solid Li2CO3 and ZrO2 shells formed during reaction should provide additional insight and improvement in sorbent performance.
Figure 3. Scanning electron micrograph of K2CO3-MgCO3 eutectic containing Li2ZrO3 sample (B5) after CO2 sorption at 500oC.
Conclusions
CO2 sorption performances of alkaline and alkaline earth-containing Li2ZrO3 sorbent materials at 500oC show very favorable reaction kinetics for CO2 capture in comparison to pure lithium zirconate. Future work will focus on the synthesis of molten salt-containing, nanocrystalline Li2ZrO3 samples along with CO2 sorption testing using TGA and a fixed-bed reactor with mixtures of gases simulating fuel gas environments, such as that found in IGGC operations.
References 1. Nakagawa, K.; Ohashi, T. J. Electrochem. Soc. 1998, 45(4),
1344-1346 2. Nakagawa, K.; Ohashi, T. J. Electrochemistry 1999, 67(6), 618-
621. 3. Ohashi, T.; Nakagawa, K. Mat.Res. Soc. Symp. Proc. 1999, 47,
249-254. 4. Essaki, K.; Nakagawa, K.; Kato, M. J. of the Ceramic Society of
Japan 2001, 109(10), 829-833. 5. Lin, Y.S.; Ida, J. Environ. Sci. Technol. 2003, 37(9), 1999-2004. 6. Ida, J.; Xiong, R.; Lin, Y.S. Sep. Pur. Technol. 2003, article in
press. 7. Gupta, H.; Fan, L.S. Ind. Eng. Chem. Res. 2002, 41(16), 4035-
4042. 8. Fauth, D.J.; Hoffman, J.S.; Pennline, H.W. Fuel Chemistry
Division Preprints, 2003, 48(1), 169-170. 9. Pennline, H.W.; Hoffman, J.S. U.S. Patent No. 6,387,337, 2002.
Prepr. Pap.-Am. Chem. Soc., Div. Fuel Chem. 2004, 49 (1), 311

Design, Process Simulation, and Construction of an Atmospheric Dual Fluidized Bed Combustion System for In Situ CO2 Capture Using High-temperature Sorbents
Robin W. Hughes, Jinsheng Wang, Edward J. Anthony
Fluidized Bed Combustion & Gasification Group
CETC-O/Natural Resources Canada 1 Haanel Dr., Ottawa
Canada K1A 1M1
Introduction The need to reduce CO2 emissions along with pollutants such as
SO2 and NOX is now generally accepted1. At the same time, there is a growing need for increased electrical power generation. If both sets of requirements are to be met without excessive economic disadvantage to the world economy, then new electrical generation methods with low or zero CO2 emissions must be developed.
The use of the carbonation reaction in a combustion system could potentially meet the needs of a modern, high-volume, CO2 capture system. The process outlined below operates continuously, producing a flue gas containing less than 3% CO2 and a marketable CO2 product stream with a purity exceeding 85%.
The carbonation reaction can remove carbon dioxide from combustion systems at elevated temperatures (~650°C-760°C) and atmospheric pressure via:
CaO + CO2 ⇔ CaCO3 (1) The efficiency of systems using dual fluid beds for carbonation
and sorbent regeneration have been shown to be comparable to current combustion systems without CO2 segregation2,3. Sulphur dioxide emissions will be on the order of a few parts per million since the calcium required for CO2 removal will be equivalent to a Ca:S molar ratio on the order of 20-30. Circulating fluidized bed combustors (CFBCs) are intrinsically low producers of NO and are amenable to NH3 injection if very low emissions of NO are desired4. N2O emissions can be minimized by operating at temperatures around 900ºC or by producing high-temperature windows in the cyclone5.
The dual fluid bed carbonation process can be applied to stationary emitters of carbon dioxide including coal-fired generating stations and cement kilns. Limestone, the main feedstock, is inexpensive and readily available throughout most of the world allowing this process to have a global impact on greenhouse gases.
Information needed for scale-up to an industrial process using dual fluid bed technology for carbon dioxide capture is not currently available in the literature. To obtain some of the required information, a mini-pilot plant has been constructed. The design and process simulation of this system are presented here. Experimental
Dual Fluid Bed Design Figure 1 shows a process flow diagram for the twin fluid bed combustion system with CO2 capture operating at atmospheric pressure. Solid fuel combustion, with air, occurs in the first stage of the carbonating combustor at an optimum temperature for combustion (850ºC-950ºC) while carbonation occurs in the second stage at an optimum temperature for CO2 capture (650ºC-750ºC for reaction (1)).
The combustion section will operate in the bubbling bed regime with allowance for both primary and secondary combustion air. Heat can be removed from the combustion stage of the Carbonating
Combustor to allow high steam cycle efficiency. Sulphur removal is possible using spent sorbent through the reaction:
CaO + ½O2 + SO2 ⇔ CaSO4 (2) The carbonation section will operate in the bubbling bed regime.
Heat removal is possible in the Carbonating stage to control the reaction temperature for reaction (1). A distribution plate separates the combustion stage from the carbonating stage.
The Carbonating Combustor is designed such that it can operate as a single stage circulating fluidized bed combustor with CO2 removal. This mode of operation is not expected to result in optimum long-term cyclic conversion of the sorbent, however, it may be of interest for commercial retrofit. The sorbent is transported to the regenerator using calciner product gas, composed primarily of CO2, or by steam. The carbon dioxide or steam is later used as a temperature mediator in the regenerator.
Sorbent regeneration occurs in the second fluid bed; the Oxygen Combustor & Calciner. Heat is supplied in the calciner by burning a low ash fuel such as petroleum coke with oxygen, to supply the heat necessary to drive reaction (1) to the left, releasing carbon dioxide. The Oxygen Combustor/Calciner can be operated as either a bubbling fluidized bed, or a circulating fluidized bed.
Figure 1. Atmospheric Dual Fluidized Bed Combustion System with CO2 Capture.
Procedure
Process simulation using ASPEN Plus been used to establish the mass and energy balances of interest for equipment selection and design. A high-level view of the simulation can be seen in Figure 2. Combustion, carbonation, calcination and sulphation are simulated using combinations of the RYIELD, RSTOIC, RCSTR, and REQUIL reactor blocks. Fluidized bed combustion simulation for this system is described by Sotudeh-Gharabaagh et al.6 Sorbent degradation and fluidization requirements are calculated using an Excel calculation block within ASPEN.
Model verification for bubbling fluidized bed combustion and circulating fluidized bed combustion has been verified using an existing 0.1-metre inner diameter CETC-O mini-circulating fluidized bed combustor. Results of mini-pilot plant studies will be used to fine tune process simulations for both atmospheric carbonation as described here, and pressurized carbonation as described by Wang7.
Prepr. Pap.-Am. Chem. Soc., Div. Fuel Chem. 2004, 49 (1), 312

Figure 2. ASPEN Plus Simulation of Fluidized Bed Combustion System with CO2 Capture. Results and Discussion
Preliminary investigations using the existing CETC-O mini-fluidized bed combustor indicate that varying operating conditions and limestone sorbents can result in a range of sorbent conversions. In general, the sorbent conversion can be estimated using the model proposed by Abanades8:
WWN
mN fffX +−= )1( (3)
where XN is the maximum carbonation conversion obtained after N cycles for a predetermined carbonation time (often reported at 20 minutes). Parameter values of fm = 0.77 and fW = 0.17 for this model have been shown to fit data for unmodified limestone sorbents quite well. This model indicates that conversion is reduced to ~0.17 after 20 carbonation-calcination cycles. Batch studies in the bubbling fluidized bed regime show that the mini-fluidized bed combustor results in conversions similar to those reported for thermogravimetric analysis under most conditions9. Limestone type, CO2 concentration, and operating temperature can affect conversion to a small extent. Sorbent losses through attrition have been found to be low.
Recent pore modification studies10 at CETC-O indicate that conversion can be greatly increased by a simple treatment step prior to sorbent injection into the carbonator. Conversion as high as 52% after 20 cycles (20-minute carbonation) can be obtained in a thermogravimetric analyzer. Conversions as high as 59% after 20 cycles (20-minute carbonation) are predicted through extrapolation of tests with the number of cycles limited to four. Operating at conditions resulting in these high conversions could result in a combustion process with less than 3% CO2 in the flue gas, and a separate concentrated CO2 stream (>85% CO2). However, the pore modification step increases the friability of the sorbent, which will lead to increased sorbent losses due to attrition. The mini-pilot plant will be used to examine sorbent losses due to elutriation and to study conversion in a continuous process.
Conclusions
A flexible atmospheric dual fluidized bed combustion system using high temperature sorbents for in situ CO2 capture has been designed and constructed. The process simulations developed for the design of the mini-pilot plant will be used for scale-up studies and process verification of commercial scale simulations based on the results of pilot plant operation. The pilot plant is expected to
combust coal and petroleum coke in a clean and efficient manner, emitting a flue gas containing less than 3% CO2, while producing a relatively pure carbon dioxide stream ready for compression. SO2 emissions are expected to be in the parts per million range.
Acknowledgment. The authors wish to thank Dr. Artruro Macchi of the University of Ottawa for reviewing the design of the dual fluid bed system. References (1) Harrison, R.M. (ed.), Understanding our Environment: An
Introduction to Environmental Chemistry and Pollution. Royal Society of Chemistry, 1992.
(2) Shimizu, T., Hirama, T., Hosoda, H., Kitano, K., Inagaki, M., and Tejima, K., A Twin Fluid-bed Reactor for Removal of CO2 from Combustion Processes. 1999, Trans IChemE 77, 62.
(3) Abanades, J.C., Alvarez, D., Anthony, E.J., and Lu, D., In-situ Capture of CO2 in a Fluidized Bed Combustor. Proceedings of the 17th FBC Conference, ASME, Jacksonville, Florida, 2003.
(4) Grace, J.R., Avidan, A.A., and Knowlton, T.M. (eds.), Circulating Fluidized Beds. Blackie Academic and Professional, 1997.
(5) Gustavsson, L., Reduction of N2O in Fluidized Bed Combustion by Afterburning. PhD Thesis, Chalmers University, Sweden, 1995.
(6) Sotudeh-Gharabaagh, R., Legros, R., Chaoiki, J., and Paris, J., Simulation of Circulating Fluidized Bed Reactors using ASPEN Plus. 1998, Fuel 77(4), 327.
(7) Wang, J., Anthony, E.J., and Abanades, J.C., A Simulation Study for Fluidized Bed Combustion of Petroleum Coke with CO2 Capture. Proceedings of the 17th FBC Conference, ASME, Jacksonville, Florida, 2003.
(8) Abanades, J.C. and Alvarez D., 2003, Energy Fuels 17, 308–315.
(9) Salvador, C., Lu, D., Anthony, E.J., and Abanades, J.C., Enhancement of CaO for CO2 capture in an FBC environment. 2003, Chemical Engineering Journal 96, 187.
(10) Hughes, R.W., Lu, D., Anthony, E.J., and Wu, Y., Improved Long-term Capacity of a Limestone Derived Sorbent For In Situ Capture of CO2 in a Fluidized Bed Combustor. 2004, Ind. Eng. Chem. Res. In print.
Prepr. Pap.-Am. Chem. Soc., Div. Fuel Chem. 2004, 49 (1), 313
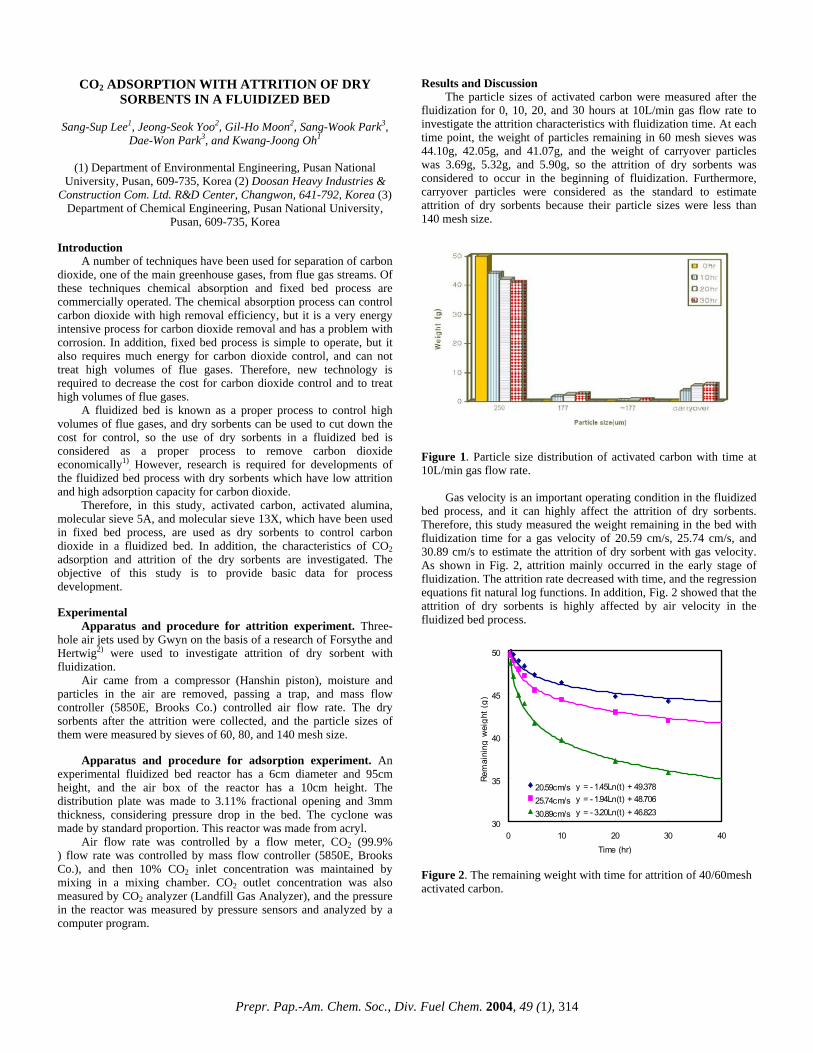
CO2 ADSORPTION WITH ATTRITION OF DRY SORBENTS IN A FLUIDIZED BED
Sang-Sup Lee1, Jeong-Seok Yoo2, Gil-Ho Moon2, Sang-Wook Park3,
Dae-Won Park3, and Kwang-Joong Oh1
(1) Department of Environmental Engineering, Pusan National
University, Pusan, 609-735, Korea (2) Doosan Heavy Industries & Construction Com. Ltd. R&D Center, Changwon, 641-792, Korea (3)
Department of Chemical Engineering, Pusan National University, Pusan, 609-735, Korea
Introduction
A number of techniques have been used for separation of carbon dioxide, one of the main greenhouse gases, from flue gas streams. Of these techniques chemical absorption and fixed bed process are commercially operated. The chemical absorption process can control carbon dioxide with high removal efficiency, but it is a very energy intensive process for carbon dioxide removal and has a problem with corrosion. In addition, fixed bed process is simple to operate, but it also requires much energy for carbon dioxide control, and can not treat high volumes of flue gases. Therefore, new technology is required to decrease the cost for carbon dioxide control and to treat high volumes of flue gases.
A fluidized bed is known as a proper process to control high volumes of flue gases, and dry sorbents can be used to cut down the cost for control, so the use of dry sorbents in a fluidized bed is considered as a proper process to remove carbon dioxide economically1)
. However, research is required for developments of the fluidized bed process with dry sorbents which have low attrition and high adsorption capacity for carbon dioxide.
Therefore, in this study, activated carbon, activated alumina, molecular sieve 5A, and molecular sieve 13X, which have been used in fixed bed process, are used as dry sorbents to control carbon dioxide in a fluidized bed. In addition, the characteristics of CO2 adsorption and attrition of the dry sorbents are investigated. The objective of this study is to provide basic data for process development. Experimental
Apparatus and procedure for attrition experiment. Three-hole air jets used by Gwyn on the basis of a research of Forsythe and Hertwig2) were used to investigate attrition of dry sorbent with fluidization.
Air came from a compressor (Hanshin piston), moisture and particles in the air are removed, passing a trap, and mass flow controller (5850E, Brooks Co.) controlled air flow rate. The dry sorbents after the attrition were collected, and the particle sizes of them were measured by sieves of 60, 80, and 140 mesh size.
Apparatus and procedure for adsorption experiment. An
experimental fluidized bed reactor has a 6cm diameter and 95cm height, and the air box of the reactor has a 10cm height. The distribution plate was made to 3.11% fractional opening and 3mm thickness, considering pressure drop in the bed. The cyclone was made by standard proportion. This reactor was made from acryl.
Air flow rate was controlled by a flow meter, CO2 (99.9% ) flow rate was controlled by mass flow controller (5850E, Brooks Co.), and then 10% CO2 inlet concentration was maintained by mixing in a mixing chamber. CO2 outlet concentration was also measured by CO2 analyzer (Landfill Gas Analyzer), and the pressure in the reactor was measured by pressure sensors and analyzed by a computer program.
Results and Discussion The particle sizes of activated carbon were measured after the
fluidization for 0, 10, 20, and 30 hours at 10L/min gas flow rate to investigate the attrition characteristics with fluidization time. At each time point, the weight of particles remaining in 60 mesh sieves was 44.10g, 42.05g, and 41.07g, and the weight of carryover particles was 3.69g, 5.32g, and 5.90g, so the attrition of dry sorbents was considered to occur in the beginning of fluidization. Furthermore, carryover particles were considered as the standard to estimate attrition of dry sorbents because their particle sizes were less than 140 mesh size.
Figure 1. Particle size distribution of activated carbon with time at 10L/min gas flow rate.
Gas velocity is an important operating condition in the fluidized bed process, and it can highly affect the attrition of dry sorbents. Therefore, this study measured the weight remaining in the bed with fluidization time for a gas velocity of 20.59 cm/s, 25.74 cm/s, and 30.89 cm/s to estimate the attrition of dry sorbent with gas velocity. As shown in Fig. 2, attrition mainly occurred in the early stage of fluidization. The attrition rate decreased with time, and the regression equations fit natural log functions. In addition, Fig. 2 showed that the attrition of dry sorbents is highly affected by air velocity in the fluidized bed process.
y = - 3.20Ln(t) + 46.823y = - 1.94Ln(t) + 48.706y = - 1.45Ln(t) + 49.378
30
35
40
45
50
0 10 20 30 4Time
0(hr)
Rem
aini
ng w
eigh
t (g)
20.59cm/s25.74cm/s30.89cm/s
Figure 2. The remaining weight with time for attrition of 40/60mesh activated carbon.
Prepr. Pap.-Am. Chem. Soc., Div. Fuel Chem. 2004, 49 (1), 314
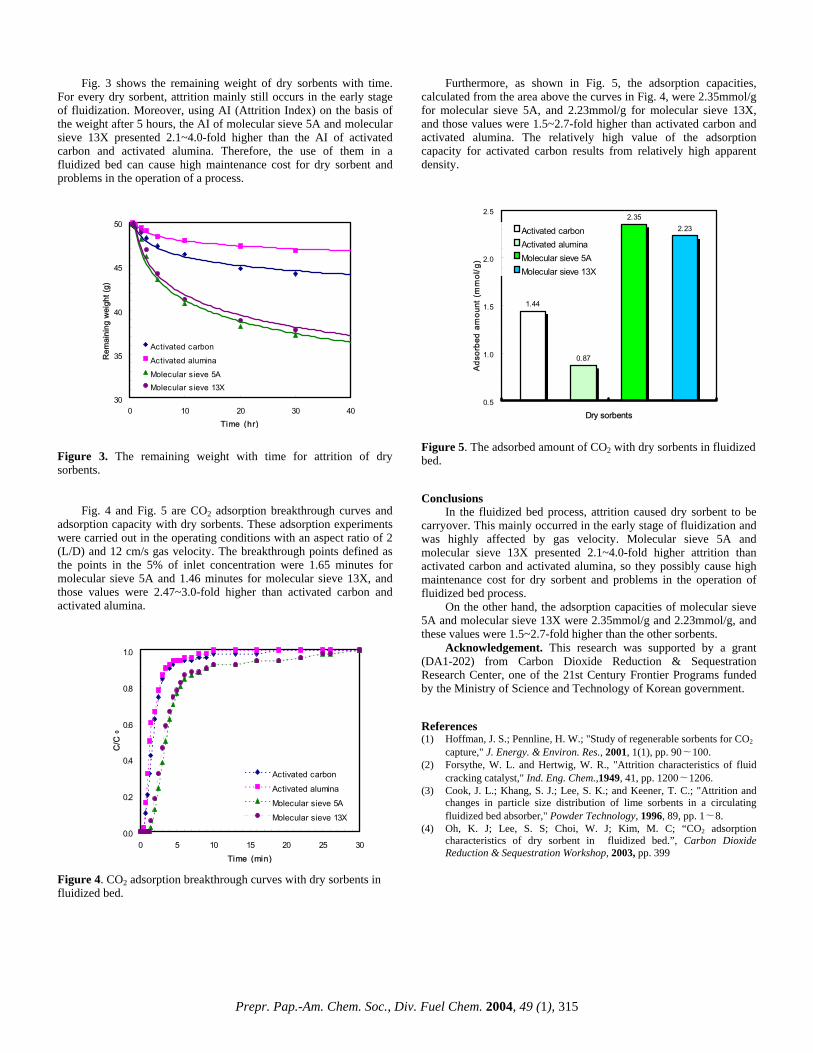
Fig. 3 shows the remaining weight of dry sorbents with time. For every dry sorbent, attrition mainly still occurs in the early stage of fluidization. Moreover, using AI (Attrition Index) on the basis of the weight after 5 hours, the AI of molecular sieve 5A and molecular sieve 13X presented 2.1~4.0-fold higher than the AI of activated carbon and activated alumina. Therefore, the use of them in a fluidized bed can cause high maintenance cost for dry sorbent and problems in the operation of a process.
30
35
40
45
50
0 10 20 30 4Time
0(hr)
Rem
aini
ng w
eigh
t (g)
Activated carbonActivated aluminaMolecular sieve 5AMolecular sieve 13X
Figure 3. The remaining weight with time for attrition of dry sorbents.
Fig. 4 and Fig. 5 are CO2 adsorption breakthrough curves and
adsorption capacity with dry sorbents. These adsorption experiments were carried out in the operating conditions with an aspect ratio of 2 (L/D) and 12 cm/s gas velocity. The breakthrough points defined as the points in the 5% of inlet concentration were 1.65 minutes for molecular sieve 5A and 1.46 minutes for molecular sieve 13X, and those values were 2.47~3.0-fold higher than activated carbon and activated alumina.
0.0
0.2
0.4
0.6
0.8
1.0
0 5 10 15 20 25 30Time (min)
C/C
0
Activated carbonActivated aluminaMolecular sieve 5AMolecular sieve 13X
Figure 4. CO2 adsorption breakthrough curves with dry sorbents in fluidized bed.
Furthermore, as shown in Fig. 5, the adsorption capacities, calculated from the area above the curves in Fig. 4, were 2.35mmol/g for molecular sieve 5A, and 2.23mmol/g for molecular sieve 13X, and those values were 1.5~2.7-fold higher than activated carbon and activated alumina. The relatively high value of the adsorption capacity for activated carbon results from relatively high apparent density.
1.44
0.87
2.352.23
0.5
1.0
1.5
2.0
2.5
Dry sorbents
Adso
rbed
am
ount
(m
mol
/g)
Activated carbonActivated aluminaMolecular sieve 5AMolecular sieve 13X
Figure 5. The adsorbed amount of CO2 with dry sorbents in fluidized bed. Conclusions
In the fluidized bed process, attrition caused dry sorbent to be carryover. This mainly occurred in the early stage of fluidization and was highly affected by gas velocity. Molecular sieve 5A and molecular sieve 13X presented 2.1~4.0-fold higher attrition than activated carbon and activated alumina, so they possibly cause high maintenance cost for dry sorbent and problems in the operation of fluidized bed process.
On the other hand, the adsorption capacities of molecular sieve 5A and molecular sieve 13X were 2.35mmol/g and 2.23mmol/g, and these values were 1.5~2.7-fold higher than the other sorbents.
Acknowledgement. This research was supported by a grant (DA1-202) from Carbon Dioxide Reduction & Sequestration Research Center, one of the 21st Century Frontier Programs funded by the Ministry of Science and Technology of Korean government. References (1) Hoffman, J. S.; Pennline, H. W.; "Study of regenerable sorbents for CO2
capture," J. Energy. & Environ. Res., 2001, 1(1), pp. 90∼100. (2) Forsythe, W. L. and Hertwig, W. R., "Attrition characteristics of fluid
cracking catalyst," Ind. Eng. Chem.,1949, 41, pp. 1200∼1206. (3) Cook, J. L.; Khang, S. J.; Lee, S. K.; and Keener, T. C.; "Attrition and
changes in particle size distribution of lime sorbents in a circulating fluidized bed absorber," Powder Technology, 1996, 89, pp. 1∼8.
(4) Oh, K. J; Lee, S. S; Choi, W. J; Kim, M. C; “CO2 adsorption characteristics of dry sorbent in fluidized bed.”, Carbon Dioxide Reduction & Sequestration Workshop, 2003, pp. 399
Prepr. Pap.-Am. Chem. Soc., Div. Fuel Chem. 2004, 49 (1), 315

DEVELOPING SEQUESTRATION BASELINES FOR THE WEST COAST
WEST COAST REGIONAL CARBON SEQUESTRATION PARTNERSHIP
Larry Myer
University of California Office of the President (UCOP) 1333 Broadway, Suite 240
Oakland, CA 94612 Fax: 510/485-5686; [email protected]
John Kadyszewski
Winrock International
John Clinkenbeard California Geologic Survey
Richard Rhudy
Electric Power Research Institute
John Ruby Nexant
Terry Surles
California Energy Commission Introduction The West Coast Regional Carbon Sequestration Partnership is one of seven partnerships established by the US Department of Energy (DOE) to evaluate carbon dioxide capture, transport, and sequestration (CT&S) technologies best suited for different regions of the country. The West Coast Region comprises Arizona, California, Nevada, Oregon, Washington, and Alaska. The Partnership will evaluate both terrestrial and geologic sequestration options through five major tasks:
1) Collection of data to characterize major CO2 point sources, the transportation options, and the terrestrial and geologic sinks in the region;
2) Addressing key issues affecting deployment of CS&T technologies, including permitting, monitoring, and health and environmental risks;
3) Conducting public outreach and education work; 4) Integrating and analyzing data to develop supply
curves and cost effective, environmentally acceptable sequestration options;
5) Identifying appropriate terrestrial and geologic demonstration projects in the Region
In order to address the broad range of issues associated with carbon sequestration, the Partnership has assembled a diverse consortium of state natural resource, environmental protection, and other agencies; national labs and universities; private companies working on CO2 capture, transportation, and storage technologies; nonprofit organizations; commercial users of CO2 such as the oil and gas industry; policy/governance coordinating organizations; and others. Characterization of Source and Sinks Characterization of the CO2 sources and sinks in the region provides the baseline data needed for analyses of best storage options. Overall, the West Coast region represents more than 11% of the nation’s CO2 emissions. As shown in Figure 1, a majority of the region’s total CO2 emissions come from the transportation,
industrial, and utility sectors. Terrestrial sinks, both forests, and soils, represent the most tractable sinks for dispersed transportation sources. Geologic storage is an option for the utility and industrial sectors, which have point sources most amenable to capture. Data collected by the IEA Greenhouse Gas Program show that these sectors account for about 56 million metric tons of carbon equivalent (MMTCE) per year in the five states shown in Figure 1. The North Slope of Alaska accounts for an additional amount of about 4MMTCE. The partnership is identifying the major individual point sources in the West Coast region by reviewing available data on power producers, cement manufacturers, oil refiners, and other energy intensive industries. In addition to location and amount of CO2, collected data includes: plant efficiency performance factors; operations schedule and capacity; description of major components and equipment; energy and other resource consumption; and sources for major plant inputs.
0.00
10.00
20.00
30.00
40.00
50.00
60.00
Arizona California Nevada Orgeon Washington
CommercialIndustrialResidentialTransportationUtilities
Figure 1. Western Region CO2 Emissions, 1999 MMTCE Porous sediments, which represent potential geologic sequestration sites, are found in most of the physiographic provinces within the West Coast partnership region. The Pacific Coast Province is of prime interest, because of its thick sediment sequence and oil and gas fields, which are found primarily in California’s Central Valley. The North Slope of Alaska is also of great interest because of its large oil fields. Oil and gas fields in the West Coast Region not only provide large potential capacity, but also provide an opportunity for offsetting costs of sequestration through enhanced oil and gas recovery. Extensive geologic characterization data is also available in oil and gas producing areas. Characterization data including depth, thickness, areal extent, porosity, formation water salinity and total dissolved solids, permeability, pressure, and degree of fracturing is compiled in a Geographic Information System (GIS) layer showing sedimentary basins. This layer is combined with other layers containing data on active faults, urban areas, transportation routes, point source locations, restricted lands, etc, to enable spatial analysis of potential sequestration targets. The West Coast region has a wealth of forest and agricultural lands where improved management practices could sequester substantial quantities of carbon. For forests, the partnership is
Prepr. Pap.-Am. Chem. Soc., Div. Fuel Chem. 2004, 49 (1), 346

focused on three major types: (1) the Pacific Coast forests of northern California, Oregon, and Washington; (2) the Inland Empire forests of eastern Washington and Oregon and the north and central portions of California’s Sierra Nevada range; and (3) the ponderosa pine and pinyon-juniper woodlands of California’s southern Sierra Nevada as well as Nevada and Arizona. The region also includes extensive man-made grasslands that could be reforested.
To characterize the terrestrial sink, the partnership is developing a baseline for each state based on data for the 1990s. The carbon data for land use/land cover classes comes primarily
from national data sets collected using common definitions and methods. Results are reported by land classes, and displayed in map format. Data types integrated into the partnership’s GIS database include: land use, land cover and land suitability, hydrology and water districts, land ownership and tax assessments, soil maps, crop yields by county and income per acre by crop type (STATSGO and USDA), remote sensing (EROS Data Center), National Gap Analysis Program information, national forest inventory and forest heath plots, national resource inventory, and risk of loss (flood zones, fire maps, pest outbreaks, etc).
Prepr. Pap.-Am. Chem. Soc., Div. Fuel Chem. 2004, 49 (1), 347
UTILIZATION OF MACRO-ALGAE FOR ENHANCED CO2 FIXATION AND ENERGY PRODUCTION
Michele Aresta, Angela Dibenedetto and Grazia Barberio
Department of Chemistry, University of Bari
Campus Universitario – 70126 Bari - Italy Introduction
The aquatic biomass represents a very interesting source of energy as it has a higher photosynthetic activity with respect to terrestrial plants, an easy adaptability to grow in different conditions, the possibility of growing either in fresh- or marine waters, avoiding the use of land. Either marine micro-algae or sea-weeds could be used as energy source also if the micro-algae have received much attention with respect to the macro-algae.
In this paper we discuss the use of selected Mediterranean macro-algae as source of biofuel. The extraction of oils and biofuel has been carried out using different technologies under mild energetic conditions. Supercritical-carbon dioxide and solvent extraction has been used efficiently to extract the fuel. The SC-CO2 extraction is quite advantageous. SC-CO2 is not toxic and, as its critic temperature is quite close to room temperature, it could be also used for the extraction of thermo-labile compounds. A preliminary balance, energetic and economic, will be also presented.
Particular attention has been dedicated to the preparation of samples for extraction in order to ameliorate the efficiency of the process, and to the characterization of the lipidic content. Results and Discussion
The key step of this work has been the selection of some algae typical of the Adriatic or Jonian sea. In particular, the study has been carried out on two algae, the Chaetomorpha linum (O.F. Müller) Kützing (Cladophorales, Cladophoraceae) and the Pterocladiella capillacea (S.G. Gmelin) Santelices et Hommersand) (Gelidiales, Rhodophyta). Chaetomorpha linum is the dominant species in the bentopleustophytic population of Mar Piccolo in Taranto (Jonian sea), the latter being very much present in the estuary of the Galeso river where it can reach a density of 3 600 g/m2. P. capillacea, a very good agarophyte, can be found on the rocky substrates in the South Adriatic sea close to Bari and can reach a density of 1 500 g/m2. Going 150 km further south in the Adriatic sea, it is still present, but in lower amount.
The two species have been selected because of their easy availability and low cost harvesting technology, presence and vegetation all the year long, growth on a large scale in an artificial environment, high percent of compounds that have a potential use as biodiesel.1
The effect of several parameters such as biomass production in presence of nitrogen sources, ratio biomass/volume, salinity, temperature and irradiance have been also considered.1
In this work, a methodology has been developed for the extraction of biodiesel from algae. Supercritical carbon dioxide has revealed to be particularly suited as extraction solvent. A quali- quanti-tative comparison of the extracts obtained by using this technique with those obtained using the organic solvent extraction has been carried out. The scCO2 technique revealed to be more efficient and less costly. By using scCO2 (40-50 °C, 25-30 MPa) in a SITEC apparatus operated in a continuous mode, the extraction of oil from algae has been carried out using either scCO2 alone or added with methanol (1 mL) as co-solvent.
In order to have an efficient extraction it is necessary to pre-treat the algae. In fact if they are used as collected, no oil is extracted. Among the various techniques, grounding of the dried (at
35 °C) algae in liquid nitrogen is the most effective. The very fine solid obtained, can be extracted under the conditions specified above. Per each sample the amount of extracted oil has been determined per kg of dry matter. The oil content varied from 7 to 20 %. Then the oil has been analysed by CG-MS and its composition determined. Almost all products in the GC were identified so far (96 % of the total) and the mass spectrum of each product was compared with that of an authentic sample used as standard. This has allowed to identify the components of the oil and to calculate the heat content expressed as MJ/kg oil. Such value has been checked through a combustion test. Such studies have shown that the morphological difference of the two algae is associated to a different lipid content, both quantitative and qualitative. In fact, in C. linum methyl myristate, methyl palmitate, methyl linoleate and methyl oleate were found, while P. capillacea was shown to contain besides methyl myristate and methyl palmitate, methyl arachidonate and methyl-all-cis-5,8,11,14,17 eicosanpentaenoate as major components (see Table 1).
Table 1. Principal compound of the oil
Algae Pressure (bar)
T (°C)
Esters (methyl) Lipidic content (%)
Chaetomorpha linum
240 50 myristate, palmitate, linoleate, oleate
15
Pterocladiella capillacea
265 50 myristate, palmitate, arachidonate, all-cis-5,8,11,14,17 eicosanpentaenoate
7.5
Studies are still in progress for the complete characterisation of
the extract. A life cycle assessment study has been initiated for the
evaluation of the potential of macro-algae for fuel production. Below we discuss the main compounds of the LCA flow-sheet.
Macro-algae need nutrients (N, P, microelements) to which the energy Enu is associated. The cultivation energy is indicated as Ec. A variance analysis has shown that if the energy of nutrients is taken into consideration, the energetic balance may be negative. Therefore, in order to avoid such huge amount of energy input, either effluent water from aquaculture plants should be used, or some selected municipal waters. Algae work as a purifying agent and treated water can be either re-circulated to the fish-pond or immitted into natural basins without paying any penalties. Such use of effluent water, by the way, generates a credit to the process that may be ultimately taken into account. With respect to micro-algae, macro-algae do not need a vigorous stirring. This difference introduces a credit for the macro-algae system when compared to micro-algae. At the end, algae must be harvested, Er. As macro-algae grow either on a solid substrate or free-floating in water, in the former case it is necessary to cut the algae, Eh. The collection is quite easy as it is possible to install a net that when risen allows to collect algae and to let excess water run-off. Also this step is less energy requiring for macro-algae than for micro-algae, that need filtration for their separation. The drying is made by using solar energy or recovered heat, so that the only requested energy is the transfer and mixing, Ee. Once the algae are dried, they need to be pre-treated for the extraction, Epr. Alternatively, algae can be directly used without drying, by using the anaerobic fermentation. As extraction techniques, here the extraction with scCO2 (Esc) or organic solvents (Eos) have been considered. The utilization of scCO2 as solvent for the extraction appears quite interesting, as recovered carbon dioxide can be used, making the whole process solvent-free. Comparing the two extraction techniques, it comes out that the energy required for the sc technique is the compression of
Prepr. Pap.-Am. Chem. Soc., Div. Fuel Chem. 2004, 49 (1), 348
CO2 and heating to 40-50 °C. Therefore the thermal energy input is much lower than using the extraction with solvents. Moreover, by using organic solvents it comes out that the isolation of the oil at the end of the extraction, is much more energy requiring than using scf. In the latter case, it is enough to decompress the gas for isolating the oil. As the scf technique uses a continuous extraction apparatus with recovery of gas, this method appears to be characterized by a lower energy than the organic solvent extraction, and to be more environmentally friendly than the use of solvents. In order to be able to make a correct energetic balance, the extracted oil has been fully (over 96% of the components) characterized for its components. The energetic content has been estimated by using an equation that considers the nature of the components and their heat of combustion, so that the net energy produced by the oil can be calculated (Eq. 1).
∆H = 3500 + 650 ∆n + (a ) kJ mol-1 (1) This value has been checked using a combustion bomb. The
global balance of the process takes into account all the energy inputs and the produced energy. (Eq. 2)
(Eric)+Eb+Ers-Ets-Esa (Escr)-Ed (Ed’)-Ec-Enu-Er-Eh-Ee-Epr- Esc(Eso)-Ees=Enet (2)
Enet indicates the net energy recovered. In Equation 2 the first
three terms represent the recovered energy, while others are spent energy. The first term is eventually the energy recovered from the hot flue gases that arrive to the algae pond may be very low. Eb is the energy associated to the solid residue (cellulose). Ets is the energy needed for transportation of the gas from the source, Esa is the energy for separation using monoethanolamine (Escr is the separation energy using the cryogenic technology), Ed is the energy of distribution of gas (Ed’ is the energy of distribution in case of non separated flue gas). Ec is the energy of cultivation and other terms have the same meaning as in the text. Such contribution is not included in calculations.
General considerations and process data. So far, all energetic quantities listed above have been collected.
Moreover, data relevant to alternative processes for algae treatment have been gathered, these are reported below for a comparison of technologies. Micro-algae have growing costs much higher than macro-algae. In this study CO2 is recovered using MEA, we assume that nutrients have not to be added, that the pond is at a maximum distance of 5 km from the source, that treated water from fish ponds is re-circulated to the fish pond. Algae from Jonian or Adriatic sea have been used.
The following balance is possible:
Biofuel energy 22-35 MJ/kg dw Total energy produced 16-20 MJ/kg dw Total energy spent for the production and harvesting 11-15 MJ/kg dw Net energy recovered 5-9MJ/kg dw. Comparison system Such data can be compared with some literature data Gasification of micro-algae: energetic input 10.48 MJ/kg dw; energy produced 17.77 MJ/kg dw; net energy 6.29 MJ/kg dw Combustion of algae: 3.55 MJ/kg dw
The combustion is the technology that generates less energy, also if it is the most direct. Therefore, it looks like the cultivation of macro-algae for the production of biofuel is a technology that has to be taken into consideration for energy production and carbon
recycling. Such data are only the first output and need revision and all steps need optimisation and an up-scaling of the process is necessary. For such study both a longer time and a higher investment are necessary. The treated aspects are very interesting if coupled with aquaculture activities that are very common in Italy.
Acknowledgement. Financial support by CNR, Project CNRC008EBF is gratefully acknowledged. References (1) Final Report, Project CNRC008EBF - CNR AGENZIA 2000.
Prepr. Pap.-Am. Chem. Soc., Div. Fuel Chem. 2004, 49 (1), 349

FE/CO2 FUEL CELLS FOR CO2 CAPTURE AND SEQUESTRATION PLUS H2 AND ELECTRICITY
PRODUCTION
Greg H. Rau
Institute of Marine Sciences, University of California, Santa Cruz, CA 95064
andEnergy and Environment Directorate, Lawrence Livermore National
Laboratory, Livermore, CA 94550 Introduction
Satisfying an increasing global demand for energy while stabilizing the atmospheric CO2 concentration may be the greatest societal and technological challenge of the 21rst century.1 In this context a range of potential CO2 capture/sequestration technologies have been proposed2, yet their capacity, economics, practicality, and/or environmental impacts have thus far proven to be impediments to large-scale application. Because of their abundance and important role in the global carbon cycle, carbonates (inorganic compounds containing the -CO3 moiety) have been studied as possible long-term storage forms for CO2.3 The conversion of CO2 into solid carbonates via reactions such as: XO + CO2 XCO3 (X=divalent metal) present one such mechanism, but reaction rates with CO2 are exceedingly slow unless additional energy (heat and/or pressure) is introduced. The conversion of metal oxides to hydroxides and subsequent reaction with CO2 has also been considered, but the cost of chemically forming such hydroxides (rare in nature) appear to be prohibitive. Thus, despite their desirability as stable CO2 reservoirs, cost and other factors have proven to be impediments to the formation of solid carbonates as a CO2 capture/ sequestration strategy.
However, it has been recognized in the geologic CO2 sequestration field (i.e., subterranean injection of CO2) that certain geochemical conditions can exist where the formation of FeCO3 would be favored and could provide a stable trap for CO2 injected underground.4 Also, the oxidation of iron metal in the presence of CO2 is well known.5,6 This proceeds by the reaction:
Fe0 + 2CO2 + 2H2O Fe2+ + 2HCO3- + ↑H2 (1)
which can further lead to the precipitation of a solid carbonate via pH elevation (e.g., removal of excess CO2):
Fe2+ + 2HCO3- ↓FeCO3(s) + ↑CO2(g) + H2O. (2)
The net reaction is then: Fe0 + CO2 + H2O ↓FeCO3(s) + ↑H2. (3) Given the abundance of Fe in nature (globally, 4rth most
abundant element) and as a waste metal (US scrap iron production = 107 tones/year, ref. 7), it is worth considering purposeful, aboveground iron carbonate formation as a CO2 sequestration tool. Additionally two valuable by-products can be produced from reaction 1, electricity and hydrogen. Because 2 moles of electrons are transferred per mole of Fe reacted and H2 formed, electricity could be made to flow between a reactive anode (Fe0) and a non-reactive cathode (e.g. graphite); the anodic reaction being Feo Fe2+ + 2e- and the cathodic reaction being 2CO2 + 2H2O + 2e- H2 + 2HCO3
-. Assuming a conservative Fe reaction rate of 10-5 moles m-2 s-1, a cell current density of 1.9 A m-2 is calculated. The cell potential of 0.44V leads to a power generation of 85kW per mole Fe reacted s-1, or about 421 kWhe per tonne Fe reacted hr-1. Such energy production is confirmed by voltage and current densities generated in experimental iron corrosion studies (Figure 1).
0.460.440.420.400.380
2
4
6
8
10
12
14
-2
-1
0
1
2
3
4
Cell Voltage
Cur
rent
den
sity
A
m^-
2
Pow
er d
ensi
ty
wat
ts m
^-2
current
power
Figure 1. Trends in voltage vs current and power densities in a galvanic cell composed of an unalloyed steel anode in an oxygen-free electrolyte solution saturated with CO2 at 298˚K (ref. 5). Fuel Cell Scenarios, Issues, and Concerns
It is envisioned8 that reaction 1 would occur in vessels or cells in which anodes produced from waste iron and cathodes composed of an appropriate conducting material (e.g., graphite) are submerged in a carbonic acid electrolyte formed by the continuous hydration of waste CO2 with water. Hydrogen gas and electricity would be produced from such cells while the electrolyte would be continuously or sporadically bled off and the iron carbonates, Fe(HCO3)2 or FeCO3, concentrated or removed. Possible fuel cell design considerations and operating procedures are further considered below.
The electrodes. Due to cost and the carbon intensity of production, scrap rather than new iron or steel would be preferred as anode material.8 Waste car bodies might be appropriate given their relatively uniform size, metallurgical composition, and abundance.9 However, the use of anti-corrosion coatings and non-Fe components in automobiles would require preparation of the scrap bodies via sanding, chemical treatments, or other processes, as well as forming the scrap into useable anodes. The cathodes need only be conductive to electricity and are not consumed in the fuel cell. However, the performance of the cathodes could degrade over time due to ancillary chemical reactions or fouling. The use of graphite is suggested here, but the performance and cost/benefit of using other materials need to be evaluated.
The electrolyte. The electrolyte would be formed by contacting waste CO2 with water by bubbling the gas stream through the water, by spraying water in the gas stream, or by some other means that is energetically efficient and cost-effective in hydrating CO2, thus forming a carbonic acid solution. This acid formation could occur within the fuel cell or upstream from it. The higher the CO2 content in the gas the higher the equilibrium carbonic acid concentration in electrolyte and hence the higher reaction rates. It may be cost-effective to pressurize the gas stream or electrolyte head space in order to increase carbonic acid concentration, reaction rates, and hence the volume density of H2 and electricity generation and CO2 mitigation. The purity of the CO2 waste gas stream could also be an issue, where contaminants such as SOx, NOx, heavy metals, etc., common in the gas effluent from coal and oil combustion, could interfere with (or enhance?) reactions 1-3. These contaminants could also affect the quality of the downstream H2 and liquid and solid wastes from the fuel cell. Use of relatively clean CO2 waste gas streams from natural gas combustion or gasification could avoid these potential problems. Waste gas from gasification/steam reforming plants and power generators would be especially attractive
Prepr. Pap.-Am. Chem. Soc., Div. Fuel Chem. 2004, 49 (1), 350

because of its high CO2 content and very low or no O2, features that would depress electrolyte pH and Eh in equilibrium with such gas, thus maximizing Fe solubilization and minimizing the formation of iron oxides.
With at least 0.3 tonnes of H2O consumed per tonne Fe reacted, the source, quality, and cost of water are issues for fuel cell operation. Sources of water might include municipal, industrial, or recycled supplies, provided that the contaminants or additives they contain, such as chlorine, do not impede reactions 1-3. On the other hand, the addition of chemicals to the electrolyte such as acids and salts (or use of seawater), known to increase Fe solubility and to reduce anode passivation by FeCO3 deposition5,6, might enhance fuel cell performance and prove cost effective.
Products, carbon sequestration, and waste streams. The H2 generated at the cathode could be harvested and stored by employing conventional methods used in the production of H2 via electrolysis. It is unknown what purity and concentration of H2 might be achievable, and these issues could affect the end-use and marketability of the hydrogen.
The electricity produced per cell would be low-voltage direct current, requiring multiple cells in series as well as current inversion in order to conform to conventional electrical grid requirements of high voltage AC. An attainable cell power density of about 20 kW m-3 is crudely estimated based on that of possibly analogous Fe/air electrochemical cells (40 kW m-3, ref. 10), reduced by 50% considering the likely volume and packing inefficiencies posed by the unconventional anode material proposed. Thus, a battery composed of a minimum of 250 cells in series, each 2 m x 2 m x 2 m (1000 m2 total battery area) would be needed to generate 40,000 kW at 110 VDC. Inverting this to AC would probably reduce power output by some 20%. Also, varying the load or resistance across the electrodes could modulate the flow of electrons and thus reaction rates within the cells. In the extreme case, close-circuiting the electrodes would forego electricity use, but maximize Fe(HCO3)2 and H2 production rates.
The sequestration of carbon could be achieved either through the formation of dissolved Fe(HCO3)2 (reaction 1), or dissolved or solid FeCO3 (reaction 2). The former compound captures twice the carbon as does the later carbonate, thus doubling the sequestration benefit per tonne Fe reacted. A further sequestration benefit could result by disposing of the dissolved iron bicarbonate in certain areas of the ocean where photosynthesis and hence CO2 conversion to biomass is Fe-limited. In such regions the tonnes of CO2 sequestered per tonne Fe2+ added has been observed to exceed 20,000:1 (ref. 11), which if realized would dominate the economics of Fe/CO2 fuel cell operation if a market/societal value of $10/tonne CO2 sequestered (or even if DOE’s target of $2.73/tonne, ref. 2) were in place.
Alternatively, spent electrolyte containing dissolved iron bicarbonate/carbonate could be injected/stored underground or the solid iron carbonate precipitated from it. The latter would occur spontaneously as the excess CO2 in the solution degassed to the atmosphere, thus increasing the pH and saturating the solution with CO3
2-. Once the FeCO3 had been precipitated some care would be needed in storing this solid in order to avoid its slow oxidation via exposure to air and hence CO2 loss. Conceivably, the carbonate would be precipitated from the electrolyte downstream from the fuel cell with the water recycled for further electrolyte use. The ultimate storage site for solid carbonates in the context of CO2 sequestration could include abandoned mines or specially dug burial sites3, or at the bottom of large water bodies containing low or no O2 which presumably could preserve the iron carbonate indefinitely.
Economics To calculate the net cost or income from Fe/CO2 fuel cells, the
following costs (per tonne Fe) were assumed8: scrap Fe=$85, anode finishing=$15, and other capital, operating and maintenance=$35, for a total investment of $135. Gross income would include: hydrogen=$129, electricity=$21, and carbon mitigation=$13, with total income=$163. This assumes the following product market values: $3,600/tonne H2, $0.05/kWe, and $10/tonne CO2 avoided. A net income (total gross income – total costs) of $28/tonne Fe reacted or $34/tonne CO2 mitigated is thus calculated. Such a profit estimate is, however, extremely uncertain given that the performance and operating requirements of Fe/CO2 fuel cells in the preceding context have not been demonstrated. If accurate, a net profit of >$30/tonne CO2 mitigated is significantly better than DOE’s 2008-2012 sequestration cost targets of $2.73/tonne CO2 for non-point-source methods and “...less than a 10% increase in the cost of energy services...” for direct capture and sequestration approaches.2 This income could therefore provide an important economic incentive for sequestration, while at the same time generating H2 and electricity free from new atmospheric CO2 emissions.
Summary and Conclusions
Fe/CO2 fuel cells pose several advantages over existing carbon mitigation strategies. They could provide a way of producing H2 and electricity in a manner that consumes rather than generates CO2, unlike current commercial methods. At the same time they convert waste CO2 and iron metal into a relatively inert carbon-containing solute or solid that is amenable to verification, long-term storage, and monitoring, important objectives for any CO2 sequestration strategy.2 The estimated market value of the H2 and electricity produced (>$180/tonne CO2) raises the possibility that this economic benefit could help drive the implementation of this process. However, such a profit motive for Fe/CO2 fuel cell utilization critically hinges on accurately determining its capital and operating costs and the market value of the products produced. Is it possible that Fe/CO2 fuel cells could provide a means of consuming part of industrial society’s waste CO2 and iron while generating “CO2-free” H2 and electricity, motivated by economics rather than or in addition to regulatory taxes/incentives? References (1) Hoffert, M. I.; Caldeira, K.; Benford, G.; Criswell, D. R.; Green, C.;
Herzog, H.; Jain, A. K.; Kheshgi, H. S.; Lackner, K. S.; Lewis, J.S.; Lightfoot, H. D.; Manheimer, W.; Mankins, J. C.; Mauel, M. E.; Perkins, L. J.; Schlesinger, M. E.; Volk, T.; Wigley, T. M. L., Science 2002, 298, 981-987.
(2) DOE. Carbon sequestration project portfolio FY 2002, U.S. DOE/NETL, Wash. D.C. http://www.netl.doe.gov/coalpower/sequestration/pubs/ Carbon%20Sequestration%20Project%20Portfolio.pdf
(3) Lackner, K. S., Ann. Rev. Energy Environ., 2002, 27, 193-232. (4) Gunter, W. D.; Perkins, E. H.; Hutcheon, I., Appl. Geochem., 2000, 15,
1085-1095. (5) Hasenberg, L. In Dechema Corrosion Handbook: Corrosive Agents and
Their Interaction with Materials, Vol. 3; Behrens, D., Ed.;, VCH: New York, 1988; pp. 159-209.
(6) Kermandi, M. B.; Morshed, A., Corrosion, 2003, 59, 659-83. (7) U.S. Geological Survey., Mineral commodity summaries – iron and steel
scrap, http://minerals.usgs.gov/minerals/pubs/commodity/iron_&_steel_ scrap/360303.pdf
(8) Rau, G. H., Energy Convers. Manag., (in press). (9) Dandapani, B.; Bockris, J.O’M., J. Hydrogen Energy, 1986, 11, 101-105. (10) Brodd, R. J., In Handbook of Batteries and Fuel Cells; Linden, D., Ed.;
McGraw-Hill: New York, 1984; pp. 20.17-20.20. (11) Buesseler, K. O.; Boyd, P. W., Science, 2003, 300, 67-68.
Prepr. Pap.-Am. Chem. Soc., Div. Fuel Chem. 2004, 49 (1), 351

VALUABLE AND STABLE CARBON CO-PRODUCT FROM FOSSIL FUEL EXHAUST SCRUBBING
Danny Day1, Robert J. Evans2, James W. Lee3, and Don Reicosky4
1Eprida, Inc., 6300 Powers Ferry Road, Suite 307, Atlanta,
GA 30339, [email protected] Renewable Energy Laboratory, 1617 Cole Blvd, Golden,
CO, 80401, [email protected] Ridge National Laboratory, 4500N, A16, MS-6194, Oak Ridge,
TN 37831, [email protected] Research Service, 803 Iowa Avenue, Morris,
MN 56267 [email protected] Introduction: A Sustainable Carbon Sink With Hydrogen Production
The increasing anthropogenic CO2 emissions and possible global warming have challenged the United States and other countries to find new and better ways to meet the world’s increasing needs for energy while reducing greenhouse gas emissions. The need for sustainable energy with little greenhouse gas emissions has lead to demonstration work in the production of hydrogen from biomass through steam reforming of pyrolysis gas and pyrolysis liquids. Our research to date has demonstrated the ability to produce hydrogen from biomass under stable conditions.[ ]1 Future large-scale renewable hydrogen production using non-oxidative technologies will generate co-products in the form of a solid sequestered carbon. This char and carbon (“C”) material represent a form of sequestered C that decomposes extremely slow[ ]2 and retains the bio-capture CO2 for centuries. The limitation of the use of this form of carbon is a profit centric use. It was apparent that additional value needed to be added to this material that would justify large-scale handling and usage. In 1990s, C in the form of CO2, accumulated at rates ranging from 1.9 to 6.0 Pg C/yr and increasing CO2 levels by 0.9 to 2.8 ppm/yr. [ ]3 . The volume of waste and unused biomass economically available in the United States is over 314 gigatons per year [ ]4 . Sequestering a small percentage as valued added carbon could significantly reduce the atmospheric loading of CO2 while simultaneously producing hydrogen. Normally hydrogen is referred to as a zero emissions fuel, however from life cycle perspective it can be viewed as a negative emissions fuel. In order to accomplish this economically, the sequestered C must have a very large and beneficial application such as a soil amendment and/or fertilizer.
The concept of utilizing charcoal as a soil amendment is not new. Man-made sites of charcoal rich soils intermingled with pottery shards and human artifacts have been identified covering 50,000 hectares of the Central Amazon rainforest each averaging 20ha and the largest at 350ha. [ ]5 The radiocarbon dating of the sites have shown ages dating back 740–2,460 years BP[ ]6 and 30% of the soil organic matter is made up of pyrolytic black carbon which is 35 times higher than the adjacent poorer quality soils (Oxisols) [ ]7 . Most terra preta sites are identified by their thick black layers of soil (40-80cm) and some have been found in layers up to 2 meters thick[ ]8 . These soils are so rich and fertile that they are dug up and sold as potting soil[ ]9 . The current agricultural methods of the Kayapó (an ancient people with little European contact until the 19th century) has changed little and give evidence to the man-made techniques (slow burning fieldsand biomass) for creation of this fertile and sustainable method of agriculture which can be farmed intensively for up to 11 years . [ ]10 This ability to farm soils without fertilization for many years is an anomaly in the rainforest. Despite the abundance of rainforest growth, their red and yellow soils are notoriously poor: weathered, highly acidic, and low in organic matter and essential nutrients.
Experimental Project Description The approach [ ]11 in our research applies a pyrolysis process that has been developed to produce charcoal like by-product and synthetic gas (containing mainly H2, and CO2) from biomass, which could come from both farm and forestry sources. In this novel system [ ]12 , a portion of the hydrogen is used to create ammonia where economical, or ammonia is purchased leaving hydrogen for fuel utilization. The ammonia is then combined with the char, H20 and CO2, at atmospheric pressure and ambient temperature to form a nitrogen enriched char. The char materials produced in this process contains a significant amount of non-decomposable carbons such as the elementary carbons that can be stored in soil as sequestered C. Furthermore, the carbon in the char is in a partially activated state and is highly absorbent. Recent research has shown that lower temperature charcoal produced at 500°C adsorbed 95% of ammonia versus charcoal produced at 700°C and 1000°C which had higher surface areas but only adsorbed 40%[ ]13 . Masada noted that acidic functional groups such as carboxyl were formed from lignin and cellulose at 400°C -500°C. [ , ]14 15 . Charcoals, regardless of biological source, were found to form acidic functional groups at these temperatures which will preferentially adsorb base compounds such as ammonia and that the chemical adsorption plays the primary role over surface area. This research points to the carbonization conditions as a key ingredient in optimizing a charcoal as a nutrient carrier and binding compound for ammonia. Thus when used as a carrier for nitrogen compounds (such as NH4
+, urea or ammonium bicarbonate) and other plant nutrients, the char binding forms a slow-release fertilizer that is ideal for green plant growth. A combined NH4HCO3-char fertilizer is probably the best product that could maximally enhance sequestration of C into soils while providing slow-release nutrients for plant growth.
A flue gas scrubbing process [ , ]16 17 utilizing hydrated ammonia was tested in combination with a low temperature char. This approach utilized a chemical process, to directly capture greenhouse gas emissions at the smokestacks by converting CO2, NOx, and SOx emissions into valued added fertilizers (mainly NH4HCO3, ~98% and (NH4)2SO4 and NH4NO3, <2%). These fertilizers can potentially enhance crop growth for sequestration of CO2 and reduce NO3
– contamination of groundwater. As discussed above, the low temperature charcoal forms surface acid groups, which adsorbs and binds ammonia to the porous media for nucleation of CO2. When used as a scrubbing agent with fossil fuel exhaust, a mechanically fluidized cyclone creates a fertilizer-matrix with a commercially acceptable amount of nitrogen and a high percentage of very stable C. In addition, the inorganic carbon component (HCO3
-) of the NH4HCO3 fertilizer is non-digestible to soil bacteria and thus can potentially be stored in certain soil (pH > 7.9) and subsoil terrains as even more sequestered C. This community-based solution operates as a closed loop process, integrating C sequestration, pollutant removal, fertilizer production, increased crop productivity and restoration of topsoil through the return of carbon and trace minerals. The benefits of producing a value added sequestering co-product from coal fired power plants and other fossil energy producing operations, can help bridge the transitions to clean energy systems that are in harmony with the earth’s ecosystem. [ ]18 An important benefit of this approach to the power industry is that it does not require compressors or prior separation of the CO2. The use of biomass in combination with fossil energy production, can allow agriculture, and the agrochemical industry infrastructure to assume a more holistic relationship of mutual support in helping each meet Kyoto greenhouse gas reduction targets.
The char component of the material acts to provide the same benefits as in terra preta sites reducing the leaching of soluble nutrients.[ ]19 This increases plant growth, nutrient uptake and reduces nitrogen runoff. One experimental goal of the project was to identify
Prepr. Pap.-Am. Chem. Soc., Div. Fuel Chem. 2004, 49 (1), 352
process parameters that would produce a carbon material optimized for agricultural use. Since it has been shown that the that charcoal addition from 2000 years ago is still providing significant soil fertility benefits [ ]20 and farmers report up to three times crop yields over immediately adjacent non-terra preta soils. Recent research, conducted by Steiner, on the addition of charcoal to non terra preta soils [ ] 21 showed significant crop yield increases.
Charcoal has been found to support microbial communities [ ]22 even greater than activated carbon (which is charcoal processed at higher temperatures with steam). Prior researchers assumed that the porous structure provided safe haven but we propose that it may be the availability of microbial nutrients. The processes of pyrolysis create an intrapore deposition of organic polycondensates[ ]23 .The deposition of these materials may increase microbial activity. [ ]24
Experimental Set-up and Results: SEM Investigation of a Low Temperature Char
The low temperature char particles are hydrophobic in nature and grind easily. The internal gases that escape from the material during the charring help develop charcoals natural porosity. The evolution of this adsorbent material provides a porous internal structure as well. We selected 400 oC as the target temperature for the char before being discharged from the pyrolysis reactor. The resulting char was cooled for 24 hours then fed through a two-roll crusher and then sieved with a mechanized screen through 30 mesh and 45 mesh screens. The resulting fraction remaining above the smaller screen was chosen as our starting material. Experimental Set-up & Results: SEM Investigation of an Enriched Carbon, Organic Slow-release Sequestering (ECOSS) Fertilizer
Bench scale demonstrations by Oak Ridge National Laboratory recently demonstrated the removal of flue-gas CO2 via formation of solid NH4HCO3 through ammonia carbonation in the gas phase. [ ]25 The results indicated that it is possible to use NH3+ H2O+CO2 solidifying process in gas phase to remove greenhouse-gas emissions from industrial facilities such as a coal-fired power plant. A study of agriculturally optimized charcoal produced by Eprida were combined with the above process created via the sequestration of a CO2 stream. It was proposed that the char could act as a catalyst (providing more effective nucleation sites) to speed up the formation of solid NH4HCO3 particles and enhance the efficiency of the gas phase process. A pilot demonstration was constructed to evaluate production and material characteristics of the NH4HCO3-char product. The process also showed promise that it could remove SOx and NOx, enhance sequestration of carbon into soils; providing an ideal “Enriched Carbon, Organic Slow-release Sequestering” (“ECOSS”) fertilizer and nutrient carrier for plant growth. The value would be enhanced if the production of NH4HCO3 could be developed inside the porous carbon media.
To test the production of a charcoal- NH4HCO3 fertilizer, we used a mechanical fluidized cyclone, easily adaptable to any gas stream and injected CO2, and hydrated ammonia. A 250g charge of 30-45 mesh 400 oC char was fed in at regular intervals varying from 15-30 minutes. A higher rotor speed increased the fluidization and suspended the particles until they became too heavy from the deposition of NH4HCO3 to be supported by fluidized gas flows. SEM Investigation of the Interior of an ECOSS-15 Char Particle
The material produced was evaluated by scanning electron microscopy. The examinations revealed The very small molecules of NH3.H2O (hydrated ammonia) are adsorbed into the char fractures and internal cavities. As CO2 enters, it converts the NH3.H2O into the solid NH4HCO3, trapping it inside the microporous material. The SEM’s of the original char and the resulting product clearly evidenced the intra-pore development of the fibrous NH4HCO3 inside the carbon-charcoal framework. The material accumulated as internal
flat-top volcano like structures. This demonstration of the process showed that we can deposit nutrients inside the porous media using a low cost gas phase application. We analyzed the required amounts of hydrogen, reformed from biomass, which would be required as ammonia and calculated that 31.6% of the H2 would be necessary for ECOSS production leaving (using all charcoal available from the process) leaving 68.4% of the hydrogen for use as a fuel.
The amount of C, directly converted from exhaust CO2 is equal to 15.2% of the total sequestered carbon as a ammonium bicarbonate and for each 100kg of biomass, we will produce a total of 28.3kg of utilized carbon. In acid soils, this part of the carbon will convert to CO2 but in alkaline soils, (pH>8) it will mineralize and remain stable. According to USDA reports, 60-70% of worldwide farmland is alkaline, so conservatively allowing for 50% of the bicarbonate to convert to CO2, this will leave us with approximately 25 kg of stable carbon in our soils for each 100kg of biomass processed. This carbon represents 91.5 kg of CO2 of which 88% is stored as a very beneficial and stable charcoal. A different way to look at this is to compare the amount of energy produced and the resulting CO2 impact. With 6.78 kg hydrogen extra produced per 100 kg of biomass, then 25/6.78 = 3.69 kg C/ kg H or 3.66x3.69=13.5 kg CO2 / kg of hydrogen produced and used for energy. From a power perspective, that is 13.5kg CO2 / 120,000 KJ of hydrogen consumed as a renewable energy or 112 kg/GJ of utilized and stored CO2. Global Potential
The large majority of increases in CO2 will come from developing countries and a sustainable technology needs to be able to scale to meet the growing population needs. The second point is that The energy from a total systems point of view could create a viable pathway to carbon negative energy as detailed in the IIASA focus on Bioenergy Utilization with CO2 Capture and Sequestration (BECS)
[ ]26 . The effects (i.e. providing 112kg of CO2 removal for each GJ of energy used) could allow major manufacturers to offset their carbon costs. For a quick test of reasonableness, if we take the atmospheric rise of 6.1GT and divide by 112kg/Gj = 54.5EJ. This number falls amazingly along the 55EJ estimate of the current amount of biomass that is used for energy in the world today. [ ]27 While the potential reaches many times this for the future utilization of biomass, this shows that there is a chance that we can be proactive in our approach. Economic projections of a study based on the ORNL process were compared to this process. Equivalent 20% CO2 reductions and credits needed to return a 33% ROI was estimated to cost $46 million for a 700MW facility utilizing purchased ammonia. However, if the market for nitrogen were an upper limit, and renewable hydrogen were used for producing the worlds ammonia, and all the world's N fertilizer requirements were met from NH4HCO3 scrubbed from power plant exhaust, then the total carbon capture at (1999 N levels) then coal combustion CO2 could be reduced by ~39.9%. The factors of increased biomass growth with the addition of charcoal as found by Mann[ ]28 , Hoshi[ ]29 , Glaser[ ]30 , Nishio[ ]31 , and Ogawa[ ]32 show increase biomass growth from 17% to as 280% with non-optimized char. The direct utilization of an optimized char plus slow release nitrogen/nutrients may allow the increase biomass growth targets worldwide. A portion of this increased biomass growth will be converted to soil organic matter, further increasing C capture (especially if no-till management practices are adopted).
The ability to slow down the release of ammonia in the soil will allow plants to increase their uptake of nitrogen. This will lead to a reduction in NO2 atmospheric release. For each ton of nitrogen produced, 0.32 tons of C are released, and the 80.95 million tons of nitrogen utilized would represent 26 million tons of C. This is a small a small number in relative terms to the amounts released by combustion of coal (2427 million tons) [ ]33 , however if we assume [ ]34 1.25% of our nitrogen fertilizer escapes into the atmosphere as N2O,
Prepr. Pap.-Am. Chem. Soc., Div. Fuel Chem. 2004, 49 (1), 353

then 1.923 million tons of N2O are released, with an CO2 equivalence of 595.9 million tons or 162.5 million tons of C equivalent.
The economics of hydrogen from biomass has been addressed in the 2001 report by Spath[ ]35 . Our analysis shows that inside plant use of renewable hydrogen would no longer be 2.4-2.8 times the costs from methane, but is approaching 1.6-1.9 times with the increase in natural gas prices. Since market price of nitrogen increases with natural gas prices and this process shows intra plant usage of renewable hydrogen (i.e. no storage or transport expense) becomes significantly more competitive at our current natural gas prices. A review of traditional ammonia processing, shows that due to unfavorable equilibrium conditions inherent in NH3 conversion, only 20-30% of the hydrogen is converted in a single pass. We determined that the ECOSS process could only utilize 31.6% of the hydrogen as we were limited by the total amount of char produced and the target 10% nitrogen loading. This means that a single pass NH3 converter could be used and the expense of separating and recycling unconverted hydrogen is eliminated. The 68.4% hydrogen is then available for sale or use by the power company/fertilizer partnership. This last bracket shows that the ECOSS process thus favors the inefficiencies of ammonia production and reduces costs inherent in trying to achieve high conversion rates of hydrogen. Conclusions
This concept of biomass energy production with agricultural charcoal utilization may open the door to millions of tons of CO2 being removed from industrial emissions while utilizing captured C to restore valuable soil carbon content. This process simultaneously produces a zero emissions fuel that can be used to operate farm machinery and provide electricity for rural users, agricultural irrigation pumps, and rural industrial parks. The use of value added carbon while producing hydrogen (or energy) from biomass can lead to energy with an associated carbon credit (ie negative carbon energy). With this development non-renewable of carbon dioxide producers can work with agricultural communities to play a significant part in reducing greenhouse gas emissions while building sustainable economic development programs for agricultural areas in the industrialized and economically developing societies.
Acknowledgements: Kim Magrini, Stefan Czernik, Bob Evans and Calvin Fiek and Don Reicosky and James Lee who have been seeking solutions to our CO2 buildup. Thanks to Nigel Smith, Bruno Glaser, Christoph Steiner, Johannes Lehman, Bill Woods, Bill Denevan and Susanna Hecht who has taught us with the history of terra preta and finally Michael Obersteiner for his encouragement. References(1) Day, D., Activities web report of a 100 hour production run of
hydrogen from biomass in Blakely, GA, USA; 2002 http://www.eprida.com/hydro/
(2) Gavin, D.G., Brubaker, L.B., and Lertzman, K.P. Holocene fire history of a coastal temperate rain forest based on soil charcoal radiocarbon dates. In press for Ecology: 2003
(3) IPCC, "Climate change 2001: the scientific basis", Intergovernmental Panel on Climate Change, 2001 (see also at http://www.grida.no/climate/ipcc_tar/wg1/index.htm. )
(4) Walsh, Marie et al., Biomass Feedstock Availability in the United States: 1999 State Level Analysis, 1999 http://bioenergy.ornl.gov/resourcedata/index.html
(5) Glaser et.al, The ‘Terra Preta’ phenomenon: a model for sustainable agriculture in the humid tropics, Naturwissenschaften 2001, 88: 37–41
(6) Saldarriaga JG, West DC, Holocene fires in the northern Amazon basin. Quat Res 1986, 26: 358–366
(7) Glaser, et. al., Black Carbon in the Terra Preta Soils of the Brazilian Amazon Region, Proceedings 9th Annual V.M.Goldschmidt Conference, Cambridge, MA 1999, #7391
(8) Smith NJH, Anthrosols and human carrying capacity in Amazonia. Ann Assoc Am Geogr 1980, 70: 553–566
(9) Mann, C., The Real Dirt on Rainforest Fertility, Science 2002; 297:920-923
(10) Hecht, S and D. Posey. “Preliminary Results on Soil Management Techniques of the Kayapó Indians.” Advances in Economic Botany 1989, 7: 174-188.
(11) Y. Yeboah,et al., Hydrogen from Biomass for Urban Transportation, Proceedings of the 2002 US DOE Hydrogen Program Review
(12) Day, Danny; Robert Evans, James Lee U.S. Patent Application, 2002 (13) Asada, T. et al, Science of Bamboo Charcoal: Study on Carbonizing
Temperature of Bamboo Charcoal and Removal Capability of Harmful Gases, Journal of Health Science 2002, 48(6) 473-479
(14) Matsui, T. et al, Preparation and Analysis of Carbonization Products from Sgi, Cryptomra japonica D. Don) Wood. Nippon Kagakukaishi 2000; 1:53-61 (Japanese)
(15) Nishimaya, K. et al., Analysis of Chemical Structure of Wood Cjrcoal by X-ray photoelectron spectroscopy 1998, Journal of Wood Science,44, 56-61
(16) Lee, J. W.; Li, R., A Novel Strategy for CO2 Sequestration and Clean Air Protection, Proceedings of First National Conference on Carbon Sequestration, Washington, DC, May 1417, 2001. http://www.netl.doe.gov/publications/proceedings/01/carbon_seq/p12.pdf
(17) Lee, J. W.; Li, R, Method for Reducing CO2, CO, NOx, and SOx Emissions, 1998 Oak Ridge National Laboratory Invention Disclosure, ERID 0631; 2002 U.S. Patent No. US 6,447,437 B1.
(18) Lee, J. W., and R. Li, Integration of Coal-Fired Energy Systems with CO2 Sequestration through NH4HCO3 Production, Energy Conversion Management 2003; 44: 1535-1546.
(19) Schleppi P., Bucher-Wallin I., Siegwolf R., Saurer M., Muller N. & Bucher J.B., Simulation of increased nitrogen deposition to a montane forest ecosystem: partitioning of the added N; Water Air Soil Pollution 1999; 116: 129-134
(20) Glaser B., Lehmann J., Zech W. Ameliorating physical and chemical properties of highly weathered soils in the tropics with charcoal – a review. Biology and Fertility of Soils 2002; 35: 219-230.
(21) Wardle, D. A. et al., The charcoal effect in Boreal forests: mechanisms and ecological consequences, Oecologia 1998; Volume
115 Issue 3: 419-426 (22) Pietikäinen, Janna, Soil microbes in boreal forest humus after fire
(thesis 1999) http://ethesis.helsinki.fi/julkaisut/maa/mekol/vk/pietikainen/soilmicr.html
(23) Runkel, R.O.H and Wilke, K, Chemical composition and properties of wood heated at 140C to 200C in a closed system without free space. Part II Holz als Roh und Werkstoff 1951; 9: 260-270 (Ger.)
(24) Godsy, E. Michael, Impact of Human Activity on Groundwater Dynamics (Proceedings of a symposium held during the Sixth IAHS Scientific Assembly at Maastricht, The Netherlands, July 2001). IAHS Publication no. 269, 2001, pp. 303–309.
(25) Li, E. Hagaman, et al., “Removal of carbon dioxide from flue gas by ammonia carbonation in the gas phase,” Energy & Fuels 2003; 17: 69-74.
(26) Oberstiener, et al., Biomass Energy, Carbon Removal and Permanent Sequestration - A ‘Real Option’ for Managing Climate Risk, Report no. IR-02-042, Laxenburg, Austria: International Institute for Applied Systems Analysis, 2002.
Prepr. Pap.-Am. Chem. Soc., Div. Fuel Chem. 2004, 49 (1), 354

(27) Hall, D.O., F. Rossillo-Calle, R.H. Williams and J. Woods,:
Biomass for energy: Supply prospects. In: Renewable Energy: Sources for Fuel and Electricity [Johansson, T.B., H. Kelly, A.K.N. Reddy, and R.H. Williams (eds.)]. Island Press, Washington, D.C., 1993:593-652
(28) Mann, C., The Real Dirt on Rainforest Fertility, Science 2002; 297:920-923
(29) Hoshi, T. (web report of growth studies with charcoal amendments on green tea yields) 2002 http://www.fb.u-tokai.ac.jp/WWW/hoshi/cha
(30) Glaser, et.al, Potential of Pyrolyzed Organic Matter in Soil Amelioration, 12th ISCO Conference, China, 2002; 3:421
(31) Nishio, M., Microbial Fertilizers in Japan, Bulletin by National Institute of Agro-Environmental Sciences, Japan, 1999
(32) Ogawa, M., Effect of charcoal on the root nodule and VA mycorrhizal formation of soybean, Proceedings of the Third Inter-national Mycology Congress, Tokyo, Ja-pan, 1983: 578
(33) World Carbon Dioxide Emissions from the Consumption of Coal, 1992-2001 http://www.eia.doe.gov/emeu/iea/tableh4.html
(34) Mosier, et.al, Closing the Global N2O budget: Nitrous Oxide Emissions through the Agricultural Nitrogen Cycle, Nutrient Cycling and in Agro Ecosystems 1998, 52: 223-245
(35) Spath, et al, Update of Hydrogen from Biomass -Determination of the Delivered Cost of Hydrogen, National Renewable Energy Laboratory, Milestone Report for the U.S. Department of Energy’s Hydrogen Program 2001, United States
Prepr. Pap.-Am. Chem. Soc., Div. Fuel Chem. 2004, 49 (1), 355

AN INTEGRATED APPROACH TO THE SYNTHESIS OF ORGANIC CARBONATES: DISCOVERY OF NEW
CATALYSTS
Michele Aresta, Angela Dibenedetto and Carlo Pastore
Department of Chemistry, University of Bari Campus Universitario – 70126 Bari - Italy
Introduction
Molecular organic carbonates are versatile compounds used as solvents or reagents in the chemical industry, or as additives to fuels.1 The latter application and their use as monomers for polymers may expand in the near future, causing a large increase of their demand on the world market. As the current synthetic technology is represented by the use of phosgene (that is banned in several countries) as building block, the development of new synthetic methodologies for organic carbonates is receiving much attention worldwide. The replacement of such toxic raw material with carbon dioxide seems to be very attractive and interesting. In fact, it responds to the “green chemistry” principles by using clean and safe technologies, also implementing the atom-economy strategy. Moreover, the utilization of carbon dioxide represents a way of carbon-recycling, saving natural resources.
In this paper we describe a pool of CO2-based “convergent synthetic technologies” such as the direct oxidative carboxylation of olefins, the carboxylation of epoxides, the direct carboxylation of alcohols, the alcoholysis of urea coupled with the trans-esterification reaction for the synthesis of organic carbonates, either linear or cyclic. The reactivity of Group 5 (V, Nb, Ta) element compounds, used as catalysts in these reactions, will be discussed and a comparison of their reactivity will be made.
Our goal, besides demonstrating the effectiveness and the benefits of networking such reactions, is the identification of a metal that may provide selective catalysts per each of the routes a-g in Scheme 1 or better, the development of a many-purpose catalyst that may drive several reactions. Results and Discussion
Scheme 1 represents the pool of convergent synthetic methodologies for the preparation of either linear (1) or cyclic (2) carbonates, and the (1) = (2) inter-conversion, through the trans-esterification reaction. All synthetic routes respond to the “green chemistry principles” and use safe reagents and operative conditions.
O O
R
O
RCH=CH2 + 1/2 O2 + CO2
O
R+ CO2 c
da
(RO)2CO (1)
R'NHCOOR
ROHR'NH2
R"OH2 ROH
(R"O)2CO
g
b 2 NH3
H2O
e
f
2 ROH + CO2
2 ROH + (H2N)2CO(2)
CO2
Scheme 1. Convergent methodologies for the synthesis of linear (1) and cyclic (2) carbonates
Since long, our research group is involved in the use of Nb-compounds as catalysts for the synthesis of organic cyclic carbonates. We have reported2 that Nb2O5 is an active catalyst in the direct oxidative carboxylation of olefins (Eq. 1) and extensively discussed the role of the temperature and solvent on the conversion yield and selectivity.
R
(1) We have shown that dimethylformamide (DMF) or
dimethylacetamide (DMA) are good solvents for such reaction and that heterogeneous catalysts have a longer life-time than homogeneous ones3 under the same operative conditions. The oxidative carboxy lation of olefins can be split into two reactions, namely the epoxidation of olefins using dioxygen, that is a quite interesting process per se, and the carboxylation of the resulting epoxides. The reaction conditions strongly influence the yield and selectivity of the whole process. The nature of the solvent plays a key role in the carboxylation of epoxides, a reaction that is promoted by amides4 like DMF or DMA that alone are able to carboxylate the epoxides. Conversely, in solvents like aromatics and ethers the reaction does not occur or takes place at a limited extent also in presence of heterogeneous metal systems under the same operative conditions. These findings justify the use of DMF as solvent in the oxidative carboxylation of olefins. The importance of such synthetic approaches (routes c and d in Scheme 1) results much better if one considers that their coupling to the trans-esterification reaction (route a in Scheme 1) may make the oxidative carboxylation of olefins or the carboxylation of epoxides a new approach for the synthesis of both linear and cyclic carbonates.
We have clearly demonstrated the efficacy of Nb(V) and Nb(IV) compounds as catalysts for the conversion of epoxides into the relevant carbonates (Eq. 2) with a selectivity >99%. Also, we have
(2)
shown that Nb(V)-oxide is an active catalyst for the carboxylation of pure enantiomers of chiral epoxides with total retention of the configuration.5 Additionally, Nb(IV) complexes with optically active ligands promote the carboxylation of racemic mixtures of styrene- or propene-oxide with an interesting enantiomeric excess.5
Interestingly, we have found that Nb(V) compounds are also active catalysts for the trans-esterification reaction (TER). We have used either Nb(OR)5 compounds or Nb(V)-oxide6 with interesting conversion yields and 100% selectivity (see below).
Besides such reactions, we have investigated new routes to linear carbonates,7a such as the direct carboxylation of alcohols8 (Eq. 3, or route e in Scheme 1) and the reaction of urea with alcohols9 (Eq. 4 or route f in Scheme 1). Also in this case Nb(V) compounds are good catalysts. In particular, Nb(OR)5 (R=Me, Et, allyl) show an interesting activity for the carboxylation of alcohols8 (Eq. 3), and Nb2O5 is active in the alcoholysis of urea9 (Eq. 4).
2 ROH + CO2 (RO)2CO + H2O (3) 2 ROH + (H2N)2CO RO)2CO + 2 NH3 (4)
O
R+ CO2 O
C O
R
O
cat
O C
O
O
RCH=CH2 + ½ O2 + CO2cat
Prepr. Pap.-Am. Chem. Soc., Div. Fuel Chem. 2004, 49 (1), 356

In the carboxylation of alcohols, Nb(OR)4(OCOOR), generated in the reaction of Nb(OR)5 with CO2, is the active catalytic species. Although such reaction suffers of thermodynamic limitations, the catalyst can be recovered and used several times as shown in Figure 1, improving the total turnover number.
Figure 1. Stability of the Nb(OR)5 catalysts (R= Me, Et, allyl) over ten runs in the carboxylation of the relevant alcohols.
Besides such reaction, Nb(OR)5 has been shown to play a
catalytic role also in the trans-esterification reaction (TER) that promotes the inter-conversion of carbonates, as depicted in Scheme 1, route a. Conversely, Nb2O5 that promotes the carboxylation of epoxides and the oxidative carboxylation of olefins, is also an active catalyst for the alcoholysis of urea and the TER. However, it is possible to utilize a class of catalysts derived from a single element for the synthesis of a wide range of linear and cyclic carbonates by using a sequence of reactions not based on the use of phosgene.
For the trans-esterification reaction, we have also tested several compounds of V and Ta in the oxidation state five, and compared their efficiency to the Nb-systems and to other catalysts (TiO2) reported in the literature. In such reactions, we have used three classes of compounds, namely pentalkoxo- [M(OR)5, M = Nb or Ta] and oxo-trialkoxo-metal complexes [MO(OR)3, M = Nb, V] (Fig. 2), or metal-oxides [Nb2O5, Nb2O4, Nb2O3, NbO, V2O5, V2O4, V2O3] (Fig. 3).
Figure 2. Activity of several Group 5 element alkoxides- or oxo-alkoxides as transesterification (EC DMC) catalysts
Ethylene carbonate (EC) was selected as the cyclic carbonate, due to the fact that it can be effectively synthesized from the relevant epoxide and CO2 using several catalysts, including Nb2O5 under heterogeneous conditions, or Nb(IV)- and Nb(V)-complexes as homogeneous catalysts.
0
0,5
1
1,5
2
2,5
3
1 2 3 4 5 6 7 8 9 10Cycles
Alc
ohol
Con
vers
ion
(%)
DMC DEC DAC
0
20
40
60
80
100
0 5 10 15 20 25 30Time / h
Con
vers
ion
of C
arbo
nate
/ %
V2O5 (DMC)TiO2 (DMC)V2O3 (DMC)V2O4 (DMC)NbO2 (DMC)
Figure 3: Activity of Group 5 metal oxides as trans-esterification catalysts.
Satisfactory results have been obtained using several of the
Group 5 element catalysts in the trans-esterification of ethylene carbonate with MeOH, EtOH or allyl-OH, as shown in Figg. 2 and 3.
In particular, V2O5 has shown a higher efficiency, over the long reaction time, than TiO2 that is used in industrial applications. (Fig. 3) Conclusions
The network of reactions represented in Scheme 1 has been shown to be fully operative. Using Group 5 element compounds as catalysts it has been possible to develop new synthetic approaches to both linear and cyclic carbonates. The same compounds are good trans-esterification catalysts. Therefore, Group 5 element derivatives represent a class of compounds with a multipurpose application in catalytic processes relevant to CO2 utilization.
Acknowledgments. We gratefully acknowledge the financial support by MIUR Project 2003039774 and the experimental assistance provided by Ms Olga Burova and Cira Devita. References
0
20
40
60
80
0 5 10 15 20 25 30Time / h
DM
C fo
rmat
ion
/ %
Ta(OMe)5 Nb(OMe)5 VO(OiPr)3 NbO(OEt)3
(1) Carbon Dioxide Recovery and Utilization, Aresta, M. Ed., Kluwer Academic Publishers, London 2003.
(2) Aresta, M.; Dibenedetto, A. J. Mol. Catal. A: Chemical 2002, 182-183, 399.
(3) Aresta, M.; Dibenedetto, A.; Tommasi, I. Eur. J. Inorg. Chem. 2001, 1801-1806.
(4) Aresta, M.; Dibenedetto, A.; Gianfrate, L.; Pastore C. J. Mol. Catal. A: Chemical, 2003. 204-205, 245
(5) Aresta, M.; Dibenedetto, A.; Gianfrate, L.; Pastore C. Appl. Catal. 2003. in press.
(6) Aresta, M.; Dibenedetto, A.; Pastore, C. Studies in Surface Science and Catalysis, 2003, in press.
(7) Aresta, M.; Dibenedetto, A.;. Pastore, C. XXI Congresso Nazionale della Società Chimica Italiana, Torino, June 22-27, 2003, IN CO 031; b) Choi, J.C.; Sakakura, T.; Sako, T. J. Am. Chem. Soc. 1999, 121, 3793; c) Ballivet-Tkatchenko, D.; Douteau, O.; Stutzmann, S. Organometallics 2000, 19, 4563.
(8) Aresta, M.; Dibenedetto, A.; Pastore, C. Inorg. Chem., 2003, 42, 10, 3256.
(9) Aresta, M.; Dibenedetto, A.; Devita, C.; Bourova, O.; Chapukin, O.N. Studies in Surface Science and Catalysis, 2003, in press.
Prepr. Pap.-Am. Chem. Soc., Div. Fuel Chem. 2004, 49 (1), 357

Studies of Direct Carbonylation of Methane on Silica-Supported Transition Metal Catalysts
Lin-Hua Song Zi-Feng Yan, Shi-Kong Shen
Department of Chemical Engineering, University of Petroleum,
Dongying 257062, Shandong, P. R. China Introduction
A considerable effort has been made in the past decade to convert the cheap raw materials ---- methane into more valuable compounds[1,2]. Methane is thermodynamically stable and its activation and transformation pose a great challenge to homogeneous and heterogeneous catalysis. Among various processes the oxidative coupling of methane is of considerable interest because it can produce C2 compounds in one step. Direct carbonylation of methane to form ethanal and ethanol is a very attractive route for the effective utilization of methane. This reaction is also thermodynamically not allowed in one reaction step, due to the positive change in Gibbs free energy (+18.90 kcal/mol at 500K). This thermodynamic limitation makes it impractical till now. Here we report the new method to achieve the direct carbonylation of methane on silica-supported transition metals. Experimental
The catalysts were prepared by ion-exchanging the silica support with solutions of transiition metals to yield a nominal 5 wt% metal. The following solution of salts of transition metals were used: [Fe(NH3)6
3+、Co(NH3)63+、Ni(NH3)4
2+、Pd(NH3)42+
and Pt(NH3)42+].
For each experiment 300mg of the catalyst were placed in the micro-reactor and was reduced in - situ at 723K. Methane decomposition was performed from a flow of 10ml/min of methane. Each of pulses of 0.3ml of CO syn-gas (95% CO + 5% H2) in a flow of 20ml/min of helium at temperature programmed conditions and at constant temperature conditions was given at each of temperature interval (50K) and at each of time interval (10mins) respectively. Product analysis was performed on line with an ion-trap detector ( Finnigan - MAT 700). Results and Discussion
The direct carbonylation of methane is thermodynamically not allowed in one reaction step, due to the positive change in Gibbs free energy (+18.90 kcal/mol at 500K). A important approach is to split the overall reaction into two reaction steps occurring under different conditions. CH4 + CO → CH3CHO (1) CH4 → CHx + (4-x) H (2) CHx + CO + (4-x) H → CH3CHO (3)
In such a two-step route the thermodynamic limitation might be overcome. The decomposition of methane (2) is endothermal △H > O △H0
s = +96.08kcal/mol) while the change in entropy is positive △S > O (△S0
s = +29.25cal/mol). The direct carbonylation of CHx (x = 0-3) species to form ethanal and ethanol (3) is exothermic △H < 0 (For gas phase reaction under standard conditions, △H0
s = -100.26 kcal/mol) and the change in entropy is negative △S < 0 (△S0
s = -57.92 cal/mol). Therefore, the overall reaction could be occurred under certain moderate temperature, where △GT < 0. Practically, the activation of
methane[3] and H2-D2 exchange reaction[4] of methane on metal surface indicate that the reaction (2) can occur under moderate temperatures. The reaction (3) was extensively studied in the formation of aldehyde and alcohol in the Fischer-Tropsch reaction[5]. Figure 1. CO pulses at different temperature on saturately adsorbed methane on 5wt% Pd/SiO2 catalyst at 423K
Fig.1 shows that the optimum temperature of carbonylation of CHx(ad) (x < 3) species lies in the range of 523-723K on cobalt. It is interesting that this temperature range is coincident with the range of dissociative adsorption of methane. It means that the two step reactions of the direct carbonylation of methane can be performed at the same temperature. Platinum (Fig.2) exhibits the similar behavior with cobalt, but less activity than cobalt. Figure 2. TPSR speat ra of methane in H2 st reem on freah 6w t% Pd/SiO2 catalyst at different adsorption temperature of methane a) T = 300K (b) T = 423K (c) T = 523K; (d) T = 673K;
Fig.1 to Fig.3 shows that the catalytic performance and product distribution depends sensitively on the nature of metals and the variance of the reaction conditions, especially the temperature of carbonylation. The result of blank experiment illustrates that no ethanal and ethanol were formed on the silica support under the same reaction conditions. In contrast to cobalt, Fig. 3 illustrates that optimum temperature range of the carbonylation of CHx(ad) species on palladium is enlarged to 823K and that the conversion of the carbonylation is reversely increased along with the increasing of the temperature. TPSR results of adsorbed methane on palladium and Fig.3 show that the hydrogenation to methane and carbonylation of CHx(ad) species formed by the decomposition of methane are the competitive reactions, especially on the H(ad)-enriched metal surface. The interaction of H(ad) with adsorbed surface species results in the formation of hydrogenated products (such as CH4, CH3CH2OH and CH3OH). Large amounts of H(ad) may be originated from the migration of H(ad) in the subsurface and
Prepr. Pap.-Am. Chem. Soc., Div. Fuel Chem. 2004, 49 (1), 358
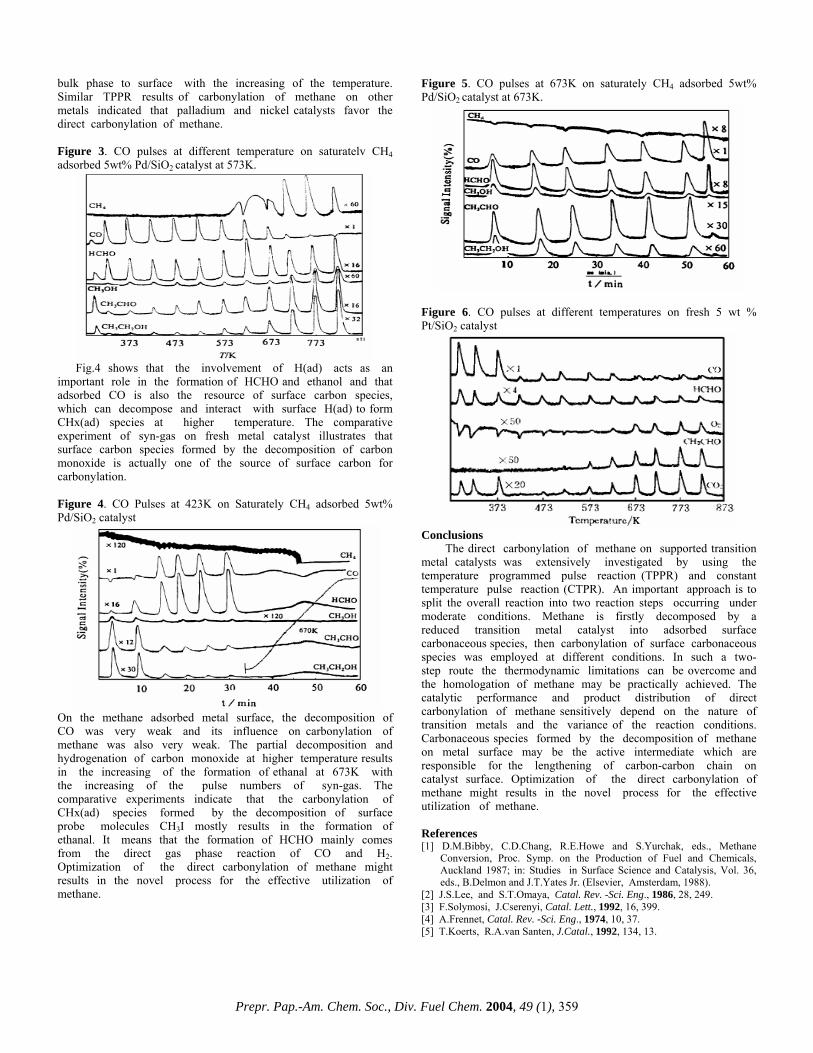
bulk phase to surface with the increasing of the temperature. Similar TPPR results of carbonylation of methane on other metals indicated that palladium and nickel catalysts favor the direct carbonylation of methane. Figure 3. CO pulses at different temperature on saturatelv CH4 adsorbed 5wt% Pd/SiO2 catalyst at 573K.
Fig.4 shows that the involvement of H(ad) acts as an important role in the formation of HCHO and ethanol and that adsorbed CO is also the resource of surface carbon species, which can decompose and interact with surface H(ad) to form CHx(ad) species at higher temperature. The comparative experiment of syn-gas on fresh metal catalyst illustrates that surface carbon species formed by the decomposition of carbon monoxide is actually one of the source of surface carbon for carbonylation. Figure 4. CO Pulses at 423K on Saturately CH4 adsorbed 5wt% Pd/SiO2 catalyst
On the methane adsorbed metal surface, the decomposition of CO was very weak and its influence on carbonylation of methane was also very weak. The partial decomposition and hydrogenation of carbon monoxide at higher temperature results in the increasing of the formation of ethanal at 673K with the increasing of the pulse numbers of syn-gas. The comparative experiments indicate that the carbonylation of CHx(ad) species formed by the decomposition of surface probe molecules CH3I mostly results in the formation of ethanal. It means that the formation of HCHO mainly comes from the direct gas phase reaction of CO and H2. Optimization of the direct carbonylation of methane might results in the novel process for the effective utilization of methane.
Figure 5. CO pulses at 673K on saturately CH4 adsorbed 5wt% Pd/SiO2 catalyst at 673K.
Figure 6. CO pulses at different temperatures on fresh 5 wt % Pt/SiO2 catalyst
Conclusions
The direct carbonylation of methane on supported transition metal catalysts was extensively investigated by using the temperature programmed pulse reaction (TPPR) and constant temperature pulse reaction (CTPR). An important approach is to split the overall reaction into two reaction steps occurring under moderate conditions. Methane is firstly decomposed by a reduced transition metal catalyst into adsorbed surface carbonaceous species, then carbonylation of surface carbonaceous species was employed at different conditions. In such a two-step route the thermodynamic limitations can be overcome and the homologation of methane may be practically achieved. The catalytic performance and product distribution of direct carbonylation of methane sensitively depend on the nature of transition metals and the variance of the reaction conditions. Carbonaceous species formed by the decomposition of methane on metal surface may be the active intermediate which are responsible for the lengthening of carbon-carbon chain on catalyst surface. Optimization of the direct carbonylation of methane might results in the novel process for the effective utilization of methane.
References [1] D.M.Bibby, C.D.Chang, R.E.Howe and S.Yurchak, eds., Methane
Conversion, Proc. Symp. on the Production of Fuel and Chemicals, Auckland 1987; in: Studies in Surface Science and Catalysis, Vol. 36, eds., B.Delmon and J.T.Yates Jr. (Elsevier, Amsterdam, 1988).
[2] J.S.Lee, and S.T.Omaya, Catal. Rev. -Sci. Eng., 1986, 28, 249. [3] F.Solymosi, J.Cserenyi, Catal. Lett., 1992, 16, 399. [4] A.Frennet, Catal. Rev. -Sci. Eng., 1974, 10, 37. [5] T.Koerts, R.A.van Santen, J.Catal., 1992, 134, 13.
Prepr. Pap.-Am. Chem. Soc., Div. Fuel Chem. 2004, 49 (1), 359
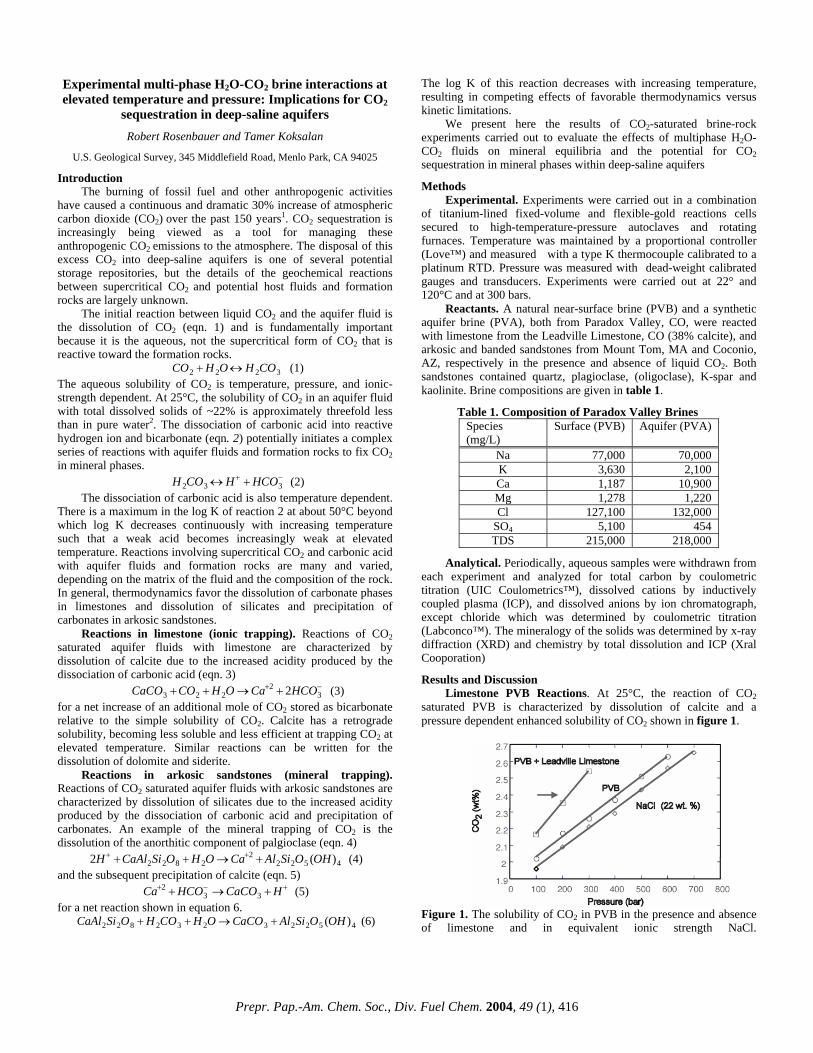
Experimental multi-phase H2O-CO2 brine interactions at elevated temperature and pressure: Implications for CO2
sequestration in deep-saline aquifers
Robert Rosenbauer and Tamer Koksalan
U.S. Geological Survey, 345 Middlefield Road, Menlo Park, CA 94025 Introduction
The burning of fossil fuel and other anthropogenic activities have caused a continuous and dramatic 30% increase of atmospheric carbon dioxide (CO2) over the past 150 years1. CO2 sequestration is increasingly being viewed as a tool for managing these anthropogenic CO2 emissions to the atmosphere. The disposal of this excess CO2 into deep-saline aquifers is one of several potential storage repositories, but the details of the geochemical reactions between supercritical CO2 and potential host fluids and formation rocks are largely unknown.
The initial reaction between liquid CO2 and the aquifer fluid is the dissolution of CO2 (eqn. 1) and is fundamentally important because it is the aqueous, not the supercritical form of CO2 that is reactive toward the formation rocks.
CO2 +H 2O↔ H 2CO3 (1) The aqueous solubility of CO2 is temperature, pressure, and ionic- strength dependent. At 25°C, the solubility of CO2 in an aquifer fluid with total dissolved solids of ~22% is approximately threefold less than in pure water2. The dissociation of carbonic acid into reactive hydrogen ion and bicarbonate (eqn. 2) potentially initiates a complex series of reactions with aquifer fluids and formation rocks to fix CO2 in mineral phases.
H 2CO3 ↔ H+ +HCO3− (2)
The dissociation of carbonic acid is also temperature dependent. There is a maximum in the log K of reaction 2 at about 50°C beyond which log K decreases continuously with increasing temperature such that a weak acid becomes increasingly weak at elevated temperature. Reactions involving supercritical CO2 and carbonic acid with aquifer fluids and formation rocks are many and varied, depending on the matrix of the fluid and the composition of the rock. In general, thermodynamics favor the dissolution of carbonate phases in limestones and dissolution of silicates and precipitation of carbonates in arkosic sandstones.
Reactions in limestone (ionic trapping). Reactions of CO2 saturated aquifer fluids with limestone are characterized by dissolution of calcite due to the increased acidity produced by the dissociation of carbonic acid (eqn. 3)
CaCO3 +CO2 +H2O →Ca+2 + 2HCO3− (3)
for a net increase of an additional mole of CO2 stored as bicarbonate relative to the simple solubility of CO2. Calcite has a retrograde solubility, becoming less soluble and less efficient at trapping CO2 at elevated temperature. Similar reactions can be written for the dissolution of dolomite and siderite.
Reactions in arkosic sandstones (mineral trapping). Reactions of CO2 saturated aquifer fluids with arkosic sandstones are characterized by dissolution of silicates due to the increased acidity produced by the dissociation of carbonic acid and precipitation of carbonates. An example of the mineral trapping of CO2 is the dissolution of the anorthitic component of palgioclase (eqn. 4)
2H+ +CaAl2Si2O8 +H2O →Ca+2 +Al2Si2O5 (OH)4 (4) and the subsequent precipitation of calcite (eqn. 5)
Ca+2 +HCO3− →CaCO3 +H+ (5)
for a net reaction shown in equation 6. CaAl2Si2O8 +H 2CO3 +H 2O →CaCO3 +Al2Si2O5 (OH )4 (6)
The log K of this reaction decreases with increasing temperature, resulting in competing effects of favorable thermodynamics versus kinetic limitations.
We present here the results of CO2-saturated brine-rock experiments carried out to evaluate the effects of multiphase H2O-CO2 fluids on mineral equilibria and the potential for CO2 sequestration in mineral phases within deep-saline aquifers Methods
Experimental. Experiments were carried out in a combination of titanium-lined fixed-volume and flexible-gold reactions cells secured to high-temperature-pressure autoclaves and rotating furnaces. Temperature was maintained by a proportional controller (Love™) and measured with a type K thermocouple calibrated to a platinum RTD. Pressure was measured with dead-weight calibrated gauges and transducers. Experiments were carried out at 22° and 120°C and at 300 bars.
Reactants. A natural near-surface brine (PVB) and a synthetic aquifer brine (PVA), both from Paradox Valley, CO, were reacted with limestone from the Leadville Limestone, CO (38% calcite), and arkosic and banded sandstones from Mount Tom, MA and Coconio, AZ, respectively in the presence and absence of liquid CO2. Both sandstones contained quartz, plagioclase, (oligoclase), K-spar and kaolinite. Brine compositions are given in table 1.
Table 1. Composition of Paradox Valley Brines
Species (mg/L)
Surface (PVB) Aquifer (PVA)
Na 77,000 70,000 K 3,630 2,100 Ca 1,187 10,900 Mg 1,278 1,220 Cl 127,100 132,000
SO4 5,100 454 TDS 215,000 218,000
Analytical. Periodically, aqueous samples were withdrawn from
each experiment and analyzed for total carbon by coulometric titration (UIC Coulometrics™), dissolved cations by inductively coupled plasma (ICP), and dissolved anions by ion chromatograph, except chloride which was determined by coulometric titration (Labconco™). The mineralogy of the solids was determined by x-ray diffraction (XRD) and chemistry by total dissolution and ICP (Xral Cooporation) Results and Discussion
Limestone PVB Reactions. At 25°C, the reaction of CO2 saturated PVB is characterized by dissolution of calcite and a pressure dependent enhanced solubility of CO2 shown in figure 1.
Figure 1. The solubility of CO2 in PVB in the presence and absence of limestone and in equivalent ionic strength NaCl.
Prepr. Pap.-Am. Chem. Soc., Div. Fuel Chem. 2004, 49 (1), 416

The solubility is enhanced 8.8% at 25°C and 5.7% at 120°C and 300 bars. Also, there is a temperature dependent offset in the solubility of CO2 between the natural brine and NaCl due to the presence of divalent cations in the brine2. At 120°C, the reaction of PVB with limestone is independent of CO2 concentration except for the dissolution of some calcite early in the experiment containing CO2. Both experiments are dominated by the precipitation of anhydrite and dolomitization of the limestone shown as a time series plot in figure 2. Based on mass balance calculation for Mg, Ca, and SO4, 25% of the original calcite dissolved or was dolomitized. Net molar volume changes result in a formation porosity increase of 5%.
Figure 2. Compositional changes in PVB when reacted with limestone both in the presence and absence of liquid CO2.
Limestone PVA Reactions. The reaction of limestone with PVA is characterized by calcite dissolution and desiccation of the brine shown in figure 3. Dolomite dissolves during heating and it or magnesite precipitate at the experimental conditions of 120°C. These reactions result in a net porosity increase of 2.6%.
Figure 3. Compositional change in dissolved Ca during reaction of CO2 saturated brine in the presence and absence of limestone at 120°C.
Sandstone PVA Reactions. Reactions of arkosic and iron-rich banded sandstones with PVA are characterized by large changes in elemental abundances, enhanced CO2 solubility, and significant desiccation of the brines. Prior to injection of liquid CO2, changes occurred in dissolved Ca, Mg, K, and Na during equilibration with minerals in the solid phase. After injection of liquid CO2, total dissolved solids (TDS), including Cl, increased markedly due to transfer of H2O from the brine to liquid CO2 as shown in figure 4. The solubility of liquid H2O in liquid CO2 is temperature and pressure dependent3 and has implications for solutions already near saturation with mineral phases. Experiments by Kazuba et al4 have shown a 25% increase in dissolved Cl when CO2 was injected into a saline brine at 200°C and 200 bars. Highly saline aquifers near saturation with NaCl would precipitate halite under these conditions.
Figure 4. Concentration of dissolved Cl before and after injection of liquid CO2 when PVA brine is reacted with arkosic sandstone. Dissolved elemental concentrations did not all increase proportionally with dissolved Cl (7%), and ranged up to 12% for dissolved Mg immediately after injection of CO2 into the brine, indicative of a variety of fluid-rock interactions. The decrease of dissolved Ca with time when PVA reacts with arkose is shown in figure 5, suggesting fixation of CO2 as calcite. Significant metals were released to solution, in particular from the banded sandstone, leading to the possibility of siderite precipitation.
Figure 5. Time series plot of dissolved Ca when PVA is reacted with arkosic and banded sandstones at 120°C and 300 bars. Conclusions
Experimental results are generally consistent with theoretical thermodynamic calculations. CO2-saturated brine-limestone reactions are characterized by compositional and mineralogical changes in the aquifer fluid and rock that are dependent on initial brine composition, especially dissolved sulfate, as are the changes in formation porosity. The solubility of CO2 is enhanced in brines in the presence of both limestone and sandstone relative to brines alone.
Reactions between CO2 saturated brines and arkosic sandstones are characterized by desiccation of the brine and changes in the chemical composition of the brine suggesting fixation of CO2 in mineral phases. These reactions are occurring on a measurable but kinetically slow time scale at 120°C. References (1) Johnansson, T. B.; Williams, R. H.; Ishitani, H.; Edmonds, J. A. Energy
Policy 1996, 24 (10-11), 985-1003 (2) Rosenbauer, R. J.; Koksalan, T. GSA Annual Meeting, Denver, CO,
October 27-30, 2002, Paper 135-2 (3) Takenouchi, S. and Kennedy, G. C. Am. J. Sci., 1964, 262, 1055-74 (4) Kaszuba, J. P.; Janecky, D. R.; Snow, M. G. Appl. Geochem. 2003, 18
(7), 1065-80
Prepr. Pap.-Am. Chem. Soc., Div. Fuel Chem. 2004, 49 (1), 417

PARAMETRIC INVESTIGATION OF CARBON SEQUESTRATION USING BRINE
Matthew L. Druckenmiller and M. Mercedes Maroto-Valer
The Energy Institute and the Department of Energy & Geo-
Environmental Engineering, The Pennsylvania State University, 401 Academic Activities Bldg., University Park, PA 16802
Introduction
In the shadow of mass fossil fuel consumption and the looming threat of global climate change, carbon sequestration using brine has emerged as a promising technology in carbon management. Brine is a saline-based solution that is produced as a waste product during the extraction of oil and natural gas. In Pennsylvania annual brine production is estimated at 59 million gallons, while total US production is over 20 billion gallons.1 The existence of large volumes of brine at the surface provides a potential feedstock for the conversion of CO2 into geologically stable mineral carbonates, such as calcium carbonate and magnesium carbonate. Under the appropriate conditions, CO2 dissolves in brine to initiate a series of reactions that ultimately leads to the bonding of carbonate anions to various metal cations inherent in brine to precipitate carbonates.
In addition to ex-situ processing to efficiently drive the reaction, much emphasis has been placed on the injection of CO2 into subsurface saline formations. US deep saline aquifers are estimated to provide storage for approximately 130 giga-tons carbon equivalent, which is approximately 80 times the US’s total carbon emissions in 2001.2,3 Following the injection of anthropogenic CO2 below a typical depth of 800 meters, the storage mechanism is initially hydrodynamic as the CO2 is stored as a dense supercritical fluid. On a separate timescale, and following the dissolution of CO2 in brine, chemical interactions with the brine may form mineral carbonates.4
The rate of the mineral trapping process is slow and serves as the major disadvantage of this technology.5 It was suggested by Soong et al.5 that pH has a significant effect on both conversion rates and on the specific species that are precipitated. The conversion to carbonates can thus be promoted by increasing brine pH through the addition of a strong base. Their research qualitatively identifies the effects of various parameters on carbonate precipitation. However, pH evolution throughout the reaction is not documented. The objective of this study is to further investigate the effects of temperature, pressure, and most importantly pH on the formation of mineral carbonates during the reaction of CO2 with various natural gas well brines. Additionally, the evolution of brine pH following a pH adjustment yet prior to reaction with CO2 is studied. This analysis will help determine a relationship between brine composition and a brine’s ability to maintain an elevated pH over time. Experimental
Four brine samples were obtained from various natural gas wells: PA-1 and PA-2 from nearby 2800 m wells in Indiana County, Pennsylvania, and OH-1 and OH-2 from a 1158 m well in Guernsey, Ohio and a 1030 m well in Youngstown, Ohio, respectively.
ICP-AES Analysis. The brine samples underwent analysis by inductively coupled plasma – atomic emission spectroscopy (ICP-AES) screening with no acid pretreatment to determine the elemental metal concentrations in the liquid phase. Additionally, ICP-AES screening following acid treatment with HNO3 was conducted to determine the total metal concentration in solution.
pH Stability Study. The stability of adjustments of brine pH was studied at room temperature and pressure using the four brine
samples. Based on the various brine compositions, it was preliminarily determined to raise the pH to a value low enough so that iron hydroxide did not precipitate. Iron hydroxide has a much lower solubility product (Ksp = 4.87 x 10⁻¹⁷) than the hydroxyl forms of the other metals. OH-2 had the highest iron composition, and accordingly a pH of approximately 7 would promote precipitation. Using a 0.24 M KOH solution, the pH of each brine sample was adjusted to approximately 6.3. Over a five-day period, the pH was measured using a digital pH meter to obtain a relationship between brine pH and time.
Autoclave CO2/Brine Reactions. A 250 ml Parr high pressure/high temperature reactor (model series 4576, T316 stainless steel) will be used to conduct reactions between CO2 and brine. A liquid sampling valve will allow for brine extraction throughout the course of the reaction. Various experiments of 12 hours in duration will be conducted at temperatures and pressures between 20 to 200 °C and 200 to 1200 psi, respectively. Initial brine pH will range from the inherent pH to 11. The CO2/brine mixture will be constantly stirred to promote interaction and to prevent the settling of precipitates. Samples extracted from the autoclave during reaction will be analyzed using ICP-AES, and the pH will be measured. Additional experiments will be conducted in which no liquid sampling will occur. These studies will yield precipitates that will be characterized using X-ray diffraction (XRD). Results and Discussion
Brine Characterization. Table 1 presents the ICP-AES analysis results conducted with and without acid pretreatment, and also includes the pH measurements of the natural untreated brine. For the four brine samples studied, the pH values are around 2.3, except for OH-2, which is less acidic with a pH value of 4.2. Both data sets reveal the major compositional differences between the brine samples. Importantly, PA-1 is representative of a relatively calcium-rich brine, while OH-1 represents a magnesium-rich brine. OH-1 also has a significantly lower iron concentration than the other three samples. Finally, the Pennsylvania samples show much higher concentrations of barium and strontium in comparison with the Ohio samples. Table 1. Metal Concentrations (ppm) as Analyzed by ICP-AES
and pH of the Brine Samples PA-1 PA-2 OH-1 OH-2
pH 2.3 2.4 4.2 2.3 No Acid Pretreatment
Ba 1021 696 <5 <5 Ca 33515 21460 19570 19350 Fe 224 121 9 476 K 2520 1490 2225 1180 Mg 1975 1215 3440 2055 Na 60680 41040 69660 48500 Sr 11170 8380 2000 1800
Acid Pretreatment with HNO3Ba 1270 789 5.66 7.3 Ca 42900 23600 22500 21600 Fe 295 223 15.9 635 K 3270 1770 2560 1380 Mg 2650 1440 4070 2380 Na 74400 44900 78900 53900 Sr 13800 8910 2330 2020
In general, the differences between the two data sets reveal that 75 to 95% of the metals are in the liquid phase. An exception exists for iron in PA-2 and OH-1, in which approximately 55% is in the liquid phase. These results clearly show the variability in brine
Prepr. Pap.-Am. Chem. Soc., Div. Fuel Chem. 2004, 49 (1), 418

composition that can be obtained even in the case of nearby wells, such as for PA-1 and PA-2, which are located only 5 miles apart.
pH Stability Measurements. Figure 1 illustrates the results of the pH stability measurements conducted on the four brine samples. OH-1 behaved uniquely in the pH stability study as it was the only brine that remained near the adjusted pH value over the five-day period. The pH of OH-1 remained especially constant over the entire course of the study. In contrast, PA-1, PA-2, and OH-2 experienced a rapid decline in pH during the first 12 hours, after which the decline seemed to level off. This observed difference in stability of brine pH at an adjusted elevated value may be attributed to the major difference in iron composition in the liquid phase between OH-1 and the other samples. OH-1 has a significantly lower iron concentration than the other three brine samples (9 ppm for OH-1 vs. 224, 121 and 476 ppm for PA-1, PA-2 and OH-2, respectively). Further studies are being conducted to understand the relationship between brine composition and observed pH stability.
Figure 1. pH measurements of brine samples that underwent a pH adjustment to approximately 6.3 using KOH.
CO2/Brine Reactions. CO2 reacts with brine’s metal cations to form carbonate precipitates via the following reaction sequence, in which selected likely precipitates are shown:5,6
CO2(g) CO2(aq) (1) CO2(aq) + H2O H2CO3 (2a) H2CO3 H+ + HCO3
- (2b) CO2 (aq) + OH- HCO3
- (3) HCO3
- H+ + CO32- (4)
Ca2+ + CO32- Ca CO3 ↓ (5a)
Mg2+ + CO32- Mg CO3 ↓ (5b)
Ca2+ + Mg2+ + 2CO32- CaMg(CO3)2 ↓ (5c)
The dissolution of CO2 in water (reaction 1) is dependent on
temperature, pressure, and brine salinity. Reactions 2a and 2b represent the formation of carbonic acid, which reduces the pH of the system, and the dissociation of carbonic acid to form bicarbonate, respectively. The bicarbonate ion may then dissociate (reaction 4) to form the carbonate ion, which is necessary to form the carbonate minerals in reactions 5a through 5b. The pH determines which steps dominate the reaction sequence, and accordingly the proportions of the carbonic species.6 At a low pH (~4), the production of H2CO3 dominates, at a mid pH (~6) HCO3
- production dominates, and at a high pH (~9) CO3
2- dominates.5 Therefore, at a basic pH the precipitation of carbonate minerals is favored because of the
availability of carbonate ions. Oppositely, the dissolution of carbonates increases as the solution becomes increasingly more acidic. The rate limiting step of the overall conversion to carbonates has been identified as the hydration of CO2 in reaction 2a, which has a forward reaction rate constant of 6.2 x 10⁻² s-1 at 25 °C and zero ionic strength.7
Conclusions
The abundance of brine both at the surface due to the production of oil and natural gas and in subsurface saline aquifers provides the capacity to sequester a significant amount of anthropogenic CO2. Subsurface saline aquifers may sequester CO2 in various forms. However, any ex-situ sequestration process will rely on an efficient conversion to mineral carbonates. An investigation into the parameters, most importantly pH, that affect this conversion rate is warranted. The evolution of brine pH following a pH adjustment and during reaction with CO2 at various temperatures and pressures is highly variable.
Preliminary results reveal large differences in the metal concentrations of brines from various depths and locations. These compositional differences are related to brine’s ability to maintain an elevated pH after treatment with a strong base to address the natural acidity of brine. The CO2/brine reactor system described herein will allow for the achievement of a relationship between pH and the formation of specific mineral carbonates throughout the duration of an experiment.
3.00
4.00
5.00
6.00
7.00
0 2000 4000 6000 8000Time, min
PA-1 PA-2
OH-1 OH-2
Acknowledgements. The authors would like to thank Dr. S. Eser at the Energy Institute at Penn State for the use of the autoclave and Dr. Y. Soong at the National Energy Technology Laboratory of the U.S. Department of Energy for the brine samples. The presenting author would like to acknowledge his research advisor, Dr. M. M. Maroto-Valer, for her continued guidance and encouragement. References (1) Jones, A.; Glass C.; Reddy T. K.; Maroto-Valer, M. M.; Andrésen, J. M.;
and Schobert, H. H. Prepr. Pap. - Am. Chem. Soc., Div. Fuel Chem., 2001, 46 (1), 321.
(2) DOE. Carbon Sequestration Research and Development; DOE/SC/FE-1; U.S. Department of Energy: Washington D.C., 1999.
(3) Energy Information Administration, International Energy Annual 2001 Edition. http://www.eia.doe.gov/emeu/iea/carbon.html (accessed March 18, 2003).
(4) Bachu, S. Sequestration of CO2 in geological media: Criteria and approach for site selection in response to climate change. Energy Conversion & Management, 2000, 41, 953-70.
(5) Soong, Y.; Jones, J. R.; Hedges, S. W.; Harrison, D. K.; Knoer, J. P.; Baltrus, J. P.; and Thompson, R. L. Prepr. Pap. - Am. Chem. Soc., Div. Fuel Chem., 2002, 47 (1), 43.
(6) Bond, G. M.; McPherson, B.; Stringer, J.; Wellman, T.; Abel, A.; Medina, M. Prepr. Pap. - Am. Chem. Soc., Div. Fuel Chem., 2002, 47(1), 39.
(7) Bond, G. M.; Stringer, J.; Brandvold, D. K.; Simsek, F. A.; Medina, M.; Egeland, G. Development of integrated system for biomimetic CO2 sequestration using enzyme carbonic anhydrase. Energy & Fuels, 2001, 15, 309-16.
Prepr. Pap.-Am. Chem. Soc., Div. Fuel Chem. 2004, 49 (1), 419
Biomimetic Sequestration of CO2 in Carbonate Form: Role of Produced Waters and Other Brines
Gillian M. Bond,1 Ning Liu,1
Aaron Abel,2 Brian J. McPherson,2 and John Stringer3
1Department of Materials & Metallurgical Engineering
2Department of Earth & Environmental Sciences New Mexico Tech 801 Leroy Place
Socorro, NM 87801
3EPRI 3412 Hillview Avenue Palo Alto, CA 94304
Introduction The overall purpose of this research from its inception has been to establish the feasibility of essentially permanent sequestration of CO2 in mineral form, and particularly to examine the possibility of achieving this end by the mimicry of natural processes. A biomimetic approach has been devised, which uses a biological catalyst, carbonic anhydrase. Thus the objective is to develop a system resembling a CO2 scrubber, in which carbonic anhydrase serves to catalyze the rate of CO2 hydration for subsequent fixation into stable mineral carbonates. Feasibility of the approach has been demonstrated, and the emphasis is now on development of the approach into a chemical engineering reality. The present focus is on the use of produced waters and other brines as sources of cations for carbonate formation. Mineralization routes to sequestration Sequestration of CO2 in the form of a stable, environmentally friendly solid offers obvious appeal for long-term storage of CO2 with low risks and minimal monitoring requirements, and would be unlikely to encounter licensing problems. Carbonate minerals, such as calcite, aragonite, dolomite and dolomitic limestone, constitute the earth’s largest CO2 reservoir, estimated to contain an amount of carbon equivalent to 150,000 × 1012 tonnes of CO2
1. Thus the geological record demonstrates that large amounts of CO2 can be stored indefinitely in carbonate form. Two types of geological processes have led to the formation of much of these carbonate minerals, and each of these processes can be viewed as a model for the sequestration of anthropogenic CO2. 1. Weathering processes result in the generation of carbonates
by the silicate-to-carbonate exchange, in which the byproduct is silica. Several other groups are working to develop an analogous process, based on carbonation of serpentinites and peridotites, which could be used on an industrial scale and timeframe. One potential advantage of this approach is that the carbonation reaction is exothermic.
2. Generation of calcium carbonate by various types of marine animals has resulted in the formation of, for example, very extensive oolitic limestone beds. This is the process that we have used as a model in our ongoing work at New Mexico Tech.
Thus we have developed an analogous (biomimetic) process, in which a biological catalyst, the enzyme carbonic anhydrase, is used to accelerate an aqueous processing route to carbonate formation.2-5 In addition to safe long-term sequestration, the potential advantages of this biomimetic approach include: the possibility of an on-site scrubber that would provide a plant-by-plant solution to CO2
sequestration; avoiding the need for concentration and transportation of CO2; and operation at ambient or near-ambient conditions. Possible cation sources The counterions for carbonate formation can be supplied from brines. One particularly attractive possibility in the portfolio of possible brines would be produced waters that result from oil and gas production. In areas such as the Permian Basin, a substantial quantity of brine is already being produced, transported, and reinjected by the oil and gas industry. Some of these produced waters are presently used in water flooding for secondary production, but most of the produced waters constitute a waste product requiring disposal. In the Permian Basin, approximately 90% of these waters are reinjected for disposal. Produced waters from the West Pearl Queen Reservoir (Permian Basin, Southeast NM) and San Juan Basin (Northwest NM) were selected as representative cation sources, corresponding to two very different brine types. Total dissolved solids (TDS) are much lower in brines from the San Juan Basin than in those from the West Pearl Queen Reservoir. Ca2+ and Mg2+ concentrations in produced waters are, respectively, 0.0871M and 0.1468M for the West Pearl Queen Reservoir, and 0.1743M and 0.0692M for the San Juan Basin. Experiments with synthetic produced waters Bench-scale experiments were first performed with synthetic produced waters as follows, prior to larger laboratory-scale experiments. 200µl 0.1mg/ml bovine carbonate anhydrase (BCA) were added to 10.0ml CO2-saturated deionized (DI) water and mixed well. 10.0ml synthetic produced water and 1.0ml 1M Tris. buffer were added immediately. pH value and precipitation time (time to onset of precipitation) were measured, both in the presence of BCA and in control solutions without BCA. Calcium carbonate precipitated much more quickly in the presence of BCA than from control solution; for example, the precipitation time was 15 sec. (pH=8.54) in the presence of BCA, but 86 sec. (pH=8.53) in the control solution for the synthetic San Juan Basin produced water. For synthetic West Pearl Queen Reservoir produced water, the precipitation times were longer: for example, 254 sec. (pH=8.43) in the presence of BCA and 326 sec. (pH=8.51) in the control solution. This is attributed to the difference in the ratios of Ca2+ to Mg2+ for the two brines. Magnesium ions are well known to be potent inhibitors of CaCO3 precipitation. A laboratory-scale reactor has been built and used for subsequent tests on the synthetic brines. In these experiments, the enzyme was immobilized in chitosan-alginate beads. 0.0010g per ml BCA powders were dissolved in 2% (w/v) sodium alginate solution. Chitosan solution was prepared by dissolution of the reagent in 3% (v/v) acetic acid solution (pH=2.5) to give 2% (w/v) of chitosan solution. In order to produce beads, the enzyme-containing alginate solution was dripped with a syringe into a crosslinker solution (comprising 1:1:1 (v/v/v) 0.2M CaCl2:2% (w/v) chitosan solution:DI water) at room temperature.. The pH of the solution was adjusted with 0.1M NaOH or 0.1M HCl to 5. The solution was placed on a magnetic stirrer. Beads were stirred in the solution for 2 hrs, washed with de-ionized water, and refrigerated at 4oC until use. CO2-saturated DI-water was pumped with buffer solution into the reaction chamber of the laboratory-scale reactor, where it flowed across enzyme-loaded beads. As the solution left the reaction chamber, synthetic brine was pumped from the brine supply barrel to mix with the H2CO3-buffer solution, and then passed through a heating vessel. In the secondary settling pan, CaCO3 precipitated, and the remainder of the solution was re-injected into the H2CO3 supply barrel. Inflow rates of the CO2-saturated DI-water, synthetic brine,
Prepr. Pap.-Am. Chem. Soc., Div. Fuel Chem. 2004, 49 (1), 420

and Tris. buffer were adjusted to give proportions equivalent to those used in the bench-scale tests. The results are listed in table 1.
Table 1. The Results of Laboratory-Scale Experiments with Simulated Produced Water
Precipitation Time
(sec.) pH Value
With BCA 252 8.63 West Pearl Queen Reservoir No BCA 303 8.71
With BCA 7 8.58 San Juan Basin No BCA 122 8.65 Injection Capacity Analyses Another approach to carbon sequestration that utilizes the carbonic anhydrase reactor is the injection of bicarbonate-rich water into subsurface reservoirs. In this process, produced water or other brine pumped from the reservoir to the surface is then enriched with bicarbonate ions by means of the carbonic anhydrase reactor. The resulting solution would then be injected into subsurface reservoirs, for example the West Pearl Queen (depleted oil and gas reservoir) and the Frio Sand (deep saline aquifer, Southeast Texas). Injection or production capacity is a major consideration when evaluating the disposal of fluids by subsurface injection or optimizing production rate. The term injection (production) capacity can be defined as the maximum injection (production) rate possible for a given reservoir. Reservoir permeability, geometry (thickness), and reservoir conditions (temperature and pressure) influence injection (production) capacity tremendously. A simple relationship can be applied to a certain set of field-scale parameters to determine the injection (production) capacity of a given reservoir. This can be used to give a reasonable estimation of the amount of CO2 that could be stored within the reservoir within a given year. L.P. Dake6 first explored injection (production) capacity in the context of oil and gas reservoir engineering, but we can apply his relationship both to the injection of bicarbonate-rich brine into a reservoir, and to the production of brine as a cation source for surface mineralization. This relationship states that the injection (production) capacity is proportional to the reservoir thickness, reservoir permeability, and the pressure difference between the point of injection (production) and the reservoir. The main field parameters that enhance injection (production) capacity are permeability and reservoir thickness. The change in pressure applied to the injection (production) of fluids is limited to the maximum overpressure that can be applied to a specific reservoir before reservoir failure. Reservoir engineers have said that this pressure difference must be limited to between 9 and 18 % of the original reservoir pressure to prevent reservoir failure7. The West Pearl Queen reservoir permeability has been measured to be approximately 6.91 × 10⁻¹³ m2 and the thickness of the reservoir is approximately 6 meters. These field parameters correspond to an injection (production) capacity of ~0.164 m3/day. The Frio Sand reservoir permeability of 8.88 × 10⁻¹⁴ m2 and reservoir thickness of 30 meters correspond to an injection (production) capacity of ~6.80 m3/day. The main factor that inhibits injection (production) capacity is the product of permeability and reservoir thickness, as can be noted from the comparison between the capacities of the Frio Sand reservoir and the West Pearl Queen reservoir. The predicted possible cumulative mass injection (production) of brine injected over 365 working days is approximately 65,500 kg (West Pearl Queen reservoir) and 2.7 million kg (Frio Sand reservoir). Throughout certain oil and gas basins there are thousands to hundreds of
thousands of wells that inject and produce brine for disposal purposes, and it can be seen that the cumulative capacity for carbon storage within these basins is significant. It is also important to note that the ability to produce brine as a source of cations is extremely important when evaluating surface mineralization options. Cation (Ca2+ and Mg2+) fluxes can be calculated on the basis of chemical analyses of brine compositions and production rate. Cation fluxes for the two field sites (West Pearl Queen and Frio Sand) were calculated given their respective brine compositions. The corresponding estimates were approximately 459 kg of divalent cations per year for the West Pearl Queen site and 5,962 kg of divalent cations per year for the Frio Sand site. These cation fluxes correspond to carbon sequestration potentials via surface mineralization of 502 kg CO2 stored (West Pearl Queen) and approximately 6,550 kg of CO2 (Frio Sand). Conclusions
Demonstrations of the bench-scale and laboratory-scale carbonic anhydrase reactor have been accomplished. Carbonic anhydrase has shown promising results for use as an enzyme to increase the rate of precipitation of carbonate mineral, with produced waters as a cation source. Synthetic produced waters have been used to demonstrate the feasibility of the system. The possibility of overcoming the inhibition of CaCO3 precipitation when the ratio of magnesium ions to calcium ions is higher, by, for example, modest heating of the solution, will be investigated.
Injection (production) capacity analyses performed on several well-scale pilot sites (West Pearl Queen Reservoir and the Frio Sands aquifer) have shown a definitive carbon sink in terms of the possibility of surface mineralization utilizing cations from brines, or the injection of bicarbonate-rich waters at depth. Acknowledgement The authors gratefully acknowledge support from EPRI under contract number WO9000-26. References 1. Wright, J., A. Colling, and Open University Course Team,
Seawater: Its Composition, Properties and Behaviour, 2nd Edition, Pergamon-Elsevier, Oxford, (1995).
2. F.A. Simsek, G.M. Bond and J. Stringer. World Resource Review 2001, 13, 74-90.
3. G.M. Bond, J. Stringer, D.K. Brandvold, F.A. Simsek, M-G. Medina and G. Egeland. Energy and Fuels 2001, 15, 309-316.
4. F.A. Simsek-Ege, G.M. Bond, and J. Stringer. Environmental Challenges and Greenhouse Gas Control for Fossil Fuel Utilization in the 21st Century, edited by Maroto-Valer et al., Kluwer Academic Publishers, 2002, pp. 133-145.
5. G.M. Bond, B.J. McPherson, A. Abel, P. Lichtner, R. Grigg, N. Liu and J. Stringer. Proceedings of the Second National Conference on Carbon Sequestration, (May 5-8, 2003, Alexandria, VA) 2003.
6. Dake, L.P., Fundamentals of Reservoir Engineering. Elsevier Scientific Publishing Company, The Netherlands, (1978).
7. Hendricks, Chris, Carbon Dioxide Removal from Coal-Fired Power Plants. Utrecht, The Netherlands, Kluwer Academic Publishers (1994).
Prepr. Pap.-Am. Chem. Soc., Div. Fuel Chem. 2004, 49 (1), 421

Carbon sequestration strategies for the Southwestern United States
Brian McPherson1
1Petroleum Recovery Research Center
Department of Earth and Environmental Science New Mexico Institute of Mining and Technology
801 Leroy Place Socorro, NM 87801
Introduction Sequestration of carbon emissions in the southwestern U.S. requires strategies tailored for its unique attributes. The region under consideration by the Southwest Regional Partnership for Carbon Sequestration includes five states (Arizona, Colorado, New Mexico, Oklahoma, and Utah) and contiguous areas from three adjacent states (west Texas, south Wyoming, and west Kansas). This region is energy rich (net exporter of electricity, coal, oil and gas), has some of the largest growth rates in the nation, and it contains two major CO2 pipeline networks that presently tap natural subsurface CO2 reservoirs for enhanced oil recovery. The ten largest coal-fired power plants in the region produce 50% of the total CO2 from power-plant fossil fuel combustion, and power plant emissions are close to half the total CO2 emissions. This paper outlines the first phase of efforts to reduce carbon intensity significantly, including unique scientific and engineering strategies specific for the southwest. CO2 Emissions in the Southwest Region About 70 fossil-fuel power plants are located in the region including Arizona, Colorado, New Mexico, Oklahoma, Utah, and southern Wyoming. Their total emissions in 2001 were approximately 260 million tons. Figure 1 summarizes these emissions by state. Of the 260 million tons of CO2 emitted from power plants in the region in 2001, about 90% comes from coal combustion. As the largest 28 emitters are all predominantly coal-fired, efforts to make significant reductions in CO2 emissions must address the large coal-fired power plants. The ten largest power plants emit 50% of the total CO2 from all power plants in the region (Rick Allis, written communication, 2003). We are investigating those factors contributing to the amount of CO2 released per MW-hour, which on average is presently at 1.13 tons CO2 emitted per MW-hour of electricity generated. Comprehensive, EPA-funded reviews of greenhouse gas (GHG) emissions of the southwestern U.S. considered Utah (1990 and 1993), Oklahoma (1990 and 1999), Colorado (1990) and New Mexico (1990). These reviews illustrate that over 95% of all CO2emissions in the region are from fossil fuel combustion. Furthermore, close to half the emissions are from power plants, ranging from 57% in Utah to 44% in Oklahoma in 1990. About 25% of CO2 emissions are from the transport sector. A comparison of EPA estimates of CO2 emissions in 1990 and the 1991 to emissions calculated from power plant generation data shows good agreement for Utah and New Mexico, but EPA estimates for Oklahoma and Colorado appear to be more than 20% too high (Rick Allis, written communication, 2003). The EPA estimates also show over 90% of Colorado’s CO2 emissions in 1990 were offset by land use changes (for example, increases in forest carbon storage), whereas this factor was insignificant in other states in the region. We are investigating and quantifying the region’s emissions as part of this work.
0.0
10.0
20.0
30.0
40.0
50.0
60.0
WY AZ CO OK UT NM
Emissions# Plants
CO
2Em
itted
(106
tons
)
0.0
10.0
20.0
30.0
40.0
50.0
60.0
WY AZ CO OK UT NM
Emissions# Plants
CO
2Em
itted
(106
tons
)
Figure 1. Summary of carbon dioxide emissions in southwestern states. CO2 Mitigation Strategies In the absence of action, current total annual CO2 emissions in the southwestern U.S. are expected to rise from to 500 million tons CO2 per year (2001) to close to 750 million tons/year by 2012. The region can offset much of this growth through various sequestration technologies. The region contains the principal CO2 pipeline infrastructure in the country, much potential exists to offset natural CO2 production with flue gas CO2 from the numerous large coal-fired plants, and diverse set of terrestrial, geologic, and mineralization options are available. Environmental and social consequences are associated with each of these options. Quantifying the consequences is challenging because complex interrelationships link the economy, energy production, population growth, green house gas emissions, and the environment. Establishing and communicating the consequences and tradeoffs between alternative emissions reduction strategies is a possible first step to formulating an effective sequestration program acceptable to the general public. We are also developing and carrying out a unique integrated analysis approach. The analysis is based on a systems-modeling decision framework that provides a means of quantitatively comparing alternative sequestration technologies relative to their associated environmental risks, monitoring and verification requirements, life-cycle costs, and applicable regulatory and permitting constraints. This systems-decision model is being used in: 1) scenario development where policy makers and regulators explore a range of “what if” scenarios, 2) constituency development wherein industry representatives and others can examine the scenario results as a test of environmental viability and practical ability to be implemented, and 3) outreach and education where the model will be taken directly to the public and used as an aid to improve their understanding of CO2/energy cycle issues and complexity, explain the decision process, and be directly engaged in evaluating possible sequestration options.. Identifying and Ranking Sequestration Options Terrestrial sequestration and surface mineralization engineering (use of catalysts; see Bond et al., this volume) offer little risk, or at least known risks because these methods are controlled at the surface. Geologic sequestration, however, offers potential risks to ecosystems and the public primarily in the form of CO2 build-up in the subsurface, unintended mixing of CO2 in good aquifers via leakage, and possible long-term leakage to the surface from wells or fault systems. Identifying and quantifying these risks for the southwest is being carried out by assigning values of “risk factors” into the integrated assessment model, based on oilfield well data and geologic data gathered to ensure potential risks are considered when
Prepr. Pap.-Am. Chem. Soc., Div. Fuel Chem. 2004, 49 (1), 422
evaluating possible sequestration sites, accounting for various monitoring methods. For the southwest, we are adapting a monitoring and verification approach tailored to site-specific requirements, including: (1) regulatory requirements, (2) location specifics, (3) process specifics, (4) monitoring methods, and (5) information management and verification. In addition to characterizing potential risks and developing appropriate monitoring and verification approaches, we are also developing field- and regional-scale computer simulation models to evaluate sequestration processes at potential sites for pilot CO2 sequestration tests. These process simulation models will be used along with the systems-decision model described above to rank possible sequestration sites and technologies. Acknowledgement The author gratefully acknowledges support from the U.S. Department of Energy under project DE-PS26-O3NT41983. The author also is extremely grateful to the dozens of individuals in the Southwest Regional Partnership for Carbon Sequestration, many of whom contributed to this paper. In particular, Rick Allis of the Utah Geological Survey provided especially useful analyses of emissions data for the southwest region.
Prepr. Pap.-Am. Chem. Soc., Div. Fuel Chem. 2004, 49 (1), 423

IEA WEYBURN CO2 MONITORING AND STORAGE PROJECT
Carolyn K. Preston1
Michael J. Monea2
Waleed Jazrawi2
(1) CANMET Energy Technology Centre-Devon, Natural
Resources Canada, 1 Oil Patch Drive, Devon, Alberta, Canada T9G 1A8, [email protected]
(2) Petroleum Technology Research Centre, 6 Research Drive, Regina, Saskatchewan, Canada S4S 7J7,
[email protected] Introduction
The IEA Weyburn CO2 Monitoring and Storage Project is a $28 million (USD) / $40 million (CDN), four year research project that began in August 2000. It builds upon the $1 billion (USD) / $1.3 billion (CDN) commercial CO2-EOR flood operated by EnCana Corporation of Calgary. The CO2 commercial flood operation began in late September 2000 following baseline data collection surveys by the IEA Weyburn project. The baseline data set makes this geological monitoring and verification project truly unique compared to its sister projects elsewhere in the world.
The IEA Weyburn project is managed by the Petroleum Technology Research Centre, located in Regina, Saskatchewan. The project has received financial sponsorship from 6 international government organizations and 9 private corporations from the energy and utility sectors. There are 22 research organizations actively engaged in the project from governments, universities and the private sector. Involvement in the project is global in character with participation from Canada, the United States, Europe and Japan. Project Objective
The overarching objective of the IEA Weyburn project is to predict and verify the ability of an oil reservoir to securely and economically store CO2. The driving forces are:
• a desire to contribute to the reduction of greenhouse gas emissions
• to improve the understanding of the performance of EOR projects on whose success this method of geologic storage directly depends.
Project Management
Research activities in the project are divided into several objectives, applying leading-edge science and engineering in geophysics, geomechanics, geochemistry, geology, reservoir engineering, risk assessment and economics. The research has been performed in over 55 separate tasks. Efficient and effective project management, coordination and integration have been critical to the success of this project. EnCana’s Commercial EOR Operation
The Weyburn field is located in southeastern Saskatchewan, Canada. 366 million barrels of oil were recovered at the Weyburn Unit under primary recovery and waterflood operation between 1955 and 2000, which was approximately 25% of the original oil in place. The estimated CO2-enhanced incremental oil recovery over 30 years is 130 million barrels. The CO2-EOR flood is currently producing over 6000 barrels per day of additional oil.
The source of the CO2 injected at Weyburn is the Great Plains Synfuels Plant operated by Dakota Gasification Company (DGC) in Beulah, North Dakota. DGC owns and operates a new CO2 pipeline for EOR operations in southeastern Saskatchewan and northern North Dakota; EnCana is injecting 5000 tonnes per day of CO2. Currently, EnCana is injecting a further 1200 tonnes per day of CO2 that is recycled from production wells. IEA Weyburn Project Results
A regional geoscience model has been developed incorporating a wide variety of information from geological, hydrogeological, and geophysical tools, including core, well-log, seismic, fluid and lineament data obtained throughout the Williston Basin. This geoscience model is being extensively used in reservoir performance assessment and long-term performance assessment modelling activities.
Geochemical modelling has been based upon fluid monitoring surveys from over 40 wells which have been sampled every 4 months over the four year period of the project. The geochemistry model is also an integral part of the long-term performance assessment work. Geochemical modelling has shown that CO2 is being stored in the reservoir via gaseous, oil, ionic and reservoir rock trapping mechanisms.
There is an important element of human intrusion into the reservoir: over 1000 wells have been drilled at the Weyburn unit, some of which are in active use and some of which have been abandoned. Geomechanics have proven to be critical in understanding the integrity of the wellbores and caprock as well as a key to understanding physical phenomena that may affect the integrity of the natural reservoir “container”.
CO2 movement in the reservoir has been monitored using a variety of geophysical methods including 3D-9C, VSP, crosswell, 4D-3C time-lapse, and microseismic surveys. Deterministic and probabilistic performance assessment methodologies are being investigated to determine the long-term fate assessment of CO2 in the geosphere and the biosphere. Expert Review
At the midpoint of the project, the IEA Greenhouse Gas R&D Programme was asked to lead an external expert review of the IEA Weyburn project. The review panel determined that the project has made substantial progress toward meeting its very challenging objectives. Some knowledge gaps were identified which will be addressed in future work undertaken by the project. Conclusions
The IEA Weyburn project is due to be completed by mid-2004. A second phase of the project is being planned to begin at that time to ensure integrity of the data sets and continued growth of the knowledge base established in phase one. The second phase of the project will focus on determining the most effective monitoring and verification tools for geological storage, developing a better understanding of geological storage and CO2-EOR using data obtained in phase one of the project, filling knowledge gaps, and developing the beginnings of a geosequestration “toolbox”.
Prepr. Pap.-Am. Chem. Soc., Div. Fuel Chem. 2004, 49 (1), 424

Dakota Gasification Company CO2 Sequestration Verification Project
Doug Huxley / CH2M HILL Inc., Ben Feldman / Natsource LLC,
David Peightal / Dakota Gasification Company
CH2M HILL, 9193 South Jamaica Street, Englewood, CO 80112 Introduction
The Dakota Gasification Company (DGC) owns and operates the only commercial synthetic fuel manufacturing facility in North America, the Great Plains Synfuels Plant (GPSP). This facility uses a patented process to convert lignite coal into synthetic natural gas and a number of other byproducts.
One of these byproducts is CO2. Gas separated from intermediate plant products contains the majority of the CO2 , and is approximately 95% CO2, 1% H2S, and 4% hydrocarbons by volume. This gas was previously fed to plant boilers, to destroy the H2S and utilize the heating value of the hydrocarbons, then released to the atmosphere.
DGC realized the potential to capture, compress, and transport this byproduct CO2 for use in oil production, which would allow the sale of an additional product and which would cause a major reduction in GHG emissions. EnCana Corporation expressed an interest in purchasing CO2 for tertiary oil recovery at its Weyburn production unit in Saskatchewan.
In late 2000, DGC completed the construction of a compression system and a 200-mile pipeline (the “Project”) to transport CO2 to Saskatchewan. EnCana currently purchases approximately 38% of the available CO2 Product Gas, and injects it into the oil formation. Pipeline capacity is currently available to allow sale of additional CO2 to other oilfield operators in North Dakota and Saskatchewan.
DGC retained CH2M HILL and Natsource to independently verify the GHG emissions reduction from the Project and to provide advice regarding actions required to allow DGC to take credit for this reduction under applicable regulatory or voluntary GHG programs. This paper presents the results of this effort.
This paper does not address the permanence of the geologic sequestration in the Weyburn oilfield. This topic is the focus of a study coordinated by the International Energy Agency. Draft results of this study are expected in July 2004. Standards and Analysis
Standards for accounting of project-based GHG reductions are not well established. For corporate GHG accounting, the GHG Protocol developed by the World Resources Institute and the World Business Council for Sustainable Development is the most widely-accepted standard. A “road-test” version of the GHG Protocol Project Quantification Standard was released in September 2003, but was not available for this project. The project was therefore performed by incorporating relevant principles from the Energy Information Administration (EIA) reporting guidance, GHG Protocol corporate reporting guidance, CleanAir Canada Inc.’s (CACI) Pilot Emissions Reduction Trading (PERT) project, and other guidance.
The basic steps performed to verify and evaluate the DGC emissions reduction were as follows:
1. Evaluate project boundaries to capture all relevant primary and secondary impacts to direct and indirect emissions.
2. Evaluate estimated baseline emissions, which are the emissions that would have occurred without the Project.
3. Evaluate quantified changes in all direct and indirect emissions within the project boundary versus the baseline.
4. Verify that the estimate meets relevant reporting principles. 5. Identify potential markets for emission reduction credits,
and assess prices for GHG reductions of various vintages.
Results and Discussion
Boundary Definition. The boundaries for this project were defined to include all known impacts to Scope 1 Direct and Scope 2 Indirect emissions, as defined by the GHG Protocol corporate accounting and reporting standard. As such, the boundaries included all operations at the GPSP, the Weyburn unit, and the CO2 pipeline. The reduction estimate was prepared for reporting by DGC; impacts to Weyburn emission sources were thus defined as indirect impacts.
Scope 1 Direct emissions are defined by the GHG Protocol as emissions from sources owned or controlled by the project developers. The one primary impact to direct emissions was the reduction in CO2 directly emitted to the atmosphere through the discharge of the CO2 Product Gas. The GPSP is a highly complex facility with many interconnected process units. Additional fuel, produced internally at the plant, must be fed to the boilers to replace the hydrocarbon content of the CO2 product gas; the production of this additional fuel and the reduced SO2 loading on the flue gas desulfurization system (FGD) causes cascading impacts throughout the entire plant. Secondary impacts to direct emissions were therefore quantified for combustion emissions from the supplementary boiler fuel, raw CO2 content of this fuel, increase in boiler fuel consumption as required to produce additional steam to gasify additional coal to manufacture this fuel, and decrease in CO2 emissions from the ammonia plant to meet the lower FGD demand. GHG emissions due to maintenance of the CO2 pipeline were found to be negligible.
Scope 2 Indirect emissions are defined by the GHG Protocol as emissions from purchased energy. Indirect emissions are defined by the “road-test” project standard as emissions that are a consequence of the project developer, but which occur at sources owned or controlled by another company. No primary indirect impacts resulted from the project. Secondary indirect impacts occurred due to electrical consumption of the new CO2 compressors at the GPSP and Weyburn, and altered electrical consumption at Weyburn due to changes in quantities of managed fluids. Other secondary indirect impacts also resulted from flaring of produced CO2 and hydrocarbons at Weyburn during initial operation of the CO2 flood system.
Electrical usage was impacted at a number of other areas in the GPSP. These other secondary indirect impacts include increase in electrical demand of the oxygen plant to allow additional coal gasification to manufacture additional fuel, decrease in electrical consumption of the compressors that deliver unsold CO2 to the boilers, and changes in electrical consumption at the FGD and the DakSul™ process which converts FGD effluent into fertilizer.
Baseline Definition. Baseline emissions are those GHG emissions that would have occurred in the absence of a project, and are the emissions against which the project reductions are evaluated. The EIA 1605(b) guidance for project reporting1 defines basic and modified reference cases.
A basic reference case is used where emissions would have continued unchanged from historical levels without the project. Although operations at the GPSP are dynamic, varying based on weather, maintenance events, environmental permits, and other factors, no significant changes in plant equipment or operating procedures were implemented after the Project. A basic reference case was thus used against which to evaluate impacts at the GPSP. The Project was implemented less than one year after the last significant plant modification; as a result, historical data could not be used to directly quantify the baseline and extensive chemical process engineering analysis was instead required. This baseline definition will be reassessed during inventory of future reductions.
Oil production operations naturally change with time. The oil yield from Weyburn would have gradually decreased, and water flood rates would have been increased to compensate for this decline,
Prepr. Pap.-Am. Chem. Soc., Div. Fuel Chem. 2004, 49 (1), 425
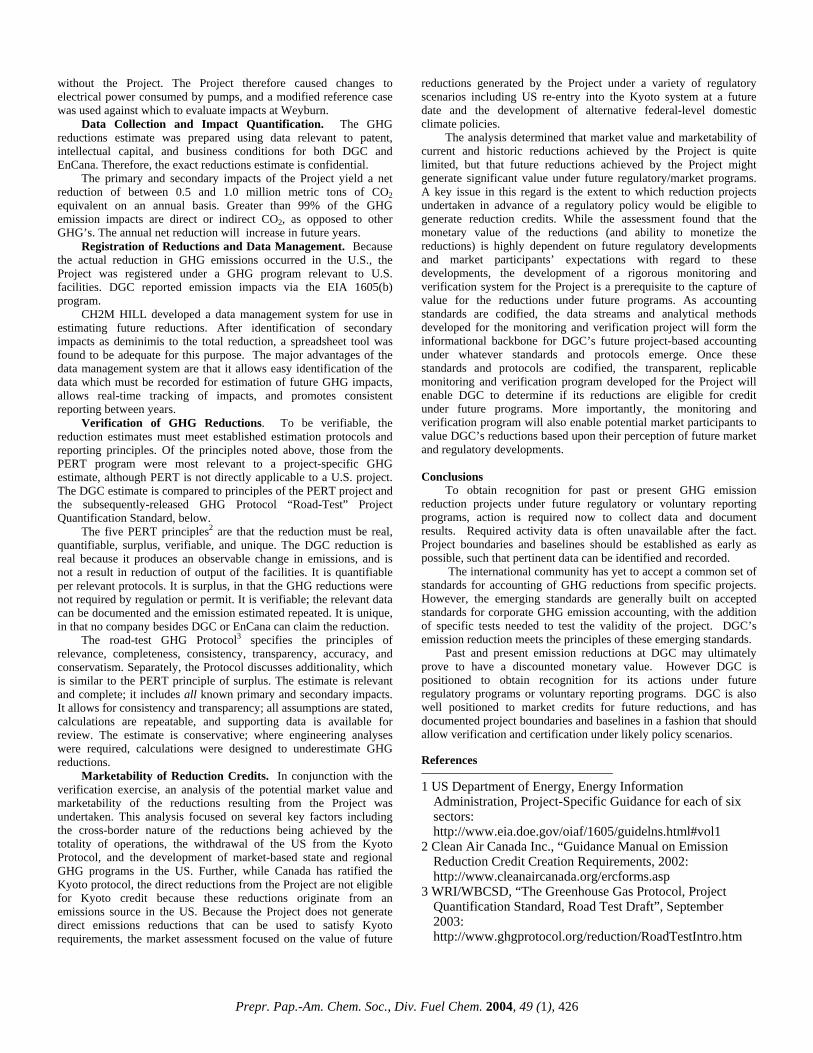
without the Project. The Project therefore caused changes to electrical power consumed by pumps, and a modified reference case was used against which to evaluate impacts at Weyburn.
Data Collection and Impact Quantification. The GHG reductions estimate was prepared using data relevant to patent, intellectual capital, and business conditions for both DGC and EnCana. Therefore, the exact reductions estimate is confidential.
The primary and secondary impacts of the Project yield a net reduction of between 0.5 and 1.0 million metric tons of CO2 equivalent on an annual basis. Greater than 99% of the GHG emission impacts are direct or indirect CO2, as opposed to other GHG’s. The annual net reduction will increase in future years.
Registration of Reductions and Data Management. Because the actual reduction in GHG emissions occurred in the U.S., the Project was registered under a GHG program relevant to U.S. facilities. DGC reported emission impacts via the EIA 1605(b) program.
CH2M HILL developed a data management system for use in estimating future reductions. After identification of secondary impacts as deminimis to the total reduction, a spreadsheet tool was found to be adequate for this purpose. The major advantages of the data management system are that it allows easy identification of the data which must be recorded for estimation of future GHG impacts, allows real-time tracking of impacts, and promotes consistent reporting between years.
Verification of GHG Reductions. To be verifiable, the reduction estimates must meet established estimation protocols and reporting principles. Of the principles noted above, those from the PERT program were most relevant to a project-specific GHG estimate, although PERT is not directly applicable to a U.S. project. The DGC estimate is compared to principles of the PERT project and the subsequently-released GHG Protocol “Road-Test” Project Quantification Standard, below.
The five PERT principles2 are that the reduction must be real, quantifiable, surplus, verifiable, and unique. The DGC reduction is real because it produces an observable change in emissions, and is not a result in reduction of output of the facilities. It is quantifiable per relevant protocols. It is surplus, in that the GHG reductions were not required by regulation or permit. It is verifiable; the relevant data can be documented and the emission estimated repeated. It is unique, in that no company besides DGC or EnCana can claim the reduction.
The road-test GHG Protocol3 specifies the principles of relevance, completeness, consistency, transparency, accuracy, and conservatism. Separately, the Protocol discusses additionality, which is similar to the PERT principle of surplus. The estimate is relevant and complete; it includes all known primary and secondary impacts. It allows for consistency and transparency; all assumptions are stated, calculations are repeatable, and supporting data is available for review. The estimate is conservative; where engineering analyses were required, calculations were designed to underestimate GHG reductions.
Marketability of Reduction Credits. In conjunction with the verification exercise, an analysis of the potential market value and marketability of the reductions resulting from the Project was undertaken. This analysis focused on several key factors including the cross-border nature of the reductions being achieved by the totality of operations, the withdrawal of the US from the Kyoto Protocol, and the development of market-based state and regional GHG programs in the US. Further, while Canada has ratified the Kyoto protocol, the direct reductions from the Project are not eligible for Kyoto credit because these reductions originate from an emissions source in the US. Because the Project does not generate direct emissions reductions that can be used to satisfy Kyoto requirements, the market assessment focused on the value of future
reductions generated by the Project under a variety of regulatory scenarios including US re-entry into the Kyoto system at a future date and the development of alternative federal-level domestic climate policies.
The analysis determined that market value and marketability of current and historic reductions achieved by the Project is quite limited, but that future reductions achieved by the Project might generate significant value under future regulatory/market programs. A key issue in this regard is the extent to which reduction projects undertaken in advance of a regulatory policy would be eligible to generate reduction credits. While the assessment found that the monetary value of the reductions (and ability to monetize the reductions) is highly dependent on future regulatory developments and market participants’ expectations with regard to these developments, the development of a rigorous monitoring and verification system for the Project is a prerequisite to the capture of value for the reductions under future programs. As accounting standards are codified, the data streams and analytical methods developed for the monitoring and verification project will form the informational backbone for DGC’s future project-based accounting under whatever standards and protocols emerge. Once these standards and protocols are codified, the transparent, replicable monitoring and verification program developed for the Project will enable DGC to determine if its reductions are eligible for credit under future programs. More importantly, the monitoring and verification program will also enable potential market participants to value DGC’s reductions based upon their perception of future market and regulatory developments. Conclusions
To obtain recognition for past or present GHG emission reduction projects under future regulatory or voluntary reporting programs, action is required now to collect data and document results. Required activity data is often unavailable after the fact. Project boundaries and baselines should be established as early as possible, such that pertinent data can be identified and recorded.
The international community has yet to accept a common set of standards for accounting of GHG reductions from specific projects. However, the emerging standards are generally built on accepted standards for corporate GHG emission accounting, with the addition of specific tests needed to test the validity of the project. DGC’s emission reduction meets the principles of these emerging standards.
Past and present emission reductions at DGC may ultimately prove to have a discounted monetary value. However DGC is positioned to obtain recognition for its actions under future regulatory programs or voluntary reporting programs. DGC is also well positioned to market credits for future reductions, and has documented project boundaries and baselines in a fashion that should allow verification and certification under likely policy scenarios. References 1 US Department of Energy, Energy Information
Administration, Project-Specific Guidance for each of six sectors: http://www.eia.doe.gov/oiaf/1605/guidelns.html#vol1
2 Clean Air Canada Inc., “Guidance Manual on Emission Reduction Credit Creation Requirements, 2002: http://www.cleanaircanada.org/ercforms.asp
3 WRI/WBCSD, “The Greenhouse Gas Protocol, Project Quantification Standard, Road Test Draft”, September 2003: http://www.ghgprotocol.org/reduction/RoadTestIntro.htm
Prepr. Pap.-Am. Chem. Soc., Div. Fuel Chem. 2004, 49 (1), 426

INTEGRATED NEAR-SURFACE MONITORING AND ANALYSIS FOR CO2 STORAGE VERIFICATION
Jennifer L. Lewicki and Curtis M. Oldenburg
Earth Sciences Division
Lawrence Berkeley National Laboratory 1 Cyclotron Rd.
Berkeley, CA 94720 Introduction
Geologic carbon sequestration is the capture of anthropogenic CO2 and its storage in deep geologic formations. To verify that this storage is effective and that CO2 is not migrating to the near surface and seeping out of the ground, resulting in potential health, safety, and environmental risks, monitoring of storage sites will be necessary. Numerical simulations of leakage and seepage have shown that CO2 concentrations in the shallow subsurface can reach relatively high levels even for modest leakage rates; however, once CO2 seeps into the atmospheric surface layer, winds are effective at dispersing the CO2
1,2. Geologic CO2 storage reservoirs will be chosen in large part for their low probability of CO2 leakage away from the target formation within hundred to thousand year time scales. Therefore, CO2 storage verification will involve searching for potential anomalies, likely of small magnitude, over tens of km2 or more within a system with large spatial and temporal variation of CO2 fluxes and concentrations arising from natural biological and hydrologic processes.
A range of technologies exists to measure CO2 concentrations and fluxes in the shallow subsurface and the atmospheric surface layer. These technologies include (1) the infrared gas analyzer (IRGA) for measurement of point CO2 concentrations, (2) the accumulation chamber (AC) technique3 to measure point soil CO2 fluxes, (3) the eddy covariance (EC) method4 to measure net CO2 flux over a given area, and (4) light distancing and ranging (LIDAR) to measure CO2 concentrations over an integrated path. However, these technologies alone cannot solve the fundamental problem of discerning a small CO2 leakage or seepage signal (LOSS) from the naturally varying background CO2 fluxes and concentrations. Here, we describe the primary sources of background CO2 in the near surface and the processes that control the natural variability of concentrations and fluxes of this CO2. We then propose an integrated measurement, monitoring, and modeling strategy designed to meet the challenge of detecting a small CO2 LOSS within this variability.
Controls on Background Fluxes and Concentrations. We define “background” CO2 as CO2 derived primarily from the atmosphere and biologically mediated oxidation of organic carbon. Background soil CO2 fluxes and concentrations are dependent on CO2 production in the soil, movement of CO2 from sub-soil sources into the soil, and exchange of CO2 with the atmosphere as controlled by concentration (diffusion) and pressure (advection) gradients. Table 1 shows generalized chemical and isotopic signatures related to different background sources of CO2. Biologically produced CO2 in soils (i.e., soil respiration) is derived from root respiration and decay of organic matter. While many factors may influence soil respiration rates, changes in atmospheric and soil temperature and soil moisture have been shown to strongly affect these rates and related concentrations and fluxes. CO2 that enters soil from sub-soil sources can be derived from groundwater degassing of CO2 derived from respiration, atmospheric, and carbonate mineral sources. Also, production of CO2 at sub-soil depths can occur by oxidative decay of relatively young or ancient (e.g., peat, lignite, kerogen) organic matter in the vadose zone. Exchange of soil CO2 from subsurface
sources with the atmosphere can occur by diffusion and/or advection. Diffusive flow depends on the gas production rate and soil temperature, moisture and properties such as porosity, with each of these factors varying in both space and time. Advective flow can be driven by fluctuations in atmospheric pressure, wind, temperature, and rainfall.
Table 1. Chemical and Isotopic Signatures Related to CO2
Derived from Different Sources CO2 source δ13CCO2
(‰) ∆14CCO2
(‰) Near-surface CO2 conc.
CO2 conc. profile with depth
O2 conc. profile with depth
Atmosphere -7 -70 Low - - Root respiration and decay of young soil organic matter
C3plants: -24 to –38 C4plants: -6 to -19
≥ -70 Low to moderate
Increasing through soil zone
Decreasing through soil zone
Decay of ancient organic matter
C3plants: -24 to –38 C4/aquaticplants: -6 to –19 Also age dependent
Highly depleted to absent, depending on age
Low Increasing potentially through vadose zone
Decreasing potentially through vadose zone
Marine carbonate rocks
0 ± 4 Absent Low Increasing through vadose zone
No effect
Fossil fuel Average: -27
Absent Moderate to high
Increasing through vadose zone
No effect
Carbon-13 and 14 values are expressed relative to PDB and oxalic acid decay corrected to 1950, respectively.
Integrated Monitoring Plan. We assume that a given land area above the storage structure can be delineated as the area at risk from unintended leakage and seepage. This area, called the study area, will normally include the surface injection facilities and may extend for many kilometers away from surface facilities depending on the depth and areal extent of the storage reservoir and nature of subsurface structures and hydrologic systems.
Baseline Monitoring and Modeling. Prior to deep CO2 injection, background spatial and temporal variability of subsurface and atmospheric CO2 within the study area should be well understood. Figure 1 shows the general sampling frequencies of the range of background characterization measurements that should be made5. Particular attention should be paid to understanding natural variability in areas where CO2 leakage and seepage would be most likely (e.g., close to the locations of injection and monitoring wells and geologic features such as faults and lithologic contacts). The study area should be characterized with respect to properties (e.g., soil type, soil and soil parent material organic carbon content, vegetation type and density, topography, and surface water hydrology) that could influence and cause important differences in background CO2 concentrations and fluxes. Ecological modeling (e.g., LSM6) and flow and transport modeling (e.g., TOUGH21) should be considered to develop a consistent conceptual model of the sources and sinks of carbon and water within the study area.
To capture both the overall spatial distribution and the small-scale spatial heterogeneity of soil CO2 fluxes, concentrations, and isotopic compositions, fluxes and concentrations should be measured using the AC method and a portable IRGA, respectively, and soil
Prepr. Pap.-Am. Chem. Soc., Div. Fuel Chem. 2004, 49 (1), 427

gases should be collected for chemical and isotopic determinations within the area along a large grid at widely spaced sampling intervals, and along a smaller grid at closely spaced sampling intervals. These measurements should also be made repeatedly over time at several sites to capture diurnal to seasonal variations. The carbon isotopic compositions of soil and sub-soil organic matter should be determined within the study area and measured repeatedly over time at several representative sites. In addition, pre-existing wells within the study area should be sampled to characterize background sub-soil gas chemistry and isotopic compositions (e.g., CO2, O2, δ13C, ∆14C) and their variability with depth.
Soil temperature and moisture and atmospheric temperature, pressure, and wind speed and direction should be monitored contemporaneously with soil CO2 fluxes. Correlation analysis of CO2 flux and environmental parameters should be performed. Using regression analysis, empirical relationships between correlated parameters could be established for the overall area, or each sub-region, if appropriate, and used to predict the background CO2 fluxes expected under a given set of environmental conditions.
If the study area has relatively low slopes and horizontally uniform vegetation type and density as required by the EC method, then an EC station should be deployed during times of meteorologically stable conditions to characterize spatially averaged background CO2 fluxes. The background temporal variability of these fluxes should be established by making measurements over diurnal to seasonal cycles. Eddy covariance CO2 fluxes should be compared to average CO2 fluxes measured by the AC method within the same footprint area to quantify the component of the background EC flux derived from soil and subsoil respiration.
Long-Term Monitoring. A range of measurements should be made within the study area during and after CO2 injection into the storage reservoir at frequencies that will likely change with time following injection (Figure 1)6. The time over which it will be necessary to carry out such monitoring activities following injection is highly uncertain. Monitoring for CO2 leakage and seepage should focus on rapid, economical, reliable measurements of soil CO2 concentration and AC surface CO2 fluxes along grids, supplemented by EC measurements. The objective here is to minimize the number of these measurements and then focus more time- and cost-intensive deep sampling (e.g., of wells, trenches) and isotopic measurements on “high-probability” anomalies. To this end, Bayesian statistical analysis of CO2 flux and concentration measurements should be used to identify the presence (or absence) of CO2 anomalies with high confidence. In addition, maps of sampling areas should be contoured for soil CO2 concentration and flux magnitude and autocorrelation and cross-correlation coefficients of these parameters. Furthermore, measured CO2 fluxes should be compared to the behavior of background CO2 fluxes predicted by ecological models under a given set of atmospheric parameters and assessed for deviations from this behavior. Based on these combined analyses, the locations of further more costly and time-intensive sampling can be determined.
Where anomalously high soil CO2 concentration and flux are located, gases should be sampled from the surface to the water table for chemical and carbon isotopic (δ13C, ∆14C) analyses. An increase in CO2 concentration with depth would indicate CO2 production at depth. Measured CO2 and O2 concentration-depth profiles should be compared to profiles generated by diffusion models of background CO2 respiration and O2 consumption to evaluate a biological respiration source of CO2 at depth. Carbon-13 values at sub-soil depths should be compared to values for soil CO2 and organic matter to look for differences indicative of a distinct source. Very low ∆14C values would be expected at depth with a leaking fossil CO2 source. The potential contribution of CO2 derived from oxidation of ancient
sedimentary organic matter should also be evaluated. Overall, the observations of CO2 and O2 concentration gradients, CO2 production distribution, surface CO2 fluxes, and carbon isotopic compositions must be consistent with the CO2 source.
1 10 100
CO2 Injection for 20 years
time (yr)
Surface mapping of soilsand vegetation
Meteorological monitoring
AC flux
Simulation and modeling
EC flux
Vertical vadose zone gas sampling
Carbon isotope analyses
Soil CO2 concentration
Portable instrument
Fixed automated{
Continuous Periodic As Needed
Subsurface hydrogeologiccharacterization
?
?
?
?
?
?
?
?
?
?
Figure 1. Example activity and schedule chart for CO2 LOSS detection and monitoring showing generalized frequency of measurements (i.e., continuous, periodic, as needed) over time preceding, during, and following CO2 injection. Lighter shading indicates increasing uncertainty in need for activities at long times following injection. Conclusions
A great deal of knowledge and technology exists to detect and monitor CO2. However, despite these resources, discerning a small CO2 LOSS from natural variations will be challenging. The strategy that we propose involves comprehensive baseline monitoring and modeling to develop an understanding of and predictive capability for the natural system in the absence of CO2 LOSS. Once this understanding is achieved and geologic CO2 storage begins, a program of integrated measurement, monitoring, and modeling that emphasizes time and cost efficiency can be applied during and after the injection period. Measurements in conflict with expectations of the natural system should be thoroughly investigated by detailed vertical profile sampling and chemical and isotopic analyses, the results of which could definitively determine if an anomalous source of fossil CO2 consistent with the geologic CO2 storage site is present.
Acknowledgement. This work was supported by the Office of Science, U.S. Department of Energy under Contract No. DE-AC03-76SF00098. We thank Patrick F. Dobson and Sally M. Benson for constructive review of this manuscript. References (1) Oldenburg, C. M., Unger, A. J. A. Vadose Zone J., 2003, 2, 287-296. (2) Oldenburg, C. M., Unger, A. J. A. Vadose Zone J., 2003, submitted. (3) Norman, J. M., Garcia, R., Verma, S. B. J. Geophys. Res., 1992, 97,
18845-18853. (4) Baldocchi, D. D., Valentini, R., Running, S., Oechel, W., and Dahlman,
R. Glob. Change Biol., 1996, 2, 159-168. (5) Oldenburg, C. M., Lewicki, J. L., and Hepple, R. P., Lawrence Berkeley
National Laboratory Report LBNL-54089, 2003. (6) Bonan, G.B., TN-417+STR, NCAR: Boulder, 1996.
Prepr. Pap.-Am. Chem. Soc., Div. Fuel Chem. 2004, 49 (1), 428

Initial results from a 4 km ocean CO2 release experiment
Edward T. Peltzera, Peter G. Brewera, Noriko Nakayamaa, Peter Walza, Izuo Ayab, Ryuji Kojimab, Kenji Yamaneb, Yasuharu
Nakajimac, Peter Haugand, Joakim Hoved and Truls Johannessend
a) Monterey Bay Aquarium Research Institute (MBARI)
7700 Sandholdt Road, Moss Landing, CA 95039 b) Osaka Branch, National Maritime Research Inst. (NMRI)
3-5-10 Amanogahara, Katano, Osaka 576-0034, Japan c)Main Branch, National Maritime Research Inst. (NMRI)
6-38-1 Sinkawa, Mitaka, Tokyo 181-0004, Japan d) University of Bergen, Allegaten 70, N-5007 Bergen, Norway
Introduction
Direct injection of CO2 into the ocean is one idea among several carbon dioxide sequestration proposals under consideration to offset the increase of anthropogenic greenhouse gases in the atmosphere. This tactic raises important questions concerning the impacts of pH changes and elevated CO2 levels for marine ecosystems and the role that ocean sequestration should play in national and international carbon management strategies. While ocean sequestration could reduce the level of atmospheric emissions, it would add to the accumulating burden of fossil fuel CO2 in the ocean. And while there has been considerable debate regarding rising levels of CO2 in the atmosphere and whether they constitute a “dangerous anthropogenic interference” with climate, there has been no such debate regarding acceptable oceanic CO2 levels. In order to address these issues and provide advice to the various world-wide governmental bodies so that policy decisions can be made based upon sound science, new types of in situ experimental investigations are required.
For the past 8 years, we have conducted small-scale experiments on the purposeful release of CO2 into the ocean using MBARI’s advanced remotely operated vehicle (ROV) technology. Apparatus and techniques for the transport and release of 0.4 to 45 kg quantities of CO2 per dive have been developed and we have used this technology to pursue fundamental chemical, physical, and biological studies associated with ocean CO2 sequestration1-4. This technology has also allowed us to conduct several in situ experiments mimicking some of the ocean CO2 sequestration scenarios which have been proposed and to begin the process of understanding the impact of CO2 on the benthic environment5-9.
We report here several recent advances in the refinement and development of new technology for experimental releases of CO2 in the deep sea, and the initial results from an international experiment conducted at 3940m depth in Monterey Bay. Experimental
56L CO2 accumulator. For this experiment the 56L CO2 accumulator10 was thoroughly re-built. A new carbon fiber reinforced fiberglass barrel was fabricated and the aluminum end-caps and piston were replaced with ones made from titanium to alleviate problems with corrosion. The end-caps and piston were redesigned to eliminate voids on the seawater side, while increasing the depth of the recessed cavity on the CO2 side to allow for an internal cooling loop. The extended length of the CO2 end-cap also allowed for a second O-ring seal to solve the leakage problems encountered earlier.
Benthic flume. In order to have more operator control over the plume created during the release experiments, a 'benthic flume' was constructed (Fig. 1). It consisted of a trough for CO2 150 cm long, 40 cm wide and 25 cm deep; a thruster (driven by a computer controlled brushless DC motor) to generate a variable seawater
current along the CO2 trough; and a wave generator paddle. Both the wave paddle and the thruster were controllable in finite increments by the experimentalist in real-time. A clear panel on the front, and an opaque panel on the back, helped to channel the seawater flow through the flume and aided in viewing of the CO2 pool under the various stresses. Power and control of the benthic flume was achieved via the ROV by using an underwater mateable connection.
Figure 1. The benthic flume being lowered into the 10m deep test tank at MBARI. The red thruster propeller is visible at the right end of the trough. For the purposes of this test a three axis velocity meter was mounted at the far left-end.
pH probes and calibration. SBE18 pH sensors (Seabird Electronics, Inc., Bellevue, WA 98005) were used. While these sensors have a nominal depth rating of 1200m, we have found that when they are slowly deployed to depth, they can be used as deep as 4000m. The pH electrodes were calibrated using seawater solutions where the pH had been previously adjusted using concentrated HCl or NaOH to ~6 and ~8 as measured by an IQ240 ISFET pH electrode (IQ Scientific Instruments, Inc., San Diego, CA 92127) that was calibrated using commercially available NBS pH standard solutions.
Figure 2. The seawater re-circulation chamber is visible at left with the Seabird SBE18 pH electrode extending from the top. The recirculation pump is the silver cylinder in the middle of the image. Hydraulically activated quarter-turn valves were used to open and close the chamber and to collect ambient seawater samples.
Prepr. Pap.-Am. Chem. Soc., Div. Fuel Chem. 2004, 49 (1), 429
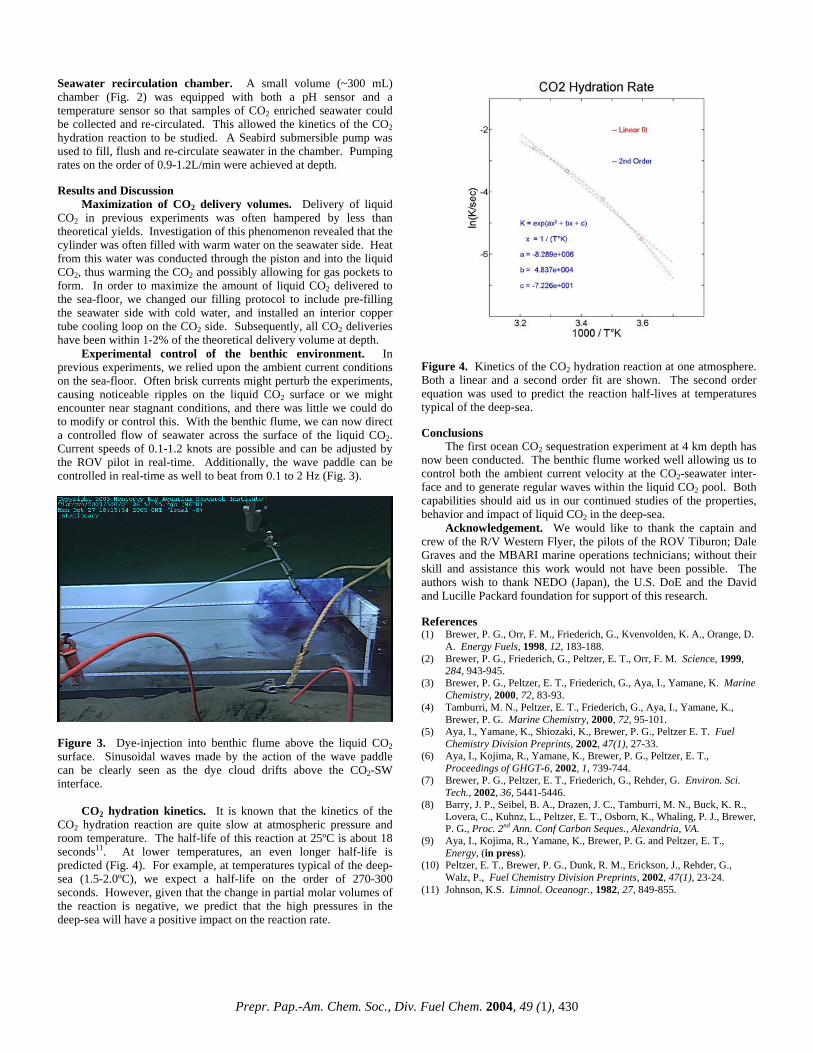
Seawater recirculation chamber. A small volume (~300 mL) chamber (Fig. 2) was equipped with both a pH sensor and a temperature sensor so that samples of CO2 enriched seawater could be collected and re-circulated. This allowed the kinetics of the CO2 hydration reaction to be studied. A Seabird submersible pump was used to fill, flush and re-circulate seawater in the chamber. Pumping rates on the order of 0.9-1.2L/min were achieved at depth. Results and Discussion
Maximization of CO2 delivery volumes. Delivery of liquid CO2 in previous experiments was often hampered by less than theoretical yields. Investigation of this phenomenon revealed that the cylinder was often filled with warm water on the seawater side. Heat from this water was conducted through the piston and into the liquid CO2, thus warming the CO2 and possibly allowing for gas pockets to form. In order to maximize the amount of liquid CO2 delivered to the sea-floor, we changed our filling protocol to include pre-filling the seawater side with cold water, and installed an interior copper tube cooling loop on the CO2 side. Subsequently, all CO2 deliveries have been within 1-2% of the theoretical delivery volume at depth.
Experimental control of the benthic environment. In previous experiments, we relied upon the ambient current conditions on the sea-floor. Often brisk currents might perturb the experiments, causing noticeable ripples on the liquid CO2 surface or we might encounter near stagnant conditions, and there was little we could do to modify or control this. With the benthic flume, we can now direct a controlled flow of seawater across the surface of the liquid CO2. Current speeds of 0.1-1.2 knots are possible and can be adjusted by the ROV pilot in real-time. Additionally, the wave paddle can be controlled in real-time as well to beat from 0.1 to 2 Hz (Fig. 3).
Figure 3. Dye-injection into benthic flume above the liquid CO2 surface. Sinusoidal waves made by the action of the wave paddle can be clearly seen as the dye cloud drifts above the CO2-SW interface.
CO2 hydration kinetics. It is known that the kinetics of the CO2 hydration reaction are quite slow at atmospheric pressure and room temperature. The half-life of this reaction at 25ºC is about 18 seconds11. At lower temperatures, an even longer half-life is predicted (Fig. 4). For example, at temperatures typical of the deep-sea (1.5-2.0ºC), we expect a half-life on the order of 270-300 seconds. However, given that the change in partial molar volumes of the reaction is negative, we predict that the high pressures in the deep-sea will have a positive impact on the reaction rate.
Figure 4. Kinetics of the CO2 hydration reaction at one atmosphere. Both a linear and a second order fit are shown. The second order equation was used to predict the reaction half-lives at temperatures typical of the deep-sea. Conclusions
The first ocean CO2 sequestration experiment at 4 km depth has now been conducted. The benthic flume worked well allowing us to control both the ambient current velocity at the CO2-seawater inter-face and to generate regular waves within the liquid CO2 pool. Both capabilities should aid us in our continued studies of the properties, behavior and impact of liquid CO2 in the deep-sea.
Acknowledgement. We would like to thank the captain and crew of the R/V Western Flyer, the pilots of the ROV Tiburon; Dale Graves and the MBARI marine operations technicians; without their skill and assistance this work would not have been possible. The authors wish to thank NEDO (Japan), the U.S. DoE and the David and Lucille Packard foundation for support of this research. References (1) Brewer, P. G., Orr, F. M., Friederich, G., Kvenvolden, K. A., Orange, D.
A. Energy Fuels, 1998, 12, 183-188. (2) Brewer, P. G., Friederich, G., Peltzer, E. T., Orr, F. M. Science, 1999,
284, 943-945. (3) Brewer, P. G., Peltzer, E. T., Friederich, G., Aya, I., Yamane, K. Marine
Chemistry, 2000, 72, 83-93. (4) Tamburri, M. N., Peltzer, E. T., Friederich, G., Aya, I., Yamane, K.,
Brewer, P. G. Marine Chemistry, 2000, 72, 95-101. (5) Aya, I., Yamane, K., Shiozaki, K., Brewer, P. G., Peltzer E. T. Fuel
Chemistry Division Preprints, 2002, 47(1), 27-33. (6) Aya, I., Kojima, R., Yamane, K., Brewer, P. G., Peltzer, E. T.,
Proceedings of GHGT-6, 2002, 1, 739-744. (7) Brewer, P. G., Peltzer, E. T., Friederich, G., Rehder, G. Environ. Sci.
Tech., 2002, 36, 5441-5446. (8) Barry, J. P., Seibel, B. A., Drazen, J. C., Tamburri, M. N., Buck, K. R.,
Lovera, C., Kuhnz, L., Peltzer, E. T., Osborn, K., Whaling, P. J., Brewer, P. G., Proc. 2nd Ann. Conf Carbon Seques., Alexandria, VA.
(9) Aya, I., Kojima, R., Yamane, K., Brewer, P. G. and Peltzer, E. T., Energy, (in press).
(10) Peltzer, E. T., Brewer, P. G., Dunk, R. M., Erickson, J., Rehder, G., Walz, P., Fuel Chemistry Division Preprints, 2002, 47(1), 23-24.
(11) Johnson, K.S. Limnol. Oceanogr., 1982, 27, 849-855.
Prepr. Pap.-Am. Chem. Soc., Div. Fuel Chem. 2004, 49 (1), 430
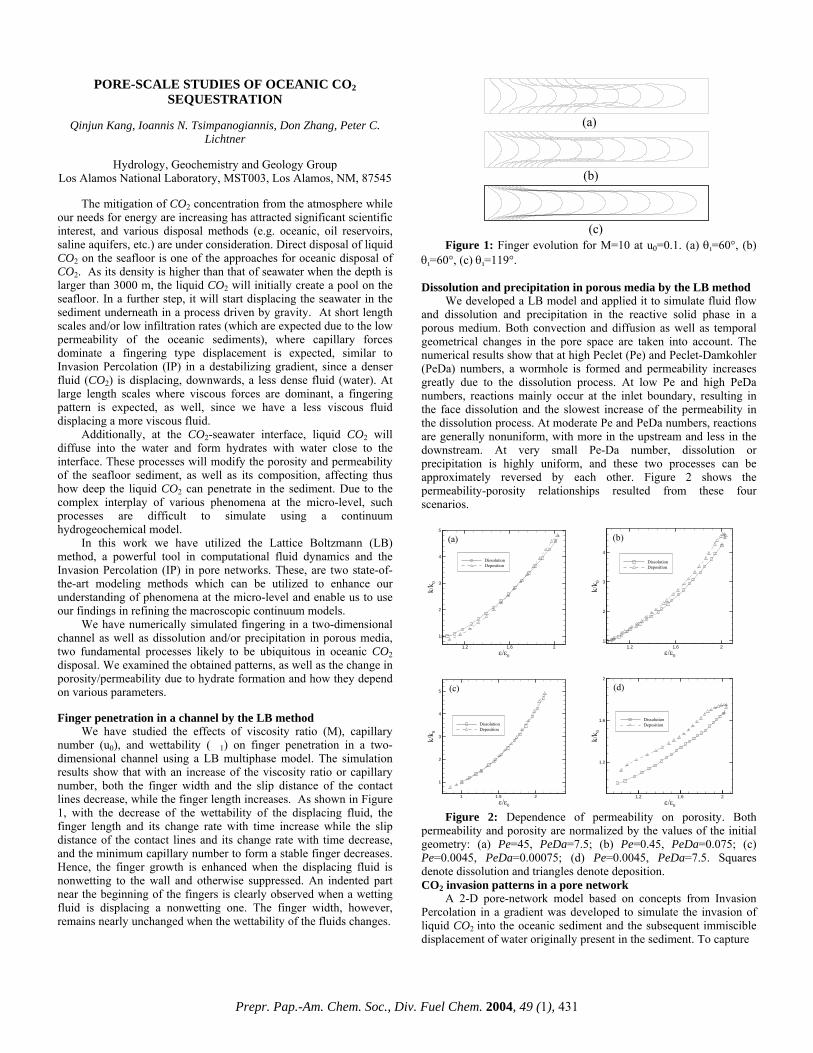
PORE-SCALE STUDIES OF OCEANIC CO2 SEQUESTRATION
Qinjun Kang, Ioannis N. Tsimpanogiannis, Don Zhang, Peter C.
Lichtner
Hydrology, Geochemistry and Geology Group Los Alamos National Laboratory, MST003, Los Alamos, NM, 87545
The mitigation of CO2 concentration from the atmosphere while our needs for energy are increasing has attracted significant scientific interest, and various disposal methods (e.g. oceanic, oil reservoirs, saline aquifers, etc.) are under consideration. Direct disposal of liquid CO2 on the seafloor is one of the approaches for oceanic disposal of CO2. As its density is higher than that of seawater when the depth is larger than 3000 m, the liquid CO2 will initially create a pool on the seafloor. In a further step, it will start displacing the seawater in the sediment underneath in a process driven by gravity. At short length scales and/or low infiltration rates (which are expected due to the low permeability of the oceanic sediments), where capillary forces dominate a fingering type displacement is expected, similar to Invasion Percolation (IP) in a destabilizing gradient, since a denser fluid (CO2) is displacing, downwards, a less dense fluid (water). At large length scales where viscous forces are dominant, a fingering pattern is expected, as well, since we have a less viscous fluid displacing a more viscous fluid.
Additionally, at the CO2-seawater interface, liquid CO2 will diffuse into the water and form hydrates with water close to the interface. These processes will modify the porosity and permeability of the seafloor sediment, as well as its composition, affecting thus how deep the liquid CO2 can penetrate in the sediment. Due to the complex interplay of various phenomena at the micro-level, such processes are difficult to simulate using a continuum hydrogeochemical model.
In this work we have utilized the Lattice Boltzmann (LB) method, a powerful tool in computational fluid dynamics and the Invasion Percolation (IP) in pore networks. These, are two state-of-the-art modeling methods which can be utilized to enhance our understanding of phenomena at the micro-level and enable us to use our findings in refining the macroscopic continuum models.
We have numerically simulated fingering in a two-dimensional channel as well as dissolution and/or precipitation in porous media, two fundamental processes likely to be ubiquitous in oceanic CO2 disposal. We examined the obtained patterns, as well as the change in porosity/permeability due to hydrate formation and how they depend on various parameters. Finger penetration in a channel by the LB method
We have studied the effects of viscosity ratio (M), capillary number (u0), and wettability (�1) on finger penetration in a two-dimensional channel using a LB multiphase model. The simulation results show that with an increase of the viscosity ratio or capillary number, both the finger width and the slip distance of the contact lines decrease, while the finger length increases. As shown in Figure 1, with the decrease of the wettability of the displacing fluid, the finger length and its change rate with time increase while the slip distance of the contact lines and its change rate with time decrease, and the minimum capillary number to form a stable finger decreases. Hence, the finger growth is enhanced when the displacing fluid is nonwetting to the wall and otherwise suppressed. An indented part near the beginning of the fingers is clearly observed when a wetting fluid is displacing a nonwetting one. The finger width, however, remains nearly unchanged when the wettability of the fluids changes.
(a)
(b)
(c) Figure 1: Finger evolution for M=10 at u0=0.1. (a) θ=60°, (b)
θ=60°, (c) θ=119°.
Dissolution and precipitation in porous media by the LB method We developed a LB model and applied it to simulate fluid flow
and dissolution and precipitation in the reactive solid phase in a porous medium. Both convection and diffusion as well as temporal geometrical changes in the pore space are taken into account. The numerical results show that at high Peclet (Pe) and Peclet-Damkohler (PeDa) numbers, a wormhole is formed and permeability increases greatly due to the dissolution process. At low Pe and high PeDa numbers, reactions mainly occur at the inlet boundary, resulting in the face dissolution and the slowest increase of the permeability in the dissolution process. At moderate Pe and PeDa numbers, reactions are generally nonuniform, with more in the upstream and less in the downstream. At very small Pe-Da number, dissolution or precipitation is highly uniform, and these two processes can be approximately reversed by each other. Figure 2 shows the permeability-porosity relationships resulted from these four scenarios.
ε/ε0
k/k 0
1.2 1.6 2
1
2
3
4
5
DissolutionDeposition
(a)
ε/ε0
k/k 0
1.2 1.6 21
2
3
4
DissolutionDeposition
(b)
ε/ε0
k/k 0
1 1.5 2
1
2
3
4
5
DissolutionDeposition
(c)
ε/ε0
k/k 0
1.2 1.6 2
1.2
1.6
2
DissolutionDeposition
(d)
Figure 2: Dependence of permeability on porosity. Both
permeability and porosity are normalized by the values of the initial geometry: (a) Pe=45, PeDa=7.5; (b) Pe=0.45, PeDa=0.075; (c) Pe=0.0045, PeDa=0.00075; (d) Pe=0.0045, PeDa=7.5. Squares denote dissolution and triangles denote deposition. CO2 invasion patterns in a pore network
A 2-D pore-network model based on concepts from Invasion Percolation in a gradient was developed to simulate the invasion of liquid CO2 into the oceanic sediment and the subsequent immiscible displacement of water originally present in the sediment. To capture
Prepr. Pap.-Am. Chem. Soc., Div. Fuel Chem. 2004, 49 (1), 431

the disorder of the oceanic sediment, we assigned random capillary thresholds to the pores during the invasion part of the simulation. This process was also coupled with hydrate formation occurring when the CO2 entered the Hydrate Stability Zone (HSZ). The reaction process was captured by considering a hydrate forming step, in a pore occupied by CO2, for every λ invasion steps (smaller λ implies faster kinetics). Figure 3 shows typical invasion patterns obtained for different cases examined, ranging from very fast hydrate formation kinetics (Figure 3a) to essentially no hydrate forming conditions (Figure 3d). Note that at the limit of fast kinetics, as CO2 enters the HSZ it immediately forms hydrate which results in blocking the pore space, resulting in formation of a thin layer of hydrate which does not allow any further penetration of CO2 into the HSZ. As a result of the pore blocking, a pool of trapped liquid CO2 is formed above the HSZ (Figures 3a-b).
Figure 3: CO2 invasion patterns in a 200x200 pore-network.
Color code: Blue denotes water, green denotes CO2, and red denotes hydrate.
Prepr. Pap.-Am. Chem. Soc., Div. Fuel Chem. 2004, 49 (1), 432

Prepr. Pap.-Am. Chem. Soc., Div. Fuel Chem. 2004, 49 (1), 433
Drop behavior and energy consumption for CO2 oceandisposal using a new injection process via a static mixer
Hideo Tajima, Akihiro Yamasaki, and Fumio Kiyono
National Institute of Advanced Industrial Science andTechnology
16-1 Onogawa, Tsukuba, Ibaraki 305-8569, Japan
IntroductionSeveral scenarios of CO2 disposal into the ocean have been
proposed for a long-term sequestration as a counteractionmeasure for global warming. In the disposal process of liquid CO2,especially, liquid CO2 would be released from a pipeline througha nozzle to the ocean at the depth deeper than 500 m.1 Since thedensity of liquid CO2 is smaller than that of seawater at the depthshallower than 3000 m, the released CO2 drops would ascend tothe ocean surface. During the drop ascending process, the CO2
would be dissolved into the seawater from the drops, and theascending speed would decrease by the reducing size of the drops.The dissolution process should be completed before reaching thesea surface. Since the ascending and dissolution behaviordepends on the size of the released CO2 drops, the releasing sizeof the drop should carefully designed and controlled on theinjection. On the other hand, the effect of CO2 hydrate should beconsidered in the disposal process of liquid CO2, because thethermodynamic condition of CO2 hydrate formation wouldnormally be satisfied in the ocean at depths greater than 500 m (T< 283 K and p > 44.5 bar).2 The nozzle of the CO2 pipeline couldbe blocked by the formation of solid CO2 hydrate upon injectionand sequent the agglomeration of the hydrates, and the blockageshould be prevented for a continuous and stable injection process.
Then, we have proposed a novel injection process of liquidCO2 into the ocean by utilization of a static mixer as a possiblesolution for the above difficulties.3 In this research, behavior ofreleased CO2 drop from the injection process with static mixer wasstudied, and estimation of energy consumption was conducted forthe scale-up of the injection process.
ExperimentalThe typical experimental pressure and temperature were,
respectively, 7.0 MPa and 277 K. The typical flow for liquid CO2
was 46.6-93.4 ml/min, and liquid CO2 flow was installed intodeionized water flow (0.47-2.98 L/min). The two-phase flow wasinjected into the Kenics-type static mixer (Noritake Co. Ltd.,Japan) by the high-pressure pump at once. In the experiment,before injected into the mixer and after released from the mixer,the two-phase patterns of the mixture could be observed in theobservation section made of polycarbonate, and it was recordedby the high-speed video camera (FOR.A Co. Ltd., VFC-1000 andPhotron Ltd.).
Results and DiscussionFigures 1-3 shows typical experimental results for the
mixture of liquid CO2 and water. Liquid CO2 always dispersed inwater flow as drops covered with hydrate film. For the mixtureflow before injected into the static mixer, the drop sizedistributions seemed to conform to the logarithmic normaldistribution. On the other hand, the drop size distributions and
mean drop diameters for the mixture after released from the staticmixer are well characterized by the normal distribution and theSauter mean diameter. The experimental results suggested that thestatic mixer is effective for producing liquid CO2 drops withrelatively uniform size distribution. Moreover, the pipe-blockageby the hydrate formation could be prevented in the presentsystem due to an effective mixing process in the static mixer.Thus, the utilization of static mixer in the injection process ofliquid CO2 into the ocean would be advantageous over simplenozzle injection methods.
a) before injected into the mixer b)after released from the mixer
Figure 1. Typical results of the mixture of liquid CO2 and water.Conditions; CO2 = 93.4 ml/min, Water = 2.03 L/min.
0
0.05
0.1
0.15
0.2
0.25
-6 -4 -2 0 2 4 6
Ni/N
(lnD-lnSMD)/SD
Figure 2. Drop size distribution for Fig.1-a
0
0.05
0.1
0.15
0.2
0.25
0.3
0.35
0.4
-6 -4 -2 0 2 4 6
Ni/N
(D-SMD)/SD
Figure 3. Drop size distribution for Fig.1-b

Prepr. Pap.-Am. Chem. Soc., Div. Fuel Chem. 2004, 49 (1), 434
To examine the feasibility of the present process, a numericalsimulation on the fate of the released CO2 droplets after releasedfrom the static mixer was conducted. The fate of the liquid CO2 inthe ocean is one of key information for estimation of theenvironmental impact caused by the disposed CO2. The severalassumptions were made for the calculations; (1) the released dropis a sphere with uniform initial size, (2) the contribution of thesurface hydrate film was ignored because the film thickness isconsidered much thinner than the drop diameter, (3) the densityof liquid CO2 was constant for simplicity,(4) the drop releasedwould ascend to the sea surface with the terminal velocitydetermined by the size, density of the drop, (5) the each dropwould move independently (no merge or breakup would occur).The dissolution distance of liquid CO2 drop covered with CO2
hydrate film, is expressed as a function of dissolution rate4.However, this equation is only valid for the drop smaller than 0.4mm (Stokes region). Then the equation of dissolution distancewas extended to the higher Reynolds number region.
Figure 4 shows the ascending behavior of the drop withvarious initial diameters, assuming the releasing depth of liquidCO2 500 m. In this condition, the initial diameter should besmaller than 9.1 mm to be dissolved completely before reachingthe sea surface. However, liquid CO2 would be vaporized when thepressure is lower than the saturated vapor pressure, then theascending rate would be accelerated drastically due to the largerdifference in the density between the seawater and gaseous CO2.To avoid the vaporization, the initial diameter of the drop shouldbe smaller than 4.0 mm to be dissolved completely beforereaching the depth of 390 m, where the water pressure equals tothe vaporization pressure for 277 K (about 3.9 MPa).
溶 時間と到達海深の関係
-600
-500
-400
-300
-200
-100
0
0 1000 2000 3000 4000 5000
Time [s]
Dept
h [m
]
Dp=9.1mm,disappearance poin(t=4449.7s)t=–5.6m
Dp=5.3mm, disappearance point(t=2591.6s)=–315.7m
Dp=4.0mm,disappearance point(t=1955.6s)=–395.2m
Dp=0.4mm,disappearance point(t=195.6s)=–499.5m
Figure 4. Ascending behavior of the drop with various initialdiameters
Energy consumption is also one of important factors todiscuss the feasibility of the new injection process. The energyrequired for the injection process is the pressure drop along thestatic mixer. The pressure drop is given by the Fanning equationincluding the individual frictional coefficient of the presentstatic mixer. In the experimental conditions, the maximum energyconsumption was estimated to be 0.83 J/g-CO2. Of course, theenergy consumption becomes smaller than this value as a ratio ofliquid CO2 flow rate to water increase.
For the scale-up of the injection process besed on theexperimental conditions, we assumed a capture and disposal
process of CO2 from 100 MW thermal power plant (CO2 emissionrate = 22.9 kg/s, energy generation per unit CO2 emission = 4365kJ/kg-CO2 generation1). Because it is known from the experimentsthat the ratio of the drop mean diameter to the diameter of themixer is expressed as a function of Weber number, the energyconsumption can be estimated by setting up a drop mean diameter.In here, we assumed that the ratio of liquid CO2 to water flow rateis same to the experimental condition. As summarized in Table 1,when the mean diameter of CO2 drop made to generate in the staticmixer was set up in 4.0 mm, the diameter of the mixer was therange of 1.91 from 0.75 m, and the maximum of the energyconsumption was 0.406 kJ/kg-CO2. This is less than 0.01% to theenergy generation per unit CO2 emission. Even if the diameter wasset up in 0.1 mm, the rate of the energy consumption was 3.14% ofthe maximum. Therefore, it can be said that the static mixer is auniform size CO2 drop generator of which the energyconsumption is very small, and the injection process is veryuseful for CO2 ocean disposal.
Table 1. Estimated results of energy consumption for theinjection process via the static mixer
SMD Partial Ratio of CO2 Mixer Diameter Mean Flow Velocity We Number Energy Consumption Ratio to Power Generation[mm] [kg/kg-total flow] [m] [m/s] [-] [kJ/kg-CO2] [%]
4.0 0.0136 1.912 0.562 1913 0.406 0.00930.0265 1.462 0.486 1118 0.165 0.00380.0251 1.494 0.492 1168 0.178 0.00410.0480 1.148 0.426 689 0.074 0.00170.0750 0.952 0.385 474 0.041 0.00090.1307 0.747 0.338 292 0.019 0.0004
SMD Partial Ratio of CO2 Mixer Diameter Mean Flow Velocity We Number Energy Consumption Ratio of Power Generation[mm] [kg/kg-total flow] [m] [m/s] [-] [kJ/kg-CO2] [%]
0.1 0.0136 0.422 11.56 93 238.8 3.140.0265 0.322 10.00 54 110.1 1.280.0251 0.330 10.11 57 117.2 1.370.0480 0.253 8.77 34 55.3 0.580.0750 0.210 7.92 23 32.9 0.310.1307 0.165 6.95 14 17.1 0.15
ConclusionsFor the new injection process of liquid CO2 into the ocean
using a static mixer, behavior of liquid CO2 in water andestimation of energy consumption to examine the feasibility werestudied. The experimental results suggested that the static mixeris effective for producing liquid CO2 drops with relativelyuniform size distribution. For a simple numerical simulation onthe fate of the released CO2 drops after released from the staticmixer, the initial diameter of the drop should be smaller than 4.0mm to make it dissolve completely when the depth to releaseliquid CO2 is supposed 500 m. The distribution of the drop mustbe taken into consideration to examine in detail. Assuming thatthe CO2 injection process was installed in the disposal process ofemission CO2 from 100MW thermal power plant, energyconsumption to generate drop with mean diameter 4.0 mm wasmuch smaller than the energy generation per unit CO2 emission.The static mixer was a very energy consumed device for thegeneration of uniform size drops. These results indicate that theinjection process via a static mixer is a feasible option for the CO2
disposal process.
References(1) Halmann M. M.; Steinberg M. In Greenhouse Gas Carbon Dioxide
Mitigation; Lewis Publishers: Boca Raton, 1999.(2) Sloan E. D., In Clathrate Hydrates of Natural Gases, 2 Ed, Dekker:
New York, 1998(3) Tajima H.; Yamasaki A.; Kiyono F. Prepr. Pap. – Am. Chem. Soc., Div.
Fuel Chem., 2003, 48 (1), 121(4) Teng H.; Yamasaki A.; Shindo Y. Int. J. Energy Res., 1999, 23,
295