the tennessee department of correction fiscal year 2003 ...€¦ · the tennessee department of...
TRANSCRIPT

The Tennessee Department of Correction Fiscal Year 2003-2004 Annual Report
was coordinated and published by:
Planning and Research Division
Gabrielle L. Chapman, Director Lois E. Holt-Cooper, Coordinating Editor
To request a copy of this report, or other research information, contact us at the following:
Telephone: (615) 741-1000 ext. 4026
FAX: (615) 532-8281
Email: [email protected]
Visit the TDOC Website: www.state.tn.us/correction
Pursuant to the State of Tennessee’s policy on nondiscrimination, the Department of Correction does not discriminate on the basis of race, gender, religion, color, national or ethnic origin, age, disability, or military service in its policies, or in the admission of or access to, or treatment or employment in, its programs, services or activities. Equal Employment Opportunity/Affirmative Action inquiries or complaints should be directed to the Department of Correction, EEO/AA Coordination, Personnel Office, 3rd Floor Rachel Jackson Building, 320 Sixth Avenue North, Nashville, TN 37243-0465, Telephone (615) 741-1000 ext. 1508 or TDD (for persons with hearing impairment) (615) 532-4423. ADA inquiries or complaints should be directed to the Department of Correction, Personnel Office, 3rd Floor Rachel Jackson Building, 320 Sixth Avenue North, Nashville, Tn 37243-0465. Telephone (615) 741-1000 ext. 1508 or TDD (for persons with hearing impairments) (615) 532-4423.

TENNESSEE DEPARTMENT OF CORRECTION
2
Mission, Vision, an Values Statements ................................................................... 5 Organizational Charts ............................................................................................. 7 SECTION I: COMMISSIONERS STAFF Legislative Liaison ........................................................................................... 11 Internal Affairs ................................................................................................. 11 Security Threat Group Management ............................................................. 12 Public Information Office .................................................................................. 12 Planning and Research ................................................................................... 13 Office of the General Counsel ......................................................................... 13 Personnel ........................................................................................................ 15 SECTION II: DEPUTY COMMISSIONER’S STAFF Compliance ...................................................................................................... 20 Accreditation ................................................................................................. 20 Annual Inspections ....................................................................................... 20 Internal Audit ................................................................................................ 20 Tennessee Correction Academy ..................................................................... 21 Food Services .................................................................................................. 22 Health Services ............................................................................................... 22 Mental Health Services .................................................................................... 26 Substance Abuse Program .............................................................................. 27 Engineering ..................................................................................................... 30 SECTION III: ADMINISTRATIVE SERVICES Budget ............................................................................................................. 32 Fiscal Services ................................................................................................ 32 Central Maintenance (Davidson County) ......................................................... 35 Contract Administration ................................................................................... 36 Contract Procurement ..................................................................................... 37 Judicial Expense and Criminal Cost Auditing .................................................. 38 Energy Management and Fire Safety Compliance .......................................... 38 Management Information Services .................................................................. 39 Systems Development Services ................................................................... 39 Operational Support Services ....................................................................... 40 Integrated Technology Services ................................................................... 40 Technical Support Services .......................................................................... 41 SECTION IV: OPERATIONS Programs ......................................................................................................... 43 Classification ................................................................................................ 43 Institutions ................................................................................................... 44 Community Service Work Crews .................................................................. 48 Security Services .......................................................................................... 48 Sentence Management Services .................................................................. 49 Inmate Grievances/Disciplinary Appeals ...................................................... 49 Pre-Release and Transition Services ........................................................... 50
FISCAL YEAR 2003-2004 ANNUAL REPORT
3
Operations (Continued) Volunteer Services ........................................................................................... 51 Inmate Jobs ..................................................................................................... 52 Education ......................................................................................................... 54 SECTION V: DATA AND STATISTICS Admissions .......................................................................................................... 60 Incarcerated Population ...................................................................................... 64 Releases ............................................................................................................. 72 Staff Directory .......................................................................................................... 76 Research Briefs and Publications ............................................................................ 81 ILLUSTRATIONS Organizational Charts ................................................................................................ 7 Correctional Officer Vacancy Rates ......................................................................... 17 Correctional Academy Graduates ............................................................................ 17 Personnel by Race and Gender ............................................................................... 18 Personnel by Class .................................................................................................. 18 Correctional Officer Series ....................................................................................... 18 Substance Abuse Programs .................................................................................... 28 Drug Testing ............................................................................................................ 29 Expenditures Summary ............................................................................................ 33 Analysis of Unit Costs of Service, Actual Expenditures ........................................... 34 Contract Liabilities (estimated) ................................................................................. 36 Facility Custody Levels, Locations, and Acronyms .................................................. 44 Inmate Population by Custody Level ........................................................................ 44 Average Daily Population ........................................................................................ 45 Demographics by Facility ......................................................................................... 45 Facility Populations by Offense ................................................................................ 46 Institutional Programs .............................................................................................. 47 Community Service Work Hours .............................................................................. 48 Inmate Employment ................................................................................................. 53 Education Enrollment ............................................................................................... 55 GED Statistics .......................................................................................................... 55 Vocational Graduates .............................................................................................. 56 Projected Incarcerated Felon Population………….……… ....................................... 59 Felony Admissions by Age ………………………………………………………..60 Felony Admissions by Race ………………………………………………………60 Felony Admissions by Gender….………………………………………………….. ..…..60 Felony Admissions by Type…………………………………………………………….…60
TENNESSEE DEPARTMENT OF CORRECTION
4
Felony Admissions by County of Conviction ............................................................. 61 Felony Admissions by Geographical Region ............................................................ 61 Felony Admissions and Average Total Sentence Length by Primary Offense Group ...................................................................... 62 Felony System wide Admissions by Total Sentence Length .................................... 63 Tennessee Offender Population ............................................................................... 64 TDOC Institutional Capacity and Population Distribution .......................................... 64 Local Jail Census ..................................................................................................... 65 Felony Inmate Population by Age ............................................................................. 66 Felony Inmate Population by Gender, Race and Location ....................................... 66 Felony Inmate Population and Average Total Sentence Length by Primary Offense Group .................................................................................. 67 Inmates Incarcerate Over Ten Years by Primary Offense Group, Average Time Served, and Location .......................................................................................... 68 TDOC Institutions’ Assaults, Deaths, and Escapes .................................................. 68 TDOC Institutions’ Incident Summary ....................................................................... 69 Felony Releases by Age ........................................................................................... 72 Felony Releases by Gender ..................................................................................... 72 Felony Releases by Race ......................................................................................... 72 Felony Releases by Type ......................................................................................... 72 Felony Releases Types and Average Time Served by Primary Offense Group ....... 73 Felony Release and Average Time Served by Primary Offense Group .................... 74

FISCAL YEAR 2003-2004 ANNUAL REPORT
5
MISSION, VISION, VALUES
MISSION
T he mission of the Tennessee Department of Correction (TDOC) is to: • ensure public safety through incarceration of convicted felons; • enhance inmate life skills through selected rehabilitative programming; and • make implementation of cost-effective measures a clear priority.
VISION
T he TDOC will be an organization where employees are: empowered in the decision making process,
involved in the improvement of individual knowledge and skills, the workplace and society, and committed to providing a safe and humane environment and to assisting offenders by providing opportunities for positive behavioral changes.
VALUES
T he TDOC is committed to continuous improvement by working toward a common goal. All employees are encouraged to be flexible, creative, and responsive in meeting the needs of those they manage.
Fair and ethical treatment of convicted felons, respect for fellow employees and the general public, and openness in both internal and external relationships are essential components in effective management of the Tennessee Department of Correction.

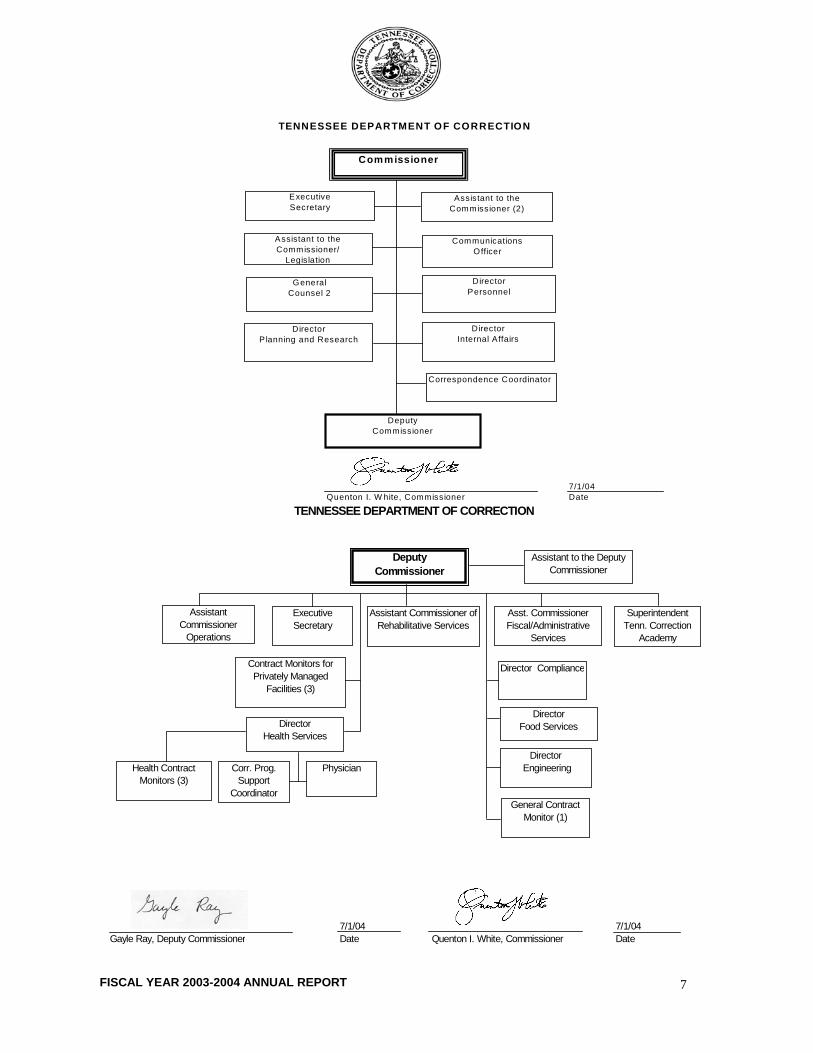
ORGANIZATIONAL CHARTS
FISCAL YEAR 2003-2004 ANNUAL REPORT
7
TENNESSEE DEPARTMENT OF CORRECTION
7/1/04Quenton I. W hite, Commissioner Date
Commissioner
Executive Secretary
Assistant to the Commissioner (2)
Assistant to the Commissioner/
Legislation
GeneralCounsel 2
CommunicationsOfficer
Director P lanning and Research
DirectorPersonnel
DirectorInternal Affairs
DeputyCommissioner
Correspondence Coordinator
TENNESSEE DEPARTMENT OF CORRECTION
7/1/04 7/1/04Gayle Ray, Deputy Commissioner Date Quenton I. White, Commissioner Date
DeputyCommissioner
ExecutiveSecretary
Assistant Commissioner of Rehabilitative Services
Asst. CommissionerFiscal/Administrative
Services
Contract Monitors for Privately Managed
Facilities (3)
Director Compliance
General Contract Monitor (1)
Director Engineering
Director Food ServicesDirector
Health Services
Corr. Prog. Support
Coordinator
PhysicianHealth Contract Monitors (3)
Assistant Commissioner
Operations
SuperintendentTenn. Correction
Academy
Assistant to the Deputy Commissioner
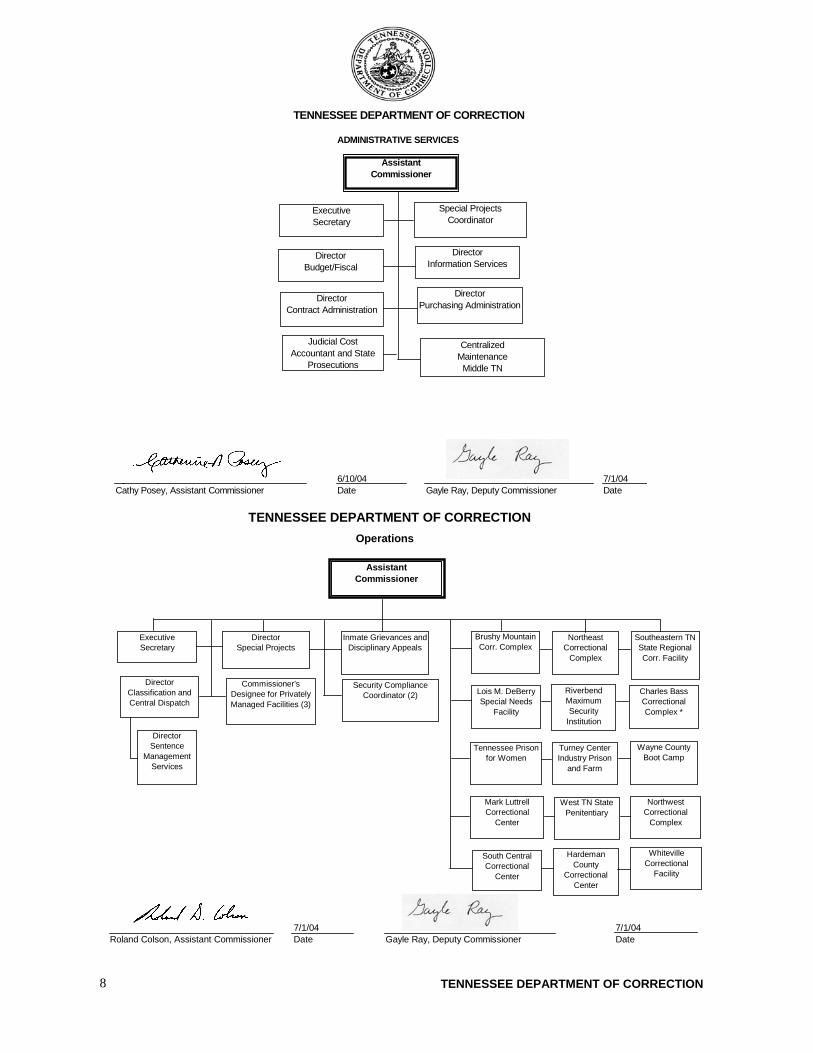
TENNESSEE DEPARTMENT OF CORRECTION
8
TENNESSEE DEPARTMENT OF CORRECTION
ADMINISTRATIVE SERVICES
6/10/04 7/1/04Cathy Posey, Assistant Commissioner Date Gayle Ray, Deputy Commissioner Date
AssistantCommissioner
Special Projects Coordinator
Director Information Services
Director Purchasing Administration
Judicial CostAccountant and State
Prosecutions
Director Budget/Fiscal
Executive Secretary
Director Contract Administration
Centralized MaintenanceMiddle TN
TENNESSEE DEPARTMENT OF CORRECTION
7/1/04 7/1/04Roland Colson, Assistant Commissioner Date Gayle Ray, Deputy Commissioner Date
AssistantCommissioner
Executive Secretary
Director Special Projects
Inmate Grievances andDisciplinary Appeals
Director Sentence
Management Services
Security Compliance Coordinator (2)
Director Classification andCentral Dispatch
Northeast Correctional
Complex
Southeastern TN State Regional Corr. Facility
Brushy MountainCorr. Complex
Lois M. DeBerry Special Needs
Facility
Riverbend Maximum Security
Institution
Charles Bass Correctional Complex *
Tennessee Prison for Women
Turney Center Industry Prison
and Farm
Wayne County Boot Camp
Mark Luttrell Correctional
Center
South Central Correctional
Center
West TN State Penitentiary
Hardeman County
Correctional Center
Northwest Correctional
Complex
Whiteville Correctional
Facility
Commissioner's Designee for Privately Managed Facilities (3)
Operations
FISCAL YEAR 2003-2004 ANNUAL REPORT
9
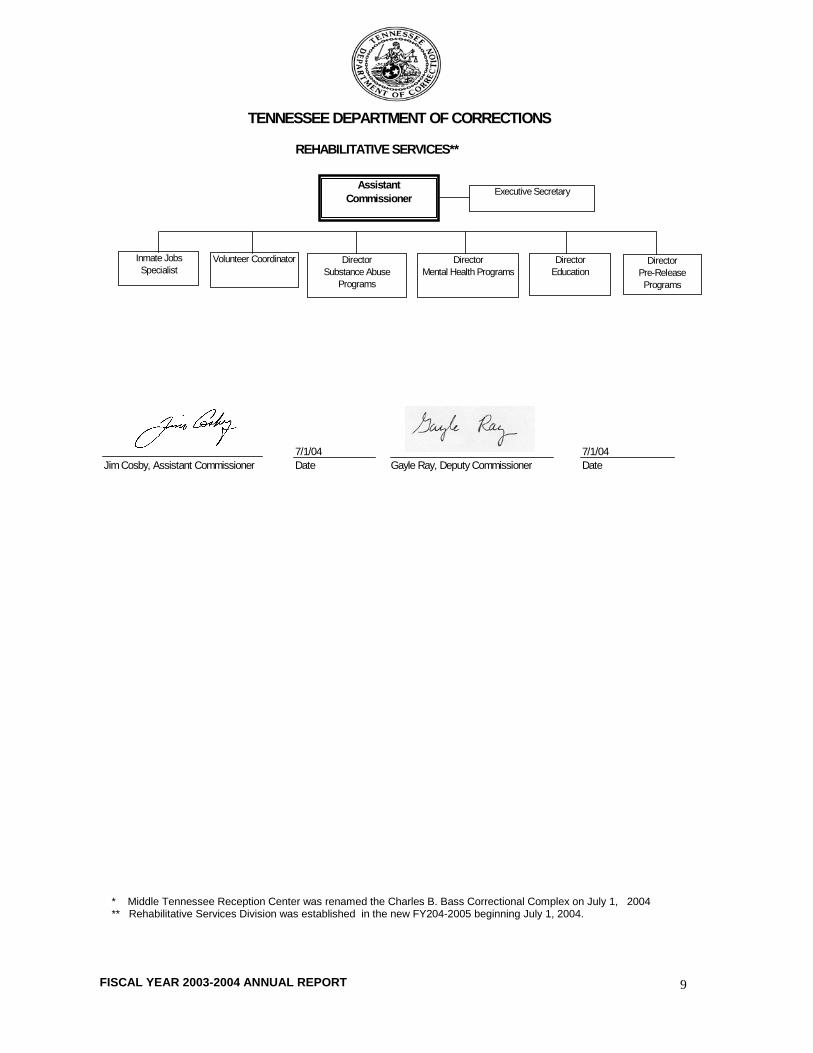
TENNESSEE DEPARTMENT OF CORRECTIONS
REHABILITATIVE SERVICES**
7/1/04 7/1/04Jim Cosby, Assistant Commissioner Date Gayle Ray, Deputy Commissioner Date
Executive Secretary
Inmate Jobs Specialist
Volunteer Coordinator DirectorSubstance Abuse
Programs
DirectorMental Health Programs
DirectorEducation
DirectorPre-Release Programs
AssistantCommissioner
* Middle Tennessee Reception Center was renamed the Charles B. Bass Correctional Complex on July 1, 2004 ** Rehabilitative Services Division was established in the new FY204-2005 beginning July 1, 2004.

COMMISSIONER’ S STAFF

FISCAL YEAR 2003-2004 ANNUAL REPORT
11
LEGISLATIVE LIAISON
The department’s legislative liaison serves as the liaison to members of the General Assembly and the governor’s office. During the legislative session the liaison advises the Commissioner and Tennessee Department of Correction’s (TDOC) staff of proposed bills that might impact the operation of the department and coordinates the department’s review of the pending legislation. In addition, this position is responsible for developing and securing passage of the department’s legislative package. The liaison also monitors the implementation of new laws and informs staff members of statutory changes and possible revisions to department policies. During the 2004 session, the General Assembly passed the department’s sunset legislation that extends the termination date of the TDOC for four years until June 30, 2008. The Sex Offender Treatment Board received a six year extension until June 30, 2010 The legislature approved the renaming of the Middle Tennessee Correctional Complex (MTCX) to the Charles B. Bass Correctional Complex (CBCX) as part of the appropriations bills. Several bills were also passed during the session that will impact the department’s pre-release program. The acts specifically outline the information that the department will provide to an inmate prior to release. The information ranges from restoration of citizenship and voting rights to the availability of programs and services. The Governor signed into law an act that strengthens the state’s sex offender registration and monitoring statute. The TDOC, Board of Probation and Parole, and local law enforcement will be registering agencies for the TBI. Prior to the release of sexual offenders the department will be required to update the offender’s information and forward that data and the signed registration form to the TBI. The General Assembly also approved two studies to be conducted by the department in conjunction with other agencies. The TDOC and the Department of Personnel will study education and employment needs for persons convicted of non-violent offenses. The TDOC, Board of Probation and Parole, the Comptroller of the Treasury, and the Office of Legislative Budget Analysis will examine the release eligibility dates for state felons housed in local jails and the fiscal impact thereof on government spending.
INTERNAL AFFAIRS The Internal Affairs Division is headed by a Director who reports directly to the Commissioner of Correction. The Director manages a division that is comprised

TENNESSEE DEPARTMENT OF CORRECTION
12
COMMUNICATIONS OFFICE The Communications Office is the central point for communication between the TDOC and the general public. The function of this office is to keep the community informed about programs and initiatives involving the department. This includes answering questions from the general public as well as the media. The Communications Officer is responsible for coordinating media relations for the
of six (6) investigators, two (2) administrative personnel, and the Security Threat Group Coordinator, formerly under the Operations Division. The Internal Affairs (IA) investigators are charged with conducting criminal as well as administrative investigations within the TDOC as authorized by the Commissioner. It is also the responsibility of Internal Affairs to foster working relationships with state, local, and federal enforcement agencies. These relationships ultimately benefit the department by maximizing the use of resources that promote effectiveness and proficiency in serving the department and the citizens of Tennessee. Security Threat Group (STG) Management encompasses the identification, monitoring, and tracking of STG members and their affiliates who are assigned to TDOC facilities. The Coordinator of the program is responsible for the collection, assessment, and dissemination of gang intelligence. Each TDOC and contract facility that houses TDOC inmates has an STG coordinator who identifies and monitors STG inmates and gang activity. This information is reported to the STG Coordinator. Currently, there are approximately 1,800 confirmed STG members and 1,600 suspected STG members identified within the various TDOC institutions. The Tennessee Offender Management Information System (TOMIS) and FaceSheet Program allow access to photos, intelligence, and other vital STG related information on affiliated inmates. In FY2000-2001, two departmental policies (STG Intelligence and STG Program Procedures) were drafted and implemented to address STG activity within the department. In April 2001, a three-phrase STG renouncement program was implemented at the Southeastern Tennessee State Regional Correctional Facility in Pikeville, Tennessee. In each phase of the program, which lasts approximately 90 to 120 days, cognitive based behavior modules designed to lessen and ultimately sever the inmate’s affiliation and/or reliance on the gangs are utilized. Currently there are 94 inmates assigned to the STG program. The Coordinator of the STG program is charged with the responsibility of working closely with the wardens, institutional staff, and other law enforcement agencies in an ongoing effort to identify and develop STG information on inmates committed to or released from TDOC institutions.
FISCAL YEAR 2003-2004 ANNUAL REPORT
13
state’s 12 non-contract prisons, as well as the Tennessee Correction Academy located in Tullahoma. The Communication Officer also assists with media relations for the three privately operated facilities that house TDOC inmates. Statewide, there are approximately 600 media outlets that utilize TDOC’s communication office on a daily basis. This office also frequently processes requests from national and international media outlets seeking information on Tennessee’s prison system. These requests cover a variety of correctional issues, including departmental population statistics and death row procedures. The Communications Officer also manages the departmental web site, which has become a valuable tool for dispensing information and facts to the public as well as the media. Users can obtain detailed information about an offender, including to which prison he/she is assigned, as well as a current release date. The web site is routinely updated with pertinent information about the TDOC and includes a page specifically designed for the media.
OFFICE OF THE GENERAL COUNSEL The Office of the General Counsel provides advice, assistance, and training to central office and institutional administrators and staff regarding correctional issues and the impact of changes in the law upon the operation of the department. The office reviews department policies and contracts, administers the interstate agreement on detainers and the interstate corrections compact, and coordinates the extradition process in Tennessee. During the legislative session, it reviews pending legislation for potential impact on the department. The legal section also represents the department in administrative proceedings in which the department is a party. This section assists the office of the Attorney General and approve private counsel in the defense of departmental employees sued by inmates for alleged constitutional civil rights violations. This section also defends the State against claims filed in the Tennessee Claims Commission arising out of the operation of the department.
PLANNING AND RESEARCH The Planning and Research division (P&R) is responsible for providing information, analysis, and research to assist the department’s ongoing and future management, operation and policy initiatives. P&R provides information regarding developing trends, issues, and correctional policy within the TDOC in the form of numerous monthly, quarterly and annual reports, as well as statistical data, fact sheets, and research briefs (several of these reports are available on the department’s web site). The P&R section serves an internal consulting function for the department and directly assists the Commissioner of Correction, executive and legislative
TENNESSEE DEPARTMENT OF CORRECTION
14
of state government, correctional facilities, other TDOC divisions, federal and state agencies, and other organizational and individual entities, including the general public.
Next fiscal year, as part of our commitment to positive change in Tennessee, the P&R team will plan and supervise Tennessee’s first Criminal Justice Summit sponsored by the TDOC. This three-day event will use a holistic approach to bring together all the primary criminal justice stakeholders in the state to discuss key criminal justice issues that affect the great state of Tennessee. These persons will develop and present recommendations for innovative action plans. On the last day of the Summit, the recommendations will be subject to review and analysis by additional criminal justice stakeholders in Tennessee. The Tennessee Criminal Justice Summit will enhance communication, increase awareness, focus the efforts of state, nonprofit, not-for-profit, and private criminal justice entities and serve as a catalyst for positive change in Tennessee. In addition, the TDOC anticipates that the Summit itself, as well as its work product(s), will serve as a best practice model for the nation. P&R coordinates the department’s annual report, compiling and organizing relevant information from the correctional academy, all institutions, and central office. In addition to authoring this document, P&R is also responsible for its proofing, printing, and distribution. P&R also coordinates the department’s annual strategic planning process. The strategic business-planning document is compiled through a multi-stage process by identifying short and long-term goals and objectives for each of the functional areas of the department (e.g., health services and operations). The strategic planning document becomes the foundation for the budgeting process. The annual felon population projections, which signal the beginning of the planning process, are perhaps the most significant responsibility of P&R. These 10-year projections allow the department to monitor offender trends, and to anticipate necessary capital construction as well as the corresponding programming needs of the inmates. Population projections, projected capacity, and projected unmet demand through June 2012 are displayed on page 59. One of P&R’s main research responsibilities is handling and processing all research proposals submitted from within and outside TDOC. P&R reviews, screens, approves, and monitors all research projects conducted in TDOC facilities. P&R is also responsible for identifying, applying for and managing grant and foundation funding opportunities. Additionally, P&R conducts its own research projects. Several projects are currently in process, including research to better understand the causal mechanisms associated with the violation of parole and community supervision, an updated return rate study, and an examination of the public perception of correction.

FISCAL YEAR 2003-2004 ANNUAL REPORT
15
As part of the P&R team, the departmental policy coordinator is responsible for conducting the policy review and development process, as well as policy distribution, training, and uploading of policies onto network servers. Monitoring services are provided as a part of the policy process, and include TDOC and Corrections Corporation of America policy development, review, and distribution, as well as publication of the TDOC Policy Handbook. Monthly reports are provided to management relative to exemptions that have been granted and annual review requirements. The departmental policy coordinator also contributes to the central office accreditation process by maintaining documentation and monitoring compliance with certain ACA standards.
PERSONNEL The Central Office Personnel section provides technical assistance and advice and ensures compliance with Civil Service rules, EEOC/Affirmative Action, state laws, and policies. This section also implements and monitors personnel related programs such as employee relations, recruitment and retention, training, performance evaluations, employee transactions, and employee benefits, including employee assistance, insurance, retirement, family medical leave, worker’s compensation, and accommodations under the Americans with Disabilities Act, etc. Employee grievances and disciplinaries are included in the functions of this section. The Employee Grievance section is a departmental resource that helps employees with respect to correct procedures for resolving grievances, and provides assistance to managers in establishing consistent actions. Quarterly reports are available to aid in establishing consistency in employee disciplinary actions by allowing personnel to better monitor cases and provide feedback to the field. Classes focusing on civil service concepts, disciplinary actions, and grievance procedures are conducted for senior managers at the Tennessee Correction Academy.
TENNESSEE DEPARTMENT OF CORRECTION
16
Personnel pursued the following programs and initiatives in FY2003/2004: • Continued to work with Tennessee Department of Personnel on increasing RN
and LPN salaries • Continued to redesign the interview process format • Continued the maintenance of a toll-free recruitment line for job applicants • Continued to work with MIS on updating the personnel section of the
departmental intranet • Applied for federal grant for recruitment and retention of nurses • Applied for federal grant to repay percentage of student loan for RN’s who go to
work for the state • Developed a co-op program with Tennessee Technology Center for LPN
training at DeBerry Special Needs Facility (DSNF) • Implemented pay differential for part time LPN’s and RN’s • Implemented parity pay scale for nurses • Created and implemented a new ad campaign for media print to aid in recruiting • Implemented a tracking system to gauge effectiveness of advertisements • Enhanced recruitment through internet job posting and visits to nursing schools • Participated in job fairs, military and community career days • Provided counter displays and recruitment flyers to Job Service Offices • Established a full time Nurse Recruiter position • Continued to utilize kiosk program to be used at job fairs, career days, and
nursing schools • Developed recruitment video to focus on different opportunities in the TDOC
FISCAL YEAR 2003-2004 ANNUAL REPORT
17
Table 1: Correctional Officer Series Vacancy Rates from 2004
As of:
Vacant Positions
Total Positions
Vacancy Rate
7/1/04 56 3,318 1.70%
7/1/03 57 3,326 1.71%
7/1/02 85 3,322 2.47%
7/1/01 144 3,221 4.50%
7/1/00 221 3,213 6.90%
7/1/99 163 3,366 5.00%
Table 2: Tennessee Correction Academy Graduates
FISCAL YEAR Year
GRADUATES Guates
2003-2004 584
2002-2003 870
2001-2002 1,098
2000-2001 871
1999-2000 830
1998-1999 1,086
TENNESSEE DEPARTMENT OF CORRECTION
18
Table 3: Personnel by Race and Gender June 30, 2004
Male Female Total White 2,631 1,293 3,924
Minority 581 599 1,180 Total 3,212 1,892 5,104
Table 4: Personnel by Class June 30, 2004
FY03-04 FY02-03 FY01-02 FY00-01 FY99-00 FY98-99
Officials/Administrators
1.8% 1.8% 1.8% 1.9% 1.9% 1.9%
Security 62.0% 60.1% 62.6% 60.5% 59.9% 60.5%
Maintenance 1.2% .6% 1.2% 1.0% 1.0% 1.0%
Professional 14.4% 15.2% 13.9% 14.3% 14.6% 14.4%
Skilled 3.5% .3.5% 3.4% 3.4% 3.4% 3.1%
Clerical 6.1% 6.1% 6.6% 6.6% 6.8% 6.8%
Technical 6.3% 6.7% 7.1% 7.1% 7.3% 7.1%
Para-Professional 4.8% 5.9% 5.2% 5.2% 5.2% 5.5%
Table 5: Correctional Officer Series June 30, 2004
Positions Correctional
Officer Correctional
Clerical Officer Corporal Sergeant Lieutenant Captain TOTAL Total 2,479 137 411 156 75 60 3,318
Filled 2,431 121 391 153 74 60 3,230

DEPUTY COMMISSIONER’S STAFF

TENNESSEE DEPARTMENT OF CORRECTION
20
COMPLIANCE Accreditation - The department continues to maintain its accredited status. Six of our institutions had successful American Correctional Association (ACA) audits during FY2003-2004. Corrections professionals from prison systems outside Tennessee evaluated these sites and found them to meet or exceed nationally recognized standards. TDOC's commitment and ability to comply with the ACA standards result in a safe and constitutional environment for offenders and employees, and institutions that are operationally sound. Mock audits of applicable sites were conducted by the accreditation section to evaluate operational quality and the caliber of the documentation in the accreditation files prepared for the audit teams. Compliance staff participated in all ACA audits, providing technical assistance and support to the institutions and ACA auditors. Annual Inspections - During FY2003-2004, all TDOC and privately operated institutions and the training academy were fully inspected by a team of 10-15 inspectors consisting of personnel from the institutions and central office. The inspections were completed utilizing an inspection instrument designed to monitor policy compliance in each area of the facility's operation. The Compliance section prepared a summary report that detailed deficiencies for each warden or superintendent. The local manager responded with a corrective action plan, and a re-inspection was performed where necessary. The annual inspection process is a cost efficient monitoring mechanism that contributes to the operational quality of the department. Ninety-five percent of all items evaluated were in compliance with policy mandates for FY2003-2004. Internal Audit - During FY2003-2004, Internal Audit conducted fiscal audits of every TDOC institution and the training academy. The goal was to identify and correct fiscal problems prior to any significant loss to the state. Audit reports were submitted by the compliance section to each site to provide the institution's management an opportunity to respond and correct findings. Additional program/fiscal evaluations were performed as directed by the commissioner or deputy commissioner. Reports were filed with the appropriate individuals. Internal Audit contributed to sound fiscal practices in the institutions.
FISCAL YEAR 2003-2004 ANNUAL REPORT
21
TENNESSEE CORRECTION ACADEMY The Tennessee Correction Academy provides continuing job-based professional development skills to newly hired and in-service personnel. In order to accomplish its mission, the Academy actively pursues three principle-driven objectives: 1. Implementing a targeted training system.
2. Operating in a quality environment. 3. Establishing professional development as a clear organizational priority.
During FY2003-2004, the Academy’s six-week basic training program for correctional officers continued to undergo changes geared specifically toward raising standards of accountability, preparedness, and performance. Included among the program adjustments were: • Implementation of a daily physical fitness/wellness and conditioning program to better prepare candidates for the rigors of correctional officer duties. • Raising minimum test score requirements consistent with American
Correctional Association recommendations. • Conducting periodic trainee room inspections. • Establishing additional awards for graduates to recognize those who demonstrate the highest ideals of teamwork, enthusiasm, and professionalism. Other achievements realized during this period were: • The successful delivery of numerous specialty training schools, including Group Counseling Skills, Conflict Resolution, Correctional Emergency Response Team training, Sanitation Officers certification training, Locksmith School, as well as a series of leadership development workshops called “Leadership TDOC” for the department’s most promising candidates for senior positions. • Development of numerous CD-ROM training programs for the department’s institutional staff, e.g., “Security Threat Group Update”, “Title VI”, “Smart Interviewing Strategies”, and “EAP Overview”. • Training nearly 1,000 personnel “off-site”, i.e., at institutions and field offices. • Development and delivery of new management training programs such as “Leadership and the Psychology of Influence” and “Achieving Excellence”. • Initiation of a video-network library of National Institute of Correction training programs for broadcast to departmental work sites. For the coming year, plans are being finalized for the premiere of the “Air Course Academy”, or the Tennessee Correction Academy’s video training network. Through this medium, the Academy will be able to broadcast live, interactive training programs to numerous locations throughout the state.

TENNESSEE DEPARTMENT OF CORRECTION
22
Training program oversight and approval mechanisms for the Academy continued under the leadership and guidance of the Tennessee Department of Correction's Training Advisory Committee.
FOOD SERVICES The Food Services division coordinates the food service operations in all TDOC managed correctional institutions. This division works with the State Food Service Board of Standards, which administers the cook/chill program, and with other correction facilities in Tennessee and outside the state on issues relating to food service. Advice and instruction are provided on operational matters such as controlling food cost, food preparation, receipt of food, compliance with nutritional guidelines, and sanitation. Institutional visits and annual inspections monitor compliance with TDOC policies and ACA standards. The Tennessee Department of Health inspects all food service operations. All Food Service Managers and Assistant Managers are Hazard Analysis of Critical Control Points (HACCP) and ServSafe certified. TDOC Food Services continues to work diligently toward the goal of all Food Service Stewards receiving their HACCP and ServSafe certification as new employees are hired. All new employees are scheduled to attend classes as soon as possible. All TDOC managed institutions are required to fully participate in the cook/chill program. The TDOC purchased 13,141,660 pounds of product for a total of $8,844,000.60 from the production center during FY2003-2004. TDOC facilities utilized USDA commodities when available. TDOC received a total of $140,499.16 from the School Nutrition Program. Each institution used TDOC farm produce in order to decrease overall food cost. During FY2003-2004, approximately 16,005,531.97 meals were served at a cost of $2.67 per day per inmate (this price does not include food, labor, supply, and cook/ chill overhead costs).
HEALTH SERVICES The Division of Health Services coordinates and monitors a comprehensive health care system for TDOC offenders. Each of the fifteen (15) facilities offer primary care services through on-site health clinics and two offer sub-acute inpatient health and acute mental health services - Lois M. DeBerry Special Needs Facility (DSNF) for males, and Tennessee Prison for Women (TPFW) for females. Institutional staff include physicians, physician assistants, nurse practitioners, psychiatrists, psychologists, dentists, dental assistants, registered nurses, licensed practical nurses, nursing assistants, x-ray technicians, medical records clerks, health
FISCAL YEAR 2003-2004 ANNUAL REPORT
23
administrators, mental health and substance abuse counselors, and other qualified health care providers. Scope of Patient Services TDOC is required to provide adequate health care to offenders in accordance with the eighth amendment of the U.S. Constitution and Tennessee State law (TCA 41-1-408 and TCA 41-21-204). Providing adequate health care to more than 19,000 individuals is both costly and complex. While the Department provides only medically necessary care ( no elective or cosmetic procedures), our scope of patient services is comprehensive and is consistent with the primary care and ancillary services generally provided to the general public.
On-Site Patient Services
X-ray
Lab *Infirmary Care
Immuni- zations
Daily Sick Call
Eye Exams
ER Care
Dental
Disease Mgt.
24 hr. Nursing
*Infirmary care is available in only nine facilities. Infirmaries are utilized to house patients in the clinics for medical observation and/or sub-acute care.

TENNESSEE DEPARTMENT OF CORRECTION
24
The following are examples of specialty services available to patients. These services are accessed primarily through DeBerry Special Needs Facility and Tennessee Prison for Women:
− Audiology − Cardiology − Dermatology − Ear, Nose & Throat − Gastroenterology − General Surgery − Infectious Diseases − Nephrology − Neurology − Neurosurgery − OB/Gyn − Oncology − Ophthalmology − Oral Surgery − Orthopedics
− Orthopedic Surgery − Podiatry − Physical Therapy &
Occupational − Pulmology − Radiology
CT/ MRI (mobile) − Rehabilitative Services/
Thoracic Surgery − Rehabilitative Services/
Psychiatry − Urology − Vascular Surgery
-- Other (as needed)
Services are designed to coordinate and integrate each patient’s health care needs. TDOC’s health care system is broad in scope and provides diagnostic and evaluation services, routine medical care, emergency care, chronic disease management, specialty care, medication management, skilled nursing care, and patient education. Any management, treatment, and/or diagnostic services that cannot be managed at the on-site clinic or infirmary are referred to DSNF for males or TPFW for females. The Health Center at DSNF supports a 104-bed sub-acute facility for patients requiring pre-operative, post-operative, convalescent, or palliative care. In addition, Metropolitan Nashville General Hospital maintains a 14-bed acute care secure unit exclusively for the department’s offender population. Costs for Inmate Management During FY2003-2004, it cost approximately $50.50 per day to house an offender in TDOC custody. Health services consumed 20% of the Department’s expenditures; this per diem cost includes $7.91 for medical care, and $1.86 for mental health care per offender. The following is a breakdown of state appropriated dollars reflecting the cost of housing felons in TDOC facilities.
2003 PER DIEM COSTS
Security and Unit Mgt. $23.85 Administration $3.49 Medical Services $ 7.54 Mental Health $2.25 Food Service $ 4.88 Inmate Issue $1.40 Maintenance $ 3.99 Other $4.17
TOTAL $51.57

FISCAL YEAR 2003-2004 ANNUAL REPORT
25
Pharmacy expenditures constitute a significant portion of the health budget. Our medical contractor, reports that total pharmacy costs for 2003 were $5,970,243 for the twelve facilities operated by the State. Of these costs: • $1,514,482 (25% of pharmacy expenditures) was spent for psychotropic
medications prescribed for 16% of the inmate population. • $1,917,734 (32% of pharmacy expenditures) was spent for HIV medications
prescribed for less than 2% of the inmate population. In FY2003, inpatient hospital services, ambulance and emergency room services accounted for a significant portion of the total cost for health services. These figures have been reduced significantly by the contractor implementing utilization management and controlling avoidable hospital days and non-emergent care.
Inpatient and Emergency Costs for FY 2003
Inpatient $ 6,136,583 Emergency Room $ 578,579 Ambulance Services $ 344,882
Contract Services Health services within twelve (12) institutions are jointly managed by TDOC, Correctional Medical Services, Inc. (CMS), Mental Health Management, Inc. (MHM), and Community Service Agencies (CSA). Correctional Medical Services (CMS) provides comprehensive health and dental services at four (4) facilities. At eight (8) facilities, CMS provides physician and dentist staffing as well as specialty, ancillary, and hospital services. Three (3) facilities are privately managed by Corrections Corporation of America (CCA). TDOC provides specific monitoring of health, mental health, and substance abuse contract compliance and quality of care at all facilities. Privately managed (CCA) facilities have onsite TDOC monitors charged with monitoring the general CCA contract. Administrative Support In addition to direct patient care, the division’s functions include health policy development, quality improvement, systemic planning, data collection/analysis, staff development, clinical recruitment and retention, technical support for institutional staff, and oversight of inquiries and grievances concerning inmate health care.

TENNESSEE DEPARTMENT OF CORRECTION
26
MENTAL HEALTH SERVICES TDOC Mental Health Services will operate within the newly created Rehabilitative Services Division effective July 1, 2004. All incarcerated offenders have access to mental health services upon determination of need by staff. All of the state’s correctional facilities have the ability to provide a range of clinical as well as non-clinical interventions. Services include, but are not limited to, mental retardation services, psychiatric in-patient/out-patient care, medication management through psychiatric intervention, individual and group counseling designed to address a range of mental disorders, psychological/psychiatric assessment and evaluation, intensive sex offender treatment, etc. Some mental health programs are provided in a therapeutic community setting. The utilization of a therapeutic community model allows staff to intensify service delivery while in the confines of a more therapeutically controlled environment. The majority of programs are provided in designated areas within the institution. State and federal standards, TDOC mental health policy, and American Correctional Association (ACA) standards govern the delivery of services by this division. The quality of service delivery is monitored through annual inspections, quality improvement studies, site visits, and vendor utilization reporting. A mental health contract compliance monitor routinely monitors various aspects of the department’s behavioral health contract. TDOC’s two primary psychiatric treatment locations are: DeBerry Special Needs Facility (DSNF) - This facility can serve 376+ mentally disordered offenders, including a 64-bed intensive sex offender treatment program, a 24-bed pre-treatment sex offender program, and a 32-bed cognitively challenged sex offender program. South Central Correctional Facility (SCCF) - This facility offers a transitional mental health unit for patients discharged from DSNF and/or patients within the system who require sheltered psychiatric care in an environment less restrictive than DSNF. Both facilities make their services available to the entire adult correctional system in Tennessee. Mental Health Services is actively involved with state and community behavioral health care agencies, universities, and advocacy groups addressing issues such as community transition service delivery and treatment outcomes. During FY2003-2004, there were more than 539 reported instances of patients transitioning through some form of therapeutic isolation. Approximately eight percent of each TDOC facility’s population was receiving some type of psychiatric

FISCAL YEAR 2003-2004 ANNUAL REPORT
27
prescribed medications (these figures do not include patients served at the three (3) privately managed facilities). DSNF, MLCC, and TPFW have a greater psychiatric drug utilization due to their population/mission. During any given month, 19 to 35 percent of the population of these facilities were receiving psychiatric medication. During FY2003-2004, the TDOC Treatment Review Committee was called upon 104 times to review cases involving involuntary treatment interventions. An average of 50 TDOC patients had court appointed conservators during FY2003-2004. The number of TDOC inmates possessing an Axis I and/or an Axis II DSM-IV diagnosis housed in TDOC during this period was estimated to be more than 4,397 (not everyone possessing a DSM may have been actively receiving treatment during this reporting period). Our psychological staff performed approximately 136 parole evaluations at the request of the Board of Probation and Parole, and 4,323 initial classification mental health assessments/evaluations were completed during this period. During FY2003-2004, $10,335,400 was budgeted for mental health services at TDOC operated institutions only (psychopharmacological costs are included).
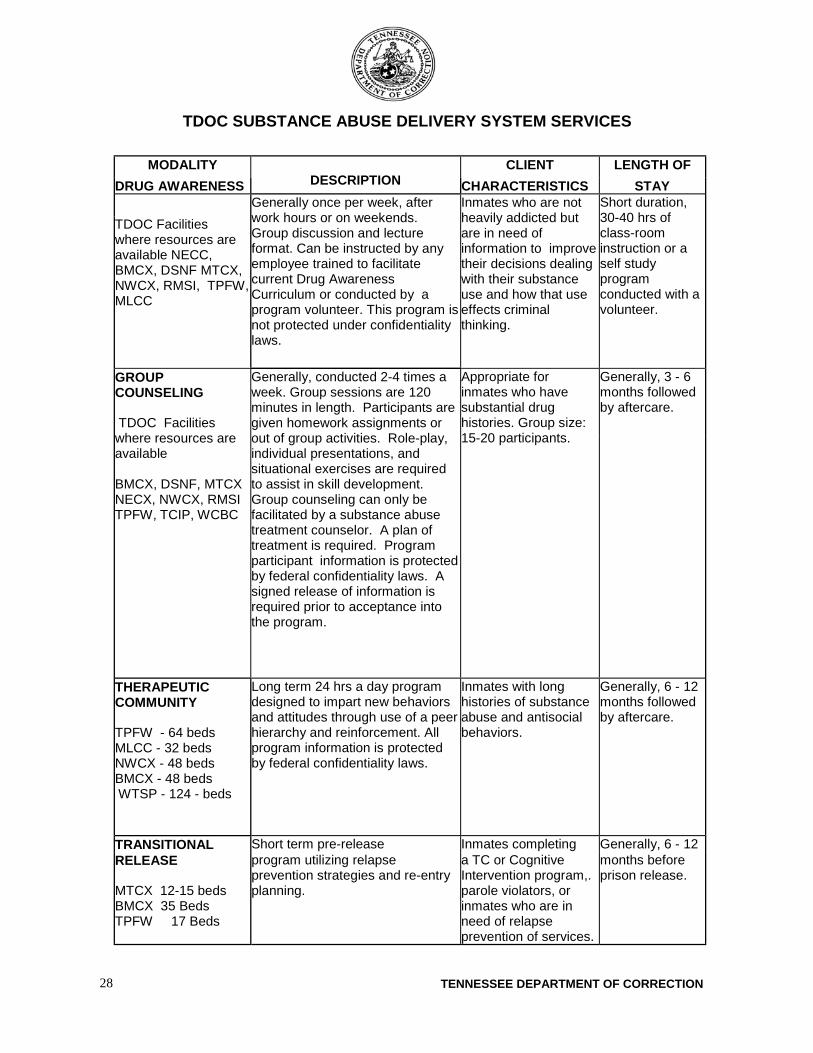
SUBSTANCE ABUSE PROGRAM The goal of the Substance Abuse Program is to provide a continuum of effective substance abuse treatment and programming services for incarcerated felons who have a history of alcohol or drug dependency. Because of the need to provide treatment services to an ever-changing population, a range of treatment programs designed for varying levels of need and motivation have been incorporated. Programming services include drug awareness, group counseling, therapeutic community, and transitional release services.
DRUG TESTING All inmates incarcerated in Tennessee Department of Correction institutions are subject to random drug testing. Using a computer generated list, ten percent of each institution’s in-house population is randomly drug tested each month. Inmates are tested for several different drugs that are commonly used by the population being tested.
TENNESSEE DEPARTMENT OF CORRECTION
28
MODALITY CLIENT LENGTH OF DRUG AWARENESS CHARACTERISTICS STAY
Generally once per week, after work hours or on weekends. Group discussion and lecture format. Can be instructed by any employee trained to facilitate current Drug Awareness Curriculum or conducted by a program volunteer. This program is not protected under confidentiality laws.
Inmates who are not heavily addicted but are in need of information to improve their decisions dealing with their substance use and how that use effects criminal thinking.
Short duration, 30-40 hrs of class-room instruction or a self study program conducted with a volunteer.
TDOC Facilities where resources are available NECC, BMCX, DSNF MTCX, NWCX, RMSI, TPFW, MLCC
GROUP COUNSELING TDOC Facilities where resources are available BMCX, DSNF, MTCX NECX, NWCX, RMSI TPFW, TCIP, WCBC
Generally, conducted 2-4 times a week. Group sessions are 120 minutes in length. Participants are given homework assignments or out of group activities. Role-play, individual presentations, and situational exercises are required to assist in skill development. Group counseling can only be facilitated by a substance abuse treatment counselor. A plan of treatment is required. Program participant information is protected by federal confidentiality laws. A signed release of information is required prior to acceptance into the program.
Appropriate for inmates who have substantial drug histories. Group size: 15-20 participants.
Generally, 3 - 6 months followed by aftercare.
THERAPEUTIC COMMUNITY TPFW - 64 beds MLCC - 32 beds NWCX - 48 beds BMCX - 48 beds WTSP - 124 - beds
Long term 24 hrs a day program designed to impart new behaviors and attitudes through use of a peer hierarchy and reinforcement. All program information is protected by federal confidentiality laws.
Inmates with long histories of substance abuse and antisocial behaviors.
Generally, 6 - 12 months followed by aftercare.
TRANSITIONAL Short term pre-release Inmates completing Generally, 6 - 12 RELEASE MTCX 12-15 beds BMCX 35 Beds TPFW 17 Beds
program utilizing relapse prevention strategies and re-entry planning.
a TC or Cognitive Intervention program,. parole violators, or inmates who are in need of relapse prevention of services.
months before prison release.
DESCRIPTION
TDOC SUBSTANCE ABUSE DELIVERY SYSTEM SERVICES

FISCAL YEAR 2003-2004 ANNUAL REPORT
29
MONTHLY RANDOM INMATE DRUG TEST RESULTS - TDOC
JULY 2003 — JUNE 2004
NUMBER FY 2004 FY 2003 MONTH TESTED REFUSED POSITIVE %POSITIVE %POSITIVE
July 1,512 19 101 8% 3% Aug 1,475 15 39 4% 1% Sept 1,518 9 27 2% 2% Oct 1,587 12 58 4% 2% Nov 1,522 8 54 4% 2% Dec 1,546 9 38 3% 3% Jan 1,512 18 56 5% 3% Feb 1,479 18 51 5% 5% March 1,486 10 50 4% 4% Apr 1,297 9 48 4% 4% May 1,545 7 55 4% 3% June 1,561 15 45 4% 3% TOTAL 18,040 149 622 4% 3%
MONTHLY RANDOM INMATE DRUG TEST RESULTS
JULY 2003 - JUNE 2004
0%
2%
4%
6%
8%
10%
1 3 5 7 9 11
MONTH
POSI
TIVE
RA
TE
FY 2004%POSITIVEFY 2003%POSITIVE

TENNESSEE DEPARTMENT OF CORRECTION
30
ENGINEERING SERVICES The Engineering Services section forms an administrative bridge between the Department of Correction and the architects, engineers, and contractors providing services to individual institutions. This section prepares maintenance and capital improvement budgets, new construction programs, cost proposals, and maintenance and safety policies. Engineering Services reviews construction plans, specifications, and completed work, as well as investigates new building sites and new designs. In addition, the staff serves as liaison between the TDOC, the Department of Finance and Administration’s Capital Project Management division, and the State Building Commission. The Department of Correction has selected the Brushy Mountain Correctional Complex-Morgan Site as the next major expansion site for male inmate beds. The project is currently under design and when construction is complete in 2007, the complex will have a capacity of 2,241 inmates. When the expansion is complete, the Brushy site will no longer house inmates. In April 2004 Bledsoe county was announced as the second major expansion for male inmates. The main design project is expected to be approved by the Building Commission early next fiscal year with construction anticipated to be complete by late 2007. The capacity at the Bledsoe site will be 2,273 inmates at completion.

DIVISION OF
ADMINISTRATIVE SERVICES

TENNESSEE DEPARTMENT OF CORRECTION
32
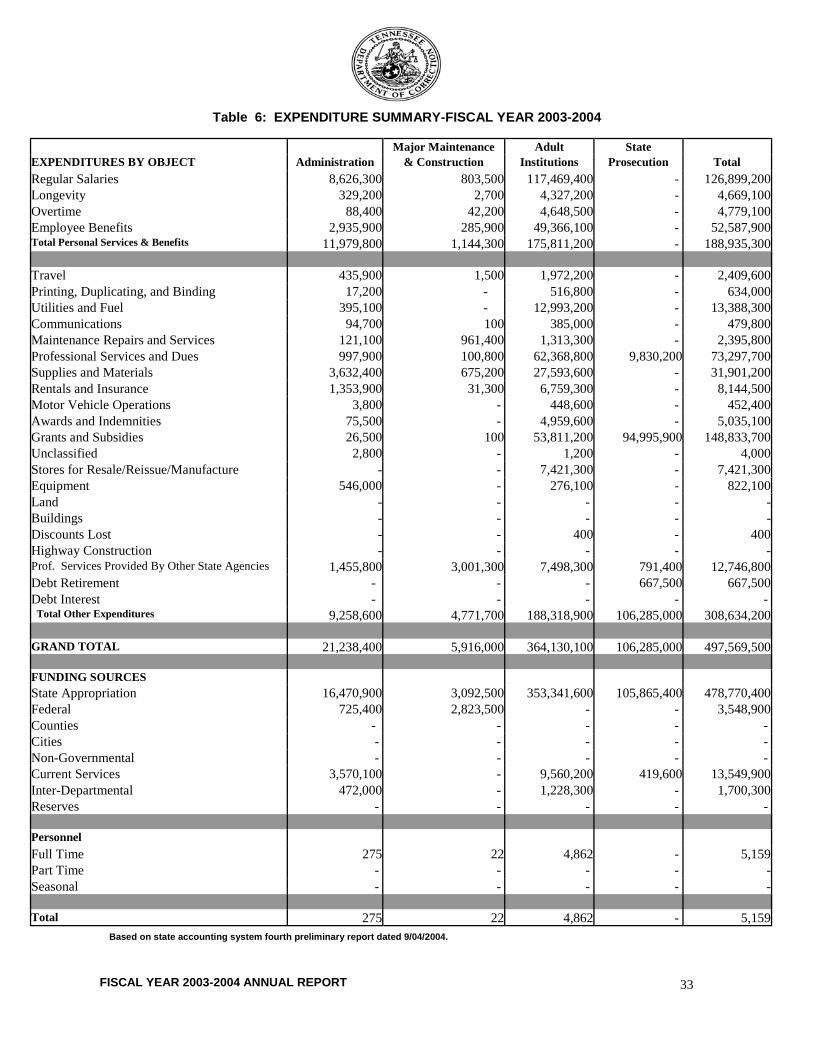
BUDGET The mission of the budget division is to assist the institutions and program directors in the submission, development, and management of the department’s operating budget. This division monitors and authorizes expenditures from the department’s operating funds and monitors and revises the department’s projected revenue collections. Additionally, this division calculates the fiscal impact to the department of proposed legislation on the department and serves as a liaison between the department’s wardens and directors and the Department of Finance and Administration’s budget division. The department’s total operating budget for FY2003-2004 was $543,903,100. Improvements for this operating budget totaled $17,842,700. Of this amount $13,679,600 is for capacity increases and $4,163,100 is for other operating requirements. The department’s actual expenditures were $497,569,600, or approximately 9% under budget. As a result of operating efficiencies and improvements, the department saved substantial tax dollars and reverted approximately 19 million to the State General Fund.
FISCAL SERVICES Fiscal Services’ mission is to support TDOC administration and operations, and to ensure fiscal accountability throughout the department. This section provides technical assistance to the field in all areas of fiscal management (financial reporting and all aspects of accounting, purchasing, payroll, property management, inmate trust fund, commissary, and inventory control). Fiscal Services participates in the development of policies and procedures designed to maximize resources and eliminate fraud and waste. Staff develop training workshops to keep TDOC fiscal staff informed and facilitate continuous improvement by the department. Fiscal Services is the liaison between TDOC and the departments of Finance and Administration, General Services, and the Comptroller of the Treasury for fiscal management responsibilities, and staff work with these agencies to ensure compliance with state laws and regulations. Fiscal Services strives for departmental recognition as an exceptional organization in the area of fiscal management.
FISCAL YEAR 2003-2004 ANNUAL REPORT
33
Based on state accounting system fourth preliminary report dated 9/04/2004.
Table 6: EXPENDITURE SUMMARY-FISCAL YEAR 2003-2004
Major Maintenance Adult State EXPENDITURES BY OBJECT Administration & Construction Institutions Prosecution Total Regular Salaries 8,626,300 803,500 117,469,400 - 126,899,200 Longevity 329,200 2,700 4,327,200 - 4,669,100 Overtime 88,400 42,200 4,648,500 - 4,779,100 Employee Benefits 2,935,900 285,900 49,366,100 - 52,587,900 Total Personal Services & Benefits 11,979,800 1,144,300 175,811,200 - 188,935,300
Travel 435,900 1,500 1,972,200 - 2,409,600 Printing, Duplicating, and Binding 17,200 - 516,800 - 634,000 Utilities and Fuel 395,100 - 12,993,200 - 13,388,300 Communications 94,700 100 385,000 - 479,800 Maintenance Repairs and Services 121,100 961,400 1,313,300 - 2,395,800 Professional Services and Dues 997,900 100,800 62,368,800 9,830,200 73,297,700 Supplies and Materials 3,632,400 675,200 27,593,600 - 31,901,200 Rentals and Insurance 1,353,900 31,300 6,759,300 - 8,144,500 Motor Vehicle Operations 3,800 - 448,600 - 452,400 Awards and Indemnities 75,500 - 4,959,600 - 5,035,100 Grants and Subsidies 26,500 100 53,811,200 94,995,900 148,833,700 Unclassified 2,800 - 1,200 - 4,000 Stores for Resale/Reissue/Manufacture - - 7,421,300 - 7,421,300 Equipment 546,000 - 276,100 - 822,100 Land - - - - - Buildings - - - - - Discounts Lost - - 400 - 400 Highway Construction - - - - - Prof. Services Provided By Other State Agencies 1,455,800 3,001,300 7,498,300 791,400 12,746,800 Debt Retirement - - - 667,500 667,500 Debt Interest - - - - - Total Other Expenditures 9,258,600 4,771,700 188,318,900 106,285,000 308,634,200
GRAND TOTAL 21,238,400 5,916,000 364,130,100 106,285,000 497,569,500
FUNDING SOURCES State Appropriation 16,470,900 3,092,500 353,341,600 105,865,400 478,770,400 Federal 725,400 2,823,500 - - 3,548,900 Counties - - - - - Cities - - - - - Non-Governmental - - - - - Current Services 3,570,100 - 9,560,200 419,600 13,549,900 Inter-Departmental 472,000 - 1,228,300 - 1,700,300 Reserves - - - - -
Personnel Full Time 275 22 4,862 - 5,159 Part Time - - - - - Seasonal - - - - -
Total 275 22 4,862 - 5,159

TENNESSEE DEPARTMENT OF CORRECTION
34
Tabl
e 7
: An
alys
is U
nit C
osts
of S
ervi
ce A
ctua
l Exp
endi
ture
s fo
r Fis
cal Y
ear 2
003-
2004
Tota
l St
ate
Stat
eHe
alth
Stat
eM
enta
l Hea
lthEd
ucat
ion/L
ibrar
yFo
od S
ervic
es
Aver
age
Oper
atin
gAp
prop
riatio
nAp
prop
riate
dSe
rvice
s Cos
tAp
prop
riate
dSe
rvice
sSe
rvice
sCo
st
Daily
Co
sts
Oper
atin
gHe
alth
Per I
nmat
e/M
enta
l Hlth
Cost
Per I
nmat
e/Co
st Pe
r Inm
ate/
Per I
nmat
e
Coun
tPe
r Day
Cost
Per D
ayCo
stPe
r Day
Cost
Per D
ayPe
r Day
Per D
ay
Brus
hy M
ount
ain C
orre
ction
al Co
mple
x1,
525
57.5
4$
55
.57
$
3,43
7,00
0
6.16
566,
400
1.
011.
172.
63$
Hard
eman
Cou
nty C
orre
ction
al Fa
cility
*1,
947
44.1
5$
44
.13
$
0.00
0.00
-
Whit
eville
Cor
recti
onal
Facil
ity*
1,47
4
45
.65
$
45.6
3$
0.
000.
00
DeBe
rry S
pecia
l Nee
ds F
acilit
y73
8
100.
42$
98
.79
$
7,44
8,10
0
27.5
74,
049,
500
14.9
90.
953.
07$
Mar
k Lut
trell C
orre
ction
al Ce
nter
414
72
.14
$
69.1
5$
1,
332,
600
8.
7923
9,40
0
1.58
3.04
2.86
$
Midd
le TN
Cor
recti
onal
Com
plex
1,01
4
59
.58
$
56.9
8$
2,
415,
000
6.
5148
3,90
0
1.30
0.50
2.37
$
North
east
Corre
ction
al Co
mple
x1,
808
46.5
0$
44
.48
$
4,59
4,10
0
6.94
710,
200
1.
071.
732.
50$
North
west
Corre
ction
al Co
mple
x2,
288
45.3
1$
43
.39
$
5,64
4,30
0
6.74
833,
600
1.
002.
912.
75$
Rive
rben
d M
axim
um S
ecur
ity In
stitu
tion
706
70
.51
$
68.8
1$
1,
795,
500
6.
9537
6,90
0
1.46
2.87
2.64
$
Sout
heas
tern
TN
Stat
e Re
giona
l Cor
recti
onal
Facil
ity94
2
52.8
1$
50
.33
$
1,98
7,80
0
5.77
437,
700
1.
272.
422.
64$
TN P
rison
for W
omen
715
59
.91
$
56.6
0$
2,
187,
900
8.
3644
7,20
0
1.71
3.41
2.68
$
Turn
ey C
ente
r Ind
ustri
al Pr
ison
and
Farm
1,09
4
50
.68
$
48.3
5$
2,
613,
200
6.
5334
2,70
0
0.86
2.17
2.74
$
Way
ne C
ount
y Boo
t Cam
p41
3
54.9
6$
52
.76
$
1,00
3,00
0
6.64
139,
700
0.
920.
902.
53$
Wes
t TN
Stat
e Pe
niten
tiary
2,43
1
48
.64
$
47.0
5$
6,
342,
400
7.
1394
1,20
0
1.06
1.94
2.72
$
Sout
h Ce
ntra
l Cor
recti
onal
Cent
er*
1,60
8
39
.18
$
39.1
5$
0.
000.
00-
Tota
l Insti
tutio
ns19
,117
52.0
4$
50
.50
$
40,8
00,9
00
7.
919,
568,
400
1.86
2.00
$2.6
7
Stat
e Pr
osec
ution
s Acc
ount
6,40
6
45
.33
$
45.1
5$
Note
s: *S
outh
Cen
tral's
, Har
dem
an C
ount
y's a
nd W
hite
ville'
s po
pulat
ions
are
not
inclu
ded
in th
e he
alth
, men
tal h
ealth
, and
edu
catio
n co
st pe
r inm
ate
calcu
latio
n.
Foo
d co
st p
er p
erso
n is
base
d on
the
TDOC
Foo
d Se
rvice
Mon
thly
Repo
rt fo
r Jun
e 20
04 a
nd d
oesn
't inc
lude
cont
ract
over
head
cos
ts.

FISCAL YEAR 2003-2004 ANNUAL REPORT
35
CENTRAL MAINTENANCE Central Maintenance provides the TDOC institutions in Davidson County with the required maintenance support to keep facilities operational and safe. This division is formed by a core of building trades specialists and headed by a facility management team. Each facility utilizes inmate labor to provide general facility upkeep, including tasks such as changing light bulbs, making minor plumbing repairs, and other routine maintenance. The complex and unique nature of each of the four Davidson County facilities poses special challenges for a maintenance group. Central Maintenance services facilities which vary from approximately 40 years old to newly constructed, providing services twenty-four hours a day, seven days a week, 365 days a year, as required. Servicing heating and cooling systems, mechanical services, commercial appliances, and electrical systems calls for employees of this section to be highly skilled and work in all kinds of weather and environments. The Davidson County garden and central landscape operation is also operated under the direction of the Central Maintenance Department. The garden is operated on TDOC property adjacent to the DSNF site and contributes fresh seasonal produce as a supplement to the daily meals of all central region facilities. Landscape, mowing of approximately 2200 acres of State property, and centralized recycling services are provided to all TDOC Davidson County facilities as a cost saving measure. Recycled items currently include solid food waste, grease, cardboard, and paper. A comparison study with surrounding state maintenance departments reveals some of the cost savings within the Central Maintenance concept. • The Green River Prison of Kentucky opened in 1994, houses approximately 900
inmates, has 15 buildings and utilizes 13 staff employees plus an inmate labor force.
• The Blackburn Complex, (Minimum Security) of Kentucky opened in 1972,
houses approximately 600 inmates, has 34 buildings and utilizes 4 staff employees plus an inmate labor force.
• The Stone County Facility in Mississippi opened in 2000, houses approximately
365 inmates in 1 large building and utilizes up to 11 staff employees plus an inmate labor force.
The Central Maintenance Department, here in Middle Tennessee, utilizes only 23 staff employees (five management) to maintain four major institutions, one minimum security complex, and the decommissioned Tennessee State Prison grounds. The major institutions have two to four staff as compared to Kentucky’s

TENNESSEE DEPARTMENT OF CORRECTION
36
CONTRACT ADMINISTRATION The Contract Administration section writes and manages contracts, requests for proposals (RFP), and purchase authorizations to assist institutions and central office administrators to procure personal services, professional services, and consultant services vital to the mission of the department. In an era of entrepreneurial government, service contracting is crucial in protecting taxpayers’ interests while achieving the state’s resource development and service delivery goals. The Contract Administration section is responsible for ensuring that the department complies with the statutes, rules, and policies applicable to the service procurement and contracting processes. It serves as a single point of contact between TDOC and the Department of Finance and Administration, Office of Contracts Review. For FY2003-2004, the Department of Correction had total contract maximum liabilities amounting to $177,499,960. Maximum liabilities represent estimated expenditures authorized under contracts and do not necessarily represent actual expenses incurred. The following table shows the relative value of TDOC contracts by general category of service.
Service Category Maximum Liability % of Total
Private Prison Operation $ 79,124,311 44.6%
County Jails 56,293,100 31.7%
Medical Care 36,748,775 20.7%
Mental Health Care 4,053,068 2.3%
Other Professional Services 1,280,706 0.7%
TOTAL $177,499,960 100.0%
Green River 13, or Mississippi’s Stone County 11 and one staff employee at the minimum security complex as compared to four at Kentucky’s Blackburn Complex. The garden, grounds, and recycle operations under Central Maintenance have one employee supervising various inmate labor crews across numerous property sites. The management team and Procurement Officer for Central Maintenance processes over 2,000 procurements per year in support of regional institution parts and service needs. Administration of inspection requirements include but are not limited to TDOC annual inspections and internal fiscal business audits, ACA audits, State Fire Marshall and Health Department inspections, OSHA/TOSHA and EPA regulations, and the overall management of a safe work environment for staff and inmates.
CONTRACT LIABILITIES FY 2003-2004

FISCAL YEAR 2003-2004 ANNUAL REPORT
37
CENTRAL PROCUREMENT The Purchasing Director serves as TDOC’s liaison between the Department of General Services Purchasing Division and all TDOC correctional facilities. This involves answering questions, handling difficult negotiations, resolving complex problems and issues regarding procurement. In addition to these duties, responsibilities of the Procurement Director include: • Reviewing commodities for establishment of statewide contracts for all TDOC
facilities. • Identifying areas where overspending may be occurring in the facilities for
wardens or appropriate staff to respond with justification and/or explanation. • Reviewing commodities for establishment of statewide contracts for all TDOC
facilities. • Standardizing commodities purchased by TDOC facilities. Standardization
teams are in place to review, revise, and determine which commodities are beneficial for TDOC to use.
• Maintaining the Electronic Procurement Request, which has been developed for TDOC for procuring commodities.
All facilities have been on-line with the Tennessee On-line Purchasing System (TOPS) since July 2002. All TOPS contracts that are used by TDOC are stored and maintained on this system. The procurement request and associated bids are entered into this systems database. The requests are electronically reviewed and approved by the appropriate institutional staff, which includes the fiscal director, warden, and management staff (when needed). Once all approvals have been completed, the procurement request is then forwarded to the procurement officer for processing. This includes obtaining appropriate bids when required, ordering, and keying additional information on the electronic procurement system. This system is designed to store all procurement requests for a three-year period. All users of this system can review any procurement request entered. The procurement officers are then required to process the information from the electronic procurement request into the TOPS system to generate a purchase order. At this stage, the purchase orders may receive additional approval from TDOC’s Director of Fiscal Services and from F&A’s budget division, if necessary. Procurement Officers All TDOC facilities have a procurement officer and staff that are responsible for procuring goods and services for their facility. All purchases are made in accordance with purchasing procedures promulgated by the Department of General Services purchasing division.
TENNESSEE DEPARTMENT OF CORRECTION
38
JUDICIAL EXPENSE AND CRIMINAL COST ACCOUNTING The Judicial Expense and Criminal Cost Accounting division works with county officials to ensure that they are reimbursed for housing TDOC felons. There are several conditions under which the state is liable for costs of housing felons: 1. Felons sentenced to serve their time in the local jail. (Tennessee Code
Annotated permits judges to sentence felons to serve their time locally in certain circumstances.)
2. Counties may contract with the state to house felons sentenced to the Department of Correction.
3. The state reimburses counties for housing felons, who have been sentenced to the Department of Correction and are awaiting transfer. 4. Court costs associated with felony charges, transporting inmates, extradition, witnesses fees, jury boarding and emergency medical expenses. The funded appropriation for FY2003-2004 was $104,375,300.
ENERGY MANAGEMENT AND HEALTH & SAFETY COMPLIANCE Energy Management & Facility Safety Compliance provides assistance and technical information to TDOC’s institutional energy coordinators and facility safety officers. Energy Management focuses on maintaining a comfortable and healthy indoor environment while reducing energy and maintenance costs and enhancing equipment performance and reliability. Health and Safety Compliance focuses on compliance with all federal, state, and local laws, rules, regulations and standards regarding institutional safety. Assistance is also provided by conducting lighting, noise, and ventilation testing to help institutions maintain their ACA accreditation status. TDOC institutions continue to make no cost and low energy reduction operational changes. The institutions are involved in pilot projects to evaluate new technologies and their potential for energy savings. The Departmental has begun using an Energy Savings Performance Contract to help further the department’s energy reduction goals. The Department’s Occupational Safety and health Plan was updated during the past fiscal year.
FISCAL YEAR 2003-2004 ANNUAL REPORT
39
MANAGEMENT INFORMATION SERVICES A Management Information Services staff of 60 organized into five collaborative service functions does planning, implementation and maintenance of technology initiatives. The service areas include Systems Development Support, Technology Support Services, Integrated Technology Services, Operational Support Services and Project and Staff Management. Software and application strategy focuses on the department’s mainframe-based Tennessee Offender Management Information System, an XHTML browser front-end to the TOMIS application (eTOMIS), staff-developed browser-based Intranet applications, and the Microsoft Office Suite including Microsoft Word, Excel, PowerPoint, Access and Microsoft Photo Editor. Currently implemented browser applications on the State’s Intranet include eProcurement and Face Sheet. The Department uses the Internet to deliver general interest information and offender-specific data to the public (FOIL). Application development strategy is based on Oracle and DB2 databases, Cobol on the mainframe and ASP applications on Windows 2000 platforms or Java and Java-script applications on Sun Solaris web servers. MIS has filled three of five new programming positions to support distributed systems development. One of the missions of the new programmers is to convert Access databases and applications residing on Novell servers throughout the department’s network to browser based programs. Systems Development Services (SDS) provides support, maintenance, change design, and testing for the Tennessee Offender Management Information System (TOMIS) and its browser-based front-end application known as eTOMIS. SDS also provides development and maintenance support for other business applications. Current and planned web based applications are: 1. Inmate Accounting: A computer-based program to track fees, commissary, purchases and inventory. 2. FaceSheet: A photo-driven application that displays pictures of offenders and their scars, marks and tattoos. 3. Needs Assessment: A fact-gathering electronic tool to assess offender treatment needs within the institution. 4. Electronic Health Records: A customized health care delivery system for tracking real-time clinical, medications, exam protocols, schedules and other health care subsystems. 5. Internal Affairs: A filing system to securely manage and track investigations. 6. Document Storage: Electronic imaging of all inmate records. SDS utilizes a team approach composed of two separate groups, analysts (12) and

TENNESSEE DEPARTMENT OF CORRECTION
40
programmers (6). Half of the analyst’s time is devoted to TOMIS enhancements to improve operation, data sharing at both the state and local levels, and collection of offender data prior to admission. Other SDS staff assist end users with various user needs by means of MIS’s Help Desk. SDS programmers use varied languages (ASP, NET, Visual Basic, etc.) to implement new applications and/or new design changes. The SDS staff works closely with the Systems Development Support staff of the Department of Finance and Administration, Office of Information Resources (OIR), which provides approximately 7,000 hours of programming support for TOMIS annually, at a cost of approximately $437,500.
Operational Support Services is responsible for scanning archived offender records to digital images and microfilm, maintaining archived medical and institutional records, distributing TOMIS generated reports, and maintaining the electronic fingerprint system. The production section is responsible for scanning and indexing all active and inactive offender records. The records section processes over 400,000 pieces of mail annually, in addition to approximately 3,300 yearly requests for offender file records. It also processes about 2,500 yearly requests for offender medical records. The records section manages warehousing archived medical and institutional records at the Tennessee State Penitentiary. Presently, there are more than 4,000,000 documents housed at this site. OSS archives institutional and medical records of offenders released at sentence expiration, deceased inmates, or inmates on parole for more than two years. Technical support staff submits all TOMIS batch schedules, and maintains the Kodak image retrieval system and the Printrak fingerprint system
Integrated Technology Services is responsible for repair, preventive maintenance and upgrades of security electronic systems. These systems include fence detection systems, electronic door control systems, alarm annunciation panels, programmable logic controllers, video display controls, closed circuit TV, paging and intercom systems, remote alarm enunciation systems, and fiber based networks for maintenance, video, and security. During FY ’04, Taut-Wire fence alarm detection systems were added to 6 sites through a project funded by Capital Projects. ITS is also responsible for installation and maintenance of network and desktop hardware and software for all TDOC facilities. Because the field operation of TDOC is a non-consolidated entity, the ITS staff also performs network administration tasks, including maintaining user security and GroupWise accounts, system backups, and virus protection. They also provide TOMIS access support to local sheriffs’ and jails that are Host On Demand users of the mainframe system. Most of these services are supported on a 24X7 basis.

FISCAL YEAR 2003-2004 ANNUAL REPORT
41
Technical Support Services provides desktop hardware and software support assistance to users in the central office. It defines technical specifications for required equipment, software, and place, track, receive, and install orders. This staff handles an average 200 requests for assistance each month through e-mail or verbal requests. The group also maintains and updates the Victim Offender Information Caller Emissary (VOICE); a system designed to allow registered victims to retrieve selected automated offender information from TOMIS via telephone. TSS is responsible for support of the department’s videoconference equipment in all facilities.

INSTITUTIONAL OPERATION
DIVISION

FISCAL YEAR 2003-2004 ANNUAL REPORT
43
PROGRAMS Program areas listed below are part of TDOC’s Operations Division. Program staff in each of these areas provide overall support to central office and the facilities on a daily basis. Classification/Sentence Management Services Community Work Programs Education Inmate Grievances/Disciplinary Appeals Inmate Jobs Security Services Volunteer Services All TDOC facilities and the commissioner’s designees for privately managed facilities are also included in this division. CLASSIFICATION The Classification section is responsible for two significant areas: Inmate Classification and Sentence Management. Classification is responsible for the implementation and maintenance of the system which manages the progression of inmates through levels of custody/risk from the point of intake into TDOC custody and throughout their incarceration. The classification process evaluates current and past information about inmates which aids in making appropriate recommendations concerning levels of supervision (custody) and programs participation. A major objective is to involve inmates in programs consistent with the safety and protection of the public, TDOC staff, and other inmates. Emphasis is given to custody and security, i.e., necessary levels of supervision as determined from the recency, severity, and frequency of an individual’s institutional conduct and criminal conviction history. The process of evaluation occurs continually throughout an inmate’s period of incarceration, and is managed at the institutional level by correctional classification coordinators. Classification is also responsible for ensuring that the inmate population levels of the institutions do not exceed capacity limits. This is accomplished by authorizing admissions of inmates to the department’s reception centers from county jails on a daily basis contingent upon available bed capacity. Further, the section monitors and approves, on the basis of population levels, inter-institutional transfers of inmates.

TENNESSEE DEPARTMENT OF CORRECTION
44
INSTITUTIONS
3
26
8
4
5
17
9 10
County Facility Acronym Security Level
1. Bledsoe County Southeastern Tennessee State Regional Correctional Facility STSR III
2. Davidson County DeBerry Special Needs Facility DSNF IV
Middle Tennessee Correctional Complex MTCX III
Riverbend Maximum Security Institution RMSI IV
Tennessee Prison for Women TPFW IV
3. Hardeman County Hardeman County Correctional Facility HCCF II
Whiteville Correctional Facility WCFA II
4. Hickman County Turney Center Industrial Prison and Farm TCIP III
5. Johnson County Northeast Correctional Complex NECX IV
6. Lake County Northwest Correctional Complex NWCX III
7. Lauderdale County West Tennessee State Penitentiary WTSP IV
8. Morgan County Brushy Mountain Correctional Complex BMCX IV
9. Shelby County Mark Luttrell Correctional Center MLCC III
10. Wayne County South Central Correctional Facility SCCF III
Wayne County Boot Camp WCBC I
FIGURE 1: Custody Levels, Security Designations and Facility Locations June 30, 2004
CUSTODY LEVEL
NUMBER OF OFFENDERS
PERCENT OF TOTAL
Maximum 857 4.4% Close 431 2.2% Medium 14,407 74.1% Minimum 3,113 16.0% Unclassified 635 3.3% TOTAL 19,443 100.0%
LEVEL
III MediumIII CloseIV Maximum
INSTITUTIONAL SECURITY LEVELS
Minimum Direct/Trusty
CUSTODY
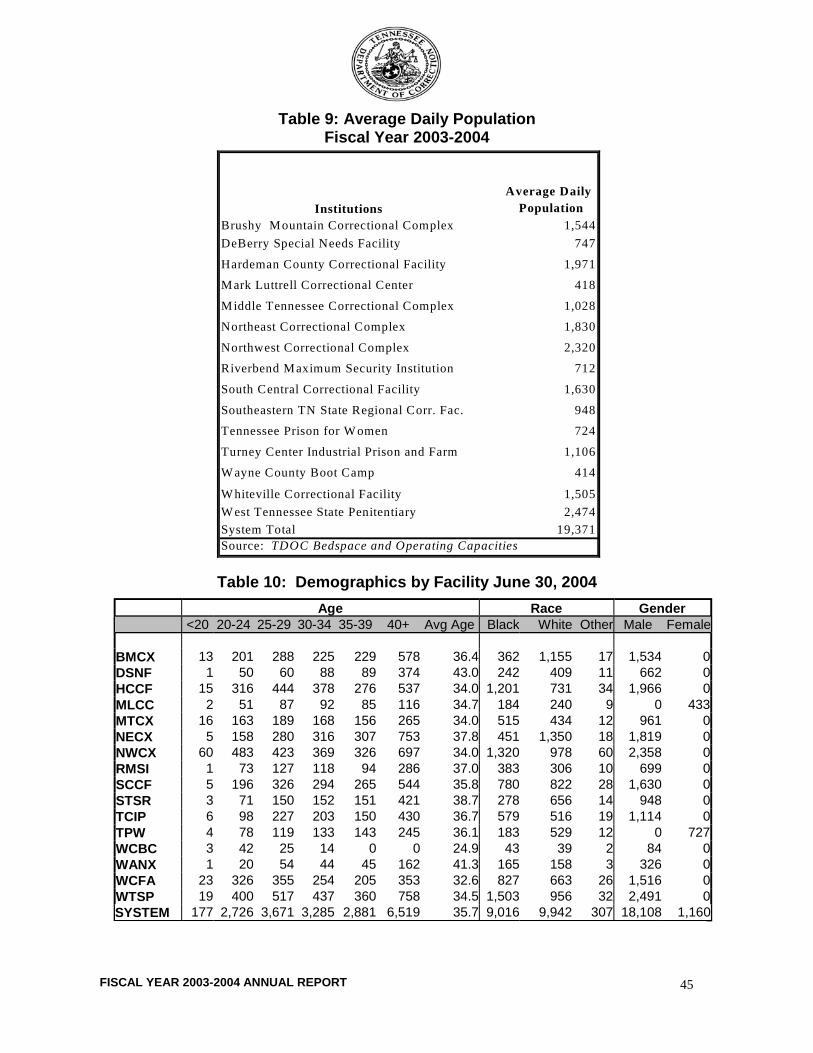
FISCAL YEAR 2003-2004 ANNUAL REPORT
45
Average DailyPopulation
Brushy Mountain Correctional Complex 1,544DeBerry Special Needs Facility 747
Hardeman County Correctional Facility 1,971
Mark Luttrell Correctional Center 418
Middle Tennessee Correctional Complex 1,028
Northeast Correctional Complex 1,830
Northwest Correctional Complex 2,320
Riverbend Maximum Security Institution 712
South Central Correctional Facility 1,630
Southeastern TN State Regional Corr. Fac. 948
Tennessee Prison for W omen 724
Turney Center Industrial Prison and Farm 1,106
W ayne County Boot Camp 414
W hiteville Correctional Facility 1,505W est Tennessee State Penitentiary 2,474System Total 19,371Source: TDOC Bedspace and Operating Capacities
Institutions
Table 9: Average Daily Population Fiscal Year 2003-2004
Table 10: Demographics by Facility June 30, 2004 Age Race Gender <20 20-24 25-29 30-34 35-39 40+ Avg Age Black White Other Male Female
BMCX 13 201 288 225 229 578 36.4 362 1,155 17 1,534 0 DSNF 1 50 60 88 89 374 43.0 242 409 11 662 0 HCCF 15 316 444 378 276 537 34.0 1,201 731 34 1,966 0 MLCC 2 51 87 92 85 116 34.7 184 240 9 0 433 MTCX 16 163 189 168 156 265 34.0 515 434 12 961 0 NECX 5 158 280 316 307 753 37.8 451 1,350 18 1,819 0 NWCX 60 483 423 369 326 697 34.0 1,320 978 60 2,358 0 RMSI 1 73 127 118 94 286 37.0 383 306 10 699 0 SCCF 5 196 326 294 265 544 35.8 780 822 28 1,630 0 STSR 3 71 150 152 151 421 38.7 278 656 14 948 0 TCIP 6 98 227 203 150 430 36.7 579 516 19 1,114 0 TPW 4 78 119 133 143 245 36.1 183 529 12 0 727 WCBC 3 42 25 14 0 0 24.9 43 39 2 84 0 WANX 1 20 54 44 45 162 41.3 165 158 3 326 0 WCFA 23 326 355 254 205 353 32.6 827 663 26 1,516 0 WTSP 19 400 517 437 360 758 34.5 1,503 956 32 2,491 0 SYSTEM 177 2,726 3,671 3,285 2,881 6,519 35.7 9,016 9,942 307 18,108 1,160
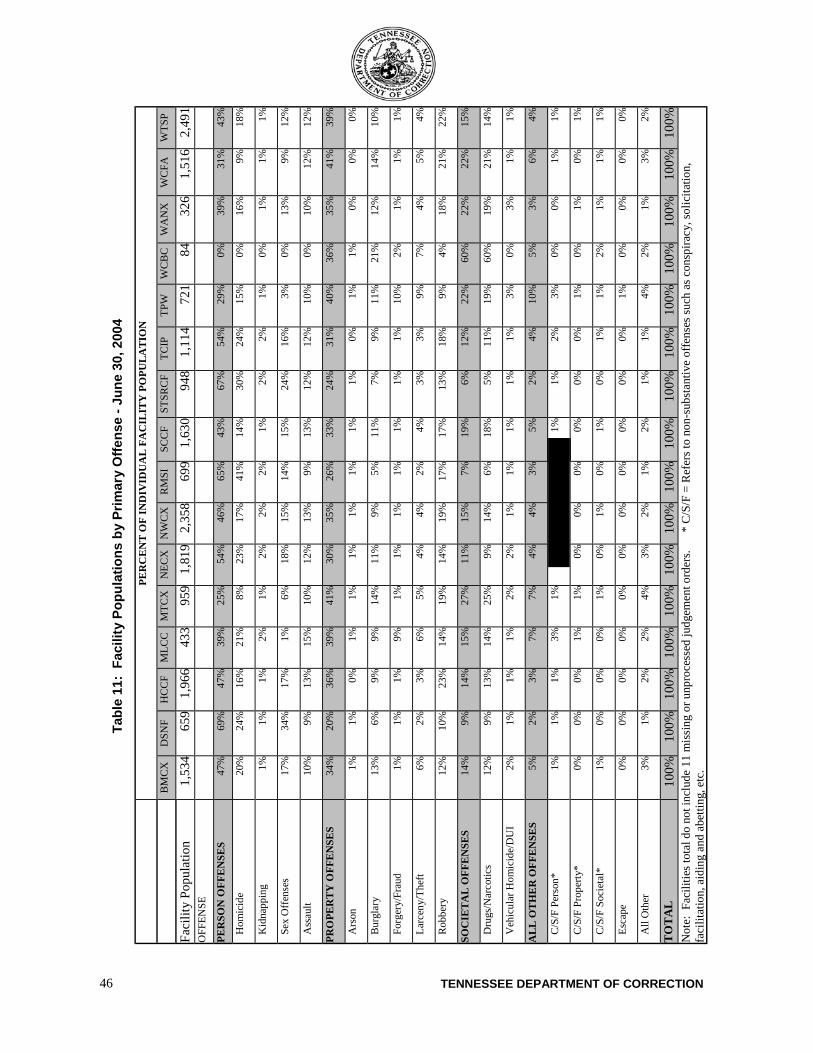
TENNESSEE DEPARTMENT OF CORRECTION
46
Tabl
e 11
: Fa
cilit
y Po
pula
tions
by
Prim
ary
Offe
nse
- Jun
e 30
, 200
4
PE
RC
EN
T O
F IN
DIV
IDU
AL
FA
CIL
ITY
PO
PUL
AT
ION
BM
CX
D
SNF
HC
CF
MLC
C
MTC
X
NEC
X
NW
CX
R
MSI
SC
CF
STSR
CF
TCIP
TP
W
WC
BC
W
AN
X
WC
FA
WTS
P
Faci
lity
Popu
latio
n 1,
534
659
1,96
6 43
3 95
9 1,
819
2,35
8 69
9 1,
630
948
1,11
4 72
1 84
32
6 1,
516
2,49
1 O
FFEN
SE
PER
SON
OFF
EN
SES
47%
69
%
47%
39
%
25%
54
%
46%
65
%
43%
67
%
54%
29
%
0%
39%
31
%
43%
H
omic
ide
20%
24
%
16%
21
%
8%
23%
17
%
41%
14
%
30%
24
%
15%
0%
16
%
9%
18%
K
idna
ppin
g 1%
1%
1%
2%
1%
2%
2%
2%
1%
2%
2%
1%
0%
1%
1%
1%
Se
x O
ffen
ses
17%
34
%
17%
1%
6%
18
%
15%
14
%
15%
24
%
16%
3%
0%
13
%
9%
12%
A
ssau
lt 10
%
9%
13%
15
%
10%
12
%
13%
9%
13
%
12%
12
%
10%
0%
10
%
12%
12
%
PRO
PER
TY
OFF
EN
SES
34%
20
%
36%
39
%
41%
30
%
35%
26
%
33%
24
%
31%
40
%
36%
35
%
41%
39
%
A
rson
1%
1%
0%
1%
1%
1%
1%
1%
1%
1%
0%
1%
1%
0%
0%
0%
B
urgl
ary
13%
6%
9%
9%
14
%
11%
9%
5%
11
%
7%
9%
11%
21
%
12%
14
%
10%
Fo
rger
y/Fr
aud
1%
1%
1%
9%
1%
1%
1%
1%
1%
1%
1%
10%
2%
1%
1%
1%
La
rcen
y/Th
eft
6%
2%
3%
6%
5%
4%
4%
2%
4%
3%
3%
9%
7%
4%
5%
4%
R
obbe
ry
12%
10
%
23%
14
%
19%
14
%
19%
17
%
17%
13
%
18%
9%
4%
18
%
21%
22
%
SOC
IET
AL
OFF
EN
SES
14%
9%
14
%
15%
27
%
11%
15
%
7%
19%
6%
12
%
22%
60
%
22%
22
%
15%
D
rugs
/Nar
cotic
s 12
%
9%
13%
14
%
25%
9%
14
%
6%
18%
5%
11
%
19%
60
%
19%
21
%
14%
V
ehic
ular
Hom
icid
e/D
UI
2%
1%
1%
1%
2%
2%
1%
1%
1%
1%
1%
3%
0%
3%
1%
1%
AL
L O
TH
ER
OFF
EN
SES
5%
2%
3%
7%
7%
4%
4%
3%
5%
2%
4%
10%
5%
3%
6%
4%
C
/S/F
Per
son*
1%
1%
1%
3%
1%
1%
1%
1%
1%
1%
2%
3%
0%
0%
1%
1%
C
/S/F
Pro
perty
* 0%
0%
0%
1%
1%
0%
0%
0%
0%
0%
0%
1%
0%
1%
0%
1%
C
/S/F
Soc
ieta
l*
1%
0%
0%
0%
1%
0%
1%
0%
1%
0%
1%
1%
2%
1%
1%
1%
Es
cape
0%
0%
0%
0%
0%
0%
0%
0%
0%
0%
0%
1%
0%
0%
0%
0%
A
ll O
ther
3%
1%
2%
2%
4%
3%
2%
1%
2%
1%
1%
4%
2%
1%
3%
2%
TO
TA
L
100%
10
0%
100%
10
0%
100%
10
0%
100%
10
0%
100%
10
0%
100%
10
0%
100%
10
0%
100%
10
0%
Not
e: F
acili
ties t
otal
do
not i
nclu
de 1
1 m
issi
ng o
r unp
roce
ssed
judg
emen
t ord
ers.
*
C/S
/F =
Ref
ers t
o no
n-su
bsta
ntiv
e of
fens
es su
ch a
s con
spira
cy, s
olic
itatio
n,
faci
litat
ion,
aid
ing
and
abet
ting,
etc
.
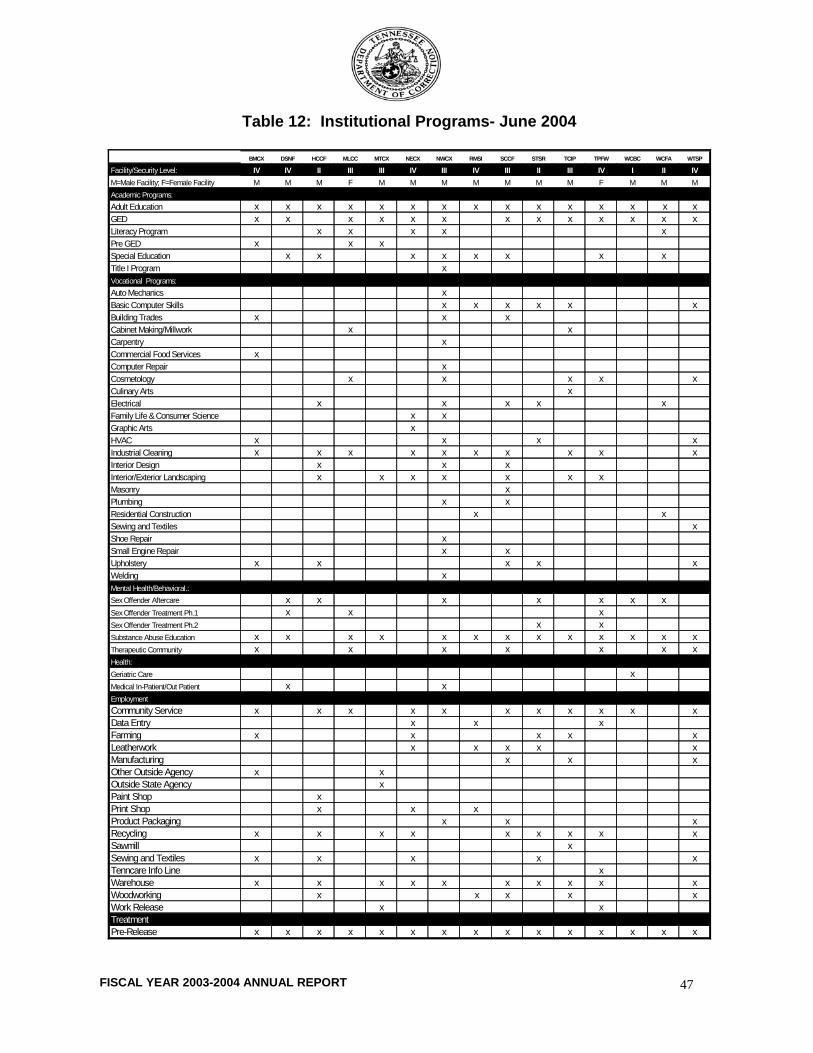
FISCAL YEAR 2003-2004 ANNUAL REPORT
47
Table 12: Institutional Programs- June 2004
BMCX DSNF HCCF MLCC MTCX NECX NWCX RMSI SCCF STSR TCIP TPFW WCBC WCFA WTSP
Facility/Security Level: IV IV II III III IV III IV III II III IV I II IVM=Male Facility; F=Female Facility M M M F M M M M M M M F M M MAcademic Programs:Adult Education x x x x x x x x x x x x x x xGED x x x x x x x x x x x x xLiteracy Program x x x x xPre GED x x x Special Education x x x x x x x xTitle I Program xVocational Programs:Auto Mechanics xBasic Computer Skills x x x x x xBuilding Trades x x xCabinet Making/Millwork x xCarpentry xCommercial Food Services xComputer Repair xCosmetology x x x x xCulinary Arts xElectrical x x x x xFamily Life & Consumer Science x xGraphic Arts xHVAC x x x xIndustrial Cleaning x x x x x x x x x xInterior Design x x xInterior/Exterior Landscaping x x x x x x xMasonry xPlumbing x xResidential Construction x xSewing and Textiles xShoe Repair xSmall Engine Repair x xUpholstery x x x x xWelding xMental Health/Behavioral.:Sex Offender Aftercare x x x x x x xSex Offender Treatment Ph.1 x x xSex Offender Treatment Ph.2 x xSubstance Abuse Education x x x x x x x x x x x x xTherapeutic Community x x x x x x xHealth:Geriatric Care xMedical In-Patient/Out Patient x xEmployment xCommunity Service x x x x x x x x x x xData Entry x x xFarming x x x x xLeatherwork x x x x xManufacturing x x xOther Outside Agency x xOutside State Agency xPaint Shop x Print Shop x x xProduct Packaging x x xRecycling x x x x x x x x xSawmill xSewing and Textiles x x x x xTenncare Info Line xWarehouse x x x x x x x x x xWoodworking x x x x xWork Release x xTreatmentPre-Release x x x x x x x x x x x x x x x

TENNESSEE DEPARTMENT OF CORRECTION
48
Table 13: Community Service Work Hours — Fiscal Year 2003-2004
COMMUNITY SERVICE WORK CREWS
SECURITY SERVICES The Security Services section, working under the auspices of the Assistant Commissioner of Operations, is responsible for monitoring TDOC security systems and evaluating institutional security issues. The primary responsibilities of this division include developing policies, procedures, and practices related to institutional security. Security Services conduct on-site audits of institutional security practices and procedures, compiles and evaluate information on trends and changes in technology that may impact or improve TDOC security functioning, and serve as a general resource for issues related to correctional security. Security Services staff work with the institutions to address issues of non-compliance during annual inspections, monitor the maintenance and control of armory and CERT team equipment, and maintain a knowledge and network of relationships with other criminal justice agencies to facilitate the sharing of information that may benefit the TDOC and other agencies. Two Security Specialists are responsible for the annual emergency drills and/or scenarios for each of the TDOC facilities as well as the three privately managed facilities.
1st Quarter 2nd Quarter 3rd Quarter 4th Quarter Facility Total BMCX 64,617 47,472 51,126 59,668 222,883 HCCF 10,006 4,850 4,576 9,001 28,433 MLCC 12,600 9,309 7,294 10,161 39,364 MTCX 76,697 55,876 58,450 67,675 258,698 NECX 66,084 55,578 62,383 65,270 249,315 NWCX 18,989 21,718 20,348 34,660 95,715 SCCF 11,912 12,462 10,054 10,087 44,515 STSR 16,721 13,659 16,001 15,652 62,033 TPFW 45,736 42,264 43,226 43,760 174,986 TCIP 320 0 1,256 848 2,424 WCBC 44,473 38,019 35,767 36,580 154,839 WTSP 936 1,112 2,140 5,980 10,168 SYSTEM 369,091 302,319 312,621 359,342 1,343,373 TOTAL SAVINGS: Dollar Value @ Minimum Wage $6,918,370.95 Note: Minimum wage = $5.15/hr.
FISCAL YEAR 2003-2004 ANNUAL REPORT
49
SENTENCE MANAGEMENT SERVICES Sentence Management Services (SMS) provides sentence management information, computes all felony sentences, and monitors and reports release dates and eligibility dates to the Board of Probation and Parole in order to produce eligibility dockets. SMS has two sections: Sentence Computation Services (SCS) and Sentence Information Services (SIS). Sentence Computation Services (SCS) computes and maintains the release eligibility dates and expiration dates for all felony offenders in Tennessee, regardless of their place of confinement. Sentence information and expiration dates are also maintained for all offenders whose sentences are suspended to probation. The number of persons being sentenced by Tennessee criminal and circuit courts has continued to increase annually. Changes in process of work flow and intense commitment to work has eliminated previous backlogs and keeps SCS current in entry of judgment orders. SCS will continue to improve its organizational process every year to increase its efficiency. Sentence Information Services (SIS) continues to provide sentence calculation training and programmatic direction for institutional record clerks, institutional unit management staff, and Sentence Management Services staff. SIS also provides research in the areas of sentence calculation, sentence credits earned or removed, eligibility for parole, and the verification of expiration of sentences for all incarcerated felons. SIS responds to numerous requests for sentence information received from attorneys, offender family members, law enforcement agencies, and other TDOC divisions.
INMATE GRIEVANCES/DISCIPLINARY APPEALS A grievance is defined as a written complaint concerning the substance or application of a written or unwritten policy or practice. It involves any single behavior or action toward an inmate by staff or other inmates, or any condition or incident within the department or institution which personally affects the inmate complaint. The U.S. Department of Justice has certified the TDOC inmate grievance procedures. There are three levels of the grievance process, two occur at the institution and a correctional program manager handles the third level of the process on behalf of the Commissioner. Approximately 160 grievances per week are handled at level three, with responses sent within 25 working days. Responses to grievances concerning health services, food services, TRICOR, and jobs/education are drafted by the appropriate director and returned to the correctional program manager.

TENNESSEE DEPARTMENT OF CORRECTION
50
An inmate has one calendar year to file a civil suit from the date of receipt of the final level three response to the grievance. Disciplinary Appeal Procedures for TDOC Institutions Appeals are submitted to the Warden and the final level is to the Commissioner. Only the inmate (or the advisor at the inmate’s request) may appeal a decision of the disciplinary board/hearing officer. Only an offense to which the inmate entered a plea of “not guilty” may be appealed. It is the responsibility of the inmate, not the inmate advisor, to ensure that any appeal is processed and that any such appeal adheres to time limits.
PRE-RELEASE AND TRANSITION SERVICES The TDOC’s division of Pre-Release and Transition Services continued to expand during this time period. The Department now has a total of 12 full time Pre-Release Coordinators. Each coordinator is responsible for developing a program at their site and for tracking inmates who leave the system by expiration of sentence or release on probation or parole. In February 2004, TDOC Policy #511.02, Pre-Release Services was reissued to allow for expansion. Policy now mandates that all inmates leaving the system be offered pre-release services. Policy also allows for full time paid program positions for inmates determined to be most in need of formal programming. At the time of this publication, MTCX, BMCX, WTSP, NWCX, WANX, MLRC, and all three CCA facilities have developed formal pre-release program positions. The 2004 session of the General Assembly passed a bill requiring that all inmates leaving the system shall receive an orientation concerning relevant post release or parole issues. TDOC Policy 511.02 allows for inmates who will expire their sentence to be eligible for formal pre-release programs. This is a significant programming expansion as the majority of inmates expiring their sentence were not eligible for annex placement under the previous policy and therefore, not eligible for pre-release program slots. During March 2004, the Department of General Services printed three resource manuals to be distributed across the state to all Pre-Release Coordinators. One of the Resource Manuals covers all pertinent information required by policy and by law (with the exception of restoration of citizenship rights). General Services printed enough copies of the manuals to allow for the approximate 5,000 inmates leaving state institutions during the upcoming year. The federally funded program, Tennessee Bridges, continues to counsel/

FISCAL YEAR 2003-2004 ANNUAL REPORT
51
educate participants through the three programmatic phases. In October 2003, an additional $35,000 was awarded to the TDOC specifically to identify substance abuse and mental health issues during Phase 2, the intensive parole supervision phase. In May 2004, a proposal was submitted for an additional $317,000 to the USDOJ. These funds are competitive and will allow for training and educational/vocational skills for TN Bridges participants. The application stated that 18 sites are in competition for the funds to be awarded after July 2004.
VOLUNTEER SERVICES The Volunteer Services section is responsible for developing and implementing volunteer programs for offenders, members of the inmate’s family, and TDOC staff. Currently, volunteers are recruited from communities all over the state to come into their local institutions and assist the department in delivering very necessary services to inmates. Volunteers can serve in many ways. Volunteers provide assistance by counseling inmates, tutoring inmates in literacy, financial management and GED preparation as well as in holiday celebrations. While these services have been provided in the past, there is always a need for increased services and expansion of volunteer programs is a primary goal of this section. Offenders are in need of assistance, not only while institutionalized, but as they prepare for release and then upon their release. While inmates’ needs are often the most prevalent, there are others who are affected by the actions of offenders. The victim of the crime, along with their family members, are often in need of support and counseling services. The family members of each inmate, especially their children, are left with financial, psychological, emotional and mental health needs that stem from incarceration. Volunteers can assist with all of these needs, many of which occur outside the walls of the institution. A staff member in each institution is assigned the task of working with the volunteers at each site. The local volunteer coordinator recruits and trains volunteers according to each institution’s specific needs. Training includes a standardized orientation to policies and procedures, with specialized instruction to meet the needs of the volunteer program at a particular location. Each institution organizes a local Community Resource Board to oversee management of the volunteer program and community relations. The local boards are made up from community leaders, church groups, and civic organizations. The local boards are represented on a statewide level by the Tennessee Community Resource Board (TCRB). This board, composed of individuals with diverse backgrounds, is made up of 15 members approved by the Commissioner of Correction and the Chairman of the Board of Probation and Parole. Annually, the volunteer network saves the state an average of more than 1.4 million dollars by providing services not offered by the department.
TENNESSEE DEPARTMENT OF CORRECTION
52
INMATE JOBS An inmate job is defined as a program assignment for which an inmate is paid and/or is evaluated for program sentence credits. A program assignment includes work, academic and vocational classes, and some mental health programs. The purpose of the inmate jobs program is to reduce idleness, to provide meaningful jobs and training, and to provide a system for job advancement. Inmates are expected to report to their assigned program at the scheduled time and participate. Reduced inmate idleness promotes stability within an institution. Work rules mimic requirements of jobs outside the prison. Many incarcerated felons do not have good work ethics. It is expected that participation in prison jobs will be the basis for promoting good work ethics. Uniform procedures have been established for assigning inmates to institutional jobs. Inmates may request placement on registers for a job assignment. Job descriptions include requirements for each job at an individual institution. Inmates are tentatively determined to be eligible and qualified before they are approved for register placement. Job assignments are primarily based on seniority on the register. Inmates without a high school diploma or GED are not routinely promoted to jobs above semi-skilled level. Inmates are not permitted to refuse or quit an assignment, with the exception of those assigned to a Prison Industries Enhancement (PIE) program or to a mental health treatment program. There are two types of job assignment terminations; i.e, disciplinary and non-disciplinary. Sanctions are attached to disciplinary terminations only. The Inmate Jobs Specialist is responsible for the coordination of the day-to-day departmental operation of the inmate jobs program. This includes policy development, monitoring, training for inmate job coordinators, assisting with development of TOMIS applications for inmate jobs, providing technical assistance to institutional and central office staff, approving requests for changes in the inmate worker pattern, preparing reports and performing audits. Each institution is staffed with an inmate job coordinator. This person is responsible for coordinating sentence credit policy requirements, assigning inmates to jobs, supervising job tracking personnel, assisting in the development of job descriptions, training inmate job supervisors in job policy requirements, and other related duties at their institution.
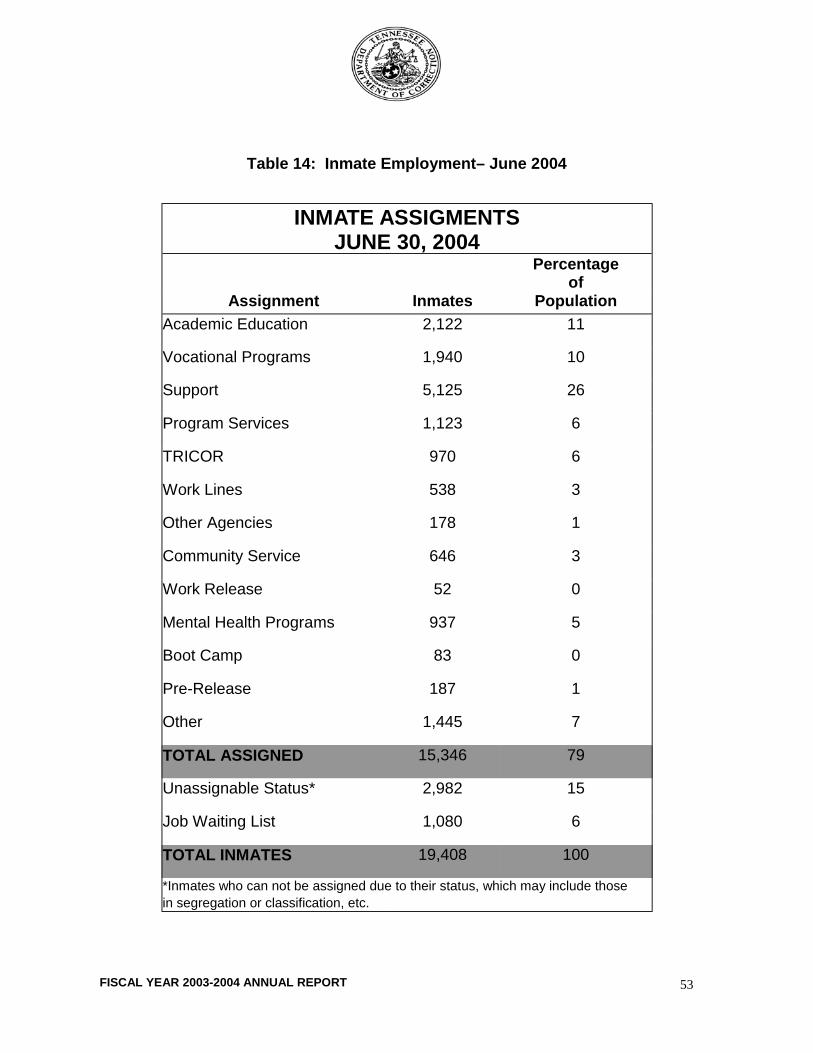
FISCAL YEAR 2003-2004 ANNUAL REPORT
53
Table 14: Inmate Employment– June 2004
Percentage of
Assignment Inmates Population Academic Education 2,122 11
Vocational Programs 1,940 10
Support 5,125 26
Program Services 1,123 6
TRICOR 970 6
Work Lines 538 3
Other Agencies 178 1
Community Service 646 3
Work Release 52 0
Mental Health Programs 937 5
Boot Camp 83 0
Pre-Release 187 1
Other 1,445 7
TOTAL ASSIGNED 15,346 79
Unassignable Status* 2,982 15
Job Waiting List 1,080 6
TOTAL INMATES 19,408 100
*Inmates who can not be assigned due to their status, which may include those in segregation or classification, etc.
INMATE ASSIGMENTS JUNE 30, 2004

TENNESSEE DEPARTMENT OF CORRECTION
54
EDUCATION Overview Correctional Education programs provide inmates with knowledge, skills, attitude, and values needed to succeed in society. Tennessee Code Annotated (TCA) 4-3-603 and 4-6-144 drive “Special School District” and “Library Operations”. TDOC maintains “School Approval” via Tennessee Department of Education, Office of Accountability, annually and must comply with the “Minimum Standards for the Governance of Public Schools”. TDOC maintains approval as an official G.E.D Test Site (one of approximately 40 official test centers in Tennessee), and therefore must adhere to guidelines set forth by the G.E.D Testing Service, Washington, D.C., the Tennessee Department of Labor and Workforce Development Adult Education Office, and the State G.E.D Administrator. American Correctional Association (ACA) standards further stipulate areas of compliance for academic and vocational programs, and library operations. Fifteen institutions (twelve state operated and three Corrections Corporation of America (CCA) operated) offer an academic program, at a minimum, with the majority offering vocational programs as well. All principals and teachers hold valid professional licenses granted by the Tennessee Department of Education. Target school enrollment, FY2003-2004, is approximately 20% of the inmate population. Full-time enrollment ABE/GED was 7,509, and vocational enrollment was 13, 071. Fiscal year statistics:
G.E.D AND VOCATIONAL CERTIFICATES EARNED
G.E.D Certificates Vocational Certificates 1999-2000 609 651
2000-2001 766 692
2001-2002 511 865
2002-2003 326 425
2003-2004 606 1,434
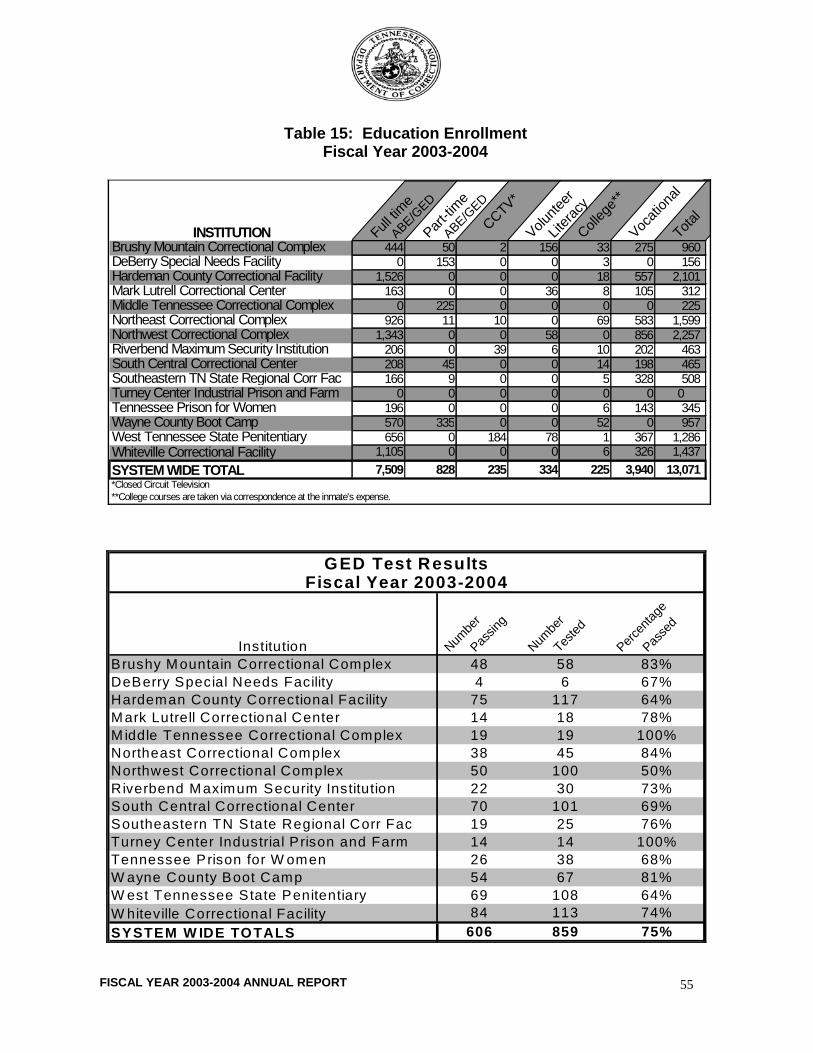
FISCAL YEAR 2003-2004 ANNUAL REPORT
55
Full tim
e
ABE/GED
Part-tim
e
ABE/GED
CCTV*
Volunte
er
Litera
cy
Colleg
e**
Vocati
onal
Total
INSTITUTIONBrushy Mountain Correctional Complex 444 50 2 156 33 275 960
0 153 0 0 3 0 156 1,526 0 0 0 18 557 2,101
163 0 0 36 8 105 312 Middle Tennessee Correctional Complex 0 225 0 0 0 0 225
926 11 10 0 69 583 1,599 1,343 0 0 58 0 856 2,257
206 0 39 6 10 202 463 208 45 0 0 14 198 465 166 9 0 0 5 328 508
0 0 0 0 0 0 0196 0 0 0 6 143 345 570 335 0 0 52 0 957 656 0 184 78 1 367 1,286
1,105 0 0 0 6 326 1,437 7,509 828 235 334 225 3,940 13,071
Whiteville Correctional Facility
Hardeman County Correctional FacilityMark Lutrell Correctional Center
Brushy Mountain Correctional ComplexDeBerry Special Needs Facility
South Central Correctional CenterSoutheastern TN State Regional Corr Fac
**College courses are taken via correspondence at the inmate's expense.
Northeast Correctional ComplexNorthwest Correctional ComplexRiverbend Maximum Security Institution
Turney Center Industrial Prison and Farm
SYSTEM WIDE TOTAL*Closed Circuit Television
Tennessee Prison for WomenWayne County Boot CampWest Tennessee State Penitentiary
Table 15: Education Enrollment Fiscal Year 2003-2004
48 58 83%4 6 67%
75 117 64%14 18 78%
Middle Tennessee Correctional Complex 19 19 100%38 45 84%50 100 50%22 30 73%70 101 69%19 25 76%14 14 100%26 38 68%54 67 81%69 108 64%84 113 74%
606 859 75%
Numbe
r
Passin
g
Numbe
r
Tested
Percen
tage
Passe
d
Riverbend Maximum Security InstitutionSouth Central Correctional Center
W est Tennessee State PenitentiaryW hiteville Correctional Facility
Southeastern TN State Regional Corr FacTurney Center Industrial Prison and FarmTennessee Prison for W omenW ayne County Boot Camp
GED Test ResultsFiscal Year 2003-2004
SYSTEM W IDE TOTALS
InstitutionBrushy Mountain Correctional ComplexDeBerry Special Needs FacilityHardeman County Correctional FacilityMark Lutrell Correctional Center
Northeast Correctional ComplexNorthwest Correctional Complex
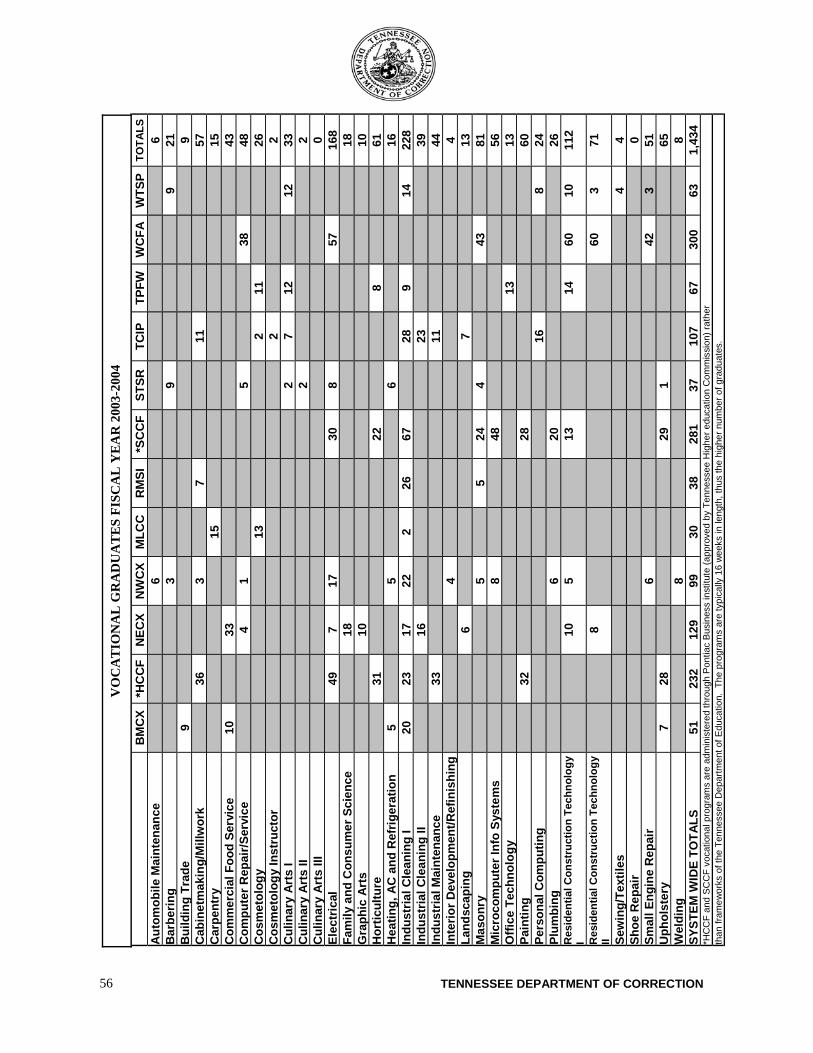
TENNESSEE DEPARTMENT OF CORRECTION
56
BM
CX
*HC
CF
NEC
X N
WC
X M
LCC
R
MSI
*S
CC
F ST
SR
TCIP
TP
FW
WC
FA
WTS
P TO
TALS
Au
tom
obile
Mai
nten
ance
6
6
Bar
berin
g
3
9
9
21
Bui
ldin
g Tr
ade
9
9
Cab
inet
mak
ing/
Mill
wor
k
36
3
7
11
57
Car
pent
ry
15
15
C
omm
erci
al F
ood
Serv
ice
10
33
43
Com
pute
r Rep
air/S
ervi
ce
4 1
5
38
48
C
osm
etol
ogy
13
2 11
26
C
osm
etol
ogy
Inst
ruct
or
2
2 C
ulin
ary
Arts
I
2
7 12
12
33
Cul
inar
y Ar
ts II
2
2
Cul
inar
y Ar
ts II
I
0
Elec
tric
al
49
7
17
30
8
57
168
Fam
ily a
nd C
onsu
mer
Sci
ence
18
18
Gra
phic
Art
s
10
10
H
ortic
ultu
re
31
22
8
61
Hea
ting,
AC
and
Ref
riger
atio
n
5
5
6
16
Indu
stria
l Cle
anin
g I
20
23
17
22
2 26
67
28
9
14
228
Indu
stria
l Cle
anin
g II
16
23
39
In
dust
rial M
aint
enan
ce
33
11
44
Inte
rior D
evel
opm
ent/R
efin
ishi
ng
4
4 La
ndsc
apin
g
6
7
13
Mas
onry
5
5
24
4
43
81
Mic
roco
mpu
ter I
nfo
Syst
ems
8
48
56
O
ffice
Tec
hnol
ogy
13
13
Pain
ting
32
28
60
Pe
rson
al C
ompu
ting
16
8
24
Plum
bing
6
20
26
Res
iden
tial C
onst
ruct
ion
Tech
nolo
gy
I
10
5
13
14
60
10
112
Res
iden
tial C
onst
ruct
ion
Tech
nolo
gy
II
8
60
3 71
Sew
ing/
Text
iles
4 4
Shoe
Rep
air
0 Sm
all E
ngin
e R
epai
r
6
42
3
51
7 28
29
1
65
Wel
ding
8
8 SY
STEM
WID
E TO
TALS
51
23
2 12
9 99
30
38
28
1 37
10
7 67
30
0 63
1,
434
*HC
CF
and
SCC
F vo
catio
nal p
rogr
ams
are
adm
inis
tere
d th
roug
h Po
ntia
c Bu
sine
ss in
stitu
te (a
ppro
ved
by T
enne
ssee
Hig
her e
duca
tion
Com
mis
sion
) rat
her
th
an fr
amew
orks
of t
he T
enne
ssee
Dep
artm
ent o
f Edu
catio
n. T
he p
rogr
ams
are
typi
cally
16
wee
ks in
leng
th, t
hus
the
high
er n
umbe
r of g
radu
ates
.
Uph
olst
ery
VO
CA
TIO
NA
L G
RA
DU
AT
ES
FISC
AL
YE
AR
200
3-20
04

DATA AND
STATISTICS
TENNESSEE DEPARTMENT OF CORRECTION
58
The following pages represent statistical information concerning TDOC’s stock population as of June 30, 2004, admissions into the TDOC system, and releases from the TDOC system. Readers of this report should note the following: Primary offense: Several years ago, offenses were categorized according to the Tennessee Incident Based Reporting System (TIBRS), which is based on the FBI’s National Incident Based Reporting System (NIBRS). This system of reporting standardizes categorical offense reporting across criminal justice agencies both within the state and nationally. For more detail on how TCA code is categorized according to the TIBRS system see the TDOC Research Brief, “Assessing the Impact of the TIBRS on TDOC Criminal Offense Reporting,” available online at http://www.state.tn.us/correction/planning/researchbrief.html. The data presented in this section are based on information drawn from several units within the Department of Correction. Due to the fact that TOMIS is a dynamic database and information is constantly being added and/or modified, some data in comparable tables may not match exactly. Sentence imposed information is relevant to admissions during the year, while time served information is relevant to releases during the year. A common tendency is to correlate this information, which is a misinterpretation of the data. Readers should keep this distinction in mind. The data do not pertain to the same groups of offenders. There are occasional discrepancies between population totals presented in different tables. These discrepancies are most commonly attributable to the fact that data may be drawn from different sources (e.g. custody level counts are taken from the daily pop count sheets rather than the Tennessee Offender Management Information System data base), missing data, or that data is drawn at different points in time. Because TOMIS is not a static database, with admissions, releases, and movements constantly occurring, data drawn at different points in time may reflect changes that have occurred between those dates of data extraction.
SECTION V
DATA AND STATISTICS
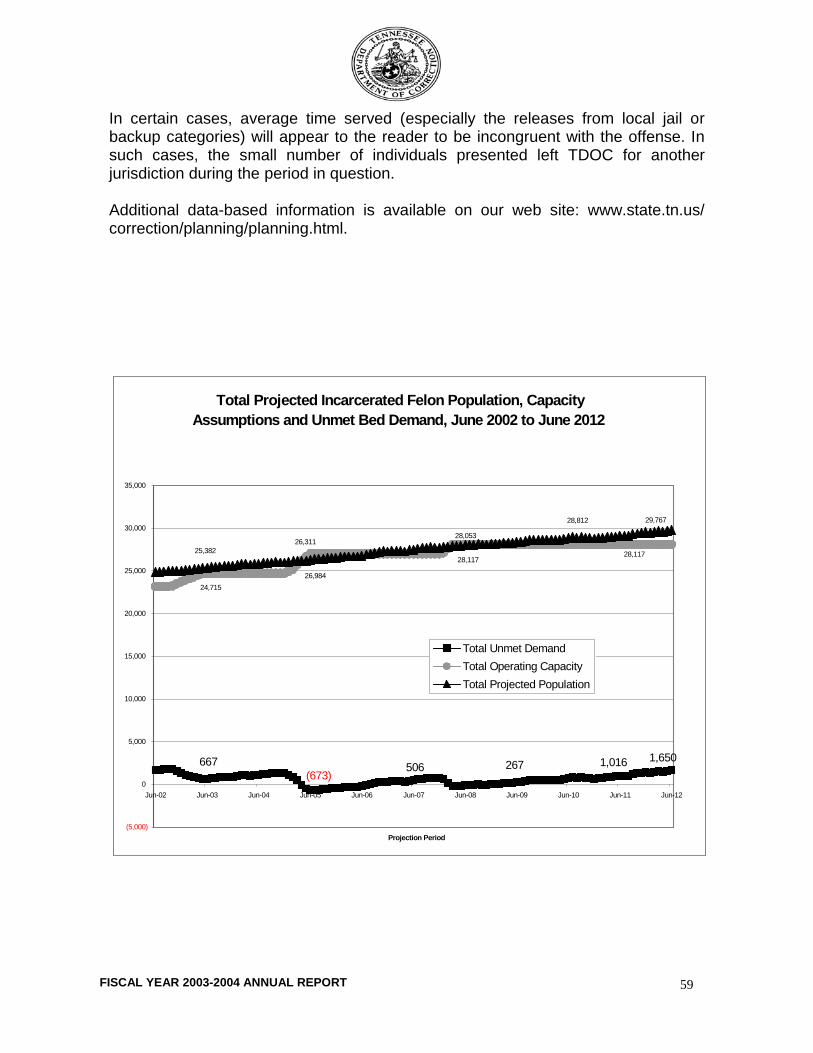
FISCAL YEAR 2003-2004 ANNUAL REPORT
59
In certain cases, average time served (especially the releases from local jail or backup categories) will appear to the reader to be incongruent with the offense. In such cases, the small number of individuals presented left TDOC for another jurisdiction during the period in question. Additional data-based information is available on our web site: www.state.tn.us/correction/planning/planning.html.
Total Projected Incarcerated Felon Population, Capacity Assumptions and Unmet Bed Demand, June 2002 to June 2012
267506667 1,650(673)
1,016
28,117
26,98424,715
28,117
29,767
25,38226,311
28,053
28,812
(5,000)
0
5,000
10,000
15,000
20,000
25,000
30,000
35,000
Jun-02 Jun-03 Jun-04 Jun-05 Jun-06 Jun-07 Jun-08 Jun-09 Jun-10 Jun-11 Jun-12
Projection Period
Total Unmet DemandTotal Operating CapacityTotal Projected Population
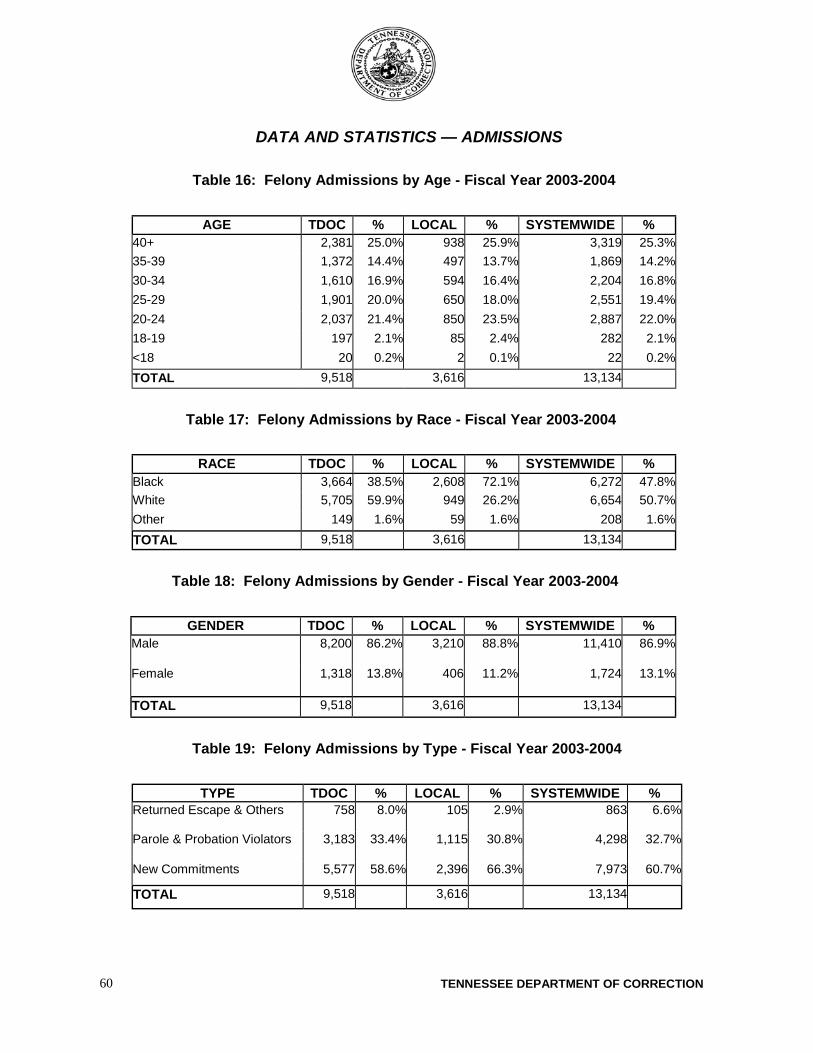
TENNESSEE DEPARTMENT OF CORRECTION
60
Table 19: Felony Admissions by Type - Fiscal Year 2003-2004
Table 18: Felony Admissions by Gender - Fiscal Year 2003-2004
Table 17: Felony Admissions by Race - Fiscal Year 2003-2004
Table 16: Felony Admissions by Age - Fiscal Year 2003-2004
DATA AND STATISTICS — ADMISSIONS
AGE TDOC % LOCAL % SYSTEMWIDE % 40+ 2,381 25.0% 938 25.9% 3,319 25.3% 35-39 1,372 14.4% 497 13.7% 1,869 14.2% 30-34 1,610 16.9% 594 16.4% 2,204 16.8% 25-29 1,901 20.0% 650 18.0% 2,551 19.4% 20-24 2,037 21.4% 850 23.5% 2,887 22.0% 18-19 197 2.1% 85 2.4% 282 2.1% <18 20 0.2% 2 0.1% 22 0.2% TOTAL 9,518 3,616 13,134
RACE TDOC % LOCAL % SYSTEMWIDE % Black 3,664 38.5% 2,608 72.1% 6,272 47.8% White 5,705 59.9% 949 26.2% 6,654 50.7% Other 149 1.6% 59 1.6% 208 1.6% TOTAL 9,518 3,616 13,134
GENDER TDOC % LOCAL % SYSTEMWIDE % Male 8,200 86.2% 3,210 88.8% 11,410 86.9%
Female 1,318 13.8% 406 11.2% 1,724 13.1%
TOTAL 9,518 3,616 13,134
TYPE TDOC % LOCAL % SYSTEMWIDE % Returned Escape & Others 758 8.0% 105 2.9% 863 6.6%
Parole & Probation Violators 3,183 33.4% 1,115 30.8% 4,298 32.7%
New Commitments 5,577 58.6% 2,396 66.3% 7,973 60.7%
TOTAL 9,518 3,616 13,134

FISCAL YEAR 2003-2004 ANNUAL REPORT
61
TDOC LOCAL COUNTY Number Percent Number Percent Number Percent
ANDERSON 62 0.7% 0 0.0% 62 0.4% BEDFORD 136 1.4% 2 0.1% 138 1.0% BENTON 21 0.2% 1 0.0% 22 0.2% BLEDSOE 7 0.1% 0 0.0% 7 0.1% BLOUNT 129 1.4% 5 0.1% 134 1.0% BRADLEY 129 1.4% 2 0.1% 131 1.0% CAMPBELL 44 0.5% 1 0.0% 53 0.4% CANNON 52 0.3% 0 0.0% 28 0.2% CARROLL 36 0.4% 1 0.0% 37 0.3% CARTER 117 1.2% 0 0.0% 117 0.8% CHEATHAM 41 0.4% 1 0.0% 42 0.3% CHESTER 28 0.3% 0 0.0% 28 0.2% CLAIBORNE 46 0.5% 0 0.0% 46 0.4% CLAY 7 0.1% 0 0.0% 7 0.1% COCKE 87 0.9% 3 0.1% 90 0.7% COFFEE 175 1.8% 4 0.1% 179 1.4% CROCKETT 29 0.3% 0 0.0% 29 0.2% CUMBERLAND 68 0.7% 0 0.0% 68 0.5% DAVIDSON 965 10.1% 1,188 32.9% 2,153 16.4% DECATUR 19 0.2% 0 0.0% 19 0.1% DEKALB 26 0.3% 1 0.0% 27 0.2% DICKSON 50 0.5% 3 0.1% 53 0.4% DYER 136 1.4% 3 0.1% 139 1.1% FAYETTE 33 0.3% 1 0.0% 34 0.3% FENTRESS 41 0.4% 5 0.1% 46 0.4% FRANKLIN 109 1.1% 0 0.0% 109 0.8% GIBSON 103 0.1.% 1 0.0% 104 0.8% GILES 64 0.7% 1 0.0% 65 0.5% GRAINGER 30 0.3% 0 0.0% 30 0.2% GREENE 110 1.2% 43 1.2% 153 1.2% GRUNDY 23 0.2% 0 0.0% 23 0.2% HAMBLEN 95 1.0% 96 2.7% 191 1.5% HAMILTON 462 4.9% 4 0.1% 466 3.5% HANCOCK 10 0.1% 20 0.6% 30 0.2% HARDEMAN 40 0.4% 1 0.1% 41 0.3% HARDIN 61 0.6% 0 0.0% 61 0.5% HAWKINS 109 1.1% 4 0.1% 113 0.9% HAYWOOD 40 0.4% 0 0.0% 40 0.3% HENDERSON 66 0.7% 0 0.0% 66 0.5% HENRY 58 0.6% 2 0.1% 60 0.5% HICKMAN 47 0.5% 5 0.1% 52 0.4% HOUSTON 6 0.1% 0 0.0% 6 0.1% HUMPHREYS 31 0.3% 0 0.0% 31 0.2% JACKSON 23 0.2% 2 0.1% 25 0.2% JEFFERSON 52 0.5% 2 0.1% 54 0.4% JOHNSON 36 0.4% 0 0.0% 36 0.3% KNOX 776 8.2% 3 0.1% 779 5.9% LAKE 22 0.2% 1 0.0% 23 0.2%
SYSTEMWIDE TDOC LOCAL COUNTY Number Percent Number Percent Number Percent
LAUDERDALE 92 1.0% 2 0.1% 94 0.7% LAWRENCE 44 0.5% 0 0.1% 44 0.3% LEWIS 32 0.3% 3 0.1% 35 0.3% LINCOLN 64 0.7% 0 0.0% 64 0.5% LOUDON 26 0.3% 0 0.0% 26 0.2% McMINN 99 1.0% 1 0.0% 100 0.8% McNAIRY 39 0.4% 0 0.0% 39 0.3% MACON 20 0.2% 1 0.0% 21 0.2% MADISON 379 4.0% 11 0.3% 390 3.0% MARION 24 0.3% 0 0.0% 24 0.2% MASHALL 118 1.2% 3 0.1% 121 0.9% MAURY 100 1.1% 0 0.0% 100 0.8% MEIGS 7 0.1% 0 0.0% 7 0.1% MONROE 81 0.9% 0 0.0% 81 0.6% MONTGOMERY 111 1.2% 9 0.2% 120 0.9% MOORE 15 0.2% 0 0.0% 15 0.1% MORGAN 2 0.0% 0 0.0% 2 0.0% OBION 95 1.0% 0 0.0% 95 0.7% OVERTON 50 0.5% 0 0.0% 50 0.4% PERRY 23 0.2% 1 0.0% 24 0.2% PICKETT 4 0.0% 0 0.0% 4 0.0% POLK 33 0.3% 0 0.0% 33 0.3% PUTNAM 80 0.8% 2 0.1% 82 0.6% RHEA 22 0.2% 0 0.0% 22 0.2% ROANE 37 0.4% 0 0.0% 37 0.3% ROBERTSON 50 0.5% 2 0.1% 52 0.4% RUTHERFORD 436 4.6% 25 0.7% 461 3.5% SCOTT 23 0.2% 1 0.0% 24 0.2% SQUATCHIE 20 0.2% 0 0.0% 20 0.2% SEVIER 98 1.0% 6 0.2% 104 0.8% SHELBY 809 8.5% 2,105 58.2% 2,914 22.2% SMITH 40 0.4% 1 0.0% 41 0.3% STEWART 12 0.1% 0 0.0% 12 0.1% SULLIVAN 404 4.2% 7 0.2% 411 3.1% SUMNER 226 2.4% 5 0.1% 231 1.8% TIPTON 71 0.7% 7 0.2% 78 0.6% TROUSDALE 11 0.1% 1 0.0% 12 0.1% UNICOI 28 0.3% 0 0.0% 28 0.2% UNION 21 0.2% 0 0.0% 21 0.2% VAN BUREN 17 0.2% 0 0.0% 17 0.1% WARREN 111 1.2% 1 0.1% 112 0.9% WASHINGTON 219 2.3% 1 0.0% 220 1.7% WAYNE 28 0.3% 0 0.0% 28 0.2% WEAKLEY 46 0.5% 2 0.0% 48 0.4% WHITE 49 0.5% 0 0.0% 49 0.4% WILLIAMSON 201 2.1% 6 0.2% 207 1.6% WILSON 144 1.5% 5 0.1% 149 1.1%
TOTAL 9,518 72.5% 3,616 100.0% 13,134 100%
SYSTEMWIDE
Table 20: Felony Admissions by County of Conviction - June 30, 2004
Figure 2: Felony Admissions by Geographical Region
DATA AND STATISTICS - ADMISSIONS
TDOC LOCAL SYSTEMWIDE
West 1844 2127 3971
Middle 4160 1284 5444
East 3514 205 3719
TENNESSEE DEPARTMENT OF CORRECTION
62
Nu
mb
er%
Of
Av
erag
eL
oca
lly
%
Of
Av
erag
eS
yst
em%
Of
Av
erag
eO
f T
DO
CS
ente
nce
Sen
ten
ced
Lo
cal
Sen
ten
ceW
ide
Sy
stem
Sen
ten
ce
PR
IMA
RY
OF
FE
NS
E
Off
end
ers
To
tal
(YY
/MM
)F
elo
ns
To
tal
(YY
/MM
)T
ota
lT
ota
l(Y
Y/M
M)
Ho
mic
ide
Mu
rder
2
99
3.1
4%
26
/00
23
0.6
4%
05
/01
32
22
.45
%2
4/0
5
N
egli
gen
t M
ansl
aug
hte
r1
70
.18
%0
4/0
29
0.2
5%
02
/04
26
0.2
0%
03
/05
Kid
nap
pin
g4
90
.51
%1
3/1
01
10
.30
%0
5/0
36
00
.46
%1
0/0
2
S
ex O
ffen
ses
Fo
rcib
le3
75
3.9
4%
13
/05
39
1.0
8%
03
/06
41
43
.15
%1
2/0
7
N
on
-Fo
rcib
le9
10
.96
%0
2/0
63
30
.91
%0
1/0
51
24
0.9
4%
02
/03
Ass
ault
Ag
gra
vat
ed A
ssau
lt8
32
8.7
4%
08
/07
38
21
0.5
7%
03
/06
1,2
14
9.2
4%
06
/10
Sim
ple
Ass
ault
91
1.0
0%
02
/04
70
1.9
4%
01
/09
16
11
.23
%0
2/0
1
Ars
on
48
0.5
0%
06
/02
11
0.3
0%
04
/01
59
0.4
5%
05
/10
Bu
rgla
ry1
,46
81
5.4
2%
06
/00
71
61
9.8
1%
03
/01
2,1
84
16
.63
%0
4/1
1
F
org
ery
/Fra
ud
58
66
.16
%0
3/0
61
89
5.2
3%
01
/11
77
55
.90
%0
3/0
1
L
arce
ny
/Th
eft
92
39
.70
%0
4/0
36
26
17
.32
%0
2/0
71
,54
91
1.7
9%
03
/06
Ro
bb
ery
Ag
gra
vat
ed R
ob
ber
y7
90
8.3
0%
13
/06
37
1.0
2%
05
/00
82
76
.30
%1
3/0
1
A
ll O
ther
Ro
bb
ery
31
73
.33
%0
7/0
91
54
4.2
6%
04
/04
47
13
.59
%0
6/0
8
Dru
g O
ffen
ses
Co
cain
e 1
,45
91
5.3
3%
08
/03
47
21
3.0
6%
04
/01
1,9
31
14
.70
%0
7/0
3
O
ther
Dru
g O
ffen
ses
98
91
0.3
9%
04
/09
30
78
.49
%0
2/1
01
,29
69
.87
%0
4/0
3
V
ehic
ula
r
V
ehic
ula
r H
om
icid
e/D
UI
57
0.6
0%
14
/06
40
.11
%0
4/0
46
10
.46
%1
3/1
0
A
ll O
ther
Veh
icu
lar
14
01
.47
%0
2/0
24
51
.24
%0
1/0
91
85
1.4
1%
02
/01
C/S
/F P
erso
n
42
0.4
4%
12
/02
13
0.3
6%
02
/01
55
0.4
2%
09
/09
C/S
/F P
rop
erty
67
0.7
0%
05
/02
60
1.6
6%
02
/11
12
70
.97
%0
4/0
1
C
/S/F
So
ciet
al/D
rug
s1
19
1.2
5%
04
/09
82
2.2
7%
02
/05
20
11
.53
%0
3/1
0
E
scap
e1
00
.11
%0
3/0
66
0.1
7%
02
/05
16
0.1
2%
03
/01
All
Oth
er
74
97
.87
%0
2/1
13
26
9.0
2%
02
/01
1,0
75
8.1
9%
02
/09
TO
TA
L9
,51
81
00
.00
%0
7/0
43
,61
51
00
.00
%0
3/0
01
3,1
33
10
0.0
0%
06
/02
Sen
ten
ce T
yp
e
D
eath
20
.02
%N
/A0
0.0
0%
02
0.0
2%
N/A
*L
ife
94
0.9
9%
45
/00
00
.00
%0
94
0.7
2%
45
/00
85
%3
89
4.0
9%
20
/08
00
.00
%0
38
92
.96
%2
0/0
7
1
-2 Y
ears
1,9
79
20
.79
%0
1/0
81
,74
84
8.3
5%
01
/08
3,7
27
28
.38
%0
1/0
9*F
or
pu
rpo
se
s o
f c
alc
ula
ting
se
nte
nc
es
we
as
sig
n l
ife o
ffe
nd
ers
45
ye
ars
. T
ota
l is
min
us
on
e i
lleg
al/u
np
roc
es
se
d ju
dg
em
en
t.
PERSON PROPERTY SOCIETAL OTHER
TD
OC
SE
NT
EN
CE
DL
OC
AL
LY
SE
NT
EN
CE
DS
YS
TE
MW
IDE
Tabl
e 21
: Fel
ony
Adm
issi
ons
Aver
age
Tota
l Sen
tenc
e Le
ngth
by
Prim
ary
Offe
nse
Gro
up -
Fisc
al Y
ear 2
003-
2004

FISCAL YEAR 2003-2004 ANNUAL REPORT
63
DATA AND STATISTICS - ADMISSIONS
TABLE 22: Felony Systemwide Admissions by Total Sentence Length
Number Of
Sentence Length Offenders Percent
1 Year 924 7.4% > 1 - 2 Years 2804 21.4% > 2 - 3 Years 2257 17.2% > 3 - 4 Years 1577 12.0% > 4 - 5 Years 707 5.4% > 5 - 6 Years 1020 7.8% > 6 - 10 Years 2222 16.9% > 10 - 15 Years 790 6.0% > 15 - 20 Years 330 2.5% > 20 Years 406 3.1% Life Sentences 85 0.7% Death Sentences 2 0.0% Life Without Parole 9 0.1%
TOTAL 13,133 100.0% Note: >20 Years category excludes Life and Death Sentences. Figures include all admissions to incarceration: new commitments, parole violators, and others.
TENNESSEE DEPARTMENT OF CORRECTION
64
DATA AND STATISTICS – POPULATION
Table 23: Tennessee Offender Population June 2004
Table 24: TDOC Institutional Capacity and Population Distribution June 30, 2004
TDOC Facilities (In-house) 19,160 Probation 37,617 Intensive Supervision Probation (ISP) 1,067 Community Correction Grant Programs 5,792 Local Jails 4,347 Total Felons 67,983
Source: Tennessee Felon Population Update
Total TDOC Assigned Count Beds Operating as of Available Operating
INSTITUTION Available Capacity* 6/30/2004 Beds Capacity
GENERAL PURPOSE FACILITIES Hardeman County Correctional Center 2,016 1,976 1,971 97.8% 99.7% Northeast Correctional Complex 1,856 1,819 1,827 98.4% 100.4% Northwest Correctional Complex 2,425 2,377 2,345 96.7% 98.7% South Central Correctional Center 1,676 1,642 1,629 97.2% 99.2% Southeastern TN State Regional Corr. Facility 981 971 944 96.2% 97.2% Turney Center Industrial Prison and Farm 1,136 1,113 1,110 97.7% 99.7% Whiteville Correctional Facility 1,536 1,505 1,521 99.0% 101.1% SUB-TOTAL 11,626 11,403 11,347 97.6% 99.5% CLASSIFICATION FACILITIES Brushy Mountain Correctional Complex 1,603 1,587 1,531 95.5% 96.5% Mark Luttrell Correctional Center 440 436 429 97.5% 98.4% Middle Tennessee Correctional Complex 1,110 1,099 1,015 91.4% 92.4% SUB-TOTAL 3,153 3,122 2,975 94.4% 95.3% SPECIAL PURPOSE FACILITIES DeBerry Special Needs Facility 800 736 746 93.3% 101.4% Tennessee Prison for Women 775 744 733 94.6% 98.5% Wayne County Boot Camp 450 446 409 90.9% 91.7% SUB-TOTAL 2,025 1,926 1,888 93.2% 98.0% HIGH SECURITY FACILITIES Riverbend Maximum Security Institution 736 714 715 97.1% 100.1% West Tennessee State Penitentiary 2,582 2,505 2,483 96.2% 99.1% SUB-TOTAL 3,318 3,219 3,198 96.4% 99.3% TOTALS 20,122 19,670 19,408 96.5% 98.7% *Operating Capacity is based on the number of total beds available and the designated use of certain beds. Special purpose beds such as medical, mental health, disciplinary segregation, and protective custody are excluded. TDOC's operating capacity is currently set at 98% of total beds available. Source: TDOC Bed Space and Operating Capacities
Population as a Percent of:
FISCAL YEAR 2003-2004 ANNUAL REPORT
65
DATA AND STATISTICS - POPULATION
Tabl
e 25
: Lo
cal J
ail C
ensu
s-Fi
scal
Yea
r 200
3-20
04
JU
LY
AUG
SE
PT
OC
T N
OV
DEC
JA
N
FEB
M
AR
APR
M
AY
JUN
E TO
TAL
JAIL
PO
PULA
TIO
N
20,7
85
20,8
28
21,4
21
21,0
77
21,1
36
20,1
22
20,6
21
21,2
73
21,6
26
21,5
98
21,2
12
22,2
03
TD
OC
BAC
KU
P 1,
943
1,98
1 1,
930
1,85
4 2,
081
2,11
5 2,
055
2,07
1 2,
040
2,01
8 2,
057
2,11
0
LOC
AL F
ELO
NS
4,01
1 4,
027
4,11
0 4,
232
4,20
2 4,
206
4,03
2 4,
276
4,44
4 4,
281
4,35
0 4,
347
OTH
ER C
ON
VIC
TED
FEL
ON
S 59
1 48
4 48
4 52
1 48
5 36
9 41
1 33
6 34
4 31
9 53
2 41
8
C
ON
VIC
TED
MIS
DEM
EAN
ANTS
4,
754
4,83
7 5,
096
4,72
8 4,
494
4,57
4 4,
695
4,83
7 5,
097
4,98
5 4,
741
5,13
8
OTH
ERS
838
776
808
791
793
578
561
834
707
920
653
837
PR
E-TR
IAL
DET
AIN
EES
FEL
ON
Y 6,
299
6,42
2 6,
596
6,48
4 6,
698
5,91
4 6,
298
6,41
7 6,
450
6,57
9 6,
382
6,71
8
MIS
DEM
EAN
ANT
2,34
9 2,
301
2,39
7 2,
467
2,38
3 2,
366
2,56
9 2,
502
2,54
4 2,
496
2,49
7 2,
635
PE
RC
ENTA
GE
OF
JA
IL P
OPU
LATI
ON
JU
LY
AUG
SE
PT
OC
T N
OV
DEC
JA
N
FEB
M
AR
APR
M
AY
JUN
E
TD
OC
BAC
KU
P 9.
3%
9.5%
9.
0%
8.8%
9.
8%
10.5
%
10.0
%
9.7%
9.
4%
9.3%
9.
7%
9.5%
LOC
AL F
ELO
NS
19.3
%
19.3
%
19.2
%
20.1
%
19.9
%
20.9
%
19.6
%
20.1
%
20.5
%
19.8
%
20.5
%
19.6
%
OTH
ER C
ON
VIC
TED
FEL
ON
S 2.
8%
2.3%
2.
3%
2.5%
2.
3%
1.8%
2.
0%
1.6%
1.
7%
1.5%
2.
6%
2.0%
C
ON
VIC
TED
MIS
DEM
EAN
ANTS
22
.9%
23
.2%
23
.8%
22
.4%
21
.3%
22
.7%
22
.8%
22
.7%
23
.6%
23
.1%
22
.4%
23
.1%
OTH
ERS
4.0%
3.
7%
3.8%
3.
8%
3.8%
2.
9%
2.7%
3.
9%
3.3%
4.
3%
3.1%
3.
8%
PR
E-TR
IAL
DET
AIN
EES
F
ELO
NY
30.3
%
30.8
%
30.8
%
30.8
%
31.7
%
29.4
%
30.5
%
30.2
%
29.8
%
30.5
%
30.1
%
30.3
%
M
ISD
EMEA
NAN
T 11
.3%
11
.0%
11
.2%
11
.7%
11
.3%
11
.8%
12
.5%
11
.8%
11
.8%
11
.6%
11
.8%
11
.9%
Sour
ce: T
DO
C J
ail S
umm
ary
Rep
orts

TENNESSEE DEPARTMENT OF CORRECTION
66
DATA AND STATISTICS-POPULATON
Table 26: Felony Inmate Population by Age as of June 30, 2004
Table 27: Felony Inmate Population by Gender, Race, and Location as of June 30, 2004
TDOC TDOC LOCAL SYSTEM
INHOUSE % BACKUP % FELON % WIDE %
40+ 6,486 34.0% 969 25.6% 1,012 25.3% 8,467 31.5%
35-39 2,848 14.9% 558 14.7% 568 14.2% 3,974 14.8%
30-34 3,242 17.0% 616 16.3% 679 17.0% 4,537 16.9%
25-29 3,633 19.0% 735 19.4% 708 17.7% 5,076 18.9%
20-24 2,704 14.2% 824 21.7% 927 23.2% 4,455 16.6%
18-19 163 0.9% 79 2.1% 100 2.5% 342 1.3%
<18 15 0.1% 8 0.2% 7 0.2% 30 0.1%
TOTAL 19,091 100.0% 3,789 100.0% 4,001 100.0% 26,881 100.0%
Source: Tennessee Offender Management Information System
TDOC
%
Backup
%
Local
%
System Wide
Male Black 8,582 47.8% 1,317 41.2% 2,337 65.4% 12,236 White 9,079 50.6% 1,841 57.5% 1,161 32.5% 12,081 Other 286 1.6% 41 1.3% 74 2.1% 401
Total Male 17,947 100.0% 3,199 100.0% 3,572 100.0% 24,718 Female Black 362 31.6% 118 20.0% 205 47.8% 685 White 762 66.6% 469 79.5% 220 51.3% 1,451 Other 20 1.7% 3 0.5% 4 0.9% 27
Total Female 1,144 100.0% 590 100.0% 429 100.0% 2,163
TOTAL 19,091 3,789 4,001 26,881 Source: Tennessee Offender Management Information System

FISCAL YEAR 2003-2004 ANNUAL REPORT
67
Ta
ble
28:
Felo
ny In
mat
e Po
pula
tion
Ave
rage
Tot
al S
ente
nce
Leng
th b
y Pr
imar
y O
ffens
e G
roup
DATA AND STATISTICS - POPULATION
NU
MB
ER%
OF
AV
ERA
GE
NU
MB
ER%
OF
AV
ERA
GE
NU
MB
ER%
OF
AV
ERA
GE
NU
MB
ER%
OF
AV
ERA
GE
OF
TDO
CSE
NTE
NC
EO
FTD
OC
SEN
TEN
CE
OF
LOC
ALL
YSE
NTE
NC
EO
FSY
STEM
SE
NTE
NC
E
PRIM
AR
Y O
FFEN
SE G
RO
UP
OFF
END
ERS
INH
OU
SE(Y
Y/M
M)
OFF
END
ERS
BA
CK
UP
(YY
/MM
)O
FFEN
DER
SSE
NTE
NC
ED(Y
Y/M
M)
OFF
END
ERS
WID
E(Y
Y/M
M)
H
omic
ide
M
urde
r 3,
510
18.3
9%15
/07
511.
35%
18/0
138
0.95
%04
/00
3,59
913
.39%
15/0
6
Neg
ligen
t Man
slau
ghte
r18
0.09
%06
/03
100.
26%
01/0
64
0.10
%01
/03
320.
12%
04/0
2
Kid
napp
ing
244
1.28
%23
/10
110.
29%
08/0
218
0.45
%04
/04
273
1.02
%21
/03
S
ex O
ffen
ses
Fo
rcib
le2,
703
14.1
6%22
/03
135
3.56
%07
/08
892.
22%
02/0
22,
927
10.8
9%21
/04
N
on-F
orci
ble
740.
39%
08/0
427
0.71
%02
/02
210.
52%
01/0
512
20.
45%
05/1
0
Ass
ault
Agg
rava
ted
Ass
ault
2,19
011
.47%
15/0
134
79.
16%
05/0
147
811
.95%
03/0
13,
015
11.2
2%11
/11
Sim
ple
Ass
ault
350.
18%
04/1
141
1.08
%02
/00
411.
02%
01/0
411
70.
44%
02/0
8
Ars
on12
70.
67%
13/0
418
0.48
%04
/06
210.
52%
01/1
116
60.
62%
11/0
2
Bur
glar
y1,
953
10.2
3%09
/11
566
14.9
4%04
/05
683
17.0
7%02
/10
3,20
211
.91%
07/0
5
For
gery
/Fra
ud29
91.
57%
07/0
624
16.
36%
02/1
014
73.
67%
01/1
168
72.
56%
04/0
6
Lar
ceny
/The
ft82
14.
30%
07/0
639
010
.29%
03/0
150
012
.50%
02/0
31,
711
6.37
%05
/00
R
obbe
ry
A
ggra
vate
d R
obbe
ry2,
796
14.6
5%18
/01
278
7.34
%10
/03
591.
47%
04/0
53,
133
11.6
6%17
/01
All
Oth
er R
obbe
ry55
72.
92%
10/0
211
53.
04%
05/1
018
34.
57%
03/0
585
53.
18%
08/0
20
D
rug
Off
ense
s
C
ocai
ne
1,93
410
.13%
11/0
657
615
.20%
06/0
471
517
.87%
02/0
93,
225
12.0
0%08
/09
Oth
er D
rug
Off
ense
s70
83.
71%
09/0
243
811
.56%
03/0
538
19.
52%
01/0
81,
527
5.68
%05
/08
V
ehic
ular
V
ehic
ular
Hom
icid
e/D
UI
181
0.95
%13
/10
320.
84%
09/0
621
0.52
%01
/05
234
0.87
%12
/01
All
Oth
er V
ehic
ular
630.
33%
05/0
350
1.32
%02
/01
111
2.77
%00
/06
224
0.83
%02
/03
C
/S/F
Per
son
226
1.18
%19
/02
170.
45%
07/0
415
0.37
%02
/05
258
0.96
%17
/04
C
/S/F
Pro
perty
720.
38%
09/0
125
0.66
%04
/06
501.
25%
02/1
014
71.
00%
06/0
2
C/S
/F S
ocie
tal/D
rugs
102
0.53
%11
/07
451.
19%
03/0
296
2.40
%01
/05
243
0.90
%06
/01
E
scap
e25
0.13
%08
/05
40.
11%
05/0
04
0.10
%02
/00
330.
12%
07/0
3
All
Oth
er
453
2.37
%06
/00
372
9.82
%02
/08
326
8.15
%01
/08
1,15
14.
28%
03/0
9TO
TAL
19,0
9110
0%3,
789
100%
4,00
110
0%26
,881
100.
00%
Sent
ence
Typ
e
Dea
th99
0.37
%00
/00
00.
00%
00/0
00
0.00
%00
/00
990.
37%
00/0
0
Life
1,91
97.
14%
00/0
06
0.16
%00
/00
00.
00%
00/0
01,
925
7.16
%00
/00
8
5%2,
419
9.00
%20
/06
782.
06%
14/0
512
0.30
%02
/08
2,50
99.
33%
20/0
3
1-2
Yea
rs18
80.
70%
01/1
148
912
.91%
01/0
877
419
.35%
01/0
61,
451
5.40
%01
/09
The
aver
age
sent
ence
leng
th fo
r mur
der i
s ba
sed
on 3
,260
off
ende
rs.
The
rem
aini
ng 2
50 o
ffen
ders
wer
e ei
ther
sen
tenc
ed to
life
with
out p
arol
e or
dea
th, f
or w
hich
the
sent
ence
leng
th w
as n
ot
incl
uded
in th
e ab
ove
stat
istic
s.
PERSON PROPERTY SOCIETAL OTHER
TD
OC
IN
HO
USE
TD
OC
BA
CK
UP
LO
CA
LL
Y S
EN
TE
NC
ED
SYST
EM
WID
E

TENNESSEE DEPARTMENT OF CORRECTION
68
DATA AND STATISTICS - POPULATION
Table 29: Inmates Incarcerated over 10 Consecutive Years by Primary Offense, Average Time Served and Location
Table 30: TDOC Institutions Assaults, Inmate Deaths and Escapes
Fiscal Year 2003-2004
BMC
X
DSN
F
HC
CF
MLC
C
MTC
X
NEC
X
NW
CX
RM
SI
SCC
F
STSR
TPFW
TCIP
WC
BC
WC
FA
WTS
PN
umbe
r of
Offe
nder
sAv
g Ti
me
Serv
ed
(YY/
MM
)
Primary Offense GroupHomicide 122 81 50 21 15 167 106 120 47 102 21 93 22 16 94 1077 16/03Kidnapping 4 3 5 0 2 6 5 3 5 3 0 5 0 0 5 46 17/01Sex Offenses 48 28 27 0 7 105 63 31 46 60 1 53 13 6 66 554 16/00Robbery 7 4 7 0 5 8 8 7 4 7 0 9 2 1 27 96 15/10Burglary 1 1 0 0 0 3 0 0 1 2 0 3 0 0 2 13 18/01Assault 4 7 5 1 0 8 9 3 5 7 0 6 2 0 8 65 16/02Drugs 1 0 0 0 0 2 0 0 0 0 0 0 0 0 1 4 12/02Arson 1 0 0 0 0 1 0 0 0 0 0 1 0 0 0 3 12/02Larceny/Theft 0 0 0 0 0 0 0 0 0 0 0 0 0 0 2 2 22/01C/S/F Person 4 1 0 0 0 0 0 2 1 0 1 0 0 0 0 9 17/04Other 0 0 1 0 0 0 2 0 0 1 0 0 0 0 0 4 19/04Total 192 125 95 22 29 300 193 166 109 182 23 170 39 23 205 1873Sentence TypeDeath 0 0 0 0 0 0 1 51 0 0 1 0 0 0 0 53 16/08Life 110 55 43 13 5 137 67 60 35 81 18 76 10 13 71 794 17/04Life without Parole 1 0 0 0 0 1 0 0 0 0 0 1 0 0 0 3 22/00Life Minimum 25 yrs. 0 0 0 0 0 0 0 0 0 0 0 1 0 0 0 1 17/06Habitual 4 2 1 0 0 5 3 0 5 6 0 8 0 0 4 38 19/0385% 0 0 0 0 0 1 0 0 0 0 0 0 0 0 1 2 16/07
1st Qtr 2nd Qtr 3rd Qtr 4th Qtr Total Assault Assault on Offender 62 88 85 77 312 Assault on Staff 104 132 129 100 465 Death Homicide 0 2 0 0 2 Suicide 1 0 0 0 1 Accidental Death 0 0 0 0 0 Natural Death 28 28 23 20 99 Escape Secure Supervision 0 0 0 0 0 Minimum Security 0 0 3 0 3 Minimum Security - Work Crew - Supervised 1 1 0 1 3 Minimum Security - Work Crew - Unsupervised 0 0 0 2 2 Furlough/Pass 0 0 0 2 2

FISCAL YEAR 2003-2004 ANNUAL REPORT
69
DATA AND STATISTICS - POPULATION Ta
ble
31:
TDO
C In
stitu
tions
, Inc
iden
t Sum
mar
y Fi
scal
Yea
r 200
3-20
04
Pct
. Cha
nge*
**W
CB
CM
LCC
TPW
RM
SI
DS
NF
STS
RC
CB
CX
TCIP
SC
CC
NE
CX
BM
CX
WTS
PH
CC
CN
WC
XW
CFA
SY
STE
MFY
02-0
3FY
01-
02A
vera
ge P
opul
atio
n41
1
416
71
5
705
73
9
942
1,
015
1,09
3
1,
609
1,80
7
1,
526
2,43
4
1,
949
2,28
6
1,
474
19,1
19
17,8
01
17,5
92
AR
RE
ST
FU
R/P
AS
S-V
IOLE
NT
CR
IME
00
00
00
00
00
00
00
0-
0.
0%0.
0% F
UR
/PA
SS
-FE
LON
Y0
00
00
00
00
00
00
00
-
0.0%
0.0%
FU
R/P
AS
S-M
IS0
00
00
00
00
00
00
00
-
0.0%
0.0%
FE
LON
Y-O
FN
00
00
00
00
00
00
00
0-
0.
0%0.
0% F
ELO
NY
-STA
FF
00
01
01
00
01
02
33
314
133.
3%36
6.7%
FE
LON
Y-V
ISIT
OR
10
10
01
15
40
1215
49
1063
-4.5
%-1
8.2%
AR
SO
N*S
ER
INJ-
PR
OP
DA
MG
>500
-OP
ER
DIS
R0
00
00
00
00
00
00
00
-
0.0%
0.0%
*IN
J-P
RO
P D
AM
G>$
500-
OP
ER
DIS
RU
P0
00
00
00
00
00
00
00
-
-100
.0%
-100
.0%
*AR
SO
N-P
RO
P D
MG
>$50
00
00
00
00
00
00
10
00
1
-50.
0%-8
0.0%
AS
SA
ULT
*ST
AF
F-S
ER
IOU
S IN
JUR
Y0
01
41
00
00
20
20
30
13
18
.2%
-31.
6%*S
TA
FF
-IN
JUR
Y0
11
64
00
21
64
131
51
45
-3
1.8%
-27.
4%*S
TA
FF
-MIN
OR
INJU
RY
03
112
72
54
173
433
320
912
3
-2
.4%
-3.9
%*S
TA
FF
-NO
INJU
RY
04
491
124
65
1623
1039
1528
2728
4
-1
4.2%
-5.3
%*O
FN
-SE
RIO
US
INJU
RY
02
00
00
16
64
16
18
136
16.1
%5.
9%*O
FN
- IN
JUR
Y1
60
13
61
56
54
155
75
70
-1
0.3%
1.4%
*OF
N-M
INO
R IN
JUR
Y1
94
11
53
2110
64
810
1611
110
-9.1
%1.
9%*O
FN
-NO
INJU
RY
37
89
34
32
162
63
1211
796
21.5
%39
.1%
*VIS
-SE
RIO
US
INJU
RY
00
00
00
00
00
00
00
0-
0.
0%0.
0%*V
IS-
INJU
RY
00
00
00
00
00
00
00
0-
0.
0%0.
0%*V
IS-M
INO
R IN
JUR
Y0
00
00
10
00
00
21
00
4
300.
0%**
*VIS
-NO
INJU
RY
00
00
00
10
00
01
11
04
10
0.0%
33.3
%D
EA
TH O
FN
-NA
TU
RA
L2
10
272
01
11
01
63
62
98
50
.8%
88.5
% O
FN
-ELE
CT
RIC
CH
AIR
00
00
00
00
00
00
00
0-
0.
0%0.
0%*O
FN
-HO
MIC
IDE
00
00
00
00
00
00
01
01
0.
0%-6
6.7%
OF
N-L
ET
HA
L IN
JEC
T0
00
00
00
00
00
00
00
-
0.0%
0.0%
*OF
N-S
UIC
IDE
00
00
00
00
00
01
00
01
-7
5.0%
0.0%
OF
N-A
CC
IDE
NT
00
00
00
00
00
00
00
0-
0.
0%-1
00.0
% *
ST
AF
F(O
N D
UT
Y)-
HO
MIC
IDE
00
00
00
10
00
00
00
01
0.
0%0.
0% *
ST
AF
F(O
N D
UT
Y)-
SU
ICID
E0
00
00
00
00
00
00
00
-
0.0%
0.0%
ST
AF
F(O
N D
UT
Y)-
AC
CID
EN
T0
00
00
00
00
00
00
00
-
0.0%
-100
.0%
ST
AF
F(O
N D
UT
Y)-
NA
TU
RA
L0
00
00
00
00
00
10
00
1
0.0%
** *
VIS
ITO
R-H
OM
ICID
E0
00
00
00
00
00
00
00
-
0.0%
0.0%
*V
ISIT
OR
-SU
ICID
E0
00
00
00
00
00
00
00
-
0.0%
0.0%
VIS
ITO
R-A
CC
IDE
NT
00
00
00
00
00
00
00
0-
0.
0%0.
0% V
ISIT
OR
-NA
TUR
AL
00
00
00
00
00
00
00
0-
0.
0%0.
0%D
ISTU
RB
AN
CE
TE
MP
-CO
NT
RO
L LO
SS
00
00
00
01
00
00
04
05
66
.7%
150.
0% T
HR
EA
T C
ON
TR
OL
LOS
S0
00
00
00
10
00
00
40
5
-50.
0%-3
7.5%
MIN
OR
1321
5110
517
5740
114
305
146
8930
746
540
427
42,
408
-8
.6%
7.5%
*Ind
icat
es v
iole
nt in
cide
nt
** In
dica
tes
pre
vio
us c
ompa
rabl
e da
ta e
qual
to z
ero
***T
he p
erce
ntag
e ch
ange
col
umns
indi
cate
how
muc
h in
cide
nts
have
ris
en o
r de
clin
ed fr
om th
e fis
cal y
ear
indi
cate
d at
the
top
of th
e co
lum
n. I
n th
e co
mpa
rison
s, th
e tw
o pr
evio
us
fisca
l yea
rs, F
Y01
-02
and
FY
02-
03, a
re c
ompa
red
to F
Y 0
3-04
. F
or e
xam
ple,
sin
ce F
Y 0
1-02
, the
vio
lent
inci
dent
rat
e ha
s de
crea
sed
2.1%
. H
owev
er, w
hen
FY
03-
04is
com
pare
d w
ith F
Y 0
2-03
, the
re h
as b
een
an d
ecre
ase
of 6
.3%
in th
e vi
olen
t inc
iden
t rat
e.

TENNESSEE DEPARTMENT OF CORRECTION
70
DATA AND STATISTICS - POPULATION
DR
UG
S C
ON
FIS
-SIG
NIF
AM
OU
NT
-OF
N1
11
56
78
36
128
237
228
118
-4.8
%3.
5% C
ON
FIS
-SIG
NIF
0
00
00
00
00
00
00
00
-
-100
.0%
-100
.0%
CO
NF
IS-S
IGN
IF A
MO
UN
T-V
ISIT
OR
00
00
00
10
00
00
00
01
0.
0%-6
6.7%
CO
NF
ISC
AT
ION
-OF
FE
ND
ER
410
198
416
2016
3441
4048
4753
4840
8
2.
8%0.
2% C
ON
FIS
CA
TIO
N-S
TA
FF
00
00
00
00
00
00
00
0-
-1
00.0
%0.
0% C
ON
FIS
CA
TIO
N-V
ISIT
OR
20
30
00
10
01
20
00
110
-87.
2%-8
2.8%
PO
SS
ES
SIO
N1
11
40
51
108
72
115
68
70
-1
4.6%
-26.
3% S
ELL
ING
01
00
01
01
05
02
00
010
-63.
0%0.
0% D
RU
GS
FO
UN
D O
N P
RO
PE
RT
Y
10
20
10
62
11
54
27
537
48.0
%76
.2%
EQ
UIP
ME
NT
MA
JOR
DIS
RU
PT
ION
02
13
20
17
00
52
03
127
-43.
8%-4
8.1%
ES
CA
PE
*SE
CU
RE
SU
PE
RV
ISIO
N0
00
00
00
00
00
00
00
-
0.0%
-100
.0%
*MIN
SE
CU
RIT
Y-V
IOLE
NC
E0
00
00
00
00
00
00
00
-
0.0%
0.0%
MIN
IMU
M S
EC
UR
ITY
UN
IT1
00
00
00
00
00
20
00
3
50.0
%50
.0%
MIN
SE
CU
RIT
Y W
OR
K C
RE
W-S
UP
V0
00
00
11
00
10
00
00
3
-25.
0%50
.0%
MIN
SE
CU
RIT
Y W
OR
K C
RE
W-U
NS
UP
V0
00
00
00
00
02
00
00
2
100.
0%**
FU
RLO
UG
H/P
AS
S0
00
00
01
00
10
00
00
2
**10
0.0%
AT
T S
EC
UR
E S
UP
ER
VIS
ION
00
00
00
00
00
00
00
0-
-1
00.0
%-1
00.0
%*A
TT
MIN
SE
CU
RIT
Y-V
IOLE
NC
E0
00
00
00
00
00
00
00
-
0.0%
0.0%
AT
T M
INIM
UM
SE
CU
RIT
Y0
00
00
00
00
00
00
00
-
-100
.0%
-100
.0%
FIR
E S
ER
INJ-
PR
OP
DA
MG
>500
-OP
ER
DIS
R0
00
00
00
00
00
00
00
-
0.0%
0.0%
INJ-
PR
OP
DA
MG
>$50
0-O
PE
R D
ISR
UP
00
00
00
00
00
00
00
0-
0.
0%0.
0% F
IRE
-PR
OP
DM
G>$
500
01
00
10
01
00
02
02
07
**
75.0
%IN
JUR
Y A
CC
IDE
NT
-OF
N-S
ER
IOU
S1
21
263
07
70
57
72
82
78
15
1.6%
16.4
% A
CC
IDE
NT
-OF
N-W
RK
RE
LAT
ED
4522
48
58
1633
142
125
91
130
305
-16.
4%-6
.4%
AC
CID
EN
T-S
TA
FF
-SE
RIO
US
01
23
20
00
11
10
02
013
30.0
%-3
5.0%
AC
CID
EN
T S
TA
FF
09
514
94
1028
240
1914
224
216
4
-1
9.2%
-24.
1% A
CC
IDE
NT
-VIS
ITO
R-S
ER
IOU
S0
00
00
00
00
00
00
00
-
-100
.0%
0.0%
AC
CID
EN
T-V
ISIT
OR
11
33
40
71
00
113
11
036
24.1
%38
.5%
*SE
LF IN
FLI
CT
ED
-SE
RIO
US
00
02
140
00
00
26
23
029
52.6
%-2
3.7%
*SE
LF IN
FLI
CT
ED
03
1220
253
515
8311
1324
3016
4030
0
23
.5%
53.8
%IL
LN
ES
S O
FN
-SE
RIO
US
-HO
SP
ITA
L4
1742
122
279
111
060
770
264
292
48.2
%30
.4%
ST
AF
F S
ER
IOU
S-H
OS
P(O
N D
UT
Y)
02
75
30
20
01
915
09
154
45.9
%-1
2.9%
VIS
ITO
R-S
ER
IOU
S-H
OS
PIT
AL
00
10
01
00
00
00
00
02
-7
1.4%
-60.
0%O
THE
RB
OM
B T
HR
EA
T
00
00
00
11
00
00
00
02
10
0.0%
100.
0%C
ON
TR
AB
AN
D22
2145
127
131
121
112
142
375
224
144
306
245
200
227
2,44
2
-5.9
%17
.5%
PR
OP
ER
TY
DA
MA
GE
>$5
000
38
22
311
90
22
90
40
55
0.
0%17
.0%
SE
XU
AL
MIS
CO
ND
UC
T2
1016
6514
2119
2123
910
126
8064
224
896
1,60
0
45.9
%11
8.3%
*In
dic
ates
vio
len
t in
cid
ent
** In
dic
ates
pre
vio
us
com
par
able
dat
a eq
ual
to z
ero
**
*The
per
cent
age
chan
ge c
olum
ns in
dica
te h
ow m
uch
inci
dent
s ha
ve r
isen
or
decl
ined
from
the
fisca
l yea
r in
dica
ted
at th
e to
p of
the
colu
mn.
In
the
com
paris
ons,
the
two
prev
ious
fisca
l yea
rs, F
Y01
-02
and
FY
02-
03, a
re c
ompa
red
to F
Y 0
3-04
. F
or e
xam
ple,
sin
ce F
Y 0
1-02
, the
vio
lent
inci
dent
rat
e ha
s de
crea
sed
2.1%
. H
owev
er, w
hen
FY
03-
04is
com
pare
d w
ith F
Y 0
2-03
, the
re h
as b
een
an d
ecre
ase
of 6
.3%
in th
e vi
olen
t inc
iden
t rat
e.
Pct.
Chan
ge**
*W
CBC
MLC
CTP
WRM
SID
SNF
STSR
CCB
CX
TCIP
SCC
CN
ECX
BMC
XW
TSP
HC
CC
NW
CXW
CFA
SYST
EMFY
02-0
3FY
01-
02Av
erag
e Po
pula
tion
411
41
6
715
70
5
739
94
2
1,01
5
1,
093
1,60
9
1,
807
1,52
6
2,
434
1,94
9
2,
286
1,47
4
19
,119
17
,801
17
,592
Tabl
e 31
: TD
OC
Inst
itutio
ns, I
ncid
ent S
umm
ary
Fisc
al Y
ear 2
003-
2004
FISCAL YEAR 2003-2004 ANNUAL REPORT
71
DATA AND STATISTICS - POPULATION Ta
ble
31:
TDO
C In
stitu
tions
, Inc
iden
t Sum
mar
y Fi
scal
Yea
r 200
3-20
04
*RIO
T0
00
00
00
00
00
00
00
-
0.0%
-100
.0%
SA
BA
TOG
E-O
PR
DIS
RU
P0
00
00
00
00
00
00
00
-
0.0%
0.0%
*HO
STA
GE
SIT
UA
TIO
N0
00
00
00
00
00
00
00
-
0.0%
0.0%
EP
IDE
MIC
-PU
B H
EA
LTH
TH
RE
AT
00
00
00
00
00
00
10
01
**
**P
AR
TIC
IPA
TE IN
GA
NG
AC
TIV
ITY
30
01
04
219
2012
322
827
812
9
13
0.4%
57.3
%P
OS
SE
SS
GA
NG
RE
LATE
D M
ATE
RIA
L9
01
70
106
4576
56
2516
4032
278
9.4%
-14.
2%ST
RIK
E IN
MA
TE-O
PE
R. D
ISR
UP
00
00
00
00
00
00
00
0-
0.
0%0.
0% S
TAFF
-OP
ER
. DIS
RU
P0
00
00
00
00
00
00
00
-
0.0%
0.0%
SUIC
IDE
*ATT
-SE
RIO
US
INJU
RY
00
00
02
00
00
00
00
35
15
0.0%
-50.
0%*A
TTE
MP
T0
12
40
52
29
30
41
01
34
9.
7%-1
2.8%
USE
OF
FOR
CE
CH
EM
ICA
L A
GE
NTS
01
04
01
00
142
725
913
682
0.0%
3.8%
DE
AD
LY W
EA
PO
N0
00
00
00
00
00
00
00
-
0.0%
-100
.0%
ELE
C R
ES
TRA
INTS
00
05
10
20
08
21
07
026
-27.
8%-4
0.9%
LE
SS
TH
AN
LE
THA
L0
00
00
00
00
00
00
00
-
0.0%
-100
.0%
ME
DIC
AL
00
12
110
01
10
00
01
118
157.
1%-2
8.0%
PH
YS
ICA
L0
210
385
410
810
49
2627
611
170
4.9%
24.1
%W
EAPO
NS
AM
MU
NIT
ION
00
00
00
00
00
01
00
01
-9
3.3%
-88.
9% A
MM
UN
ITIO
N-S
IGN
IF A
MO
UN
T0
00
00
00
00
00
00
00
-
-100
.0%
-100
.0%
CO
MM
ER
CIA
L FI
RE
AR
M0
00
21
01
00
00
00
00
4
-73.
3%-7
5.0%
CO
MM
ER
CIA
L K
NIF
E
20
04
00
13
02
11
02
218
-91.
2%-8
5.4%
EX
PLO
SIV
E0
00
00
00
00
00
00
00
-
-100
.0%
0.0%
EX
PLO
SIV
E-S
IGN
IF A
MO
UN
T 0
00
00
00
00
00
00
00
-
0.0%
0.0%
HO
ME
MA
DE
FIR
EA
RM
00
00
00
00
00
00
00
0-
0.
0%0.
0% H
OM
EM
AD
E K
NIF
E4
01
155
43
5451
292
3541
120
5041
4
-2
7.7%
-37.
3% O
THE
R0
10
41
82
35
56
95
82
59
-3
5.9%
-11.
9% C
LUB
00
00
00
11
00
13
13
010
-23.
1%10
0.0%
RA
W M
ATE
RIA
LS
00
02
00
03
00
28
312
030
-11.
8%-2
3.1%
CLA
SS
A T
OO
L0
20
21
23
12
02
10
00
16
-5
9.0%
-62.
8% C
LAS
S B
TO
OL
30
10
00
01
00
00
00
27
**
250.
0%
TOTA
L-VI
OLE
NT
5
36
33
15
0
70
32
28
62
16
4
65
48
158
82
11
9
10
5
1,15
7
0.7%
6.4%
TOTA
L - N
ON
-VIO
LEN
T12
2
13
2
22
7
47
9
303
307
30
7
55
4
1,
192
619
61
1
1,10
2
1,
540
1,29
7
806
9,
598
-2
.2%
11.1
%TO
TAL
127
168
260
629
37
3
33
9
335
616
1,35
6
68
4
659
1,
260
1,62
2
1,
416
91
1
10,7
55
-1
.9%
10.6
%
Rat
e pe
r 10
0 - V
iole
nt1.
22
8.
65
4.
62
21
.28
9.47
3.40
2.
76
5.
67
10
.19
3.60
3.15
6.49
4.
21
5.
21
7.
12
6.
05
-6
.2%
-2.1
%R
ate
per
100
- Non
-Vio
lent
29.6
8
31.7
3
31.7
5
67.9
4
41
.00
32
.59
30.2
5
50.6
9
74.0
8
34
.26
40.0
4
45
.28
79.0
1
56
.74
54
.68
50.2
0
-9.0
%2.
2%R
ate
per
100
- Tot
al30
.90
40
.38
36
.36
89
.22
50.4
7
35.9
9
33
.00
56
.36
84
.28
37.8
5
43
.18
51.7
7
83
.22
61.9
4
61.8
0
56
.25
-8
.7%
1.7%
*Indi
cate
s vi
olen
t inc
iden
t**
Indi
cate
s pr
evio
us c
ompa
rabl
e da
ta e
qual
to z
ero
***T
he p
erce
ntag
e ch
ange
col
umns
indi
cate
how
muc
h in
cide
nts
have
rise
n or
dec
lined
from
the
fisca
l yea
r ind
icat
ed a
t the
top
of th
e co
lum
n. I
n th
e co
mpa
rison
s, th
e tw
o pr
evio
us
fisca
l yea
rs, F
Y01
-02
and
FY 0
2-03
, are
com
pare
d to
FY
03-
04.
For e
xam
ple,
sin
ce F
Y 0
1-02
, the
vio
lent
inci
dent
rate
has
dec
reas
ed 2
.1%
. H
owev
er, w
hen
FY 0
3-04
is c
ompa
red
with
FY
02-
03, t
here
has
bee
n an
dec
reas
e of
6.3
% in
the
viol
ent i
ncid
ent r
ate.
Pc
t. C
ha
ng
e**
*W
CB
CM
LC
CT
PW
RM
SI
DS
NF
ST
SR
CC
BC
XT
CIP
SC
CC
NE
CX
BM
CX
WT
SP
HC
CC
NW
CX
WC
FA
SY
ST
EM
FY
02
-03
FY
01
-02
Av
era
ge
Po
pu
lati
on
41
1
4
16
71
5
7
05
73
9
9
42
1
,01
5
1
,09
3
1
,60
9
1,8
07
1
,52
6
2,4
34
1
,94
9
2,2
86
1,4
74
1
9,1
19
17
,80
1
1
7,5
92
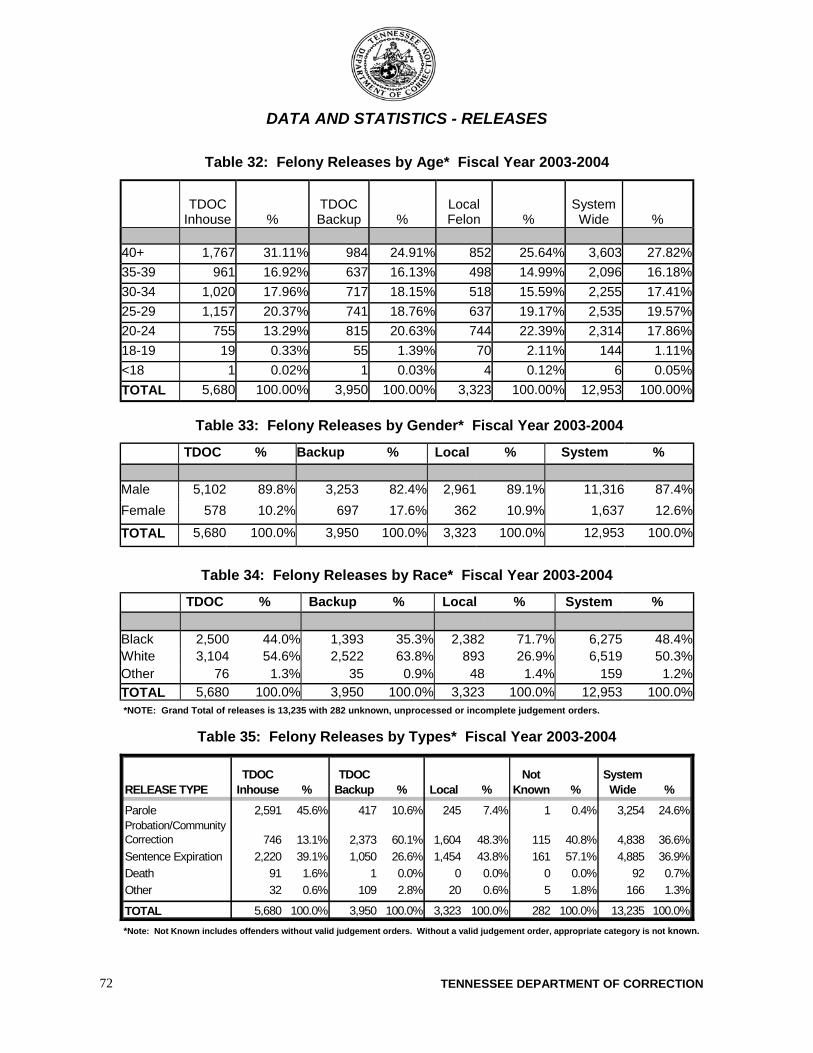
TENNESSEE DEPARTMENT OF CORRECTION
72
DATA AND STATISTICS - RELEASES
Table 32: Felony Releases by Age* Fiscal Year 2003-2004
Table 33: Felony Releases by Gender* Fiscal Year 2003-2004
Table 34: Felony Releases by Race* Fiscal Year 2003-2004
Table 35: Felony Releases by Types* Fiscal Year 2003-2004
RELEASE TYPETDOC
Inhouse %TDOC
Backup % Local % Not
Known %System Wide %
Parole 2,591 45.6% 417 10.6% 245 7.4% 1 0.4% 3,254 24.6%Probation/Community Correction 746 13.1% 2,373 60.1% 1,604 48.3% 115 40.8% 4,838 36.6%Sentence Expiration 2,220 39.1% 1,050 26.6% 1,454 43.8% 161 57.1% 4,885 36.9%Death 91 1.6% 1 0.0% 0 0.0% 0 0.0% 92 0.7%Other 32 0.6% 109 2.8% 20 0.6% 5 1.8% 166 1.3%
TOTAL 5,680 100.0% 3,950 100.0% 3,323 100.0% 282 100.0% 13,235 100.0%*Note: Not Known includes offenders without valid judgement orders. Without a valid judgement order, appropriate category is not known.
TDOC
Inhouse
%
TDOC Backup
%
Local Felon
%
System Wide
%
40+ 1,767 31.11% 984 24.91% 852 25.64% 3,603 27.82% 35-39 961 16.92% 637 16.13% 498 14.99% 2,096 16.18% 30-34 1,020 17.96% 717 18.15% 518 15.59% 2,255 17.41% 25-29 1,157 20.37% 741 18.76% 637 19.17% 2,535 19.57% 20-24 755 13.29% 815 20.63% 744 22.39% 2,314 17.86% 18-19 19 0.33% 55 1.39% 70 2.11% 144 1.11% <18 1 0.02% 1 0.03% 4 0.12% 6 0.05% TOTAL 5,680 100.00% 3,950 100.00% 3,323 100.00% 12,953 100.00%
TDOC % Backup % Local % System %
Male 5,102 89.8% 3,253 82.4% 2,961 89.1% 11,316 87.4% Female 578 10.2% 697 17.6% 362 10.9% 1,637 12.6%
TOTAL 5,680 100.0% 3,950 100.0% 3,323 100.0% 12,953 100.0%
TDOC % Backup % Local % System %
Black 2,500 44.0% 1,393 35.3% 2,382 71.7% 6,275 48.4% White 3,104 54.6% 2,522 63.8% 893 26.9% 6,519 50.3% Other 76 1.3% 35 0.9% 48 1.4% 159 1.2% TOTAL 5,680 100.0% 3,950 100.0% 3,323 100.0% 12,953 100.0% *NOTE: Grand Total of releases is 13,235 with 282 unknown, unprocessed or incomplete judgement orders.

FISCAL YEAR 2003-2004 ANNUAL REPORT
73
DATA AND STATISTICS - RELEASES
PRIM
AR
Y O
FFE
NSE
G
RO
UP
Number
%
Average Time Served (YY/MM)
Number
%
Average Time Served (YY/MM)
Number
%
Average Time Served (YY/MM)
Number
%
Average Time Served (YY/MM)
H
omic
ide
M
urde
r 13
84.
24%
14/0
913
12.
64%
10/0
717
0.36
%12
/09
286
2.21
%12
/07
N
eglig
ent M
ansl
augh
ter
00.
00%
00/0
015
0.30
%02
/11
150.
32%
00/1
130
0.23
%01
/11
K
idna
ppin
g19
0.58
%12
/04
330.
66%
08/0
210
0.21
%04
/09
620.
48%
08/0
9
Sex
Offe
nses
Fo
rcib
le25
0.77
%11
/00
314
6.32
%09
/01
591.
25%
05/0
239
83.
08%
08/0
8
Non
-For
cibl
e1
0.03
%08
/06
400.
81%
03/0
580
1.69
%01
/02
121
0.94
%02
/01
A
ssau
lt
A
ggra
vate
d A
ssau
lt24
07.
38%
06/0
367
313
.55%
05/0
339
78.
41%
03/0
91,
310
10.1
2%05
/02
Sim
ple
Ass
ault
100.
31%
03/0
345
0.91
%03
/04
100
2.12
%01
/08
155
1.20
%02
/03
04/0
604
/08
A
rson
150.
46%
05/1
038
0.77
%06
/11
150.
32%
03/1
068
0.53
%05
/06
B
urgl
ary
526
16.1
7%04
/08
865
17.4
2%04
/11
764
16.1
8%03
/04
2,15
516
.65%
04/0
3
For
gery
/Fra
ud11
53.
54%
02/0
716
63.
34%
03/0
239
98.
45%
01/0
868
05.
26%
02/0
2
Lar
ceny
/The
ft28
78.
83%
03/0
647
59.
57%
03/0
963
913
.53%
02/0
21,
401
10.8
3%03
/01
R
obbe
ry
A
ggra
vate
d R
obbe
ry48
514
.91%
07/0
141
68.
38%
08/1
087
1.84
%09
/08
988
7.64
%08
/01
All
Oth
er R
obbe
ry15
44.
74%
05/0
426
85.
40%
05/0
416
53.
49%
05/0
358
74.
54%
05/0
7
D
rug
Offe
nses
Coc
aine
79
124
.32%
04/0
874
915
.08%
06/0
864
313
.62%
04/0
12,
183
16.8
7%05
/03
Oth
er D
rug
Offe
nses
248
7.63
%03
/03
244
4.91
%03
/11
533
11.2
9%01
/09
1,02
57.
92%
02/0
8
Veh
icul
ar
Veh
icul
ar H
omic
ide/
DU
I21
0.65
%05
/01
380.
77%
06/0
214
0.30
%07
/10
730.
56%
06/0
2
A
ll O
ther
Veh
icul
ar5
0.15
%04
/02
551.
11%
02/0
310
72.
27%
01/0
016
71.
29%
01/0
7
C/S
/F P
erso
n19
0.58
%08
/05
220.
44%
05/0
49
0.19
%06
/08
500.
39%
06/0
9
C/S
/F P
rope
rty29
0.89
%04
/03
380.
77%
03/0
848
1.02
%02
/01
115
0.89
%03
/02
C
/S/F
Soc
ieta
l/Dru
gs27
0.83
%04
/01
621.
25%
04/0
571
1.50
%02
/09
160
1.24
%03
/06
E
scap
e6
0.18
%01
/03
30.
06%
02/0
913
0.28
%02
/05
220.
17%
03/0
4
All
Oth
er
912.
80%
02/1
027
65.
56%
02/0
953
711
.37%
01/0
390
46.
99%
01/1
1
TO
TA
L3,
252
100.
00%
05/0
54,
966
100.
00%
05/0
84,
722
100.
00%
02/1
112
,940
100.
00%
04/0
6
PAR
OL
EE
XPI
RA
TIO
N A
ND
OT
HE
RS
PRO
BA
TIO
N/C
OM
MU
NIT
Y
CO
RR
EC
TIO
NSY
STE
MW
IDE
PERSON PROPERTY SOCIETAL OTHERTa
ble
36:
Felo
ny R
elea
ses
Type
s an
d A
vera
ge T
ime
Serv
ed b
y Pr
imar
y O
ffens
e G
roup
Fi
scal
Yea
r 200
3-20
04

TENNESSEE DEPARTMENT OF CORRECTION
74
DATA AND STATISTICS - RELEASES Ta
ble
37:
Felo
ny R
elea
ses
and
Aver
age
Tim
e Se
rved
by
Prim
ary
Offe
nse
Gro
up
Fisc
al Y
ear 2
003-
2004
PRIM
ARY
OFF
ENSE
G
ROUP
Num
ber o
f O
ffend
ers
% of
TD
OC
Inho
use
Aver
age
Tim
e Se
rved
(Y
Y/M
M)
Num
ber o
f O
ffend
ers
% of
TD
OC
Back
up
Aver
age
Tim
e Ser
ved
(YY/
MM
)Nu
mbe
r of
Offe
nder
s%
of L
ocal
ly
Sent
ence
d
Aver
age
Tim
e Ser
ved
(YY/
MM
)Nu
mbe
r of
Offe
nder
s
% of
Sy
stem
W
ide
Aver
age
Tim
e Se
rved
(Y
Y/M
M)
H
omici
de
M
urde
r 23
54.1
4%13
/10
250.6
3%13
/07
260.7
8%05
/02
286
2.21%
12/0
7
N
eglig
ent M
ansla
ught
er8
0.14%
02/0
411
0.28%
02/0
511
0.33%
01/0
730
0.23%
01/1
1
Kid
napp
ing
420.7
4%10
/04
110.2
8%06
/01
90.2
7%04
/07
620.4
8%08
/09
S
ex O
ffens
es
F
orcib
le28
34.9
9%09
/08
711.8
0%07
/04
411.2
3%04
/03
395
3.05%
08/0
8
N
on-F
orcib
le38
0.67%
03/1
055
1.39%
01/0
728
0.84%
01/0
712
10.9
4%02
/01
A
ssau
lt
Ag
grav
ated A
ssau
lt58
810
.37%
06/0
028
77.2
7%05
/02
435
13.09
%03
/08
1,310
10.12
%05
/00
Sim
ple A
ssau
lt50
0.88%
02/0
858
1.47%
02/0
747
1.41%
01/0
915
51.2
0%02
/03
0
A
rson
420.7
4%05
/10
150.3
8%06
/09
110.3
3%02
/09
680.5
3%05
/07
B
urgl
ary95
316
.81%
04/1
159
415
.05%
04/0
360
818
.30%
03/0
32,1
5516
.65%
04/0
3
For
gery
/Frau
d21
53.7
9%02
/09
321
8.13%
02/0
114
44.3
3%01
/07
680
5.26%
02/0
2
Larc
eny/T
heft
458
8.08%
03/1
044
111
.17%
02/1
050
215
.11%
02/0
61,4
0110
.83%
03/0
1
Rob
bery
Aggr
avate
d Rob
bery
683
12.05
%07
/08
271
6.87%
08/0
836
1.08%
03/0
899
07.6
5%08
/01
All O
ther
Rob
bery
260
4.59%
06/0
013
33.3
7%05
/10
194
5.84%
04/0
858
74.5
4%05
/07
D
rug O
ffens
es
Co
cain
e 97
517
.20%
05/0
261
315
.53%
05/0
759
617
.94%
04/1
02,1
8416
.88%
05/0
2
Ot
her D
rug O
ffens
es36
46.4
2%03
/05
446
11.30
%01
/11
215
6.47%
02/0
910
257.9
2%02
/08
V
ehicu
lar
Vehi
cular
Hom
icide
/DUI
490.8
6%06
/00
180.4
6%06
/01
60.1
8%07
/07
730.5
6%06
/02
All O
ther
Veh
icular
470.8
3%02
/01
912.3
1%01
/05
290.8
7%00
/11
167
1.29%
01/0
7
C
/S/F
Per
son
320.5
6%07
/02
120.3
0%06
/09
60.1
8%04
/07
500.3
9%06
/09
C
/S/F
Pro
perty
310.5
5%05
/01
340.8
6%02
/04
501.5
0%02
/04
115
0.89%
03/0
2
C/S
/F S
ociet
al/Dr
ugs
430.7
6%03
/11
461.1
7%03
/09
712.1
4%03
/04
160
1.24%
03/0
8
Esc
ape
90.1
6%03
/00
110.2
8%04
/03
20.0
6%00
/02
220.1
7%03
/04
A
ll Ot
her
265
4.67%
02/0
838
39.7
0%01
/09
256
7.70%
01/0
590
46.9
9%01
/11
TOTA
L5,6
7010
0%05
/09
3,947
100%
04/1
03,3
2310
0%03
/03
12,94
010
0%04
/06
PERSON PROPERTY SOCIETAL OTHER
TDOC
INH
OUS
ETD
OC
BACK
UPLO
CALL
Y SE
NTEN
CED
SYST
EMW
IDE

DIRECTORY
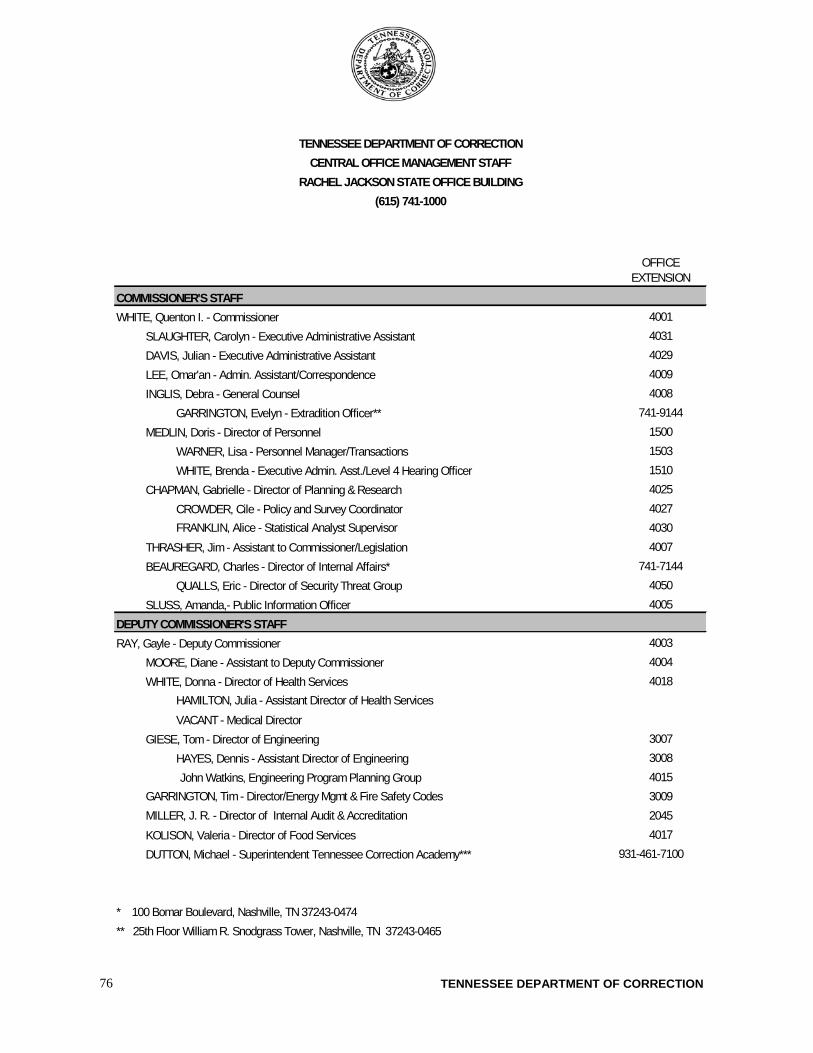
TENNESSEE DEPARTMENT OF CORRECTION
76
OFFICE EXTENSION
40014031402940094008
741-914415001503151040254027
FRANKLIN, Alice - Statistical Analyst Supervisor 40304007
741-714440504005
400340044018
HAMILTON, Julia - Assistant Director of Health Services
300730084015
GARRINGTON, Tim - Director/Energy Mgmt & Fire Safety Codes 3009MILLER, J. R. - Director of Internal Audit & Accreditation 2045
4017931-461-7100
MEDLIN, Doris - Director of Personnel
GIESE, Tom - Director of EngineeringHAYES, Dennis - Assistant Director of Engineering
DUTTON, Michael - Superintendent Tennessee Correction Academy***
WARNER, Lisa - Personnel Manager/TransactionsWHITE, Brenda - Executive Admin. Asst./Level 4 Hearing Officer
BEAUREGARD, Charles - Director of Internal Affairs*
CHAPMAN, Gabrielle - Director of Planning & Research
THRASHER, Jim - Assistant to Commissioner/Legislation
CROWDER, Cile - Policy and Survey Coordinator
SLAUGHTER, Carolyn - Executive Administrative AssistantDAVIS, Julian - Executive Administrative Assistant
COMMISSIONER'S STAFF
LEE, Omar'an - Admin. Assistant/Correspondence
TENNESSEE DEPARTMENT OF CORRECTIONCENTRAL OFFICE MANAGEMENT STAFF
RACHEL JACKSON STATE OFFICE BUILDING
RAY, Gayle - Deputy Commissioner
INGLIS, Debra - General CounselGARRINGTON, Evelyn - Extradition Officer**
DEPUTY COMMISSIONER'S STAFFSLUSS, Amanda,- Public Information Officer
(615) 741-1000
WHITE, Quenton I. - Commissioner
QUALLS, Eric - Director of Security Threat Group
MOORE, Diane - Assistant to Deputy Commissioner
KOLISON, Valeria - Director of Food Services
WHITE, Donna - Director of Health Services
VACANT - Medical Director
** 25th Floor William R. Snodgrass Tower, Nashville, TN 37243-0465
John Watkins, Engineering Program Planning Group
* 100 Bomar Boulevard, Nashville, TN 37243-0474
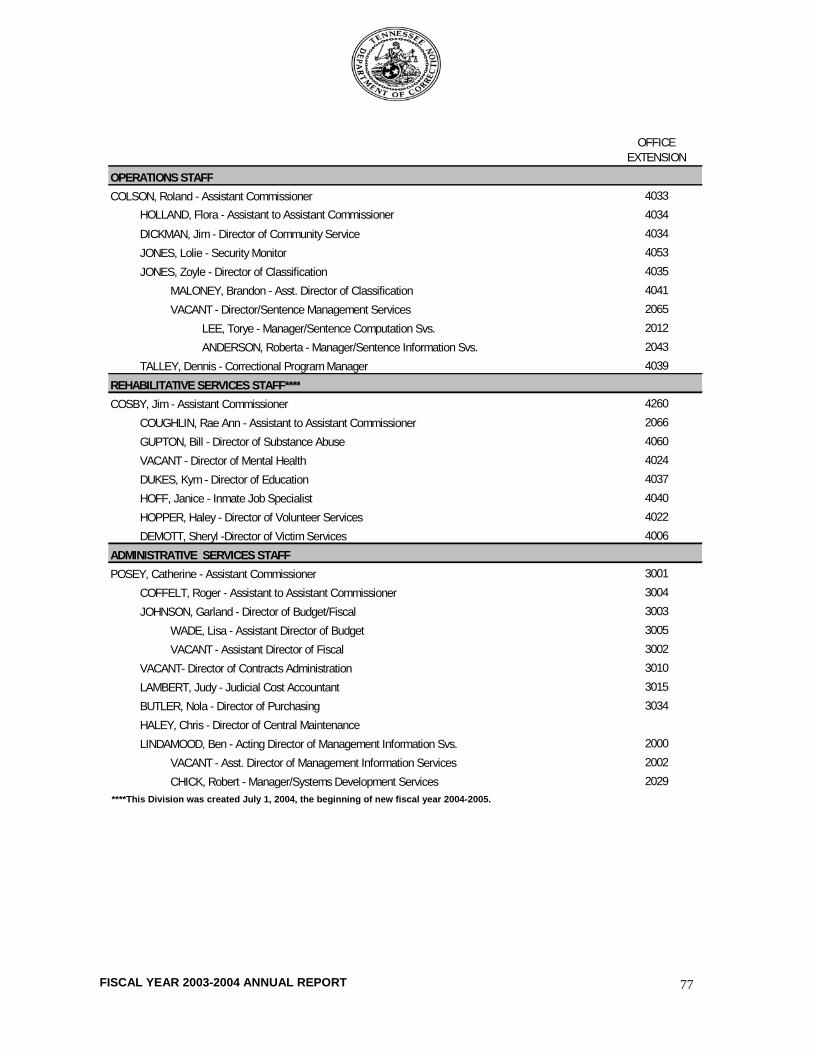
FISCAL YEAR 2003-2004 ANNUAL REPORT
77
OFFICE EXTENSION
4033HOLLAND, Flora - Assistant to Assistant Commissioner 4034
40344053403540412065201220434039
42602066406040244037404040224006
30013004300330053002301030153034
200020022029
ADMINISTRATIVE SERVICES STAFF
JONES, Zoyle - Director of Classification
VACANT - Director of Mental Health
HOFF, Janice - Inmate Job SpecialistHOPPER, Haley - Director of Volunteer Services
COUGHLIN, Rae Ann - Assistant to Assistant Commissioner
WADE, Lisa - Assistant Director of BudgetVACANT - Assistant Director of Fiscal
POSEY, Catherine - Assistant Commissioner
MALONEY, Brandon - Asst. Director of ClassificationVACANT - Director/Sentence Management Services
LEE, Torye - Manager/Sentence Computation Svs.ANDERSON, Roberta - Manager/Sentence Information Svs.
DEMOTT, Sheryl -Director of Victim Services
GUPTON, Bill - Director of Substance Abuse
VACANT- Director of Contracts AdministrationLAMBERT, Judy - Judicial Cost AccountantBUTLER, Nola - Director of Purchasing
JOHNSON, Garland - Director of Budget/FiscalCOFFELT, Roger - Assistant to Assistant Commissioner
DUKES, Kym - Director of Education
VACANT - Asst. Director of Management Information Services
HALEY, Chris - Director of Central MaintenanceLINDAMOOD, Ben - Acting Director of Management Information Svs.
CHICK, Robert - Manager/Systems Development Services
OPERATIONS STAFF
JONES, Lolie - Security Monitor DICKMAN, Jim - Director of Community Service
COLSON, Roland - Assistant Commissioner
REHABILITATIVE SERVICES STAFF****COSBY, Jim - Assistant Commissioner
TALLEY, Dennis - Correctional Program Manager
****This Division was created July 1, 2004, the beginning of new fiscal year 2004-2005.

TENNESSEE DEPARTMENT OF CORRECTION
78
Institutions Brushy Mountain Correctional Complex (423) 324-4011 Jack Morgan, Warden P. O. Box 1000, Petros, TN 37845 Lois M. DeBerry Special Needs Facility (615) 350-2700 Robert Waller, Warden 7575 Cockrill Bend Industrial Road, Nashville, TN 37243-1057 Hardeman County Correctional Facility* (901) 231-0465 Glenn Turner, Warden P. O. Box 549, Whiteville, TN 38075 *Note: This is a county facility operated by Corrections Corporation of America and contracted by TDOC to house state inmates. Mark H. Luttrell Correctional Center (901) 372-2080 Reuben Hodge, Warden 6000 State Road, Memphis, TN 38134 Middle Tennessee Correctional Complex (615) 350-3361 Ken Locke, Acting Warden 7177 Cockrill Bend Industrial Boulevard, Nashville, TN 37243-0470 Northeast Correctional Complex (423) 727-7387 Howard Carlton, Warden P.O. Box 5000, Mountain City, TN 37683-5000 Northwest Correctional Complex (901) 253-5000 Tony Parker, Warden Route 1, Box 660, Tiptonville, TN 38079 Riverbend Maximum Security Institution (615) 350-3100 Ricky J. Bell, Warden 7475 Cockrill Bend Industrial Boulevard, Nashville, TN 37243-0471 South Central Correctional Facility* (931) 676-5372 Kevin Myers, Warden P. O. Box 279, Clifton, TN 38425-0279 *Note: This is a county facility operated by Corrections Corporation of America and contracted by TDOC to house state inmates. Southeastern Tennessee State Regional Correctional Facility (423) 881-3251 Virginia Lewis, Warden Route 4, Box 600, Pikeville, TN 37367
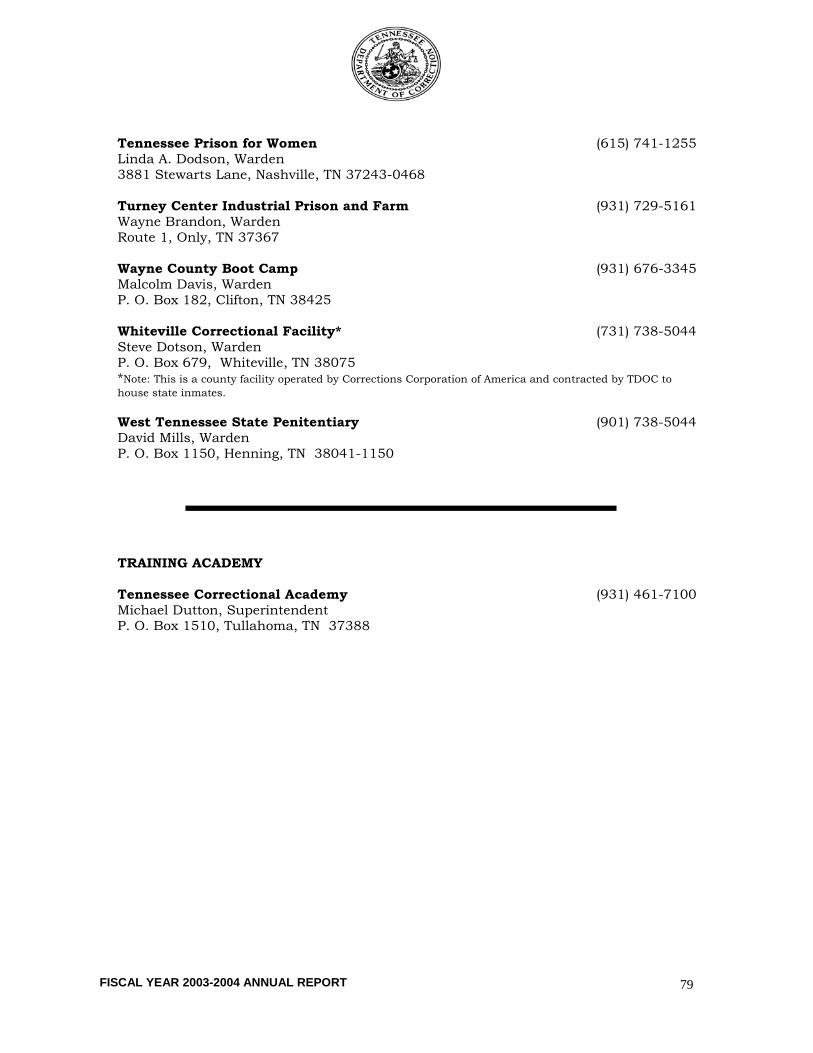
FISCAL YEAR 2003-2004 ANNUAL REPORT
79
Tennessee Prison for Women (615) 741-1255 Linda A. Dodson, Warden 3881 Stewarts Lane, Nashville, TN 37243-0468 Turney Center Industrial Prison and Farm (931) 729-5161 Wayne Brandon, Warden Route 1, Only, TN 37367 Wayne County Boot Camp (931) 676-3345 Malcolm Davis, Warden P. O. Box 182, Clifton, TN 38425 Whiteville Correctional Facility* (731) 738-5044 Steve Dotson, Warden P. O. Box 679, Whiteville, TN 38075 *Note: This is a county facility operated by Corrections Corporation of America and contracted by TDOC to house state inmates. West Tennessee State Penitentiary (901) 738-5044 David Mills, Warden P. O. Box 1150, Henning, TN 38041-1150 TRAINING ACADEMY Tennessee Correctional Academy (931) 461-7100 Michael Dutton, Superintendent P. O. Box 1510, Tullahoma, TN 37388

PUBLICATIONS
RESEARCH BRIEFS
&

FISCAL YEAR 2003-2004 ANNUAL REPORT
81
RESEARCH BRIEFS AND PUBLICATIONS
PUBLICATIONS AVAILABLE ON THE INTERNET TDOC Annual Reports Fiscal Years 1998-2004 TDOC Annual Felon Population Projection Report 2002-2003 Monthly Felon Population Projection Reports (Blue Report)* Monthly Female Felon Reports* Monthly TDOC Bed Space and Operating Capacities Reports Monthly Jail Summaries*
*All monthly reports will be maintained on the TDOC web site for one year. http://www.state.tn.us/correction/planning/planning.html
RESEARCH BRIEFS AVAILABLE ON THE INTERNET
Aging Prison Population in Tennessee Fact Sheet: A demographic examination of the population of older inmates, 50 years and over, in Tennessee. Drug Research Brief – New Commitments A brief examination of the new drug commitments to TDOC from 1997 to 2001. Drug Research Brief A felony population of admissions, releases, and the stock population of drug and alcohol violations for fiscal year 2002-2003. Impact of Incarceration on Children Discussion of national trends regarding mothers in prison. Overview of Juvenile Offenders Fact Sheet: A brief overview of the characteristics of juvenile felony offenders in the TDOC system. Tennessee Incident Based Reporting System (TIBRS) TIBRS provides a logical approach towards categorizing offense codes for in-mates incarcerated in the TDOC. TDOC Release Trends and Failure Rates
The release trends and failure rates of all incarcerated felons released between 1993 and 1999 (i.e., probation, expiration and parole and prison versus jail).

TENNESSEE DEPARTMENT OF CORRECTION
82
RESEARCH BRIEFS AND PUBLICATIONS
PUBLICATIONS AVAILABLE IN THE PLANNING AND RESEARCH SECTION LIBRARY
TDOC Annual Reports 1900 – 2004 Felon Inmate Population Projections 1987 – 2002 Profile of Sex Offenders and Victims December 1991 Death Row January 1992 Life-Sentenced Inmates February 1992 Changes in Total Correctional Population – Update February 1992 Changes in Total Correctional Population – Update March 1993 Commitments to Incarceration by Offense Type Fiscal Years 1986-87 through 1991-92 – Update March 1993 Death Row – Update October 1993 Felony Inmate Population Projections January 1994 Drugs and Crime: An Overview of the TDOC Substance Abuse Program and Inmate Participation May 1994 The Children and Families of Incarcerated Felons: A Status Report and Demographic Inquiry April 1996 Wayne County Boot Camp – An Update of Offender Performance in the Program March 1996 TDOC: Departmental Strategic Plan 1997 – 2004 Annual Institutional Incident Reports 1997 – 2004 Offender Pre-Release and Parole Transition Programs July 1999 Prison Facility Deign, Renovation, and Construction Guideline March 2001 Measure Validation: Risk Assessment Scale (with TBI) August 2001 Title VI: A Statistical Review 2001-2004 Title VI: Parity Report July 2002 TDOC: Inmate Rules and Regulations (updated annually) June 2002

Note to Recipients of the Tennessee Department of Correction Annual Report
Planning and Research has recently made the annual report and all other monthly, quarterly, and annually published reports available through the correction web-site.
Please visit the TDOC web-site from time to time for updates:
http://www.state.tn.us/correction/planning/planning.html Should you wish to remain on the mailing list for the hard copy of any of these reports, please send an email to [email protected] or call 615/741-1000 ext. 4026, specifying the report.
Department of Correction, Publication Authorization Number 329139, October 2004, 250 copies. This public document was promulgated at a cost of $_____ per copy.