the tbi case studies: rc core wall and rc dual...
TRANSCRIPT

PEER TBI SEAONC Seminar April 21, 2011
Tuna, Yang, Wallace 1
The TBI Case Studies:RC Core Wall and RC Dual Systemy
Zeynep Tuna, John WallaceUniversity of California, Los Angeles
Tony YangUniversity of British Columbia, Vancouver
PBEE and Its Application to Tall Building Design – San Francisco – April 19 & 21, 1011
Case Study Buildings
42-story RCCore Wall
42-story RCDual System
40-story Steel SM Frame
2
PEER TBI SEAONC Seminar April 21, 2011
Tuna, Yang, Wallace 2
Today’s Discussion – Analysis
Overview, Ground Motions, DesignModeling
Detailed overview
Core wall/Dual System analysis resultsDrift ratiosCore wall shear stresses and axial strainsCoupling beam rotations
Dual System moment frame resultsBeam and Column plastic rotation demandsColumn axial load demands
Summary3
Overall Approach
Create 3D building models [Perform 3D]Uniform modeling approach
Subject models to 5 levels of ground shaking intensity [horizontal ground acceleration]:
SLE25 - Serviceability with a probability of 70%/30 yr
SLE43 - Serviceability with a probability of 50%/30 yr
DBE - Life-Safety with a probability of 10%/50 years
MCE - Maximum Considered Earthquake with a
probability of 2%/50 years
OVE - Higher intensity than MCE with a probability of
1%/50 years4

PEER TBI SEAONC Seminar April 21, 2011
Tuna, Yang, Wallace 3
Overall Approach
Each building analyzed for each hazard level:
5 Levels @ 15 GMs
Engineering Demand Parameters (EDPs):
Drift, Rotation, Strain, ,
Fragility Relations
5
Modeling – Global Considerations
3-D nonlinear models
Perform 3D [practice oriented program]Perform 3D [practice oriented program]
Lateral force resisting system only
Soil-structure interaction is neglected
P-Delta effects are included
2.5% viscous Rayleigh damping0.2T1 & 1.5T1
6

PEER TBI SEAONC Seminar April 21, 2011
Tuna, Yang, Wallace 4
Modeling – Uniform Approach
Core Wall modelingFlexure and axial loads
U i i l fib d l ( t i l l ti )Uniaxial fiber models (material relations)Flexural yielding, followed by shear failure
ShearBackbone relations (linear flexure, nonlinear shear)
Coupling beamsShear displacement hinges (backbone)p g ( )
Dual systemBeam and column plastic hinges
Linear elements (stiffness)Podium level slabs, basement walls
7
RC Core Wall/RC Dual SystemMODELING DETAILS
8

PEER TBI SEAONC Seminar April 21, 2011
Tuna, Yang, Wallace 5
Modeling – Core Wall (Concrete)
Concrete stress-strain relationship (Mander et al., 1988)
A: (0.6fcc/Ec, 0.6fcc)
B: (0.75εcc, fcc)
C: (1.25εcc, fcc)8
12
16
oncr
ete
Stre
ss (k
si)
C
A
B
D
f’c,exp =1.3*f’c(NOWAK &
SZERSZEN)
D: (0.024, 0.6fcc)
0 0.005 0.01 0.015 0.02 0.025Concrete Strain (in/in)
0
4
Co
f’c = 10 ksi1.3f’c = 13 ksi
9
Modeling – Core Wall (Rebar)
Steel stress-strain relationshipA706 steel 100A706 steel
fy= 1.17(60) = 70 ksi
fu= 105 ksi
Post-yield stiffness
and cyclic degradation
b O akcal et al (2006)
-0.12 -0.08 -0.04 0 0.04 0.08 0.12
-50
0
50
100
Ste
el S
tress
(ksi
)
fy,exp=1.17*fy
(MIRZA et al.)
by Orakcal et al. (2006)
Steel Strain (in/in)
-100
10

PEER TBI SEAONC Seminar April 21, 2011
Tuna, Yang, Wallace 6
Modeling – Core Wall Shear
Shear stress-strain relationship
( )1 5 1 5 ' ACI 318-08 §21 9 4 1v v f fα ρ= = +
0.5
1
1.5
Shea
r Stre
ss (V
ult/V
n)
( )exp
'
'
'
'
1.5 1.5 ACI 318 08 §21.9.4.1
6000 psi57,000 psi
> 6000 psi40 000 1 0 6 i
n c c t y
c
c c
c
v v f f
fE f
fE f E
α ρ+
≤
=
0 0.004 0.008 0.012 0.01
Shear Strain (in/in)
0
S40,000 1.0 6 psiACI Committee 363
0.2
c c
c c
E f E
G E
= +
=
11
Modeling – Core Wall (Flexure-shear)
Test results
12
PEER TBI SEAONC Seminar April 21, 2011
Tuna, Yang, Wallace 7
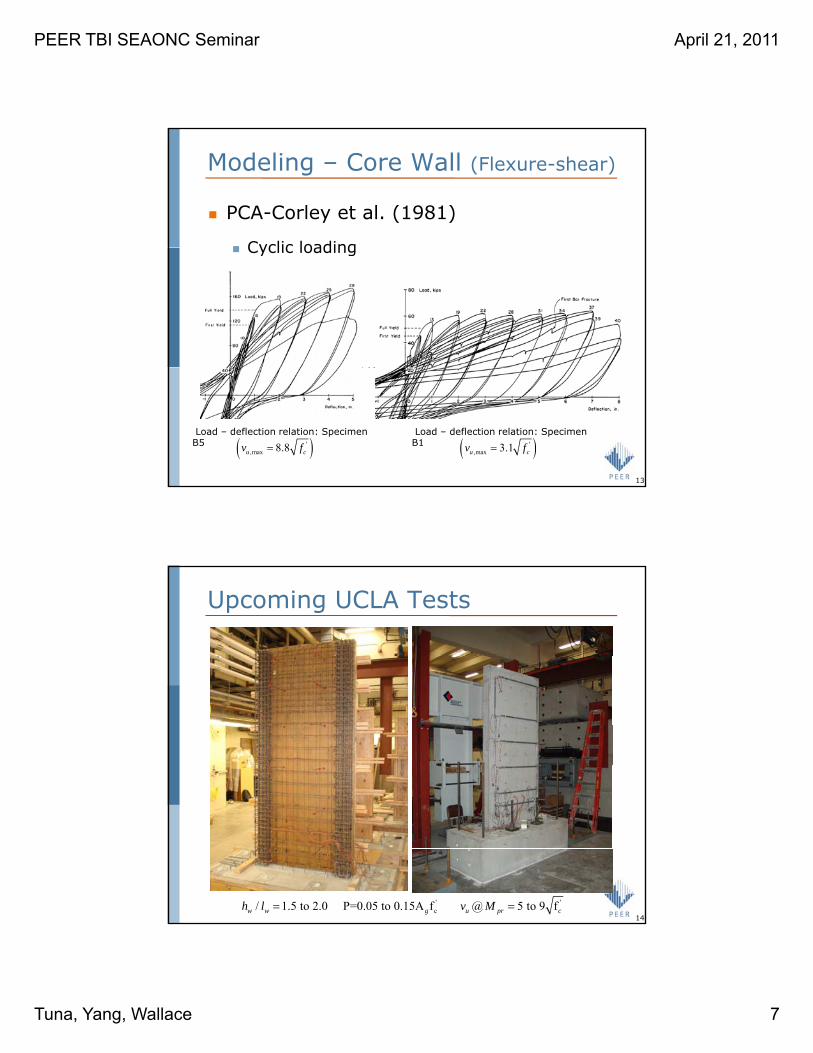
Modeling – Core Wall (Flexure-shear)
PCA-Corley et al. (1981)
Cyclic loadingCyclic loading
Axial loads vary from 0.0 to 0.13Agf’c
2 types of cross-sections with different
aspect ratios: barbelled: h/l=3.5
and flanged: h/l 2 7and flanged: h/l=2.7
Load – deflection relation: Specimen B5 ( )'
,max 8.8u cv f=Load – deflection relation: Specimen B1 ( )'
,max 3.1u cv f=
13
Upcoming UCLA Tests
' 'c/ 1.5 to 2.0 P=0.05 to 0.15A f @ 5 to 9 fw w g u pr ch l v M= =
14

PEER TBI SEAONC Seminar April 21, 2011
Tuna, Yang, Wallace 8
Modeling – Coupling BeamsElastic beam elements + Nonlinear displacement shear hinge
Relative Displacement [in]
Shear displacement hinge
θ
V/Vy
Beam Effective Stiffness
0
100
200
Lat
eral
Loa
d [
k]
-4.32 -2.16 0 2.16 4.32p
ln/h = 2.4TestShear hinge model
-0.12 -0.06 0 0.06 0.12Rotation [radians]
-200
-100
(Naish et al.)
EIeff=0.2*EIg
MElastic beam
θ
15
Modeling – Coupling BeamsElastic beam elements + Nonlinear displacement shear hinge
Relative Displacement [in]Vyexp=Expected yield shear strength (2*As*fyexp*sin(α)
Shear displacement hinge
θ
V/Vy
Beam Effective Stiffness
0
100
200
Lat
eral
Loa
d [
k]
-4.32 -2.16 0 2.16 4.32p
ln/h = 2.4TestShear hinge model
p p
Vuexp=Expected ultimate shear strength (1.33*Vyexp)
Vrexp= Expected residual strength (0.25*Vuexp)
-0.12 -0.06 0 0.06 0.12Rotation [radians]
-200
-100
(Naish et al.)
EIeff=0.2*EIg
MElastic beam
θ
16

PEER TBI SEAONC Seminar April 21, 2011
Tuna, Yang, Wallace 9
Modeling – SMF Beam
n mnRigid
dRigid
d
Nonlinear Rotation Hinges
Col
umn
Col
um
M
EIeff=0.35*EIg
M
end zone end zone
θ
Beam Effective Stiffness
θ
Moment Strength
17
Modeling – SMF Beam
Myexp=Expected nominal moment capacity Muexp= Expected nominal ultimate capacity (1.18*Myexp )θy=Maximum elastic rotationθy=Maximum elastic rotationθu=Ultimate rotation observed in test (0.046 rad)
18

PEER TBI SEAONC Seminar April 21, 2011
Tuna, Yang, Wallace 10
Modeling – SMF Column
P
BeamRigid end zone
EIeff=0.7*EIg
M
θ
MMoment Strength
Nonlinear Rotation Hinges
Column Effective Stiffness Axial
Force
BeamRigid end zone
19
Modeling – Basement Walls
Basement walls below grade were modeled using elastic shear wall elements (Eeff = 0.8Ec)
20

PEER TBI SEAONC Seminar April 21, 2011
Tuna, Yang, Wallace 11
Modeling – Podium Level Slabs
Slabs below grade were modeled using elastic shear shell element (Eeff = 0.25Ec)
21
RESULTS
Core Wall: Core Wall & Dual SystemDrift ratios Wall shear force/stressWall Base tension/compressive strainsCoupling beam rotations
RC Moment Frame: Dual SystemB l ti t tiBeam plastic rotationsColumn axial loadColumn plastic rotations
22

PEER TBI SEAONC Seminar April 21, 2011
Tuna, Yang, Wallace 12
RC Core WallRESULTS
23
Core Wall – Design Summary1A: Code 1B: PBEE 1C: PBEE+
Wall: Strong Stronger Strongest
Coupling beam:
Stronger Stronger Strong
24” 24” 28” 28” 32” 32”
bea
1st mode Period:
T1X = 5.2 sec
T1Y = 4.0 sec
T1X = 4.8 sec
T1Y = 3.6 sec
T1X = 4.6 sec
T1Y = 3.5 sec
24

PEER TBI SEAONC Seminar April 21, 2011
Tuna, Yang, Wallace 13
Core Wall – Drift (%)
Inter-story Drifts – Building I40
Building 1A - MCE
40
Building 1B - MCE
40
Building 1C - MCE
15
20
25
30
35
loor
num
ber [
-]
15
20
25
30
35
15
20
25
30
35
0 1 2 3 4 5
0
5
10
Fl
Drift (%)0 1 2 3 4
0
5
10
Drift (%)0 1 2 3 4
0
5
10
Drift (%)
meanmean + stdindividual record
μ = 2.5%μ+σ=3.33%
μ = 2.4%μ+σ= 3.0%
μ = 2.25%μ+σ= 2.75%
Core Wall - Wall Shear Stress
40
Building 1A - MCE
40
Building 1B - MCE
40
Building 1C - MCE
meanmean + std
1A: Code 1B: PBEE PBEE+
15
20
25
30
35
Floo
r num
ber [
-]
15
20
25
30
35
Floo
r num
ber [
-]
15
20
25
30
35
Floo
r num
ber [
-]
mean std8sqrt(fc)individual record
0 0.5 1
0
5
10
F
Stress (ksi)0 0.5 1
0
5
10
F
Stress (ksi)0 0.5 1
0
5
10
F
Stress (ksi)

PEER TBI SEAONC Seminar April 21, 2011
Tuna, Yang, Wallace 14
Core Wall – Wall Strains εc
L38 L38 L38
1A: Code 1B: PBEE 1C: PBEE+
L3L8
L13L18L23L28L33L38
Floo
r num
ber [
-]
L3L8
L13L18L23L28L33L38
Floo
r num
ber [
-]
L3L8
L13L18L23L28L33L38
Floo
r num
ber [
-]
-2.5 -2 -1.5 -1 -0.5 0x 10
-3
B3L3
Wall edge strain - South west corner [in./in.]
-2.5 -2 -1.5 -1 -0.5 0x 10
-3
B3L3
Wall edge strain - South west corner [in./in.]
-2.5 -2 -1.5 -1 -0.5 0x 10
-3
B3L3
Wall edge strain - South west corner [in./in.]
Wall concrete compressive strain x 2; Wallace, SDTB (2007)PEER/ATC -72 Report: Modeling & Acceptance Criteria
εc = 0.0014/0.002 εc = 0.0013/0.0016 εc = 0.0012/0.0014
27
L38
L43
PEERTBI-1AM
MCE
L38
L43
PEERTBI-1BM
MCE
L38
L43
PEERTBI-1CM
MCE
Core Wall – Wall Strains εt1A: Code 1B: PBEE 1C: PBEE+
Yield Yield Yield
L13
L18
L23
L28
L33
L38
Flo
or n
umbe
r [-]
L13
L18
L23
L28
L33
L38
Flo
or n
umbe
r [-]
L13
L18
L23
L28
L33
L38
Flo
or n
umbe
r [-]
28
0 0.5 1 1.5 2B3
L3
L8
WallStrain01 [%]
0 0.5 1 1.5 2B3
L3
L8
WallStrain01 [%]
0 0.5 1 1.5 2B3
L3
L8
WallStrain01 [%]
εt,max = 0.02 εt,max = 0.01 εt,max = 0.004

PEER TBI SEAONC Seminar April 21, 2011
Tuna, Yang, Wallace 15
Core Wall – Wall Reinforcement
29
Core Wall – CB Rotations θcb
L37L42
Building 1A - MCE
meanmean + std L37
L42
Building 1B - MCE
L37L42
Building 1C - MCE1A: Code 1B: PBEE 1C: PBEE+
0 0.02 0.04 0.06 0.08L2L7
L12L17L22L27L32L37
Floo
r num
ber [
-]
individual record
0 0.02 0.04 0.06 0.08L2L7
L12L17L22L27L32L37
Floo
r num
ber [
-]
0 0.02 0.04 0.06 0.08L2L7
L12L17L22L27L32L37
Floo
r num
ber [
-]
Coupling beam plastic rotation - South wall [radian] Coupling beam plastic rotation - South wall [radian] Coupling beam plastic rotation - South wall [radian]
Coupling beam plastic rotations
θcb = 0.008/0.013 θcb = 0.009/0.017 θcb = 0.028/0.043
30

PEER TBI SEAONC Seminar April 21, 2011
Tuna, Yang, Wallace 16
RC Dual SystemCORE WALL RESULTS
31
Core Wall Building Design2A: Code 2B/2C: PBEE/PBEE+
Columns Walls Columns Walls
Wall: Strong Stronger
24” 24” 28” 28”
Column: Strong Stronger
36”x36” 46”x46”
Coupling beam:
Stronger Strong
1st mode Period:
T1X = 4.28 secT1Y = 3.88 sec
T1X = 4.46 secT1Y = 4.03 sec
Column: Strong Stronger
32

PEER TBI SEAONC Seminar April 21, 2011
Tuna, Yang, Wallace 17
Dual System – Drift (%)
Inter-story Drifts – Building II
35
40
Building 2A - MCE
35
40
Building 2B - MCE2A: Code 2B/2C: PBEE
15
20
25
30
35
Floo
r num
ber [
-]
15
20
25
30
35
0 0.5 1 1.5 2 2.5
0
5
10
F
Drift (%)0 0.5 1 1.5 2 2.5
0
5
10
Drift (%)
μ = 1.6%μ+σ= 2.0%
μ = 1.55%μ+σ= 2.05%
Dual System - Wall Shear vn
35
40
Building 2A - MCE
35
40
Building 2B - MCE
meanmean + std8sqrt(fc)
'1.5 8 cVn f≈
15
20
25
30
35
Floo
r num
ber [
-]
15
20
25
30
35
Floo
r num
ber [
-]
individual record
0 0.2 0.4 0.6 0.8 1
0
5
10
Stress (ksi)0 0.2 0.4 0.6 0.8 1
0
5
10
Stress (ksi)

PEER TBI SEAONC Seminar April 21, 2011
Tuna, Yang, Wallace 18
Dual System - Wall Shear vn
40
MCE40
OVE
2A: Code
10
20
30
10
20
30
'1 5 8Vn f≈
2A: Code
2B/2C: PBEE
0 0.4 0.8Stress (ksi)
0
10
0 0.4 0.8Stress (ksi)
0
10 1.5 8 cVn f≈
2A/CodeShear FailureOVE (1%/50yr)
Dual System – Wall Shear vn
Building 2A –Failure modes
Δz3
Elevation view
1.5South Long Walls
0.5
1
1.5
Shea
r Stre
ss (V
ult/V
n)
z1 z3(1-3)
( - )=Hw
ε Δ Δ
z2 z4(2-4)
( - )=Hw
ε Δ ΔHw
Lw
Δz4
Δz2Δz1
0 0025
0.5
1
hear
stre
ss ra
tio V
/Vn,
AC
I
Failure Envelope1st floor2nd floor3rd floor4th floor5th floor6th floor
(OVE#10)Calculations
0 0.004 0.008 0.012 0.016
Shear Strain (in/in)
0 (1-3) (2-4)-curvature =
Lwε ε
φ0.0025yield curvature
Lwφ ≈y
curvature ductility =y
φφ
0 1 2 3 4 5 6 7 8 9 100
Curvature Ductility
Sh
PEER TBI SEAONC Seminar April 21, 2011
Tuna, Yang, Wallace 19
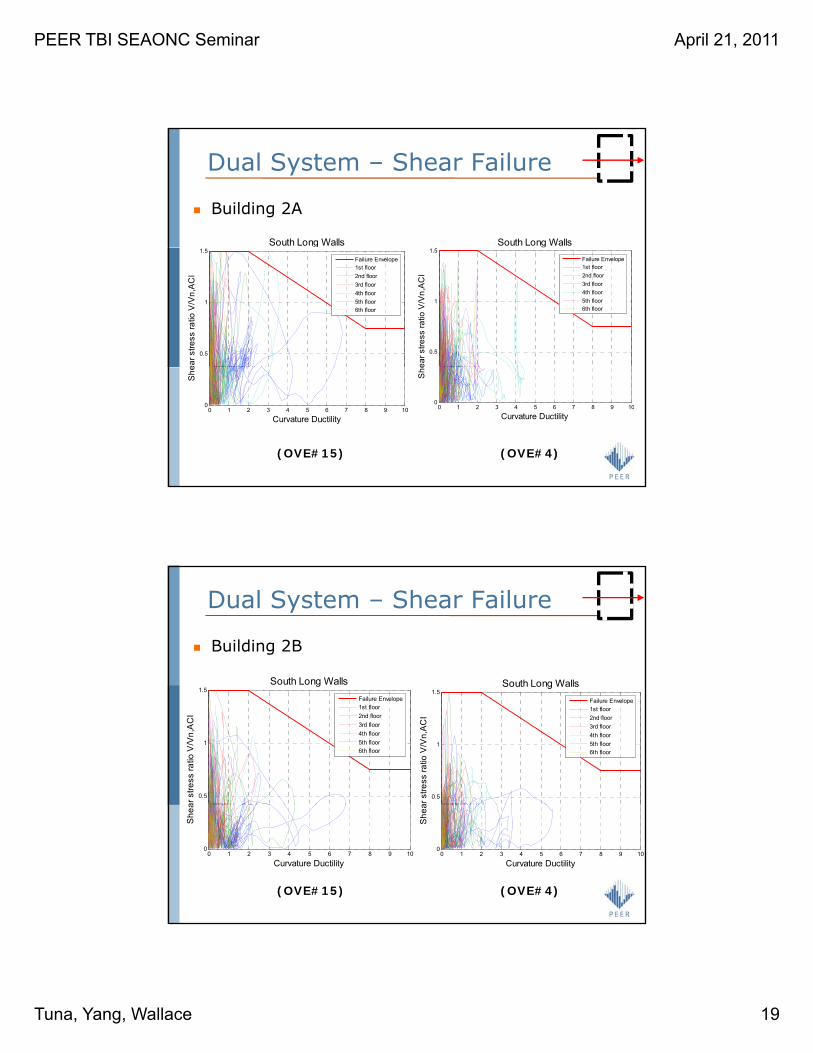
Dual System – Shear Failure
Building 2A
South Long Walls South Long Walls
0.5
1
1.5g
ear s
tress
ratio
V/V
n,A
CI
Failure Envelope1st floor2nd floor3rd floor4th floor5th floor6th floor
0.5
1
1.5
ear s
tress
ratio
V/V
n,A
CI
Failure Envelope1st floor2nd floor3rd floor4th floor5th floor6th floor
(OVE#15) (OVE#4)
0 1 2 3 4 5 6 7 8 9 100
Curvature Ductility
She
0 1 2 3 4 5 6 7 8 9 100
Curvature DuctilityS
he
Dual System – Shear Failure
Building 2B
South Long Walls South Long Walls
0.5
1
1.5g
ar s
tress
ratio
V/V
n,A
CI
Failure Envelope1st floor2nd floor3rd floor4th floor5th floor6th floor
0.5
1
1.5South Long Walls
ar s
tress
ratio
V/V
n,A
CI
Failure Envelope1st floor2nd floor3rd floor4th floor5th floor6th floor
(OVE#15) (OVE#4)
0 1 2 3 4 5 6 7 8 9 100
Curvature Ductility
She
a
0 1 2 3 4 5 6 7 8 9 100
Curvature Ductility
She
a

PEER TBI SEAONC Seminar April 21, 2011
Tuna, Yang, Wallace 20
Dual System – Wall Strains εc
Core Wall Strains – Building II
35
40
Building 2A - MCE
35
40
Building 2B - MCE2A: Code 2B/2C: PBEE
20
25
30
35
Floo
r num
ber
20
25
30
35
Floo
r num
ber
εc = 0.0008/0.0011εc = 0.0012/0.0016
x2
39
-2.5 -2 -1.5 -1 -0.5 0x 10-3
5
10
15
South west corner [in./in.]-2 -1.5 -1 -0.5 0
x 10-3
5
10
15
South west corner [in./in.]
εc = 0.0012/0.0015εc = 0.0018/0.0023
40
45Building 2A - MCE
40
45Building 2B - MCE
Dual System – Wall Strains εt
Yield
2A: Code 2B/2C: PBEE
Yield
20
25
30
35
Floo
r num
ber [
-]
20
25
30
35
Floo
r num
ber [
-]
40
0 0.005 0.01 0.015 0.020
5
10
15
South west corner [in./in.]0 0.005 0.01 0.015 0.02
0
5
10
15
South west corner [in./in.]

PEER TBI SEAONC Seminar April 21, 2011
Tuna, Yang, Wallace 21
Dual System – CB Rotations θcb
Coupling Beam Rotations – Building II40
Building 2A - MCE
meanmean + stdindividual record
40
Building 2B - MCE2A: Code 2B/2C: PBEE
20
25
30
35
Floo
r num
ber [
-]
20
25
30
35
Floo
r num
ber [
-]
θcb = 0.007/0.013θcb = 0.03/0.042
0 0.02 0.04 0.06 0.08
5
10
15
South wall [rad]
F
0 0.02 0.04 0.06 0.08
5
10
15
South wall [rad]
F
Dual System – Fragility Curves Damage State Definition of damage Repair procedures
Yield -Substantial change in stiffness of load-deformation plot none
DS1-Minor damage -Residual cracks greater than 1/16”Epoxy injection of cracks(200”-240” in length)
DS2-Major damage (I) -Residual cracks greater than 1/8”-Minor spalling of concrete
-Epoxy injection of cracks in beam(600”-720”) and slab (300”)-Replacement of spalled concrete
-Chip away damaged concreteA h h i l l
DS3-Major damage (II)-Significant strength degradation
(<0.8Vn)-Buckling/fracture of reinforcement-Crushing of concrete
-Attach mechanical couplers to remaining bars
-Replace damaged/fractured reinforcement
-Replace damaged concrete
Consistent with ATC-5842
PEER TBI SEAONC Seminar April 21, 2011
Tuna, Yang, Wallace 22
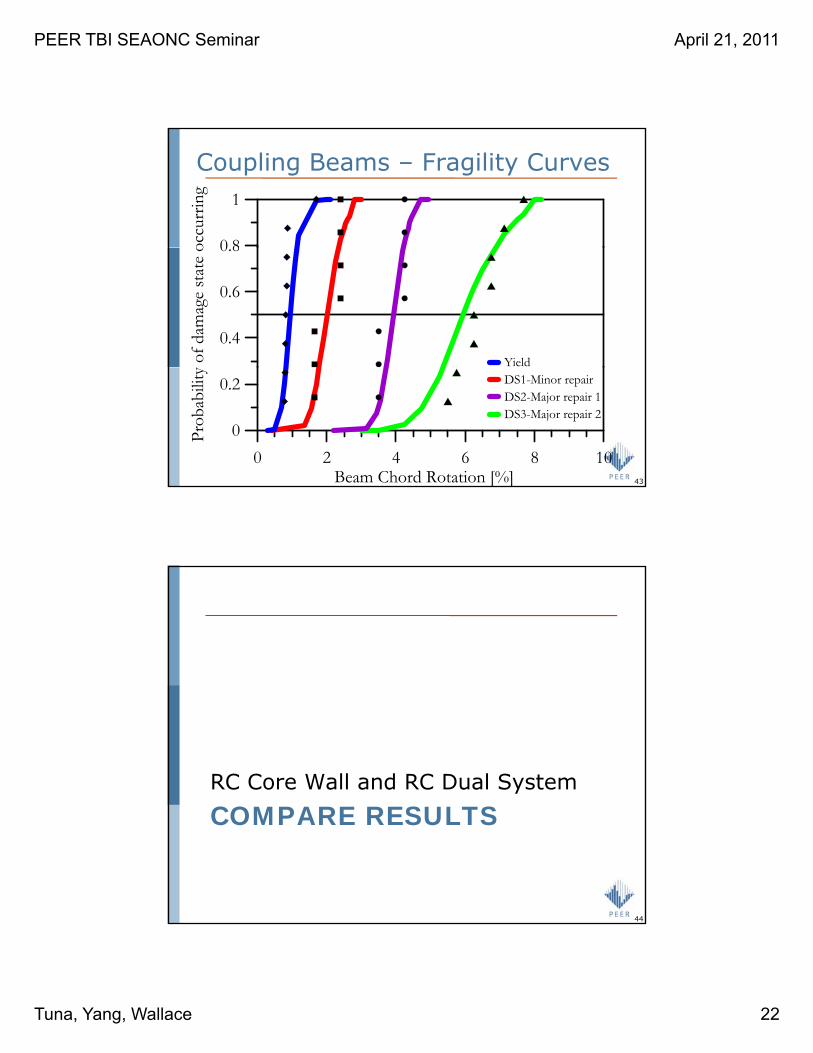
Coupling Beams – Fragility Curves
0 8
1oc
curr
ing
0.4
0.6
0.8
y of
dam
age
stat
e o
Yield
0 2 4 6 8 10Beam Chord Rotation [%]
0
0.2
Prob
abili
ty DS1-Minor repairDS2-Major repair 1DS3-Major repair 2
43
RC Core Wall and RC Dual System
COMPARE RESULTS
44

PEER TBI SEAONC Seminar April 21, 2011
Tuna, Yang, Wallace 23
Core Wall (I) vs Dual System (II)Story (mean) DriftEdit as you wish
40
OVE
40
MCE
40
DBE
40
SLE43
40
SLE25
1A CCore…
20
25
30
35
40
20
25
30
35
40
20
25
30
35
40
20
25
30
35
40
20
25
30
35
40
oor n
umbe
r
1A1B1C2A2B
CoreDual
Dual
45
0 2 4
0
5
10
15
Mean Drift (%)0 2 4
0
5
10
15
Mean Drift (%)0 2
0
5
10
15
Mean Drift (%)0 2
0
5
10
15
Mean Drift (%)0 2
0
5
10
15
Mean Drift (%)
Flo
Core Wall (1) vs Dual System (2)Coupling beam rotation demands
40
MCE
40
DBE
40
SLE43
40
SLE25
40
OVE
1A1B CoreCore
20
25
30
35
20
25
30
35
20
25
30
35
20
25
30
35
Floo
r num
ber
20
25
30
35
1B1C2A2B
DualDual
θcb = 0.028
460 0.03 0.06
0
5
10
15
Mean (rad)0 0.03 0.06
0
5
10
15
Mean (rad)0 0.03 0.06
0
5
10
15
Mean (rad)0 0.03 0.06
0
5
10
15
Mean (rad)
F
0 0.03 0.06
0
5
10
15
Mean (rad)
θcb 0.028θcb = 0.030

PEER TBI SEAONC Seminar April 21, 2011
Tuna, Yang, Wallace 24
Core Wall (1) vs Dual System (2)Core Wall Shear Stress Demands
35
40
OVE
35
40
MCE
35
40
DBE
35
40
SLE43
40
SLE25
1A1B1C2A
CoreDual
CoreDual
15
20
25
30
35
15
20
25
30
35
15
20
25
30
35
15
20
25
30
35
15
20
25
30
35
Floo
r num
ber
2A2B
47
0 1 2x 10⁴
0
5
10
0 1 2x 10⁴
0
5
10
0 1 2x 10⁴
0
5
10
0 1 2x 10⁴
0
5
10
0 1 2x 10⁴
0
5
10
Shear Force (k)
RC Dual System
SMF RESULTS
48
PEER TBI SEAONC Seminar April 21, 2011
Tuna, Yang, Wallace 25
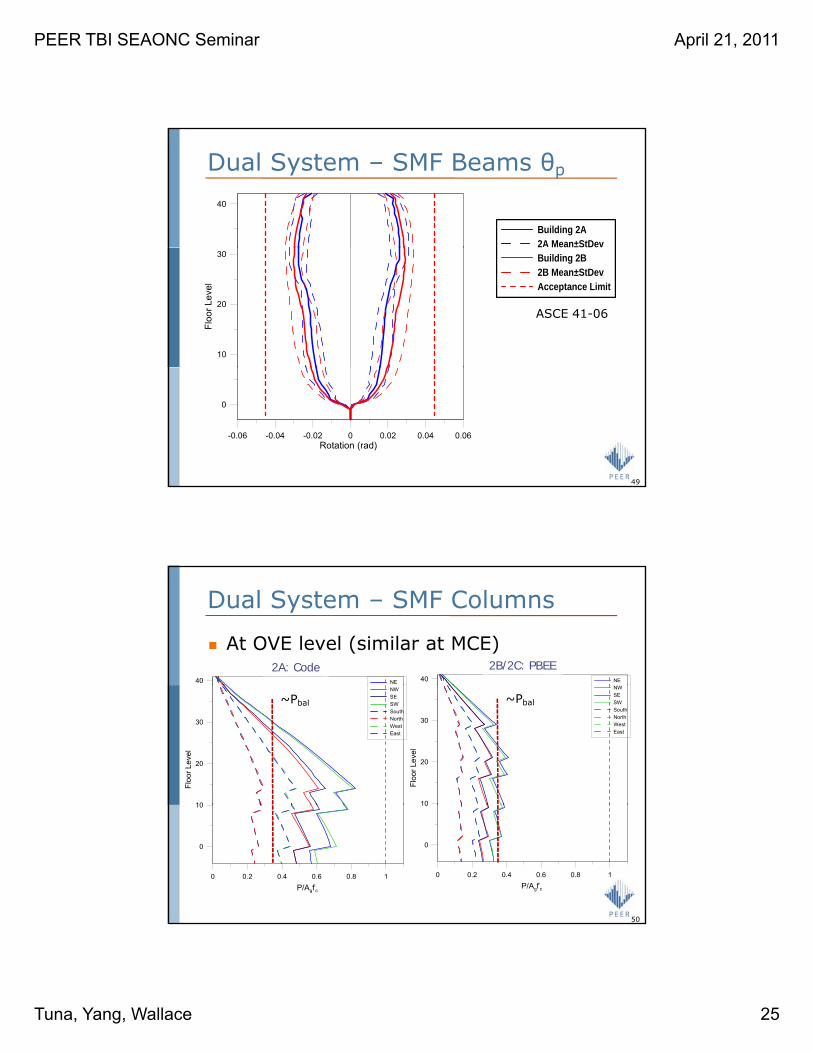
40
Building 2A2A Mean±StDev
Dual System – SMF Beams θp
10
20
30
Floo
r Lev
el
Building 2B2B Mean±StDevAcceptance Limit
ASCE 41-06
49
-0.06 -0.04 -0.02 0 0.02 0.04 0.06Rotation (rad)
0
Dual System – SMF Columns
40 NE
Building 2A40 NE
Building 2B
At OVE level (similar at MCE)2A: Code 2B/2C: PBEE
10
20
30
Floo
r Lev
el
NWSESWSouthNorthWestEast
10
20
30
Floo
r Lev
el
NWSESWSouthNorthWestEast
~Pbal ~Pbal
50
0 0.2 0.4 0.6 0.8 1P/Agf'c
0
10
0 0.2 0.4 0.6 0.8 1P/Agf'c
0
10

PEER TBI SEAONC Seminar April 21, 2011
Tuna, Yang, Wallace 26
Dual System – SMF Columns
At OVE level40 Building 2A-interior
Building 2A-exteriorP
20
30
Floo
r Lev
el
Building 2B-interiorBuilding 2B-exterior
~Pbal
51
0 0.2 0.4 0.6 0.8 1P/Agf'
c
0
10
P/Agf’c
Dual System – SMF Columns
Building 2A Code (OVE)
SW column (Ground floor) 14000SW column (15th floor)SW Column (ground Floor) SW Column (15th Floor)
4000
6000
8000
10000
12000
14000
xial
For
ce (k
ips)
P-MOVE#1OVE#11OVE#13
SW column (Ground floor)
4000
6000
8000
10000
12000
14000
Axi
al F
orce
(kip
s)
P-MOVE#1OVE#11OVE#13
52
0 1000 2000 3000 4000 5000 6000
Moment (k-ft)-4000
-2000
0
2000Ax
0 1000 2000 3000 4000 5000 6000
Moment (k-ft)-4000
-2000
0
2000A
PEER TBI SEAONC Seminar April 21, 2011
Tuna, Yang, Wallace 27
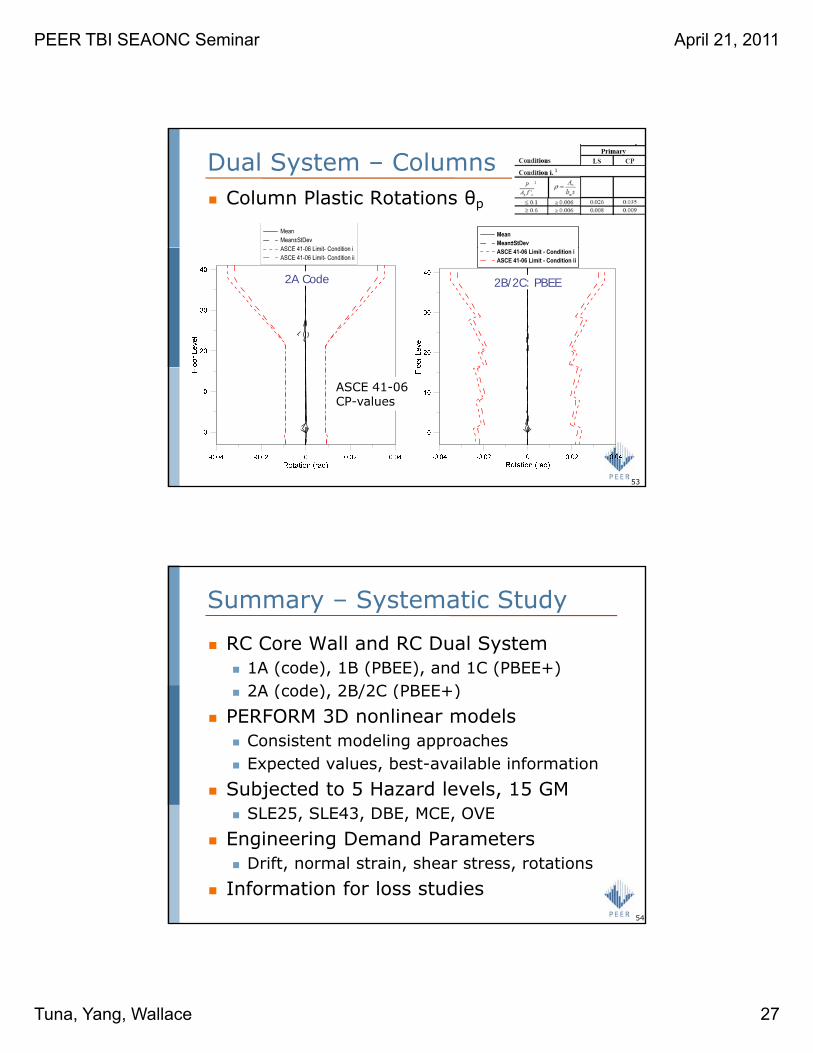
Dual System – Columns Column Plastic Rotations θp
2A Code 2B/2C: PBEE
53
ASCE 41-06CP-values
Summary – Systematic Study
RC Core Wall and RC Dual System1A (code), 1B (PBEE), and 1C (PBEE+)2A ( d ) 2B/2C (PBEE )2A (code), 2B/2C (PBEE+)
PERFORM 3D nonlinear modelsConsistent modeling approachesExpected values, best-available information
Subjected to 5 Hazard levels, 15 GMSLE25, SLE43, DBE, MCE, OVE
Engineering Demand ParametersDrift, normal strain, shear stress, rotations
Information for loss studies54
PEER TBI SEAONC Seminar April 21, 2011
Tuna, Yang, Wallace 28
Challenges
Shear wall modeling – Influence of shearModerate shear stress – Influence on maximum concrete compressive strainmaximum concrete compressive strainHigh shear stress – Influence on deformation capacity [shear failure]; lack of test data
Fragility relationsWalls: strain-based relations
Yielding, spalling, buckling, strength lossg, p g, g, g
Coupling beams: Rotation-based relationsLimited data [10 tests] from aspect ratios and reinforcement commonly used in modern tall buildings
55
Analysis Results Overall
Code & PBEE – Good expected performanceRelatively low design wall shear stress: '5 cf
Code > PBEE > PBEE+Lower drift, wall shear stress, core wall compressive/tensile strainsHigher coupling beam plastic rotation demands (stronger wall)
PBEE+ [Core wall]
cf
Wall strain: εc=0.0012(x2); εt=0.004Coupling beam rotations: θcb = 0.028/0.043
CodeWall tensile strains: more yielding over wall heightDual System SMF: High column axial loads
56