the tax system in mexico: a need for ... main priorities for reform should be base broadening...
TRANSCRIPT

Unclassified ECO/WKP(2000)6
Organisation de Coopération et de Développement Economiques OLIS : 02-Mar-2000Organisation for Economic Co-operation and Development Dist. : 10-Mar-2000__________________________________________________________________________________________
English text onlyECONOMICS DEPARTMENT
THE TAX SYSTEM IN MEXICO: A NEED FOR STRENGTHENINGTHE REVENUE-RAISING CAPACITY
ECONOMICS DEPARTMENT WORKING PAPERS N0. 233
byThomas Dalsgaard
Unclassified
EC
O/W
KP
(2000)6E
nglish text only
Most Economics Department Working Papers beginning with No. 144 are now available throughOECD’s Internet Web site at http://www.oecd.org/eco/eco.
88175
Document complet disponible sur OLIS dans son format d’origine
Complete document available on OLIS in its original format

ECO/WKP(2000)6
2
ABSTRACT/RÉSUMÉ
The Mexican tax system encompasses a number of commendable features and disincentives towork, save and invest appear less severe than in most other OECD countries. However, the system alsocontains major deficiencies, which hampers the efficiency and equity of the system and contribute to thefact that Mexico has by far the lowest level of tax revenues in relation to GDP among the OECD countries.The main priorities for reform should be base broadening measures such as eliminating the tax preferencesfor agriculture, fisheries, publishing and land transportation; substantially reducing the vast number ofzero-rated and exempted goods and services in the VAT system; and broadening the income base ofindividuals by taxing fringe benefits and eliminate the fiscal subsidy. Furthermore, increased taxation ofproperty, in particular real estate, would be warranted from both a revenue-raising and distributional pointof view. Finally, administration could be further improved through a more comprehensive registration oftaxpayers; better training of local personnel; integration of social and tax registers; improved registration ofcross-border trade; strengthened enforcement; and enhanced legal certainty for taxpayers.
JEL Code: H2Keywords: Tax, Mexico
* * * *
Le système fiscal mexicain présente un certain nombre d’aspects positifs, et les contre-incitationsà travailler, à épargner et à investir semblent moins fortes au Mexique que dans la plupart des autres paysde l’OCDE. Cependant, le système présente aussi de sérieux défauts qui nuisent à son efficacité et à sonéquité et contribuent à faire du Mexique le pays de l’OCDE ayant de loin les recettes fiscales les plusfaibles en proportion du PIB. Les réformes devraient viser en priorité à élargir l’assiette des impôts ensupprimant les régimes préférentiels dont bénéficient l’agriculture, la pêche, l’édition et les transportsterrestres, en réduisant sensiblement le nombre de produits et services assujettis à un taux zéro de TVA ouexemptés de cette taxe, et en élargissant les revenus imposables des personnes physiques par l’inclusiondans ceux-ci des avantages accessoires et par la suppression de la subvention fiscale. En outre, uneimposition plus lourde de la propriété, immobilière notamment, se justifierait à la fois pour accroître lesrecettes de l’État et dans une optique de redistribution. Enfin, l’administration de l’impôt pourrait êtreencore améliorée grâce à un recensement plus complet des contribuables, à une meilleure formation dupersonnel local, à une intégration des fichiers des services sociaux et fiscaux, à une meilleure prise encompte du commerce frontalier, à une application plus efficace de la législation et à l’élimination d’uncertain nombre d’incertitudes juridiques pour les contribuables.
Classification JEL : H2Mots-clés : Impôt, Mexique
Copyright OECD, 2000Applications for permission to reproduce or translate all, or part of, this material should be made to:Heads of Publications Service, OECD, 2 rue André Pascal, 75775 Paris Cedex 16, France

ECO/WKP(2000)6
3
Table Of Contents
Page
I. Introduction .............................................................................................................................. 4
II. The economic and social context influencing the design of the tax system............................. 4
III. Broad features of the Mexican tax system ............................................................................... 7
IV. Main issues for strengthening the tax system......................................................................... 13
V. Conclusion and options for further reform............................................................................. 25
Tables and Figures................................................................................................................................. 28
Annex I: Summary of tax reform measures, 1987-98 ........................................................................... 50
Annex II: Main issues in the tax mix discussion in OECD countries in the 1990s ............................... 54
Annex III: The statutory tax regime, 1998 ............................................................................................ 57
Bibliography .......................................................................................................................................... 76

ECO/WKP(2000)6
4
THE TAX SYSTEM IN MEXICO: A NEED FOR STRENGTHENING THEREVENUE RAISING CAPACITY
Thomas Dalsgaard1
I. Introduction
1. The Mexican tax system encompasses a number of commendable features, and disincentives towork, save and invest appear less severe than in most other OECD countries. However, it still containsmajor deficiencies, which contribute to the fact that Mexico has by far the lowest level of tax revenues inrelation to GDP among the OECD countries. As expenditures are also relatively low the budget outcomesare in general reasonably satisfactory -- but the low capacity for raising tax revenue severely limits thescope for public spending, including in areas where potential social returns are high. The experience ofother countries also suggests that there is considerable scope for strengthening the potential revenue raisingcapacity of the Mexican tax system despite the wide distribution and low level of income. A number ofcountries, including Turkey and several Latin American countries, which have similar or even lowerincomes per capita than Mexico, thus manage to raise substantially higher tax revenues in relation to GDP(Figure 1). Furthermore, as much as 30-40 per cent of government revenues in Mexico stem from oil taxes,mainly in terms of royalty payments from the state-owned oil company PEMEX, underlining the modestamount of revenue collected from non-oil sources.2
(Figure 1. Tax revenues and the level of income, 1996)
II. The economic and social context influencing the design of the tax system
2. The Mexican tax system has to be evaluated against a number of economic and social featuresthat distinguish Mexico from most other OECD countries. First, the relatively low level of governmentexpenditure in Mexico (Figure 2) is mainly a reflection of the low tax revenues and the need for prudentbudget outcomes. However, more public spending to enhance capacity and investment in areas likeeducation, health, physical infrastructure and poverty alleviation, which are key to further economic andsocial development of the country, would clearly be desirable, provided it is well-designed and effectivelyimplemented.3 In addition, the social security reform and the cost associated with the banking sector 1. The author is a staff economist at the OECD. This paper is a revised version of a special chapter that was
originally produced for the OECD Economic Survey of Mexico published in April 1999 under the authorityof the Economic and Development Review Committee. The author is indebted to Benedicte Larre,Paul Atkinson, Kathryn Gordon, Val Koromzay, Marcos Bonturi and Flip de Kam for comments anddrafting suggestions, and to the Mexican authorities for their assistance with obtaining the information andclarifications necessary to prepare the paper. The paper has also benefited from discussions with numerousMexican experts outside the government. Special thanks go to Chantal Nicq, Benedicte Riey andHarry Tchilinguirian for technical assistance and to Nanette Mellage for secretarial assistance.
2. It should be emphasised that this paper is mainly concerned with the tax system excluding revenues fromPEMEX, and that issues relating to the extraction of rent from the state monopoly are not analysed.Moreover, the paper generally treats social security contributions as taxes on labour even though these arenot included in the tax laws and to some extent could be regarded as insurance. The Economic Survey ofMexico, 1998, gives a detailed exposition of the health insurance and pension components of the socialsecurity system.
3. Some of these issues have been discussed in special chapters of previous Economic Surveys of Mexico(1995, 1997, and 1998).

ECO/WKP(2000)6
5
support package (FOBAPROA) are expected to raise annual government expenditure by more than 2 percent of GDP over the next 10 years.4 Financing these expenditures will require increases in the tax base,given the need to limit government borrowing.5 Some theoretical and empirical analyses suggest thathigher tax levels could be counterproductive in terms of their effect on economic growth, whereas otherrecent studies raise serious doubts about the robustness of this proposition (Box 1). When taking intoaccount the way additional revenues are spent as well as the initial tax levels, growth effects fromincreased taxation might even be positive – in particular for a low tax country like Mexico. Furthermore,the structure of the tax system may be more decisive than the overall level of the tax burden in determiningthe balance between economic and social returns from more expenditure and the costs of higher taxation.However, it is important to stress that any move to raise tax revenues will be sustainable only to the extentthat the population at large perceives it is getting sufficient value for money in terms of the quality ofpublic spending.
(Figure 2. General government expenditure -- average 1990-1996)
Box 1. Taxation and economic growth
The direction of tax effects on the level and growth of income is not always clear. Taxation may, in fact, bebeneficial for the economy if it provides the financial basis for the provision of public goods that improve averageliving standards and social welfare. More and better public goods and services may also increase the productivity ofprivate fixed and human capital and hence increase economic growth. This is in particular true in countries withunderdeveloped human and physical capital. In addition, government transfers may reduce poverty and improvesocial cohesion. On the other hand, higher taxes increase distortions and may reduce saving, investment and workincentives. The adverse effects on economic efficiency may grow disproportionately with the increase in the tax level.As the net effect of taxation on economic performance depends on the level and structure of taxation, and whether taxrevenue is spent in a productive or unproductive way, the benefits and costs of taxation are difficult to disentangleempirically. The Secretariat has previously examined the relationship between taxation and growth for a sample ofOECD countries (not including Mexico, Turkey and other relatively low-income countries) and found that a10 percentage point increase in the tax/GDP-ratio is accompanied by 0.5 percentage point lower growth (Leibfritz etal, 1997). This is more or less in line (at least, in qualitative terms) with the findings of Barro (1991), Plosser (1992)and King and Rebelo (1990). However, the robustness of the negative relationship between taxation and growth hasbeen questioned by several other studies, including: Levine and Renelt (1992); Slemrod (1995); Easterly andRebelo (1993); Mendoza et al. (1997); Hendricks (1999); Engen and Skinner (1996); and Milesi-Feretti andRoubini (1998), who generally find non-significant or even positive correlation. In particular, there may benon-linearities implying a positive growth effect if taxes are increased from a low level and a negative growth effectif they are increased from a high level.
3. Second, the dependency on oil-related revenues in government budgets implies that volatility inoil prices -- besides imposing volatility on the real economy -- significantly influences fiscal policy due tothe strict adherence to announced budget targets. The consequence is that discretionary fiscal policydecisions tend to exacerbate the effects of oil price changes on the economy. For instance,three discretionary spending cuts were made during 1998 following the sharp drop in oil prices, allowingthe deficit target of 1.25 per cent of GDP to be roughly achieved. If more revenues could be raised fromnon-oil sources, and at least some of it being used to improve the average budget position, this would allowthe government to absorb a larger part of the oil price changes, thereby reducing the frequency of
4 . See Chapter II of the Economic Survey of Mexico, 1999.
5. Moreover, as the major privatisation operations have been completed earlier in the 1990s, there is nolonger much potential to raise revenues from this source.

ECO/WKP(2000)6
6
disruptive discretionary changes to expenditure and/or taxes.6 This is also a pertinent concern in moregeneral terms. Mexico has shared the experience of many Latin American countries where fiscal policy hasbeen pro-cyclical more often than not -- and this has contributed to the considerable overallmacroeconomic volatility of the Mexican economy. The variation in the growth rates of real GDP and realprivate consumption has thus exceeded the OECD average by a factor of three and five, respectively,since 1980. Another macroeconomic factor shaping the design of the tax system has been a history of highand volatile rates of inflation that Mexico shares with most other Latin American countries.
4. Third, income is considerably lower and much more unequally distributed in Mexico than in theother OECD countries, except for Turkey. When measured by the Gini coefficient, post-tax incomeinequality in Mexico is only slightly lower than in Brazil and Chile. One illustration is that the mostaffluent 10 per cent of households receive nearly 40 per cent of total income, while less than 10 per cent oftotal income is earned by the 30 per cent of households with the lowest income levels.7 Moreover,distribution has become slightly more unequal over the past 10 to 15 years according to household surveys.The low level and wide distribution of income give rise to economic and social problems, not least in termsof poverty (including malnutrition, high infant mortality, illiteracy and lack of basic health care) that arevirtually absent in most other OECD countries. Furthermore, the wide income distribution in practicelimits the base for individual income taxes to a relatively small group of people, who then face rather hightax payments in absolute terms. As the most affluent individuals typically have access to instruments ofavoidance or evasion, this acts to limit the scope for raising revenues through direct taxation of incomes.
5. Fourth, the informal sector in Mexico is large compared with other OECD countries, exceptperhaps for Turkey, although it does not appear to be out of line with that of other Latin Americancountries (Table 1). By several estimates, employment in the informal sector could be as much as one-thirdto one-half of total urban employment,8 but since incomes are relatively low in the informal sector (ascompared with the formal sector) its share in GDP is probably somewhat lower. Precise estimates areinherently difficult to obtain, but a recent study by the Ministry of Finance, based on micro-data from theINEGI household survey, estimated the size of the informal sector to be around 10 per cent of GDP.9 Theinformal sector in Mexico is primarily a by-product of widespread poverty, lack of basic skills of a largeproportion of the population and absence of a social safety net and is thus not comparable with the“undeclared” economy of more advanced economies (Box 2). It is a characteristic feature of the informalsector that it expands in economic downturns because it provides the only fall-back option for people beinglaid off in the formal sector. Integration of the informal economy is thus a complex issue that goes wellbeyond tighter administration and control and even beyond tax structure. From a taxation point of view,most activities in the informal sector are of a subsistence nature and would thus potentially represent a verylimited, or even negative, income tax base in the short to medium term (as a result of the negative income 6. Since 1980 the standard deviation from PEMEX royalties has been 1 per cent of GDP, i.e. if normality is
assumed then the movement from one year to another will not exceed 2 per cent of GDP with 95 per centconfidence. A rough rule of thumb could then be, that tax revenues, excluding PEMEX contributions,should be large enough to accommodate a 2 per cent of GDP drop in PEMEX contributions withoutcausing the budget deficit to exceed a targeted maximum and without having to resort to discretionaryexpenditure cuts.
7. Figures based on the 1996 Household Income and Expenditure Survey (INEGI).
8. In the OECD 1997 Economic Survey of Mexico, references are given to studies that estimate informalemployment to be 20-44 per cent of the urban labour force -- a share which according to most of theindicators used have been increasing since the 1980s.
9. Other studies have estimated the size of the informal sector through electricity consumption or moneydemand, and have generally found that the informal sector could be as much as one-third of GDP. Thesestudies, however, do not only capture informal activity, but also tax evasion by the formal sector, whichmay be a different issue for policy.

ECO/WKP(2000)6
7
tax for workers earning less than 3.2 times the minimum wage). However, the informal sector alsofacilitates evasion by higher income individuals and larger corporations, thus contributing to erosion of theformal sector tax base. It is thus important to institute mechanisms whereby these activities can be includedin the tax base so as to mitigate problems of horizontal inequity, non-neutrality between economicactivities and a sense of unfairness among taxpayers. Nevertheless, this challenge should not divertattention from more urgent problems related to the income and value added tax systems.
(Table 1. Estimates of informal sector size in selected countries)
Box 2. The informal sector
The informal sector in Mexico covers a very diverse and heterogeneous set of economic activities,individuals and enterprises, and is thus a much wider concept than the limited “grey sector” in more advanced OECDeconomies. Although most of agricultural workers in Mexico operate without any formal contract, informality as suchis often associated with non-agricultural activities and is thus seen as having emerged with urbanisation. It isparticularly widespread in domestic services, retail trade and cleaning services. Operating on a very small scale,informal units very often have no accounts and premises, produce or sell low-quality/low-cost products and services,rarely comply with either various registration obligations or labour regulations, and are generally short-lived. Theyalso tend to rely on family ties for labour contracting. However, part of the informal sector operates on a larger scaleand it is, for instance, not uncommon for firms registered in the formal sector to supply part of their production intothe untaxed informal sector. It also appears that street vendors and other retailers in the informal sector, at least tosome extent, are supplied by non-registered and non-taxed imports and sometimes also stolen goods. Unfortunately,reliable quantitative estimates of these problems are not available. See also the Economic Survey of Mexico (1997).
III. Broad features of the Mexican tax system10
6. The Mexican tax system has undergone a number of major reforms since 1980. Primary featuresof these reforms have been the introduction of a general value-added tax (VAT); indexation to neutralisethe effects of inflation on taxation; and integration of personal and corporate income taxes to ensure moreneutrality with respect to the financing decisions of companies. Since the late 1980s, the reforms have hadtwo main objectives: first, to compensate the fall in revenue caused by the collapse in oil prices in 1986;second, to reduce distortions and inefficiencies, including the incentives to switch between different kindsof income and between tax systems of different countries. In particular, in line with the gradual opening ofthe economy which ultimately led up to the NAFTA (1994), there has been some convergence of corporateand individual top income tax rates with those of the United States and Canada. The reforms of the taxsystem (which are summarised in Annex I) made the system more equitable and efficient: marginalincome-tax rates were lowered for corporations and individuals, and the tax base widened in line with theprinciples guiding tax reforms in several other OECD and Latin American countries.11 Despite theimprovements in the tax structure, the reform measures did not produce any lasting and significant increase
10. Background information for this section is presented in the annexes: I. Summary of tax reform measures,
1987-98; II. Main issues in the tax mix discussion in OECD countries in the 1990s; and III. The statutorytax regime, 1998.
11. Annex II sets the Mexican reforms in a broader context by summarising some overall principles fortaxation as well as some of the main themes of tax discussions in OECD countries since the 1980s. For adiscussion of developments in Latin American countries, see Shome, 1992.

ECO/WKP(2000)6
8
in tax revenues (Figure 3).12 The main reasons for this have been the continuation, extension orintroduction of preferential regimes, various types of tax relieves, and -- closely interlinked -- the fact thatreforms were apparently not successful in ensuring stronger compliance with the tax law.
(Figure 3. Total tax revenues)
7. Mexico’s tax-to-GDP ratio of around 15 per cent is by far the lowest among OECD countries,although it should be noted that such ratios may not be fully comparable between countries.13 Mexico, forinstance, uses tax credits instead of social transfers to compensate low-income wage earners in the formalsector implying -- all else being equal -- lower levels of taxes and expenditure than in countries usingtransfers as compensation (although this effect should not be overstated as it amounts to less than half apercentage point of GDP). However, it is striking that Mexico collects nearly 10 percentage points of GDPless than Turkey, which at 25 per cent of GDP has the second-lowest ratio in the OECD area. Excludingroyalty payments from PEMEX, the gap is even larger. Furthermore, there are few signs that Mexico iscatching up -- on the contrary, revenues as a percentage of GDP have fallen in recent years and thedifference between Mexico and the rest of the OECD has increased slightly since 1980. Compared withother Latin American countries, Mexico’s tax revenues (excluding PEMEX royalties) as a percentage ofGDP lag behind those of Argentina, Chile and in particular Brazil.
8. All major sub-components of total tax revenues, excluding PEMEX royalties,14 displayed aslowly increasing trend as a per cent of GDP from the early 1980s until 1994 (Figure 4). Then, theeconomic crisis in 1995 triggered a sharp decline in revenues from income taxes, social securitycontributions and other consumption taxes. VAT revenues remained almost unchanged as the rise in thestandard VAT rate from 10 to 15 per cent that year offset the impact from the sharp drop in real privateconsumption and real imports. Any comparison of the mix of collected tax revenues with that in otherOECD countries must be made cautiously, given the special features of the Mexican economy which haveaffected the collected tax mix. These include the low and unevenly distributed income, the importance ofoil as a revenue source, the informal sector, as well as the severe economic crises of the past two decades.Given this caveat, the tax mix (excluding PEMEX royalties) has in many respects followed trends in manyother OECD countries. There has been increasing reliance on social security contributions and generalsales taxes, whereas import duties have become less important -- in part, due to the trade liberalisation thatstarted in 1986-87 and culminated with NAFTA.15 Significant variations exist in the tax mix across OECDcountries, but Mexico’s current tax structure, excluding PEMEX, does not stand out as unusual (Figure 5).
(Figure 4. Tax mix in Mexico, 1980-1996)
12. Taxes include federal, state and local taxes, social security contributions and royalty payments from
PEMEX (the latter being classified as a tax in OECD’s revenue statistics). In the public sector accounts ofthe Ministry of Finance (Hacienda) the contributions from PEMEX to the federal government budget aretreated as non-tax revenues.
13. Countries generally apply widely different practices when compensating individuals, households orcorporations through the tax and transfer system, which in turn implies different levels of expenditure andtaxes even where the economic impacts are similar. Some rely primarily on expenditure, while others usetax allowances and/or credits more extensively. Moreover, some countries tax gross income, includingsocial transfers, whereas others only tax income net of transfers. Finally, countries may enact policies, forinstance regulation, that have similar goals and create similar economic incentives and disincentives astaxes and spending, but have different implication for the size of the government sector as measured bytaxes or spending (Leibfritz et al, 1997).
14. The structure and size of revenues from PEMEX are described in more detail in Box 3.
15. Revenues from customs and import duties declined from a peak of 1.2 per cent of GDP in 1992 to 0.6 percent in 1998 as tariffs were reduced.

ECO/WKP(2000)6
9
(Figure 5. Tax mix in selected countries, 1996)
Box 3. PEMEX and subsidiaries’ contributions to the federal government budget
PEMEX and its subsidiaries effectively contribute to the federal government budget through four channels:
-- a hydrocarbons fee of 60.8 per cent of gross revenues (excluding VAT);
-- ordinary VAT payments and customs duties;
-- an “excess profit fee” on windfall gains from oil exports (for 1998, the levy was programmed to be39.2 per cent of the excess of oil prices above US$ 15.5 per barrel);
According to Article 4 of the Federal Revenues Law for 1998, the hydrocarbons fee paid by PEMEX isformally made up of contributions from three different sources: an oil extraction royalty (which comprises anordinary fee, an extraordinary fee and an additional fee), the regular income tax of 34 per cent and excise taxes(special tax on products and services, IEPS). As changes in excises are determined endogenously by the market priceof oil and the regulated price at the pumps, the oil extraction fees act as a residual to ensure that the aggregatedcontribution from PEMEX is equivalent to the budgeted 60.8 per cent of gross revenues.
The oil extraction royalty paid by PEMEX has fluctuated sharply since 1980, cf. Figure 3 above,contributing between 10 and 30 per cent of total federal revenues. In most recent years, i.e. 1993-98, the contributionhas varied between 10 and 25 per cent of total revenue (2-4.5 per cent of GDP). Including the special gasoline tax,payments from PEMEX have been more stable, contributing annually 25-30 per cent of total revenue (4-5 per cent ofGDP) during 1993-97. Net VAT payments from PEMEX have amounted to 0.3-0.6 per cent of GDP during the sameperiod.
9. Cross-country comparison of the share of income taxation from, respectively, individuals andcorporations is blurred by diverging accounting practices. In particular, Mexico includes in corporate taxespayments from self-employed as well as some withholding taxes (e.g. on payments to foreign residents andon interest income from bank deposits), which are allocated to individual income taxes in most othercountries. This implies a tendency to report a higher share of corporate taxation in Mexico than elsewhere.Indeed, on a comparable basis the share of income taxes from corporations may be roughly on level with,or even below the OECD average.16 Another salient feature is that the share of capital income in GDP ismuch higher in Mexico than in most other OECD countries, implying that the effective taxation of capitalis very low (see below). The reported revenue share from individual income taxation and payroll taxes isbelow the average OECD share, but similar to that of Greece, Turkey and Brazil. However, this result isalso affected by the differences in definitions.
10. Leaving aside preferential regimes in corporate and individual income taxation as well as in theVAT system, the statutory rates and features of the general tax regime in Mexico compare favourably withthose of most other OECD countries. The integration of personal and corporate income taxes implies equaltreatment of corporate financing through issuing equity or using retained earnings, while indexation toinflation ensures that tax distortions from high and volatile inflation rates are kept to a minimum (Box 4).The top marginal statutory tax rate on individual wage-income is among the lowest in OECD. Themarginal corporate tax rate is close to the median of OECD-countries, but significantly higher than in some
16. Unfortunately, the statistics do not allow a full correction of the Mexican data for these idiosyncratic
features. Revenues from withholding taxes amounts to some 0.7 per cent of GDP (1997) or around one-quarter of total corporate tax revenue, but information on tax revenues from self-employment is notavailable.

ECO/WKP(2000)6
10
Latin American countries, including Brazil and Chile. The special asset tax on the net worth of enterprisesserves as an important control device without creating any significant disincentive for investment.
Box 4. Indexation to inflation
High inflation has several potentially adverse consequences for non-indexed tax systems: bracket creep(although it raises revenue, it is normally considered a non-transparent and not necessarily efficient way to financegovernment expenditure); high taxation of investment when depreciation rules do not take into account the effectsfrom inflation (which gives incentives to invest in assets with low duration); distortion of saving and investmentdecisions when only nominal interest payments are taxed or deductible; overvaluation of capital gains which couldlead to “lock-in effects” and thereby lower investment; and eroded revenues from specific excises. Moreover, highinflation is often accompanied by high volatility, which adds to tax uncertainties and an inefficient resource allocationif the system is not indexed. These costs of non-indexation have to be weighed against the administrative difficultiesand complexities of introducing accounting for inflation, which is why many low-inflation OECD countries choosenot to index their tax systems.
For Mexico, the semi-annual adjustment of brackets, subsidies and credits in the individual income-taxsystem effectively limits bracket creep. The full indexation of assets and liabilities ensures that only real interestincome is included in taxable income and indexation of realised and accrued foreign exchange gains and losses renderthe tax system neutral regarding expatriation or repatriation of capital. Purchases of goods and services bycorporations are immediately expensed so as to eliminate any effect of inflation on the calculation of taxable incomearising from the treatment of inventories.
11. The progressivity of the individual income tax system is ensured by the tax schedule itself, aswell as by the progressive salary tax credit and the so-called tax subsidy. The various tax reliefs pull in theother direction. The tax credit, which is refunded in cash for low-wage earners with negative tax payments,was introduced in 1994 (with retrospective effect from October 1993) and extended in 1995 to alleviateadverse distributional consequences of the VAT increase from 10 to 15 per cent.17 Unlike the system insome other countries, for instance Canada, the tax credit is independent of family status and number ofchildren, which tends to lessen its impact on progressivity as low-income families typically have morechildren. The tax subsidy has been implemented to mitigate problems of horizontal inequality imposed bythe non-taxation of fringe benefits.18 Combining the statutory rates, the tax credit and the tax subsidy givesthe theoretical effective tax rate for each income category of wage earners in the formal sector (i.e. taxesexpected to be paid under full compliance with the tax law). The tax system is progressive throughout allincome categories (Table 2). Progressivity is highest at the lower-income intervals, whereas the ratestructure flattens somewhat after ten times the minimum wage as the top marginal effective rate rises tojust below 25 per cent. The theoretical effective tax rates points to another salient feature of the system,i.e. that the revenue-generating base of the system is extremely narrow. Indeed, by December 1997, formalsector employees with earnings less than 3.2 times the minimum wage19 -- amounting to some 70 per centof all dependent employees -- would in theory be paying negative income taxes, i.e. they would receive
17. However, as a large proportion of consumption by the lower income deciles are zero-rated goods and
services, the VAT increase would not have had a full impact on the living standards for these groups.
18. The subsidy is creditable against tax and varies inversely with the proportion that fringe benefits representin total earnings. The subsidy decreases with rising income thus adding to progressivity of the overall taxsystem. According to official estimates, fringe benefits amount to one-third of total remuneration foremployees. Fringe benefits are only deductible for the firm if they are extended to all employees, and forwage-earners with incomes above seven minimum wages they are only exempt up to the amount ofone minimum wage.
19. The minimum wage is around 28 pesos per day (December 1998) or less than US$ 3.
ECO/WKP(2000)6
11
cash payments from the tax authorities. It should be noted, however, that the theoretical rates does notreflect actual amounts paid in tax by different income groups and that they do not apply to self-employedand individuals working in the informal sector. Tax avoidance and evasion erode the revenue-generatingcapacity of the system and actual progressivity may differ from the theoretical in a non-negligible way.
(Table 2. Tax progressivity and distribution of wage earners)
12. Measured by statutory marginal tax wedges, distortions in the labour market are generally lowerin Mexico than in most other OECD countries, including the United States and Canada, for most familytypes (Figure 6). Of the selected countries shown, only New Zealand and Turkey generally apply lowermarginal tax wedges than Mexico.20 Higher marginal rates affect both labour supply and demand by raisingthe wedge between what workers receive from pay increases and what firms pay, and empirical analysissuggests that employment falls as a result, thereby lowering potential output. The extent of the fall inemployment depends on labour-market institutions and the wage-bargaining framework. In countries withflexible real wages, such as Mexico, taxes tend to get shifted back onto labour, reducing the take-homewage, while leaving labour demand relatively unaffected. Labour-supply elasticities, however, could besomewhat higher in Mexico than in most other OECD countries, at least with respect to wage earners withincomes above three times the minimum wage, i.e. those paying positive taxes, and self-employed, forwhom informal sector employment appears to be a close substitute to the formal sector.21
(Figure 6. Marginal tax wedges by family type and wage level, 1996)
13. Incentives to save and invest do not appear highly distorted in Mexico compared with most otherOECD countries. In particular, when measured by statutory marginal effective tax rates on investment invarious physical assets and different sources of financing, Mexico stands out among the group of OECDcountries as having one of the most neutral tax systems.22 The required pre-tax rates of return of differentinvestments, taking into account both corporate and personal taxation, are thus relatively uniform acrossvarious assets and financing sources (Table 3). The relative neutrality reflects mainly the integration ofindividual and corporate taxation23 and the indexation to inflation. As a summary measure of neutrality, thestandard deviation of these returns (amounting to 0.3) is lower in Mexico than elsewhere in the OECD,except for New Zealand.24 Moreover, the required level of pre-tax returns of each instrument in Mexico isnot far from the OECD average, indicating that no excessive tax disincentives exist for each of these
20. Among the entire group of OECD countries, Japan and Korea also (in general) apply lower marginal
wedges than Mexico.
21. Empirical work (Leibfritz et al, 1997) shows that labour-demand elasticities are generally much higherthan overall supply elasticities (where substitution and income effects move in opposite directions), so thatlabour taxes tend to be much more distortionary in countries where there are rigid real wages, and most ofthe tax effect falls on the demand rather than the supply of labour. Unfortunately, there exists no empiricalwork investigating this issue for Mexico.
22. The marginal effective tax rates are reflected in the required pre-tax rate of return an investment has to earnin order to provide a personal investor with the same post-tax return as a bank deposit earning a pre-tax5 per cent real rate of interest. The estimates are based on the King-Fullerton methodology. Themethodology has a number of shortcomings, including the absence of uncertainty and the rudimentarytreatment of financial structures and of the intermediation process. For a thorough exposition see Gordonand Tchilinguirian, 1998.
23. In particular, it is noted how the full imputation system implies equal marginal effective rates on retainedearnings and new equity.
24. The changes to corporate taxation made in 1999 have introduced a wedge between distributed and retainedprofit (see Box 9), creating a bias in favour of financing through retained earnings.

ECO/WKP(2000)6
12
investments and financing sources. Income from private savings are receiving favoured treatment in termsof a tax rate of only 17-20 per cent for all levels of income, and only on the first 10 percentage points ofnominal interest rates. Some non-neutrality across savings instruments is imposed by the tax exemption oninterest income from various financial instruments, including government securities and instruments withmaturity exceeding one year, as well as the tax deductibility of pension savings up to a certain limit.
(Table 3. Required real pre-tax rates of return, 1996)
14. Actual average tax rates collected on consumption, labour income and capital income aresomewhat lower in Mexico than in most other OECD countries (Figure 7). The taxation of capital incomeis particularly low, but in general the numbers show that the low overall tax revenue to GDP ratio forMexico reflects relatively low actual tax payments on all three bases. The advantage of using actualaverage rates, as opposed to statutory rates, is that they capture effects from preferential regimes and othertax-reliefs as well as overall compliance, which are not reflected in the effective statutory rates. The levelsof actual average rates are not adequate for comparing overall tax distortions across countries, however,since low rates may primarily reflect preferential treatment of selected groups of taxpayers and hightaxation of others. Moreover, average levels of taxation are not necessarily good approximations of thedistortions created by the tax system, which are primarily determined by marginal rates facing theindividual taxpayer. Finally, besides the methodological problems discussed in Box 5, a major factor which
(Figure 7. Average effective tax rates)
Box 5. Measuring effective tax rates
The estimates for effective tax rates on capital income, labour income and consumption are based on amodified version of the Mendoza et al. Methodology (see Mendoza et al., 1994). The three tax rates are measured asad valorem estimates by classifying virtually all forms of tax revenue at the general government level into one of thethree taxes. Each measure of tax revenue is then expressed as a fraction of the corresponding tax base,i.e. consumption, wages and the overall operating surplus in the economy. The methodology gives rise to a number ofcaveats in terms of the assumptions being made and the data being used (see OECD (2000) and Carey andTchilinguirian, forthcoming). First, all sources of household income are assumed to be taxed at the same rate (theestimates turn out to be quite sensitive to changes in this assumption, for instance if Mexican households are assumedto pay zero tax on capital income, it raises the effective tax on labour by 1 to 1.5 percentage points and lowers that oncapital by the same amount). A second pertinent issue is whether to apply gross or net operating surplus(i.e. operating surplus less capital consumption) in the base for capital taxation. In theory, the net operating surplusshould be used, but problems of measuring capital consumption sufficiently accurately in the national accounts couldfavour using the gross concept in some circumstances. Here, however, the net operating surplus is used in the base,implying that effective tax rates on capital are very high, and probably overestimated, for some countries. Third, thenumbers are not taking into account tax bases not measured by the national accounts -- such as imputed rental incomefrom owner-occupied housing, work at home, etc. A particular problem is the informal sector or “non-declared”economy. Income in this sector is to some extent covered by national accounts data, and is therefore included in theincome bases used in the calculations, but it does not generate income tax revenues. This implies that actual tax rateson formal sector income are to some extent underestimated depending on the size of the undeclared economy andhow much of this activity is included in official GDP figures. The methodology used here explicitly treats imputedwages to the self-employed as labour income, whereas the Mendoza et al. methodology attributes the entire operatingsurplus of unincorporated enterprise to capital. The estimates use revenue data collected by the OECD and nationalaccounts data. Due to incomplete national accounts data for Mexico, assumptions have been made from the 1994Household Survey, with respect to self-employment income and household property income.

ECO/WKP(2000)6
13
complicates the analysis of tax effects is determining who finally bears the incidence of the tax -- sincetaxes levied on a given base may end up being shifted along the production and distribution chain.25
IV. Main issues for strengthening the tax system
15. The structure of the general Mexican tax system in terms of statutory rates and features appearssatisfactory overall, but the system does not seem to be robust enough to meet prospective financing needsand there are a number of areas where improvements would contribute to both better equity and efficiency.The key challenge facing the tax system is to increase the potential revenue raising capacity, primarily bybroadening the base and improving collection, while keeping the rates near the current low levels. Thiswould strengthen revenue significantly without increasing distortions much, and at the same time it wouldalleviate problems of horizontal inequity and help reducing budget volatility. The main concerns are thepreferential regimes and the closely related deficiencies in tax administration. The preferential regimes,besides diluting revenue and complicating administration per se, create significant loopholes and facilitateevasion. This, in turn, hampers the effectiveness of the tax administration and creates major problems ofhorizontal inequity (some pay taxes, others do not). On the other hand, inefficiencies in the taxadministration itself may compound negative revenue consequences arising from preferential regimes tothe extent that inadequate surveillance and enforcement induces taxpayers to falsely register their activityor transactions in these regimes. Lack of administrative capacity at the sub-national level could also be amajor impediment for decentralising more expenditure responsibilities and taxing powers to states andmunicipalities. Finally, considerations related to the informal sector, income distribution and the impactfrom oil price volatility on the budget are also relevant with respect to reforming the tax system.
Broadening the base: preferential regimes and the informal sector
16. Preferential regimes (or tax expenditures in a broad sense) are major contributors to the low levelof revenues. Not only do they lead to low revenues per se, they also open multiple possibilities fornon-compliance through tax evasion and avoidance. Moreover, preferential regimes may introduceconsiderable non-neutralities in terms of incentives to various economic activities. The exemptions andzero-rated goods and services in the VAT system, as described in Annex III, have resulted in a significantreduction of the base of taxed consumption26 and also contributed to low VAT compliance, as sometransactions are falsely attributed to the zero-rated base. Moreover, the system of refundable VAT creditsexacerbates the incentives to fraud and complicates administration further.27 According to the authorities’estimates, VAT compliance in Mexico is only around 63 per cent -- i.e. only 63 pesos were collected out ofevery 100 pesos that should have been collected (Table 4). This is below compliance levels in other OECDcountries for which comparable data are available, including Canada and Portugal, as well as some LatinAmerican countries. The narrow base and the induced low compliance implies that Mexico ranks lowestamong the OECD countries in terms of VAT productivity.28 This is also the case for the effective VAT
25. Producers may be able to shift taxes on to consumers (via higher prices), depending on product market
conditions, or onto labour (via lower wage cost, including through reducing employment), depending onlabour-market conditions. Labour, on the other side, may also be able to shift taxes on wages and salariesto producers if labour market conditions allow after-tax wages to be held unchanged.
26. By some estimates only around one half of total consumption is taxed.
27. In 1997, the cash refunds amounted to 1.1 per cent of GDP, up from 0.7 per cent of GDP in 1994 and0.3 per cent of GDP in 1993.
28. The VAT productivity is a standard measurement of the revenues collected per percentage point tax,i.e. VAT revenues in per cent of GDP divided by the standard VAT rate. Although a relatively roughindicator it provides some guidance for international comparison.

ECO/WKP(2000)6
14
rate29 in per cent of standard rate -- again indicating that only a small part of the potential base is actuallybeing taxed.
(Table 4. Indicators of VAT compliance and productivity)
17. Preferential treatment in the corporate income scheme concerns primarily the simplified regimefor certain sectors and the small taxpayers regime. In addition, until the 1999-tax package tightenedconsolidation rules and eliminated the immediate deduction scheme for specific kinds of investment, thesetwo features represented important preferential regimes and correspondingly significant tax losses.30 Thesectors benefiting from the simplified regime -- i.e. agriculture, fisheries and land transportation, whichtogether represent around 10 per cent of GDP and 25 per cent of total employment -- pay only little or nocorporate income tax, as taxation is based on cash flows, and only on resources withdrawn from theenterprise. These sectors are thus de facto liable to the assets tax only.31 A large part of taxpayers in thesesectors are small family-run businesses that would be lightly taxed in any circumstance (under the regimefor small taxpayers), but also larger corporations are avoiding income taxation under the simplified regime.There seems to be little economic justification for the special treatment of medium- and large-sizedcorporations in agriculture and land transportation. The regime for small taxpayers, on the other hand,serves the useful purpose of making formal sector economic activity more accessible -- in terms of lesscomplicated rules and requirements -- for self-employed and micro-businesses who would otherwise havean incentive to operate in the informal sector.
18. Finally, the non-taxation of fringe benefits in the individual income-tax system leaves aroundone-third to one-fourth of total labour income in the formal sector untaxed. Moreover, the non-taxation hasnecessitated the introduction of a tax rebate -- the fiscal subsidy -- for those receiving a relatively smallshare of remuneration as fringe benefits, in order to mitigate adverse consequences for horizontal equity.This, in turn, means that tax revenues and the base of taxpayers are lowered further and adds to thecomplexity of the tax system. Fringe benefits are included in the income-tax system in most OECDcountries,32 but the tax treatment of different types of fringe benefits varies significantly across countries.Only New Zealand and Australia have separate fringe benefit taxes.
19. In sum, Mexico applies preferential regimes on a broad range of economic activities and incomes-- a practice which causes a major drag on tax revenues, uneven incentives across activities and severely
29. VAT revenue divided by total consumption exclusive of government wages.
30. The immediate deduction scheme for corporations outside the three largest metropolitan areas and forsmall- and medium-sized enterprises, although comprising some economic rationale in terms of supportinginvestment and regional development, also created unintended loopholes and distortions, cf. Box 9. Withrespect to consolidation rules, these were considerably more lax than in most other OECD countries(e.g. implying that transfer of negative income from a subsidiary to a parent company could take placeeven though the ownership of voting shares in the subsidiary was less than 50 per cent). According to thenew rules, ownership now has to exceed 50 per cent and foreign resident subsidiaries can no longer beincluded in a Mexican tax consolidation group. Furthermore, the maximum amount of earnings or losses ofa subsidiary that may be consolidated is now 60 per cent against previously 100 per cent. Consolidationrules are now more in line with rules in the rest of the OECD but there may still be room for some furthertightening.
31. Moreover, enterprises in agriculture, fisheries and publishing only pay half the standard rate, i.e. 17 percent of taxable income and 0.9 per cent in assets tax.
32. The most widely used fringe benefits in OECD countries are food, discounts, transportation, leisurefacilities, accommodation, medical and dental insurance, financial insurance and education expenses. ForMexico the non-taxed fringe benefits also includes child care, while excluding food and accommodation.Nearly all OECD countries tax employer-provided motor vehicles and accommodation, and nearly half ofthe countries tax insurance arrangements and leisure facilities.

ECO/WKP(2000)6
15
complicates tax administration. A rough calculation would suggest that the direct effect of completelyeliminating the major preferential regimes described above could provide as much as 3 per cent of GDP inadditional tax revenues.33 This estimate does not take into account additional positive revenue effects fromincreased compliance if preferential regimes were removed. Nor does it consider any potential dilution ofrevenues due to substitution between formal and informal activity, increased tax avoidance or thepossibility of increased substitution between consumption and savings, as well as between leisure andwork. On balance, however, these indirect effects are likely to be small compared with the significantincrease in revenues that would certainly arise as a direct consequence of the elimination of preferentialregimes.
20. The informal sector would appear to be another target for base widening. Individuals andenterprises in the informal sector do not pay income taxes and retail sales from vendors in the informalsector are, to some extent, escaping consumption taxes (although often only in the final transaction).However, the informal sector may not have a large direct impact on tax revenues as the larger part of itseems to be related to micro-business and low-skilled/low-income employment. By some estimates asmuch as 90 per cent of the workers in the informal sector earn less than three times the minimum wagesand would thus be eligible for a negative tax payment were they registered as wage earners in the formalsector.34 Moreover, most of the corporate activity would be taxed under the small taxpayer system. It isthus doubtful whether incorporating larger parts of the informal sector into the formal sector would providemuch additional tax-revenues -- in fact, it could even be a drag on tax revenues, at least in the short term,due to the tax credits. However, the non-taxation of higher-income individuals and firms in the informalsector and the size and visibility of informal activities have negative effects. They contribute to horizontalinequity, lower tax morale and complicate the political process of raising revenue from those alreadypaying taxes.35 The task of integrating the informal economy is complicated by the fact that a majorproportion of the labour force is self-employed,36 and that self-employment in the formal sector andinformal activity are often combined or close substitutes. The same problem relates to the large -- andgrowing -- number of small and micro-enterprises.37
33. This assumes that: (i) the potential tax-contributions from agriculture and transportation would be
proportional to their contributions to GDP; (ii) consolidation rules are tightened further; (iii) taxableindividual income would increase by one-third as fringe benefits are taxed; (iv) the fiscal subsidy would beeliminated without compensatory reductions in rates, and (v) finally -- in accordance with the authorities’estimate -- the effects from eliminating VAT exemptions and the zero-rate, while keeping the standard rateat 15 per cent, would increase VAT revenues by 1.6 per cent of GDP.
34. The question then arises why these workers do not take advantage of the negative tax credit. The mainanswer is that most workers in the informal sector are not there by deliberate choice but because ofshortage of jobs in the formal economy (and self-employed in the formal sector are not entitled to the taxcredit). Moreover, for some individuals there could also be an incentive to work as wage earners in theinformal sector to the extent the “tax rebate” for the informal enterprise is shared with workers. Finally, thesocial benefits obtained by entering the formal sector (including health care, pensions and the potential taxcredit refund) may not always be perceived as sufficiently attractive. The other side of the coin is that, incontrast with a number of other OECD countries, no benefits are lost when entering work in the formalsector -- which provides incentives for integration.
35. According to the views expressed by several private sector representatives, the non-taxation of the informalsector is one of the most serious tax concerns of enterprises in the formal sector.
36. Around one-third of total employment are self-employed, which is comparable to Turkey, Greece and otherLatin American countries, but is a much higher share than in other OECD countries. In the United Statesand Canada, for instance, self-employment is only around 10 per cent of total employment.
37. For example, only 13 per cent of employees of micro enterprises are declared to the social security system(IMSS). Source: Encuesta Nacional de Micronegocios, 1994.

ECO/WKP(2000)6
16
21. Two other potential areas for increasing tax capacity would be excises and taxation of property.On both accounts, Mexico falls behind most other OECD countries and also some of its Latin Americanneighbours (Table 5). With respect to excises, the recent step to increase the tariff rates on gasoline anddiesel should be seen against the fact that fuel prices by international standards are very low in Mexico,although not lower than in the United States and Canada. In contrast to most other OECD countries, whichview inherited wealth as a legitimate base for redistributive taxation, Mexico does not levy taxes onindividuals’ wealth or on inheritance and gifts. Such taxes imply double taxation of capital and may thushave some adverse impact on investment, although this effect is likely to be small in most countries.Moreover, they are often difficult to enforce, and in general they do not provide significant revenues incountries where applied. Taxation of immovable property is administered by the municipalities with the taxbeing levied on the value of property. A main barrier for raising revenue from this tax appears to beinadequate valuation practices and lax local administration and enforcement of collection.
(Table 5. Revenues from property taxation and excises, 1996; gasoline prices, 1998)
Tax administration
22. Significant efforts have been made in the last few years to improve the effectiveness of taxadministration, but there is still scope for improvement in several areas. A major complicating feature fortax administration is the existence of numerous preferential regimes and loopholes, and to a lesser extent,the significant informal sector. The attempts made in recent years to improve administration have covereda broad range of measures. Control of corporate income taxes has been strengthened through the assets tax,which was introduced in 1989 (and later amended on several occasions with the aim of reducing negativeeffects on investment decisions). Tax administration of small enterprises has been made easier by theintroduction of a special regime for small taxpayers, which should also facilitate integration of informalenterprises into the formal economy. Furthermore, the reform of the pension and health-care system isexpected to provide better incentives for tax compliance. Various administrative measures have also beentaken: to enhance control more widely; to specify and improve the legal framework, including sanctionsand penalties in case of fraud (which now include the possibility of prison sentence); and finally, in 1997,to modernise the administration itself by establishing an autonomous administrative body under theMinistry of Finance,38 and creating a professional “career” for employees of the tax administration. Box 6summarises the measures implemented in the last few years to improve collection and control. The reformstrategy mainly relies on tighter supervision of the largest taxpayers, more -- and better targeted -- auditing,as well as tighter surveillance of imports, which typically constitute a “grey area” in terms of taxation.39
With respect to filing requirements, corporate entities in the general regime are obliged to submit detailedinformation to tax authorities on a regular basis. Individual taxpayers with income from more than onesource (and above a certain limit) are obliged to file an annual tax form. Wage income is subject tomonthly withholding of income tax at source, and corporate taxes are paid as monthly advance payments(or quarterly for small enterprises). Taxes on interest payments are withheld at source.
23. Although it is still too early to evaluate the full achievements of the administrative initiatives ofrecent years, some indicators point to improved effectiveness. Fiscal presence, i.e. number of audits pertaxpayer (corporate and self-employed), has thus increased dramatically since 1996 and is now onlyslightly below the level in e.g. Spain. Moreover, there has been a shift in the structure of auditing towards
38. SAT (Tax Administration Service) covers all the four main areas of tax administration: legal interpretation;
auditing; collection; and customs. This is done via 65 local offices, each of which perform all four areaslocally. SAT has some 30 000 employees. Internal control procedures are in place to prevent and detectfraud and corruption within SAT staff.
39. This strategy follows broadly the guidelines recommended in much of the literature on tax administration,including Mansfield (1988) and Tanzi and Pellechio (1995).

ECO/WKP(2000)6
17
specific audits, which have proven to be relatively efficient in terms of revenue collected per auditor. But,even though the reform of administration seems to be moving in the right direction, there is still scope forincreasing effectiveness further -- in terms of integrating registers in the social security system with that oftax authorities; improving import registration and control, for instance by extending even further thealready close co-operation with US and Canadian customs and tax authorities; improving third partyreporting requirements and the processing of tax information, e.g. through simplified individual tax forms,electronic processing etc.; increasing skills at the local tax administrative levels; and strengtheningenforcement and the legal framework for collecting taxes, including legal certainty for tax payers. In thelonger term it would also be appropriate to integrate the municipalities’ registration of street vendors andreal estate valuation registers into the central tax registers.
Box 6. Recent initiatives to improve tax administration and control
Several measures to modernise and simplify the tax administration have been taken in recent years, including:
-- creation of the Tax Administration Service (SAT) from 1 July 1997 as a decentralised institution withbudget and management autonomy, to administer tax and customs policy designed by the Ministry ofFinance and to issue norms to accomplish its function;
-- establishment of a professional career for tax employees;
-- changes in the regulation of consolidated enterprises;
-- changes in definitions and sanctions for tax fraud including strengthening the taxpayers’ legal certainty;
-- new measures against the use of tax heavens;
-- reduction of information requirements in tax forms and requirements to keep accounting records (from 10to 5 year);
-- electronic file returns and payments (e.g. through Internet).
Main developments to improve surveillance and enforcement have been:
-- introduction of a special regime for small enterprises;
-- tightening of transfer pricing rules;
-- shortening the delays for initiating the surveillance process by updating, on a permanent basis, the federaltax registers to be able to identify more rapidly the non-submission of a tax declaration;
-- improved incentives for states to carry out audits more efficiently, as they are allowed to keep additionalrevenues;
-- monitoring changes in taxpayers’ behaviour and differences in contributions over time;
-- identification and registration of the 8 000 largest taxpayers in a special database. These taxpayerscontribute some 60 per cent of all tax revenue. The idea is to develop a close relationship with thesetaxpayers in order to minimise resources devoted to them, thereby freeing up personnel to increase theeffort towards other taxpayers;
-- improved auditing of small and medium-sized enterprises’ issuance of invoices. In the first nine months of1998 nearly 100 000 small and medium-sized enterprises were audited (out of a stock of some five million)compared with only 6 000 in all of 1997. Sanctions were imposed on nearly 70 000 enterprises and some6 000 were closed temporarily. The sample has mainly been chosen in typical “problem areas” like:medicine, restaurants, jewellery stores, construction, material retailers, liquor stores, department stores andshopping malls;
-- more control of VAT evasion and the informal sector by enhanced import registration. Under-valuation andnon-registration of imports are important sources of VAT evasion. Besides being a tax collection problemthe under-valuation of imports creates an unfair competition for the formal private business sector. Adatabase has been constructed to register importers and exporters by tariff codes. The database containsinformation of the volumes and unit prices, making it easier to identify “suspiciously low” unit prices.Exchange of information with US customs, US Internal Revenue Service and the Canadian authorities isincreasing, but it is still far from being fully effective.

ECO/WKP(2000)6
18
The tax system and income distribution40
24. Even though distributional objectives to some extent can be achieved through progressivity in thetax system, it is widely recognised that such objectives are more efficiently handled from the expenditureside. The issues that Mexico will have to address concerning income distribution and taxation thusprimarily involve how much progressivity is needed to raise sufficient revenues in order to allow for morepublic spending -- including on improving distribution. Related concerns would be how incentives areaffected, how the progressivity should evolve along the income scale and to what extent distributionalobjectives can be achieved through progressivity. A major consideration in this respect is how changes inmarginal statutory rates for the most affluent income groups would affect avoidance and evasion, and thusinfluence the actual progressivity of the system (i.e. taxes paid by income deciles).41 The wide incomedistribution in Mexico significantly limits the base for individual income taxation. First, 70 per cent ofwage earners in the formal sectors are not paying income taxes at all, but receive negative tax paymentsfrom the tax credit. Out of 15 million registered individual taxpayers in Mexico, only some four to fivemillion are thus paying income tax -- which should be seen against the needs of a population of 90 millionpeople. Second, although tax rates for high-income individuals are still relatively low in Mexico, there maybe limited scope for significantly increasing their effective tax rates as these income groups may haveaccess to instruments for shifting income into domestic or foreign low-tax regimes. Mexico is thus in linewith an international pattern showing a distinct relationship between income distribution and tax revenue,whereby higher income inequality (after tax), measured by the Gini coefficient, is associated with lowertax revenue as a percentage of GDP (Figure 8).
(Figure 8. Tax revenues and the distribution of income after tax, 1996)
25. The tax system influences the distribution of income, primarily through its overall progressivity,but also indirectly through effects on relative wages and employment.42 The statutory progressivity of theMexican tax system ranks roughly in the middle compared with other OECD countries (Figure 9), whenmeasured as the difference between the top statutory rate and the average tax rate for an averageproduction worker.43 However, as is evident from Figure 10, progressivity in theoretical effective rates(combining the statutory rates, the tax credit and the tax subsidy, as defined above) is much steeper at thelower end of the income scale than for higher incomes, in particular those above ten times the minimumwage. Moreover, progressivity has increased quite sharply since 1993 for incomes between two and fourtimes the minimum wage, due to a proportionally larger reduction in effective tax rates for these incomegroups than for incomes above ten times the minimum wage. This should be seen against a decline in realwages of around 18 per cent since 1994, implying that problems of poverty at lower levels of income, ifanything, have increased.44 The increased progressivity at lower income levels is also likely to have
40. The problems related to income distribution and poverty in Mexico are treated in more depth in the 1995
Economic Survey on Mexico.
41. See Box 8 below, which elaborates on this discussion.
42. Whereas a high progressivity can be a desirable feature of the tax system from distributional objectives, italso tends to imply adverse economic consequences in terms of distorted incentives (not least in terms ofunder-investment in human capital) and increased evasion and avoidance. Moreover, a high overallprogression may in some cases be incompatible with the international mobility of production factors.
43. Unfortunately, the available data for Mexico do not allow for comparisons of income distributions beforeand after tax, as an alternative measure of progressivity. See for instance Norregaard (1990).
44. To the extent that changes in minimum wages have differed from general wage developments thisconclusion could be modified. However, over recent years, minimum wages have generally moved withaverage wages, so that the comparison over time of progressiveness remains valid.

ECO/WKP(2000)6
19
exacerbated problems of under-declaration of income.45 A flattening of the progressivity at the lowerincome levels could, for instance, be achieved by extending the interval over which the tax credit iswithdrawn and widening the brackets of the income-tax system, although this measure would probablyinvolve substantial cost in terms of revenue foregone. Increased progressivity at the higher income levelscould be obtained through higher rates46 or by replacing tax reliefs, which are deducted at the highest rate,with tax credits. The latter option is not likely to be very effective, however, since Mexico only allows forrather limited tax deductions at the individual level. In order to achieve higher actual progressivity forhigh-income earners it would also be necessary to improve enforcement to make the recent increase in topstatutory rates more effective. Another relevant aspect of taxation and progressivity is the allocation ofincome between monetary and non-monetary income. In the case of Mexico, this appears to contribute to ahigher actual progressivity (Box 7), although the effect should probably not be overestimated.
(Figure 9. Overall progressivity of individual income tax systems in selected OECD countries, 1996)
(Figure 10. Theoretical effective tax rates for different levels of income)
Box 7. Income allocation for different income levels
The Mexican after-tax income distribution shows a pattern in which the share of wage income increaseswith overall income, and the share of non-monetary income is highest among the lower-income deciles (Figure 11).Although the share of property income increases with income, it is still a relatively small part of total income at thehighest income decile -- amounting only to around 2.2 per cent of total income. The non-monetary income consists, toa large extent, of own-consumption (for example, of home-grown farm products) at the lower deciles, whereas italmost entirely reflects imputed rent of owner-occupied housing at the higher end of the income scale. Progressivityin the individual income scheme is thus compounded by the differences in monetary versus non-monetary income,and consumption taxes are less regressive than otherwise (ceteris paribus, i.e. even without considering the incidenceof the zero-rated base), due to the distribution of own-consumption.
(Figure 11. Income sources by decile, 1994)
26. Another channel of redistribution is the taxation of consumption. Many OECD countries havetraditionally applied lower rates or exemptions to basic staples like food and medicine in order to introducesome progressivity into the VAT system. This typically implies a considerable dead-weight loss as peopleat higher income levels are compensated most in absolute terms since they consume more of all goods andservices. In the case of Mexico, the total implicit subsidy due to the zero-rating on food can be estimated atsome 1.8 per cent of GDP.47 The distribution by income deciles shows that the highest decile capturesnearly 30 per cent of this amount, while the lowest three deciles together receive only 12 per cent of the
45. This has also provided a stronger incentive to work in the informal sector, at least for individuals with
incomes above three times the minimum wage (i.e. where tax payments become positive). In practice,however, this effect is likely to be of minor importance given the low levels of income in the informalsector.
46. The 1999 tax package increases the top individual statutory rate from 35 per cent to 40 per cent (cf. Box 9).
47. Total consumption of food by private households times the standard rate of 15 per cent (i.e. account is nottaken for the border rate of 10 per cent, but this is not likely to have significant effects). The consumptionof food is approximated from total household expenditure according to the 1996 household survey and therelative weight on food and non-food per decile from the 1994 survey. The estimate of the subsidy does notconsider substitution effects between consumption and savings or within the consumption basket whenprices changes.

ECO/WKP(2000)6
20
value of the subsidy (Figure 12). Measured as a per cent of household income, the implicit subsidyamounts to nearly 4 per cent for the highest decile and 5 per cent for the lowest decile. If the zero-rate onfood were fully eliminated, all else being equal, total tax revenues would increase by the value of thesubsidy, i.e. 1.8 per cent of GDP, or nearly 15 per cent.48 A politically more viable option would probablybe to retain the zero-rating on basic staples, like milk, bread, tortillas and eggs. Applying the zero-ratingonly to these goods would imply an implicit subsidy of only 0.4 per cent of GDP. Moreover,compensating, for example, the first four income deciles for the loss of subsidy on the rest of their foodconsumption (via direct income transfers or an extended tax credit) would only amount to some 0.25 percent of GDP,49 leaving a total budgetary gain of more than 1 per cent of GDP. The extent to whichcompensation should be given through retaining zero-rating on a few basic staples or through expenditureschemes, or both, is a political question tightly linked to the overall distributional objectives. However, itshould not divert attention from the significant budgetary gains that are likely to arise in any circumstancefrom eliminating, or reducing drastically, zero-rating and exemptions in the VAT regime.
(Figure 12. Distribution of implicit VAT subsidy, 1996)
27. If zero-rating and exemption of goods and services were to be completely eliminated, or at leastconcentrated on a few basic staples, the question would arise as to how in practice to provide compensationto the lower-income groups. One way would be to extend the tax credit for these groups by an amountbased on cost-of-living indices for reference low-income families. However, such compensation wouldonly benefit wage earners who work in the formal sector, i.e. a minor part of the population. Anotherpotential problem is that the tax credit payments are administered by the employers, who might be temptedto try to shift higher credit onto lower wages. Fraud could also be a potential problem. A better optionmight be to use the individual pension savings accounts (AFOREs) for workers included in the socialsecurity system into which the government could make direct transfers. The problem would remain,however, of non-coverage of individuals outside the formal sector. The poorest families could becompensated by expanding the targeted poverty-alleviation programme (PROGRESA) to cover a muchlarger number of families. It would probably be more difficult to reach those who are poor, but not poorenough to be covered by PROGRESA, and not working in the formal sector. For these groups, a separatecompensation mechanism would have to be created and eligibility criteria chosen (for instance incomebelow three minimum wages). Still, a number of problems arise besides the political difficulties involvedin overhauling the VAT system. First, the compensation scheme will necessarily increase effectivemarginal tax rates for those not included (even though a gradual phasing out of the compensation couldmitigate this problem). Second, there are no instruments in place to ensure that individuals covered byPROGRESA do not, at the same time, have an AFORE account, thus being compensated twice -- althoughthe risk for overlap is presumably small.50 More significant is the risk that some individuals would havemore than one AFORE account, as is currently the case due to still imperfect registration. Finally, some ofthe increased revenue from the VAT would have to be shared with the states, leaving the marginalbudgetary gain for the federal government somewhat smaller.
48. The “all else being equal” assumption implies, among other things, that potential positive revenue effects
from higher compliance (in the absence of multiple regimes) are not taken into account.
49. This calculation is an approximation that does not consider compensation in terms of maintaining the samebundle of goods or the same utility level. At the practical level this is of minor importance.
50. Furthermore, to the extent such problems exist they could be viewed as a problem of PROGRESAtargeting rather than one of registration.

ECO/WKP(2000)6
21
Box 8. Taxing the affluent more
Given the highly unequal income distribution and low revenue raising capacity in Mexico, taxing thehighest-income individuals more heavily have advantages, although this involves questions about both valuejudgements and economics.1 One possibility would be to raise income-tax rates for the highest-income individuals.The tax revenue effects of such a move are often uncertain due to increased avoidance and evasion incentives for thehigh-income groups -- in particular for countries where top marginal tax rates are already high. This uncertainty, inturn, points to the importance of a strong enforcement of tax compliance to accompany any increase in top marginalrates. There is also a risk that increased taxation could entail a reduction in “entrepreneurial” and other sociallyproductive activity among these tax payers.2 Another pertinent concern, especially for countries with a structural needto increase private savings, is the effect that higher income taxes on the richest individuals would have on total privatesavings. It is often assumed that saving ratios increase with income, thus implying a trade-off between incomedistribution and private savings. However, this assumption could be called into question both empirically andtheoretically: in a life-cycle framework, for instance, there would be a positive savings effect in redistributing incomefrom the elderly to the young through a more progressive tax system (Slemrod, 1998).
Mexico has recently, in its 1999 tax package, opted for increased statutory rates for the highest incomeindividuals. However, the new top marginal rate for individuals -- at 40 per cent on both wage income and dividendincome -- is still among the lowest in OECD and it remains considerably below the top marginal rates on wage anddividend income in the United States and Canada (including state/provincial taxes). Nevertheless, the rise in ratesincreases the importance of further strengthening of enforcement in order to ensure compliance. Other ways of taxingthe affluent more include abolishing some of the exemptions related to taxation of capital income, as well asintroducing gift and inheritance taxes (although this would imply introducing some double taxation of capital). Onealternative could be taxation of (large) real-estate holdings. Real estate taxes are less easy to evade than taxes onfinancial assets and with a sufficiently high minimum limit, it would be possible to achieve a progressive profile.Finally, the massive exemptions and zero-rating in the VAT system subsidise the top income decile households by anaverage of 4 per cent of their disposable income. Therefore reducing the preferential treatment of consumption to aminimum would be one way of taxing the most affluent households at higher effective rates.
_______________________
1. Simple theoretical models of optimal income taxation do not necessarily point to sharply progressive tax structures even ifsociety places a relatively high weight on the welfare of the less well off individuals. This conclusion, though, dependscritically on the sensitivity of labour supply to the after tax wage-rate. With a low elasticity, redistributing income throughthe tax system could take place at low marginal cost, thus implying highly progressive tax structures (Slemrod, 1998).
2. In the United States, where the top 1 per cent of individual tax payers contributes nearly 30 per cent of total federal incometax revenues, there is no solid empirical evidence showing measurable macroeconomic effects of the substantial fluctuationsin income taxation of the rich that has taken place over the 1950-97 period (Slemrod, 1998). Evidence from the Tax ReformAct of 1986, suggests considerable responsiveness in the timing of economic decisions (for instance, the pattern ofrealisation of capital gains) as well as financial and accounting responses (for instance corporations shifting status), whereasthe evidence of the response of real activities by firms and individuals, i.e. with respect to savings, labour supply andinvestment, is more mixed. Evidence from the 1993 marginal tax rise in the United States (OBRA93) also suggests that theresponse to tax changes is to a large extent a question of short-run shifts in the timing of compensation rather than apermanent reduction in taxable income. The dead-weight loss of this particular tax increase, based on short-term elasticities,may thus have been considerable (as much as twice the revenue generated according to Feldstein et. al, 1996), but whenshifts in the timing of e.g. exercising stock options are taken into account, a much lower estimate is found. Correcting forsuch transitory effects, Goolsbee (1997) thus arrives at an estimated dead weight loss of 15-25 per cent of the revenuegenerated.

ECO/WKP(2000)6
22
Fiscal federalism51
28. Sub-national governments (states and municipalities) only collect a small part of total taxrevenues, i.e. around 5 per cent in recent years. This is below the level in most other OECD countries, aswell as Argentina and Brazil, but not much different from the situation in for instance Greece, Portugal andChile (Figure 13).52 On the expenditure side, however, the role for sub-national governments is greaterwith around 20-25 per cent of total expenditure being administered at the state and municipality level.Against this background, the federal government is engaged in a process of strengthening sub-nationalfiscal autonomy by the devolution of additional spending and taxing responsibilities, increasing transfersand improving administrative co-operation between the federation and lower levels of government. In mostrecent years, the spending responsibilities of lower levels of government have increased, in particular,within the areas of education and health care.
(Figure 13. Tax collection by level of government in selected countries, 1996)
29. A key issue is how to ensure spending efficiency and accountability given that the localgovernments are only faced with a small part of the burden of financing. In particular, if the marginalfinancing of spending is (near) zero for the local authorities, moral hazard problems might occur. Thus,while potentially beneficial in terms of allocative efficiency of public expenditure (by bringing thespending decision closer to the needs of the citizens), increased decentralisation also carries considerablerisk: possible loss of macroeconomic and budgetary control by the central government; insufficientadministrative capacity at the local level; higher overall administrative and compliance cost; excessive taxand expenditure competition between different regions; and concessions to local political pressure groups.A major challenge for the Mexican authorities over the coming years would thus be to establishmechanisms whereby further decentralisation can be achieved while limiting the scale of such problems.This may involve careful targeting of grants based on objective expenditure needs (a nationally agreedminimum cost per pupil, per patient etc.), improved information and accounting systems as well enhancedincentives for local governments through tighter links between spending and financing decisions.
30. Financing of sub-national government in Mexico mainly takes place through a revenue-sharingscheme, in which the federal government transfers around 25 per cent of its so-called “sharable” revenue tothe states and municipalities. Most of the transfers are given as unconditional grants. The “sharablerevenue” consists of most federal taxes except for the additional and extraordinary fees from extraction ofpetroleum,53 the federal tax on new motor vehicles and the tax on usage of cars, which are directlyappropriated by the states, and a percentage of excise taxes on tobacco and alcohol. The share of totaltransfers going to each state is primarily determined by its revenue collection capacity (i.e. a sort ofcompensation from the federation for revenue “foregone” by the state) and population size. Athird element, amounting to less than 10 per cent of the total sharable revenues, is used as an equalisationmechanism through which poorer states receive more.
51. This subject is treated at more length in the 1995 Economic Survey of Mexico (Annex II), including a
description of activities and responsibilities of sub-national levels of government in Mexico and otherOECD countries.
52. These numbers do not necessarily reflect the taxing autonomy of sub-national government, in particularbecause they do not reflect revenue sharing arrangements.
53. This exemption implies in certain circumstances that the federal government has an incentive not toincrease the regulated fuel price by too much: if the (sharable) excises are high due to a large differencebetween the regulated price and the world market price, the (non-sharable) oil fees will have to becorrespondingly lower in order not to exceed PEMEX’s 60.8 per cent total contribution.

ECO/WKP(2000)6
23
31. Mexican states face few constitutional limitations as to their taxing powers, but they are inpractice severely restricted by the Law on Fiscal Co-ordination that regulates tax responsibilities betweendifferent levels of government. At present, the states levy a small number of minor taxes, including apayroll tax, a tax on transfer of property, a tax on old motor vehicles, a tax on hotel accommodation and atax on lotteries. In addition, they may levy fees for some public services. The states are also allowed tokeep any additional revenue collected as a result of audits conducted in the area of income tax, assets taxand VAT.54 The municipalities have a constitutional right to tax local real estate and to levy local fees.Even though it would be desirable to increase revenues from immobile property, perhaps evensignificantly, the administrative and political barriers may be prohibitive in the short term. However, in thelonger term, a more adequate valuation and tighter administration of property taxes could turn propertytaxation into a more important source of revenue at the local level. Apart from its benefits in terms ofstrengthening the autonomy and revenue base of municipalities, this would probably have the effect ofplacing more of the tax burden on the income groups with most capacity to pay taxes. In the medium term,other revenue mechanisms could include the possibility of income or consumption (final sales) taxation atthe sub-national level, although problems of administration and mobility may hamper the effectiveness ofsuch taxes. In the process of delegating more responsibility for taxation to sub-national levels ofgovernment, it is imperative that the efforts of states and municipalities to raise revenue are consistent withthe overall aims of the tax system (such as minimising non-neutralities) and that negative externalities onother regions or the federal government are minimised.
Budgetary volatility
32. The budget in Mexico is more exposed to volatility than it is in most other OECD countries.Historically, a major source of this volatility has been macroeconomic instability, partly reflectingmacroeconomic policies in Mexico, but partly also a characteristic of emerging market economiesgenerally. A more specific source of volatility has been movements in world oil prices, given theimportance of the oil sector for the budget and the overall economy. The linkage between oil price changesand the budget is non-trivial. For instance, economic slowdowns or crises in Mexico have often beenassociated with a depreciation of the peso against the US dollar, in which case oil revenues (i.e. royaltycontributions from PEMEX) have increased in peso terms at the same time as revenues from other taxsources were declining. This has historically, i.e. since 1980, resulted in a negative correlation between oiland non-oil revenues. Indeed, the total tax revenue in per cent of GDP (including PEMEX contributions)has been less volatile than the tax revenue excluding PEMEX contributions (Figure 14). However, ingeneral there is not a straightforward and fixed relationship between the developments in oil prices and thereal economy, and hence between oil and non-oil revenues (Figure 15).55
(Figure 14. Coefficient of variation in tax revenue and primary expenditures)
(Figure 15. Oil revenues, oil prices and real GDP growth)
54. Recent changes in the tax responsibilities of local government are described in more detail in Annex I.
55. The episodes of 1983/84 and 1994/95 illustrate how the growth rate of the real economy (and thus thenon-oil tax base) sometimes can be strongly negatively correlated with the change in PEMEXcontributions, whereas the episodes of 1987 and 1990 show the opposite pattern.

ECO/WKP(2000)6
24
33. Another salient feature of Mexico’s budget experience is the high degree of volatility in primaryexpenditure as a percentage of GDP. This is an indication that the impact from revenue shocks on thebudget has, to a large extent, been absorbed through discretionary spending adjustments in order to meetdeficit targets. As a result, pro-cyclicality of government spending has contributed to macroeconomicvolatility.56 The high volatility in expenditure is undesirable from a macroeconomic smoothing point ofview and in terms of its impact on the effectiveness of spending directed at programmes that are essentialfor the longer-term development of the country -- e.g. infrastructure, basic education and health care andpoverty alleviation. This points to the need of promoting a more stable development in both oil and non-oilrevenues. With respect to the latter, broadening the tax base and improving administration as discussedabove, would help to stabilise non-oil revenues -- and thus lessen the budgets dependency on oil revenuesand thereby the vulnerability to exogenous shocks. This, in turn, could pave the way for a sustainable long-term solution to dampen the impact on the budget from fluctuations in oil revenues.
34. There are, in principle, several ways of fully or partially insulating the budget from the directeffects of sharp fluctuations in oil-prices and thus royalty contributions from PEMEX. One solution couldbe to privatise major parts of the oil sector and design the transaction in such a way that it allows asubstantial reduction of the risk borne by the government. However, major privatisations in the oil sectorare probably not an option in the short and medium term. Another solution is the creation of a fund outsidethe government accounts to absorb the direct budgetary effects from short-term fluctuations in oil prices.Although such a fund does not avoid the government sector’s exposure to oil-price volatility, it spreads itover longer time horizons, thereby making it less costly for society.57 Norway and Chile are among thecountries which have opted for some revenue stabilisation via the creation of funds for commodity-relatedrevenues.58 In Mexico, a contingency fund has been established in the budget for 2000. Budget provisionsdetermine that 40 per cent of windfall revenues (above a certain limit) should be deposited in thecontingency fund -- the rest being used for public debt redemption. Windfall revenues might arise, forinstance if the price of oil rises above the budget assumption, but also if economic activity is stronger thanprojected, if tax collection is more effective, or because of other factors. However, no rules have beendrawn on how, or when, to use the proceeds placed in the fund, or on how to invest its assets. Hence, it isstill too early to gauge the practical effects of this initiative on fiscal policy and budgetary volatility.
56. See also the Inter-American Development Bank (1997).
57. A third potential solution could be to link part of government expenditure to oil prices by issuinggovernment debt indexed to the oil price. Such commodity linked securities are not an uncommonphenomenon. However, markets for such bonds are normally less liquid than markets for more ordinaryinstruments, implying a premium. Moreover, investors will have to be compensated for the oil-price risk,so that the overall additional costs of such a programme might outweigh the advantages.
58. Chile’s copper stabilisation fund was established in 1987 in order to mitigate the fiscal impact offluctuations in copper prices (copper is some 40 per cent of Chile’s total exports and the state coppercompany CODELCO normally contributes 5-10 per cent of total tax revenues). The fund receives transfersfrom CODELCO when export prices exceed a certain threshold and transfer resources to the treasury whenprices fall below the threshold. The impact of this stabilisation mechanism has tended to diminish in the1990s as the share of copper produced by private companies has increased strongly. The NorwegianPetroleum Fund, created in 1991, serves a broader purpose: by investing the fiscal surplus in financialassets abroad, the government fund also aims to offset the net currency inflows associated with oil, in orderto stabilise the exchange rate.

ECO/WKP(2000)6
25
V. Conclusion and options for further reform
35. Further reform of the Mexican tax system in order to raise its revenue generating potential is oneof the main keys to dealing properly with many of the challenges facing the economy, including improvingthe physical and human capital stock, i.e. developing the social infrastructure and the health care system.The tax system contains many commendable features that contribute to limiting non-neutralities anddistortions to incentives. Effective average tax rates on consumption, labour and capital appear to be lowcompared with other OECD countries and statutory marginal tax wedges on labour income are alsorelatively modest for most wage levels and family types. The adverse effects from high and volatileinflation are largely neutralised through indexation and the personal and corporate income taxes areintegrated so as to avoid double taxation of dividends and distributed profits. This helps to make the taxsystem reasonably neutral in terms of its impact on different types of investment and financinginstruments.
36. However, with respect to practical implementation there is still ample scope for improvement. Inparticular, the extensive preferential regimes that exist in the taxation of consumption, individual incomeand corporate income should be reduced to a minimum and the administrative surveillance andenforcement should be strengthened further. The administrative improvements should go beyond those thatwould automatically derive from a more comprehensive tax system. Besides increasing the revenuegenerating capacity of the tax system per se such measures taken together would also reduce thedependency of the budget on oil-related income.
37. Reforms to the tax system would have to take into account considerations relating to incomedistribution, expenditure needs and the quality of spending as well as the issue of how to integrate theinformal sector into the formal economy. Another pertinent issue would be the scope for granting localgovernments more taxation and expenditure responsibilities. Many of these elements are stressed in theGovernment’s agenda as laid out in the National Development Plan 1995-2000 and reiterated in 1997 inthe PRONAFIDE, the medium-term programme for financing development. However, the changes made tothe tax system in recent years have generally not succeeded in increasing the tax-to-GDP ratio. The budgetfor 1999 aimed to increase federal government tax revenues by around 1 percentage point of GDP from the1998 outturn (see Box 9). Although this is significant compared with previous efforts, it will still beinsufficient for longer-term spending needs. Additional measures in the area of taxation would thus benecessary in light of the challenges facing the tax system.
38. Substantial changes to existing tax structures -- be they formal or informal, administrative orlegislative -- almost inevitably raise political difficulties. However, efforts to improve the system shouldbenefit from the fact that the general tax regime is in many ways already adequately designed. In any case,the reforms carried out during the past decade cannot achieve their potential unless further steps are taken.A number of specific options, which follow from the above analysis, are listed in Box 10 below. Some ofthese could be seen as medium-term recommendations, rather than immediate priorities, and in generalchanges will have to be implemented gradually and with due consideration to balancing the interests ofthose being affected. Even though the recommendations could in principle be implemented on an à la cartebasis, it should be emphasised that the package of measures, if implemented as a whole would be muchmore efficient and balanced than individual measures taken in isolation. If all of these initiatives wereimplemented together, they could raise tax revenue by some 3 percentage points of GDP, which seems toprovide a reasonable benchmark for Mexico in the medium term.

ECO/WKP(2000)6
26
Box 9. Changes to the tax system contained in the budget for 1999
The individual tax rate is increased from 35 per cent to 37.5 per cent for annual incomes above 1.5 millionpesos and 40 per cent for annual incomes above 2 million pesos. Taxes on interest payments are modified accordinglyand the exemption on interest income from long term bonds is eliminated. The corporate income tax rate is lowered to32 per cent in 1999 and to 30 per cent in 2000 for retained earnings, while the rate for dividends is increased from 34to 35 per cent. The immediate deduction scheme for investment outside the metropolitan areas of Mexico City,Monterey and Guadalajara, as well as for small and medium-sized firms, is abolished and consolidation rules aretightened. An increase in the tax on alcohol and beverages, which was introduced for one year in 1998, is maintained.Import tariffs have been raised for countries which do not have a free trade agreement with Mexico (the surcharge is3 per cent for capital, intermediate and basic consumption goods; 10 per cent for other consumption goods).
Raising the top statutory rates to 37.5 and 40 per cent is warranted from a revenue and distributional pointof view, although increased avoidance and evasion at higher levels of income to some extent could reduce the effectof this change. The taxation of interest income from long term bonds is a step forward in reducing distortions betweencapital and debt financing.
The changes made to corporate taxation have both benefits and drawbacks in terms of neutrality and theirrevenue-raising capacity. The tightening of consolidation rules is a step forward as it improves equity and reducescomplexity and distortions (such as the incentive to preserve economically inefficient enterprises for tax purposes) aswell as problems of tax segmentation and avoidance. The reduction of the statutory rate on retained earnings and theelimination of the immediate deduction scheme could be considered as a package aiming at keeping the overalleffective tax rates for corporations roughly unchanged while reducing tax expenditure and distortions implied by theimmediate deduction scheme. These distortions arose because only firms with a tax liability would benefit from thescheme, implying that the scheme was procyclical and that it introduced a bias against new firms and firms in highgrowth sectors. Moreover, it enhanced the possibilities for tax avoidance through transfer pricing. The lowering of thecorporate rate should also be seen against the tendency in other OECD-countries and Latin American countries toreduce taxation of capital. However, given the relatively light taxation of capital in Mexico and the level of statutorycorporate rates, it is not evident that the elimination of the immediate deduction scheme would necessitate a loweringof the rates -- on the contrary, the needs for raising revenues would suggest that the corporate rate should not havebeen lowered. Moreover, by introducing a wedge between dividends (taxed at a marginal rate of 40 per cent) andretained earnings (taxed at 30 per cent), a bias in favour of financing through retained earnings is created. The adverseeffects of this change on capital allocation may be small though, as the share of distributed profits is relatively low inMexico and because debt financing in any circumstance may be difficult to obtain for small and medium-sizedenterprises.
Finally, the 1999 tax package contains a number of measures to curb evasion and informal sector activities,including: additional powers of the tax authority to incorporate new taxpayers (and thereby immediately initiate a taxaudit), a change in the alcohol excise tax structure (i.e. the excise will only be applied at the producer level), a changein tax subject for specific operations in VAT (for certain operations between enterprises and individuals-- e.g. consulting -- the firm will retain the VAT and pay it directly to the government instead of paying it to theprovider) and the elimination of the zero VAT rate for “indirect exporters”.
39. In addition to the specific recommendations, two more areas have been identified where actionmight be appropriate -- at least in the longer term. First, in attempting to manage the informal economy, thegovernment should use a “carrot and stick” approach that involves providing services in the formal sectorthat will attract potential taxpayers into the formal sector, i.e. law enforcement, in-work benefits, adequatesocial insurance, etc. The stick would then be coercive tax enforcement and control. Besides the beneficialsocial and economic consequences from integrating the informal economy, there would also be positivelong-run effects on government tax revenues. The steps taken in terms of the reform of the pension systemand the health insurance are important in this respect, as are the recent efforts of improving the taxadministration, the introduction of the small taxpayers regime and several of the measures taken for 1999.However, further initiatives along the lines described above will still be needed in the medium to longterm.

ECO/WKP(2000)6
27
40. Finally, a transparent and autonomous stabilisation fund for oil revenues from PEMEX couldcontribute to ensuring greater stability for both revenue and expenditure. More important, however, is thefact that Mexico, as an emerging market economy, is more exposed to shocks arising in internationalmarkets than most other OECD countries. This underlines the need for a firm medium-term reference tosupport a stability-oriented macroeconomic policy.
Box 10. Strengthening tax revenue: a synopsis of policy recommendations
The VAT regime: the extensive zero-rating of goods should be limited to a few basic staples; the zero-ratingfor agriculture and fishing activities and the exemptions for land transportation should be eliminated; and thepreferential border rate at 10 per cent should be changed to the standard rate (since the gains from a uniform rate in alllikelihood will significantly exceed the short term losses that might arise from possible harmful impacts on localMexican business in border areas). VAT is normally easy to administer and control, as two sides of the transactionsuntil the final transaction is reported to the authorities. Moreover, it is an easy and efficient way to ensure that at leastsome tax revenues are raised from the informal sector. The current regime dilutes the neutrality of the consumptiontax, limits the revenue deriving from individuals working in the informal sector and is a very inefficient mechanismfor redistribution of income. Moreover, it considerably complicates administration, creating numerous possibilities ofevasion and fraud. Compensation to low-income groups -- although not a trivial administrative and politicalproblem -- could be provided directly through various transfer mechanisms (including the use of individual AFOREsaccounts and PROGRESA, for instance), but it could also take the form of in-kind benefits (school-based foodprogrammes for children, food coupons, hospital or doctor-based nutrition programmes for pregnant women, etc.).
Corporate taxes: the simplified regime for agriculture and land transportation should be abolished, asshould the special rate regime for agriculture, publishing, etc. The small taxpayers’ regime should be preserved as away to encourage greater integration of informal sector activity and to lower administrative costs. The assets taxshould be maintained due to its importance as a controlling device. A further tightening of consolidation rules couldbe considered.
Individual income taxes: fringe benefits should be taxed and the fiscal subsidy eliminated. Taxing fringebenefits could potentially pose some additional administrative difficulties; on the other hand the elimination of thefiscal subsidy is likely to yield a non-negligible administrative relief. The proceeds of such changes might partly beused to reduce progressivity at the low- to medium-income levels.
Property taxes -- in particular real estate taxes -- should be increased, primarily by encouraging localgovernment to make more adequate valuations and improve collection efforts. This would enhance the overallrevenue base which supports local government finances, and it would probably be relatively progressive in its overallincidence.
Administration and enforcement should be strengthened by: increasing the number of trained personal, inparticular at the local level; integrating registers of the social security system with that of tax authorities; enhancingimport registration and control; improving auditing by further increasing the incentives for states to audit;strengthening legal certainty and enforcement; simplifying procedures for tax payments; and strengthening the effortagainst high income activities in the informal sector.
ECO/WKP(2000)6
28
TABLES AND FIGURES
List of tables
1. Estimates of informal sector size in selected countries2. Tax progressivity and distribution of wage-earners, 19973. Required real pre-tax rates of return, 19984. Indicators of VAT compliance and productivity5. Revenues from property taxation and excises, 1996; gasoline prices, 1998
List of figures
1. Tax revenues and the level of income, 19962. General government expenditure -- average 1990-19963. Total tax revenues4. Tax mix in Mexico, 1980-19965. Tax mix in selected countries, 19966. Marginal tax wedges by family type and wage level, 19967. Average effective tax rates8. Tax revenues and the distribution of income after tax, 19969. Overall progressivity of individual income tax systems in selected OECD countries, 199610. Theoretical effective tax rates for different levels of income11. Income sources by decile, 199412. Distribution of implicit vat subsidy, 199613. Tax collection by level of government in selected countries, 199614. Coefficient of variations in tax revenue and primary expenditures15. Oil revenues, oil prices and real GDP growth

ECO/WKP(2000)6
29
Table 1. Estimates of informal sector size in selected countries1
Informal sector employment in per cent of non-agricultural employment, mid-1990’s
Per cent
ILO estimates2 OECD estimates3
Mexico 57 20 - 44
Argentina 53 --
Brazil 56 --
Chile 51 --
Turkey -- 21
1. These estimates are subject to considerable uncertainty.
2. ILO, “World Employment 1996/97; National Policies in a Global Context”.
3. Estimates published in OECD, Economic Survey of Mexico, (1997) and OECD, Economic Survey of Turkey, (1996).
Source: Ministry of finance.

ECO/WKP(2000)6
30
Table 2. Tax progressivity and distribution of wage-earners, 19971
Income expressed asa multiple of
minimum wage
Theoreticaleffective tax rate2
Number of workers(thousands)
Number of workers(per cent of total)
Cumulated number ofworkers
(per cent of total)
1 -22.3 1980.7 18.7 18.72 -7.4 3740.3 35.2 53.9
3 -1.7 1785.2 16.8 70.7
4 3.4 920.2 8.7 79.3
5 6.4 590.5 5.6 84.9
7 11.0 597.3 5.6 90.5
10 15.6 407.4 3.8 94.4
15 19.3 274.6 2.6 96.9
19 21.3 111.0 1.0 98.0
20 21.7 18.5 0.2 98.2
24 23.1 62.4 0.6 98.7
25+ 23.4 133.3 1.3 100.0
Total -- 10621.4 100.0 --
1. Based on IMSS data as a proxy for number of workers by tax bracket.
2. The theoretical effective tax rates combine for each income category the statutory rate, the tax credit and the tax subsidy, andthus measure the taxes expected to be paid under full compliance with the tax law. Fringe benefits are assumed to account forone-third of total remuneration.
Source: Ministry of finance.
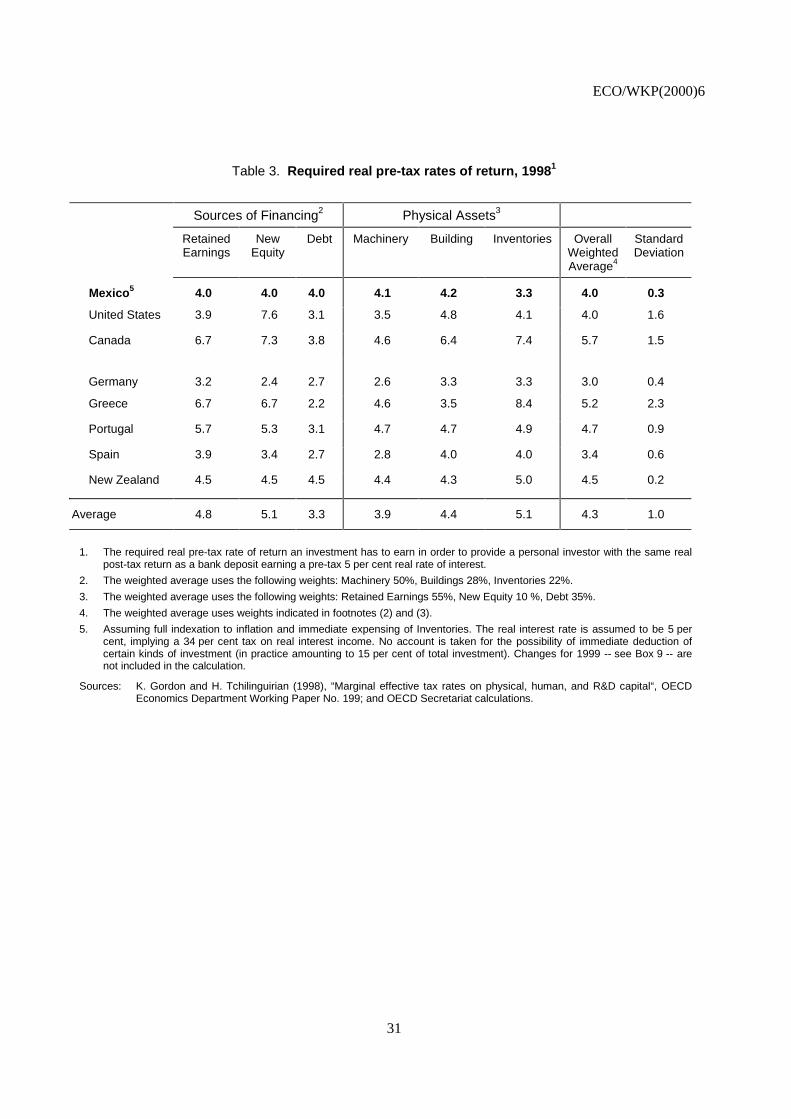
ECO/WKP(2000)6
31
Table 3. Required real pre-tax rates of return, 19981
Sources of Financing2 Physical Assets3
RetainedEarnings
NewEquity
Debt Machinery Building Inventories OverallWeightedAverage4
StandardDeviation
Mexico5 4.0 4.0 4.0 4.1 4.2 3.3 4.0 0.3
United States 3.9 7.6 3.1 3.5 4.8 4.1 4.0 1.6
Canada 6.7 7.3 3.8 4.6 6.4 7.4 5.7 1.5
Germany 3.2 2.4 2.7 2.6 3.3 3.3 3.0 0.4
Greece 6.7 6.7 2.2 4.6 3.5 8.4 5.2 2.3
Portugal 5.7 5.3 3.1 4.7 4.7 4.9 4.7 0.9
Spain 3.9 3.4 2.7 2.8 4.0 4.0 3.4 0.6
New Zealand 4.5 4.5 4.5 4.4 4.3 5.0 4.5 0.2
Average 4.8 5.1 3.3 3.9 4.4 5.1 4.3 1.0
1. The required real pre-tax rate of return an investment has to earn in order to provide a personal investor with the same realpost-tax return as a bank deposit earning a pre-tax 5 per cent real rate of interest.
2. The weighted average uses the following weights: Machinery 50%, Buildings 28%, Inventories 22%.
3. The weighted average uses the following weights: Retained Earnings 55%, New Equity 10 %, Debt 35%.
4. The weighted average uses weights indicated in footnotes (2) and (3).
5. Assuming full indexation to inflation and immediate expensing of Inventories. The real interest rate is assumed to be 5 percent, implying a 34 per cent tax on real interest income. No account is taken for the possibility of immediate deduction ofcertain kinds of investment (in practice amounting to 15 per cent of total investment). Changes for 1999 -- see Box 9 -- arenot included in the calculation.
Sources: K. Gordon and H. Tchilinguirian (1998), “Marginal effective tax rates on physical, human, and R&D capital“, OECDEconomics Department Working Paper No. 199; and OECD Secretariat calculations.

ECO/WKP(2000)6
32
Table 4. Indicators of VAT compliance and productivity
Per cent
VAT Compliance1
(1993)VAT Productivity2
(1996)Effective VAT rate3
in per cent of standard rate(1996)
Mexico 63 19 29
Canada 77 37 62
Germany -- 45 77
Greece -- 51 61
Portugal 86 47 79
Spain -- 34 59
New Zealand 95 68 123 4
Turkey -- 40 61
Argentina 69 10 --
Chile 77 51 --
1. VAT compliance is VAT actually paid in per cent of theoretical VAT collected under full compliance with existing tax laws.
2. VAT productivity is VAT revenue in per cent of GDP divided by standard VAT rate.
3. Effective VAT rate is VAT revenue divided by base (i.e. consumption).
4. The general sales tax at standard rate is levied on 60 per cent of the value of the supply for long term stay in a commercialdwelling which may partly explain why the number exceeds 100.
Sources: Ministry of Finance; OECD Revenue Statistics; National Accounts; IMF, Government Finance Statistics; OECD,Economic Survey of Turkey (1997); and OECD Secretariat calculations.

ECO/WKP(2000)6
33
Table 5. Revenues from property taxation and excises, 1996; gasoline prices, 1998
Taxes on propertyper cent GDP
(1996)
Excisesper cent GDP
(1996)
Unleaded gasoline priceincluding taxes US Dollars/litre
(2nd Quarter 1998)
Mexico 0.3 1.2 0.40
United States 3.1 1.5 0.33
Canada 3.8 2.0 0.35
Germany 1.1 2.8 0.91
Greece 1.4 6.1 0.70
New Zealand 2.0 2.0 0.44
Portugal 0.9 5.1 0.90
Spain 1.9 2.7 0.75
Turkey 0.5 0.3 0.73
Argentina1 1.4 1.0 --
Brazil2 0.4 -- --
Chile 0.1 2.0 --
1. Figures for Argentina are for 1992.
2. Figures for Brazil are for 1993.
Sources: OECD, Revenue Statistics; IMF, Government Finance Statistics; IEA, Energy prices and taxes, 2nd Quarter 1998.

ECO/WKP(2000)6
34
Figure 1. TAX REVENUES AND THE LEVEL OF INCOME, 1996 (1)
0 5 10 15 20 25 300
5
10
15
20
25
30
35
40
45
50
55
0
5
10
15
20
25
30
35
40
45
50
55
Japan
GermanyCanada
Australia
Austria
Czech Republic
Denmark
Finland
Hungary
Ireland
NorwayPoland
Portugal
Sweden
Switzerland
Chile
Brazil
ColombiaPeruVenezuela
TurkeyKorea
Mexico*
Mexico**
New Zealand
Italy Netherland
United States
Belgium
United Kingdom
France
spain
Tax revenue/GDP, % Tax revenue/GDP, %
GDP per capita in thousand $ (PPP)
1. General Government, including social security contributions. 1996 or nearest year available.* Mexico including PEMEX contributions.** Mexico excluding PEMEX contributions.
Sources:OECD, Revenue Statistics ; IMF, Government Finance Statistics Yearbook, 1995 and 1996 issues.

ECO/WKP(2000)6
35
Figure 2. GENERAL GOVERNMENT EXPENDITURE - AVERAGE 1990-1996As a percentage of GDP
0
10
20
30
40
50
60
0
10
20
30
40
50
60
Mexico(1)Argentina(2)
Chile(3)Turkey
Brazil(4)United States
New ZealandPortugal
SpainGreece
CanadaGermany
% %
1. Mexico: federal government only.2. Argentina: average for years 1990 to 1992.3. Chile: central government only.4. Brazil: average for years 1991 to 1995.
Sources:OECD, Economic Outlook, Economic Surveys various issues ; IMF, Government Finance Statistics.
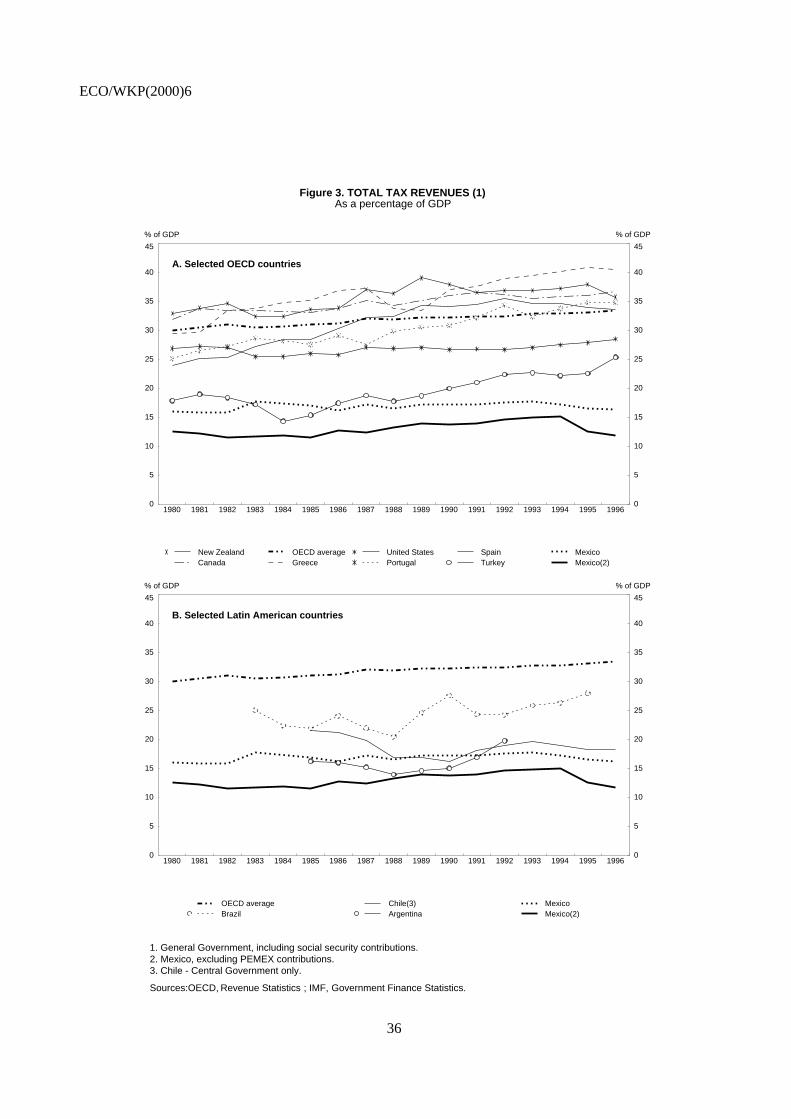
ECO/WKP(2000)6
36
Figure 3. TOTAL TAX REVENUES (1)As a percentage of GDP
1980 1981 1982 1983 1984 1985 1986 1987 1988 1989 1990 1991 1992 1993 1994 1995 19960
5
10
15
20
25
30
35
40
45
0
5
10
15
20
25
30
35
40
45
% of GDP % of GDP
A. Selected OECD countries
New ZealandCanada
OECD averageGreece
United StatesPortugal
SpainTurkey
MexicoMexico(2)
1980 1981 1982 1983 1984 1985 1986 1987 1988 1989 1990 1991 1992 1993 1994 1995 19960
5
10
15
20
25
30
35
40
45
0
5
10
15
20
25
30
35
40
45
% of GDP % of GDP
B. Selected Latin American countries
1. General Government, including social security contributions. 2. Mexico, excluding PEMEX contributions. 3. Chile - Central Government only.
Sources:OECD, Revenue Statistics ; IMF, Government Finance Statistics.
OECD averageBrazil
Chile(3)Argentina
MexicoMexico(2)

ECO/WKP(2000)6
37
Figure 4. TAX MIX IN MEXICO, 1980-1996 (1)
1. General Government.
0
1
2
3
4
5
6
7
0
1
2
3
4
5
6
7
1980 1981 1982 1983 1984 1985 1986 1987 1988 1989 1990 1991 1992 1993 1994 1995 1996
PEMEX contributions Taxes on income, profits and capital gains
Value added taxes
Social Security & Payroll Taxes
Other consumption taxes
Taxes on property & other taxes
% of GDP % of GDP
A. Main components in per cent of GDP
0
2
4
6
8
10
12
14
16
18
20
22
0
2
4
6
8
10
12
14
16
18
20
22
1980 1981 1982 1983 1984 1985 1986 1987 1988 1989 1990 1991 1992 1993 1994 1995 1996
Taxes on income, profits and capital gains
Value added taxes
Other consumption taxes
Taxes on property & other taxes
Social Security & Payroll Taxes
PEMEX contributions
Total Tax Revenues
Total Revenues
% of GDP % of GDP
B. Total revenue in percent of GDP
Source: OECD, Revenue Statistics.

ECO/WKP(2000)6
38
Figure 5. TAX MIX IN SELECTED COUNTRIES, 1996 (1)
0
10
20
30
40
50
60
70
80
90
100
0
10
20
30
40
50
60
70
80
90
100
Uni
ted
Sta
tes
Can
ada
Ger
man
y
Gre
ece
New
Zea
land
Por
tuga
l
Spa
in
Tur
key
OE
CD
(2)
Bra
zil(3
)
Chi
le
Mex
ico
% %
Sources:OECD, Revenue Statistics ; IMF, Government Finance Statistics.
Social Security & Payroll taxesOther taxes, including property taxesConsumption taxesIndividual Income taxCorporate tax
1. General government. Contributions from fiscal monopolies are not included (i.e. PEMEX contributions are excluded for Mexico).2. Unweighted average.3. Figures for Brazil are for 1995.
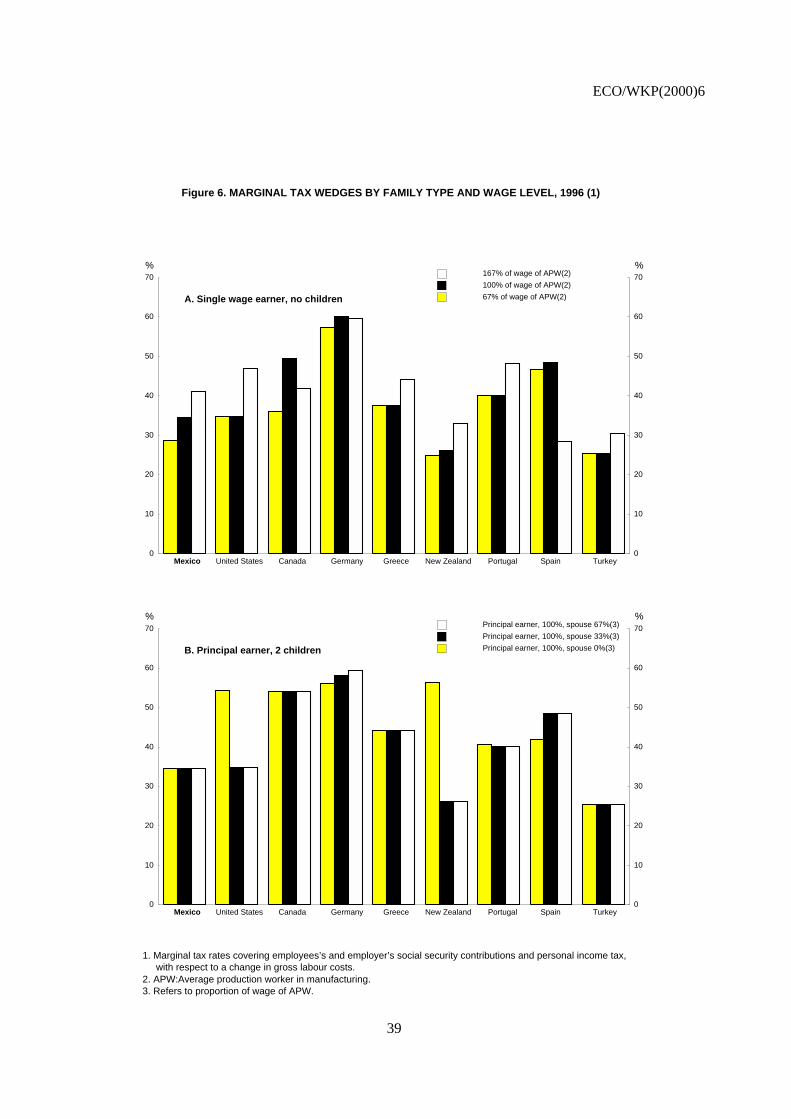
ECO/WKP(2000)6
39
Figure 6. MARGINAL TAX WEDGES BY FAMILY TYPE AND WAGE LEVEL, 1996 (1)
0
10
20
30
40
50
60
70
0
10
20
30
40
50
60
70
Canada Germany Greece Portugal Spain TurkeyMexico United States New Zealand
67% of wage of APW(2)
100% of wage of APW(2)
167% of wage of APW(2)
A. Single wage earner, no children
% %
0
10
20
30
40
50
60
70
0
10
20
30
40
50
60
70
Canada Germany Greece Portugal Spain TurkeyMexico United States New Zealand
Principal earner, 100%, spouse 0%(3)
Principal earner, 100%, spouse 33%(3)
Principal earner, 100%, spouse 67%(3)
B. Principal earner, 2 children
1. Marginal tax rates covering employees’s and employer’s social security contributions and personal income tax, with respect to a change in gross labour costs.2. APW:Average production worker in manufacturing.3. Refers to proportion of wage of APW.
% %
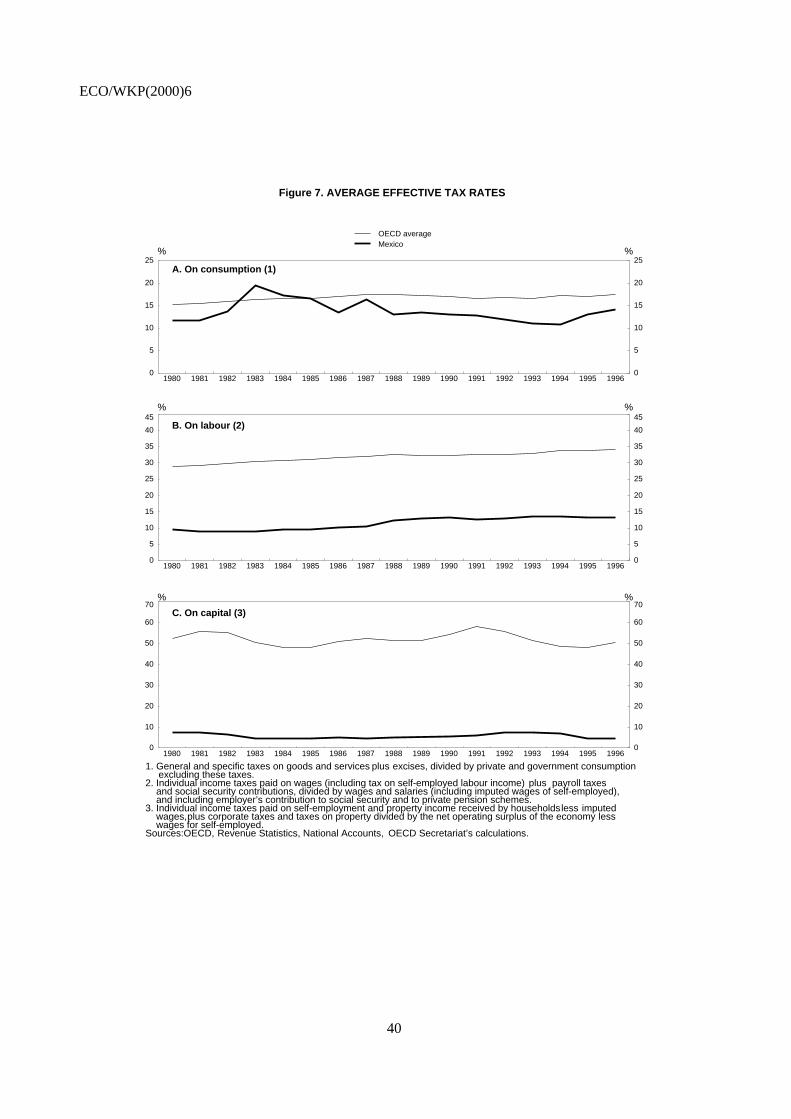
ECO/WKP(2000)6
40
Figure 7. AVERAGE EFFECTIVE TAX RATES
1980 1981 1982 1983 1984 1985 1986 1987 1988 1989 1990 1991 1992 1993 1994 1995 19960
5
10
15
20
25
0
5
10
15
20
25A. On consumption (1)
% %
OECD averageMexico
1980 1981 1982 1983 1984 1985 1986 1987 1988 1989 1990 1991 1992 1993 1994 1995 19960
5
10
15
20
25
30
35
40
45
0
5
10
15
20
25
30
35
40
45B. On labour (2)
% %
1980 1981 1982 1983 1984 1985 1986 1987 1988 1989 1990 1991 1992 1993 1994 1995 19960
10
20
30
40
50
60
70
0
10
20
30
40
50
60
70
1. General and specific taxes on goods and services plus excises, divided by private and government consumption excluding these taxes.2. Individual income taxes paid on wages (including tax on self-employed labour income) plus payroll taxes and social security contributions, divided by wages and salaries (including imputed wages of self-employed), and including employer’s contribution to social security and to private pension schemes.3. Individual income taxes paid on self-employment and property income received by households less imputed wages,plus corporate taxes and taxes on property divided by the net operating surplus of the economy less wages for self-employed.Sources:OECD, Revenue Statistics, National Accounts, OECD Secretariat’s calculations.
C. On capital (3)
% %

ECO/WKP(2000)6
41
Figure 8. TAX REVENUES AND THE DISTRIBUTION OF INCOME AFTER TAX, 1996 (1)
0.65 0.60 0.55 0.50 0.45 0.40 0.35 0.30 0.250
5
10
15
20
25
30
35
40
45
50
55
0
5
10
15
20
25
30
35
40
45
50
55
United States Japan
Germany
France
Canada
Australia
AustriaBelgium
Denmark
Finland
New Zealand
Poland
Spain
Chile
Brazil
Colombia PeruVenezuela
TurkeyKorea
Czech Republic
Sweden
Hungary NorwayNetherlands
Italy
Switzerland PortugalUnited Kingdom
Ireland
Mexico*
Mexico**
Total tax/GDP, % Total tax/GDP, %
Gini coefficient (2)
1. General Government, including social security contributions. 1996 or nearest year available.2. The Gini coefficient is a measure of income inequality: the higher the coefficient, the wider the income distribution.* Mexico including PEMEX contributions.** Mexico excluding PEMEX contributions.
Sources:OECD, Revenue Statistics ; IMF, Government Finance Statistics Yearbook, 1995 and 1996 issues.

ECO/WKP(2000)6
42
Figure 9. OVERALL PROGRESSIVITY OF INDIVIDUAL INCOME TAX SYSTEMS IN SELECTED OECD COUNTRIES (1), 1996
0
5
10
15
20
25
30
35
0
5
10
15
20
25
30
35
GermanyNew Zealand
CanadaUnited States
MexicoGreece
SpainPortugal
Turkey
% points % points
1. Progressivity is measured as the difference between the top marginal personal income tax rate (including social security contributions) and the average statutory tax rate for an average production worker.
Source: OECD, Tax Database, Tax/Benefit Positions of Employees, Tax Equations and OECD secretariat’s calculations.
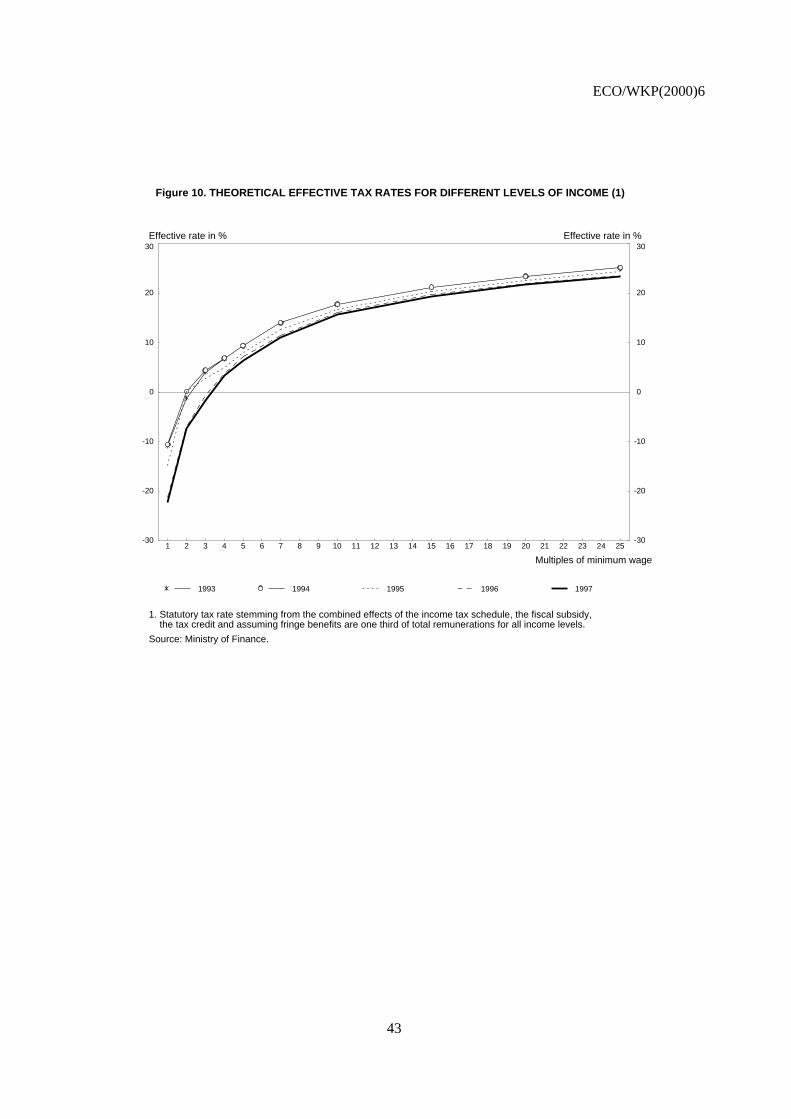
ECO/WKP(2000)6
43
Figure 10. THEORETICAL EFFECTIVE TAX RATES FOR DIFFERENT LEVELS OF INCOME (1)
1 2 3 4 5 6 7 8 9 10 11 12 13 14 15 16 17 18 19 20 21 22 23 24 25-30
-20
-10
0
10
20
30
-30
-20
-10
0
10
20
30Effective rate in % Effective rate in %
Multiples of minimum wage
1. Statutory tax rate stemming from the combined effects of the income tax schedule, the fiscal subsidy, the tax credit and assuming fringe benefits are one third of total remunerations for all income levels.
Source: Ministry of Finance.
1993 1994 1995 1996 1997

ECO/WKP(2000)6
44
Figure 11. INCOME SOURCES BY DECILE, 1994
0
10
20
30
40
50
60
70
80
90
100
0
10
20
30
40
50
60
70
80
90
100
I II III IV V VI VII VIII IX X Decile
Source: INEGI, Encuesta nacional de ingresos y gastos de los hogares 1994, México, 1995.
% %
Non-monetary income (1)Other monetary incomeProperty incomeEntrepreneurial incomeSalaries
1. Including consumption of self-production, imputed rent of owner-occupied housing, etc.

ECO/WKP(2000)6
45
Figure 12. DISTRIBUTION OF IMPLICIT VAT SUBSIDY, 1996 (1)
0
5
10
15
20
25
30
35
0
1
2
3
4
5
6
7
8
I II III IV V VI VII VIII IX X Decile
Per cent of total subsidy (left scale)
Per cent of income (right scale) (2)
% %
1. The implicit VAT subsidy at each income decile is estimated by total expenditure on food multiplied by the standard VAT rate of 15 per cent. The consumption of food is approximated from total household expenditure according to the 1996 household survey and the relative weight on food and non-food per decile from the 1994 survey. The estimate of subsidy does not consider substitution effects between consumption and savings or within the consumption basket when prices changes. 2. Income per decile is from the INEGI 1996 Household Survey. Sources: INEGI, Encuesta nacional d’ingresos y gastos de los hogares 1994 and 1996, México ; OECD secretariat’scalculations.
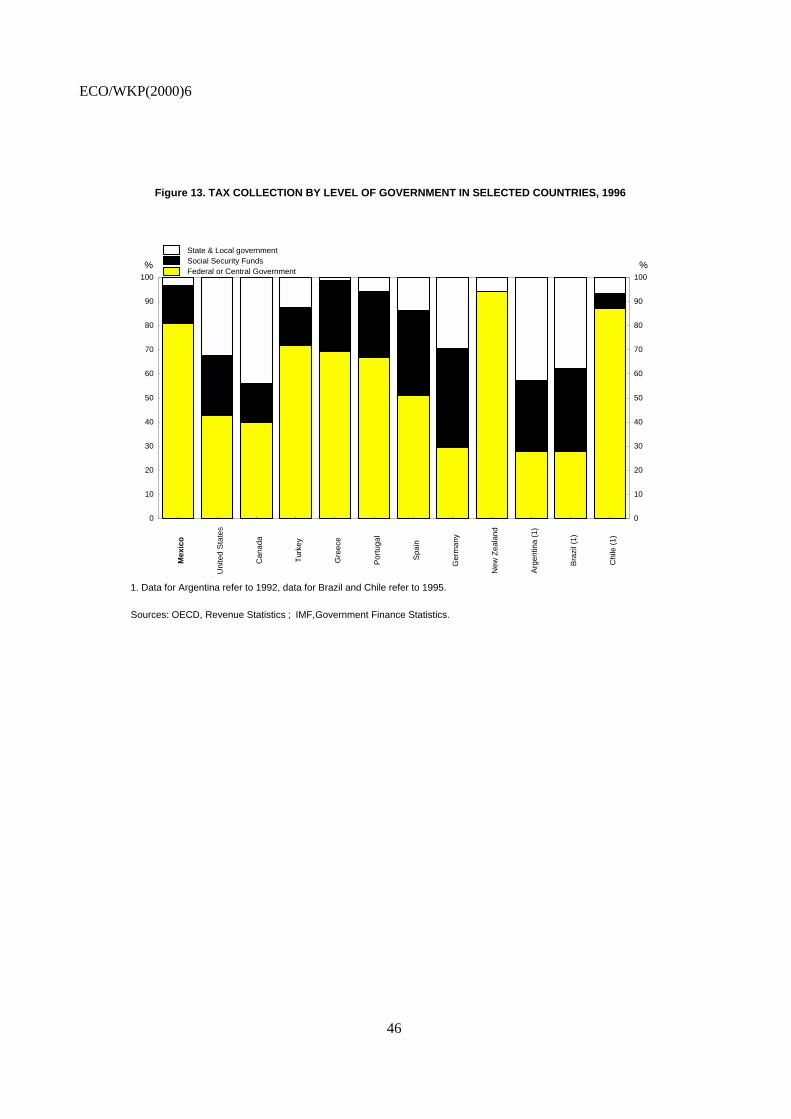
ECO/WKP(2000)6
46
Figure 13. TAX COLLECTION BY LEVEL OF GOVERNMENT IN SELECTED COUNTRIES, 1996
0
10
20
30
40
50
60
70
80
90
100
0
10
20
30
40
50
60
70
80
90
100
Uni
ted
Sta
tes
Can
ada
Tur
key
Gre
ece
Por
tuga
l
Spa
in
Ger
man
y
New
Zea
land
Arg
entin
a (1
)
Bra
zil (
1)
Chi
le (
1)
Mex
ico
Sources: OECD, Revenue Statistics ; IMF,Government Finance Statistics.
% %
State & Local governmentSocial Security FundsFederal or Central Government
1. Data for Argentina refer to 1992, data for Brazil and Chile refer to 1995.

ECO/WKP(2000)6
47
Figure 14. COEFFICIENT OF VARIATION IN TAX REVENUE AND PRIMARY EXPENDITURES (1)As a percentage of GDP
0 2 4 6 8 10 12 14 16 18 200
2
4
6
8
10
12
14
16
18
20
0
2
4
6
8
10
12
14
16
18
20
United States
Japan
GermanyFrance
ItalyDenmark
Greece
Brazil
Chile
New Zealand Spain
TurkeyArgentina
United Kingdom
Canada
Portugal
Mexico**Mexico*
Primary expenditures/GDP, %
Total tax revenues/GDP, %
Primary expenditures/GDP, %
1. The coefficient of variation is the standard deviation divided by the average of the tax/GDP ratio (including social security contributions) and primary expenditures in per cent of GDP of general government (Mexico is federal government only). Sample period is 1980 to 1996 for all countries except Argentina (1985 to 1992), Chile (1985 to 1994 for primary expenditures, 1985 to 1996 for tax revenues - figures for central government only), and Brazil (1983 to 1993 for primary expenditures and 1983 to 1995 for tax revenues).* Total tax revenues including PEMEX contributions.** Total tax revenues excluding PEMEX contributions.
Sources:OECD, Revenue Statistics, Analytical Data Bank ; IMF,Government Finance Statistics ; OECD Secretariat’s calculations.
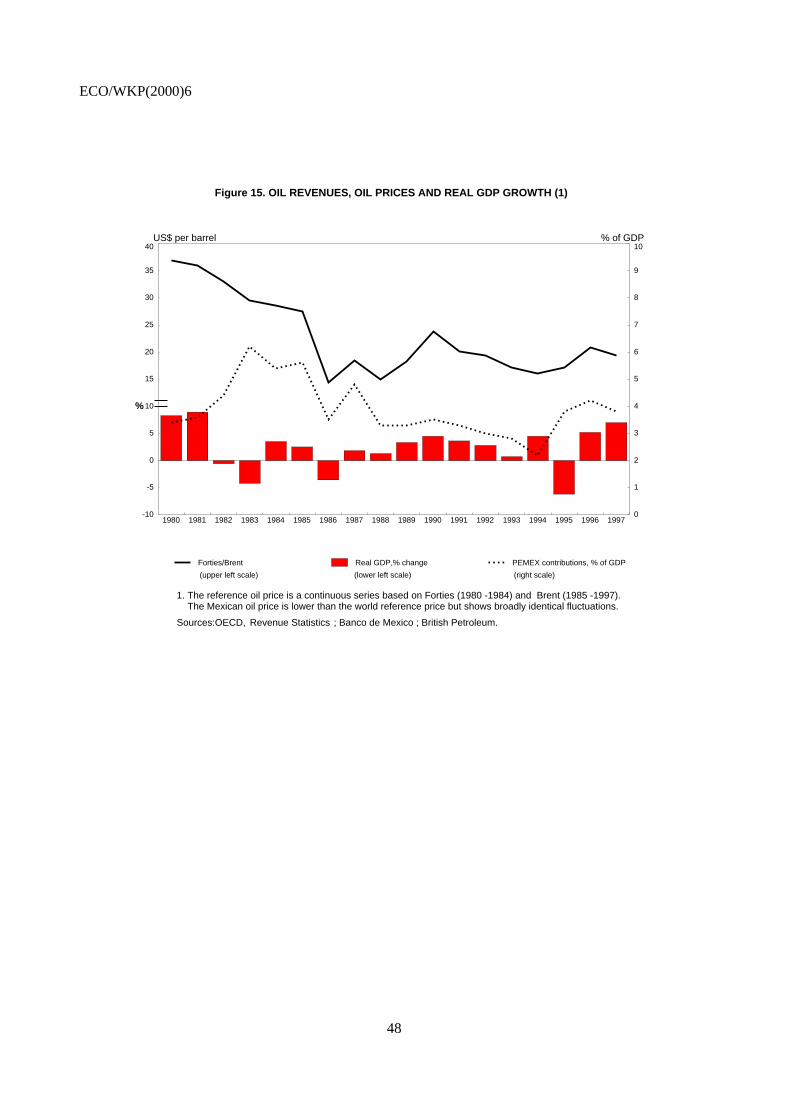
ECO/WKP(2000)6
48
Figure 15. OIL REVENUES, OIL PRICES AND REAL GDP GROWTH (1)
1980 1981 1982 1983 1984 1985 1986 1987 1988 1989 1990 1991 1992 1993 1994 1995 1996 1997-10
-5
0
5
10
15
20
25
30
35
40
0
1
2
3
4
5
6
7
8
9
10
(upper left scale) (lower left scale) (right scale)
US$ per barrel % of GDP
%
1. The reference oil price is a continuous series based on Forties (1980 -1984) and Brent (1985 -1997). The Mexican oil price is lower than the world reference price but shows broadly identical fluctuations.
Sources:OECD, Revenue Statistics ; Banco de Mexico ; British Petroleum.
Forties/Brent Real GDP,% change PEMEX contributions, % of GDP

ECO/WKP(2000)6
49
Annexes
Annex I. Summary of tax reform measures, 1987-98
Annex II. Main issues in the tax mix discussion in OECD countries in the 1990s
Annex III. The statutory tax regime, 1998
List of annex tables
A1. Main features of the tax system, 1998A2. Rates and structure of income tax on individuals, 1998A3. Statutory rates and rules for taxation of corporations, 1998A4. Main features of VAT systems in selected countries, 1997
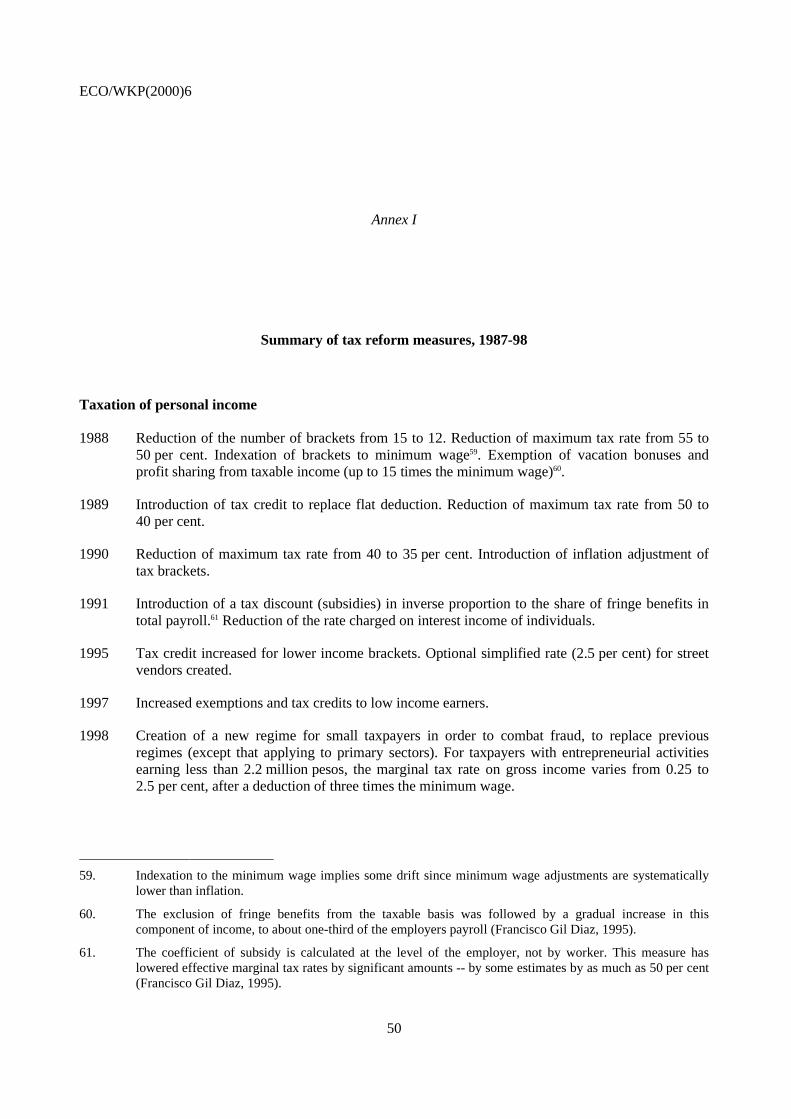
ECO/WKP(2000)6
50
Annex I
Summary of tax reform measures, 1987-98
Taxation of personal income
1988 Reduction of the number of brackets from 15 to 12. Reduction of maximum tax rate from 55 to50 per cent. Indexation of brackets to minimum wage59. Exemption of vacation bonuses andprofit sharing from taxable income (up to 15 times the minimum wage)60.
1989 Introduction of tax credit to replace flat deduction. Reduction of maximum tax rate from 50 to40 per cent.
1990 Reduction of maximum tax rate from 40 to 35 per cent. Introduction of inflation adjustment oftax brackets.
1991 Introduction of a tax discount (subsidies) in inverse proportion to the share of fringe benefits intotal payroll.61 Reduction of the rate charged on interest income of individuals.
1995 Tax credit increased for lower income brackets. Optional simplified rate (2.5 per cent) for streetvendors created.
1997 Increased exemptions and tax credits to low income earners.
1998 Creation of a new regime for small taxpayers in order to combat fraud, to replace previousregimes (except that applying to primary sectors). For taxpayers with entrepreneurial activitiesearning less than 2.2 million pesos, the marginal tax rate on gross income varies from 0.25 to2.5 per cent, after a deduction of three times the minimum wage.
59. Indexation to the minimum wage implies some drift since minimum wage adjustments are systematically
lower than inflation.
60. The exclusion of fringe benefits from the taxable basis was followed by a gradual increase in thiscomponent of income, to about one-third of the employers payroll (Francisco Gil Diaz, 1995).
61. The coefficient of subsidy is calculated at the level of the employer, not by worker. This measure haslowered effective marginal tax rates by significant amounts -- by some estimates by as much as 50 per cent(Francisco Gil Diaz, 1995).

ECO/WKP(2000)6
51
Taxation of corporate income
1989 Tax base is fully adjusted for inflation, following a transition period. Corporate tax rate islowered from 42 to 35 per cent.
1990 Introduction of the simplified tax regime for small taxpayers and specific sectors (regardless ofsize) replacing special tax bases.
1991 The special tax rate on income derived from the agriculture, livestock, fisheries and forestrysectors -- both corporate and personal -- is reduced to 50 per cent of normal tax rate (instead of40 per cent previously)62. Fiscal losses can be carried forward over ten years (instead of fivepreviously).
1994 Reduction of marginal tax rate from 35 to 34 per cent.
1995 Simplified tax regime is expanded by raising maximum income of firms eligible for theprogramme. Deductions for investment and R&D are increased; and depreciation rates areaccelerated.
1997 Tax payment restructuring for firms facing liquidity problems. Tax arrears are partly forgiven andpartly re-negotiated at more favourable terms.63
1998 Measures to promote long-term savings are introduced, including through employees’ individualretirement accounts.
Asset tax
1989 Introduction of the asset tax at a 2 per cent rate (not applicable for the first three years aftercompany starts operating). Asset tax is refunded against income tax -- excess is carried forwardfor three years.
1990 The asset tax rate is reduced to 1 per cent for taxpayers who benefit from the reduced income taxrate regime (applying to the primary sector). Consolidation of asset tax introduced.
1991 The number of years over which asset tax refund is possible increases from three to five years.
1992 Exemption for street vendors who pay income tax under specific regimes (10 per cent of theirpurchases). Special, more favourable, regime created for the hotel sector.
1994 The number of years over which asset tax refund is allowed increases from five to ten years.
1995 Tax rate lowered to 1.8 per cent. New enterprises exempt for three years. Established firms withqualifying investment programmes can defer payments for four years.
62. The tax rates are reduced by 75 per cent if taxpayers from these sectors put their production through
industrial processing.
63. This measure should be seen in the context of a general effort to alleviate debtors’ problems in theaftermath of the peso crisis, to prevent the development of a widespread non-payment culture.

ECO/WKP(2000)6
52
1996 Income below 7 million pesos exempt. Investment and employment creation incentives areintroduced for one year.64
1997 Widening of the tax to include most financial institutions (except for assets used inintermediation operations). Income below 8.9 million pesos exempt. Investment and employmentcreation incentives extended for one year.
1998 Investment and employment creation incentives were not extended.
Value added tax
1988-92 A number of changes in VAT rates and structure are introduced.
1992 General VAT rate lowered from 15 to 10 per cent and the special border rate raised from 6 to10 per cent.
1995 General tax rate is raised from 10 to 15 per cent, except in border areas, where it remains at10 per cent.
1996 Widening of the zero rate to include potable water, processed food items and medicines, at allstages of production. VAT applies only to real interest (instead of nominal previously) onconsumer credit and credit card loans.
Car taxes
1987 Five tax rates are established on the sale of new cars, depending on the price of vehicle.
1989 Reduction of rates; limits are introduced on deductibility for businesses.
1990 Full deductibility is re-established for cars purchased by businesses.
1991 Tax rates on ownership and use of cars established at 2.0, 5.0 and 8.5 per cent.
1992 Tax rates on ownership and use of cars raised to 2.5, 6.5 and 10.0 per cent.
1997 Tax on new cars tax reduced (temporary measure applicable for one year only).
Excise taxes
1989 Rates reduced for tobacco and wine.
1993 Rates reduced for beer.
64. This measure was meant to support the economic recovery; it was extended in 1997 to boost the domestic-
oriented sector.

ECO/WKP(2000)6
53
Revenue-sharing measures
1996 Measures to introduce a new federalism
Revenue-sharing rules
The general revenue-sharing pool is increased to 20 per cent of “sharable” federal tax receipts-- 7 percentage points more than before.
The federal government will distribute 20 per cent of excise tax revenues on alcoholic beveragesand beer, and 8 per cent of the tax on tobacco, directly to state and local governments.
Rescheduling of revenue-sharing transfers through the year to improve the cash flow of the lowerechelons: 90 per cent of the funds are to be apportioned monthly and only 10 per cent set asideuntil the end of the fiscal year.
The federal government increases the proportion of bridge toll revenues to be distributed to thestates and municipalities to 25 per cent of operating revenue (from 10 per cent previously). Theresources may be earmarked for infrastructure and capital expenditure.
Devolution of responsibilities
Lower echelons are authorised to impose licensing fees for bars.
They are authorised to levy a tax on hospital services and on motor vehicle ownership or use.Beginning in 1997, the proceeds from the federal new car tax will be passed on to the lowerechelons in their entirety.
The federal tax on the acquisition of real estate is rescinded, and the lower echelons will beauthorised to impose it.
1997 Lowering of federal tax rate on lotteries (from 21 to 15 per cent); states can levy a 6 per cent taxon the same basis. Under an administrative co-operation agreement, the states are authorised toadminister a number of federal taxes. This is an incentive for improving their collectioncapability insofar as they may keep any additional taxes imposed as a result of the tax audits theyconduct (this being applicable to income tax, assets tax, excise tax for small taxpayers and VAT).

ECO/WKP(2000)6
54
Annex II
Main issues in the tax mix discussion in OECD countries in the 1990s
41. The role of the tax system is to allow the Government to fulfil its inter-temporal budget constraintby generating the necessary revenues as efficiently, equitably and manageably as possible.65 This impliesthat taxation should minimise disincentives to work, invest and save; that horizontal equity should beobserved and vertical equity taken duly into account;66 and that tax laws and regulations should not beunduly complex and difficult to enforce by the authorities. While these broad guidelines constitute a set of“first principles” for taxation, there is more ambiguity when it comes to practice. In theory the leastdistortionary tax is a lump-sum tax where each individual pays the same amount in tax. This raisesproblems with respect to vertical inequality as well as generating sufficient revenue. Most generalequilibrium models imply that consumption taxation is less distortionary than income taxation (becauseconsumption taxation can be viewed as a proportional tax on lifetime income or intergenerational income,that does not distort inter-temporal decisions, i.e. savings and investment). However, this again generatesconcerns of vertical inequality and possibly also compliance because the revenue-neutral rate is likely to bevery high for most OECD-countries. Another issue is whether incomes from different sources should betaxed at rates according to the elasticity of the bases (Ramsey optimality) or whether a single rate scheduleshould apply to aggregate income independent of source (the Shantz-Haig-Simons principle). In practice, itis hardly possible to identify and implement such a thing as an “optimal tax system” and the exact designof the tax system will be influenced by a host of idiosyncratic, and often interrelated, features of theindividual countries -- such as the income level and distribution, regulation and flexibility of labour andproduct markets, relative magnitude of distortions from different taxes and their impact on economicactivity and/or social welfare, industrial structure, considerations on tax competition and politicalpreferences for government expenditure levels. Moreover, the overall political context is of course decisivefor the design of the tax system as are the administrative capacities in place.
42. The issue of overall tax mix is perhaps the most fundamental problem in the design of taxsystems. There has been considerable convergence in tax mixes in the OECD, but large differences amongcountries remain. Generally, the broad thrust of tax reforms have involved an increase in direct labourtaxation in the form of social security taxation, a decrease in both statutory and average effective rates ofcorporate tax, and a shift in consumption taxes away from excise taxes and toward value added taxation.There has also been a slight increase in the use of environmental taxes, especially in Europe. Thesechanges seem to have been driven by two considerations. First, there was a desire to reap efficiency gainsfrom the reform of tax systems. Clearly, the priority assigned to finding less distorting ways of levyingtaxes had to increase as tax burdens themselves increased in the OECD. A second consideration wasundoubtedly globalisation, as these reforms tended to lower marginal rates on more mobile tax bases (and,hence, on those with more elastic responses to taxation) and to raise them on less mobile tax bases. In this
65. See for instance Goode, 1984.
66. Horizontal equity refers to a situation in which people with the same level of income are taxed at the samelevel. Vertical equity implies that tax payments are increasing in income.

ECO/WKP(2000)6
55
sense, then, the reforms corresponded to a standard principle for the design of tax systems -- that taxdistortions are minimised if the burden is focused on tax bases that respond relatively little to taxation. Atthe same time, though, this shift in tax mix gives rise to fairly serious concerns for distribution and taxequity. Some of the main themes of the tax structure discussion among OECD countries are summarisedbelow.
43. First, there has been some advocacy for a move from income taxation to general consumptiontaxes (VAT). This would reduce tax disincentives on inter-temporal decisions (i.e. savings andinvestment). Moreover, consumption taxes are generally less easy to avoid for the underground/informaleconomy. However, consumption taxes tend to be less progressive than income taxes, they may distortconsumption patterns if rates are not uniform, or some goods and services are exempted, and taxpayerresistance is often significantly biased against consumption taxes (Messere, 1993). Moreover, such a shiftwould also have generational distributional consequences in favour of the younger generations during thetransition since people with assets accumulated under the income tax regime would essentially "pay twice"as they consumed these assets under the consumption tax regime.
44. Second, a measure which has attracted significant attention in Europe is a switch from payrolltaxes to VAT (see for instance OECD, 1995). This is particularly attractive to countries where payrolltaxes have been high and increasing and where labour market arrangements convert part of the incidenceof this tax into unemployment.67 The effect of such a measure would be to shift some of the tax burden tothose outside the labour force (i.e. receivers of capital and transfer incomes), thus reducing the disincentivefor employers to take on labour -- especially low-skilled and part-time employed to the extent socialsecurity contributions are levied from the first unit of income earned and reduced above certain ceilings. Avariant of this proposal has focused on a shift from labour to energy taxes, in which case some of the taxburden could (but not necessarily) be shifted to energy consumers and producers. A number of countrieshave already experimented with such taxes (Belgium, Denmark, Finland, Netherlands, Norway, Sweden,and the United Kingdom). The few empirical studies of such measures suggest that the employment impactof such measures is extremely small.
45. One difficulty encountered in implementing policies that shift the tax burden onto transferrecipients is in reducing the standard of living of those receiving transfer payments. If they are fullycompensated for the tax-induced increase in prices, then the scope for tax cuts on labour is much reduced.Moreover, such a shift might only have marginal effects on labour supply decisions to the extent thesedepend on the total tax burden of a household (i.e. including consumption taxes), cf. Layard et al. (1996).It has also been argued that such a shift might -- at least in the short term -- improve wage-competitivenesssince VAT but not payroll taxes are rebated at frontiers. Although true, especially for countries with fixedexchange-rate regimes and slow wage adjustment, such temporary arguments should not, by themselves,validate adjustment to tax regimes.
46. Third, the links between benefits and tax systems have been widely analysed, in particular theexistence of so-called poverty or unemployment traps in which low-income households face very highmarginal effective tax rates when moving up the income ladder, or taking on work. In fact, marginaleffective tax rates, while having generally been lowered for high incomes, have barely moved, or in severalcountries even increased for low-income taxpayers during the past two decades. However, as noted by theImplementing the OECD Jobs Strategy (1997), marginal effective tax rates for low incomes have beenreduced during the 1990s in several countries including France, the United Kingdom, Canada, Denmark,Iceland, Ireland, the Netherlands, New Zealand and Sweden. Measures to reduce poverty or unemployment
67. Although the incidence of social security contributions depends on the degree of labour-market flexibility,
there is some empirical evidence that these taxes have a larger effect on employment than other taxes,cf. the OECD Jobs Study (1994).
ECO/WKP(2000)6
56
traps through the use of employment conditional benefits were introduced or expanded in the UnitedStates, the United Kingdom, Canada, Australia, Ireland and New Zealand. The same has been the case forMexico with the introduction in 1994 -- later expanded in 1995 -- of a progressive salary tax credit.
47. Fourth, in a few countries, a move from employees’ social security contributions towards anincome tax has been advocated even though the proceeds may still be earmarked for social welfarebenefits. The argument here is between those who regard social security contributions as insurance, andthose who regard them as a regressive form of taxation, with flat rates, low ceilings and no allowances forfamily circumstances. In most OECD countries, the link between contributions and benefits is at besttenuous, and social security is de facto no more than a tax on labour. France and Sweden have recentlyreduced payroll taxes within an unchanged overall tax wedge of labour income. In Mexico, the socialsecurity reform also draws in this direction (1998, Economic Survey of Mexico).
48. Fifth, a general switch from mobile to immobile tax bases is being widely considered, as trade-and capital-market liberalisation increases the potential for tax competition between countries. Thetrade-off will be to what extent higher marginal tax rates on relatively immobile factors can replace taxeson mobile factors, thereby safeguarding domestic revenues, without causing excessive distortions in thesupply and demand of the immobile factor. Up until now, there has been little evidence, that increasingglobalisation and tax competition have had much influence on domestic tax profiles (leaving aside theEuropean Union, where a substantial convergence has taken place in indirect taxation due to the gradualimplementation of the single market).

ECO/WKP(2000)6
57
Annex III
The statutory tax regime, 199868
49. Income from individual non-business activities is taxed at rates ranging from 3-35 per cent(Table A1). The statutory rates, both at the bottom and at the top, are lower than found in most otherOECD country.69 Income brackets are indexed to inflation on a semi-annual basis. In contrast with manyother OECD countries, Mexico does not apply a zero-rated band for low incomes (Table A2). However, abasic allowance is given for holiday bonus and end-of-year bonus. Moreover, a salary tax credit impliesthat low-income earners pay negative taxes. Non-standard deductions include medical expenses, schooltransportation, funeral charges, charitable donations and voluntary contributions to pension schemes (up toa certain limit). Imputed rental income from owner occupied housing is not taxed, while interestexpenditure, including on housing, are not deductible for individuals. Positive real interest income is taxedat a rate of 17 per cent, which applies only up to the first 10 percentage points of interest and only forfinancial instruments with less than one year’s maturity. Exempt from tax is interest income fromgovernment securities and several other instruments. States and municipalities are not allowed to taxincome, but states can levy payroll taxes.
(Table A1. Main features of the tax system, 1998)
(Table A2. Rates and structure of income tax on individuals, 1998)
50. The social security system has been fundamentally reformed in recent years. The pension schemeis being transformed from a pay-as-you-go system into a fully funded system and the financing of healthinsurance is being changed so as to reduce labour taxation, increase the financial viability of the systemand make affiliation to social security more attractive for the uninsured population in the informal sector.70
The new pension system strengthens the link between workers’ contributions and benefits, which reduceincentives for workers to evade or under-declare income. In addition to mandatory contributions, workerscan make voluntary deposits on their accounts, and the government pays a fixed contribution. Thefinancing reform of the health insurance increases contributions from general taxes, while lowering theshare of social security contributions (except for low incomes) and their marginal rates (Table A1). This
68. A detailed overview of the Mexican tax system in 1998 is presented in Table A1.
69. Switzerland has lower rates at the central government level, but not when taking local government incometaxes into account. New Zealand has a lower top rate, i.e. 33 per cent.
70. More details are given in the 1998, Economic Survey of Mexico.

ECO/WKP(2000)6
58
could alleviate problems of under-reporting of income71 and might also facilitate the integration of workersfrom the informal to the formal sector as payroll taxes fall most heavily on low-paid and part-time workers(OECD, 1998).
51. Corporate income is taxed at a uniform rate of 34 per cent -- roughly in line with most otherOECD countries (Table A3) and lower than in the United States and Canada. As in the individual incomescheme, corporate income is fully indexed for the effects of inflation. Besides income tax, Mexicanenterprises have to pay into a so-called profit sharing scheme by which 10 per cent of after-tax profits fromthe previous year is distributed to workers.72 Depending on the incidence, this could raise the effectivecorporate income tax rate by up to 10 percentage points (i.e. from 34 to 44 per cent).73 Such schemes arenot used in other OECD countries. Mexico has recently implemented the OECD guidelines for transferpricing, and have also applied a set of specific rules for operations with residents in tax havens. Dividendsare taxed at the corporate level, but individuals may choose to have dividends taxed in the individualincome scheme (grossed up by a factor of 1.515) and credit the tax paid at the corporate level. No doubletaxation of dividends thus takes place, thereby ensuring an equal treatment of corporate financing throughnew equity or retained earnings. Compared to almost all other OECD countries, the wedge on dividends-- i.e. the difference between gross earnings at the corporate level and net “take-home” dividend for theindividual share-holder -- is correspondingly low in Mexico (Table A3). In accordance with the integrationof individual and corporate taxation, self-employed are free to chose between the individual and corporateincome scheme.
(Table A3. Statutory rates and rules for taxation of corporations, 1998)
52. In order to improve compliance of corporate taxation, a net worth tax (“asset tax”) wasintroduced in 1989, whereby net assets are taxed by a flat rate of 1.8 per cent at present. The asset tax iscreditable against income taxes paid, and the purpose of the tax is primarily to limit income-tax avoidance-- for instance, through transfer pricing or overstatement of costs -- by imposing a minimum tax oncorporate activity above a certain threshold. The rationale for using an asset tax, as opposed to, forinstance, a lump-sum tax, is that assets in principle reflect the earnings capacity of a company. From anadministrative point of view, companies have less incentive to under-report investment, as compared toincome, as this would have negative consequences for their depreciation allowances. The current tax rateof 1.8 per cent assumes that the annual real return to private capital should exceed 5.3 per cent on average.If this is the case, the assets tax does not distort investment incentives (because the income tax generatedwould exceed the asset tax) -- and a lower rate of return would, in any case, indicate an inefficient use ofthe assets. The assets tax thus encourages an efficient capital allocation. The assets tax has been highlycriticised by the business sector, not least because it applies in years when firms are making losses,74 but 71. IMSS registers show that in 1993 one out of five workers were contributing to IMSS on the basis of
earnings of one minimum wage or less, while according to the national Employment Survey only one outof 40 workers were earning such low wages.
72. Formally, this is not a tax since it is instituted in the Labour Law rather than the Tax Laws. However, it hasthe same de facto effects as an income tax.
73. Most likely, however the incidence will be on workers, and the effective increase in the rate is likely to besignificantly less than 10 percentage points. It should also be added, that the profit sharing is deductiblefrom corporate income to the extent it exceeds fringe benefits. As these typically vastly exceeds 10 per centof profits the effective deductibility of profit sharing is probably small.
74. However, assets taxes paid can be refunded by the amount by which corporate income tax exceeds theassets tax in any of the following ten years. Likewise the amount by which income taxes have exceededassets taxes during the previous three years are creditable against the assets tax in a given year. Newenterprises are exempt for 3 years, and enterprises with incomes below 8.9 mill. pesos (1998) are alsoexempt.

ECO/WKP(2000)6
59
also because it discourages foreign investors by not allowing start-up concessions for these investors.Although it is normally not recommended to tax investment directly because of the possible adverseconsequences for capital accumulation -- and, indeed, net worth taxes are only levied in a few other OECDcountries (Canada, Switzerland, Finland and Iceland) -- it has a clear justification in the case of Mexico,given the administrative problems of controlling and enforcing corporate income-tax payments. One studythus concluded that every peso of assets tax collected brings in an additional 3.5 pesos of corporate incometaxes, thus corroborating the important control function of the assets tax.75 Assets taxes or net wealth taxesare also levied in a number of other Latin American countries.76
53. Besides the general corporate tax regime, three partly overlapping preferential regimes are inplace: the simplified regime for the agriculture,77 fishery and land transportation sectors; the special rateregime for agriculture and publishing; and the small taxpayers regime. The simplified regime applies thestandard corporate tax rate of 34 per cent, but calculates income on a cash-flow basis. All expenditure isthus immediately deductible (including investment in physical and financial assets), and only resourcestaken out of the company are subject to taxes. In practice, this leaves companies under this regime, whichare typically family-run businesses, with ample room to avoid any taxation. The special-rate regime appliesonly half of the standard corporate tax rate, i.e. 17 per cent on income and 0.9 per cent on assets, on theenterprises included.78 Finally, the small taxpayers regime includes companies with an annual grossincome below 2.2 million pesos. This scheme was especially set up to encourage small firms and theself-employed to register in the formal sector and to reduce the government’s administrative costs linked tothese entities. Besides avoiding the complexities of the general regime, notably inflation accounting, thisregime also applies lower reporting requirements. Gross income is taxed at rates between 0.25-2.5 per cent.Even though preferential regimes like the ones in Mexico are not uncommon in other OECD and LatinAmerican countries, the economic justification for preferential treatment of certain sectors or types ofenterprises are most often relatively weak. This is to a large extent the case for Mexico, where theconcessions granted -- especially in terms of the simplified and low-rate regimes -- seem to reflect afavouring of political pressure groups more than profound macroeconomic and structural considerations.
54. Taxation of consumption has typically accounted for 40-50 per cent of total tax revenue(excluding royalties from PEMEX) with the sources being split almost equally between VAT revenues andother consumption taxes, mainly excises, customs and import duties. Revenues from VAT have beensignificantly influenced by numerous changes to the system over the years -- during the 1990s mostnotably the decision in 1990 to switch the VAT administration from states to the federal government, thestandard rate reduction in 1992 and its reversal in 1995 (as noted in Annex I). In broad terms, the MexicanVAT system follows a set-up not very different from that of most other countries. It applies a standardVAT rate (at present 15 per cent) while having some goods and services (food, medicine, newspapers, etc.)being exempted or taxed at a lower rate, in this case zero. Furthermore, the standard VAT rate is reduced to10 per cent in areas close to the US border. However, Mexico deviates from many other OECD countriesby the amount of exemptions and zero-rated goods.79 In most other OECD countries the lower rates are
75. Gil Diaz (1995).
76. Shome (1992).
77. Including livestock and forestry.
78. Workers in agriculture and fishery are also totally tax exempt for incomes below 20 times the minimumwage.
79. Exemptions differ from zero-rating in that businesses that sell exempt products cannot claim credit for theVAT included in their purchases (i.e. the VAT paid is then shifted on to consumers, and all transactions upto the exempted sale will be taxed). Moreover, if a business’ sales consist exclusively of exemptcommodities, it can be considered outside of the VAT chain and treated as a final consumer. Exemptionsshould thus be considered a superior option to zero-rating from the administrative as well as from the

ECO/WKP(2000)6
60
applied to a much smaller variety of goods and services (Table A4). Mexico also allows wider concessionsto small traders than seen in other OECD countries except for Japan. One departure in the other direction isthe inclusion of some financial services, including consumer credits and personal loans, in the tax base.Overall, however, the revenues from VAT are relatively low in an international comparison -- of OECDcountries applying VAT only Japan and Canada have lower revenue/GDP ratios.
(Table A4. Main features of VAT systems in selected countries, 1997)
55. The problem of exempting and zero-rating a very wide range of goods and services is not onlythe revenue foregone per se by narrowing the base, but also that it opens up multiple possibilities for non-compliance and avoidance -- for instance by falsely attributing sales to zero-rated or exempted transactions-- thus making it difficult for the tax administration to enforce the VAT-regime appropriately. This isexacerbated by the possibility for companies to get cash refunds for VAT credits. In most countries azero-rate only applies in the export sector, and the only businesses that can be expected to systematicallyshow tax credit in excess of tax debits are exporting enterprises. In such countries authorities often chooseto make the option of VAT refunds available to exporting companies only, so as not to burden theadministration with the processing and control tasks involved in refund claims. In Mexico, the economicrationale for using consumption taxes (i.e. they do not distort savings and investment decisions) is alsodiluted to the extent that different rates distort relative prices. Finally, by allowing a large spectrum ofgoods and services preferential treatment, pressures from rent seeking may mount as taxpayers in theordinary regime are encouraged to also try to become exempt or zero-rated.
56. Excise taxes are based on the same system of credits, debits and reimbursements as the VAT,whereas in many other countries excises are levied only at the import - or production - point. Althoughtechnically elegant, the Mexican system is difficult to administer, which could give rise to problems ofnon-compliance in this system as well. Like most other countries, Mexico levy excises on fuels, alcoholicbeverages, tobacco and motor vehicles. No excises are levied on environmentally damaging activities.Revenues from excises to GDP have fluctuated sharply over the 1980-96 period, with a coefficient ofvariation being double that of VAT-revenues to GDP. The main reason is the excise on fuel, whichfluctuates inversely proportionally with the oil price. The fuel price for the final consumer at the pump isregulated by the authorities on a monthly basis (i.e. the price is linked to expected inflation) with theschedule being determined in the annual budget.80 The excise is then determined residually as thedifference between the regulated consumer price and the import price on oil adjusted for a mark-up andcommercialisation costs at PEMEX. When market prices of oil fall, the regulated consumer price remainsunchanged, and excise revenues will increase accordingly. However, the overall revenue intake will bedominated by a drop in other oil-related revenues. The revenue raised by PEMEX are described in moredetail in Box 3 of the main text.
revenue viewpoints but not from a distributive viewpoint as replacing zero-rating with exemptions wouldincrease prices for a range of basic necessities.
80. The Ministry of Finance has the option of raising the regulated price at its discretion without Congressionalapproval.

ECO/WKP(2000)6
61
Table A1. Main features of the tax system, 1998
Tax Nature of Tax Deductions and Exemptions RatesFederal taxes1. Taxes on Income:1.1. Individuals:1.1.1. Individual income tax IIT)
The IIT is levied on an individuals income from allsources, including wages and salaries, income frombusiness activities, service fees, real property andinterest. Changes in the real value of assets andliabilities due to inflation are taken into account indetermining the tax base. Income also includesgains from the effect of exchange rate changes onthe value of debts denominated in foreign currency.
Tax-files must be returned before end of April ofthe year following the year in which the incomearose. Individuals who are exempt from filinginclude employees whose salary income aroseexclusively from one single employer and thosewhose final taxes have already been paid by way ofwithholding at source.
Income tax provisions include a separate set ofrules governing computation of income derivedfrom business activity that are substantially thesame as the computation of income under thecorporate income tax scheme (CIT). The self-employed with business activities may choose toinclude business profits multiplied by 1.515 ontheir final tax return as part of their global taxableincome and take a credit for advance at thecorporate tax rate, or pay taxes on that incomeseparately under the scheme for corporate businessprofits. If gross income the preceding year did notexceed 2.2. mill. pesos (1997) they may opt for thespecial regime for small taxpayers, where gross
Certain items of income are exempt from incometax when paid to individuals; these items include:income from agriculture, livestock raising, forestry,or fishery to the extent that income does not exceed20 times annual minimum salaries; interest paid bycredit institutions on savings deposits which do notexceed two times general minimum salaries for oneyear and whose interest does not exceed the ratefixed every year by the Congress; interest paid oninvestments in registered securities of the FederalGovernment; interest on bonds, securities, andother credit documents with terms exceeding oneyear and publicly issued under rules issued by theSHCP; interest paid on bonds and debts issued byinternational credit institutions of which theMexican Government is a member; inheritances;fringe benefits calculated on the minimum wageprovided they do not exceed the limits establishedunder the Fiscal Law; certain social securitybenefits and other benefits received by workers.
Deductions for personal expenses: expensesincurred for transportation to school of taxpayer’sdirect descendants in zones where transportation isnecessary; medical, dental, and hospital expenses ofthe taxpayer and dependants; funeral expenses forthe dependants up to the annual minimum wage;and donations made to qualified institutions. Inaddition, residents may deduct deposits made inspecial personal savings accounts, pension planinsurance premiums paid to Mexican institutions
Taxable income1
03 639
30 88454 27563 09375 539
152 352240 128
Fiscal Subsidy
Taxable income1
03639
30 88454 27563 09375 539
152 352240 128304 704365 644
Percentage onexcess
310172532333435
Percent subsidy onmarginal tax
5050505050403020100
income is taxed at rates from 0 to 2.50 %(7 brackets). The simplified tax system permittedunder the CIT is also applicable to individuals withincome from business activities in the same sectorsdetermining eligibility for corporations (see below).
and the cost of shares in specified investmentcompanies (up to a certain limit).
Income brackets are adjusted semi-annually forinflation.1) Each line refers to an income tax bracketwhose lower limit is given on the line and upperlimit on the next line.Source: 1998 Tax Law.
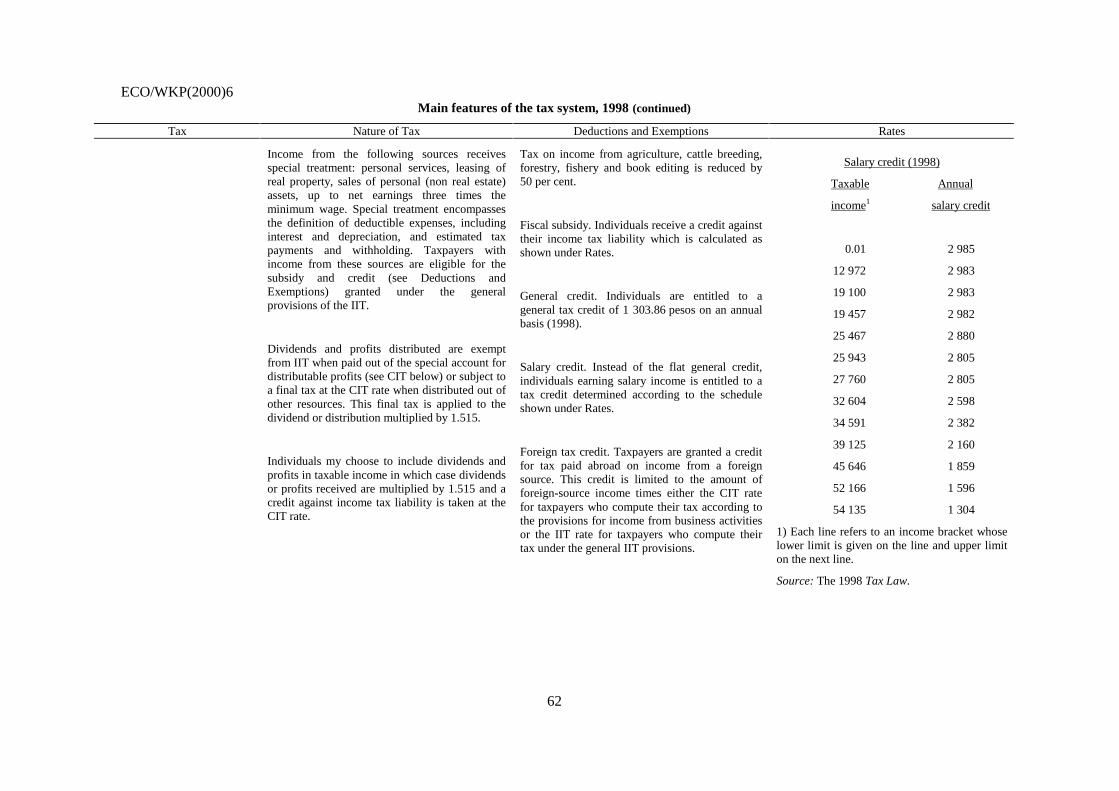
ECO/WKP(2000)6
62
Main features of the tax system, 1998 (continued)
Tax Nature of Tax Deductions and Exemptions Rates
Income from the following sources receivesspecial treatment: personal services, leasing ofreal property, sales of personal (non real estate)assets, up to net earnings three times theminimum wage. Special treatment encompassesthe definition of deductible expenses, includinginterest and depreciation, and estimated taxpayments and withholding. Taxpayers withincome from these sources are eligible for thesubsidy and credit (see Deductions andExemptions) granted under the generalprovisions of the IIT.
Dividends and profits distributed are exemptfrom IIT when paid out of the special account fordistributable profits (see CIT below) or subject toa final tax at the CIT rate when distributed out ofother resources. This final tax is applied to thedividend or distribution multiplied by 1.515.
Individuals my choose to include dividends andprofits in taxable income in which case dividendsor profits received are multiplied by 1.515 and acredit against income tax liability is taken at theCIT rate.
Tax on income from agriculture, cattle breeding,forestry, fishery and book editing is reduced by50 per cent.
Fiscal subsidy. Individuals receive a credit againsttheir income tax liability which is calculated asshown under Rates.
General credit. Individuals are entitled to ageneral tax credit of 1 303.86 pesos on an annualbasis (1998).
Salary credit. Instead of the flat general credit,individuals earning salary income is entitled to atax credit determined according to the scheduleshown under Rates.
Foreign tax credit. Taxpayers are granted a creditfor tax paid abroad on income from a foreignsource. This credit is limited to the amount offoreign-source income times either the CIT ratefor taxpayers who compute their tax according tothe provisions for income from business activitiesor the IIT rate for taxpayers who compute theirtax under the general IIT provisions.
Salary credit (1998)
Taxable Annual
income1 salary credit
0.01 2 985
12 972 2 983
19 100 2 983
19 457 2 982
25 467 2 880
25 943 2 805
27 760 2 805
32 604 2 598
34 591 2 382
39 125 2 160
45 646 1 859
52 166 1 596
54 135 1 304
1) Each line refers to an income bracket whoselower limit is given on the line and upper limiton the next line.
Source: The 1998 Tax Law.

ECO/WKP(2000)6
63
Main features of the tax system, 1998 (continued)
Tax Nature of Tax Deductions and Exemptions Rates
For interest that is not exempt under theindividual income tax, the withholding tax is17 per cent on the first 10 percentage points ofinterest. Interest paid to individuals on specialsavings accounts is subject to a withholding taxof 35 per cent that is creditable against the finalliability. A 15 per cent withholding tax is appliedto indexed saving accounts (UDIs). Interest andgains from derivative financial transactions aresubject to a 15 per cent provisional withholdingtax, creditable against the annual tax liability.
1.1.2 Withholding tax Employment income is subject to monthlywithholding of income tax at source at the ratesshown under Rates. The withholding tax iscreditable against final liability.
Annual tax. In addition to the monthlywithholding tax, the withholding agent mustcalculate every year the annual tax onemployment income due by each employee at theannual IIT rates, considering the ordinary fiscalsubsidy and a credit table that combines thecredit tables used during the year for employmentincome proper or the general credit for otherincome.
The obligation of employers to file an annual taxreturn on behalf of employees does not apply toemployees who promise to file an annual return.

ECO/WKP(2000)6
64
Main features of the tax system, 1998 (continued)
Tax Nature of Tax Deductions and Exemptions Rates
1.1.3 Capital gains Capital gains realised by individuals from thetransfer or sale of immovable property,securities, and personal property are taxed asincome from the transfer or disposition of goods.The sale price of assets is reduced by theiracquisition cost adjusted for inflation to computecapital gains. A deduction for depreciation ofbuildings is also made. Capital gains arising fromthe acquisition of property are taxed as ordinaryincome.
Capital gains are not taxed if they raise in thefollowing situations: gain from the sale of apersonal residence if the individual lived in theresidence for at least two years prior to the sale;transfer of ownership by reason of death ordonations to immediate family members; gainsfrom the sale of securities when the transaction iscarried out through the Mexican stock exchangeand certain exchanges of treaty countries; thegains from sale of personal property up to anannual amount not exceeding three times theminimum wage.
1.2 Tax on foreign remittances Withholding tax on wages, interest and royaltiespaid to non-residents.
Exempt interest includes interest on loans grantedto the Federal Government.
1.3 Business1.3.1 Corporate income tax (CIT)
A broad-based tax on income of legal entities.Income includes changes in the value of assetsand liabilities due to inflation, for example, gainaccruing to taxpayer as a result of the reductionin real value of debts. Taxable income equalsgross income less expenses and net losses carriedforward from preceding periods. Corporateincome tax returns are due on March 31.
Receipts are deemed to accrue for the supply ofgoods and services on the day the relevantcontract is concluded or upon any of thefollowing events: issuance of a voucher for theprice or delivery of the goods or some advance orpartial payment for the goods, whichever occursfirst.
Dividend and profit distributions are exempt whenpaid out of the distributable profits account(i.e. after corporate income tax).
Non taxable income includes: (i) capital increases;(ii) payments made by shareholders to coverlosses; (iii) premiums received upon issuance ofshares; (iv) appreciation of shares in othercompanies arising from the use of the equityaccounting method of valuation; (v) revaluation ofassets and capital; (vi) dividends and profitsreceived from other resident legal entities. Thesemust be included in the income subject to profitsharing.
34 per cent.
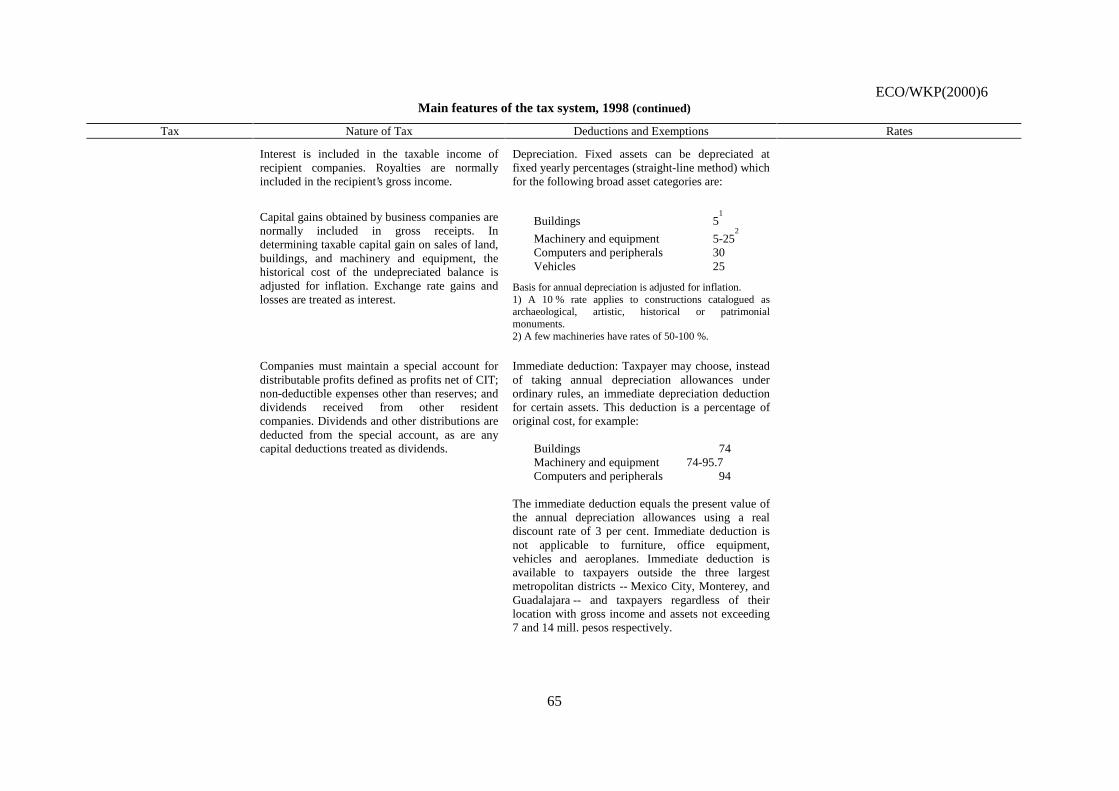
ECO/WKP(2000)6
65
Main features of the tax system, 1998 (continued)
Tax Nature of Tax Deductions and Exemptions Rates
Interest is included in the taxable income ofrecipient companies. Royalties are normallyincluded in the recipient’s gross income.
Depreciation. Fixed assets can be depreciated atfixed yearly percentages (straight-line method) whichfor the following broad asset categories are:
Capital gains obtained by business companies arenormally included in gross receipts. Indetermining taxable capital gain on sales of land,buildings, and machinery and equipment, thehistorical cost of the undepreciated balance isadjusted for inflation. Exchange rate gains andlosses are treated as interest.
Buildings 51
Machinery and equipment 5-252
Computers and peripherals 30Vehicles 25
Basis for annual depreciation is adjusted for inflation.1) A 10 % rate applies to constructions catalogued asarchaeological, artistic, historical or patrimonialmonuments.2) A few machineries have rates of 50-100 %.
Companies must maintain a special account fordistributable profits defined as profits net of CIT;non-deductible expenses other than reserves; anddividends received from other residentcompanies. Dividends and other distributions arededucted from the special account, as are anycapital deductions treated as dividends.
Immediate deduction: Taxpayer may choose, insteadof taking annual depreciation allowances underordinary rules, an immediate depreciation deductionfor certain assets. This deduction is a percentage oforiginal cost, for example:
Buildings 74Machinery and equipment 74-95.7Computers and peripherals 94
The immediate deduction equals the present value ofthe annual depreciation allowances using a realdiscount rate of 3 per cent. Immediate deduction isnot applicable to furniture, office equipment,vehicles and aeroplanes. Immediate deduction isavailable to taxpayers outside the three largestmetropolitan districts -- Mexico City, Monterey, andGuadalajara -- and taxpayers regardless of theirlocation with gross income and assets not exceeding7 and 14 mill. pesos respectively.

ECO/WKP(2000)6
66
Main features of the tax system, 1998 (continued)
Tax Nature of Tax Deductions and Exemptions Rates
Simplified regime. Includes agriculture,livestock, forestry, fishery and landtransportation activities. Taxable income iscalculated on a cash-flow basis, where onlyresources taken out of the entity are subject totax.
Special rate regime. Includes agriculture,livestock, forestry, fishery, silviculture andpublishing.
Special regime for small taxpayers. Includesindividuals carrying out business activities with ayearly gross income below 2.2 million pesos.
34 per cent.
17 per cent (or 25.5 per cent if these taxpayers,except those dedicated to publishing,commercialise or industrialise their products).
0-2.5 per cent of gross income.Inventory. Not recognised for tax purposes. Allpurchases and costs of production are deductiblewhen incurred. Interest and inflationary losses aredeductible provided they are computed underrules that require the taxpayer to compute theinflationary profit derived from monetaryliabilities.Loss carry-forward. Net losses may be deductedfrom taxable profits of the ten years following theyear in which they were sustained. No carry-backis allowed. Net losses are adjusted for inflation.Losses realised on sales of shares, debt and othertransferable securities may be deducted only fromgains realised on the sale of such assets during theyear of the loss or subsequent five years.Foreign tax credit. A credit is granted for tax paidabroad on income from a foreign source. Thiscredit is limited to the amount of foreign-sourceincome times the CIT rate.

ECO/WKP(2000)6
67
Main features of the tax system, 1998 (continued)
Tax Nature of Tax Deductions and Exemptions Rates
1.3.2 Tax on business assets A tax payable by corporations, unincorporatedbusinesses and individuals (whether resident ornon-resident) carrying out business activities orleasing to businesses subject to the tax, includingmaquiladoras. The assets tax is reduced by theamount of CIT paid. Further, the amount bywhich the CIT paid exceeds the assets tax in agiven year can be used to obtain a refund ofassets tax paid in any of the previous 10 years.
The tax base is the average value of assets heldduring the taxable year or the prior four years atthe taxpayer’s option, less the average value ofthe liabilities to other business enterprisesresident in Mexico, except those contracted withthe financial sector. Tax is filed together with theincome tax return. Procedures for adjusting thevalue of assets for inflation are specified indetailed rules.
Companies with income below 8.9 mill. Pesos areexempt. For financial institutions the tax is leviedon assets and liabilities which are not subject tofinancial intermediation. Companies are not liableduring: (i) the pre-operational period; (ii) firstyear of operation; (iii) two fiscal years followingthe first year of operation; and (iv) last fiscal yearfor companies in liquidation.
When the CIT exceeds the tax on assets, theexcess may be carried back for 10 years andcredited against the minimum tax paid in any ofthose years, and a refund may be requested.
The excess of the CIT over the tax on assetsduring the previous three years may be creditedagainst the tax on assets in the current year.
1.8 per cent.
(0.9 per cent for entities in the special rateregime, cf. above).
2. Social security contributions The social security system for private sectoremployees (IMSS) underwent a major reform in1997 concerning both pensions and healthinsurance. The financing of the pension system,now based on individual accounts, is sharedbetween employers, employees and thegovernment according to the following scheme:
Contributions to pension scheme and disability insurance after the IMSS reformPremium Cap
(per cent of wage) (times the Financing minimum wage) Disability and life insurance 2.5 15-251 Tripartite2
Retirees’ medical care 1.5 15-251 Tripartite2
Retirement and old-age severance 4.5 15-251 Tripartite2
Government’s contribution 365 pesos3 - GovernmentRetirement saving: individual account 2.0 15-251 EmployerINFONAVIT (housing) 5.0 10 EmployerVoluntary contributions - - Employee/employer
1. Rising from 15 minimum wages in 1997 to 25 minimum wages in 2007.2. Employer 70 per cent, worker 25 per cent and government 5 per cent of total.3. At 1997 constant prices, amount equivalent to 5.5 per cent of the minimum wage in the Federal
district, indexed to this minimum wage.

ECO/WKP(2000)6
68
Main features of the tax system, 1998 (continued)
Tax Nature of Tax Deductions and Exemptions Rates
The financing of the health insurance system isbeing changed gradually over a transition periodof ten years (1997 to 2007).
IMSS health fund financing
1997 2007
Government
Fixed 13.9 x Min.w. 13.9 x Min.w.
Maternity and sickness 0.05 % of wage 0.05 % of wage
Employers
Fixed 13.9 x Min.w. 20.4 x Min.w.
Proportional 6 % of wage > 3 x Min.w. 1.1 % of wage > 3 x Min.w.
Maternity and sickness 0.70 % of wage 0.70 % of wage
Employees
Proportional 2 % of wage > 3 x Min.w. 0.4 % of wage > 3 x Min.w.
Maternity and sickness 0.25 % of wage 0.25 % of wage
Source: National authorities; OECD Economic Survey, Mexico, 1998.3. Domestic taxes on goods
and services3.1. Value-added tax VAT is levied on the following transactions:
transfer of goods; rendering of independentservices, including professional services andinterest not specifically exempt; granting oftemporary use or right to use goods (leasing);imports of goods and services.Tax point. A taxable transfer of goods is deemedto be carried out and the tax is due when: (i) theproperty is physically delivered; (ii) the price iswholly or partially paid; (iii) the relevantdocument covering the transfer is issued.Taxable amount. VAT is calculated on the price,inclusive of any taxes, fees, interest, or penalties.If there is no price, the base is the market value.If there is no market value, then an estimatedvalue is used.
Tax credit. Taxpayers may deduct from their VATliability the VAT charged on inputs or paid by thetaxpayer on imports.Tax refund. If credits in a month exceed theliability to VAT, the taxpayer may carry thebalance forward to the next month or apply for atax refund of the full balance.Exempt persons. Individuals engaging in businessactivities who supply goods or servicesexclusively to final consumers are exemptprovided their receipts in the previous year do notexceed one million pesos (a number adjustedannually for inflation). Individuals engaging inagriculture, forestry, or fishery are exempt withinthe same limit.
15 per cent.10 per cent for border regions.
Zero-rated goods and services: non processedanimal and vegetable products except rubber;food except processed food and smoked salmonand caviar; patented medicines; milk; ice andwater; specified services, machinery andequipment for agriculture and fishery;wholesale of gold, gold bullions and jewellerywith a content of at least 80 per cent of gold.
Exports are zero rated.

ECO/WKP(2000)6
69
Main features of the tax system, 1998 (continued)
Tax Nature of Tax Deductions and Exemptions Rates
Exempt transactions: inheritances; gifts; land;construction attached to land provided that it isused for dwelling homes; books, periodicals,magazines, and copyrights; used personalproperty; tickets for lotteries and games andprizes paid; Mexican and foreign currency;company shares, stock shares, and bonds.
Exempt services: employee services rendered forremuneration; education at recognised schoolsand institutions; public transportation of personsby land (transportation by railroad is taxable);insurance of risks of agriculture and cattle raising;life insurance covering pensions and annuities;interest on most business loans and for firstmortgage loans to individuals and other kind ofinterest specified in the law; derivative financialtransactions; medical services.
3.2. Excises An excise tax is levied on specified goods andservices. The tax is levied under a value-addedsystem up to the wholesale level. Cigarettes,gasoline, and diesel are taxed only at theproducer or importer level.
Taxable amount. With respect to imports, theexcise tax is normally calculated on the importvalue plus customs duties and other duties paidon importation, except VAT.
Fuel: Based on the difference between theimport parity and the regulated finalconsumer price.
Beer.: 25-60 per cent.
Wine: 25-30 per cent.
Alcoholic beverages: 60 per cent.
Mineral oils: 39.3-78.9 per cent.
Tobacco: 20.9-85 per cent.
New automobiles: 2 to 17 per cent plus a fixedamount, both based on the purchaseprice.
Source: OECD, Consumption Tax Trends, 1998edition.

ECO/WKP(2000)6
70
Main features of the tax system, 1998 (continued)
Tax Nature of Tax Deductions and Exemptions Rates
4. Taxes on internationaltrade and transactions
4.1. Import duties Customs duties are levied on the customs valueof most imported goods.
Compensatory duties may be imposed onmerchandise that the Ministry of Commerce hasdemonstrated to have been imported underconditions involving unfair practice ininternational trade.
In addition to import duties, imports may besubject to VAT and excise taxes.
Goods may be temporarily imported duty free.The customs authorities may permit thatmerchandise be processed, transformed, orrepaired within bonded premises to besubsequently exported or returned abroad.
The tariff provides for rates of up to 20 percent. The average tariff rate has been reduced toabout 11 per cent (1995).
4.2. Export duties Export duties are levied on a few exported goods,for example, live rattlesnakes and turtles,although the export of most manufactured goodsis not taxed.
State taxes
1. State payroll tax The Federal District and some states levy a smalltax on payrolls to be withheld by employers.
2. Tax on the transfer ofproperty
The sale of immovable property is subject to afederal tax and a similar tax levied by each stateunder an agreement to avoid double taxation. Thetax base is the sale price.
No inheritance tax is levied at either the federal orlocal level.
The rate of the federal tax is 2 per cent, andlocal taxes may not be higher than the federaltax.
3. Tax on motor vehicles The states operate a tax on motor vehicles olderthan 10 years, based on the residual value of thevehicle. More importantly, they administer andappropriate the proceeds from the federal tax onmotor vehicles that applies to vehicles less than10 years old. This tax is based on the purchaseprice adjusted for inflation and depreciation.
Municipal taxes
Local tax on property The tax is levied on the cadastral value ofimmovable property.
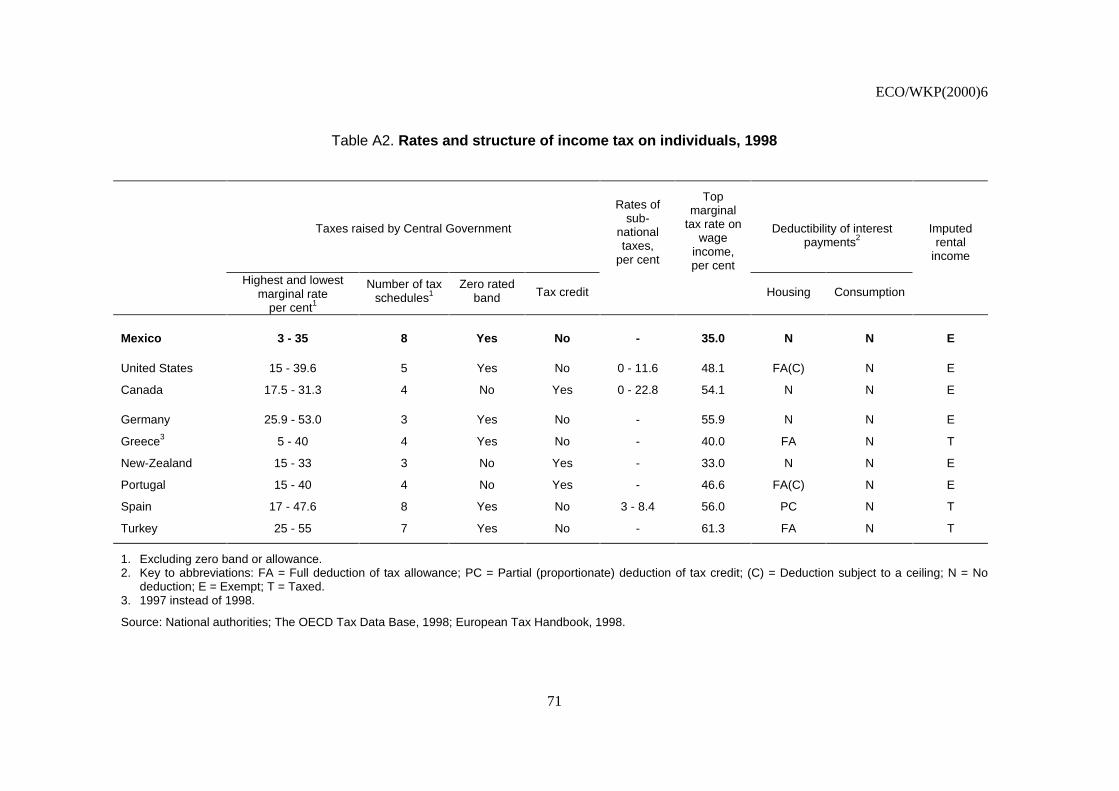
ECO/WKP(2000)6
71
Table A2. Rates and structure of income tax on individuals, 1998
Taxes raised by Central Government
Rates ofsub-
nationaltaxes,
per cent
Topmarginal
tax rate onwage
income,per cent
Deductibility of interestpayments2
Imputedrental
income
Highest and lowestmarginal rate
per cent1
Number of taxschedules1
Zero ratedband Tax credit Housing Consumption
Mexico 3 - 35 8 Yes No - 35.0 N N E
United States 15 - 39.6 5 Yes No 0 - 11.6 48.1 FA(C) N E
Canada 17.5 - 31.3 4 No Yes 0 - 22.8 54.1 N N E
Germany 25.9 - 53.0 3 Yes No - 55.9 N N E
Greece3 5 - 40 4 Yes No - 40.0 FA N T
New-Zealand 15 - 33 3 No Yes - 33.0 N N E
Portugal 15 - 40 4 No Yes - 46.6 FA(C) N E
Spain 17 - 47.6 8 Yes No 3 - 8.4 56.0 PC N T
Turkey 25 - 55 7 Yes No - 61.3 FA N T
1. Excluding zero band or allowance.2. Key to abbreviations: FA = Full deduction of tax allowance; PC = Partial (proportionate) deduction of tax credit; (C) = Deduction subject to a ceiling; N = No
deduction; E = Exempt; T = Taxed.3. 1997 instead of 1998.
Source: National authorities; The OECD Tax Data Base, 1998; European Tax Handbook, 1998.

ECO/WKP(2000)6
72
Table A3. Statutory rates and rules for taxation of corporations, 1998
Central governmentbasic rateper cent
Top marginal rate1
per centNet worth tax Dividends wedge2 Special rates
(incl. small profits rate)per cent
Mexico 34 34 Net worth tax of 1.8 per cent. 35 17/25.5
United States 35 39.5 No tax on corporate net worth 67.7 15
Canada 29.1 46.1 No tax on corporate net worth 73.6 13.12/22.12
Germany3 47.5/30 58.2 Business tax on capital abolishedas of January 1998
49.3 44.31/23.74
Greece4 35/40 40/35 No tax on corporate net worth 53.8 -
New-Zealand 33 33 .. 33 -
Portugal 34 37.4 No tax on corporate net worth 53.1 -
Spain 35 35.8 No tax on corporate net worth 60.4 Several, depending on activity
Turkey 25 44 No tax on corporate net worth 66.4 20
Memorandum item:
Argentina 33
Brazil 25
Chile 15
1. Including local taxation and surcharges.2. Differences between the pre-tax profit earned by the distributing company and the net dividend received by the shareholder.3. These rates apply to retained profits only.4. 1997 instead of 1998.
Source: The OECD Tax Data Base, 1998; National sources and the European Tax Handbook, 1998; KPMG Corporate tax rate survey, March 1998.

ECO/WKP(2000)6
73
Table A4. Main features of VAT systems in selected countries
StandardVAT rate
Concessions tosmall traders
Departures from standard exemptions1 Coverage of lower rates
(in US dollars) Exemption other than"standard exemptions"
Taxation of "standard exemptions" Zero rate2 Lower rates
Mexico 15 112 194 The sale of books,newspapers, magazines,gold and silver coins andshare, the exchange offoreign currency, retailing ofgold bullion, authors’ rights,Public transport ofpassengers by land,agriculture, forestry andfishing activities.
Postal and insurance services exceptlife and agricultural insurance. Theletting of commercial buildings andfinancial services for consumer creditsand personal loans.
The sale of non processed animals andvegetables except rubber; patentmedicines, milk, water, ice, food exceptprocessed food and smoked salmon andcaviar; agricultural equipment andmachinery and fishing boats; thewholesale of gold, gold bullion andjewellery, some agricultural and fishingservices, the letting of some agriculturalmachinery and equipment, the export ofgoods and services.
The sale of goods and services in theborder regions.
Rate = 10 per cent.
United States - - - - - -
Canada3 7/15 22 760 Child care, legal aid, ferry,road and bridge tolls,standard municipal services.
Lotteries and gambling, supply andleasing of commercial land andbuildings, domestic postal services.
Medicine, basic groceries, exports,certain financial services (usually to non-residents), certain agricultural andfishing products, medical devices ,international travel and transportationservices, international organisations andofficials, agriculture, precious metals,(sales of 25 cents or less made throughmechanical coin-operated devices).
-
Germany4 16 21 352 - - - Books, food, newspapers, certaincultural events, charitable work if notexempt, transport (only applies topassenger transport by ship and to localpublic passenger transport).
Rate = 7 per cent.
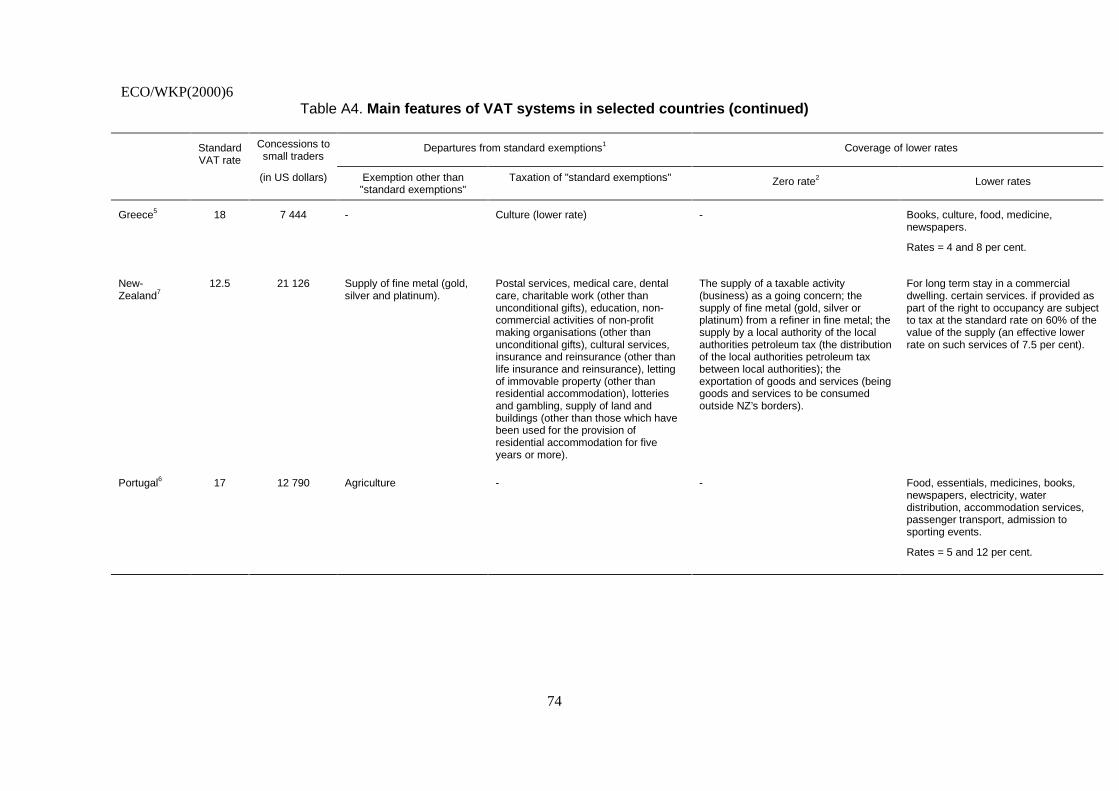
ECO/WKP(2000)6
74
Table A4. Main features of VAT systems in selected countries (continued)
StandardVAT rate
Concessions tosmall traders
Departures from standard exemptions1 Coverage of lower rates
(in US dollars) Exemption other than"standard exemptions"
Taxation of "standard exemptions" Zero rate2 Lower rates
Greece5 18 7 444 - Culture (lower rate) - Books, culture, food, medicine,newspapers.
Rates = 4 and 8 per cent.
New-Zealand7
12.5 21 126 Supply of fine metal (gold,silver and platinum).
Postal services, medical care, dentalcare, charitable work (other thanunconditional gifts), education, non-commercial activities of non-profitmaking organisations (other thanunconditional gifts), cultural services,insurance and reinsurance (other thanlife insurance and reinsurance), lettingof immovable property (other thanresidential accommodation), lotteriesand gambling, supply of land andbuildings (other than those which havebeen used for the provision ofresidential accommodation for fiveyears or more).
The supply of a taxable activity(business) as a going concern; thesupply of fine metal (gold, silver orplatinum) from a refiner in fine metal; thesupply by a local authority of the localauthorities petroleum tax (the distributionof the local authorities petroleum taxbetween local authorities); theexportation of goods and services (beinggoods and services to be consumedoutside NZ’s borders).
For long term stay in a commercialdwelling. certain services. if provided aspart of the right to occupancy are subjectto tax at the standard rate on 60% of thevalue of the supply (an effective lowerrate on such services of 7.5 per cent).
Portugal6 17 12 790 Agriculture - - Food, essentials, medicines, books,newspapers, electricity, waterdistribution, accommodation services,passenger transport, admission tosporting events.
Rates = 5 and 12 per cent.

ECO/WKP(2000)6
75
Table A4. Main features of VAT systems in selected countries (continued)
StandardVAT rate
Concessions tosmall traders
Departures from standard exemptions1 Coverage of lower rates
(in US dollars) Exemption other than"standard exemptions"
Taxation of "standard exemptions" Zero rate2 Lower rates
Spain 16 - Copyright to literature andworks of art.
Some cultural services providedconsumers pay for them.
- Books, social lodgement, catering,certain cultural and entertainmentservices, food, hotels, restaurants,supplies to the handicapped, medicines,transport, newspapers, public amenities,burial services, agricultural and forestry.
Rates = 4 and 7 per cent.
Turkey8 15 - Deliveries and repairs ofmaritime, aircraft or railwaytransport vehicles used forbusiness activities, socialservices, water used inagriculture.
Educational and cultural service, newspapers, books, magazines (lower rate),postal services, sale of commercialbuildings, letting, radio and televisionbroad casting, hospitals, lotteries andgambling.
- Agricultural products, leasing, secondhand cars, news papers, books,magazines, basic food stuffs, naturalgas, cinema, theatre, opera, ballet andeducation.
Rates = 1 to 8 per cent.
1. Standard exemption are the following: postal services, transport of sick/injured persons; hospital and medical care; human blood, tissues and organs; dental care; charitable work;education; non-commercial activities of non-profit making organisation insurance and reinsurance; letting of immovable property; financial services; betting, lotteries and gambling;supply of land and buildings; certain fund-raising events.
2. All countries apply zero rates to exports.3. 15% Harmonised Sales Tax (HST) applies in those provinces that have harmonised their provincial retail sales tax with the federal GST (the 15% HST is composed of a provincial
component of 8% and a federal component of 7%).4. This rate is applied as of 1 April 1998.5. Tax rates are reduced by 30% in some remote areas.6. 17% in Madeira and Azores autonomous regions.7. For long term stay in a commercial dwelling GST at standard rate is levied on 60% of the value of the supply.8. Turkey applies a 23 to 40 % rate on certain luxurious goods.
Source: Consumption Tax Trends, OECD 1998.

ECO/WKP(2000)6
76
BIBLIOGRAPHY
Barro, Robert J. (1991), “Economic growth in a cross-section of countries”, Quarterly Journal ofEconomics, Vol. 106.
Carey, David and Harry Tchilinguirian, “Average effective tax rates on capital, labour and consumption”,OECD Economics Department Working Paper (forthcoming), Paris.
Easterly, W. and S. Rebelo (1993), “Fiscal policy and economic growth: an empirical investigation”,Journal of Monetary Economics, Vol. 32.
Engen, Eric and Jonathan Skinner (1996), “Taxation and Economic Growth”, National Tax Journal,Vol. 49, No. 4, December.
Feldstein, M. and D. Feenberg (1996), “The effect of increased tax rates on taxable income and economicefficiency: a preliminary analysis of the 1993 tax rate increases”, Tax Policy and the Economy v. 10,J. Poterba, ed., pp. 89-117, MIT Press, Cambridge MA.
Gil Diaz, Francisco (1995), “Fiscal policy and tax administration: the experience of Mexico”, TaxAdministration in Latin America, Inter-American Development Bank, Washington DC.
Goode, Richard (1984), Government Finance in Developing Countries, The Brookings Institution,Washington.
Goolsbee, Austin (1997), “What happens when you tax the rich? Evidence from executive compensation”,NBER Working Paper No. 6333.
Gordon, Kathryn and Harry Tchilinguirian (1998), “Marginal effective tax rates on physical, human andR&D capital”, OECD Economics Department Working Papers No. 199, Paris.
Hendricks, Lutz (1999), “Taxation and Long-Run Growth”, Journal of Monetary Economics, Vol. 43,No. 2, April.
Inter-American Development Bank (1997), Latin America after a Decade of Reform: Economic and SocialProgress, Washington DC.
King, R.G., and S. Rebelo (1990), “Public policy and economic growth: developing neoclassicalimplications”, Journal of Political Economy, Vol. 98.
Leibfritz, Willy, John Thornton and Alexandra Bibbee (1997), “Taxation and economic performance”,OECD Economics Department Working Papers No. 176, Paris.

ECO/WKP(2000)6
77
Levine, R. and D. Renelt (1992), “A sensitivity analysis of cross-country growth regressions”, AmericanEconomic Review, Vol. 82.
Mansfield, Charles (1988), “Tax administration in developing countries: an economic perspective”, IMFStaff Papers, Washington DC.
Mendoza, Enrique G., Assaf Razin and Linda L. Tesar (1994), “Effective tax rates in macroeconomics:cross-country estimates of tax rates on factor incomes and consumption”, Journal of MonetaryEconomics, No. 34.
Mendoza, Enrique G., Gian Maria Milesi-Feretti and Patrick Asea (1997), “On the Ineffectiveness of TaxPolicy in Altering Long-Run Growth: Harberger’s Superneutrality Conjecture”, Journal of PublicEconomics, Vol. 66, No. 1, October.
Messere, Ken (1993), Tax Policy in OECD Countries: Choices and Conflicts, IBFD Publications BV,Amsterdam.
Milesi-Feretti, Gian Maria and Nouriel Roubini (1998), “Growth Effects of Income and ConsumptionTaxes”, CEPR Discussion Paper No. 1979, September.
Norregaard, John (1990), “Progressivity of income tax systems”, OECD Economic Studies No. 15, Paris.
OECD (1994), The OECD Jobs Study -- Facts, Analysis, Strategies, Paris.
OECD (1995), The OECD Jobs Study -- Taxation, Employment and Unemployment, Paris.
OECD (1997), Implementing the OECD Jobs Strategy -- Lessons from Member Countries’ Experience,Paris.
OECD (2000), “Tax burdens: alternative measures”, OECD Tax Policy Studies No. 2, Paris.
Plosser, C.I. (1992), The Search for Growth, Policies for Long-Run Economic Growth, Federal ReserveBank of Kansas City.
Shome, Partasarathi (1992), “Trends and future directions in tax policy reform: a Latin Americanperspective”, IMF Working Paper 92/43, Washington DC.
Slemrod, Joel (1995), “What do cross-country studies teach about government involvement, prosperity andeconomic growth”, Brookings Papers on Economic Activity, 2.
Slemrod, Joel (1998a), “The economics of taxing the rich”, NBER Working Paper No. 6584,Cambridge, MA.
Slemrod, Joel (1998b), “Are ‘real’ responses to taxes simply income shifting between corporate andpersonal tax bases?”, NBER Working Paper No. 6576, Cambridge, MA.
Slemrod, Joel (1998c), “A general model of the behavioural response to taxation”, NBER Working PaperNo. 6582, Cambridge, MA.
Tanzi, Vito and Anthony Pellechio (1995), “The reform of tax administration”, IMF Working Paper 95/22,Washington DC.

ECO/WKP(2000)6
78
ECONOMICS DEPARTMENTWORKING PAPERS
232. EMU, the Euro and the European policy mix(February 2000) Jonathan Coppel, Martine Durand and Ignazio Visco
231. The tax system in Japan: a need for comprehensive reform(February 2000) Thomas Dalsgaard and Masaaki Kawagoe
230. The size and role of automatic fiscal stabilisers in the 1990s and beyond(January 2000) Paul van den Noord
229. Enhancing environmentally sustainable growth in Finland(January 2000) Ann Vourc’h and Miguel Jimenez
228. Finance and growth: Some theoretical considerations, and a review of the empirical literature(January 2000) Kotaro Tsuru
227. What the yield curves say about inflation: Does it change over time?(December 1999) Sebastian T. Schich
226. Summary Indicators of Product Market Regulation with an Extension to Employment ProtectionLegislation(December 1999) Giuseppe Nicoletti, Stefano Scarpetta and Olivier Boylaud
225. Some Issues Related to the Equity-Efficiency Trade-Off in the Swedish Tax and Transfer System(November 1999) Henning Strand
224. The Economic Effects of Employment-Conditional Income Support Schemes for the Low-Paid:An Illustration from a CGE Model Applied to Four OECD Countries(October 1999) Andrea Bassanini, Jørn Henrik Rasmussen and Stefano Scarpetta
223. The Use of Financial Market Indicators by Monetary Authorities(September 1999) Paul Mylonas and Sebasian Schich
222. Tax Reform in Switzerland(August 1999) David Carey, Kathryn Gordon and Philippe Thalman
221. Trends in Market Openness(August 1999) Jonathan Coppel and Martine Durand
220. Technology Upgrading with Learning Cost: A Solution for Two “Productivity Puzzles”(July 1999) Sanghoon Ahn
219. Testing for a Common OECD Phillips Curve(July 1999) Dave Turner and Elena Seghezza
218. Sustainable Economic Growth: Natural Resources and the Environment(July 1999) Paul van den Noord and Ann Vourc’h
217. Coping with Population Ageing in Australia(July 1999) David Carey

ECO/WKP(2000)6
79
216. Estimating Prudent Budgetary Margins for 11 EU Countries: A Simulated SVAR ModelApproach(July 1999) Thomas Dalsgaard and Alain de Serres
215. The Problems and Prospects Faced by Pay-As-You-Go Pension Systems: A Case Study of Greece(June 1999) Paul Mylonas and Christine de la Maisonneuve
214. Greek Public Enterprises : Challenges for Reform(May 1999) Paul Mylonas and Isabelle Joumard
213. The Levels and Cyclical Behaviour of Mark-Ups across Countries and Market Structures(May 1999) Joaquim Oliveira Martins and Stefano Scarpetta
212. Poverty Dynamics in Four OECD Countries(April 1999) Pablo Antolín, Thai-Thanh Dang and Howard OxleyAssisted by Ross Finnie and Roger Sceviour
211. The Recent Experience with Capital Flows to Emerging Market Economies(February 1999) Sveinbjörn Blöndal and Hans Christiansen
210. Foreign Portfolio Investors Before and During a Crisis(February 1999) Woochan Kim and Shang-Jin Wei
209. Towards More Efficient Government : Reforming Federal Fiscal Relations in Germany(February 1999) Eckhard Wurzel
208. Stock Market Fluctuations and Consumption Behaviour: Some Recent Evidence(December 1998) Laurence Boone, Claude Giorno and Pete Richardson
207. Microeconometric analysis of the retirement decision: The Netherlands(June 1998) Maarten Lindeboom
206. Microeconometric analysis of the retirement decision: United Kingdom(June 1998) Raffaele Miniaci and Elena Stancanelli
205. Microeconometric analysis of the retirement decision: Italy(June 1998) Raffaele Miniaci
204. Microeconometric analysis of the retirement decision: Germany(June 1998) Pablo Antolin and Stefano Scarpetta
203. Microeconometric analysis of the retirement decision: United States(June 1998) Joseph Quinn, Richard Burkhauser, Kevin Cahill and Robert Weathers
202. The retirement decision in OECD countries(June 1998) Sveinbjörn Blöndal and Stefano Scarpetta
201. The macroeconomic effects of pension reforms in the context of ageing populations: overlappinggenerations model simulations for seven OECD countries(June 1998) Ketil Hviding and Marcel Mérette