the talybont trial exploring the psychology of smart meters
TRANSCRIPT

The Talybont Trial
Exploring the Psychology of Smart Meters
Alison Kiddi and Peter Williams
The Prospectory
April 2008
Executive Summary
Simple, clip-on, smart meters show households how much electricity they are using at any moment in time. This feedback has been shown to help people reduce the amount of electricity they use.
Talybont-on-Usk is seeking to become the first carbon-neutral community in Wales and therefore needs to reduce the energy its 300 homes consume as well as generating more of their energy from renewable sources such as the Talybont Reservoir hydro-electric turbine.
At a national level, the government and electricity suppliers are considering how to introduce smart meters across all UK homes. The relative benefits of different kinds of smart meter and the costs involved are the subject of ongoing debate and 2 year trials.
On a small scale, The Prospectory, in collaboration with Talybont Energy Group, ran a trial equipping 10 households in Talybont-on-Usk with Efergy smart meters for a month. The primary aim of the trial was to explore the psychology of electricity use in the home and how smart meters affect people’s understanding, attitudes and behaviour. We therefore conducted in-depth interviews with each household at the end of the trial and analysed all the reported comments. The trial also measured the effect of the meters on consumption in comparison to a group of 10 control households.
The meters had an effect. 9 of the 10 trial households reduced their consumption during the trial period by an average of 9%. In contrast, the control group consumption rose by an average of 5% over the same period. The variation in consumption between households of similar type and occupancy was striking as was the variation in people’s day to day use. This makes any concept of ‘normal’ consumption difficult.
The story behind the numbers was more complex. Two of the households who reduced their consumption didn’t use the smart meter and two of the households who used the meter didn’t reduce their consumption. The behavioural results explain these findings to some extent.
In most households, the meters had a dramatic effect on people’s understanding and awareness of the electricity they use in their everyday lives and activities. Seeing the readings jump up and down as appliances were switched on or off had the biggest effect on people’s thinking and stimulated conscious changes in the ways they used kettles, lights, auxiliary
Page 1 of 30
heaters, showers, washing machines, tumble dryers and ovens. It also encouraged them to turn devices off when not in use.
The meters had the most effect in households where their discretionary electricity use was fairly high and they were motivated to reduce it for either environmental or cost reasons. In the absence of such motivation, it is not clear that meter feedback alone will affect change.
The trial revealed some of the challenges for future smart meter design and technology:-
1. People struggled to monitor their usage over time. They lacked useful reference points and the day to day variability made trends hard to spot.
2. Smart meters can’t (currently) identify which appliances are on and how much each is contributing to the overall load.
3. Understanding electricity consumption is a tricky cognitive problem involving the concept of power x time. Most people will not devote much time or effort to studying numbers and graphs and the drama of seeing consumption readings jump up and down in response to kettles and hairdryers can distract people from identifying appliances which contribute a larger load over a longer period of time.
On the basis of our findings, we would recommend that only the data collection and transmission part of the problem is standardised in UK homes. The design of display appliances should be left open to encourage innovation and competition between both appliance designers and energy suppliers.
1 Introduction
To mitigate some of the effects of climate change, small communities like Talybont-on-Usk in the Brecon Beacons are seeking to become carbon neutral. This means reducing the amount of energy they use in the first place as well as generating more of their energy from renewable sources such as the Talybont Reservoir hydro-electric turbine1..
But recent research shows that most people in the UK are only vaguely aware of how much energy they use. Electricity use, in particular, is often invisible and subconscious2. Most consumers don’t know how much electricity different appliances and activities use or how they could reduce it – and save money – by simple changes in everyday behaviour.
If the Talybont community wants to be the first to achieve carbon neutrality in Wales, they need to understand their own energy consumption better, and find ways to reduce it. One way to do both could be through direct visible feedback about current electricity consumption in the home. This has been shown to have a direct effect on behaviour and produce savings of between 5-15% 3.
Clip-on ‘smart meters’ show you how much electricity your home is using right now and cost between £40 and £1504. They show people, for the first time, the immediate effect on power consumption of switching a kettle or tumble dryer on, or switching lights off.
At a national level, the government and electricity suppliers are considering deploying smart meters in all UK homes. They are debating the benefits versus costs of different types of smart meter as well as how such an initiative should be owned and funded.
The Prospectory5, in partnership with Talybont Energy Group, ran a trial of clip-on smart meters in 10 Talybont households. The trial, in Spring 2008, focussed on the psychology of energy use and the effect of smart meters on people’s awareness, attitudes and behaviour.
Page 2 of 30
2 Aims of the Smart Meter Trial
The aim of the trial was to introduce clip-on smart meters into 10 Talybont households for a 4 week period to study how it affected:
1. Awareness – did people become more conscious of how much energy they consume and what appliances and/or behaviours were responsible for that?
2. Behaviour – did they change any of the things they did or the way they used their appliances?
3. Attitude – did it make them more interested/engaged in reducing their carbon footprint?
4. Actual consumption – did it reduce the amount of electricity they actually consumed?
We wanted to understand how our results varied with both the level of ‘normal’ consumption of that household (high or low) and its general attitude towards energy use.
We also hoped our results might inform the design and user interface of future smart meters.
Our trial population was small and the trial period short. Our data cannot therefore claim to be representative of the general population, but we have learned a great deal about how different people think about their consumption. For more statistically significant results interested readers need to wait for the results of the Ofgem sponsored trials involving 40,000 homes over a 2 year period.6 Our trial focussed on learning about the psychology of energy use and how people interpret and use the feedback from a clip-on smart meter.
3 Test meters
We chose Efergy meters7 for the trial because we had found them to be simple and effective to use, and they also provide a memory function enabling subjects and experimenters to look at consumption patterns on previous days and weeks. Efergy meters are also inexpensive enough to be widely deployed. On request, Efergy Ltd kindly supplied us with 10 meters at cost for the trial.
To install an Efergy meter, you clip a sensor to one of the cables emerging from your main electricity meter. This ferrite sensor indirectly measures the current flowing into the home.
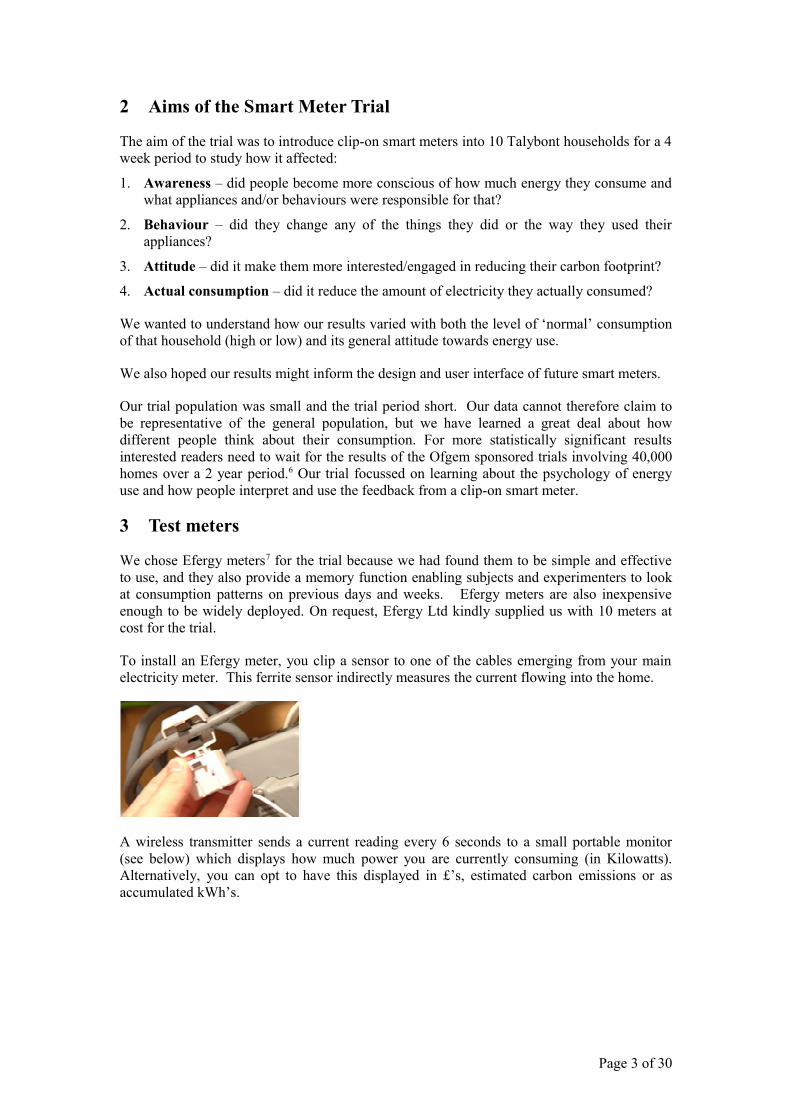
A wireless transmitter sends a current reading every 6 seconds to a small portable monitor (see below) which displays how much power you are currently consuming (in Kilowatts). Alternatively, you can opt to have this displayed in £’s, estimated carbon emissions or as accumulated kWh’s.
Page 3 of 30
The device has a memory in which it stores the consumption over the past 8 days, the past 4-5 weeks and the past 3 months. The user can display these figures in kWh, £’s, or kilogrammes of carbon dioxide emitted.
4 Recruitment
We recruited our 10 trial households through a combination of an article in the local newspaper, flyers in the village Post Office and an email distribution list of people interested in Talybont Energy. The advert read: ‘Take part in a fun energy trial in the Talybont area. We need 10 volunteer households for a 4 week energy experiment. It’s new, it’s fun and you may even save money on your electricity bills.’
We also recruited 10 control households. These did not get Efergy meters but volunteered to provide weekly meter readings in response to email reminders during the pre-trial and trial period. We had more difficulty recruiting the control group, so a number lived outside the Talybont area. The control group allowed us to control for the effects of taking regular readings, large scale weather changes, ‘normal’ day to day variations in use and the lengthening daylight hours over the period of the trial.
5 Trial Process
In each trial household, we took a reading from the main electricity meter one week before the smart meter installation, another at the point of installation, another one week after installation and a final one 3 weeks later at the end of the trial.
We would have preferred a longer pre-trial period but wanted to complete the trial before the Easter holidays (when people planned to be away or change their regular habits), the arrival of British Summer Time, and the increasing effect of warming spring weather.
In all but one case, participants said that their pre-trial week activities were ‘fairly typical’.
At installation, we attached the sensors and briefly demonstrated how to use the monitor, change its settings and access its memory. We also left the Efergy user manual. We stressed that there was no right or wrong way to use the meter – that was entirely up to them. We explained that we would call to check everything was OK after 1 week and return after a further 3 weeks to collect the smart meter and interview them about whether they had found it useful.
We collected no information about energy use from the participants at this time, to avoid artificially drawing their attention to particular devices or behaviours.
Page 4 of 30
At the end of the trial period, we collected the Efergy meters and informally interviewed the subjects about their motivation for taking part in the trial, how they had used the Efergy meters (if at all), what they had found useful (or not) and any changes they had made in their behaviour. We also conducted a brief audit of each household including size of house, number of occupants, sources of energy, main appliances and hours of use. We also noted days spent away from home and any overnight visitors.
The control households we emailed weekly to collect meter readings and finally to ask them to complete a short online audit of their household appliances and occupancy at the end of the trial. We also asked them whether taking weekly readings had had any effect on their awareness or behaviour.
The trial interviews were transcribed and entered into a purpose-built spreadsheet allowing categorisation and analysis of the subjects’ comments.
The Efergy and main meter readings were also all entered into a spreadsheet for analysis.
We did not take further meter readings immediately following the trial because this unfortunately coincided with the Easter holiday and BST change. Readings over a longer post-trial period would have been seriously affected by the lengthening and warming days of April/May generating results that would be difficult to compare. This limitation obviously affects the significance of our numerical data. Any attempt to collect consumption data controlled for seasonal and holiday variation would need to last at least a year – as the Ofgem trial will. Our trial concentrated on the immediate psychological impact of the smart meter, and this in our view would inevitably change over a longer period.
6 About the households
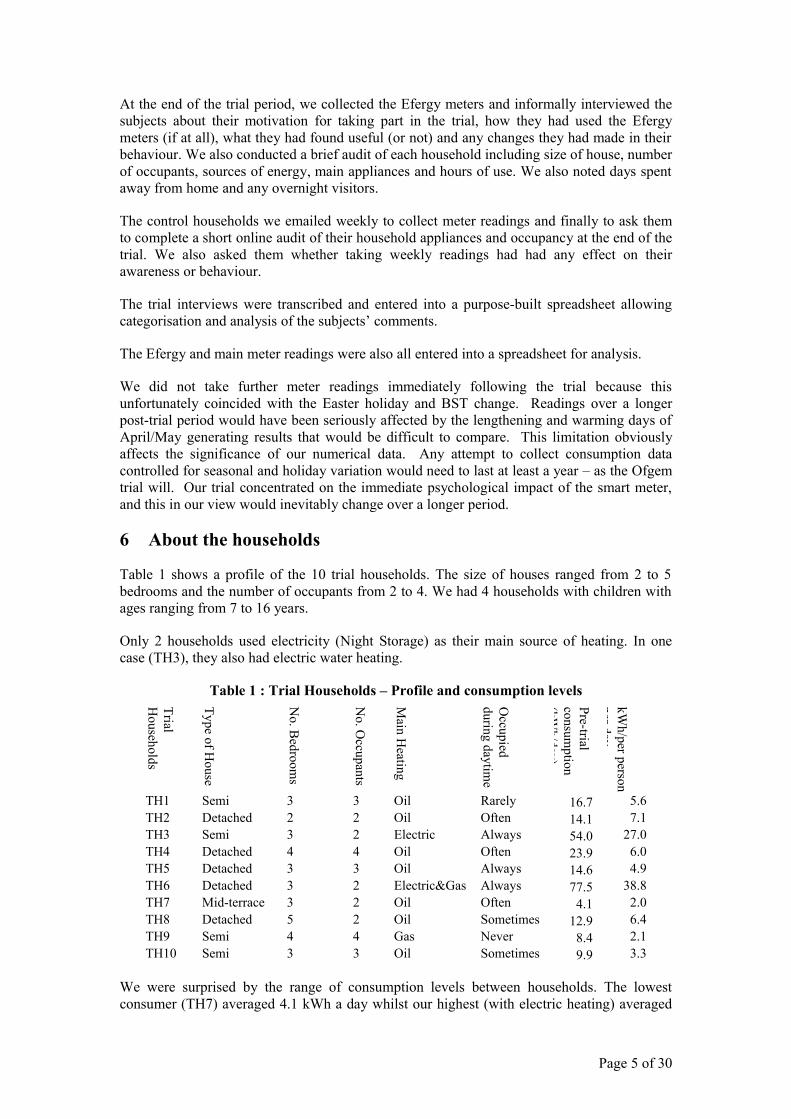
Table 1 shows a profile of the 10 trial households. The size of houses ranged from 2 to 5 bedrooms and the number of occupants from 2 to 4. We had 4 households with children with ages ranging from 7 to 16 years.
Only 2 households used electricity (Night Storage) as their main source of heating. In one case (TH3), they also had electric water heating.
Table 1 : Trial Households – Profile and consumption levels
Trial H
ouseholds
Type of House
No. B
edrooms
No. O
ccupants
Main H
eating
Occupied
during daytime
Pre-trial consum
ption (kW
h/day)
kWh/per person
per day
TH1 Semi 3 3 Oil Rarely 16.7 5.6TH2 Detached 2 2 Oil Often 14.1 7.1TH3 Semi 3 2 Electric Always 54.0 27.0TH4 Detached 4 4 Oil Often 23.9 6.0TH5 Detached 3 3 Oil Always 14.6 4.9TH6 Detached 3 2 Electric&Gas Always 77.5 38.8TH7 Mid-terrace 3 2 Oil Often 4.1 2.0TH8 Detached 5 2 Oil Sometimes 12.9 6.4TH9 Semi 4 4 Gas Never 8.4 2.1TH10 Semi 3 3 Oil Sometimes 9.9 3.3
We were surprised by the range of consumption levels between households. The lowest consumer (TH7) averaged 4.1 kWh a day whilst our highest (with electric heating) averaged
Page 5 of 30
77.5 kWh a day. Even two households of broadly similar size and occupancy (e.g. TH4 and TH9) varied by a factor of 3 in their average daily consumption.
As a whole, the trial householders’ use was higher than the Powys average of 13.5 kWh/day8. We only had 3 households with levels lower than the county average.
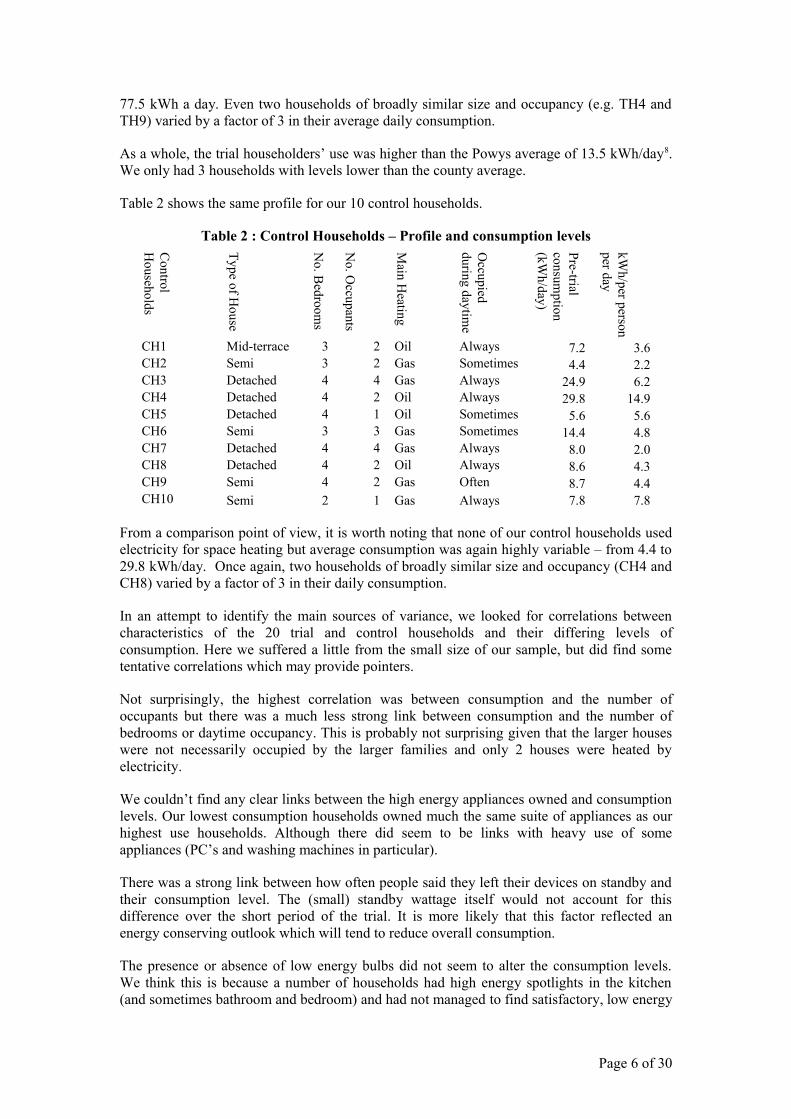
Table 2 shows the same profile for our 10 control households.
Table 2 : Control Households – Profile and consumption levels
Control
Households
Type of House
No. B
edrooms
No. O
ccupants
Main H
eating
Occupied
during daytime
Pre-trial consum
ption (kW
h/day)
kWh/per person
per day
CH1 Mid-terrace 3 2 Oil Always 7.2 3.6CH2 Semi 3 2 Gas Sometimes 4.4 2.2CH3 Detached 4 4 Gas Always 24.9 6.2CH4 Detached 4 2 Oil Always 29.8 14.9CH5 Detached 4 1 Oil Sometimes 5.6 5.6CH6 Semi 3 3 Gas Sometimes 14.4 4.8CH7 Detached 4 4 Gas Always 8.0 2.0CH8 Detached 4 2 Oil Always 8.6 4.3CH9 Semi 4 2 Gas Often 8.7 4.4CH10 Semi 2 1 Gas Always 7.8 7.8
From a comparison point of view, it is worth noting that none of our control households used electricity for space heating but average consumption was again highly variable – from 4.4 to 29.8 kWh/day. Once again, two households of broadly similar size and occupancy (CH4 and CH8) varied by a factor of 3 in their daily consumption.
In an attempt to identify the main sources of variance, we looked for correlations between characteristics of the 20 trial and control households and their differing levels of consumption. Here we suffered a little from the small size of our sample, but did find some tentative correlations which may provide pointers.
Not surprisingly, the highest correlation was between consumption and the number of occupants but there was a much less strong link between consumption and the number of bedrooms or daytime occupancy. This is probably not surprising given that the larger houses were not necessarily occupied by the larger families and only 2 houses were heated by electricity.
We couldn’t find any clear links between the high energy appliances owned and consumption levels. Our lowest consumption households owned much the same suite of appliances as our highest use households. Although there did seem to be links with heavy use of some appliances (PC’s and washing machines in particular).
There was a strong link between how often people said they left their devices on standby and their consumption level. The (small) standby wattage itself would not account for this difference over the short period of the trial. It is more likely that this factor reflected an energy conserving outlook which will tend to reduce overall consumption.
The presence or absence of low energy bulbs did not seem to alter the consumption levels. We think this is because a number of households had high energy spotlights in the kitchen (and sometimes bathroom and bedroom) and had not managed to find satisfactory, low energy
Page 6 of 30
equivalents for these. In heavily used rooms, these would easily outweigh the effects of low energy bulbs in the rest of the house.
Overall, the correlations (or lack of them), when combined with the insights gleaned from the post–trial interviews, suggest that the large differences in consumption levels mostly lay in the householders’ outlook rather than the size of house or appliances they owned.
7 Quantitative results – the effect of the trial on consumption
At the end of the trial, we collected the Efergy meter readings for the previous 7 days for each household plus the previous 4 weeks. The accuracy of an Efergy meter depends on how snugly the ferrite sensor clips to the wire, and there is often a small error. By comparing the Efergy reading with the main meter reading over the whole trial we were able to correct for this error to produce comparable figures across all households.
The trial had a clear effect on electricity consumption. 9 of the 10 trial households reduced their electricity consumption over the 4 week trial relative to the 1 week pre-trial period. The largest drop was 29% (TH3) and the smallest was an insignificant 1% (TH9). One household’s consumption rose by 14%ii. Across all 10 households, the average was a 9% reduction. For the 9 who reduced, the average drop was 11%. This result is in line with previous smart meter studies.9
In comparison, 5 of the control households increased their consumption during the trial period and 5 reduced it. The average across all 10 control households was a 5% increase.
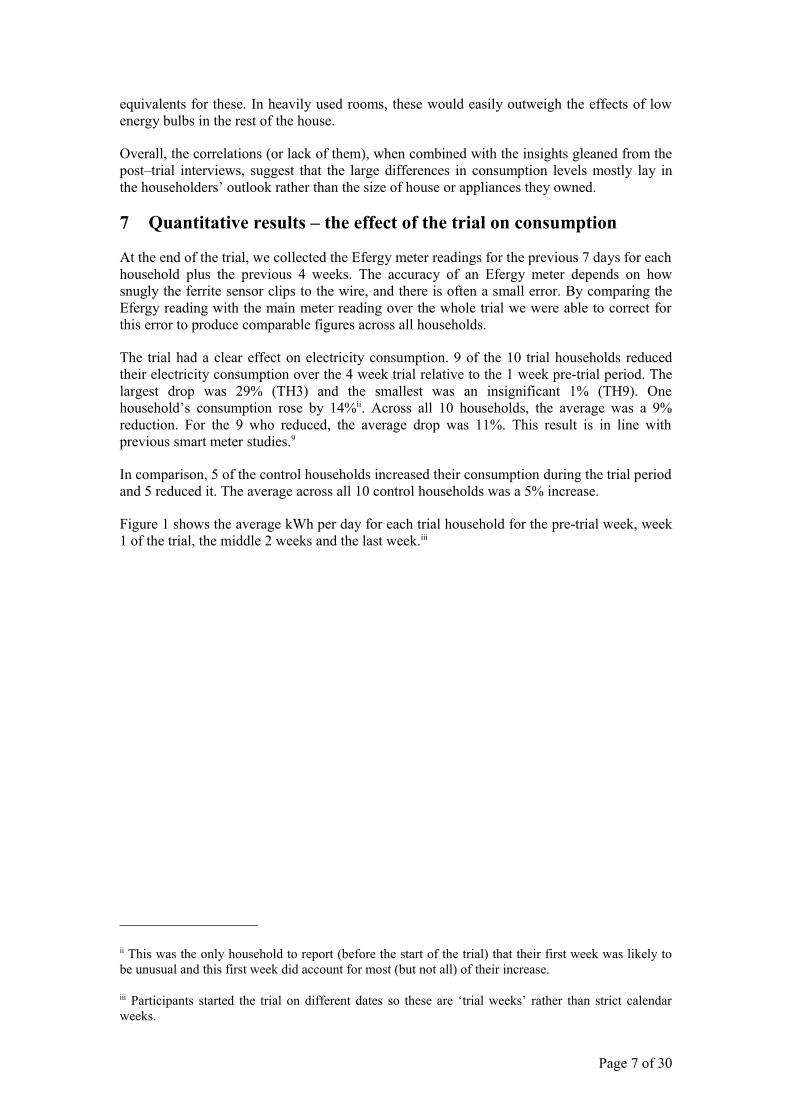
Figure 1 shows the average kWh per day for each trial household for the pre-trial week, week 1 of the trial, the middle 2 weeks and the last week.iii
ii This was the only household to report (before the start of the trial) that their first week was likely to be unusual and this first week did account for most (but not all) of their increase.
iii Participants started the trial on different dates so these are ‘trial weeks’ rather than strict calendar weeks.
Page 7 of 30
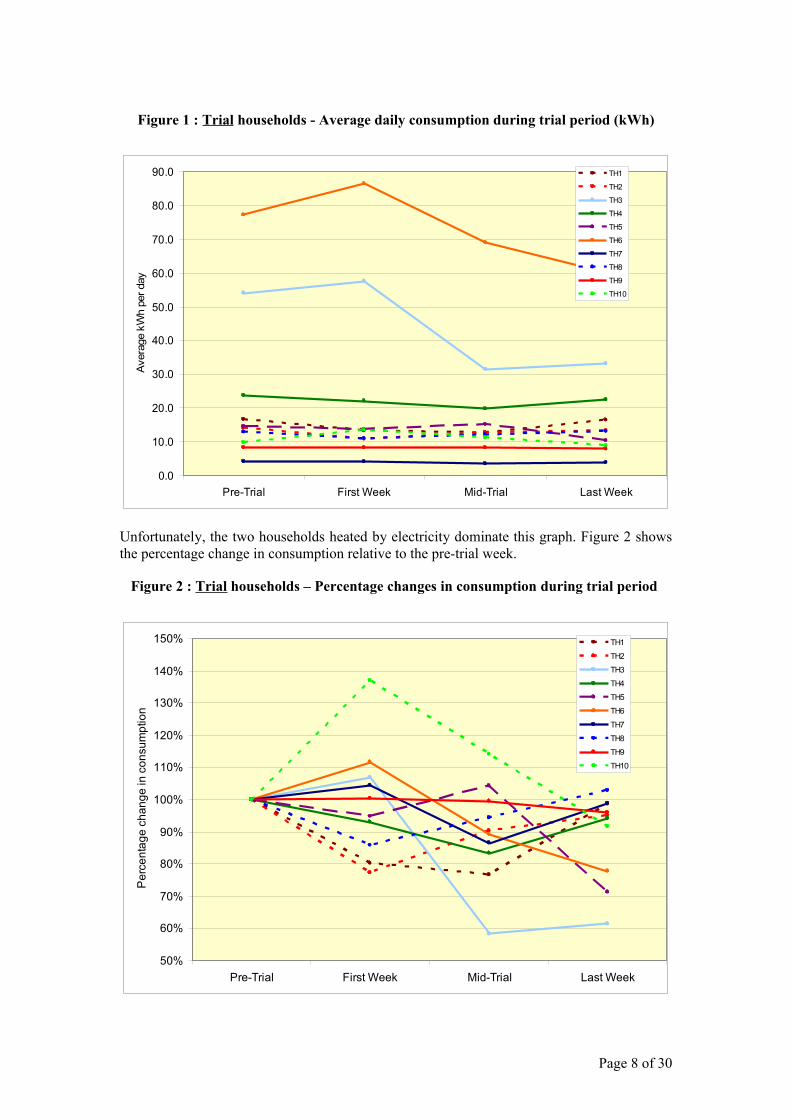
Figure 1 : Trial households - Average daily consumption during trial period (kWh)
0.0
10.0
20.0
30.0
40.0
50.0
60.0
70.0
80.0
90.0
Pre-Trial First Week Mid-Trial Last Week
Aver
age
kWh
per d
ay
TH1
TH2
TH3
TH4
TH5
TH6
TH7
TH8
TH9
TH10
Unfortunately, the two households heated by electricity dominate this graph. Figure 2 shows the percentage change in consumption relative to the pre-trial week.
Figure 2 : Trial households – Percentage changes in consumption during trial period
50%
60%
70%
80%
90%
100%
110%
120%
130%
140%
150%
Pre-Trial First Week Mid-Trial Last Week
Per
cent
age
chan
ge in
con
sum
ptio
n
TH1
TH2
TH3
TH4
TH5
TH6
TH7
TH8
TH9
TH10
Page 8 of 30
The first thing to note is the week to week variation – both up and down. We only had one household (TH9) whose consumption stayed steady week by week. Day to day variation was even higher. All households (apart from the two heated by electricity) used twice as much electricity some days as others and some used 4 or 5 times as much (e.g. 2.8 kWh on a Saturday to 13.5 kWh on a Sunday in one case). There were only a couple of instances of occupants staying away overnight during the trial period and hardly any overnight visitors, so most of this variation was due to either weekends compared to weekdays and/or a varied pattern of social or work activitiesiv. This degree of variation certainly challenges the concept of a ‘normal’ day or week. One needs to sample a much longer period before any notion of normal consumption emerges.
In line with previous studies, 4 of the 5 households who made the largest percentage reduction were also the biggest pre-trial consumers10. The two households with electric space heating (TH3 and TH6) confuse this result. By isolating their Economy 7 meter readings, we could deduce that most of their reductions did not involve their night storage heating (although interviews suggest they did involve changes to their auxiliary daytime heating)v.
A couple of households (TH2 and TH8) showed an initial reduction in Week 1 followed by a return to pre-trial rates. In contrast, 4 Households actually rose in the first week and then reduced after that. All but one household finished the trial below the pre-trial level albeit by an incidental amount in some cases.
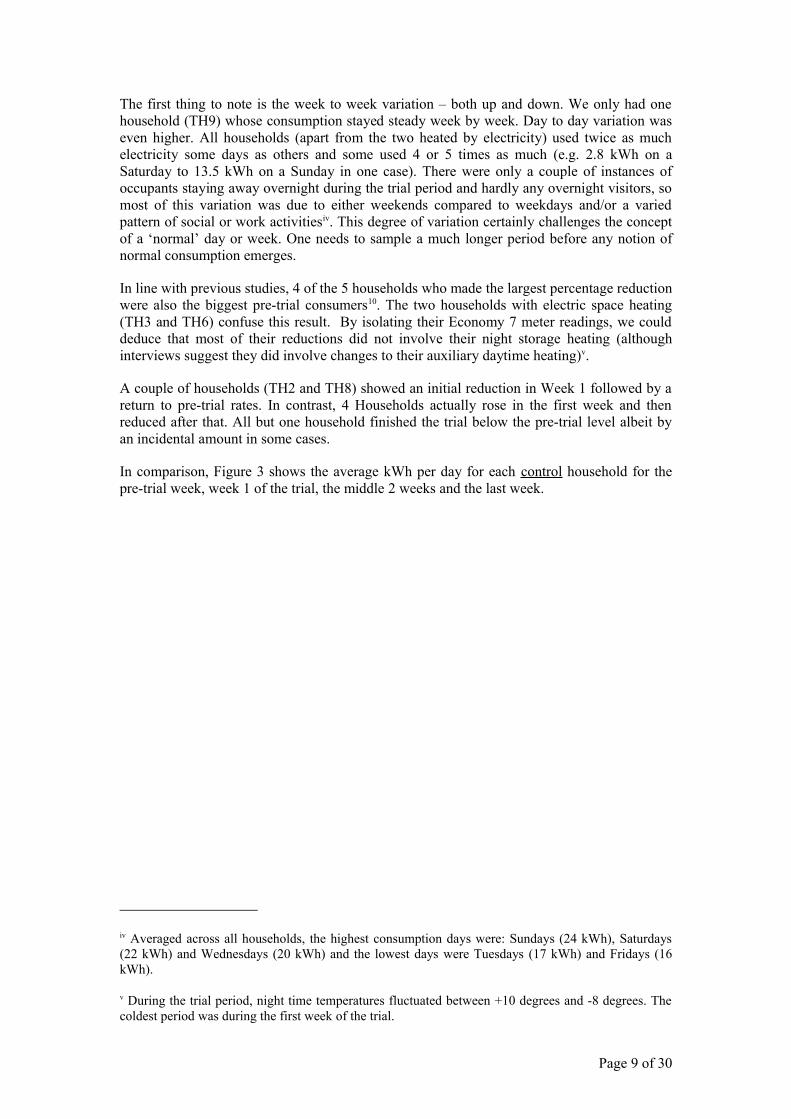
In comparison, Figure 3 shows the average kWh per day for each control household for the pre-trial week, week 1 of the trial, the middle 2 weeks and the last week.
iv Averaged across all households, the highest consumption days were: Sundays (24 kWh), Saturdays (22 kWh) and Wednesdays (20 kWh) and the lowest days were Tuesdays (17 kWh) and Fridays (16 kWh).
v During the trial period, night time temperatures fluctuated between +10 degrees and -8 degrees. The coldest period was during the first week of the trial.
Page 9 of 30
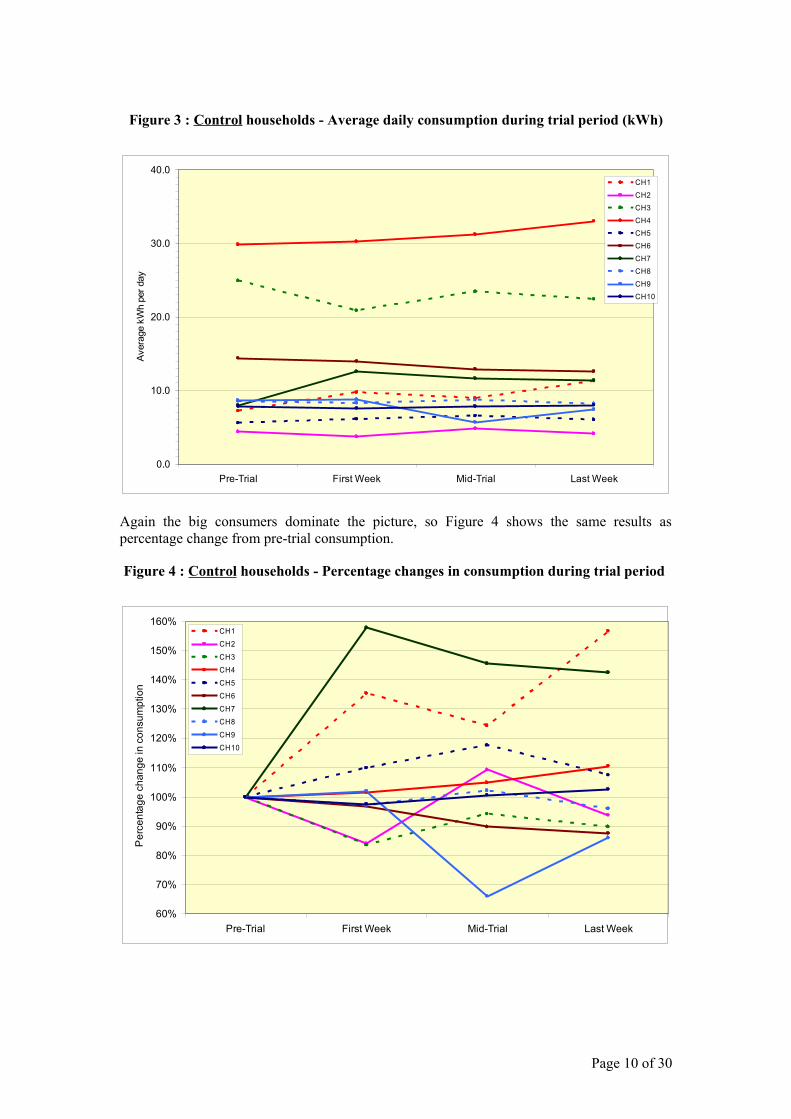
Figure 3 : Control households - Average daily consumption during trial period (kWh)
0.0
10.0
20.0
30.0
40.0
Pre-Trial First Week Mid-Trial Last Week
Ave
rage
kW
h pe
r day
CH1
CH2
CH3
CH4
CH5
CH6
CH7
CH8
CH9
CH10
Again the big consumers dominate the picture, so Figure 4 shows the same results as percentage change from pre-trial consumption.
Figure 4 : Control households - Percentage changes in consumption during trial period
60%
70%
80%
90%
100%
110%
120%
130%
140%
150%
160%
Pre-Trial First Week Mid-Trial Last Week
Per
cent
age
chan
ge in
con
sum
ptio
n
CH1
CH2
CH3
CH4
CH5
CH6
CH7
CH8
CH9
CH10
Page 10 of 30

Although the week to week variation is still high, the control group had a larger number of participants whose use was steady and some of the variability in this case was attributable to significant periods away from home (notably CH9).vi
When surveyed at the end of the trial, two of the households (CH1 and CH2) responded that the weekly readings had made them more conscious of their use and led them to monitor it more closely. They also said that they planned to carry on reading their meters after the trial ended (“Nothing else would have made me engage directly with electricity usage like this. I now want to know what causes the increases we've noticed.”). 6 out of the 10 control households also expressed interest in acquiring a clip-on smart meter in the future.
Unfortunately, measurement will always affect behaviour (the dreaded ‘Hawthorne effect’)11
but the control group still showed an average (small) rise in consumption.
8 The story behind the numbers
Through our post-trial interviews, we found that the story behind the quantitative results was more complex than the numbers suggest (as is often the case with psychology!). For example, not all the households who reduced their consumption made use of the Efergy meter while conversely, some households who enthusiastically used the meter achieved relatively modest reductions. We will explore the reasons for this in the forthcoming sections.
We will start with what we learned about how the participants think about electricity usage and their motivation for taking part in the trial.
8.1 Understanding electricity
In line with previous research12, we found that trial participants tended to be less aware of electricity compared to their other sources of energy. As they pointed out, electricity is ‘invisible’.
• “Electricity is very invisible isn’t it, you can sort of pretend that it’s not doing any harm… (with gas) I feel differently because they drive up in a lorry and fill the tank up”
• “with oil, you can see the level going down, piles of logs you see them going down but with electricity, you just don’t realise how much you’re using. I was blissfully unaware”.
• “I’d thought about using the car and thought about flying and thought about all those other things but I hadn’t really thought about electricity”
Some participants were honest enough to admit that electricity is more difficult to understand than oil or gas – it feels as if you need academic qualifications to get your head round itvii:-
• “I think most people struggle. I really struggle with it because it’s like electricity – what is it? Really, what is it? You know, I haven’t got physics GCSE…”
• “this has been very interesting for me because the only science I did was biology and anatomy, not physics and chemistry so I’m just a complete ignoramus”
vi Control groups are never quite as controlled as you want them to be!
vii After spending 3 months on this project, I’m inclined to agree!
Page 11 of 30
• “although I've been told now what a kilowatt hour is, it's quite hard to get your head round really”.
And electricity bills (the only visible record) are too disconnected in time from usage:-
• “yes, you get your electricity bill but that’s so far removed. It’s so much after the electricity you’ve used”.
On the other hand, when bills are higher than expected, that creates sudden awareness but then people become frustrated and anxious because they can’t work out why they have used so much or how they can reduce this:-
• “we were discussing 'what on earth can we be doing? What have we got that normal people don't have?'”
• “We don't use the immersion heater. It is heating. I'm sure it's heating” (reply) “You think it's heating? But it's whizzing round during the day and the heating isn't on”
• “I try to turn everything off so it’s not on standby and I just wondered where … I mean our electricity bills are huge … and I was just wondering where the electricity was going really”.
8.2 Motivation for taking part in trial
We asked why they volunteered to take part in the trial. 6 of the 10 households cited environmental reasons:-
• “nowadays with all that's in the news and media about global warming and carbon footprints and everything else…when I saw the email, I thought, ‘oooh yes, that sounds interesting’”
• “helping future generations really by deleting as much carbon emissions as possible”
• “we need to reduce our carbon footprint, we’re aware of that but we do like our home comforts”.
For 3 households, recent high electricity bills were also a strong motivation:-
• “that’s a lot for us to spend … we’ve got to make cuts for our own benefit apart from the fact we have to do it for the benefit of the climate”
• “my electricity bill was getting ridiculous!.
Finally, in a couple of cases, people simply thought the trial sounded an interesting exercise to be involved in.
• “I was just interested really”
• “She’s interested – she’s up for anything really!”
9 How people used the Smart meter
8 out of the 10 households used the Efergy meter and enjoyed the experience. Not surprisingly, there was a huge novelty impact in the first few days after installing it.
Page 12 of 30
• “the first week, we were obsessed with it, everything we turned on, we rushed to have a look at it.
• “it was a bit like a novelty game – the first week they were all laughing at me because I was quite boring about it! I started carrying it around the room”.
During this initial period, the enthusiasts carried the meter around with them checking what happened when they switched things on and off.
• “we were ‘now, turn everything off! Now turn that on!, See you how much that is. Put that on, see how much that is’”
• “We got completely nerdy about it – ‘Quick, how much is that? Put that off!’”.
Taking it to bed seemed particularly popular (amongst women anyway!):-
• “the first day, I took it up to bed with me, watching it when I turned the lights off and turned the lights on!”
• “I took it up to bed at one point so I could check with all the lights off!”
Some people tried to use the meter to track down every last bit of energy they used:-
• “I was surprised, when I went round the house turning things off trying to find the elusive last .001 or whatever, how many things we have plugged in”
• “we'd turned the fridge freezer off briefly - just long enough to find out if that was what was doing it, just while I was trying to track everything down. I kind of was going round the house going like 'right if I turn that off and that off and that off"’.
After the first few days, however, interest inevitably settled down with most people only occasionally glancing at it to monitor the current situation.
• “but I must admit, the last few weeks, I’ve not looked at it much”
• “it’s tended to sort of be there in the kitchen and we’ve seen it going up and down”
• “predominantly in the morning when we first came down – it’s always about 0.3 and when you put the kettle on, it goes up to 1. something”.
After the first few days of carrying the meter around, most people either kept it in the living room or the kitchen where they could regularly keep an eye on it.
• “most of the time, it sits on the table in here (lounge) – it’s our little pet!”
• “I kept it mostly here in the kitchen where I could see it”.
9.1 Not using the Smart meter
Two households (TH5 and TH6) reported that they did not use the meter at all but their consumption still went down. In the first case, the participants said that they hadn’t understood how the meter worked or what it was telling them.
• “I haven’t worked it out … I didn’t really understand it. I’m sorry, I didn’t get to grips with it”.
Page 13 of 30
• “I certainly haven’t used it … I certainly am not techno..”.
However, they volunteered that taking part in the trial had still made them think about their use:-
• “we’ve thought about it once or twice which is part of the object of the exercise”
• “B did tell me that using that fire in the sitting room is a very uneconomic machine and we have that on quite a bit, don't we? And we've got a tumble dryer that we have on and off. They're bad aren't they”.
It might be that these discussions, prompted by the trial, rather than the meter itself, triggered the reduction in this household’s use.
In the case of TH6, the two participants had been too busy to engage with the Efergy meter or notice the readings.
• “I’ve been really preoccupied since it’s been here and I’ve not been paying any attention to it”
• “For me, it happened, I wasn’t involved in it. I was at work, I don’t even know where the meter was – where was it?”
The post-trial interview in this household didn’t offer any substantial clues as to how or why consumption went down in this household during the trial period.
10 Positive effects of the Smart meter1. Emotional impact
In the first few days, the meter had a highly emotive impact as people switched appliances or lights on:-
• “I was absolutely gobsmacked”
• “I was amazed at the reading, I couldn’t believe it – wooooah!”
• “To watch it jump is quite scary! Because it's a big jump!”
2. General awareness
The meter had a clear impact on people’s awareness of their electricity use. The invisible was rendered visible:-
• “it’s a lot easier to see when it’s like staring you in the face”
• “it’s been fun watching what’s using a lot of electricity!”
And so people became more conscious and aware:-
• “it really has made me think about it a lot more”
• “it’s made me much more conscious of things”
• “It’s very useful as an awareness thing. Very very useful. It does make you think ‘ooh - what’s going on?’”
Page 14 of 30
3. Triggering thinking and discussion
It also triggered thinking and discussion about how much they consume and how that could improve:-
• “I’ve seen it going up and down and things like saying to you 'perhaps we ought to consolidate everything in one freezer'.”
• “it has provoked some interesting discussions – we are still married, yes!”
• “I think it’s helped my son – he’s coming up into his 20’s – I think it’s made him think in money terms like leaving the telly on..”
4. Something visible to influence children
Some parents found that the meter was an effective tool in getting their offspring (and spouses!) to think and change their behaviour:-
• “I mean some nights I can come home from work and the whole house is lit up like Blackpool Tower - the computer's on, the telly is on, the radio's on in here and there's nobody in the house! That used to drive me up the wall but they are now starting to think. I've been badgering them and I've been flashing that meter in their faces!”
• “it was the kids mostly, getting them to think. I think it’s helped them or helped me show them. I’ve had something to show them what’s happening”.
5. Identify the chief offenders – appliances, behaviours and people
The Efergy helped the participants identify some of the biggest offenders amongst their appliances:-
• “My God, the oven is terrible!”
• “the lights really, we noticed the most – the lights all over the house”
• “the dishwasher when it was in heating cycles”
And identify the energy wasting behaviours:-
• “I probably wasn’t that careful about overfilling the kettle before”
• “it was definitely the hair straighteners and the hair dryer! She was using them every flaming morning - 5 -10 minutes and then the hair dryer every evening.”
• “you make yourself a cup of tea and you’ll switch the kettle on and you go back 10 minutes later and you have to switch it on again”
And the bad offenders in the family!
• “my daughter could be in the shower for nearly 20-30 minutes at a time. I’m banging on the door ‘Get out of there!’.
• “I was conscious that he would walk out of the room and leave all the lights on – it’s made me more conscious of that!”
Page 15 of 30
• “You switch on the TV to watch the sport and you then go off and leave it!”
6. Enhanced understanding
Some households mentioned how the meter had helped them understand more about electricity – in particular that heating appliances demand the most power.
• “I think we kind of found out that things that heat stuff up use more”
• “.. it's anything that heats which is fairly obvious when you think about it but I hadn't ever really thought about it before so it was quite good from that point of view”.
• “like a kettle - why would a kettle take so much? You know, it takes more than a computer? How can that be? To me, that seems crazy but I know it's because it's heat and everything that makes the biggest change is to do with heat. That has been a real education to me to find out what things take the most.”
7. Checking everything’s off at night
Households described using the Efergy to check everything was switched off last thing at night:-
• “there were times sitting in bed, turned the light out and then try to get the little light (on the Efergy) to come on so we could read it in the dark – ‘yea, we’ve dropped! Night night, darling!’”.
• “when you go to bed at night or something like that, just check it”
• “the other habit I've managed to get them out of is switching that computer off at night. Before I hadn't really noticed, now I know, 'oh the computer's still on'.”
8. Knowing you’re being recorded
Finally, an astute 11 year old in the trial pointed out that maybe the biggest effect was knowing that your behaviour was being recorded:-
• “we also noticed that, um, the meter doesn't so much change our behaviour as it does knowing that it's being recorded”.
A young man of insight!
11 Changing behaviours
6 of the 10 households talked about conscious changes they had made to their behaviour as a result of the meter feedback. Sometimes these changes were voluntary; other times they were imposed by the ‘meter holder’! Lights and kettles topped the list:-
1. Lights
The most common change involved switching lights off.
• “it definitely has affected us and we have reduced… both of the boys have been touring the house turning lights off”
• “I was more aware of turning the lights off and things”
Page 16 of 30
• “I don’t use the spotlights as much”
2. Kettles
• “we try not to fill the kettle up so it boils more quickly”
• “they’ve all had a habit of filling up the kettle for just one cup of tea. That’s been changed! Now it’s just enough for their own cup of tea or they will ask everybody else”
• “I became quite obsessional about the kettle – instead of thinking, ‘oh, I’ll just put it on now’ and then going away and doing something.. I was thinking ‘no, no, no! I’m not going to put the kettle on until I actually need it”.
3. Auxiliary heaters
• “I turned my heater down too”
• “I have an electric heater in the bathroom and I haven’t used it since we got this. I’ve been freezing but I just can’t bring myself to do it. After the first week of finding out what things were, I haven’t put those two heaters on because it’s just criminal”
4. Electric showers
• “I have a shower after cycling or running and, if I'm in there for more than 10 minutes, it gets knocked off by some unknown hand on the system!”
• “I’m really chuffed because I’ve managed to reduce the amount of time they’re in the shower!”
5. Laundry
• “I know I've changed with the washing machine as well because that was on every day really but I've stopped that. I'd have a little basket and I'd just chuck it in whereas I wait now until I've got a bit more.”
• “I used to use the washing machine every day but now I’ve managed to get it down to 2 or 3 times a week”.
6. Oven
• “well, I’ve used the oven much less .. instead of baking potatoes several times a week, I did boiled potatoes”viii
• “I’m now aware of making the best use of the oven, if the oven’s on, making sure you are using it”
7. Turning devices off
• “I’ve been very careful about my mobile phone charger and not leaving that on”
• “I have noticed that when I go to turn the cooker on, he’s been turning it off at the wall now which is like ‘oh, it has had an effect on him!’ …So, yes, it's changed habits”
viii It was later admitted that this change (understandably) didn’t last.
Page 17 of 30
• “I was shocked how much electricity the television seemed to use. I became quite obsessional about turning the TV off”.
12 Relationship between Smart meter use and kWh reduction
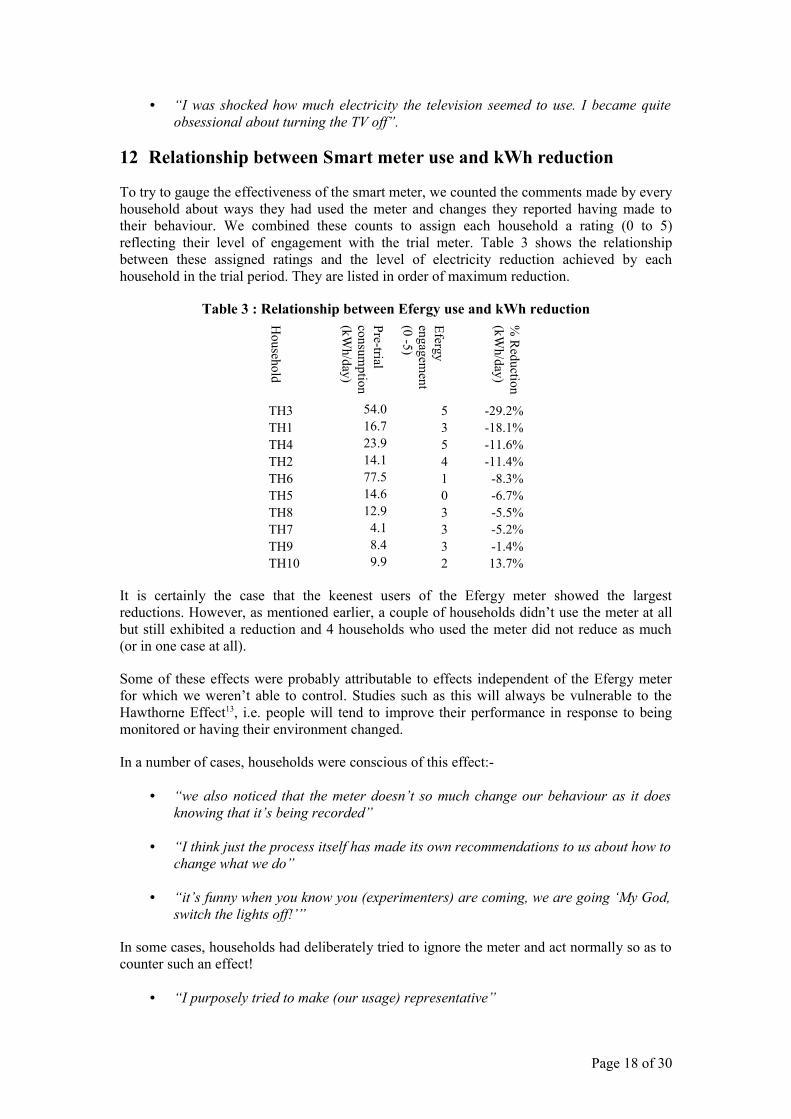
To try to gauge the effectiveness of the smart meter, we counted the comments made by every household about ways they had used the meter and changes they reported having made to their behaviour. We combined these counts to assign each household a rating (0 to 5) reflecting their level of engagement with the trial meter. Table 3 shows the relationship between these assigned ratings and the level of electricity reduction achieved by each household in the trial period. They are listed in order of maximum reduction.
Table 3 : Relationship between Efergy use and kWh reduction
Household
Pre-trial consum
ption (kW
h/day)
Efergy engagem
ent (0 -5)
% R
eduction (kW
h/day)
TH3 54.0 5 -29.2%TH1 16.7 3 -18.1%TH4 23.9 5 -11.6%TH2 14.1 4 -11.4%TH6 77.5 1 -8.3%TH5 14.6 0 -6.7%TH8 12.9 3 -5.5%TH7 4.1 3 -5.2%TH9 8.4 3 -1.4%TH10 9.9 2 13.7%
It is certainly the case that the keenest users of the Efergy meter showed the largest reductions. However, as mentioned earlier, a couple of households didn’t use the meter at all but still exhibited a reduction and 4 households who used the meter did not reduce as much (or in one case at all).
Some of these effects were probably attributable to effects independent of the Efergy meter for which we weren’t able to control. Studies such as this will always be vulnerable to the Hawthorne Effect13, i.e. people will tend to improve their performance in response to being monitored or having their environment changed.
In a number of cases, households were conscious of this effect:-
• “we also noticed that the meter doesn’t so much change our behaviour as it does knowing that it’s being recorded”
• “I think just the process itself has made its own recommendations to us about how to change what we do”
• “it’s funny when you know you (experimenters) are coming, we are going ‘My God, switch the lights off!’”
In some cases, households had deliberately tried to ignore the meter and act normally so as to counter such an effect!
• “I purposely tried to make (our usage) representative”
Page 18 of 30
• “in this household, it’s a case of it’s there, right, look at it, forget about it. Don’t do anything different because that’s where a lot of people make the mistake ‘oh, we’re being assessed, let’s change everything to what you want to see”.
So, consciousness of being trial subjects may have affected the results both ways!
Family dynamics also affected the results. In half the trial households, it was clear that there was one household member (usually female) who was far more committed to the trial and to electricity reduction than other members of the household (offspring or partners). Unless the advocate was particularly effective in using the meter as a tool to influence others’ behaviour, then it was difficult for the household, as a whole, to reduce their consumption.
• “I kept showing it to you and you weren’t interested”
• “my daughter is at that age ‘whatever, we’re not paying for it’”.
• “I think certain members of the family tried to ignore it – a big display on the wall would have been good – in every room!”
Finally, two of the households who used the Efergy meter but didn’t make significant reductions were already operating at abstemious levels of consumption pre-trial. Both households commented that, whilst keen to reduce, they had found it difficult to find changes they could make.
• “beyond trying to change your lifestyle into wouldn't have a freezer or we wouldn't watch TV, we haven't got any obvious things where you can say 'we won't use these things' and we'll reduce our consumption quite significantly. We've already made adjustments over time, the light bulbs, the fridge and all the rest of it so we have kind of thought about it at that level. So, if you wanted to actually step that down significantly, what would we do?”
• “for us it would be less about reducing our energy consumption, given we didn't manage to reduce it much at all, as much as to find alternative sources like solar….”
The lowest consumer (TH7) actually had fishing line strung around his walls to pick up daylight and glow in the dark so avoiding having to switch on the lights to navigate around the house at night!ix
However, the post–trial interviews also revealed features of current Smart Meter technology which limit its ability to help reduce consumption over time. We will explore these in the next section.
13 Shortcomings of clip-on smart meters13.1 Not aware of reductions over time
Until the post-trial interviews, we had deliberately not given the trial participants any feedback about their consumption levels nor whether their consumption had changed during the trial.
As far as possible, we wanted any changes in consumption to be a direct result of using the meter and using it in ways they had discovered, rather than ways we had suggested.
ix He had already had his meter checked by a disbelieving Electricity supplier!
Page 19 of 30

We discovered that none of the trial households used the Efergy meter to track whether their consumption had reduced (or not) over the 4 week trial although two people had used the memory to check out day to day variations. At the end of the trial, it emerged that none of the 10 households knew whether their use had actually dropped (or not) or by how much.
• “I’d be interested to know if the usage has gone up recently”
• “I haven’t checked the numbers”
“When we told them of consumption reductions they had made, most expressed surprise – they didn’t seem to think they would have changed by that amount.
• “Oh wow! That is good but I would have thought … I've used the tumble dryer loads … I probably haven't used it more than normally but I've used it loads - just circumstances really because I work full time and the weather's been dreadful. So, I've been thinking that it's going to be really high.”
• “In what respect have we changed – using lots more?”
• “Did we change? – that’s interesting”
• “How did you know that?”
Given that continual feedback is a powerful motivator and an inherent value (arguably) of having a smart meter, this finding slightly concerned us. As we analysed the interview data, however, it emerged that there were several reasons why this might have happened:-
1. No reference point with past behaviour
Most households were unaware of their daily consumption levels before the trial beyond some general sense that they were ‘high’ or ‘medium’ or ‘reasonably low’. A few quoted quarterly totals on recent bills (in monetary terms) but no-one seemed aware of what their consumption week to week or day to day was. Certainly no-one quoted ‘units’ or ‘kWh’. This is typical of the wider UK population where less than 25% regularly check their meters14.
This meant that people didn’t have a reference point from which to evaluate a change in consumption during the trial and the cumulative figures which the Efergy was showing them were totally unfamiliar to them.
We chose not to tell participants their pre-trial consumption figures because we believed that would artificially influence resultsx. They could, of course, have opted to record their first week (using Efergy) without making any changes and then compare performance across subsequent weeks but, given the novelty impact of the meter, this would have taken some planning and self discipline to do.
2. No sense of ‘normal’ current consumption levels
At installation, it was clear that most households had no sense of what their current consumption rate might be in numerical (kW) terms because they had never before seen it expressed as a live number. The number initially displayed was fairly meaningless to them until they saw it jump up or down for the first time.
x Interestingly, only one household asked us about this figure during installation.
Page 20 of 30

We discovered, at the end of the trial, that some people had interpreted our unintended reactions to their initial reading as useful clues as to what counted as a ‘normal’ or ‘high’ level. Without such feedback, they had no idea how to evaluate the numbers displayed.
• “.. I think, by the time we'd talked, the boiler had kicked in and you turned it on and you said 'oh what have you got on? - it's on 2!' and I'm thinking '2? - 2 doesn't sound very much to me - is 2 bad?!'. “
• “But also, you said, 'we never get ours down to nothing'. I think if you hadn't said that, I would have been thinking, 'I'm supposed to have got it to nothing for part of the time'. So, just in chat really, you've given me a couple of pointers…”.
We are aware that, even if we (or the meter designers) had tried to give consumers an initial sense of whether their consumption (either current or a day’s worth) was ‘low’, ‘high’ or ‘normal’, there is no fixed reference point from which to do this.
Fortunately, if people checked the meter often enough, they started to develop their own model of what is high and low and the numbers then started to mean something to them.
• “I was amazed at the reading in the morning when everybody had gone.. like the lowest I had it one morning, I couldn’t believe it, it was 236 for about 10 to 15 minutes”
People were even more confused by the alternative currencies available on the Efergy meter, i.e. cost in £’s and carbon equivalent. Everyone chose to stick with displaying the current reading as kilowatts.
3. Effort to access and interpret consumption over time
Only two households had accessed the Efergy memory. This had given them a sense of their week to week or daily variation and made them think about their fluctuating use levels:-
• “I did look at the memory … there seemed to be one week, the first or second week when it was much lower? – but didn’t we go away?”
• “generally there was a big difference between weekend and week. The lowest, I think, was 5.something - a lot of days in the week were 6 something and then at the weekend it would be like 10 or 11”.
But they found the memory confusing to use:-
• I looked at different days; it was interesting but sometimes it was confusing as well”
• “I found it confusing working out which day it was”.
The remaining 8 households hadn’t successfully accessed the memory. Some had tried once but found the interface confusing and were worried when the device appeared to move to a state they didn’t recognise.
• “it got in a state where I didn't quite know which one I was comparing it to maybe - usually it was because G had been pressing buttons”
• “I pressed the button one day and I thought, ‘oh what have I done?’ and I couldn’t get back to where I was. So I left it alone then. I thought, ‘No, I won’t touch it’”.
Page 21 of 30

• “I didn’t flick back – I didn’t work that one out”.
Others hadn’t tried to access the memory at all but still recognised that a record of their levels might have been useful and regretted not having tried to keep that themselves:-
• “I suppose it would have been a lot more useful if we had controlled it further still, woken up in the morning or went to bed and took a meter reading every day and then, 'Oh I had the hairdryer on, had hot water' etc etc - you could get it right down, really squeeze as much information out of it as possible.”
• “I didn't study it enough, that was the trouble. You'd said something about being able to see what you've done the previous week as a week but it didn't make sense to me … and then I mislaid the instructions.”.
Some smart meters allow historical data to be uploaded to a PC. For householders with the time and motivation, this might be a boon but it seems doubtful that, had such a facility been available, more than a couple of our trial households would have used it. They lead busy lives and their electricity consumption is not sufficiently interesting to them to put the extra effort in to fetch the data and study it.
• “that's one of the problems with these, I don't really know how to interpret what I'm looking at. I'd like it to tell me something without me having to go and read up to see 'what does this mean?' and 'what does that mean?' and then I've got to remember it. I'd rather have a display which told me in a way that I would understand what is happening.”
• “…it's got to be something that's so easy to use that it's not a hassle for people at all.”
• “maybe if I’d been more efficient about using the memory and checking back, it would have had more effect if you were actually recording it … I did think at one stage I should be doing that but I didn’t get round to it”.
4. Confused responsibility
Because people were aware that they were part of a trial and we had taken initial meter readings from them, some people may have felt that we were responsible for monitoring their use. This might also reflect a view that someone else (the Electricity supplier) usually does the measurement and calculations of use on behalf of the householder.
• “how much have we gone down? a lot?”
• “because we knew we’d get a report afterwards, I thought ‘Oh, I’ll wait for that – they can do the working out’”.
13.2 Can’t identify contributors
At the end of the trial, some of the enthusiastic meter users were frustrated that the meter hadn’t actually helped them identify the main appliances or activities causing their high usage, particularly over a period of time.
In analysing the interviews, there seemed to be two main problems:
1. The meter can’t identify which appliances are on or their relative loads.
2. Sudden spikes in use (e.g. kettles and hairdryers) dominate the attention and may distract from the contribution of lower usage devices which are on for longer periods of time.
Page 22 of 30
1. Can’t identify source appliance
The Efergy meter cannot identify which appliances are on and what percentage of the load they are contributing. So, once the initial drama of switching the kettle or lights on and off wanes, people become frustrated that they can’t use the meter to identify exact sources.
• “it’s sort of ‘well, where the hell are we using it?’… we don’t do roast dinners, most of what we cook would be 20 minutes in the oven… I wouldn’t have said we had a particularly heavy use oven so it’s..ummmm..”
• “there was one day when we had really high usage and I think our highest was, like, 11 or 12 and I think I worked out that it had been a day when we had both had showers …. I wondered if that's what it was - I didn't actually have a shower hanging onto the meter!.”
• “ a good thing would be like if you could … I don’t know how you’d do this … but like hook up different energy sources so then it could recognise when something starts up”.
This problem is exacerbated by appliances which automatically turn on and off.
• “I couldn't really see how much the TV used on standby because we had this sort of fluctuating thing from the freezers”
• “could it be the other things going on in the house, for example, sometimes the boiler kicks in, doesn’t it?”.
Or when there are multiple-appliance activities in progress, e.g. when cooking:-
• “If you think, it’s usually one of those times when we are all in here and the lights are on and the oven … it coincides with a time when we are using quite a bit of electricity”
And in households where there are a lot of rooms or outhouses.
• “I'm not sure it's something we do.. we've got a dehumidifier going in each shed and a heater in each shed and a heater in the greenhouse”.
• “because the freezers are in the garage, you can't hear whether they’ve cut in whereas the ones in the kitchen you can hear when the fridge has cut in so that was a bit difficult.”
2. Spike versus extended use
Sudden spikes in smart meter readings capture the attention, but can easily mask or distract from other medium or low energy appliances which are on for longer and consume more electricity over time. For example, people talked far more about their kettles than their TV’s or PC’s and some expressed surprise that the oven didn’t seem as “bad” as the kettle.
• “I mean things like the kettle being as much as an oven is a bit of a surprise”
• “and like the main lights, you’d think they’d use up loads and loads of electricity but they don’t seem to use up as much as small things like the kettle”
Page 23 of 30

• “what's really shocked me is my daughter's hair straighteners - I couldn't believe it! … but the oven wasn’t too bad I thought”
So, as well as identifying individual appliances, people need to be able to gauge the relative amount any appliance contributes over a longer period, e.g. an oven, computer or TV.
• “I don't know how you would do it is the sort of comparison of how much overall you use the energy. There's that sort of thing with the kettle - 'oh it uses a whole hell of a lot' but then it's only on for 3 minutes. The same for the television, although it seems quite low actually but the fact that you might have it on for 2 or 3 hours - it's the sort of comparison I'd want.”
• “I think if you could have more of an idea of individual things and over time, it would make a real comparison.”
14 Option to keep the meter
At the end of the trial, we offered all trial participants the option to buy the Efergy meter from us at a reduced price. Only 1 household decided to do that. Most people seemed to feel it had served its purpose and made them more aware and they could always monitor their future use with their main meter.
• “I also think that, as interesting and useful as this has been, we can always monitor our electricity use through recording the meter. I think what's interesting for us is that this has most certainly changed our behaviour and, I think just the process itself has made its own recommendations to us about how to change what we do - the light switches and the television.”
One household felt that, having been made aware of their usage, they were now more interested in purchasing a plug meter which would tell them how much each individual appliance was using.
• “I would be interested in the individual socket ones because then we could go round the house and check all the different things.”
However, 6 of the control households expressed interest in purchasing a meter and another 4 friends and relatives of trial or control households have purchased meters from us. In a community like Talybont, it might be most effective if meters like this are simply passed around from house to house.
15 Summary of Results1. Our sample of 10 trial and 10 control households showed a surprisingly high degree of
variation in electricity usage even when electric heating was factored out. Whilst the number of people in the house was a clear factor, some households used 3 times more electricity than other households of similar size and occupancy. Lack of correlations between consumption levels and appliances owned suggest that the variation might depend more on the householders’ outlook and lifestyles than on the size of their houses or the appliances they owned.
2. The Efergy smart meters had an effect. 9 of the 10 trial households reduced their electricity consumption over the 4 week period of the trial. The average reduction across all 10 households was 9%. In contrast, the consumption in the 10 control households increased by an average of 5%. Two households who did not use the Efergy meter still
Page 24 of 30

reduced their consumption suggesting that the trial suffered, to some extent, from an inevitable Hawthorne effect.
3. Households typically used twice the electricity on some days as they did on others. In some cases, they used 4 or 5 times as much. This reflected weekend versus weekday differences as well as varying social and work patterns across weekdays.
4. Most households went through a novelty period of 3 or 4 days when they carried the meter around the house (and to bed!) switching lights and appliances on and off and seeing what had the biggest effect. Their usage then settled down and they tended to leave the meter in a visible place (kitchen or living room) and occasionally check on the reading. They preferred the kW setting and only two people accessed the memory function at all. No-one kept track of their consumption over the 4 week period or knew whether they had made a reduction.
5. Two households made little or no use of the meter. One because they did not understand how it worked or what it was telling them; the other because they were too busy.
6. The majority of the households enthused about the positive affects of the Efergy meter – for the first time their electricity became “visible” and the live readings had a dramatic impact on their awareness and understanding of their appliances and electricity-based activities. This in turn triggered thinking, debate and changes in family behaviour. Parents found it a useful tool for influencing their children’s behaviour.
7. In direct response to the meter’s feedback, householders made changes to their use of: lights, kettles, auxiliary heaters and showers, washing machines, tumble dryers and ovens. They also started turning more devices off when not in use.
8. The keenest users of the Efergy meters made the largest reductions (although they were unaware of the extent of these). Some households sought to behave ‘as normal’ during the trial in order not to mess with our readings. Other households were clearly affected by knowing they were being recorded.
9. Households which were already abstemious in their electricity use before the start of the trial enjoyed having the meter but found it difficult to reduce their consumption.
10. The trial revealed several limiting factors of current smart meter design and technology:-
There was no quick and easy way for participants to see whether their electricity consumption was reducing over time. This was because:-
- Most households had no idea what their pre-trial consumption levels were so had no point of reference from which to identify subsequent reductions in consumption.
- Accessing Efergy memory involved a moded interface which was beyond either the confidence and/or motivation level of most participants.
- The few who successfully accessed memory found the stored readings confusing because the large up/down variations day to day and week to week puzzled them and made it impossible to see a trend without writing all the readings down.
• Most households had no idea what their live consumption would be (in kW terms) because they had never witnessed this before. The kW number displayed was meaningless to them and they had no initial conception of whether it was high or low. As they witnessed the number jumping up and down over a period of time, they started to attach some meaning to it.
Page 25 of 30
• After a few days, enthusiastic users became frustrated that they could not identify exactly which appliances were on at any point in time and which were the biggest consumers over time. They wanted this information in order to identify what would achieve the biggest reductions.
• Sudden jumps in meter readings dominated people’s attention and caused the most interest and concern. Unfortunately, these often masked or distracted people’s attention away from other appliances which used more energy spread over a longer period of time. Such effects are not easy to spot with current Smart meters.
16 Implications of Trial Results 16.1 Problem of useful reference points
Without a reference point, people have little sense of their own electricity consumption. If the degree of variation in our small sample is typical, then the regional averages published by BERR are not very helpful unless they also publish the distributions and associated demographics. Certainly informing our participants of the Powys average (at the end of the trial) did not seem to be very helpful to them unless they just happened to have a rate fairly close to that average.
It might be difficult to give people a feel for ‘normal’ consumption for a size of house or occupancy if, as we suspect, the variation is determined to a significant extent by people’s outlook and lifestyle.
16.2 Where smart meters may be effective (or not)
The results from this small study suggest that the simple feedback provided by cheap, clip-on smart meters can significantly reduce electricity consumption in households where:-
• discretionary electricity use is fairly high.
• they are motivated to make a change (for financial or environmental reasons) but are fairly ignorant as to their current usage.
• there is either a dominant family member who can influence the others’ behaviour or all parties (particularly couples) are equally motivated.
There is a campaign for a national roll-out of Smart Meters to be subsidised by the government15. These would be more sophisticated than the clip-on variety; they would be provided and installed by the electricity suppliers and feed information both to the consumer and back to the supplier. It is not clear, from our study, that a universal roll out would by itself reduce consumption across the board.
Quite simple feedback can convert motivation into knowledge and action, but, feedback (even of a sophisticated kind) may not generate motivation if that is not already presentxi.
The perception of who owns the meter and the data it captures may also affect any reductions made. Even in our trial, some users thought that the data being captured was for our benefit rather than theirs. The historical practice of suppliers owning and reading meters may not encourage individual responsibility for reducing consumption.
xi Just as the feedback from bathroom scales can help you lose weight but may not make you want to.
Page 26 of 30

Given that most of the impact of smart meters happens in the first week or so, short term rental of the device is a viable option, if there is an economical way for suppliers to offer such a service. If smart meters start to provide better feedback over longer periods (see below), then the situation changes.
16.3 Two types of customer – open design space
The results of this trial suggest to us that there may be two different customer segments for smart meters:-
1. ‘Normal people’ – people who want to know about their electricity and are motivated to make reductions but they are either not willing or able to devote time and effort into learning to use a smart meter or accessing, downloading and interpreting stored data. For these people, the smart meter needs to be cheap, simple, and ‘in your face’. A glance at it needs to give them the instantaneous and historical feedback they need. If the device offers more complex options, then these must not get in the way of the everyday simple display and operations.
2. Eco-Geeks –people who are motivated to track and learn about usage patterns of individual appliances and their behaviour over time. They are keen to collect all the information they can and are willing to study charts and graphs. We imagine they’d be happy to do this on their PC’s or smart phones.
Both would benefit from standardisation of the sensor and transmitter but not the smart meter itself. This would open up the market for independent companies and/or suppliers to compete on creative new appliance designs, simple user interfaces, smarter displays as well as more sophisticated information or analysis tools for eco-geeks and professional energy auditors.
16.4 Design challenges for smart meters
16.4.1 Presenting historical information
To help motivate consumers to initiate and maintain electricity reductions, ongoing feedback about usage over days and weeks is important. Our results suggest that accessing these data in numerical form via a memory function involves too many steps and too much interpretation effort for the average householder. The fact that usage varies week to week and can be 2 or 3 times as much one day than another also makes it hard for people to readily spot reductions over time.
Displaying usage information graphically and being able to zoom in and out to view different time periods displayed in a consistent form (e.g. last hour, yesterday, last week, last month, etc) would help people assimilate this complex information but would require either larger, more expensive displays or transfer to a PC or smart phone. One way forward might be to have a stand-alone data logger capture data from the sensor/transmitter and present it through a web page available anywhere on the home network or perhaps maintained on a public web-site by the electricity supplier.
16.4.2 Lack of motivating reference points
People need to feel that early changes they make (in response to the initial impact of the meter) have made a difference. Unfortunately, smart meters don’t know what the previous consumption levels were. After the first week or so, the meter can compute a ‘normal’ consumption level and show the user whether subsequent weeks or days are ‘higher’ or ‘lower’ than this. But, if the user already made significant changes in Week 1, then they might struggle to reduce further in weeks 2, 3, 4 and not feel that they had made progress.
Page 27 of 30
A meter provided and installed by the supplier could be pre-programmed with an historical kWh/day rate. Alternatively, sophisticated users could enter a daily kWh average at the point of installation (if they can calculate it from recent electricity bills, or deduce it from their monthly standing order rate if that’s how they pay for electricity). They could also be invited to enter their own reduction goal (e.g. 10%) and the meter could subsequently feed back progress towards that goal.
16.4.3 Interpreting high and low consumption
In our trial, much of the impact which the smart meters had was a result of the eye-catching jumps in wattage when the user switches a device on or off. These have a shock element which stimulates behavioural change. Media reviews of other smart meters suggest this phenomenon is common (at least at the novelty stage). The attractively designed Wattson16
meter even glows red if one’s current usage is ‘higher than average’ and blue if it’s ‘lower’.
But this raises the question over what time period to compute and compare these averages. If a meter turns red the moment the kettle goes on, it will certainly catch attention. However, given that the kettle is only on for 3 minutes, it probably isn’t impacting your daily average at that point and users may soon ignore such brief spikes in use whether they glow red or not. It might be more helpful if the meter indicated whether your last few hours of consumption were either raising or reducing your daily average. Unfortunately, this is a tricky cognitive (and indeed philosophical) problemxii and it is difficult to know without testing different ways of providing such feedback.
The second problem is identifying which appliances are contributing the most to your daily or weekly consumption. When users’ attention is attracted by high energy appliances which trigger sudden spikes in use, they may well overlook the larger contributors over time. The current meters have no way of identifying individual appliances and, even if such a facility became available, communicating the results in simple but powerful ways will be challenging. Most households have numerous appliances operating at any one time. Maybe a ‘sinners list’ of the top 5 consumption devices (in % terms) which changed dynamically as the day or week progressed would create interest and direct attention to the worst offenders?
17 Conclusion
The Talybont trial results show that simple numerical feedback from today’s clip on smart meters can help people to reduce their electricity consumption. The effect comes from showing people, for the first time, the amount of electricity they are currently consuming in their everyday activities. The meters seem most effective where discretionary electricity use is relatively high and the householders are motivated to reduce it.
But understanding electricity consumption is a tricky cognitive problem. (Try explaining a kWh to someone!). Designing attractive, inexpensive, smart meters which display simple current and historical feedback which is easily understood and stimulates behaviour change is a challenge. We would like to see the data collection and transmission part of the problem standardised in UK homes but the design of the end-user displays and other software tools for analysis and presentation left open to encourage innovation and competition between both appliance designers and electricity suppliers.
xii One is reminded of the old Punch cartoon of the lady stopped by police for exceeding the 30 mph speed limit. “Nonsense officer”, she retorts, “I haven’t been out an hour!”.
Page 28 of 30

18 Acknowledgements
We are grateful to the 10 trial and 10 control households who took part in the trial and for the help and cooperation of the Talybont-on-Usk Energy Group and Efergy Ltd.
Page 29 of 30
1 www.talybontenergy.co.uk
2 Dobbyn, J. and Thomas, G. Seeing the Light: the impact of micro-generation on the way we use energy, The Hub Research Consultants (October 2005).
3 Darby, S. The effectiveness of feedback on energy consumption, A review for DEFRA of the literature on metering, billing and direct displays, Environmental Change Institute, University of Oxford, (April 2006).
4 http://www.smartplanet.com/reviews/tech/roundups/10000675/best-energy-monitors.htm
5 www.prospectory.co.uk
6 http://www.cse.org.uk/cgi-bin/news.cgi?full&archive&20070725&1294
7 www.efergy.com
8 2006 BERR Statistics
9 Darby, S. (April 2006) op.cit.
10 Darby, S. (April 2006) op.cit.
11 Roethlisberger F. J. and Dickson, W. J. Management and the worker: An account of a research program conducted by the Western Electric Company, Hawthorne Works, Chicago, Cambridge MA: Harvard University Press (1941).
12 Dobbyn, J. and Thomas, G. (October 2005) op.cit.
13 Roethlisberger F. J. and Dickson, W. J. (1941) op cit.
14 Darby, S. (April 2006) op.cit.
15 http://www.energysavingtrust.org.uk/uploads/documents/aboutest/GB4.pdf
16 http://www.diykyoto.com/