the synthesis and characterization of noble metal
TRANSCRIPT

THE SYNTHESIS AND CHARACTERIZATION OF NOBLE METAL NANOPARTICLES,
THEIR INTERACTION WITH DYES AND USES IN ANTIMICROBIAL SURFACES
PHD IN CHEMISTRY
HAZEL KITCHING UNIVERSITY COLLEGE LONDON
2017
For Grandpa
‘Mischief managed.’

1
Declaration
I, Hazel Kitching, confirm that the work presented in this thesis is my own. Where information
has been derived from other sources, I confirm that this has been indicated in the thesis.
2
Abstract
Herein is presented the synthesis and characterization of a range of gold silver and bimetallic
nanoparticles using a variety of synthetic routes. Particles of different sizes and shapes were
fabricated by using different reaction conditions and capping agents. Mesoscale linear
arrangements of tiopronin-capped silver nanoparticles were fabricated using a sonication
step. The interaction of all synthesised particles with a range of cationic and anionic dyes
was investigated and yielded mixed results. Enhanced absorption of the dye maxima was
seen in some cases when combined with citrate-capped gold nanoparticles, with novel dye-
nanoparticle combinations which exhibit this behaviour reported. Aggregation of these
particles was also observed at high concentrations of cationic dyes. It was established that
aggregation was not due to increasing ionic strength of the solution as previously postulated
but an attractive charge-charge mechanism between the dye molecules and citrate shell.
It is well known that dye molecules can act as antimicrobial agents. Literature has shown that
conjugation of these dyes with a nanoparticle can enhance the bacterial kill rate. The
antibacterial capabilities of citrate-stabilised gold and silver nanoparticles were therefore
evaluated against gram positive and gram negative organisms. Excellent kill rates were
observed for several novel combinations of dye and nanoparticle. Acridine orange with silver
nanoparticles, a previously unreported conjugate, delivered complete kill of both E. coli and
S. aureus in five hours both under a white light source and in the dark. This shows potential
for further use as a self-sterilising surface due to the potency and rapidity of the bactericidal
response.
Novelty of the work
Novel combinations of dyes and nanoparticles that exhibit enhanced optical absorption of
the dye maxima were found. Additionally a pre-existing theory concerning the cause of
nanoparticle aggregation at high dye concentrations was proven to be incomplete and a new

3
theory proposed. The new dye-nanoparticle combinations were used for antimicrobial
testing with excellent results attained for both gram positive and gram negative organisms.
Silver nanoparticles were used in conjunction with dyes to make antimicrobial surfaces for
the first time. Light and dark kill rates for acridine orange combined with citrate-capped silver
nanoparticles show potential for commercialization as antimicrobial surfaces.
4
List of publications
‘Self-assembly of metallic nanoparticles into one dimensional arrays’
H. Kitching, M. J. Shiers, A. J. Kenyon and I. P. Parkin, J. Mater. Chem. A., 2013, 1, 6985-6999
‘The interaction of gold and silver nanoparticles with a range of anionic and cationic dyes’
H. Kitching, A. J. Kenyon and I. P. Parkin, Phys. Chem. Chem. Phys., 2014, 16, 6050-6059
‘The antimicrobial capacity of citrate-stabilised silver and gold nanoparticle-dye conjugates for self-sterilising surfaces’
H. Kitching, S. Sehmi, A. J. Kenyon and I. P. Parkin, J. Mater. Chem. B., 2017, pending publication

5
Acknowledgements
In memory of Dr Russell Binions
21/11/1978 – 13/04/2017
This work would not have been possible without the unending patience and support of
Professor Ivan Parkin and Professor Tony Kenyon. I thank them from the bottom of my heart
for always being on my side, crashing in with invaluable advice and for bearing with me
throughout the good and the bad. Thanks also go to everyone who helped in the lab and with
analysis, particularly to Joe Bear, Sandeep Sehmi and Sacha Noimark. The EPSRC is thanked
for funding through the EngDoc centre.
I would also like to thank Demus and Annie for their continued excellent friendship, Mum
and Rod for their endless and multifaceted support, Alex for his perennially unique
perspective, Jarvis and George for the inspiration, Binions for the turkey/life advice and Mike
for the inspiration and ‘help’. Thanks also to my sister Louise for the good times, the bad
ideas and for always keeping The Faith.
I want to thank Simon, my rock, who always makes me challenge myself even when it is
uncomfortable to do so. His unquestioning belief in me singlehandedly kept me going
through some dark times and his advice, though not sugarcoated, is invaluable. He’s also
dead good at maths, physics and computers which has saved me (and this file) on multiple
occasions, so on behalf of my sanity, this document and everything else on my hard drive –
thank you.
Most thanks of all go to my boys, Ben Robinson and Joe Manzi, without whom I could very
well not be here. Cheers for the laughs, tears, happy walls, board games, meat binges and
common sense. Thanks for keeping your sense of humour when I had lost mine. It has been
a privilege to share the ride with you both. Chang on!

6
List of Abbreviations
AFM: atomic force microscopy
A.U.: arbitrary units
BHI: brain heart infusion
cfu: colony forming units
CNT(s): carbon nanotube(s)
CTAB: cetyltrimethylammonium bromide
DLS: dynamic light scattering
DMF: dimethylformamide
DNA: deoxyribonucleic acid
EBL: electron beam lithography
EDC: 1-(3-dimethylamino)propyl)-3-ethylcarbodiimide methiodide
HAI(s): hospital acquired infection(s)
HEPES: 2-[4-(2-hydroxyethyl)-1-piperazinyl]ethane-sulfonic acid
HIV: human immunodeficiency virus
HpD: haematoporphyrin derivative
HSV: herpes simplex virus
LAAA(s): light activated antimicrobial agent(s)
LED: light emitting diode
MRSA: methicillin resistant Staphylococcus aureus
NP(s): nanoparticle(s)
PBS: phosphate buffered saline
PDD: photodynamic diagnosis
PDT: photodynamic therapy
ppb: parts per billion
ppm: parts per million
PVP: Poly(vinyl pyrrolidone)
RNA: ribonucleic acid
ROS: reactive oxygen species

7
SERS: Surface enhanced Raman scattering
SPR: Surface plasmon resonance
TB: tuberculosis
TEM: transmission electron microscopy
TMV: tobacco mosaic virus
UV: ultraviolet
UV-vis: Ultraviolet-visible spectroscopy
XRD: X-ray diffraction

8
Table of Figures
Figure 1.1 Image showing the red shift in absorption maximum with increasing aspect ratio
of gold nanorods. Image from El-Sayed et al.19 ..................................................................... 31
Figure 1.2 TEM images showing extended linear arrays of gold nanoparticles. Scale bars all
represent 200 nm. I-III show the structures; IV-V show higher magnification sections of I and
II. Figure reproduced with permission from Deng et al.78Different approaches have been
employed to yield similar results. Conductive wires of silver nanoparticles decorated DNA
were produced by Braun et al.80 DNA strands were strung between gold electrodes at a
separation of 12 µm.80 Ag+ ions were then ion exchanged and conjugated with amino groups
on the surface of the DNA before being reduced. Repeating the ion exchange and reduction
steps resulted in the formation of silver nanoparticles along the DNA wire (Figure 1.3). .... 38
Figure 1.3 AFM image showing a silver wire templated on DNA connected between gold
electrodes at 12 μm separation. Figure reproduced with permission from Braun et al.80 ... 38
Figure 1.4 (a) AFM and (b) TEM images of the ridge-like structure formed by linear assembly
of gold nanoparticles on a DNA nanogrid. Figure reproduced with permission from Kiehl et
al88. ......................................................................................................................................... 39
Figure 1.5 TEM image showing alternating parallel rows of 5 nm and 10 nm gold nanoparticles
on a DNA grid. Figure reproduced with permission from Kiehl et al.87 ................................. 39
Figure 1.6 TEM images showing (a) double helical arrays of Au nanoparticles on peptide
nanofibrils obtained at pH = 3.5, and (b) single chain arrays obtained at pH = 6. Figure
reproduced with permission from Wang et al.93 ................................................................... 40
Figure 1.7 TEM image of a single TMV, showing dense coverage of Au nanoparticles. Figure
reproduced with permission from Dujardin et al.94 ............................................................... 41
Figure 1.8 TEM image of gold nanoparticles on a peptide nanowire. Figure taken with
permission from Djalali et al.99 .............................................................................................. 42
9
Figure 1.9 TEM images of silver nanoparticles in the central capillary of a carbon nanotube.
Scale bars represent 5 nm. Figure reproduced with permission from Ugarte et al107. ......... 43
Figure 1.10 TEM image showing the self-assembly of gold nanoparticles on the outer surface
of a CNT. Figure taken with permission from Fullam et al. 108 ............................................... 44
Figure 1.11 TEM image showing (a) the alignment of gold nanoparticles along the ridges of
an amorphous carbon substrate, and (b) a high-magnification image of a single nanoparticle
chain showing exceptional linearity. Figure reproduced with permission from Hutchinson et
al.122 ........................................................................................................................................ 45
Figure 1.12 TEM image showing ring-like structures of gold nanoparticles formed on a
polylysine support. Image with permission from Dai et al. 130 .............................................. 46
Figure 1.13 TEM image showing a coiled wire of fused silver nanoparticles obtained by
treatment with supercritical water at 400 °C at 49 MPa. Reaction time was 60 minutes. Scale
bar represents 100 nm. Figure from Chang et al.138 .............................................................. 48
Figure 1.14 Illustration showing the mechanism of formation of linear chains of gold
nanoparticles in ethanol. Figure adapted from Liao et al.139 ................................................. 49
Figure 1.15 TEM images showing (a) 6nm diameter silver wires, and (b) linear arrays of 2nm
silver nanoparticles. Figure reproduced with permission from Viau et al.166 ........................ 51
Figure 1.16 TEM images showing progressively longer chains of gold nanoparticles
encapsulated in amphiphilic poly(styrene-block¬-acrylic acid) by exposure to increasing
concentrations of 1-(3-dimethylamino)propyl)-3-ethylcarbodiimide methiodide (EDC): (a)
[EDC] = 0 µM; (b) [EDC] = 55 mM; (c) [EDC] = 87 mM. Figure with permission from Kang et
al.180 ........................................................................................................................................ 53
Figure 1.17 High-magnification TEM images of chains of triblocks obtained in the DMF/water
mixture with water concentrations of 10 wt% (a) 10 wt% and (b) 15 wt%. The scale bar is 50
nm. Figure with permission from Rubinstein et al. 182 ........................................................... 53

10
Figure 1.18 Image showing the colour change observed on adding mercury ions to a colloidal
suspension of peptide-functionalized gold nanoparticles. Image used with permission from
Si et al.171 ................................................................................................................................ 58
Fig. 1.19 The binding of 1-mercapto-6-hexanol to gold nanoparticle chains measured in real-
time. The graph shows the change in resistance when the analyte is added at approx. 50 s.
The image above the graph shows numerous chains of gold particles spanning the gap
between the electrodes. Graph with permission from Leiterer et al.215 ............................... 58
Figure 1.20 Infographic showing the proportion of S. aureus bloodstream isolates accounted
for by methicillin-resistant species in Europe in 2010. Image with permission from
Antimicrobial resistance surveillance in Europe, 2010 228 ...................................................... 61
Figure 1.21 Extensive lupus vulgaris cured after 1 year of heliotherapy. Image with permission
from Daniell and Hill.234 ......................................................................................................... 62
Figure 1.22 Scheme showing the mechanism of photodymanic therapy. Image with
permission from Dolmans et al.235 ......................................................................................... 64
Figure 2.1 The structure of 2-[4-(2-hydroxyethyl)-1-piperazinyl]ethane-sulfonic acid (HEPES)
showing the piperazine ring. .................................................................................................. 75
Figure 2.2 UV-vis spectrum of gold nanoparticles made using the Turkevich citrate reduction
method. .................................................................................................................................. 80
Figure 2.3 TEM images showing gold nanoparticles synthesised by the Turkevich method 81
Figure 2.4 UV-vis spectrum of silver nanoparticles synthesised by the Turkevich citrate
reduction method .................................................................................................................. 82
Figure 2.5 TEM images showing silver nanoparticles synthesised by the Turkevich method.
Irregularities are seen in particle size and morphology......................................................... 82
Figure 2.6 Photograph showing the progression in colour as molar ratio of gold to silver
changes in solutions of citrate-stabilised gold-silver nanoparticles. A = pure silver, B = 1:3
Au:Ag, C = 1:1 Au:Ag, D = 3:1 Au:Ag, E = pure gold. .............................................................. 83

11
Figure 2.7 UV-vis absorption spectra showing the mean spectrum of silver-gold nanoparticles
synthesised via the citrate reduction method. Particles had molar ratios of 1:3, 1:1 and 3:1
gold:silver. .............................................................................................................................. 84
Figure 2.8 Graph showing the change in position of the SPR maximum as molar ratio of gold
to silver increases. .................................................................................................................. 86
Figure 2.9 Illustration showing different types of gold-silver particles that can form. A: silver
core, gold shell; B: gold core, silver shell; C: silver-rich alloy core, gold-rich alloy shell; D:
alloyed; E: gold-rich alloy core, silver-rich alloy shell. ........................................................... 86
Figure 2.10 TEM images showing bimetallic silver-gold particles synthesised using a molar
ratio of 1:3 Au:Ag ................................................................................................................... 88
Figure 2.11 TEM images showing bimetallic silver-gold particles synthesised using a molar
ratio of 1:1 Au:Ag ................................................................................................................... 89
Figure 2.12 TEM images showing bimetallic silver-gold particles synthesised using a molar
ratio of 3:1 Au:Ag ................................................................................................................... 89
Figure 2.13 UV-vis spectrum of tiopronin-capped silver nanoparticles dissolved in water at a
rate of 1 mg/mL. .................................................................................................................... 91
Figure 2.14 TEM image showing as-prepared tiopronin-capped silver nanoparticles. Scale bar
corresponds to 100 nm. ......................................................................................................... 91
Figure 2.15 TEM image showing as-prepared tiopronin-capped silver nanoparticles. Scale bar
corresponds to 1 µm. ............................................................................................................. 92
Figure 2.16 TEM images showing linear arrays of tiopronin-capped silver particles formed as
a result of sonication.............................................................................................................. 93
Figure 2.17 UV-vis spectrum of CTAB-stabilised gold nanorods synthesised by a seed-
mediated growth method. ..................................................................................................... 94

12
Figure 2.18 TEM images of gold nanorods obtained by a seed and growth synthesis, showing
A&B: gold nanorods; C: a variety of differently shaped particles within the same sample; D:
lattice planes of crystalline gold within a rod. ....................................................................... 96
Figure 2.19 UV-vis absorption spectrum of a solution of gold branched nanocrystals (AuBNCs)
............................................................................................................................................... 97
Figure 2.20 TEM images of branched gold nanocrystals produced by reduction of auric acid
using a HEPES buffer. ............................................................................................................. 98
Figure 3.1 UV-vis absorption spectra of malachite green in a solution of gold nanoparticles.
‘Dye’ corresponds to the absorption spectrum of 20 µM malachite green dye on its own; ‘Au
NPs’ to the absorption spectrum of 5 mM gold nanoparticle solution only. ‘1 mL’ corresponds
to the absorption spectrum of 1 mL 20 µM malachite green in 16 mL 5 mM gold nanoparticle
solution. 2 mL corresponds to the absorption spectrum of 2 mL malachite green in 16 mL
nanoparticle solution etc. Shoulder indicative of aggregation is indicated by the black arrow.
............................................................................................................................................. 107
Figure 3.2 UV-vis absorption spectra of rhodamine 6G in a solution of gold nanoparticles.
‘Dye’ corresponds to the absorption spectrum of 20 µM rhodamine dye on its own; ‘Au NPs’
to the absorption spectrum of 5 mM gold nanoparticle solution only. ‘1 mL’ corresponds to
the absorption spectrum of 1 mL 20 µM rhodamine in 16 mL 5 mM gold nanoparticle solution.
2 mL corresponds to the absorption spectrum of 2 mL rhodamine in 16 mL nanoparticle
solution etc. The peak that forms as nanoparticles aggregate is indicated by a black arrow.
............................................................................................................................................. 108
Figure 3.3 UV-vis absorption spectra of toluidine blue in a solution of gold nanoparticles. ‘Dye’
corresponds to the absorption spectrum of 5 µM toluidine blue dye on its own; ‘Au NPs’ to
the absorption spectrum of 5 mM gold nanoparticle solution only. ‘1 mL’ corresponds to the
absorption spectrum of 1 mL 5 µM toluidine blue in 16 mL 5 mM gold nanoparticle solution.
2 mL corresponds to the absorption spectrum of 2 mL toluidine blue in 16 mL nanoparticles,

13
etc. Black arrow indicates maximum enhancement of the absorption after 6 mL of toluidine
blue had been added. Dotted grey arrow indicates decrease in absorbance of the
nanoparticle peak as a function of dilution; dashed grey line shows the increase in
absorbance of the dye from the start of the experiment to the enhanced absorption observed
at 6 mL dye added. Solid grey arrow shows the decrease in intensity and slight red shift of
the aggregation peak as further aliquots of toluidine blue after 6 mL are added. ............. 109
Figure 3.4 Graph comparing the UV-vis absorption spectra of toluidine blue at 1.36 µM (blue
line), gold nanoparticle solution at 3.63 mM (red line), the spectra of toluidine blue (1.36 µM)
and gold nanoparticle solution (3.63 mM) added together to give a mathematical estimate
of the absorption spectrum that could be expected if there were no electronic interaction
between toluidine blue and the gold particles (green line), and finally the enhanced
absorption of toluidine observed experimentally (purple line)........................................... 110
Figure 3.5 UV-vis absorption spectra of crystal violet in a solution of gold nanoparticles.
Maximum enhancement of the absorption after 7 mL crystal violet had been added is
indicated by a black arrow. Grey dotted arrow shows the decrease in absorption of the
nanoparticles as a function of dilution; dashed grey arrow shows the increase in absorption
of the dye from the start of the experiment to the enhanced absorption observed at 7 mL
dye added. Solid grey arrow shows the decrease in intensity and slight red shift of the
aggregation peak as further aliquots of crystal violet after 7 mL are added....................... 111
Figure 3.6 Graph comparing the UV-vis absorption spectra of crystal violet at 1.52 µM (blue
line), gold nanoparticle solution at 3.48 mM (red line), the spectra of crystal violet (1.52 µM)
and gold nanoparticle solution (3.48 mM) added together to give a mathematical estimate
of the absorption spectrum that could be expected if there were no electronic interaction
between crystal violet and the gold particles (green line), and finally the enhanced absorption
of crystal violet observed experimentally (purple line). ...................................................... 112

14
Figure 3.7 UV-vis absorption spectra of acridine orange with a solution of gold nanoparticles.
Black arrow indicates the new peak that forms after 3 aliquots of acridine orange have been
added. Dashed grey arrow shows the increase in absorption and red shift from the start of
the experiment to the enhanced absorption observed at 3 mL dye added. Solid grey arrow
shows the decrease in intensity and slight red shift of the aggregation peak as further aliquots
of acridine orange after 3 mL are added. ............................................................................ 113
Figure 3.8 Graph comparing the UV-vis absorption spectra of acridine orange at 3.75 µM
(blue line), gold nanoparticle solution at 4.21 mM (red line), the spectra of acridine orange
(3.75 µM) and gold nanoparticle solution (4.21 mM) added together to give a mathematical
estimate of the absorption spectrum that could be expected if there were no electronic
interaction acridine orange and the gold particles (green line), and finally the enhanced
absorption of crystal violet observed experimentally (purple line). ................................... 114
Figure 3.9 A generalised scheme depicting the changes observed in the UV-vis spectra as a
cationic dye is added to a solution of gold nanoparticles. Arrows on spectra indicate general
trends observed in peak intensity and red shift. ................................................................. 115
Figure 3.10 UV-vis absorption spectra of rose bengal with a solution of gold nanoparticles.
Isosbestic points are indicated by black arrows. ................................................................. 117
Figure 3.11 UV-vis absorption spectra of naphthol green with a solution of gold nanoparticles.
Isosbestic points are indicated by black arrows. ................................................................. 117
Figure 3.12 UV-vis absorption spectra of 2, 7-dichlorofluorescein with a solution of gold
nanoparticles. ...................................................................................................................... 118
Figure 3.13 UV-vis spectra showing the effect of titrating aqueous 5 µM potassium chloride
solution against a solution of citrate-capped gold nanoparticles. ...................................... 119
Figure 3.14 UV-vis spectra showing the effect of titrating aqueous 20 µM potassium chloride
solution against a solution of citrate-capped gold nanoparticles. ...................................... 119
15
Figure 3.15 Naphthol green and silver nanoparticles. Isosbestic points indicated by black
arrows. ................................................................................................................................. 120
Figure 3.16 Rose bengal and silver nanoparticles. Isosbestic points indicated by black arrows.
............................................................................................................................................. 121
Figure 3.17 2, 7-dichlorofluorescein with silver nanoparticles. Isosbestic points indicated by
black arrows. ........................................................................................................................ 121
Figure 3.18 UV-vis absorption spectra of malachite green with a solution of silver
nanoparticles. Isosbestic points shown by black arrows. .................................................... 122
Figure 3.19 UV-vis absorption spectra of rhodamine 6G with a solution of silver nanoparticles.
Isosbestic points indicated by black arrows. ....................................................................... 122
Figure 3.20 UV-vis absorption spectra of toluidine blue with a solution of silver nanoparticles
............................................................................................................................................. 123
Figure 3.21 UV-vis absorption spectra of crystal violet with a solution of silver nanoparticles.
Isosbestic points indicated by black arrows......................................................................... 123
Figure 3.22 UV-vis absorption spectra of acridine orange with a solution of silver
nanoparticles ....................................................................................................................... 124
Figure 3.23 UV-vis spectra showing the titration of 5 mM toluidine blue with a solution of
citrate stabilised silver-gold nanoparticles made using a gold to silver ratio of 1:3. .......... 127
Figure 3.24 UV-vis spectra showing the titration of 5 mM crystal violet with a solution of
citrate stabilised silver-gold nanoparticles made using a gold to silver ratio of 1:3. A second
peak was seen to develop at ~680 nm as the titration progressed. .................................... 127
Figure 3.25 UV-vis spectra showing the titration of 20 µM naphthol green with a solution of
citrate stabilised silver-gold nanoparticles made using a gold to silver ratio of 1:3 ........... 128
Figure 3.26 UV-vis spectra showing the titration of 5 mM toluidine blue with a solution of
citrate stabilised silver-gold nanoparticles made using a gold to silver ratio of 1:1 ........... 129

16
Figure 3.27 UV-vis spectra showing the titration of 5 mM crystal violet with a solution of
citrate stabilised silver-gold nanoparticles made using a gold to silver ratio of 1:1 ........... 129
Figure 3.28 UV-vis spectra showing the titration of 20 µM naphthol green with a solution of
citrate stabilised silver-gold nanoparticles made using a gold to silver ratio of 1:1 ........... 130
Figure 3.29 UV-vis spectra showing the titration of 5 mM toluidine blue with a solution of
citrate stabilised silver-gold nanoparticles made using a gold to silver ratio of 3:1 ........... 131
Figure 3.30 UV-vis spectra showing the titration of 5 µM crystal violet with a solution of
citrate stabilised silver-gold nanoparticles made using a gold to silver ratio of 3:1 ........... 132
Figure 3.31 UV-vis spectra showing the titration of 20 µM naphthol green with a solution of
citrate stabilised silver-gold nanoparticles made using a gold to silver ratio of 3:1 ........... 132
Figure 3.32 UV-vis spectrum of gold branched nanocrystals synthesised using the HEPES
buffer and a solution of auric acid. Two SPR peaks are seen at 339 and 546 nm. .............. 134
Figure 3.33 UV-vis spectrum of the titration between gold branched nanocrystals and
toluidine blue ....................................................................................................................... 136
Figure 3.34 UV-vis spectrum of the titration between branched gold nanocrystals (AUBNCs)
and crystal violet .................................................................................................................. 136
Figure 3.35 UV-vis spectrum of the titration between branched gold nanocrystals and rose
bengal ................................................................................................................................... 137
Figure 3.36 UV-vis spectrum of the titration between branched gold nanocrystals and
naphthol green ..................................................................................................................... 137
Figure 3.37 The structure of 2-[4-(2-hydroxyethyl)piperazin-1-yl]ethanesulfonic acid (HEPES)
............................................................................................................................................. 138
Figure 3.38 UV-vis spectra showing the titration between CTAB-stabilised gold nanorods and
5 µM toluidine blue. ............................................................................................................. 139
Figure 3.39 UV-vis spectra showing the titration between CTAB-stabilised gold nanorods and
20 µM acridine orange. ........................................................................................................ 140

17
Figure 3.40 The structure of cetyltrimethylammonium bromide (CTAB) ............................ 141
Figure 3.41 UV-vis spectra showing the titration between CTAB-stabilised gold nanorods and
20 µM naphthol green. ........................................................................................................ 141
Figure 3.42 UV-vis spectrum of the titration of tiopronin-capped silver nanoparticles (Ag-tio
NPs) with acridine orange .................................................................................................... 142
Figure 3.43 UV-vis spectrum of the titration of tiopronin-capped silver nanoparticles (Ag-tio
NPs) with crystal violet ........................................................................................................ 143
Figure 3.44 UV-vis spectrum of the titration of tiopronin-capped silver nanoparticles (Ag-tio
NPs) with rhodamine 6G ...................................................................................................... 143
Figure 3.45 UV-vis spectrum of the titration of tiopronin-capped silver nanoparticles (Ag-tio
NPs) with 2, 7-dichlorofluorescein ....................................................................................... 144
Figure 3.46 The structure of 2-mercaptopropionylglycine (tiopronin)................................ 145
Figure 3.47 TEM image showing gold nanoparticles synthesised by the Turkevich method
............................................................................................................................................. 146
Figure 3.48 TEM images showing (a) gold nanoparticles made by the Turkevich method
before dye solutions were added; (b) gold nanoparticles to which 4 mL of toluidine blue had
been added; (c) gold nanoparticles to which 5 mL toluidine blue had been added; (d) gold
nanoparticles to which 6 mL toluidine blue had been added. ............................................ 147
Figure 3.49 TEM images showing the formation of aggregates as crystal violet is added to a
solution of gold nanoparticles: (a) 3 mL crystal violet added; (b) 6 mL crystal violet added; (c)
and (d) 10 mL crystal violet added. ...................................................................................... 148
Figure 3.50 TEM images showing the formation of aggregates of nanoparticles as acridine
orange was added to a solution of gold nanoparticles: (a) 1 mL acridine orange added; (b) 3
mL acridine orange added; (c) 7 mL acridine orange added; (d) 10 mL acridine orange added.
............................................................................................................................................. 149

18
Figure 3.51 TEM images showing the formation of aggregates as malachite green was added
to a solution of gold nanoparticles: (a) 3 mL malachite green added; (b) 6 mL malachite green
added. .................................................................................................................................. 150
Figure 3.52 Graph showing the increase in observed hydrodynamic radius of gold
nanoparticles as dyes are added to the nanoparticle solution. .......................................... 150
Figure 4.1 TEM images showing A) citrate capped gold nanoparticles showing good
uniformity of size and shape, and B) citrate-capped silver nanoparticles produced by the
same method showing a greater spread of particle sizes and less regular shape. ............. 165
Figure 4.2 Graphs showing the UV-vis spectra of A) citrate-capped gold nanoparticles,
showing characteristic SPR band at 519 nm, and B) citrate-capped silver nanoparticles
showing SPR band at 402 nm. .............................................................................................. 165
Figure 4.3 Graph showing the UV-vis absorption spectra of (i) solvent-treated polyurethane,
(ii) polyurethane with citrate-capped gold nanoparticles and (iii) polyurethane with citrate-
capped silver nanoparticles. ................................................................................................ 167
Figure 4.4 Graph showing the UV-vis absorption spectra of (i) solvent-treated polyurethane,
(ii) polyurethane post-coated with 0.1 M aqueous crystal violet (CV), (iii) polyurethane
treated with solvent and acridine orange (AO), (iv) polyurethane post-coated with 0.1 M
aqueous malachite green (MG), (v) polyurethane treated with solvent and naphthol green
(NG). ..................................................................................................................................... 168
Figure 4.5 Graph showing the UV-vis absorption spectra of (i) solvent-treated polyurethane
with citrate-capped gold nanoparticles (AuNPs), (ii) polyurethane embedded with gold
nanoparticles and post-coated with 0.1 M aqueous crystal violet (AuCV), (iii) polyurethane
embedded with gold nanoparticles then treated with solvent and acridine orange (AuAO),
(iv) polyurethane embedded with gold nanoparticles then post-coated with 0.1 M aqueous
malachite green (AuMG), (v) polyurethane embedded with gold nanoparticles treated with
solvent and naphthol green (AuNG). ................................................................................... 169
19
Figure 4.6 Graph showing the UV-vis absorption spectra of (i) solvent-treated polyurethane
with citrate-capped silver nanoparticles (AuNPs), (ii) polyurethane embedded with silver
nanoparticles and post-coated with 0.1 M aqueous crystal violet (AgCV), (iii) polyurethane
embedded with silver nanoparticles then treated with solvent and acridine orange (AgAO),
(iv) polyurethane embedded with silver nanoparticles then post-coated with 0.1 M aqueous
malachite green (AgMG), (v) polyurethane embedded with silver nanoparticles treated with
solvent and naphthol green (AgNG). ................................................................................... 170
Figure 4.7 Images showing the water contact angles acheived on (a) solvent treated
polyurethane; (b) polyurethane containing tiopronin-capped silver particles and naphthol
green; (c) polyurethane containing citrate-capped silver particles and malachite green. .. 171
Figure 4.8 Graph showing viable counts of S. aureus after a 5 hour incubation on dye-modified
polyurethane, incubated either in the dark or illuminated by a white light source (of 6600 ±
990 lux at a distance of 25 cm). ........................................................................................... 172
Figure 4.9 Graph showing viable counts of S. aureus after a 5 hour incubation on gold
nanoparticle and dye-modified polyurethane, incubated either in the dark or illuminated by
a white light source (of 6600 ± 990 lux at a distance of 25 cm.). A dot indicates that the
bacterial numbers were reduced below the detection limit of 100 cfu/mL for that sample.
............................................................................................................................................. 173
Figure 4.10 Graph showing viable counts of S. aureus after a 5 hour incubation on silver
nanoparticle and dye-modified polyurethane, incubated either in the dark or illuminated by
a white light source (of 6600 ± 990 lux at a distance of 25 cm.). A dot indicates that the
bacterial numbers were reduced below the detection limit of 100 cfu/mL for that sample.
............................................................................................................................................. 175
Figure 4.11 Graph showing viable counts of S. aureus after a 2 hour incubation on silver
nanoparticle and acridine orange-modified polyurethane, incubated either in the dark or
illuminated by a white light source (of 6600 ± 990 lux at a distance of 25 cm.). A dot indicates

20
that the bacterial numbers were reduced below the detection limit of 100 cfu/mL for that
sample. ................................................................................................................................. 175
Figure 4.12 Graph showing viable counts of E. coli after a 5 hour incubation on dye-modified
polyurethane, incubated either in the dark or illuminated by a white light source (of 6600 ±
990 lux at a distance of 25 cm). ........................................................................................... 176
Figure 4.13 Graph showing viable counts of E. coli after a 5 hour incubation on gold
nanoparticle and dye-modified polyurethane, incubated either in the dark or illuminated by
a white light source (of 6600 ± 990 lux at a distance of 25 cm). ......................................... 177
Figure 4.14 Graph showing viable counts of E. coli after a 5 hour incubation on silver
nanoparticle and dye-modified polyurethane, incubated either in the dark or illuminated by
a white light source (of 6600 ± 990 lux at a distance of 25 cm.). A dot indicates that the
bacterial numbers were reduced below the detection limit of 100 cfu/mL for that sample.
............................................................................................................................................. 178
Figure 4.15 Graph showing viable counts of E. coli after a 2 hour incubation on silver
nanoparticle and dye-modified polyurethane, incubated either in the dark or illuminated by
a white light source (of 6600 ± 990 lux at a distance of 25 cm.). ........................................ 179
21
Table of Contents
Abstract ................................................................................................................................ 2
Novelty of the work ......................................................................................................... 2
List of publications ............................................................................................................... 4
Acknowledgements .............................................................................................................. 5
Table of Figures .................................................................................................................... 8
Table of Contents ............................................................................................................... 21
Chapter 1 : Introduction and literature review...................................................................... 28
1.1 Noble metal nanoparticles: their importance, properties and synthesis .................... 28
1.1.1 Surface plasmon resonance .................................................................................. 30
1.1.2 Synthetic routes to noble metal nanoparticles..................................................... 31
1.1.2.1 The Turkevich synthesis of charge-stabilised nanoparticles .......................... 33
1.1.2.2 Seeding methods ........................................................................................... 34
1.1.2.3 Two-phase reactions ...................................................................................... 34
1.1.3 Assemblies of multiple nanoparticles ................................................................... 35
1.2 Self-assembly of metallic nanoparticles into one dimensional arrays......................... 35
1.2.1 Methods of preparation of 1D assemblies of nanoparticles ......................... 36
1.2.1.1 Templated assembly ................................................................................. 36
1.2.1.1.1 DNA ......................................................................................................... 37
1.2.1.1.2 Other biomolecules ............................................................................. 40
1.2.1.1.3 Carbon nanotubes ............................................................................... 42
1.2.1.1.4 Other templates ................................................................................... 44

22
1.2.1.2 Template-free assembly......................................................................... 46
1.2.1.2.1 Supercritical fluids ............................................................................... 47
1.2.1.2.2 Dipole-dipole interactions .................................................................. 48
1.2.1.2.3 Linker molecules ................................................................................. 50
1.2.1.2.4 Magnetic interactions ......................................................................... 51
1.2.1.2.5 Oriented aggregation ........................................................................... 51
1.2.1.2.6 Non-uniform stabiliser distributions ................................................... 52
1.2.1.2.7 Electron beam lithography .................................................................. 52
1.2.1.2.8 Micelles ............................................................................................... 52
1.2.1.2.9 Hydrophobic/hydrophilic interactions ................................................. 53
1.2.1.2.10 Electric fields ...................................................................................... 53
1.2.2 Properties and applications of 1D nanoparticle arrays ................................. 54
1.2.2.1 Optical properties .................................................................................. 54
1.2.2.2 Magnetic and electrical properties ............................................................ 56
1.2.2.3 Sensing applications ............................................................................... 57
1.2.3 Future challenges ........................................................................................... 60
1.3 Introduction to photodynamic therapy ....................................................................... 60
1.3.1 History of PDT ...................................................................................................... 62
1.3.2 Photosensitizers and the mechanism of PDT ........................................................ 63
1.3.3 Oncological applications of PDT ............................................................................ 64
1.3.4 PDT to treat viruses, bacteria and fungi ............................................................... 65
1.3.5 Conjugation of photosensitizers with nanoparticles ............................................ 67
23
1.3.6 Photosensitizers for antimicrobial surfaces .......................................................... 67
1.3.6.1 Photosensitizer-nanoparticle conjugates for antimicrobial surfaces ............ 69
Chapter 2 : The synthesis and characterization of gold and silver nanoparticles ................. 72
2.1 Aims.............................................................................................................................. 72
2.2 Introduction to the synthesis and properties of noble metal nanoparticles ............... 72
2.3 Experimental methods ................................................................................................. 75
2.3.1 Modified Turkevich synthesis of gold and silver nanoparticles ............................ 75
2.3.1.1 Synthesis of citrate-stabilised gold nanoparticles ......................................... 76
2.3.1.2 Synthesis of citrate-stabilised silver nanoparticles ........................................ 76
2.3.1.3 Synthesis of citrate-stabilised silver-gold nanoparticles ................................ 76
2.3.2 Synthesis of 2-mercaptopropionylglycine-capped silver nanoparticles and
fabrication of 1D chains ................................................................................................. 77
2.3.2.1 Synthesis of 2-mercaptopropionylglycine-capped silver nanoparticles ........ 77
2.3.2.2 Synthesis of high-aspect ratio 2-mercaptopropionylglycine-capped silver
nanoparticle chains .................................................................................................... 77
2.3.3Synthesis of gold nanorods using seed and growth solutions ............................... 78
2.3.3.1 Stock solutions ............................................................................................... 78
2.3.3.2 Synthesis of gold nanorods ............................................................................ 78
2.3.4 Synthesis of branched gold nanocrystals .............................................................. 79
2.3.5 Characterization techniques ................................................................................. 79
2.3.5.1 TEM ................................................................................................................ 79
2.3.5.2 UV-vis absorption measurements.................................................................. 79

24
2.4 Results and discussion ................................................................................................. 80
2.4.1 Modified Turkevich synthesis of noble metal nanoparticles ................................ 80
2.4.1.1 Citrate-stabilised gold nanoparticles ............................................................. 80
2.4.1.2 Citrate-stabilised silver nanoparticles ............................................................ 81
2.4.1.3 Citrate-stabilised bimetallic silver-gold nanoparticles ................................... 82
2.4.2 Synthesis of 2-mercaptopropionylglycine capped silver nanoparticles ............... 90
2.4.2.1 2-mercaptopropionylglycine capped silver nanoparticle chains ................... 92
2.4.3 Synthesis of gold nanorods ................................................................................... 93
2.4.4 Synthesis of branched gold nanocrystals .............................................................. 96
2.5 Conclusions .................................................................................................................. 98
Chapter 3 : The interaction of cationic and anionic dyes with gold and silver nanoparticles
............................................................................................................................................. 100
3.1 Aims............................................................................................................................ 100
3.2 Motivations and an introduction to photodynamic therapy ..................................... 101
3.2.1 Combination of photosensitizers with nanoparticles ......................................... 102
3.3 Experimental methods ............................................................................................... 103
3.3.1 Modified Turkevich synthesis of gold and silver nanoparticles .......................... 103
3.3.1.1 Synthesis of citrate-stabilised gold nanoparticles ....................................... 103
3.3.1.2 Synthesis of citrate-stabilised silver nanoparticles ...................................... 103
3.3.1.3 Synthesis of citrate-stabilised silver-gold nanoparticles .............................. 103
3.3.2 Synthesis of 2-mercaptopropionylglycine-capped silver nanoparticles ............. 103
25
3.3.2.1 Synthesis of high-aspect ratio 2-mercaptopropionylglycine-capped silver
nanoparticle chains .................................................................................................. 103
3.3.3 Synthesis of gold nanorods ................................................................................. 104
3.3.4 Synthesis of branched gold nanocrystals ............................................................ 104
3.3.5 Titration experiments ......................................................................................... 104
3.3.6 UV-vis absorption measurements....................................................................... 106
3.3.7 Particle size measurements ................................................................................ 106
3.3.7.1 Zetasizer measurements .............................................................................. 106
3.3.7.2 TEM .............................................................................................................. 106
3.4 Results and discussion ............................................................................................... 107
3.4.1 UV-vis studies ...................................................................................................... 107
3.4.1.1 Citrate-stabilised gold nanoparticles with cationic dyes ............................. 107
3.4.1.2 Citrate-stabilised gold nanoparticles with anionic dyes .............................. 116
3.4.1.3 Citrate-stabilised silver nanoparticles with anionic dyes ............................. 120
3.4.1.4 Citrate-stabilised silver nanoparticles with cationic dyes ............................ 121
3.4.1.5 Citrate-stabilised silver-gold nanoparticles with cationic and anionic dyes 125
3.4.1.5.1 1:3 Au:Ag nanoparticles ........................................................................ 125
3.4.1.5.2 1:1 Au:Ag nanoparticles ........................................................................ 128
3.4.1.5.3 3:1 Au:Ag nanoparticles ........................................................................ 130
3.4.1.6 Branched gold nanocrystals with anionic and cationic dyes ....................... 133
3.4.1.7 Gold nanorods with anionic and cationic dyes ............................................ 138

26
3.4.1.8 2-mercaptopropionylglycine-capped silver nanoparticles with cationic and
anionic dyes ............................................................................................................. 141
3.4.2 Particle size measurements for citrate-capped gold nanoparticles: TEM studies and
Zetasizer ....................................................................................................................... 145
3.5 Conclusions ................................................................................................................ 150
Chapter 4 : The antimicrobial capacity of citrate-stabilised gold and silver nanoparticle-dye
conjugates in polyurethane ................................................................................................. 153
4.1 Aims............................................................................................................................ 153
4.2 Introduction and motivations .................................................................................... 153
4.2.1 Nosocomial infections ......................................................................................... 153
4.2.2 Light activated antimicrobial surfaces ................................................................ 154
4.2.3 Conjugation of LAAAs and nanomaterials .......................................................... 156
4.3 Experimental methods ............................................................................................... 159
4.3.1 Synthesis of nanoparticles .................................................................................. 159
4.3.1.1 Synthesis of gold and silver citrate stabilised nanoparticles. ...................... 159
4.3.1.2 Nanoparticle characterisation techniques ................................................... 159
4.3.2 Preparation of dye solutions ............................................................................... 159
4.3.3 Polymer samples for antimicrobial testing ......................................................... 160
4.3.3.1 Characterisation of polymer samples .......................................................... 162
4.3.4 Antimicrobial activity assays ............................................................................... 163
4.4 Results and discussion ............................................................................................... 164
4.4.1 Nanoparticle synthesis ........................................................................................ 164
4.4.2 Polymer samples ................................................................................................. 165

27
4.4.2.1 UV-vis studies ............................................................................................... 166
4.4.2.2 Water contact angle measurements ........................................................... 170
4.4.3 Antibacterial testing ............................................................................................ 171
4.4.3.1 Staphylococcus aureus ................................................................................. 171
4.4.3.2 E. coli ............................................................................................................ 176
4.5 Conclusions ................................................................................................................ 179
Chapter 5 : Concluding Remarks .......................................................................................... 182
5.1 Synthesis of gold and silver nanoparticles ................................................................. 182
5.2 Interaction of gold and silver nanoparticles with anionic and cationic dyes ............. 183
5.3 Incorporation of dyes and nanoparticles into polyurethane for antimicrobial surfaces
......................................................................................................................................... 184
5.4 Future work ................................................................................................................ 186
Bibliography ..................................................................................................................... 188
28
CHAPTER 1 : INTRODUCTION AND LITERATURE REVIEW
This work presents the successful synthesis and characterisation of a range of noble metal
nanoparticles using a range of synthetic techniques. Nanoparticles varied in shape, size,
capping agent and supraparticular arrangement: rods, stars and spheres of different sizes
were successfully synthesised, with highly linear anisotropic chains of some particles formed.
The ability of the synthesised nanoparticles to enhance the absorption and activity of a range
of photosensitising dyes was then investigated, producing novel dye-nanoparticles
combinations not previously reported. It has been reported that dye-nanoparticle
combinations which show enhanced activity compared to dye alone can act as highly potent
antimicrobial agents for photodynamic therapy or self-sterilising surfaces. The antibacterial
capabilities of dye-nanoparticle conjugates against S. aureus and E. coli was therefore
investigated with excellent kill rates observed for novel combinations. Total kill of both
bacterial species in light and dark conditions was observed in five hours using a new pairing
of acridine orange with citrate-stabilised silver nanoparticles. This represents an exciting
possibility for the development of new self-sterilising surfaces that are active under both
ambient light and in the dark, a property which is paramount to maximise the benefit of
antimicrobial surfaces.
A literature review outlining the background, motivations and theory behind these fields
follows.
1.1 Noble metal nanoparticles: their importance, properties and
synthesis
Nanoparticles of metals and inorganic materials have been known for many years. They are
loosely defined as a particle in the size range 1-100 nm that exhibits properties not found in

29
the bulk material.1 From accidental colouration of glass in the Roman era by throwing golden
coins into the melt2 to cutting edge technological applications now, they have always been
at the forefront of science and their unique properties, innumerable uses and sheer beauty
mean they still enjoy much attention.
Nanoparticles exhibit a number of unique features. Due to their small size they show
behaviour not found by non-nanoscale particles with the same composition. Their atypical
surface structure, very high surface area to volume ratio and consequent increased reactivity
make them useful in many commercial applications.3–5 Small nanoparticles (below ~30 nm)
are characterised by a surfeit of energy at the surface and are thermodynamically unstable.6
Crystallographic changes such as expansion or contraction of the lattice, a change in
morphology, the appearance of defects or rearrangement of the atoms at the surface have
all been observed to happen in an effort to lower the surface energy of the unstable particles
.7–9 Another distinctive property of small nanoparticles is the size dependence of their optical
behaviour in a phenomenon called surface plasmon resonance, which is discussed more fully
in Section 1.1.1. The physical properties of nanoparticles can also be size dependent, with
thermal properties being among the easiest to measure. Particles of indium show a 120 °C
drop in melting point when the diameter of the particle is reduced from 100 to 10 nm.10
Particles of tin exhibit an 80 °C reduction under the same parameters.11 The electrical
properties of nanoparticles can also be related to their size – the Curie temperature for
ferromagnetic MnFe2O4 and MgFe2O4 is changeable dependent on the diameter of the
particles tested.12–14
The size and shape dependence of nanoparticles’ properties offers excellent tuneability of
their behaviour, making them ideal for applications such as catalysis15 and surface enhanced
Raman scattering (SERS) where very specific performance is required.16 In both the above
30
cases, altering the shape of the nanocrystal from spherical to many-edged and nanorods
respectively causes an enhancement in their ability to carry out the required function.
1.1.1 Surface plasmon resonance
Surface plasmon resonance (SPR) is a phenomenon exhibited by gold, silver and limited other
nanoparticles. It originates from the presence of the free d electrons in metallic lattices which
are free to travel through the material. The mean free path in gold and silver is approximately
50 nm, thus in a nanoparticle smaller than this no scattering is expected from the bulk and
consequently the interaction of light is only with the surface. When the wavelength of
incident light is much larger than the diameter of the nanoparticle standing resonance
conditions can be set up. Light which is in resonance with the oscillations of the surface
plasmon causes the free electrons to oscillate with the light’s frequency, causing a standing
oscillation.17 This effect produces solutions of nanoparticles with very strong characteristic
colourations and is a useful diagnostic tool, as the SPR of the nanoparticles is highly size and
shape dependent.18,19 Thus, the colour of a gold colloid can give an accurate idea of the size
of the nanoparticles it contains. Increasing the diameter of gold particles from 10 nm to 100
nm sees the SPR band undergo red shift from 515-520 nm to 572 nm, an increase of about
50 nm. Increasing the aspect ratio of particles can have a much stronger effect; increasing
the aspect ratio of gold nanorods from 2.4 – 5.7 is concurrent with a red shift of 300-350 nm
for the longitudinal plasmon (Figure 1.1).20

31
Figure 1.1 Image showing the red shift in absorption maximum with increasing aspect ratio of gold
nanorods. Image from El-Sayed et al.20
The SPR of a nanoparticle is also very sensitive to change in the dielectric constant of the
surrounding material. Changing the solvent is a facile way to do this, but choice of ligand or
capping molecule is by far the most important consideration in altering the plasmon
resonance electrically. Molecules which are covalently bonded to the surface of the metallic
nanoparticle affect the electron density found there, resulting in a shift in the observed SPR
maximum.21 In this manner nanoparticles can act as simple chemical sensors, an application
discussed more thoroughly in Section 1.2.2.3.
1.1.2 Synthetic routes to noble metal nanoparticles
There are myriad ways to achieve nanoparticles of gold and silver with many papers
published on the topic. Broadly speaking, however, all synthetic routes to gold and silver
nanoparticles fall into one of two general categories: top down or bottom up approaches.
Top down methods start with a bulk material and remove the excess to leave the desired
nanostructures. Common approaches include electron beam lithography and
photolithography.22–25 Though excellent results can and have been achieved by both
techniques, top-down methods suffer from the obligation to remove large quantities of
material which is then wasted. There are also hard limits on the size of the nanostructures

32
that can be generated, as photolithography is bound by the diffraction limit of the available
lasers. Current technology allows features as in the range 20-100 nm to be generated and
this is ever improving as laser pulses with shorter wavelengths are developed, but even if this
hurdle can be overcome photolithography requires expensive, highly specialised
equipment.26 Electron beam lithography also requires costly instrumentation, though it does
allow smaller nanostructures (in the region of 10 nm) to be generated compared to
photolithography.27
Bottom-up techniques have garnered more interest as they are more adaptable and tend to
require less specialist apparatus. The general approach is to use a reducing agent to reduce
gold or silver ions in solution, then assemble the atoms into nanostructures. Techniques in
this area are many and varied, including templating, chemical, sono- electro- and
photochemical and thermal reductions.17 Bottom-up methods allow very small
nanostructures to be fabricated (1 nm upwards) but usually require an arresting agent to
stop particle growth at the desired point.28 Monodispersity can also be difficult to achieve
using these methods. As such, capping molecules or ligands are usually employed to coat the
surface of the particles which renders them much more stable to aggregation and falling out
of solution than bare particles alone.29
Bottom up methods allow great control over the shape and size of the nanoparticles
produced by close control of reaction parameters such as time, temperature, reducing agent
and capping molecule.30 Though most nanoparticles are spherical, different reaction
conditions and methods have produced rods, cubes, wires, tubes, one to eight pointed stars,
prismatic and tetrahedral nanoparticles from gold, silver and platinum.31–35
One downside of bottom up techniques is the slight variance in each experimental run.
Nanoparticles synthesised by the same methods will always vary from batch to batch as the
particles are extremely sensitive to tiny fluctuations in temperature, pH, time etc., so
33
extreme care should be taken to keep reaction conditions as similar as possible to minimise
this.
A brief overview and explanation of the common bottom up techniques used in the following
chapters is given below.
1.1.2.1 The Turkevich synthesis of charge-stabilised nanoparticles
The Turkevich synthesis of noble metal nanoparticles is widely used and well known. The
method uses citrate ions to reduce a hot solution of auric acid or silver nitrate to give a stable
solution of small, well-formed, citrate-stabilised nanoparticles.36 This method is unusual
among bottom-up techniques as the citrate plays the dual role of reductant and stabilizer;
usually, two separate reactants are required to achieve this.37 Control over the size and
morphology of the particles can be exercised by altering temperature,38 pH39 and
concentration of citrate ions.37 Increasing the concentration of citrate ions in the reaction
mixture produces smaller particles which are more stable to aggregation.40
The citrate reduction of metal salts is a redox system. Oxidation of the citrate forms acetone
dicarboxylic acid, which reduces the gold ions from Au3+ to Au0 (Or Ag+ to Ag0 for silver
particles) and forms a supersaturated solution. Nucleation followed by condensation of more
gold onto the surface of the nuclei results in nanoparticles forming.41 As the particles grow
the SPR develops, allowing the solution to take on the distinctive strong colouration of gold
and silver colloids. SPR was discussed in more detail in Section 1.1.1. The nuclei prior to the
growth step are too small (~1nm) to produce an SPR band in the visible region.
Once the nanoparticles have formed citrate ions remain bound to the surface, forming a
negatively charged capping layer.42 Thus the particles carry an overall negative charge. It is
presumed that at the surface of the particle there are both donor and acceptor sites – neutral
metal that donates electrons to acceptor molecules and gold complexes in a high oxidation

34
state which are reduced by donors. The capping citrate ligands are bound at the surface of
the particle where the oxidation state of the gold is +1.
The nanoparticles for the main part of this work were synthesised by a slightly modified
Turkevich method as used by Narband et al.43
1.1.2.2 Seeding methods
Another common approach to making nanoparticles is the seeding approach, whereby a
strong reducing agent (commonly NaBH4) is used to make very small, spherical particles.
These particles are then added to a growth solution containing more metal ions and a
surfactant to promote directional growth. The growth solution uses a weaker reducing agent
such as ascorbic acid to reduce the metal ions to a halfway, intermediate state, allowing
catalysed reduction and condensation of metal on the surface of the seed particles.44
This method is used with very specific surfactant and seed conditions to grow nanorods in
solution.31,45,46 Steric inhibition by the surfactant (chosen to be a large, bulky molecule;
cetyltrimethylammonium bromide (CTAB) is a common choice) of growth along the long
sides of the rod allows for anisotropic growth on the short sides only, forming a particle with
a distinct aspect ratio.
1.1.2.3 Two-phase reactions
Very small (1 – 5 nm) nanoparticles can be produced using a two-phase approach.47 The first
stage of these reactions uses a surfactant to transfer the gold or silver ions into the organic
phase. The surfactant of choice is usually a thiol, as the gold- or silver-thiol bond is strong
and stabilises the growing particles. Addition of sodium borohydride to the aqueous phase
followed by vigorous stirring promotes the growth of nanoparticles in the organic phase,
which will start to colourise as particles grow and develop SPR bands. Particles produced in
this way are small and very stable when isolated, allowing storage for long periods.
35
1.1.3 Assemblies of multiple nanoparticles
The unique optical,48–50 electronic,51,52 magnetic53 and catalytic54–56 properties of metallic
nanoparticles has made them the focus of intensive study by both the scientific and
engineering communities. Though the properties and applications of noble metal
nanoparticles are numerous, a fascinating quirk they possess is that the collective behaviour
of a group of particles can be very different to the individual. As such, careful assembly of the
particles into groups – be it thin films, arrays or composites - allows us the possibility of
tweaking their behaviour to suit a prospective application. The potential of these assemblies
to facilitate the miniaturisation of existing electronic components (such as LEDs and
photoconductive devices57) is huge; consequently there is a large body of literature devoted
to their understanding and applications.
Assemblies of nanoparticles are classified as being either one-, two- or three-dimensional.
The latter two are well covered by several existing reviews and are not discussed herein.58–60
By contrast, the former is less thoroughly reported in the literature owing to difficulties
concerning their preparation, isolation and analysis whilst maintaining their anisotropic
character. The next section of this review outlines these problems and presents a
comprehensive overview of the methods used to prepare 1D arrays of metallic nanoparticles
along with a summary of their properties and applications.
1.2 Self-assembly of metallic nanoparticles into one dimensional arrays
Though relatively facile to prepare, unsupported anisotropic arrays of discrete nanoparticles
have a tendency to undergo sintering without charge-induced stabilisation or the physical
support of a template. Their remaining as unconnected particles can also be effected by
wrapping the array in stabilising molecules or using another form of external coating. All of
these methods of stabilising the arrays can make isolation for analysis difficult.

36
Owing to the difficulties outlined above, metallic nanowires would seem a sensible
compromise when an application calls for a 1D nanoparticle array. Indeed, they share some
similar functional properties which mean they could be substituted in certain applications
and tend to be easier to produce, isolate and analyse.61 However they lack the unique inter-
particle photonic, electronic and energy transfer62,63 properties of 1D arrays of particles
which make them so interesting for producing modernised electronic components and
devices.
The unique properties of 1D arrays are dependent upon our ability to control and manipulate
the interparticle spacing. For example, nanoparticles of copper,64,65 silver66–69 and gold19,70,71
show SPR effects which give rise to enhanced absorption, reflection and remarkably strong
colouration.72 The ability to tailor the spatial coupling of the nanoparticles in these cases
therefore allows extremely close control of optical and electronic properties,73 essential for
efficient and repeatable device manufacture.
The next section of this review covers the reported methods used to produce 1D arrays of
metallic nanoparticles, both template and template-free. Section 1.2.2 sets out the novel
properties exhibited by these assemblies and discusses their current uses and scope for the
future.
1.2.1 Methods of preparation of 1D assemblies of nanoparticles
1.2.1.1 Templated assembly
By far the most common way of producing 1D arrays if nanoparticles is to use an
appropriately shaped template to guide the particles into the desired configuration. Some
template-free methods have been reported and are discussed in Section 1.2.1.2. Templates
can be divided into two loose categories: ‘hard’, such as carbon nanotubes, facetted
substrates and inorganic wires, or ‘soft’ examples such as DNA, peptides and other
biopolymers.74

37
1.2.1.1.1 DNA
By far the most widely studied template for nanoparticle assembly is DNA. It boasts several
features which make it a champion in this field – peerless molecular recognition and the ease
with which nanoparticles can be functionalized with DNA ‘tags’ of complementary sequences
to template attachment points, taking advantage of the specific bonding of DNA base pairs.
As it is itself a nanoscale material (possessing a diameter of 2 nm and an inter-base spacing
of 3.4 Å)75 it allows facile production of components that are themselves on the nanoscale.
The biospecificity of the DNA system allows a high degree of control over ordering, structure
and features in the nanoparticles assemblies.76 Metallisation of DNA templates has been
widely reported and is discussed in more detail below.77
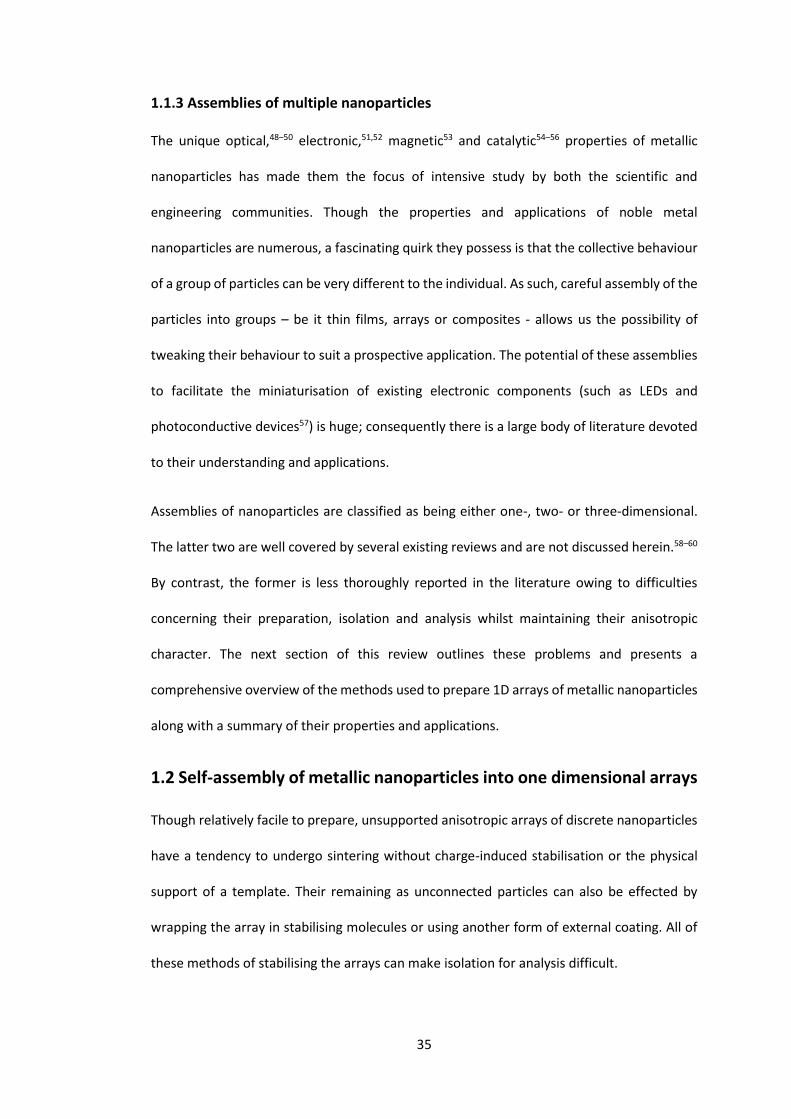
Directed assembly of nanoparticles using a DNA template has been studied over the past two
decades, first brought to prominence by Schulz et al. in 1996.78 Though their dimeric
structures were proof of concept for functionalising nanoparticles and selective attachment
to a DNA template, it was not until almost ten years later that the first report of linear
nanoparticles assemblies was published.79 Deng et al. functionalised phosphine-capped gold
nanoparticles with DNA-1 fragments to produce gold-DNA conjugates. They then used rolling
circle polymerisation (a biological technique in which a circular DNA oligonucleotide revolves
and is used to produce long strands of DNA up to 12000 nucleotides in length)80 to assemble
the conjugates into arrays, which were isolated by gel electrophoresis. TEM and AFM images
confirmed the presence of micrometre-scale linear arrays, comprised of well-separated gold
nanoparticles spaced along the DNA backbone at an average spacing of 18.5 nm (Figure 1.2).
Similar processes have since produced arrays of nanoparticles of different metals, including
silver,81,82 gold,83,84 platinum85 and palladium.86
38
Figure 1.2 TEM images showing extended linear arrays of gold nanoparticles. Scale bars all represent
200 nm. I-III show the structures; IV-V show higher magnification sections of I and II. Figure
reproduced with permission from Deng et al.79Different approaches have been employed to yield
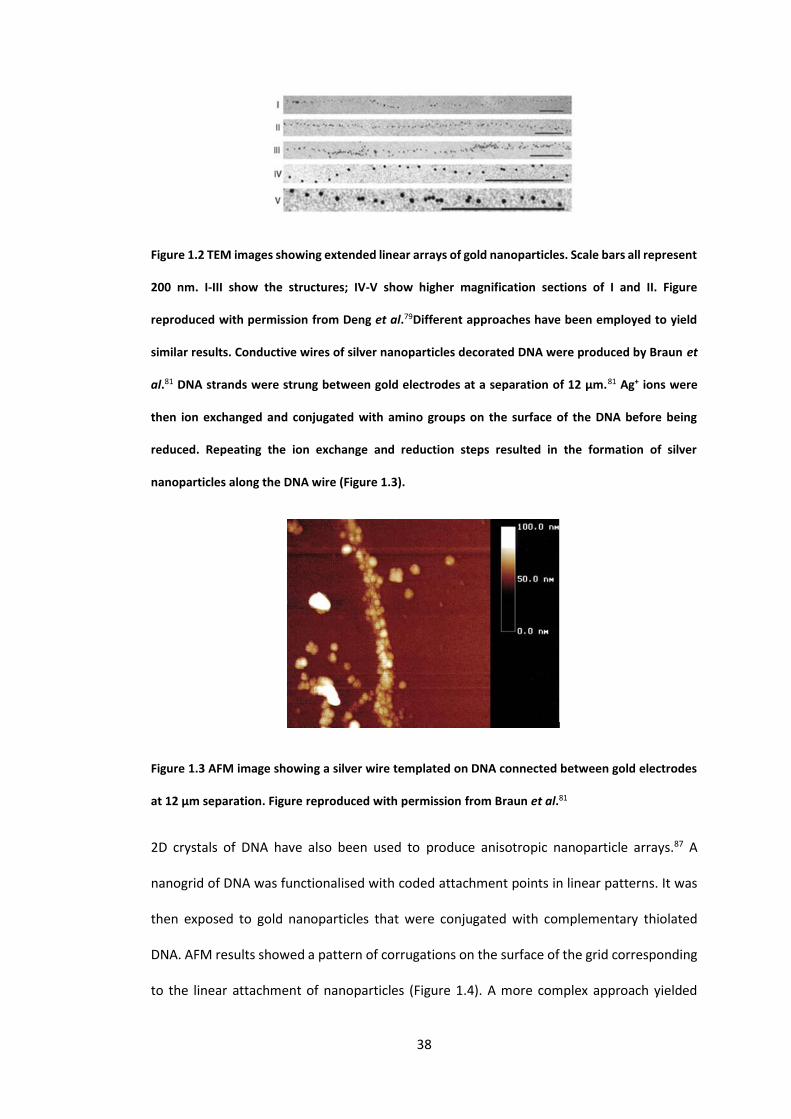
similar results. Conductive wires of silver nanoparticles decorated DNA were produced by Braun et
al.81 DNA strands were strung between gold electrodes at a separation of 12 µm.81 Ag+ ions were
then ion exchanged and conjugated with amino groups on the surface of the DNA before being
reduced. Repeating the ion exchange and reduction steps resulted in the formation of silver
nanoparticles along the DNA wire (Figure 1.3).
Figure 1.3 AFM image showing a silver wire templated on DNA connected between gold electrodes
at 12 μm separation. Figure reproduced with permission from Braun et al.81
2D crystals of DNA have also been used to produce anisotropic nanoparticle arrays.87 A
nanogrid of DNA was functionalised with coded attachment points in linear patterns. It was
then exposed to gold nanoparticles that were conjugated with complementary thiolated
DNA. AFM results showed a pattern of corrugations on the surface of the grid corresponding
to the linear attachment of nanoparticles (Figure 1.4). A more complex approach yielded

39
nanogrids with two differently-coded attachments points.88 On exposure to a mixture of
nanoparticles (5 nm and 10nm, each size tagged with differently-coded DNA) parallel rows
of alternating small and large particles were observed (Figure 1.5). This facile approach uses
DNA’s exceptional biospecificity to allow control of both size and position of nanoparticles
within a component.
Figure 1.4 (a) AFM and (b) TEM images of the ridge-like structure formed by linear assembly of gold
nanoparticles on a DNA nanogrid. Figure reproduced with permission from Kiehl et al89.
Figure 1.5 TEM image showing alternating parallel rows of 5 nm and 10 nm gold nanoparticles on a
DNA grid. Figure reproduced with permission from Kiehl et al.88
DNA has also been used to mediate the assembly of gold nanoparticles into quasi-1D, cyclical
structures.90 Gold nanoparticles functionalised with thiolated DNA were conjugated with
support DNA to produce ‘building blocks’. These blocks then underwent hybridisation to
produce a cyclical DNA backbone decorated with nanoparticles. Though novel, functional
properties of these structures have yet to be reported.

40
1.2.1.1.2 Other biomolecules
Peptide fibrils have shown great ability to produce linear arrays of nanoparticles. One
method reported by Wang et al. used protonation of the nitrogen groups along the length of
the fibril to attach anionically-stabilised gold nanoparticles via electrostatic interaction.91
Varying the pH resulted in single nanoparticle width assemblies forming at low pH (Figure
1.6b) and double helical arrangements at higher pH (Figure 1.6a). Analogous experiments
produced comparable arrays of palladium nanoparticles. Utilising antibody-antigen and
streptavidin-biotin specificity on fibre-recruiting peptides has also successfully produced
anisotropic arrays of gold particles on the micrometre scale.92 Dextran can be used similarly
to achieve analogous results.93
Figure 1.6 TEM images showing (a) double helical arrays of Au nanoparticles on peptide nanofibrils
obtained at pH = 3.5, and (b) single chain arrays obtained at pH = 6. Figure reproduced with
permission from Wang et al.94
Viruses can also be used to this end. The tobacco mosaic virus (TMV) is a tubular molecule
with a length of 300 nm and an inner diameter of 4 nm, making it an ideal template to align
small nanoparticles into chains. Dujardin et al.95 published the first report of metallic
nanoparticles on the TMV, using silver, gold and platinum. Silver experiments comprised
exposing the virus to silver nitrate then reducing it under UV light. This yielded nanoparticles
2-4 nm in diameter spaced along the internal channel of the virus. Gold and platinum studies
used HAuCl4 and [PtCl6]2i ions (the latter stabilised by Na+ or K+) reduced by hydrazine hydrate
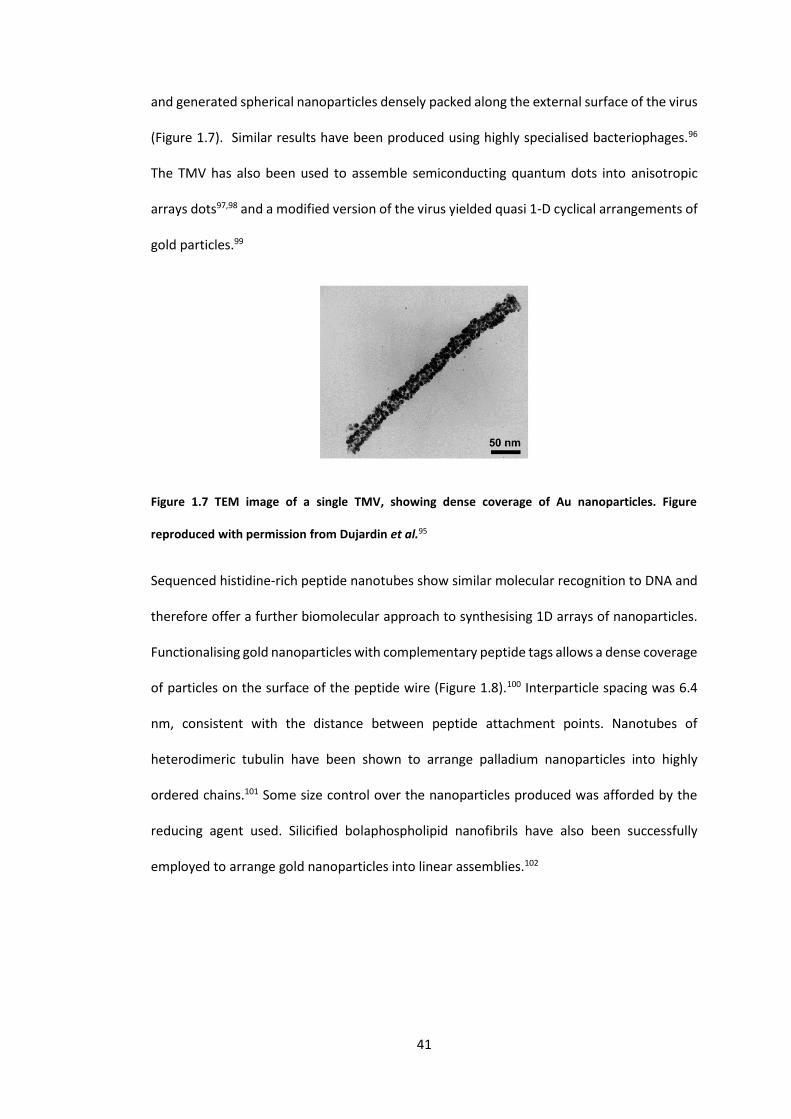
41
and generated spherical nanoparticles densely packed along the external surface of the virus
(Figure 1.7). Similar results have been produced using highly specialised bacteriophages.96
The TMV has also been used to assemble semiconducting quantum dots into anisotropic
arrays dots97,98 and a modified version of the virus yielded quasi 1-D cyclical arrangements of
gold particles.99
Figure 1.7 TEM image of a single TMV, showing dense coverage of Au nanoparticles. Figure
reproduced with permission from Dujardin et al.95
Sequenced histidine-rich peptide nanotubes show similar molecular recognition to DNA and
therefore offer a further biomolecular approach to synthesising 1D arrays of nanoparticles.
Functionalising gold nanoparticles with complementary peptide tags allows a dense coverage
of particles on the surface of the peptide wire (Figure 1.8).100 Interparticle spacing was 6.4
nm, consistent with the distance between peptide attachment points. Nanotubes of
heterodimeric tubulin have been shown to arrange palladium nanoparticles into highly
ordered chains.101 Some size control over the nanoparticles produced was afforded by the
reducing agent used. Silicified bolaphospholipid nanofibrils have also been successfully
employed to arrange gold nanoparticles into linear assemblies.102

42
Figure 1.8 TEM image of gold nanoparticles on a peptide nanowire. Figure taken with permission
from Djalali et al.100
As mentioned above, genetically modified bacteriophages provide excellent scaffolds for
nanoparticle assembly. Alloyed particles of CoPt and FePt were produced on these
supports,103 though it has also successfully been used to produce nanoparticles of
semiconducting materials.97,98 Modified yeast cells have been used to form belts of gold and
silver nanoparticles 100 nm wide.104 The belts produced in these experiments exhibit
excellent conductivity, similar to that of a solid metal wire.
Cellulose molecules contain a large amount of oxygen and can therefore stabilise bare
nanoparticles in a similar way to crown ethers. This eliminates the need for stabilising ligands
on the particles themselves. Nanoparticles of bare silver, gold and platinum have been
produced using this template, aligning themselves along the length of the cellulose fibrils to
give highly linear arrays.105
1.2.1.1.3 Carbon nanotubes
Carbon nanotubes (CNTs) are widely used for the purpose of aligning particles, and are
known as ‘hard’ templates owing to their inflexibility and toughness. They hold an advantage
over biomolecules in cases where harsh reaction conditions are required, as they tolerate
extremes of temperature, pH and oxidation/reduction much better than biological tissues.
They also offer two options for alignments of particles: either decorated on the outer surface
or aligned along the interior, capillary-like cavity.

43
One elegant system for filling the central capillaries of the CNTs is nanotube wetting. This
technique was reported using low melting point metals (Pb, 106 Ni and UOx107) but as a general
point suffered with poor filling efficiency of the capillary. The work of Ugarte et al. using silver
nitrate, however, produced discrete nanoparticles of metallic silver along the internal cavity
after prolonged electron irradiation (Figure 1.9).108 Thermal decomposition of the silver
nitrate produced a continuous wire within the capillary.
Figure 1.9 TEM images of silver nanoparticles in the central capillary of a carbon nanotube. Scale
bars represent 5 nm. Figure reproduced with permission from Ugarte et al108.
Sol-gel methods have been widely explored to deposit nanoparticles from colloidal solution
onto the outer surface of CNTs. Precipitation of CNTs from a highly concentrated solution of
gold colloid yields CNTs with monolayer coverage of gold particles on the surface (Figure
1.10).109 1D gold structures produced in this way were up to 10 µm in length. DNA110 and
organic capping agents111 can also be used to functionalise both the CNT walls and the
nanoparticles, resulting in coverage of the outer walls. Similar approaches have been used to
produce comparable structures from gold,112 silver,113 platinum,114–116 palladium,117 tin,117
and copper.118 Rhodium nanoparticles have also been prepared on CNTs119 and have been
proven to exhibit exceptional catalytic activity.120

44
Figure 1.10 TEM image showing the self-assembly of gold nanoparticles on the outer surface of a
CNT. Figure taken with permission from Fullam et al. 109
Electrodepostion has also been used with some success to deposit gold, palladium and
platinum nanoparticles on single-walled CNTs.121 Coverage was found to be dependent on a
myriad of factors including salt concentration, potential and deposition time. This therefore
offers an inexpensive method to control the coverage and tune it for purpose. CNTs
functionalised with 1-pyrenesulfonic acid can initiate the assembly of gold nanoparticles
along their length to produce 1D structures.122 This can be followed by a heating step to
induce nanowelding.
1.2.1.1.4 Other templates
Ridged and facetted sheet substrates present another method of preparing high aspect ratio
chains of nanoparticles. Slow evaporation of a colloidal gold solution onto ridged amorphous
carbon results in spontaneous arrangement of the particles along the step edges of the
substrate (Figure 1.11).123 This is thought to be due to entropic force fields generated at the
ridges of the carbon sheet. Pulsed laser deposition of silver onto facetted alumina has also
be shown to produce linear arrangements of nanoparticles.124 The grooves in the surface of
the alumina sheet provide high-coordination binding sites to which the silver nanoparticle
will preferentially attach.125 Physical vapour deposition of silver onto highly ordered pyrolytic

45
graphite can be used to similar effect, generating chains of silver nanoparticles in excess of
100 µm in length along the step edges of the graphite. 126
Figure 1.11 TEM image showing (a) the alignment of gold nanoparticles along the ridges of an
amorphous carbon substrate, and (b) a high-magnification image of a single nanoparticle chain
showing exceptional linearity. Figure reproduced with permission from Hutchinson et al.123
The internal linear cavities of zeolites and other mesoporous zeolite-type materials can be
used to efficiently align metallic nanoparticles. Monodisperse chains of gold or platinum
nanoparticles have been generated by saturating mesoporous organosilicas with the
appropriate metal salt, followed by reduction under dry hydrogen gas.127 Thermal
decomposition of silver nitrate in the pores of SBA-15 produces nanowires of metallic
silver,128 with similar techniques producing analogous structures of platinum129 and
palladium.130
Polymerisation reactions between monomer units has also been reported to form quasi-1D
nanoparticle structures. Carboxylic acid functionalised gold nanoparticles were joined to a
polylysine support. Inducing closure of the polylysine ring generated rings of gold
nanoparticles held on a cyclic template (Figure 1.12).131 Slightly different approaches to this
have used polymer units: gold nanoparticles functionalised with thiolated poly(ethylene
oxide) form large aggregates of particles when mixed with polymers. Linear arrays of particles
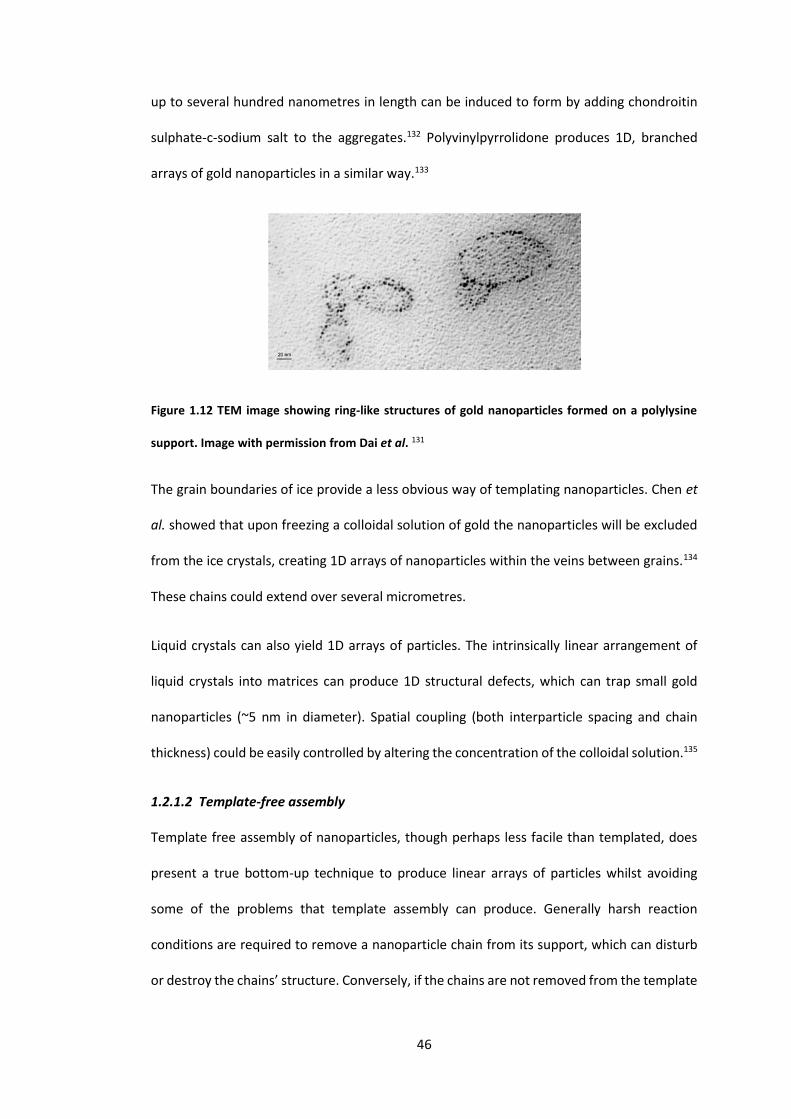
46
up to several hundred nanometres in length can be induced to form by adding chondroitin
sulphate-c-sodium salt to the aggregates.132 Polyvinylpyrrolidone produces 1D, branched
arrays of gold nanoparticles in a similar way.133
Figure 1.12 TEM image showing ring-like structures of gold nanoparticles formed on a polylysine
support. Image with permission from Dai et al. 131
The grain boundaries of ice provide a less obvious way of templating nanoparticles. Chen et
al. showed that upon freezing a colloidal solution of gold the nanoparticles will be excluded
from the ice crystals, creating 1D arrays of nanoparticles within the veins between grains.134
These chains could extend over several micrometres.
Liquid crystals can also yield 1D arrays of particles. The intrinsically linear arrangement of
liquid crystals into matrices can produce 1D structural defects, which can trap small gold
nanoparticles (~5 nm in diameter). Spatial coupling (both interparticle spacing and chain
thickness) could be easily controlled by altering the concentration of the colloidal solution.135
1.2.1.2 Template-free assembly
Template free assembly of nanoparticles, though perhaps less facile than templated, does
present a true bottom-up technique to produce linear arrays of particles whilst avoiding
some of the problems that template assembly can produce. Generally harsh reaction
conditions are required to remove a nanoparticle chain from its support, which can disturb
or destroy the chains’ structure. Conversely, if the chains are not removed from the template

47
then the substrate can have a great effect on the electrical properties of the array. Thus,
exploiting the intrinsic preferences of some nanoparticles to align presents a method of
achieving anisotropic arrangements of metallic particles whilst circumventing the need for a
template. The major methods of attaining this are reported below.
1.2.1.2.1 Supercritical fluids
Supercritical fluids offer the advantages of tuneable solvation with tiny changes in pressure
and temperature, meaning their effect can be minutely controlled. This makes them ideal for
the fine control needed to synthesise and modify nanostructures, and have already proven
invaluable in the synthesis of carbon nanotubes,136 metal oxide nanoparticles137 and silicon
nanowires.138
Supercritical water has been shown to organise silver aggregates into nanoparticles and 1D
wires sponatenously.139 Ag2O was decomposed in an argon atmosphere before being
transferred to the supercritical water reaction vessel. Small changes in the temperature and
pressure of the water were found to radically alter the morphologies that resulted: low
pressures (<49 MPa) gave rise to in discrete nanoparticles, whereas higher pressures (>49
MPa) caused the particles to aggregate and assemble into coiled wires (Figure 1.13).
Investigation of intermediate steps in the wires’ formation shows they are composed of
nanoparticles that fuse and crystallize together into the anisotropic arrays. The chains were
more easily polarisable longitudinally, thus aggregation tended to occur on the ends of the
wires to minimise coulombic repulsion.

48
Figure 1.13 TEM image showing a coiled wire of fused silver nanoparticles obtained by treatment
with supercritical water at 400 °C at 49 MPa. Reaction time was 60 minutes. Scale bar represents
100 nm. Figure from Chang et al.139
1.2.1.2.2 Dipole-dipole interactions
Linear aggregation of gold nanoparticles in ethanol has been shown.140 10 nm gold
nanoparticles synthesised in aqueous solution, sonicated in ethanol for 1 h then immobilised
on silicon resulted in closely spaced lines of discrete nanoparticles. Observation of the
nanoparticles in the ethanol solution showed similar results, giving credence to the theory
that aggregation happens in solution due to dipole-dipole interactions than due to drying
effects on the silicon. It is proposed that due to the change of medium in this study excess
stabiliser was removed from the solution, allowing aggregation of the particles where
previously electrostatic repulsion would have forbidden it. Coupled with the difference in
polarity of water vs. ethanol molecules, the former being able to counteract asymmetric
charges on the surface of the gold particles and the latter not, there is a compelling argument
for dipole-dipole interaction in solution being the cause of the anisotropic wires. Liao et al.
proposed a mechanism for this, whereby the formation of asymmetric charges on
nanoparticles lead them to become dimers.140 The integrative dipole moment of a dimer is

49
greater than that of a lone particle thus they will attract nanoparticles more strongly, causing
growth of the chain (Figure 1.14).
Figure 1.14 Illustration showing the mechanism of formation of linear chains of gold nanoparticles
in ethanol. Figure adapted from Liao et al.140
Further work by a different group suggests that this dipole-dipole mechanism could also be
dependent on the salt concentration in the solution.141 Dipole-dipole interactions induced by
exchange of negatively charged citrate ligands with neutral thiourea has also been reported
to trigger assembly of gold particles into 1D arrays.142 Similar methods have been employed
by other groups.143 There is still, however, some dispute over the true processes at work and
ongoing research by computational144 and experimental groups145, 146 aims to clarify this.
Superparamagnetic iron particles have been reported to spontaneously align into randomly
oriented 1D structures.147 There is a clear-cut transition from single nanoparticles to chains
as particle size increases and the dipole charges become sufficient to induce aggregation.
Electrochemistry can be used to exploit dipoles and align gold particles into short 1D
structures. A colloid of spherical gold particles (approx. 18 nm in diameter) was added to a
mixed organic/aqueous electrolytic solution. A current of 20 mA was applied for 20 min
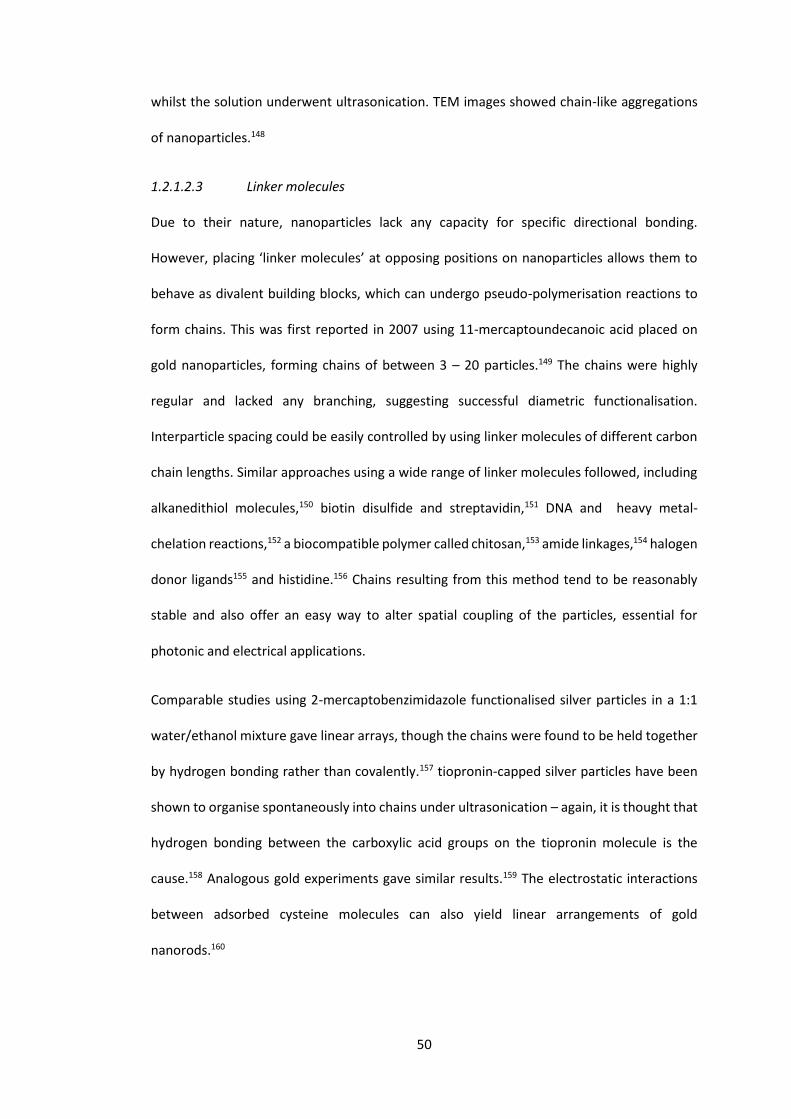
50
whilst the solution underwent ultrasonication. TEM images showed chain-like aggregations
of nanoparticles.148
1.2.1.2.3 Linker molecules
Due to their nature, nanoparticles lack any capacity for specific directional bonding.
However, placing ‘linker molecules’ at opposing positions on nanoparticles allows them to
behave as divalent building blocks, which can undergo pseudo-polymerisation reactions to
form chains. This was first reported in 2007 using 11-mercaptoundecanoic acid placed on
gold nanoparticles, forming chains of between 3 – 20 particles.149 The chains were highly
regular and lacked any branching, suggesting successful diametric functionalisation.
Interparticle spacing could be easily controlled by using linker molecules of different carbon
chain lengths. Similar approaches using a wide range of linker molecules followed, including
alkanedithiol molecules,150 biotin disulfide and streptavidin,151 DNA and heavy metal-
chelation reactions,152 a biocompatible polymer called chitosan,153 amide linkages,154 halogen
donor ligands155 and histidine.156 Chains resulting from this method tend to be reasonably
stable and also offer an easy way to alter spatial coupling of the particles, essential for
photonic and electrical applications.
Comparable studies using 2-mercaptobenzimidazole functionalised silver particles in a 1:1
water/ethanol mixture gave linear arrays, though the chains were found to be held together
by hydrogen bonding rather than covalently.157 tiopronin-capped silver particles have been
shown to organise spontaneously into chains under ultrasonication – again, it is thought that
hydrogen bonding between the carboxylic acid groups on the tiopronin molecule is the
cause.158 Analogous gold experiments gave similar results.159 The electrostatic interactions
between adsorbed cysteine molecules can also yield linear arrangements of gold
nanorods.160
51
1.2.1.2.4 Magnetic interactions
The inherent anisotropy in magnetic nanoparticles can be exploited to align them into 1D
arrays.59,161 thermal decomposition of iron pentacarbonyl was found to form single domain
ferromagnetic iron nanoparticles. The particles assembled themselves into chains extending
up to 300 μm due to the intrinsic magnetic forces present. .162 Similar results have been
reported computationally for cobalt, iron and nickel particles. 163
1.2.1.2.5 Oriented aggregation
‘The crystallographically specific self-assembly of primary nanocrystals’ is known as oriented
aggregation. 164 It involves the self-assembly of nanocrystals followed by crystallographic
reorganization, then subsequent aggregation into oriented aggregates.165 This phenomenon
was first investigated using titania,164,166 with silver being the first purely metallic
nanoparticles to be proven to behave in this way.167 Silver nitrate was reduced by a polyol in
the presence of a thiol stabiliser. Silver wires with high aspect ratios were formed in this way,
spanning from the nano- to micrometre scale in length and 2-6 nm in diameter. TEM studies
showed the wires to be an anisotropic coalescence of crystalline silver particles (Figure 1.15).
Giersig et al. produced similar results also using silver: silver wires were grown by the spatially
directed aggregation of silver along the (100) and (111) crystallographic planes.168 Palladium
in toluene has been shown to form nanoribbons in a comparable manner.169
Figure 1.15 TEM images showing (a) 6nm diameter silver wires, and (b) linear arrays of 2nm silver
nanoparticles. Figure reproduced with permission from Viau et al.167

52
1.2.1.2.6 Non-uniform stabiliser distributions
The uneven adsorption of stabilising ligands on the surface of nanocrystals is most often seen
in composite particles (such as CdSe170,171, silver sulphide172 and titania173). However, the
different crystallographic planes exhibited on pure metallic nanoparticles can also present
surfaces with different affinities for a chosen ligand, though this phenomenon has only been
reported for silver to the best of our knowledge. Poly(vinyl pyrrolidone) (PVP) shows differing
affinities for the silver 100 and 111 crystallographic planes, and varying the ratio of silver
nitrate precursor to PVP has resulted in anisotropic silver wires.174
1.2.1.2.7 Electron beam lithography
Electron beam lithography (EBL) is a well-known technique that has been used to form
periodic arrays of nanoparticles on a substrate, be that 1- or 2D.26,175–179 Palladium is one of
many metals that has been used in conjunction with EBL to form periodic arrays of
nanoparticles.179 Despite EBL’s ability to produce linear chains of particles it is not a bottom-
up self-assembly process and therefore is not covered in any detail here.
1.2.1.2.8 Micelles
Block copolymer micelles, exposed to a change in salt concentration or pH, can undergo a
transition from spherical to ribbon-like structures.180 Similar observations have been made
about gold nanoparticles encapsulated in amphiphilic poly(styrene-block-acrylic acid)
exposed to increasing acetic acid or salt concentration, forming chains of discrete particles
(Figure 1.16).181 An inversion of charge at the surface-liquid interface is thought to be the
driving force behind this. Chains up to 300 nanoparticles long have been produced by a
similar method.182

53
Figure 1.16 TEM images showing progressively longer chains of gold nanoparticles encapsulated in
amphiphilic poly(styrene-block¬-acrylic acid) by exposure to increasing concentrations of 1-(3-
dimethylamino)propyl)-3-ethylcarbodiimide methiodide (EDC): (a) [EDC] = 0 µM; (b) [EDC] = 55 mM;
(c) [EDC] = 87 mM. Figure with permission from Kang et al.181
1.2.1.2.9 Hydrophobic/hydrophilic interactions
Utilising the inherent hydrophobic/hydrophilic nature of different ligands can cause oriented
assembly of nanoparticles. Gold nanorods (8 x 42 nm) in an organic medium were capped
with CTAB along the long sides and a hydrophobic polymer on the ends.183 Exposure to water
in the organic medium caused the now amphiphilic nanorods to self-assemble into chains
between 10-100 blocks in length (Figure 1.17).
Figure 1.17 High-magnification TEM images of chains of triblocks obtained in the DMF/water
mixture with water concentrations of 10 wt% (a) 10 wt% and (b) 15 wt%. The scale bar is 50 nm.
Figure with permission from Rubinstein et al. 183
1.2.1.2.10 Electric fields
Polarizing conductive nanoparticles can bring about their organization along field lines,
forming 1D chains. 74,184 Facile control of chain length was afforded by tuning the
concentration of particles in the colloid, strength of the field and the dielectric permittivity
of the medium.

54
1.2.2 Properties and applications of 1D nanoparticle arrays
Anisotropic arrays of nanoparticles often display very different optical, electrical and
magnetic properties to their discrete counterparts, whilst simultaneously showing excellent
sensing capabilities. These properties and their current and potential uses are presented
below.
1.2.2.1 Optical properties
Optical properties of 1D arrays of metallic particles have been observed both theoretically
and experimentally as they exhibit extremely interesting group behaviours. Strong dichroism
in the absorption spectrum of linear arrays of silver particles has been observed.185 Different
resonant plasmon wavelengths were recorded depending upon the direction of polarization,
either perpendicular or parallel.
Plasmonics is the study of controlling and manipulating the interaction between the free
electrons in metals and incident light.186,187 Within plasmonics, waveguiding is one of the
most promising fields of interest. Waveguides are nanostructures of metal that transmit light
from one location to another with extreme precision. As waveguiding is possible due to the
strong interaction of light with the free electrons in the nanostructure, altering the shape
and size of the waveguiding structures is a powerful method of controlling the light and in
some cases can effect sub-wavelength manipulation.188,189
Though waveguiding is still somewhat in its infancy, silver has attracted the most attention
for both computational and experimental study.190–193 Nanowires of silver have been proven
to transmit light over distances of 10 µm,194 in addition to being capable of directing light
through multiple changes of angle and fanning the light out from a single wire to many
branches.195–197 Integration of plasmonic silver with optical polymer waveguides achieves
close control over coupling by altering the polarization of the incident light. Quantum dots
55
can be conjugated with silver nanowires to make simple plasmonic circuits.198 Silver nanorods
have been reported to produce 2D waveguides.199
Though interesting, silver nanowires do not fit completely within the remit of this review.
Chains of discrete silver nanoparticles show potential in waveguiding applications, though
have only more recently been studied. In 2003 the transfer of a plasmon along a closely-
spaced chain of silver nanoparticles was measured by Maier et al.200 Though propagation
distance was short (several hundred nanometres) the plasmon lost intensity, adding
observed experimental evidence to pre-existing theoretical predictions concerning
dampening of plasmon transmission along waveguides.193 Silver nanoparticle chains have
shown the ability to propagate light along the array at 10% the speed of light, with speed of
transmission dependent upon shape and size of the particles – this offers a facile method of
controlling propagation velocity. Gold nanoparticles in anisotropic arrays have been shown
to behave in a similar manner.181,201–203 Additionally, DNA-assembled chains of nanoparticles
have great promise in plasmonic applications as the helicity of the DNA introduces chirality
into the assembly which could hold potential in nanoscale electrical components.204,205
Integration of chains of gold nanoparticles with silicon waveguides has met with good
success. Depositing 700 nm chains of gold particles and exciting them through the
evanescent field of the silicon substrate showed transfer of a large proportion of the
transverse electric mode energy to the resonant gold particles.206 The system was found to
be highly sensitive to changes in the physical environment, showing potential for biological
or chemical sensing.
Another group utilised the strong electromagnetic coupling between close-packed gold
particles to trigger the formation of sub-radiant plasmons.207 The loss low associated with
this system allowed light to be propagated over several micrometres. This work highlighted
56
the advantage of disorder in the nanoparticles and opens the gates for nanoscale
optoelectronic applications.
1.2.2.2 Magnetic and electrical properties
The electrical properties of aggregations of nanoparticles are not necessarily an extrapolation
of the behaviour of the single particle. Braun et al. showed that wires of silver nanoparticles
showed non-linear electrical behaviour rather than ohmic.81 The current-voltage curves seen
were asymmetric with respect to zero bias, with some dependence on scan directionality. At
high resistance (>1013 Ω) a zero current plateau was observed at zero bias. However at
higher biases the silver wire became very conductive which has great potential for electrical
components, even if the origins of this effect are as yet unclear.
The collective magnetic properties exhibited by metallic nanoparticle arrays can be vastly
different to the sum of their parts. Evaporation of a cobalt containing solution onto highly
ordered pyrolytic graphite substrates in a strong magnetic field was shown to produce linear
arrays of 8 nm nanoparticles.208 Hysteresis studies showed a significant increase in remnant
magnetisation and coercivity of the linear chains of cobalt particles compared to a disordered
system of comparable particles (chains of particles 0.60 and 0.14 T respectively, compared
to the disordered systems 0.52 and 0.13 T). This was accredited to improved orientation of
the magnetic moments in the direction of the applied magnetic field. A perpendicularly
applied field resulted in a large drop in remnant magnetisation and coercivity. This was not
observed during hysteresis studies of disordered systems of the same cobalt particles. Similar
phenomena have been observed in nickel, with chains of nickel particles exhibiting magnetic
coercivity two orders of magnitude greater than the bulk metal.209 Coercivity was shown to
decrease with increasing size of the nickel particles.210 Manganese particles organised into
chains and supported on CuN substrates have also been proven to exhibit weak
ferromagnetism, compared to the paramagnetism seen in bulk manganese metal.211

57
1D arrays of polyelectrolyte-stabilised magnetite particles have found practical application
as a contrast agent in MRI scanning.212 The magnetic fluid, when injected directly into rats’
brains, has given scan results with vastly enhanced detail, allowing more accurate diagnoses.
Additionally they have shown superb biocompatibility and are cleared from the body quickly,
potentially due to the morphology of the chains allowing easy passage through the blood
vessels. This also has potential for detecting irregularities within the circulatory system such
as blocked blood vessels.
Quasi-1D rings of magnetic cobalt nanoparticles have recently been shown to have a vortex
state in the centre of the system which can be stable at room temperature.213 If the chirality
of the vortex can be controlled and switched easily it has great potential in next-generation,
ultradense data storage.214
1.2.2.3 Sensing applications
Sensing applications of 1D arrays of nanoparticles is one of the fastest-growing and most
applicable fields. Gold nanoparticle surfaces functionalised with peptide molecules have
been shown to self-assemble into linear chains when exposed to mercury ions.215 This
spontaneous assembly is marked by a noticeable colour change of the solution from red to
blue or purple, depending on the concentration of mercury ions present (Figure 1.18). This
was shown to be due to the formation of a new SPR band at 670 nm. This method enables
the facile detection of low concentrations Hg2+ ions (up to 4 ppm) in water by the naked eye,
proving a useful test for heavy metal contamination. Thiourea has been detected in a similar
colorimetric assay by utilising the assembly of gold nanoparticles in the presence of
sensitising sodium hydrogen sulphate, allowing concentrations of thiourea as low as 15 ppb
to be detected with the human eye.142

58
Figure 1.18 Image showing the colour change observed on adding mercury ions to a colloidal
suspension of peptide-functionalized gold nanoparticles. Image used with permission from Si et
al.171
Potential nanosensors to detect thiols have been produced by stringing chains of gold
nanoparticles between two electrodes.216 The resistance across the nanoparticle chain was
observed to change significantly on the binding of 1-mercapto-6-hexanol, possibly due to the
thiol molecules affecting the tunnelling barriers between nanoparticles. Measurements
taken in real time using an ampere meter of the thiol binding event show this change in
resistance clearly (Figure 1.19). This is a facile sensing method using readily available
equipment for detection, thus showing promise for commercialization.
Fig. 1.19 The binding of 1-mercapto-6-hexanol to gold nanoparticle chains measured in real-time.
The graph shows the change in resistance when the analyte is added at approx. 50 s. The image
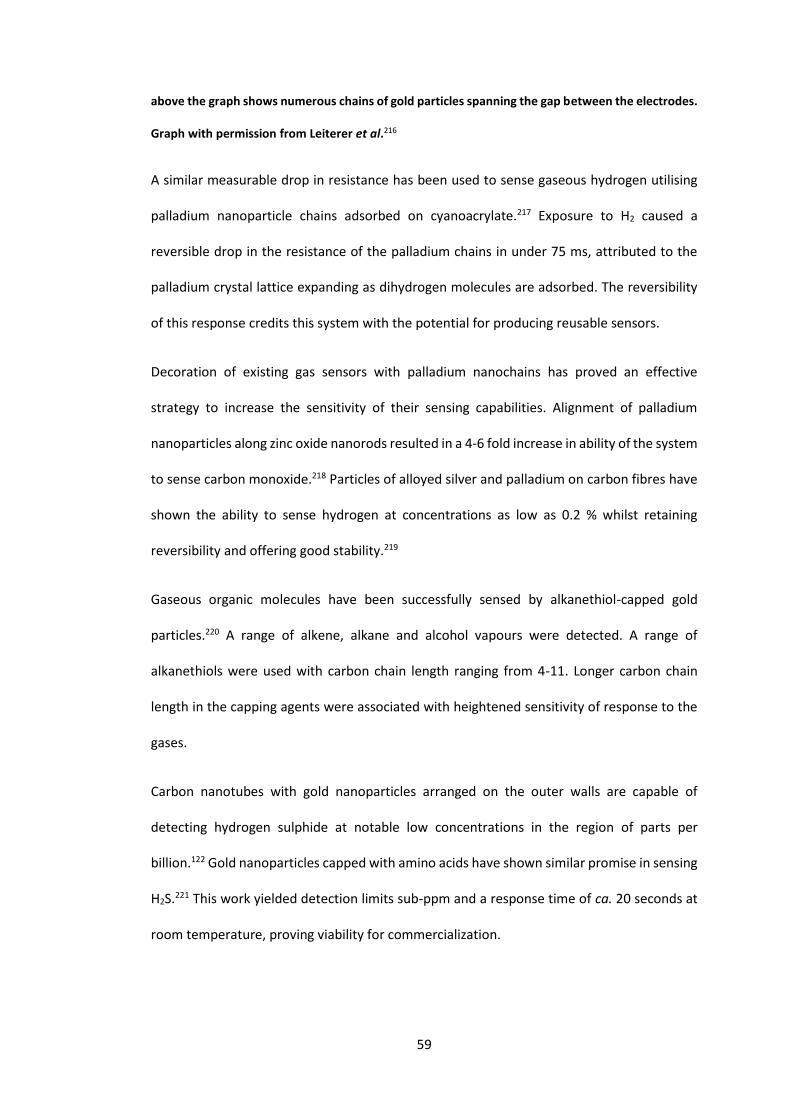
59
above the graph shows numerous chains of gold particles spanning the gap between the electrodes.
Graph with permission from Leiterer et al.216
A similar measurable drop in resistance has been used to sense gaseous hydrogen utilising
palladium nanoparticle chains adsorbed on cyanoacrylate.217 Exposure to H2 caused a
reversible drop in the resistance of the palladium chains in under 75 ms, attributed to the
palladium crystal lattice expanding as dihydrogen molecules are adsorbed. The reversibility
of this response credits this system with the potential for producing reusable sensors.
Decoration of existing gas sensors with palladium nanochains has proved an effective
strategy to increase the sensitivity of their sensing capabilities. Alignment of palladium
nanoparticles along zinc oxide nanorods resulted in a 4-6 fold increase in ability of the system
to sense carbon monoxide.218 Particles of alloyed silver and palladium on carbon fibres have
shown the ability to sense hydrogen at concentrations as low as 0.2 % whilst retaining
reversibility and offering good stability.219
Gaseous organic molecules have been successfully sensed by alkanethiol-capped gold
particles.220 A range of alkene, alkane and alcohol vapours were detected. A range of
alkanethiols were used with carbon chain length ranging from 4-11. Longer carbon chain
length in the capping agents were associated with heightened sensitivity of response to the
gases.
Carbon nanotubes with gold nanoparticles arranged on the outer walls are capable of
detecting hydrogen sulphide at notable low concentrations in the region of parts per
billion.122 Gold nanoparticles capped with amino acids have shown similar promise in sensing
H2S.221 This work yielded detection limits sub-ppm and a response time of ca. 20 seconds at
room temperature, proving viability for commercialization.

60
1.2.3 Future challenges
For chains of nanoparticles to realise their potential in commercial applications, control over
the interparticle spacing must be achieved. Distance-dependent photonic and electronic
transfer is vital in many electronic and photonic devices, sensors and telecommunication
applications therefore precise control over the spacing between nanoparticles is essential.
1D arrays of mixed nanoparticles could also be investigated, such as the combination of
metallic and semiconducting particles to produce nanoscale diodes.
A fuller understanding of template-free assembly methods is also needed if we are to
exercise more control over the preparation, spacing and resultant properties of the chains.
There is some debate over whether the model of spherical particles with a monolayer cover
of ligands is accurate.222 This feeds into a separate debate as to the extent to which the
removal or rearrangement of stabilising ligands is necessary to create a dipole on the
particles to induce self-assembly mechanisms. There is also evidence that points to
intermolecular forces between the ligands that make up the monolayer could be at least
partially responsible for inducing alignment of particles.223 Clarifying these issues would lead
to a more thorough explanation and understanding of the self-assembly processes behind
forming anisotropic arrangements of nanoparticles and therefore allow a more focused and
informed push towards commercialization.
The next section of this introduction covers photodynamic therapy, a thriving area of
research on the boundaries of chemistry and medicine. Recent advances in the field have
started to integrate pre-existing therapies with nanoparticle research to great effect,
generating exciting results which are reported below.
1.3 Introduction to photodynamic therapy
The emergent and ongoing epidemic of infections caused by antibiotic resistant strains of
common bacteria is a modern day plague on the global healthcare industry. Antibiotic

61
resistant strains of the bacteria that cause once easily-controlled infections such as
tuberculosis and pneumonia,224 gonhorrea,225 diarrhoea-causing C. difficile226 and food
poisoning pathogens E. coli227 and Salmonella228 are now commonplace. In several European
countries methicillin-resistant Staphylcoccus aureus (MRSA) accounts for up to 50% of tested
S. aureus bloodstream isolates (Figure 1.20).229 We desperately require innovative alternative
treatments for when standard antibiotic therapy fails, as is increasingly the case.
One potential treatment to replace or complement antibiotics is photodynamic therapy
(PDT). PDT can be used to kill bacteria for effective infection control or somatic cells for
cancer therapies.230
Figure 1.20 Infographic showing the proportion of S. aureus bloodstream isolates accounted for by
methicillin-resistant species in Europe in 2010. Image with permission from Antimicrobial resistance
surveillance in Europe, 2010 229
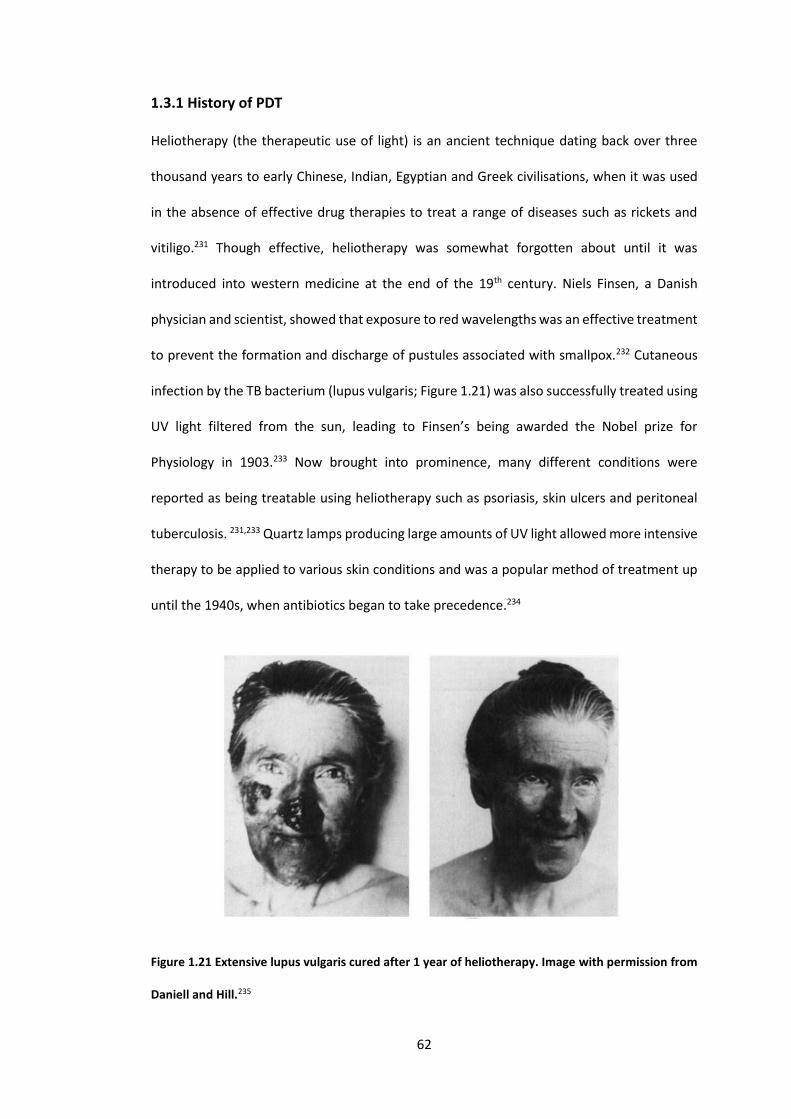
62
1.3.1 History of PDT
Heliotherapy (the therapeutic use of light) is an ancient technique dating back over three
thousand years to early Chinese, Indian, Egyptian and Greek civilisations, when it was used
in the absence of effective drug therapies to treat a range of diseases such as rickets and
vitiligo.231 Though effective, heliotherapy was somewhat forgotten about until it was
introduced into western medicine at the end of the 19th century. Niels Finsen, a Danish
physician and scientist, showed that exposure to red wavelengths was an effective treatment
to prevent the formation and discharge of pustules associated with smallpox.232 Cutaneous
infection by the TB bacterium (lupus vulgaris; Figure 1.21) was also successfully treated using
UV light filtered from the sun, leading to Finsen’s being awarded the Nobel prize for
Physiology in 1903.233 Now brought into prominence, many different conditions were
reported as being treatable using heliotherapy such as psoriasis, skin ulcers and peritoneal
tuberculosis. 231,233 Quartz lamps producing large amounts of UV light allowed more intensive
therapy to be applied to various skin conditions and was a popular method of treatment up
until the 1940s, when antibiotics began to take precedence.234
Figure 1.21 Extensive lupus vulgaris cured after 1 year of heliotherapy. Image with permission from
Daniell and Hill.235
63
The early years of last century brought the realisation that certain chemicals could, when
exposed to light of the right frequency, cause cellular death. Infusoria in the presence of
acridine dye were shown to be killed when exposed to certain wavelengths of light.236
Ingestion of eosine was found to induce dermatitis on skin that was exposed to sunlight,237
as well as being used topically to treat skin tumours.238 This singular property was named
‘photodynamic action’, with the agents that caused it termed ‘photosensitizers’. Modern PDT
sprang from extensive testing of different photosensitizer-light combinations in these years.
1.3.2 Photosensitizers and the mechanism of PDT
For PDT photosensitizers are typically localised to the target area, tissues or cells. This
provides an advantage over traditional surgical and chemotherapeutic techniques, as the
pathogens or malignant cells can be targeted and killed with little collateral damage to
surrounding tissues. Localisation can be achieved by injection, topical application or by
functionalisation with microbe- or cell-recognising moieties.
During the PDT process the photosensitizer is exposed to light of a specific frequency and
absorbs a photon, thus is promoted to a high energy triplet state. This excited state transfers
energy to molecular oxygen which in turn generates singlet oxygen, a metastable form of the
O2 molecule. Excited singlet oxygen is approximately 1 V more oxidising than the ground state
and consequently is much more electrophilic, allowing it to oxidise substrates that are
unaffected by oxygen in its lowest energy form.239 Singlet oxygen will react rapidly with
carbon-carbon double bonds, neutral nucleophiles (e.g. amines) and anions. As a
consequence of this it is highly cytotoxic, destroying cells by damaging cell walls, membranes
and DNA.240 This process is illustrated in Figure 1.22.
There are various well-studied families of photosensitizers used including phthalocyanines,
chlorophyll derivatives, porphyrins and associated macrocycles and dyes.241 The thiazine
family of dyes are also used as photosensitizers and includes methylene blue, azures A, B and

64
C, toluidine blue and thionin. There have already been many studies which confirm their
ability to act as photosensitizers in PDT.242–244 Methylene blue has been shown to be
successful against a range of pathogenic species and tumour cells. Topical application to an
MRSA infected wound followed by irradiation with 670 nm light gives a 25-fold reduction in
the number of viable MRSA bacteria.245 Good results have been obtained against E. coli246
and malignant cells.247 The latter study combines effective in vivo kill of tumour cells with
very little damage to surrounding healthy tissues by coupling methylene blue to a recognition
moiety.
Figure 1.22 Scheme showing the mechanism of photodymanic therapy. Image with permission from
Dolmans et al.236
1.3.3 Oncological applications of PDT
One of the most promising applications for PDT is the in vivo targeted treatment of cancers.
First reported in 1972 using haematoporphyrin-sensitized glioma cells in rats,248
fluorescein249 and acridine250 were quickly shown to be similarly effective. Clinical trials in
humans followed shortly, injecting haematoporphyrin derivative (HpD) into cutaneous or
sub-cutaneous tumours and irradiating them with 600-700 nm light.251 111 out of 113 lesions
showed a complete or partial response to this treatment. Moreover, no tumour type
investigated (including carcinomas of the prostate, breast, endometrium and colon;

65
melanomas; angio- and chondrosarcomas) was found to be unresponsive. This offers an
enormous advantage over current chemo- and radiotherapy, which is extremely specialised
and must be tailored to specific tumour types. Similar studies have since shown that HpD-
mediated PDT is also effective in the treatment of cancers of the lung,252,253 bladder,254,255
head and neck256,257 and glioma.258,259 Purified HpD in the form of photofrin II has also shown
potential.260–263
More recently, photodynamic diagnosis (PDD) has been used to obtain early diagnosis of
premalignant oral lesions. Topical application of 5-aminolevulinic acid in combination with
fluorescence imaging for this purpose was reported in 2006.264 Precursor lesions to
squamous cell carcinoma have been similarly diagnosed.265 With great sensitivity and almost
faultless accuracy, PDD is a vital tool in the early diagnosis of these aggressive and common
cancers, allowing the greatest possible chance of successful treatment as well as improved
cost effectiveness, monitoring ability, patient tolerance and a low invasiveness compared to
traditional diagnosis via surgical biopsy.
1.3.4 PDT to treat viruses, bacteria and fungi
Outside the field of oncology PDT is a phenomenally useful technique to combat pathogenic
viruses, bacteria and fungi. Methylene blue can be used to kill the herpes (HSV 1) virus by
blocking viral DNA replication.266 The same dye can be used topically under 660 nm laser
illumination for relief from herpes lesions.267 Strikingly, low concentrations of both
methylene blue and toluidine blue have both been shown to photoinactivate the HIV-1 virus
in blood plasma.268 It was later shown that inactivation of the virus was due to destruction of
the viral RNA.269 This has real potential for purification of donor blood. A 99% reduction in
the virus titre of cells infected by HIV and HSV viruses was also achieved by treatment with
5-aminolevulinic acid and irradiation.270
66
Many common fungal conditions can be addressed using PDT. Ringworm-causing
Trichophyton mentagrophytes and Microsporum gypseum can be killed using methylene blue
and illumination with white light.271 Candiosis, a common recurrent infection in
immunocompromised patients, is caused by a species of yeast called Candida albicans and is
easily killed by topical application of either methylene or toluidine blue followed by
illumination with a low-energy laser.272 Topical applications of methylene blue (concentration
450-500 µg/mL) completely removed C. albicans from the oral cavity in mice, showing great
promise for treatment of this opportunistic infection without aggressive drugs.273
Periodontal disease and other bacterial infections of the mouth have been treated with great
success with PDT. Aluminium disulphonated phthalocyanine in conjunction with a GaAs laser
has been shown to kill cariogenic bacteria in a convenient clinical time frame (30-90 s).274
Chlorin e6 has been shown to induce lethal photoinactivation of P. gingivalis, F. nucleatum
and C. gingivalis – three of the leading causes of periodontal disease.275
PDT has been used extensively to treat bacterial skin infections. MRSA in particular has been
shown to be killed by a variety of photosensitizers. Burn wounds on mice infected with S.
aureus were successfully treated with porphyrins to reduce the bacterial count.276
Polyethylenimine-ce6 in conjunction with non-coherent red light accelerated the healing of
MRSA-infected abrasions by 8.6 days compared to untreated wounds.277 Selective killing of
MRSA in a mixture with E. coli has been achieved by functionalising the photosensitizer with
a MRSA-recognising antibody for the specific strain, a treatment which shows potential to
treat infections caused by pathogenic species without disturbing the normal microbial
ecology of the skin.278
For situations where non-specific kill is desirable, methylene blue has proven itself a useful
broad-spectrum photosensitizer against a range of common problematic bacteria including
those species that cause acne and erythrasma.279 Kill was induced by exposure to white light,

67
meaning the cost of the treatment would be minimal. This, the non-specificity of the kill and
the improbability of the bacteria to develop resistance to this treatment in the manner of
antibiotic resistant pathogens means the technique holds real promise in clinical situations.
1.3.5 Conjugation of photosensitizers with nanoparticles
It has been recently reported that combining a photosensitizer with a nanoparticle to form a
conjugate can greatly increase their photosensitizing capacity.280,281 The toluidine blue-
induced lethal photosensitization of S. aureus can be increased by an order of magnitude by
conjugating the dye with gold nanoparticles.282 Further work by the same group on this topic
showed that conjugation with gold nanoparticles enhanced the UV-visible (UV-vis)
absorption of toluidine blue and methylene blue at a ‘critical concentration’, increasing the
extinction coefficient ten-fold compared to a solution of the dye alone.43 This work is
expanded upon in Chapter 3 of this thesis, with novel results being obtained.
It is worth noting that whilst scant literature is available on the subject of silver-dye
conjugates, both bulk and colloidal silver show inherent antimicrobial activity in the form of
a silver ion release mechanism.283 Ion release, though temperature and pH dependent, is not
reliant upon a photoactivated mechanism so kill of bacteria is seen both light and dark
conditions.284 Thus, combination of silver nanoparticles with photosensitizing dyes is an
interesting and relatively unexplored avenue of approach for lethal photosensitization of
pathogenic bacterial species.
1.3.6 Photosensitizers for antimicrobial surfaces
One very promising application of the bactericidal ability of photosensitizers is in making
functional surfaces.285 Instead of topical or in vivo application of the photosensitizer it is
encapsulated within a material and immobilised there. The surface can then be irradiated as
in PDT and bacteria which have colonised the surface will be killed via the singlet oxygen
mechanism outlined in Figure 1.22. Materials which have this capability have great potential
68
in medical applications, as a large number of hospital acquired infections (HAIs) are
transmitted by touch after contact with heavily contaminated, frequently touched ‘reservoir’
surfaces such as bed rails, door handles and telephones.286,287 HAIs are estimated to affect
more than 1 in 10 hospital patients and over half all hospitalization complications.288 These
preventable infections are a huge drain on health care resources worldwide, costing an
estimated £1 billion per year in the UK alone.289 Thus if these reservoir surfaces in hospitals
could be fabricated from functional, antimicrobial materials the overall number of viable
bacteria on them could be significantly reduced and transmission rates lessened. This
presents an elegant scheme to reduce the number of HAIs and reduce associated cost,
benefitting patients and healthcare system.
A number of different surfaces such as glass290 and titania291 have been investigated for the
application of functional antimicrobial surfaces, but polymers have emerged as by far the
most popular due to their flexibility, ease of modification, low cost and durability.292 Different
polymers have been trialled, including silicone,293,294 cellulose acetate,295,296 resins297 and
polyurethane.298–300 Combinations of these polymers with different photosensitising dyes –
particularly from the triarylmethyl and phenothiazine groups – showed good general
photobactericidal effect against both gram positive and gram negative organisms, though
broadly speaking better and quicker kill rates were observed against the former. Activation
of the photobactericidal effects of the photosensitizer-modified polymers can either be by
laser301 or a non-specific white light source.298 Though laser illumination tends to induce
quicker kill rates it is also more expensive and requires specialist equipment, therefore it is
advantageous if the modified polymers exhibit good antimicrobial activity under a standard
white light source to minimise the cost and expertise required.
Additional essential criteria for these functional surfaces to fulfil include high durability,
resistant to leaching under routine cleaning/washing conditions and benign to both humans

69
and the environment. Non-toxicity towards humans can be achieved either by choosing
photosensitizers which are known to be safe or by ensuring the photosensitizer is sufficiently
well contained within the polymer that it cannot leach out. Several methods of incorporating
dyes into polymers have been reported. Simple covalent attachment to the surface can be
used but can be hard to achieve as polymers used in medical settings tend to be reasonably
inert. Another easy method is to use a swell-encapsulation-shrink method to allow dye
molecules to be held within the bulk polymer rather than sitting on the surface.298 This
method uses a solvent to swell the polymer in the presence of the desired dye molecule. The
dye molecules can diffuse into the polymer matrix under these conditions and move into the
bulk. Upon removal from the swelling solution the solvent evaporates and the polymer
shrinks back to its original size, trapping the dye molecules within. In this way the dye
molecules are immobilised within the polymer framework and are resistant to leaching under
aqueous conditions, an important property if the antimicrobial polymers are to be both long
lasting and non-toxic to humans.
Though toxicity of the chosen photosensitizer should be carefully considered, it has been
shown that the concentrations of photosensitizers and illumination times which exhibit
excellent bacterial cytotoxicity do not possess sufficient power to damage larger mammalian
cells.302,303 The high vulnerability of bacterial cells to lethal photosensitization allowed
surfaces to be fabricated that not only kill bacteria on the polymer itself but also up to 0.65
mm away from it, a huge distance in the nanoworld.304 This protective ‘aura’ provided by
antimicrobial surfaces shows excellent potential in medical applications by providing a potent
barrier to biofilm formation.
1.3.6.1 Photosensitizer-nanoparticle conjugates for antimicrobial surfaces
As discussed in Section 1.3.5, the efficiency of a photosensitizer in solution can be increased
by combining it with a nanomaterial, particularly a nanoparticle. Similar phenomena have

70
been recorded in polymer-encapsulated systems. Methylene blue has been shown to exhibit
enhanced bacterial kill rates when combined with gold nanoparticles in silicone, compared
to methylene blue-modified silicone only. 298,305,306 Great specificity was seen as to the size of
the nanoparticles incorporated into the system – gold particles over 20 nm in diameter
decreased the photobactericidal kill rates whereas very small particles (~2 nm) increased
activity significantly, increasing the kill of gram negative E. coli by a factor of 1log10 and
reducing numbers of gram positive S. epidermis to below the detection limit, corresponding
to a 99.99% kill.305. Silicone samples containing the same ~2 nm gold particles did not show
any antimicrobial ability, thus the enhanced kill rates seen on the addition of these particles
to methylene blue was thought to be due to a cooperative effect between the particle and
the dye. Similar studies have shown that the number of viable S. epidermis colonies can be
reduced by half using silicone modified with methylene blue and gold nanoparticles when
the surface is illuminated by a laser for 10 minutes per hour.307
Metal oxide nanoparticles have also shown good antimicrobial ability when combined with
crystal violet. Semiconducting zinc oxide particles, fabricated from the thermal
decomposition of a metal-oleate precursor, were incorporated into medical grade
polyurethane sheets along with crystal violet.308 The resultant modified polymer showed
excellent bactericidal activity against both gram positive and negative organisms, exhibiting
complete kill of S. aureus in 1 hour and a 2.5 log10 reduction of E. coli counts in 2 hours.
Interestingly the crystal violet-zinc oxide nanoparticle system also had a potent dark kill
effect, achieving 99.9% kill against E. coli in 4 hours and S. aureus in 2 hours when incubated
in dark conditions. The ability to destroy bacteria under a non-specialised white light source
combined with good dark kill ability make this system very promising for medical
applications.

71
The conjugation of photosensitizers with nanoparticles is, then, an exciting topic with much
scope to provide real benefit in many healthcare settings. Chapter 4 of this thesis is dedicated
to results gained from the conjugation of both silver and gold nanoparticles with a range of
dyes to excellent effect, producing antimicrobial polymers with potent light and dark kill.
The next chapter of this thesis exemplifies the techniques used to synthesize a range of gold
and silver nanoparticles to be used in the later chapters’ investigations.

72
CHAPTER 2 : THE SYNTHESIS AND CHARACTERIZATION OF GOLD AND SILVER NANOPARTICLES
2.1 Aims
In this chapter we aimed to synthesise a range of gold, silver and bimetallic nanoparticles.
Particles were fabricated via a variety of synthetic routes and using a number of different
capping agents to produce particles with different compositions and shapes. The properties
and behaviour of metallic nanoparticles varies greatly according to shape, size, composition
and capping ligand, thus the ability to control the morphology of particles is paramount in
the quest for tuneable behaviour. We present the synthesis of pure silver, pure gold and
silver-gold bimetallic citrate-stabilised spherical particles using a modified Turkevich (citrate
reduction) method. The synthesis of 2-mercaptopropionylglycine-capped silver particles is
also presented. These particles were subsequently caused to self-arrange into long, high
aspect ratio chains via a sonication treatment. Anisotropic gold nanorods were also
synthesised using a seeding method, producing particles with a defined aspect ratio. Multi-
branched gold nanocrystals were made by reduction of auric acid by a 2-[4-(2-hydroxyethyl)-
1-piperazinyl]ethane-sulfonic acid (HEPES) buffer solution, forming ‘nanourchins’ under very
mild reaction conditions. Particles were studied by UV-vis spectroscopy to obtain the SPR for
each type. TEM was also used to provide visual confirmation of unique morphologies.
2.2 Introduction to the synthesis and properties of noble metal
nanoparticles
Synthetic routes to noble metal nanoparticles have been widely reported since the fifties.
The fascinating properties of nanoparticles make them the focus of intense study in both
chemical and physical fields as they have many uses in commercial, medical and technological
applications.20,72,309 One of the most interesting things about nanoparticles is the size, shape
73
and dielectric medium-dependence of their properties; that is, altering the morphology of a
particle or its capping agent can have notable effects on its optical, electrical and magnetic
behaviour, a phenomenon discussed more fully in Section1.1.12,30,48,50 This level of achievable
tuneability can be vital in engineering novel nanoparticles for new applications. The method
of synthesis of a nanoparticle, be it bottom-up or top-down, and selection of the capping
agent are crucial to producing the different shapes, sizes and properties desired.
As already noted in Section 1.1.2, bottom-up methods of nanoparticle synthesis dominate
the literature, not only due to their ease and flexibility but also as they do not require the
specialist instrumentation needed for top-down approaches and consequently tend to be
much cheaper. Most bottom-up techniques use a reducing agent such as sodium borohydride
or citric acid to reduce gold or silver ions in solution, resulting in particles of the neutral metal
forming. Capping molecules are usually used in the reaction mixture to aid monodispersity
and stabilise the particles, which have a high surface energy, from precipitating out of
solution.310,311
Great control over size, shape and properties of nanoparticles can be achieved by altering
reaction parameters. Though susceptible to variation in each batch, control of reaction time,
choice of reducing agent or method, temperature and selection of capping molecule can all
dictate the morphology of the resultant particles.17,46,312 A wide variety of particle shapes
such as stars, cubes, triangles, wires and tubes have been produced in addition to regular
nanospheres.30,33,34,44,313
The work in this chapter uses some common bottom-up synthesis techniques, successfully
synthesising a range of gold, silver and bimetallic particles of different shapes and sizes for
use in further investigations. We report the successful synthesis of citrate-stabilised gold and
silver nanoparticles using a Turkevich-style citrate reduction method (discussed in Section
1.1.2.1), producing excellent, well-formed particles. Bimetallic particles of gold and silver

74
were produced using analogous methods. Tiopronin-capped silver nanoparticles were also
generated using a Brust synthesis, utilising sodium borohydride as a reducing agent to give
regular, spherical particles of small size. These particles were then used to fabricate high
aspect ratio arrays of discrete particles by a sonication step. Gold nanorods were synthesised
using a seed-mediated growth mechanism (seeding methods are reported on in Section
1.1.2.2), producing particles with defined quadrilateral shape with a range of aspect ratios.
Branched gold nanocrystals were also successfully produced using a HEPES buffer solution to
reduce aqueous auric acid to produce branched nanocrystals of crystalline gold. By contrast
with the spherical or anisotropic particles described above, branched nanocrystals are
comparatively poorly covered in literature owing to the difficulties in generating branched
structures from highly symmetrical, face-centred cubic noble metals by a homogenous
nucleation and growth process. Several methods for producing branched or asymmetric
nanostructures by seeding methods have been reported,314–319 though all required multistep
seeding procedures and/or the use of polymers and surfactants to induce directional growth.
Such molecules can be difficult to remove from the surface of the nanoparticles without
harsh reaction conditions which can also damage the desired nanocrystals. The method used
herein was adapted from Lee et al. and is both seedless and surfactantless, utilising a 2-[4-
(2-hydroxyethyl)-1-piperazinyl]ethane-sulfonic acid (HEPES) buffer to reduce an aqueous
solution of auric acid to produce branched gold nanocrystals.320 HEPES contains a piperazine
ring (Figure 2.1) which is capable of producing nitrogen-centred free radicals, which in turn
are capable of reducing the AuCl4- ions in aqueous auric acid. HEPES also preferentially
adsorbs on the 100 face of gold, thus directs growth along the 111 plane and results in
multiple branches forming.

75
Figure 2.1 The structure of 2-[4-(2-hydroxyethyl)-1-piperazinyl]ethane-sulfonic acid (HEPES)
showing the piperazine ring.
All particles synthesised in this chapter were studied using UV-vis to obtain the SPR band
value for each sample. SPR (discussed in detail Section 1.1.1) is a useful diagnostic tool when
synthesising colloids as different metals exhibit characteristic colours which are variable with
size. The shape, size and monodispersity of the particles were observed using transmission
electron microscopy (TEM).
2.3 Experimental methods
All water used was deionised (resistivity ≥ 15 MΩ cm). All glassware was washed with aqua
regia before use, then rinsed with copious quantities of deionised water and air dried.
2.3.1 Modified Turkevich synthesis of gold and silver nanoparticles
Stock solutions were made up as follows:
Solution 1: HAuCl4.3H2O (170 mg, 0.445 mmol) was dissolved in deionised water (100 mL)
giving a ~4.5 mM solution. Solution was a clear bright yellow.
Solution 2: AgNO3 (85 mg, 0.500 mmol) was dissolved in deionised water (100 mL) giving a ~5
mM solution. Solution was colourless.
Solution 3: Na3C6H5O7.2H2O (250 mg, 0.969 mmol) was dissolved in deionised water (50 mL)
giving a ~20 mM solution. Solution was colourless.
76
2.3.1.1 Synthesis of citrate-stabilised gold nanoparticles
Solution 1 (2 mL) was diluted in deionised water (16 mL). The pale yellow solution was heated
in a mantle and boiled for 2 min. Solution 3 (2 mL) was added dropwise over 45-60 s. Solution
was boiled for 1 min, during which time a rapid colour change from colourless to grey to
pinkish red to deep crimson was observed. Solutions were allowed to cool.
2.3.1.2 Synthesis of citrate-stabilised silver nanoparticles
Solution 2 (2 mL) was diluted in deionised water (16 mL). The colourless mixture was brought
to reflux. Solution 3 (2 mL) was added dropwise over 45-60 s. The mixture was refluxed for
30 min, during which time a gradual colour change from colourless to slightly cloudy, greyish
yellow was observed. Solutions were allowed to cool.
2.3.1.3 Synthesis of citrate-stabilised silver-gold nanoparticles
Three different ratios of 5 mM HAuCl4.3H2O (solution 1) to 5 mM AgNO3 (solution 2) were
used:
i. 0.5 mL solution 1 and 1.5 mL solution 2; gold to silver ratio of 1:3
ii. 1 mL solution 1 and 1 mL solution 2; gold to silver ratio of 1:1
iii. 1.5 mL solution 1 and 0.5 mL solution 2; gold to silver ratio of 3:1
Each ratio used an analogous method. The example given is for (ii) 1:1. The results of (i) - (iii)
are summarised in Table 1.
Solutions 1 (1 mL) 2 (1 mL) were dissolved in deionised water (16 mL). The pale yellow
solution was brought to the boil. Solution 3 (2 mL) was injected and the mixture boiled for a
further 2 minutes. A colour change from pale yellow to grey to a purplish red was observed.
Table 2.1 the ratios of gold to silver used to make citrate-stabilised silver-gold particles and the colour of the resultant solution of nanoparticles
Sample Vol. solution 1 (mL) Vol. solution 2 (mL) Ratio gold : silver Colour of solution
(i) 0.5 1.5 1:3 Peach
77
(ii) 1 1 1:1 Red/purple
(iii) 1.5 0.5 3:1 Lilac
2.3.2 Synthesis of 2-mercaptopropionylglycine-capped silver nanoparticles and
fabrication of 1D chains
2.3.2.1 Synthesis of 2-mercaptopropionylglycine-capped silver nanoparticles
Silver nitrate (0.5092 g, 3.00 mmol) and of 2-mercaptopropionylglycine (0.9499 g, 5.82 mmol)
were dissolved in deionised water (25 ml and 10 ml respectively). The two solutions were
cooled separately to below 5 °C before being combined to give a cloudy yellow solution.
Sodium borohydride (0.2563 g, 6.78 mmol) was dissolved in deionised water (10 ml) and
added dropwise to the yellow solution over ~5min with vigorous stirring. The temperature
was kept below 5 °C throughout this addition. A colour change from yellow to orange to a
dark red-brown was observed. This solution was allowed to come to room temperature.
Methanol (ca. 100 mL) was added to precipitate the particles. The reddish brown suspension
was filtered under vacuum and the particles collected on a Millipore 0.45 µm membrane
filter. The dark brown cake of isolate was washed sequentially with methanol, ethanol and
acetone before being allowed to dry in air.
2.3.2.2 Synthesis of high-aspect ratio 2-mercaptopropionylglycine-capped silver
nanoparticle chains
To make the silver nanoparticle chains the dried tiopronin capped silver nanoparticles were
added to deionised water at a concentration of 0.5 mg/mL. The flask was sonicated for 2
hours in an ultrasonic bath to produce the silver nanoparticle assemblies in solution. The
solution was a dark amber colour.

78
2.3.3Synthesis of gold nanorods using seed and growth solutions
2.3.3.1 Stock solutions
Stock solutions were made up as follows:
Solution A: HAuCl4.3H2O (0.5 mL of a 5 mM solution) was dissolved in 4.5 mL deionised water
to give a 0.5 mM solution
Solution B: (C16H33)N(CH3)3Br (cetyltrimethylammonium bromide [CTAB]; 0.7337 g) was
dissolved in deionised water (10 mL) to give a 0.2 M solution.
Solution C: NaBH4 (0.0039 g) was dissolved in deionised water (10 mL) to give a 0.01 M
solution.
Solution D: AgNO3 (0.0068 g) was dissolved in deionised water (10 mL) to give a 0.004 M
solution.
Solution E: HAuCl4.3H2O (1 mL of a 5 mM solution) was dissolved in 4 mL deionised water to
give a 1 mM solution
Solution F: Ascorbic acid (0.1377 g) was dissolved in deionised water (10 mL) to give a 0.0788
M solution.
2.3.3.2 Synthesis of gold nanorods
Seed solution: Solution A (5 mL) was added to Solution B (5 mL) and stirred for 15 min.
Solution C was cooled in ice. Solution C (0.6 mL, 3 °C) was added to the CTAB/gold solution
with vigorous stirring. A colour change from milky yellow to opaque brown was observed.
The solution was stirred and heated to 50 °C in a water bath to promote dissolution of CTAB.
Once fully dissolved (~5 min) the solution was removed from the water bath.
Growth solution: Solution E (0.2 mL) was added to Solution B (5 mL). Solution F (5 mL) was
added and a colour change from colourless to yellow-amber was observed on gentle mixing.

79
Solution F (70 µL) was added to the mixture. A colour change from yellow to colourless was
observed.
Synthesis of nanorods: 20 µL seed solution was added to the growth solution. This mixture
was incubated at 30 °C. A colour change from colourless to smoky grey was observed after
~5 min and to dark blue after 1 h. Incubation overnight resulted in dark indigo solutions that
were removed from the water bath and allowed to come to room temperature.
2.3.4 Synthesis of branched gold nanocrystals
A buffer solution of 2-[4-(2-hydroxyethyl)-1-piperazinyl]ethane-sulfonic acid (HEPES) was
made up by dissolving 0.4747 g HEPES in deionised water (20 mL). The pH of this was adjusted
to 7.4 ± 0.1 using 1 M NaOH. 2 mL of the buffer was dissolved in deionised water (3 mL) and
20 mM HAuCl4.3H20 (50 µL) was added. This mixture was agitated and left to stand at room
temperature for 1 h. A colour change from clear, extremely faint yellow to blue-purple was
observed.
2.3.5 Characterization techniques
2.3.5.1 TEM
Samples of the particles were prepared by evaporating drops of the nanoparticle solution
onto carbon coated copper grids and allowing them to air dry in a dust-free environment. A
Jeol 200 kV microscope was used to obtain images of all particles other than as-prepared 2-
mercaptopropionylglycine-capped silver nanoparticles, for which a Jeol-1010 microscope at
80 kV was used.
2.3.5.2 UV-vis absorption measurements
UV-vis absorption spectra were recorded using a Shimadzu UV-1800 Spectrophotometer.
Plastic cuvettes with a light path length of 10 mm were used. Absorption was measured over
the spectral range 200 – 1000 nm.

80
2.4 Results and discussion
2.4.1 Modified Turkevich synthesis of noble metal nanoparticles
2.4.1.1 Citrate-stabilised gold nanoparticles
Synthesis of gold nanoparticles using the citrate reduction method outlined above resulted
in ruby red, clear solutions forming. UV-vis studies of these showed a single, clear absorption
in the visible range at 527 nm (Figure 2.2), typical for gold colloids formed by this method.28
TEM studies of the same particles showed well-formed, spherical particles arranged singly or
in small groups (Figure 2.3). Average particle diameter was found to be 11 nm.
The synthesis was very robust and repeatable with little variation in colour observed for each
experimental run. Solutions were stable for long periods of time (> 2 years) with no change
in colour or transparency.
Figure 2.2 UV-vis spectrum of gold nanoparticles made using the Turkevich citrate reduction method.

81
Figure 2.3 TEM images showing gold nanoparticles synthesised by the Turkevich method
2.4.1.2 Citrate-stabilised silver nanoparticles
Synthesis of silver nanoparticles using the citrate reduction method gave pale yellow
solutions that were occasionally greyish and slightly turbid, mostly likely a consequence of
partial oxidation of the surface of the silver particles. UV-vis studies of these showed a single
absorption in the visible range at ~402 nm (Figure 2.4), though the peak was somewhat
broader than the sharp absorption seen for the gold particles synthesised in the same way.
This is indicative of a less tightly arranged distribution of particle sizes and could also be due
to the extra scattering caused by the slight turbidity of the silver colloids compared to the
gold. TEM studies of the silver particles showed particles that were predominantly spherical
with some ellipsoidal entities. Some less regular shapes were also observed (Figure 2.5). A
greater range of particle sizes was observed than in the gold samples, spanning the range 5-
40 nm. The increased range of particle sizes, less regular shape and larger average size of the
silver crystallites formed by this method as opposed to analogous gold experiments is
documented in literature.37 Average particle size could not be accurately calculated due to
the irregular morphology of the silver nanoparticles.

82
Figure 2.4 UV-vis spectrum of silver nanoparticles synthesised by the Turkevich citrate reduction method
Figure 2.5 TEM images showing silver nanoparticles synthesised by the Turkevich method. Irregularities are seen in particle size and morphology.
2.4.1.3 Citrate-stabilised bimetallic silver-gold nanoparticles
Particles of silver and gold were synthesised using the citrate reduction method. Three
different ratios of silver to gold stock were used, as summarised in Table 2.1. All samples of
all molar ratios of gold and silver gave one absorption in the visible range of the UV-vis

83
spectrum, indicative of a gold-silver hybrid particle forming rather than two separate
particles of pure gold and pure silver, which would give rise to a double peaked spectrum.
Colours of the colloids ranged from dark yellow (Ag only) through peach (1:3 Au:Ag), red-
purple (1:1 Ag:Au), lilac (3:1 Au:Ag) to red (Au only). This can be seen in Figure 2.6. It should
be noted that these solutions were of the modal colour and that repeats at the same molar
ratios exhibited variation in hue. Bimetallic samples were less stable than pure silver or pure
gold synthesised in the same manner and fell out of solution after ~24-48 hrs.
Figure 2.6 Photograph showing the progression in colour as molar ratio of gold to silver changes in solutions of citrate-stabilised gold-silver nanoparticles. A = pure silver, B = 1:3 Au:Ag, C = 1:1 Au:Ag, D = 3:1 Au:Ag, E = pure gold.
UV-vis absorption spectra of all silver-gold particles gave single absorption in the UV-vis. The
location of the maximum of this point varied with each run. As such, a mathematical average
of all samples of each molar ration was calculated to give a more representative view. The
spectra of these are shown in Figure 2.7. The SPR maxima vary with changing molar ratios of
gold to silver, though not in a linear way: 3:1 Au:Ag particles had an average SPR band located
at 531 nm, .1:1 Au:Ag at 534 nm and 1:3 Au:Ag at 526 nm. The SPR peaks are tabulated in
Table 2.2 and also marked on Figure 2.7. Absorptions for 3:1 and 1:3 Au:Ag particles were
reasonably sharp, whereas the absorption for 1:1 Au:Ag particles was broader and less
symmetrical.
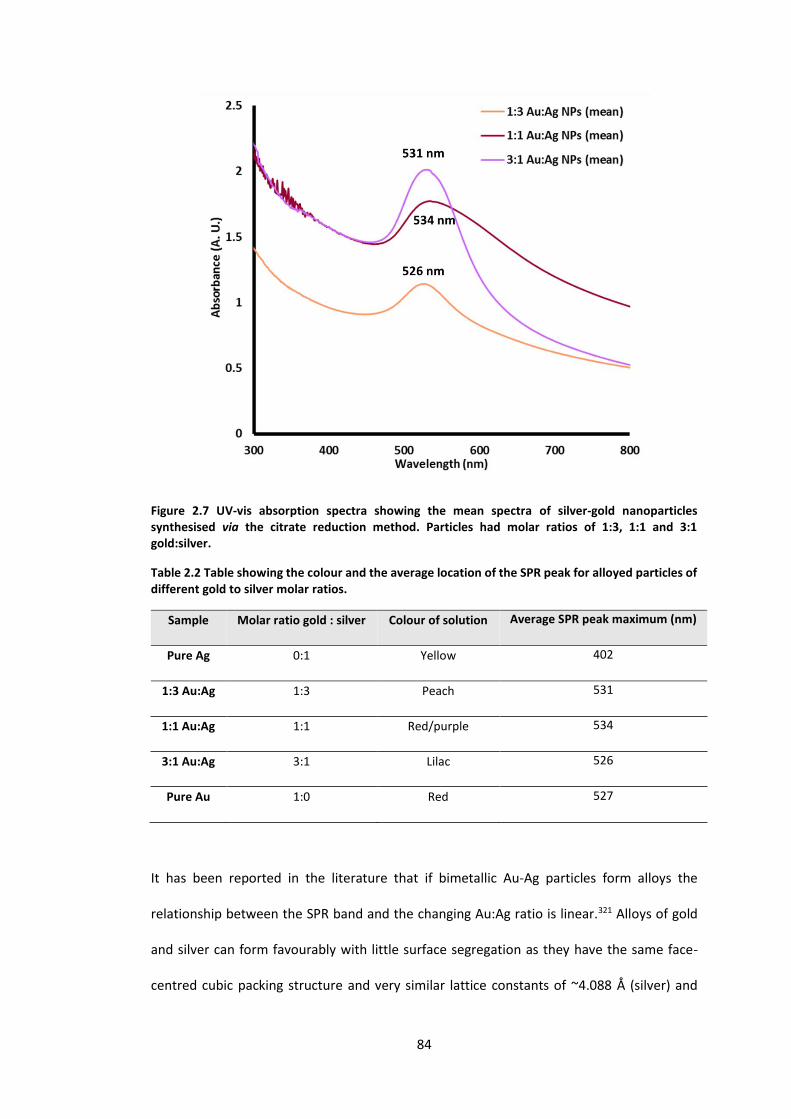
84
Figure 2.7 UV-vis absorption spectra showing the mean spectra of silver-gold nanoparticles synthesised via the citrate reduction method. Particles had molar ratios of 1:3, 1:1 and 3:1 gold:silver.
Table 2.2 Table showing the colour and the average location of the SPR peak for alloyed particles of different gold to silver molar ratios.
Sample Molar ratio gold : silver Colour of solution Average SPR peak maximum (nm)
Pure Ag 0:1 Yellow 402
1:3 Au:Ag 1:3 Peach 531
1:1 Au:Ag 1:1 Red/purple 534
3:1 Au:Ag 3:1 Lilac 526
Pure Au 1:0 Red 527
It has been reported in the literature that if bimetallic Au-Ag particles form alloys the
relationship between the SPR band and the changing Au:Ag ratio is linear.321 Alloys of gold
and silver can form favourably with little surface segregation as they have the same face-
centred cubic packing structure and very similar lattice constants of ~4.088 Å (silver) and

85
4.073 Å (gold), thus minimising lattice strain.30 It has also been shown that core-shell particles
exhibit a non-linear, but progressive, relationship as the Au:Ag content changes.322 The
particles in this experiment exhibit neither type of behaviour, as is shown in Figure 2.8.
Position of the average SPR red shifts dramatically from the pure silver position (402 nm) at
even low gold content, then fluctuates as gold content continues to increase. SPR bands for
all gold to silver ratios were above that of the pure gold samples (527 nm) with the exception
of 3:1 Au:Ag particles, which had a maximum at 526 nm. No predictable relationship between
molar ratio of gold to silver and average SPR was observed. Failure of the SPR to behave
either linearly or predictably non-linearly suggests a structure which is neither core-shell nor
a true, homogenous alloy. It is possible that particles formed with a core shell structure
whereby both core and shell are alloys of gold and silver, but rich in one or the other. A
visualisation of this is shown in Figure 2.9. If this is true, differing levels of silver or gold in the
core or shell of the particles could explain the fluctuations observed in SPR maxima for each
molar ratio. Alternatively it is possibly that no core-shell structure exists but that different
regions of gold- or silver-rich alloy make up the particles randomly, giving a different
‘patchwork’ effect with each and explaining the unsystematic SPR results. It is possible that
very high resolution XRD could be used to resolve this issue. High resolution XRD has been
successfully used in other cases to prove the existence of homogenous gold-silver alloys in
nanoparticles so its use in this instance could prove useful,323 however the isolation of
particles as a powder would be necessary and these samples were of insufficient
concentrations to achieve this.

86
Figure 2.8 Graph showing the change in position of the SPR maximum as molar ratio of gold to silver increases.
Figure 2.9 Illustration showing different types of gold-silver particles that can form. A: silver core, gold shell; B: gold core, silver shell; C: silver-rich alloy core, gold-rich alloy shell; D: alloyed; E: gold-rich alloy core, silver-rich alloy shell.
TEM analysis of 1:3 Au:Ag particles showed a range of particles sizes and shapes (Figure 2.10).
The average diameter of discrete particles was found to be 10.5 nm, though particles from 2
nm to 30 nm were observed (Figure 2.10A and B). Regions of densely packed particles and
larger, cloudy agglomerations were observed (Figure 2.10C). Discrete particles were
observed to be of crystalline metal as lattice planes were seen under high magnification
87
(Figure 2.10D), though not to be single crystals - grain boundaries were seen. This suggests
different regions of growth, probably as a result of the mix of metals used in synthesis, and
supports the assertion that a patchwork of silver- or gold-rich alloys makes up the particles
synthesised in this manner. Images of 1:1 Au:Ag particles reveal similar patterns: a range of
particles with irregular sizes and shapes (Figure 2.11 A and B) exhibiting regions of both
discrete particles and large agglomerations of particles and less well-formed cloudy matter
extending over several micrometres (Figure 2.11C). Particles were again found to be
crystalline under high magnifications, showing areas of differently-orientated lattice planes
indicative of aggregated crystallites. Average particle size was 10.1 nm with a size range of 2-
35 nm, showing little difference to the 1:3 Au:Ag particles. 3:1 Au:Ag particles yielded very
similar results (Figure 2.12) though particle size was found to be somewhat smaller, showing
a range from 2-15 nm and an average diameter of 8 nm. Particles were also observed to be
more regular in shape, likely a consequence of the increased gold content in the reaction
mixture as silver particles synthesised by a citrate reduction tend to be larger and less regular
than gold.324

88
Figure 2.10 TEM images showing bimetallic silver-gold particles synthesised using a molar ratio of 1:3 Au:Ag

89
Figure 2.11 TEM images showing bimetallic silver-gold particles synthesised using a molar ratio of 1:1 Au:Ag
Figure 2.12 TEM images showing bimetallic silver-gold particles synthesised using a molar ratio of 3:1 Au:Ag

90
2.4.2 Synthesis of 2-mercaptopropionylglycine capped silver nanoparticles
Synthesis of silver nanoparticles capped with 2-mercaptopropionylglycine (tiopronin) was
successfully achieved using a Brust sodium borohydride reduction of silver nitrate. Isolated
nanoparticles produced by this method were a solid, dark red-brown powder. Upon
dissolution in deionised water at a rate of 1 mg/mL dark amber solutions were obtained. A
UV-vis spectrum of a typical solution prepared thus is shown in Figure 2.13 below. A distinct
shoulder is seen at ~377 nm.
Examination of as-prepared samples of nanoparticles under the electron microscope showed
discrete particles with a variety of sizes present on the grid (Figures 2.14 and 2.15). Particle
size varied from 3 nm to approximately 15 nm, though smaller particles were most common.
Particles were predominantly spherical, typically well-formed and closely packed. Average
particle size was 6 nm. Particles in the as-prepared samples were observed to be
predominantly in densely-packed agglomerations rather than dispersed, as shown in the
micrograph in Figures 2.14 and 2.15. There is no evidence of the formation of chains of
nanoparticles in the as-prepared samples.
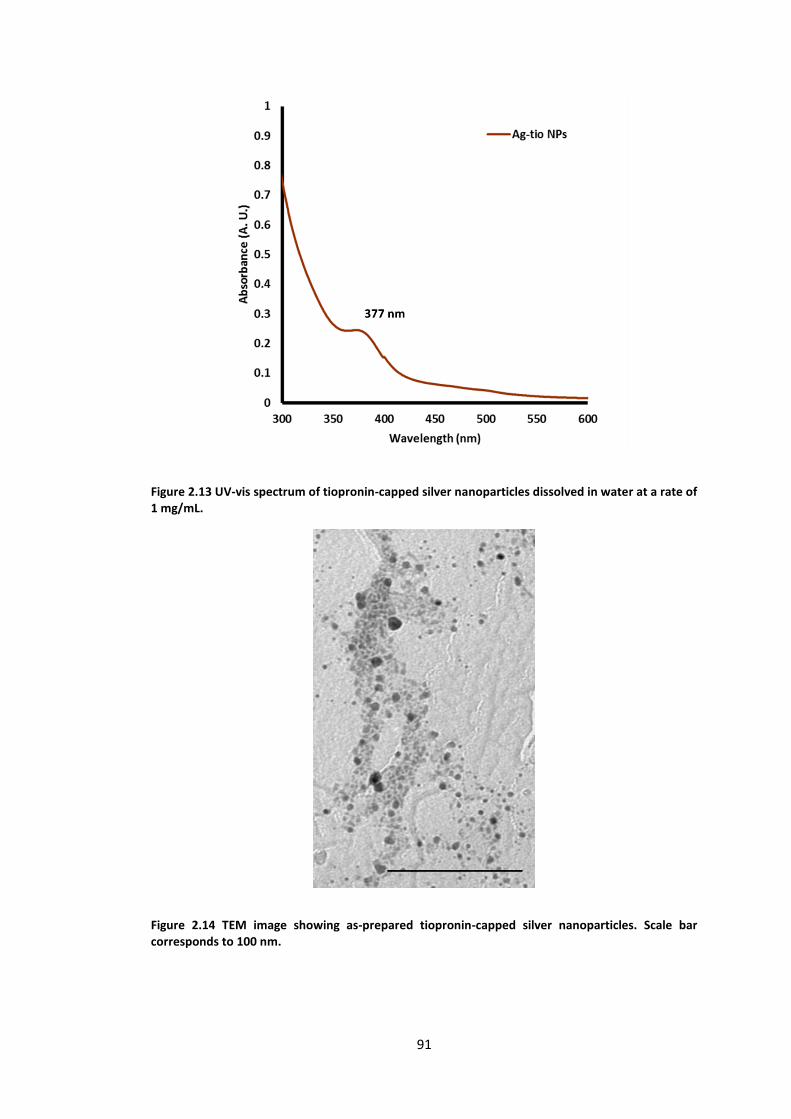
91
Figure 2.13 UV-vis spectrum of tiopronin-capped silver nanoparticles dissolved in water at a rate of 1 mg/mL.
Figure 2.14 TEM image showing as-prepared tiopronin-capped silver nanoparticles. Scale bar corresponds to 100 nm.
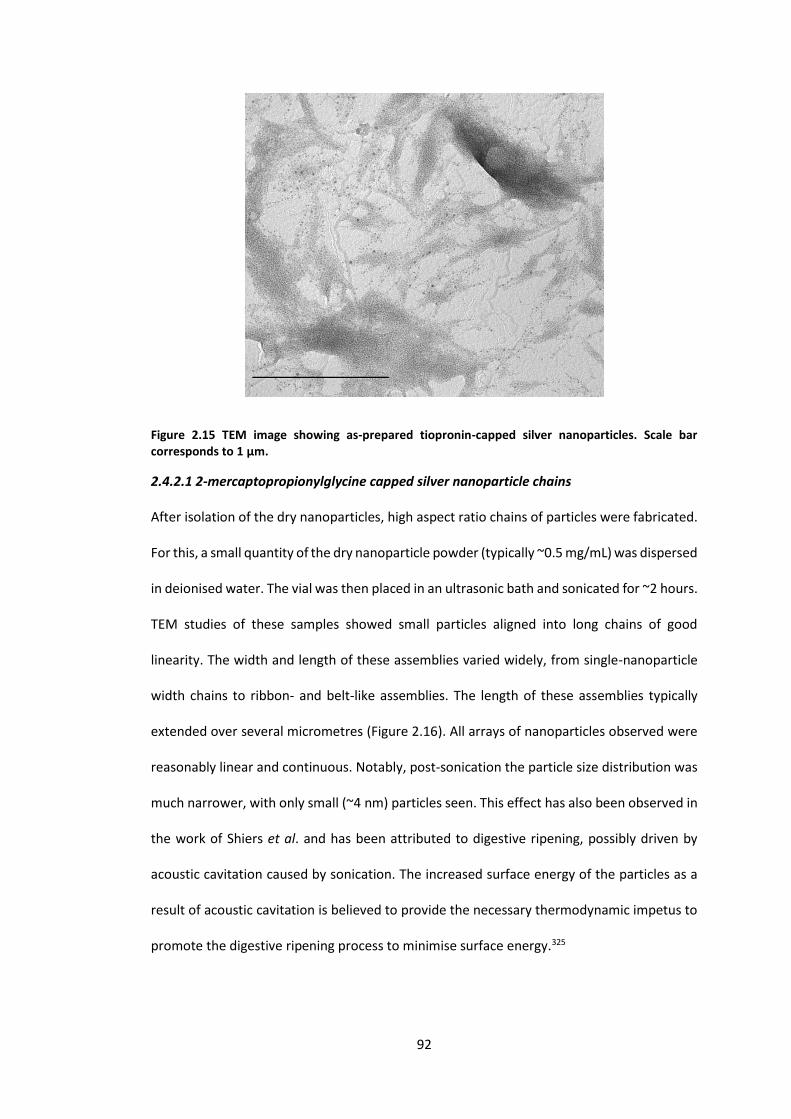
92
Figure 2.15 TEM image showing as-prepared tiopronin-capped silver nanoparticles. Scale bar corresponds to 1 µm.
2.4.2.1 2-mercaptopropionylglycine capped silver nanoparticle chains
After isolation of the dry nanoparticles, high aspect ratio chains of particles were fabricated.
For this, a small quantity of the dry nanoparticle powder (typically ~0.5 mg/mL) was dispersed
in deionised water. The vial was then placed in an ultrasonic bath and sonicated for ~2 hours.
TEM studies of these samples showed small particles aligned into long chains of good
linearity. The width and length of these assemblies varied widely, from single-nanoparticle
width chains to ribbon- and belt-like assemblies. The length of these assemblies typically
extended over several micrometres (Figure 2.16). All arrays of nanoparticles observed were
reasonably linear and continuous. Notably, post-sonication the particle size distribution was
much narrower, with only small (~4 nm) particles seen. This effect has also been observed in
the work of Shiers et al. and has been attributed to digestive ripening, possibly driven by
acoustic cavitation caused by sonication. The increased surface energy of the particles as a
result of acoustic cavitation is believed to provide the necessary thermodynamic impetus to
promote the digestive ripening process to minimise surface energy.325

93
Figure 2.16 TEM images showing linear arrays of tiopronin-capped silver particles formed as a result of sonication.
2.4.3 Synthesis of gold nanorods
Nanorods were successfully synthesised using a two-step seed and growth mechanism as
reported in literature. Though facile, the resultant colours of solutions of nanorods produced
by this method were not completely consistent indicating a sensitivity to minute changes in
reaction conditions. Solutions range from pale greyish blue to dark blue after overnight
incubation at 30 °C.
UV-vis studies of the gold nanorod solutions produced by this method showed samples with
a large, very broad absorption centred around 658 nm, corresponding to the longitudinal
plasmon (Figure 2.17). In literature, the longitudinal plasmon has been reported to be
affected by the aspect ratio of the rods. It has been shown that as aspect ratio increases from
~2 to 9 the maximum of the longitudinal plasmon increases from ~700 – 1250 nm.31 As the
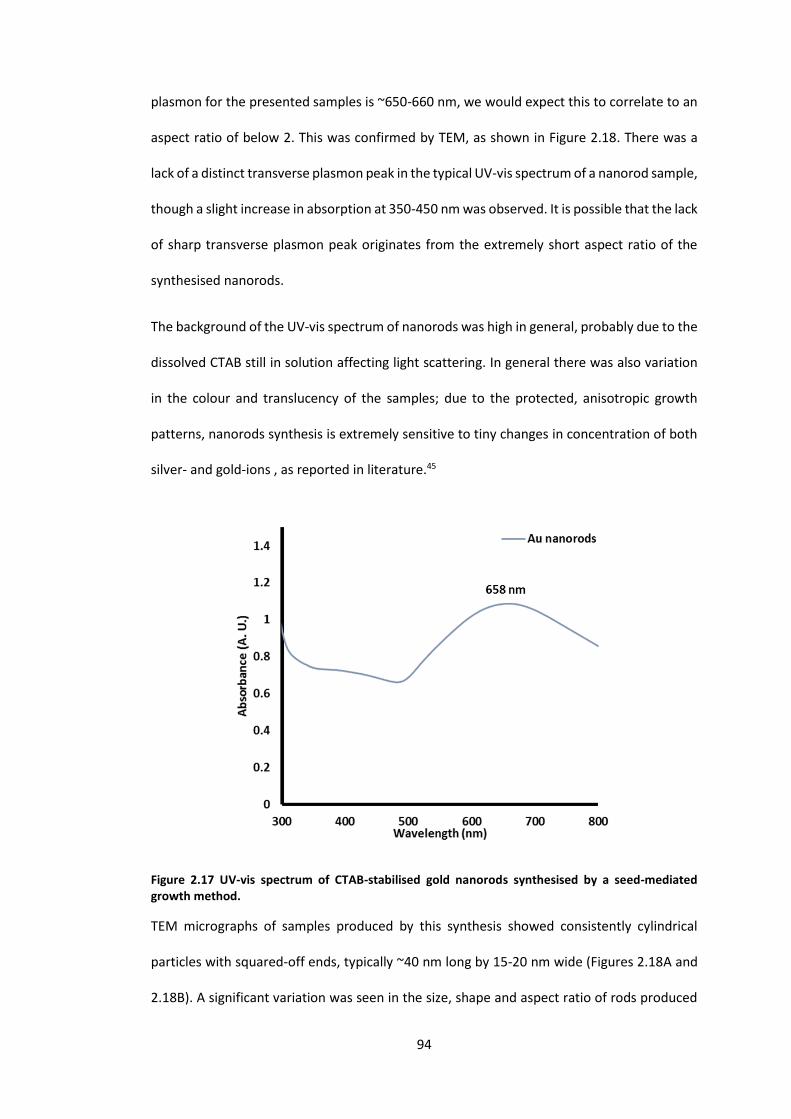
94
plasmon for the presented samples is ~650-660 nm, we would expect this to correlate to an
aspect ratio of below 2. This was confirmed by TEM, as shown in Figure 2.18. There was a
lack of a distinct transverse plasmon peak in the typical UV-vis spectrum of a nanorod sample,
though a slight increase in absorption at 350-450 nm was observed. It is possible that the lack
of sharp transverse plasmon peak originates from the extremely short aspect ratio of the
synthesised nanorods.
The background of the UV-vis spectrum of nanorods was high in general, probably due to the
dissolved CTAB still in solution affecting light scattering. In general there was also variation
in the colour and translucency of the samples; due to the protected, anisotropic growth
patterns, nanorods synthesis is extremely sensitive to tiny changes in concentration of both
silver- and gold-ions , as reported in literature.45
Figure 2.17 UV-vis spectrum of CTAB-stabilised gold nanorods synthesised by a seed-mediated growth method.
TEM micrographs of samples produced by this synthesis showed consistently cylindrical
particles with squared-off ends, typically ~40 nm long by 15-20 nm wide (Figures 2.18A and
2.18B). A significant variation was seen in the size, shape and aspect ratio of rods produced

95
by this method, even within the same sample, with some cubic particles observed as well as
longer, thinner rods with less well squared-off ends (Figure 2.18C). Despite some variation in
morphology particles were well-formed and of crystalline gold, as evidenced by observed
lattice planes at high magnification (Figure 2.18D). Average aspect ratio was found to be 1.9,
which agrees closely with the ratio expected by analysis of UV-vis spectra of the sample.
Why a variety of different aspect ratios was observed in the same samples is unclear.
According to literature the aspect ratio of seed-mediated nanorods grown in this manner is
control by the concentration of silver ions in the seed solution.31 Though consistency is hard
to achieve from batch to batch even with minute care, it would be expected that nanorods
within the same reaction sample should be comparable. Within the same sample (as
illustrated in Figure 2.18C) rods with aspect ratios ranging from 1 to 2.9 were observed. It is
possible that incubation without stirring resulted in small, localised fluctuations in
temperature or local concentration of seed/growth solutions and these tiny differences in
reaction condition in the immediate surroundings of a seed particle caused the observed
differences, though previously in literature this has not been reported to be the case.

96
Figure 2.18 TEM images of gold nanorods obtained by a seed and growth synthesis, showing A&B: gold nanorods; C: a variety of differently shaped particles within the same sample; D: lattice planes of crystalline gold within a rod.
2.4.4 Synthesis of branched gold nanocrystals
Branched gold nanocrystals were synthesised as described in Section 2.3.4. This synthesis
was found to be difficult to repeat with accuracy, as the method was strongly affected by tiny
changes in temperature, concentration and volume and would often fail. Solutions were
most often dark blue in colour. UV-vis studies on a typical solution show two absorptions,
one at ~550 nm in the visible range and another at 344 nm, just into the ultraviolet range
(Figure 2.16). This corresponds well with literature examples for branched gold nanocrystals:
the absorption in the visible range is the longitudinal plasmon and gives the solution its colour
(in this case blue/purple) and the absorption at the edge of the ultraviolet reason
corresponds to the transverse plasmon, present in elongated particles. It is well known both
theoretically and experimentally that anisotropic nanoparticles exhibit this characteristic
two-peak spectrum.31,201

97
Figure 2.19 UV-vis absorption spectrum of a solution of gold branched nanocrystals (AuBNCs)
TEM images of these samples show multi-branched crystals of roughly spherical overall shape
with diameters between 20-80 nm (Images shown in Figure 2.20). Particles were reasonably
monodisperse, occasionally being found in small clusters of 2-6. The crystals exhibited many
fine points and appeared rather urchin-like in shape. Though unusual in shape the particles
were crystalline gold, as evidenced by visible lattice planes under high magnification (Figure
2.20F). These urchin-like particles have been reported in literature before, though not using
the HEPES method.319,326 Previous studies have shown a large increase in light intensity
around the tips of the branches and consequent potential in SERS, so if these effects can be
replicated this represents an easy, quick and extremely mild method of fabricating branched
crystals for this use.

98
Figure 2.20 TEM images of branched gold nanocrystals produced by reduction of auric acid using a HEPES buffer.
2.5 Conclusions
A range of noble metal nanoparticles was successfully synthesised via a variety of methods.
Citrate-capped gold and silver particles were made using a well-known citrate reduction
method. Gold particles made by this method were found to be well-formed, spherical and
regular in size, with an average particle diameter of ~11 nm. Silver particles formed by this
method were somewhat larger (ranging from 5 – 40 nm) and possessed a diversity of
morphologies. Silver-gold particles of different molar ratios were also synthesised using the
citrate reduction method. All molar ratios of gold to silver showed distinct SPR bands, though
the position of this varied on each run. No relationship between molar ratio and position of
the SPR band was drawn.
Small, spherical silver particles capped with tiopronin with an average particle diameter of 6
nm were synthesised by a borohydride reduction. These were caused to self-arrange into

99
chains via sonication, forming very high aspect ratio arrays of good linearity. Particles in
chains were smaller and had a narrower size distribution (~4 nm average diameter, all
particles in the range of 3-5 nm) than in the as-prepared samples, a phenomenon attributed
to digestive ripening during ultrasonication treatment. CTAB-stabilised gold nanorods were
synthesised, though average aspect ratio was quite short (< 2). Nevertheless the rods showed
defined cylindrical shape and definite anisotropic growth patterns. Branched gold
nanocrystals were synthesised using a HEPES buffer solution as both reducing agent and
growth director, leading to samples that showed a distinct two-peak UV-vis spectrum and
multiple points in the TEM images.
The next section of this work took the successfully synthesised nanoparticles and titrated
them with a range of anionic and cationic dyes. Differences in behaviour between
nanoparticles of differing shapes and capping agents were seen, with new, novel dye-
nanoparticle combinations being observed to give enhanced absorption of the dye maxima.

100
CHAPTER 3 : THE INTERACTION OF CATIONIC AND ANIONIC DYES WITH GOLD AND SILVER
NANOPARTICLES 3.1 Aims
Noble metal nanoparticles not only show a wealth of unique properties, they have the ability
to affect the properties of molecules they are conjugated with. This chapter presents an
investigation of the behaviour of the range of noble metal nanoparticles synthesised in
Chapter 2 with both cationic and anionic dyes with the ultimate aim of utilising such
combinations for antimicrobial purposes. Titration of dyes against solutions of nanoparticles
was carried out to observe consequent changes to the UV-vis spectrum including red shift of
peaks, new peaks emerging and enhanced absorption of the dye; all of which indicate
interaction between the dye and the nanoparticle in question. Literature has shown that
conjugation of dyes with nanomaterials can create potent antimicrobial agents which can be
used for medical purposes, either in photodynamic therapy or as antimicrobial surfaces.
These applications, discussed in the following section, have potential to combat the rise of
antibiotic resistance in common pathogens.
Titration of citrate-stabilised gold nanoparticles with cationic dyes was found to interact
strongly, triggering aggregation of the particles and also exhibiting enhanced absorption of
crystal violet, toluidine blue and acridine orange. Enhanced absorption had not, to the best
of our knowledge, been reported for acridine orange before. Anionic dyes were not seen to
show the same behaviour. Citrate-capped silver nanoparticles, made by identical
methodology to their gold analogues, did not exhibit the same interaction with cationic dyes.
Citrate-stabilised bimetallic particles of different gold to silver molar ratios showed erratic
behaviour, possibly a consequence of the variation in size, shape and surface composition of
the particles synthesised by this method. Tiopronin-capped silver and branched gold
nanocrystals all showed no interaction with either class of dye. CTAB-stabilised gold

101
nanorods showed a small interaction with anionic naphthol green, though no enhanced
absorption was seen.
3.2 Motivations and an introduction to photodynamic therapy
The continuing explosion in the number of antibiotic resistant strains of bacteria is a major
concern for the scientific and medical communities.327 Rapidly increasing numbers of
infections caused by resistant strains of common bacteria such as Salmonella,228 E. coli,227 S.
aureus,278 C. difficile226 and M. tuberculosis328 amongst many others has produced a
desperate need for alternative treatments when established antibiotic therapies fail. As
previously stated, photodynamic therapy (PDT) has been widely studied as one such process
that could help to gain control over the epidemic of resistant pathogens.
PDT is a well-known technique which involves exciting a photosensitizer with a known
wavelength of light.329 The photosensitizer absorbs a photon of specific frequency and is
promoted to a high energy triplet state. This excited state transfers energy to molecular
oxygen to create singlet oxygen, a cytotoxic species which is highly reactive towards organic
compounds and can kill pro- and eukaryotic cells by destroying cell walls, membranes and
DNA.330 This mechanism is shown in Scheme 3.1.
Photodynamic therapy relies on an efficient photosensitizer, the molecule that is able to
absorb light. There is a wide variety of photosensitizers in use today, including
phthalocyanines, chlorophyll derivatives, porphyrins and associated macrocycles and dyes.241
The dyes from the thiazine family are also used as photosensitizers and include methylene
blue, azures A, B and C, toluidine blue and thionin. There have already been many studies
which confirm the thiazines’ ability to act as photosensitizers in PDT.242–244 Within this work
we use a range of dyes (a list of which can be found below in Table 3.1) from the thiazine
family and other groups.

102
Scheme 3.1 Illustration showing the mechanism of photodynamic therapy.
3.2.1 Combination of photosensitizers with nanoparticles
The efficacy of photodynamic therapy has been shown to be increased upon conjugation with
a nanoparticle or nanostructured material.298,309 Studies on the toluidine blue-induced lethal
photosensitization of Staphylococcus aureus showed that conjugation of the dye molecule
with a gold nanoparticle increased the kill rate by an order of magnitude.282 The same system
exhibited enhanced absorption of the toluidine blue maximum absorption in the UV-vis
spectrum when combined with gold nanoparticles. The increased photosensitizing capacity
of the dye when combined with nanoparticles is potentially very exciting for clinical
applications.
It is possible that dyes other than toluidine blue possess this ability and would behave
similarly under UV-vis studies, thus this work tests a range of dyes (a list of which is given in
Table 3.2) with citrate-capped gold nanoparticles to assess any analogous behaviour. The
selected range of dyes was also tested with both citrate-capped- and tiopronin-capped silver
nanoparticles to see how different nanoparticle composition affects these behaviours.
Citrate-capped gold-silver hybrid particles were also synthesised and tested, in addition to
branched gold nanocrystals synthesised using a seedless, surfactantless method and CTAB-

103
stabilised seed-mediated gold nanorods. All particles were tested with cationic and anionic
dyes. The results of these investigations are reported below.
3.3 Experimental methods
3.3.1 Modified Turkevich synthesis of gold and silver nanoparticles
Stock solutions were made up as in Section 2.3.1.
3.3.1.1 Synthesis of citrate-stabilised gold nanoparticles
Citrate-stabilised gold particles were synthesised as described in Section 2.3.1.1. Cooled
nanoparticle solutions were used in titration experiments as described in Section 3.3.5.
3.3.1.2 Synthesis of citrate-stabilised silver nanoparticles
Citrate-stabilised silver particles were synthesised as described in Section 2.3.1.2. Cooled
nanoparticle solutions were used in titration experiments as described in Section 3.3.5.
3.3.1.3 Synthesis of citrate-stabilised silver-gold nanoparticles
Citrate-stabilised silver-gold particles were synthesised as described in Section 2.3.1.3.
Cooled nanoparticle solutions were used in titration experiments as described in Section
3.3.5.
3.3.2 Synthesis of 2-mercaptopropionylglycine-capped silver nanoparticles
2-mercaptopropionylglycine-capped silver nanoparticles were synthesised as described in
Section 2.3.2.1.
3.3.2.1 Synthesis of high-aspect ratio 2-mercaptopropionylglycine-capped silver
nanoparticle chains
2-mercaptopropionylglycine-capped silver nanoparticle chains were fabricated as described
in Section 2.3.2.2. These solutions were used in the titration experiments outlined in Section
3.3.5.

104
3.3.3 Synthesis of gold nanorods
CTAB-stabilised gold nanorods were synthesised using the methods outlined in Section 2.3.3.
The resultant solutions were used in titration experiments described in Section 3.3.5.
3.3.4 Synthesis of branched gold nanocrystals
Branched gold nanocrystals were synthesised by the methods described in Section 2.3.4. The
resultant solutions were used in the titration experiments as described in Section 3.3.5
below.
3.3.5 Titration experiments
Firstly, solutions of dyes were made by dissolving a known mass of the solid dye in deionised
water. The full list of dyes used in these experiments, their respective concentrations and
structures are shown in Table 3.1.
UV-vis spectra of nanoparticle solutions and dye solutions were obtained separately. For
each dye to be studied, 16 mL of nanoparticle solution was used. 1 mL dye was added to the
nanoparticle solution and stirred. A cuvette was filled and the UV-vis spectrum of this mixture
was obtained. The sample solution was returned to the original mixture and a further 1 mL
of dye was added. The UV-vis sample of this mixture was recorded. This process was repeated
15 times until 15 mL of dye solution total had been added to the nanoparticle solution.
This titration experiment was repeated for each dye.
Table 3.1 Dyes used in the titration experiments, their structures and concentrations.
Dye Structure Concentration (µM)
Cationic dyes
Toluidine blue O
5

105
Malachite green
20
Rhodamine 6G
20
Crystal violet
5
Acridine Orange
20
Anionic dyes
Rose bengal
20
Naphthol green B
20
106
2’,7’-Dichlorofluorescein
20
3.3.6 UV-vis absorption measurements
UV-vis absorption spectra were recorded using a Shimadzu UV-1800 Spectrophotometer.
Plastic cuvettes with a light path length of 10 mm were used. Absorption was measured over
the spectral range 200 – 1000 nm.
3.3.7 Particle size measurements
The size of nanoparticles which showed interaction with dyes in the UV-vis was monitored
before, during and after the titration experiments using the following two techniques.
3.3.7.1 Zetasizer measurements
The hydrodynamic radius of the particles was measured using photon correlation
spectroscopy on a Zetasizer 3000 (Malvern, UK). Experiments were carried out at 25 °C using
plastic cuvettes with a path length of 10 mm.
3.3.7.2 TEM
A Jeol 200 kV TEM was used to measure the size of nanoparticles before and during the
titration experiments. Samples of the particles without dyes were prepared by evaporating
drops of the nanoparticle solution onto carbon coated copper grids. Further samples were
prepared at points through the titration procedure so the physical effect of increasing dye
concentration could be seen and compared to the nanoparticle-only specimens.

107
3.4 Results and discussion
3.4.1 UV-vis studies
3.4.1.1 Citrate-stabilised gold nanoparticles with cationic dyes
During titration experiments with citrate-capped gold nanoparticles all the cationic dyes
studied (see Table 3.1) showed formation of a new peak in the UV-vis absorption spectra at
approximately 630-690 nm. This peak (separate to that of the dye or nanoparticle solution)
was typically found at a large red shift thus was indicative of the aggregation of the
nanoparticles into large agglomerates. This assertion was confirmed using TEM and Zetasizer
studies to observe changes in particle size, as discussed in Section 3.4.2. The effect was more
pronounced for certain cationic dyes. The UV-vis absorption spectrum of the titration of
malachite green with gold particles showed only a small shoulder at 685 nm (Figure 3.1). It is
proposed that some of the ‘new’ absorption presented at 685 nm could be being masked by
the absorption peak corresponding to the dye solution alone, which is found at 617 nm for
malachite green. TEM analysis for this sample (Figure 3.51) revealed limited aggregation
however, explaining the lack of intensity observed in the agglomeration peak.
Figure 3.1 UV-vis absorption spectra of malachite green in a solution of gold nanoparticles. ‘Dye’ corresponds to the absorption spectrum of 20 µM malachite green dye on its own; ‘Au NPs’ to the absorption spectrum of 5 mM gold nanoparticle solution only. ‘1 mL’ corresponds to the absorption spectrum of 1 mL 20 µM malachite green in 16 mL 5 mM gold nanoparticle solution. 2 mL

108
corresponds to the absorption spectrum of 2 mL malachite green in 16 mL nanoparticle solution etc. Shoulder indicative of aggregation is indicated by the black arrow.
Rhodamine 6G titrated with gold nanoparticle showed a very distinct peak forming at 640
nm, indicating aggregation in a similar manner (Figure 3.2). The dye maximum for rhodamine
is located at 527 nm, thus a much clearer and more distinct peak is seen in the absorption
spectrum when the aggregation peak emerges. The aggregation peak reached maximum
intensity after 6 mL of rhodamine had been added to the nanoparticle solution. Increasing
dye concentration further with additional aliquots of rhodamine up to 15 mL resulted in a
decrease in the absorption maxima of the aggregation peak accompanied by slight red shift,
indicating further nominal aggregation.
Figure 3.2 UV-vis absorption spectra of rhodamine 6G in a solution of gold nanoparticles. ‘Dye’ corresponds to the absorption spectrum of 20 µM rhodamine dye on its own; ‘Au NPs’ to the absorption spectrum of 5 mM gold nanoparticle solution only. ‘1 mL’ corresponds to the absorption spectrum of 1 mL 20 µM rhodamine in 16 mL 5 mM gold nanoparticle solution. 2 mL corresponds to the absorption spectrum of 2 mL rhodamine in 16 mL nanoparticle solution etc. The peak that forms as nanoparticles aggregate is indicated by a black arrow.
The three remaining cationic dyes in this study – toluidine blue, crystal violet and acridine
orange - show similar features in the UV-vis studies of their titrations with gold nanoparticles.
Additionally they show an enhanced absorption in the aggregation peak; that is, an
absorption above the intensity of the dye peak alone.

109
The absorption spectra of toluidine blue and gold nanoparticles show enhanced absorption
at a critical concentration, as reported in the literature (Figure 3.3).43,331 Dilution of the
absorption peak corresponding to gold nanoparticles (SPR band at approx. 510 nm) was
observed as expected, due to the decreasing overall concentration of gold nanoparticles in
the solution as total volume increases (shown by the dotted grey arrow in Figure 3.3).
Alongside this, enhancement of the absorption at 630 nm was observed. Maximum
enhancement was seen after 6 mL of toluidine blue had been added, corresponding to a dye
concentration of 1.36 µM in the reaction mixture. Each aliquot of dye added subsequently
resulted in a decrease of the intensity of the aggregation absorption peak with slight red shift,
indicating further minimal agglomeration.
Figure 3.3 UV-vis absorption spectra of toluidine blue in a solution of gold nanoparticles. ‘Dye’ corresponds to the absorption spectrum of 5 µM toluidine blue dye on its own; ‘Au NPs’ to the absorption spectrum of 5 mM gold nanoparticle solution only. ‘1 mL’ corresponds to the absorption spectrum of 1 mL 5 µM toluidine blue in 16 mL 5 mM gold nanoparticle solution. 2 mL corresponds to the absorption spectrum of 2 mL toluidine blue in 16 mL nanoparticles, etc. Black arrow indicates maximum enhancement of the absorption after 6 mL of toluidine blue had been added. Dotted grey arrow indicates decrease in absorbance of the nanoparticle peak as a function of dilution; dashed grey line shows the increase in absorbance of the dye from the start of the experiment to the enhanced absorption observed at 6 mL dye added. Solid grey arrow shows the decrease in intensity and slight red shift of the aggregation peak as further aliquots of toluidine blue after 6 mL are added.
The concentrations of toluidine blue and gold nanoparticles at the point where maximum
dye absorption enhancement was observed were calculated to be 1.36 µM and 3.63 mM
respectively. Solutions of these concentrations were made up and the UV-vis spectra taken

110
separately. The two curves (1.36 µM toluidine blue and 3.63 mM gold nanoparticles) were
then mathematically combined, giving the absorption curve that could be expected if the two
solutions were to show zero interaction with each other. The UV-vis spectrum from the
titration experiment with corresponding concentration showing enhanced absortion was
plotted on the same axes to give a comparison. This study is shown in Figure 3.4. It is clearly
seen that the maximum absorption of the calculated UV-vis spectrum of the mixed
nanoparticle-dye solution (green line) is far lower than the experimentally observed curve
for a solution of identical concentration (purple line); the former being 0.23 A. U. and the
latter 0.74 A. U. This roughly three-fold increase in maximum absorption is the largest
recorded in this data set. It is also clear that the calculated spectrum is a strikingly different
shape to the experimentally observed curve: the experimental spectrum clearly exhibits
decreased intensity at 520 nm due to consumption of the initial gold nanoparticles to form
aggregates.
Figure 3.4 Graph comparing the UV-vis absorption spectra of toluidine blue at 1.36 µM (blue line), gold nanoparticle solution at 3.63 mM (red line), the spectra of toluidine blue (1.36 µM) and gold nanoparticle solution (3.63 mM) added together to give a mathematical estimate of the absorption spectrum that could be expected if there were no electronic interaction between toluidine blue and the gold particles (green line), and finally the enhanced absorption of toluidine observed experimentally (purple line).
Analogous results were obtained during the titration experiment between gold nanoparticles
and crystal violet (Figure 3.5). As the concentration of crystal violet in the solution was

111
increased an aggregation peak began to develop at approximately 680-700 nm, as opposed
to the dye-only absorption maximum at 590 nm. Maximum enhanced absortion was
recorded after 7 mL of crystal violet had been added to the gold nanoparticle solution,
corresponding to a dye concentration of 1.52 µM. Further additions of dye after this point
caused a decrease in the absorption at 680 nm along with further slight red shift to ~700 nm,
as seen in the toludine blue-gold nanoparticle titration.
Figure 3.5 UV-vis absorption spectra of crystal violet in a solution of gold nanoparticles. Maximum enhancement of the absorption after 7 mL crystal violet had been added is indicated by a black arrow. Grey dotted arrow shows the decrease in absorption of the nanoparticles as a function of dilution; dashed grey arrow shows the increase in absorption of the dye from the start of the experiment to the enhanced absorption observed at 7 mL dye added. Solid grey arrow shows the decrease in intensity and slight red shift of the aggregation peak as further aliquots of crystal violet after 7 mL are added.
The concentrations of crystal violet and gold nanoparticles at the point where maximum dye
absorption enhancement was observed were calculated to be 1.52 µM and 3.48 mM
respectively. As with the toluidine blue – gold nanoparticle experiment, solutions of these
concentrations were made up and the UV-vis spectra taken separately. The two curves were
then mathematically combined to give the absorption curve that could be expected if the
two solutions were to show zero interaction with each other. The UV-vis spectrum from the

112
crystal violet-gold nanoparticle titration experiment with corresponding concentration
showing enhanced absortion was plotted on the same axes. This study is shown in Figure 3.6.
Again, it is obvious that the calculated spectrum (green) differs greatly from the
experimentally observed curve (purple): the calculated absorption spectrum shows no
aggregation peak at longer wavelengths, indicating a definite interaction between the
nanoparticles and dye molecules.
Figure 3.6 Graph comparing the UV-vis absorption spectra of crystal violet at 1.52 µM (blue line), gold nanoparticle solution at 3.48 mM (red line), the spectra of crystal violet (1.52 µM) and gold nanoparticle solution (3.48 mM) added together to give a mathematical estimate of the absorption spectrum that could be expected if there were no electronic interaction between crystal violet and the gold particles (green line), and finally the enhanced absorption of crystal violet observed experimentally (purple line).
Similar results were obtained when the titration was carried out between gold nanoparticles
and acridine orange, though the enhanced absorption observed was much less pronounced
(Figure 3.7). An aggregation peak was seen to form at 630 nm (indicated by the black arrow).
Maximum enhancement was observed after 3 mL of 20 mM acridine orange had been added
to the nanoparticle solution, corresponding to a dye concentration of 3.75 µM in the reaction
mixture. Further addition of dye caused the expected decrease in absorption of the
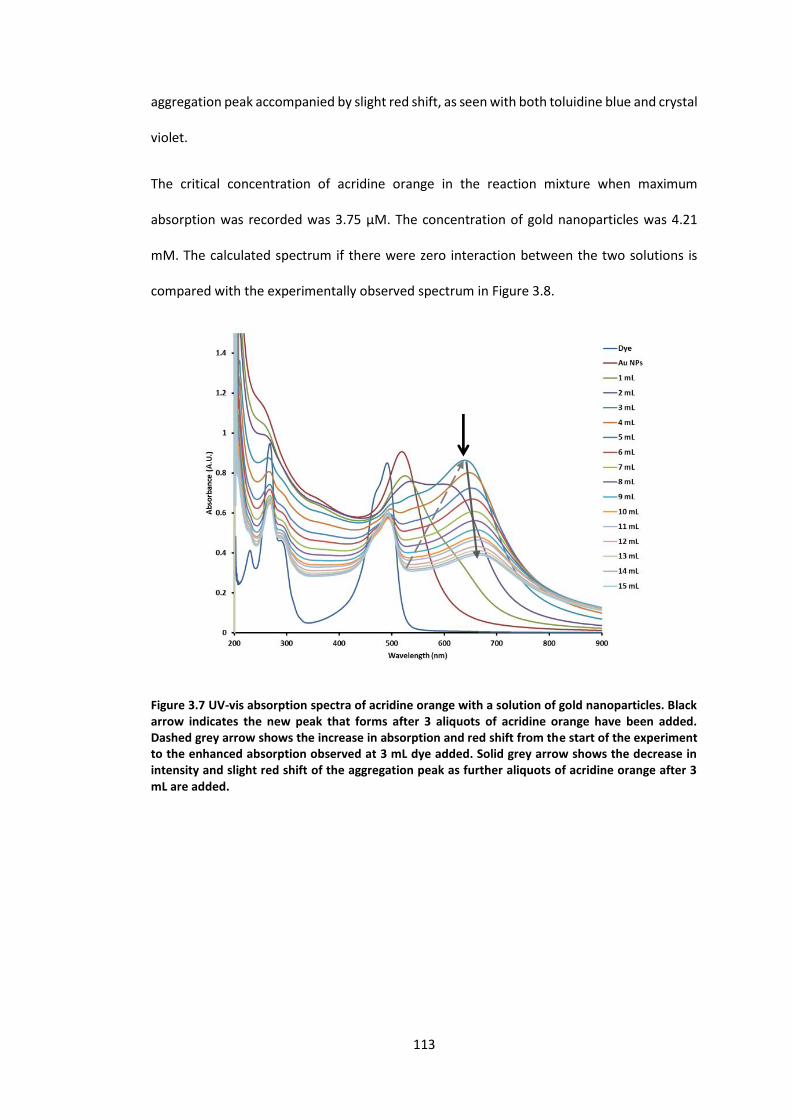
113
aggregation peak accompanied by slight red shift, as seen with both toluidine blue and crystal
violet.
The critical concentration of acridine orange in the reaction mixture when maximum
absorption was recorded was 3.75 µM. The concentration of gold nanoparticles was 4.21
mM. The calculated spectrum if there were zero interaction between the two solutions is
compared with the experimentally observed spectrum in Figure 3.8.
Figure 3.7 UV-vis absorption spectra of acridine orange with a solution of gold nanoparticles. Black arrow indicates the new peak that forms after 3 aliquots of acridine orange have been added. Dashed grey arrow shows the increase in absorption and red shift from the start of the experiment to the enhanced absorption observed at 3 mL dye added. Solid grey arrow shows the decrease in intensity and slight red shift of the aggregation peak as further aliquots of acridine orange after 3 mL are added.
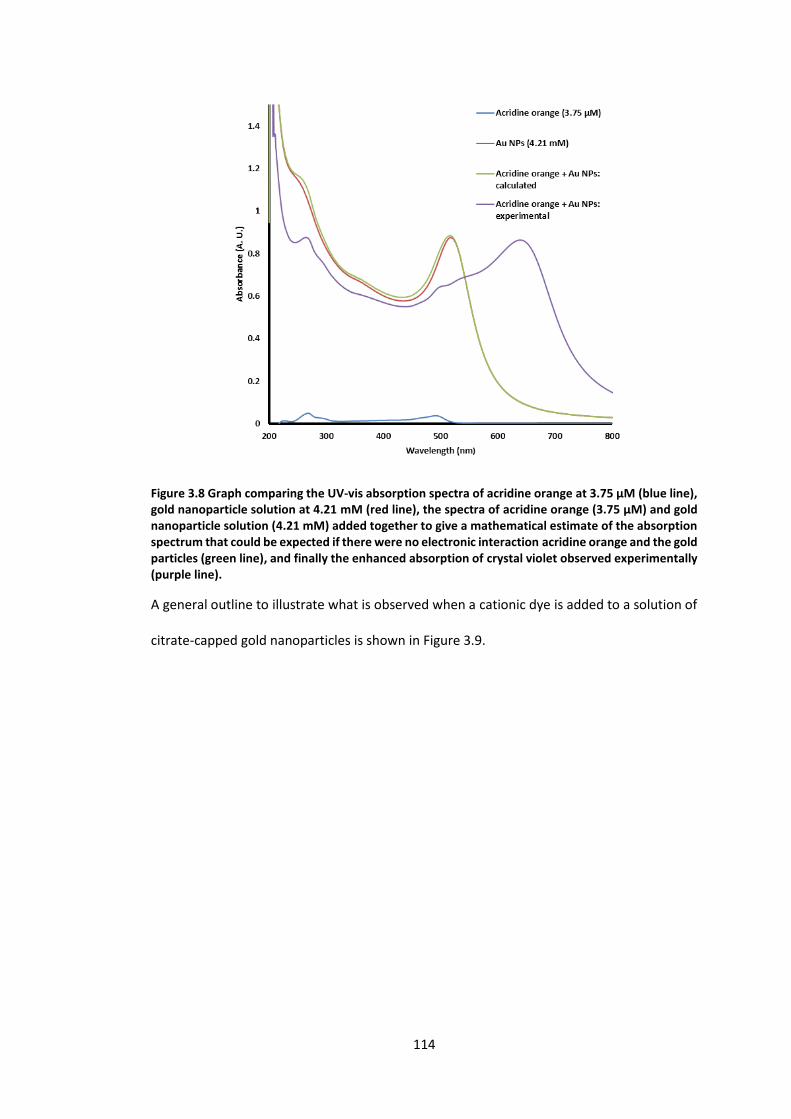
114
Figure 3.8 Graph comparing the UV-vis absorption spectra of acridine orange at 3.75 µM (blue line), gold nanoparticle solution at 4.21 mM (red line), the spectra of acridine orange (3.75 µM) and gold nanoparticle solution (4.21 mM) added together to give a mathematical estimate of the absorption spectrum that could be expected if there were no electronic interaction acridine orange and the gold particles (green line), and finally the enhanced absorption of crystal violet observed experimentally (purple line).
A general outline to illustrate what is observed when a cationic dye is added to a solution of
citrate-capped gold nanoparticles is shown in Figure 3.9.
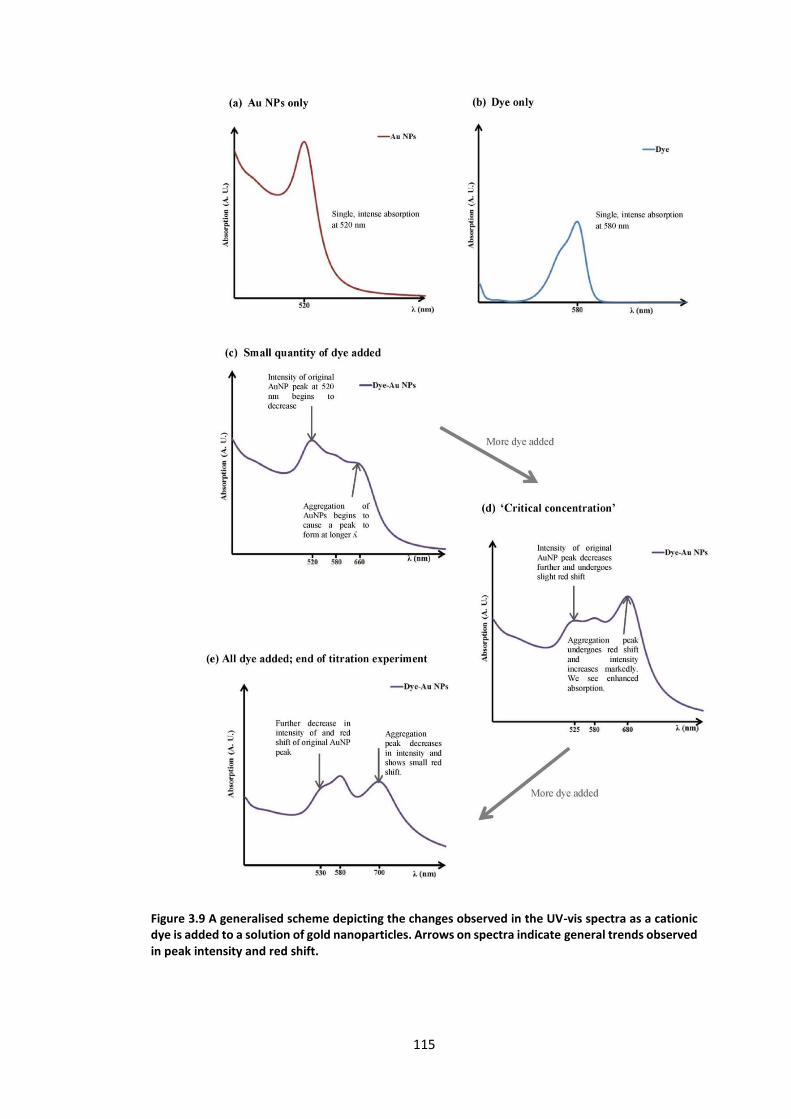
115
Figure 3.9 A generalised scheme depicting the changes observed in the UV-vis spectra as a cationic dye is added to a solution of gold nanoparticles. Arrows on spectra indicate general trends observed in peak intensity and red shift.

116
In the case of toluidine blue and crystal violet the dye absorption maxima lie close to the
aggregation peak. The maximum absorbance for toluidine blue alone is found at 630 nm
which perfectly overlaps the aggregation peak that forms. In this case then we do not see a
‘new’ peak forming in the UV-vis, merely an enhancement of the dye absorption. Similarly,
crystal violet’s maximum absorption is located at 578 nm, close to the aggregation peak at
685 nm. In this case we do see the aggregation peak emerge separately as it is not masked
by the dye absorption, but the two lie sufficiently close that the aggregation peak ‘borrows’
some intensity from the dye peak to produce the enhanced absorption we observe.
3.4.1.2 Citrate-stabilised gold nanoparticles with anionic dyes
Spectra with no enhancement of absorption and no interaction between the dye molecules
and gold nanoparticles were observed for all the anionic dyes used in this work: rose bengal
(Figure 3.10), naphthol green (Figure 3.11) and 2,7-dichlorofluorescein (Figure 3.12). All three
spectra showed the increase in the intensity of the dye absorption as it becomes more
concentrated in the titration mixture and the expected decrease in intensity of the
nanoparticle peak as the titration experiment progresses as a function of dilution. None
showed red-shifted peaks forming at longer wavelengths that would indicate aggregation of
the particles, nor did they show any enhancement of the dye absorption. The spectra of gold
nanoparticles with rose bengal and naphthol green show clear isosbestic points (a
wavelength at which the absorption of light by a mixed solution remains constant as the
equilibrium between the components in the solution changes), which are indicative of zero
electronic interaction between the particle and the dye molecules.

117
Figure 3.10 UV-vis absorption spectra of rose bengal with a solution of gold nanoparticles. Isosbestic points are indicated by black arrows.
Figure 3.11 UV-vis absorption spectra of naphthol green with a solution of gold nanoparticles. Isosbestic points are indicated by black arrows.
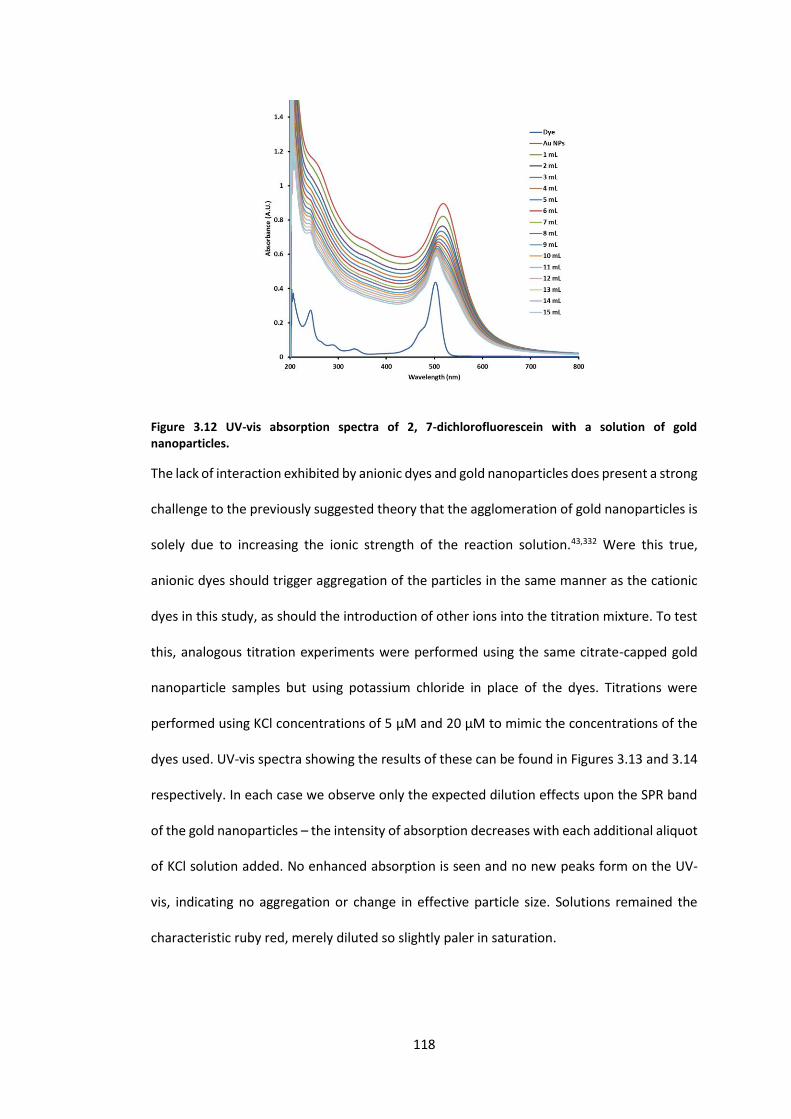
118
Figure 3.12 UV-vis absorption spectra of 2, 7-dichlorofluorescein with a solution of gold nanoparticles.
The lack of interaction exhibited by anionic dyes and gold nanoparticles does present a strong
challenge to the previously suggested theory that the agglomeration of gold nanoparticles is
solely due to increasing the ionic strength of the reaction solution.43,332 Were this true,
anionic dyes should trigger aggregation of the particles in the same manner as the cationic
dyes in this study, as should the introduction of other ions into the titration mixture. To test
this, analogous titration experiments were performed using the same citrate-capped gold
nanoparticle samples but using potassium chloride in place of the dyes. Titrations were
performed using KCl concentrations of 5 µM and 20 µM to mimic the concentrations of the
dyes used. UV-vis spectra showing the results of these can be found in Figures 3.13 and 3.14
respectively. In each case we observe only the expected dilution effects upon the SPR band
of the gold nanoparticles – the intensity of absorption decreases with each additional aliquot
of KCl solution added. No enhanced absorption is seen and no new peaks form on the UV-
vis, indicating no aggregation or change in effective particle size. Solutions remained the
characteristic ruby red, merely diluted so slightly paler in saturation.
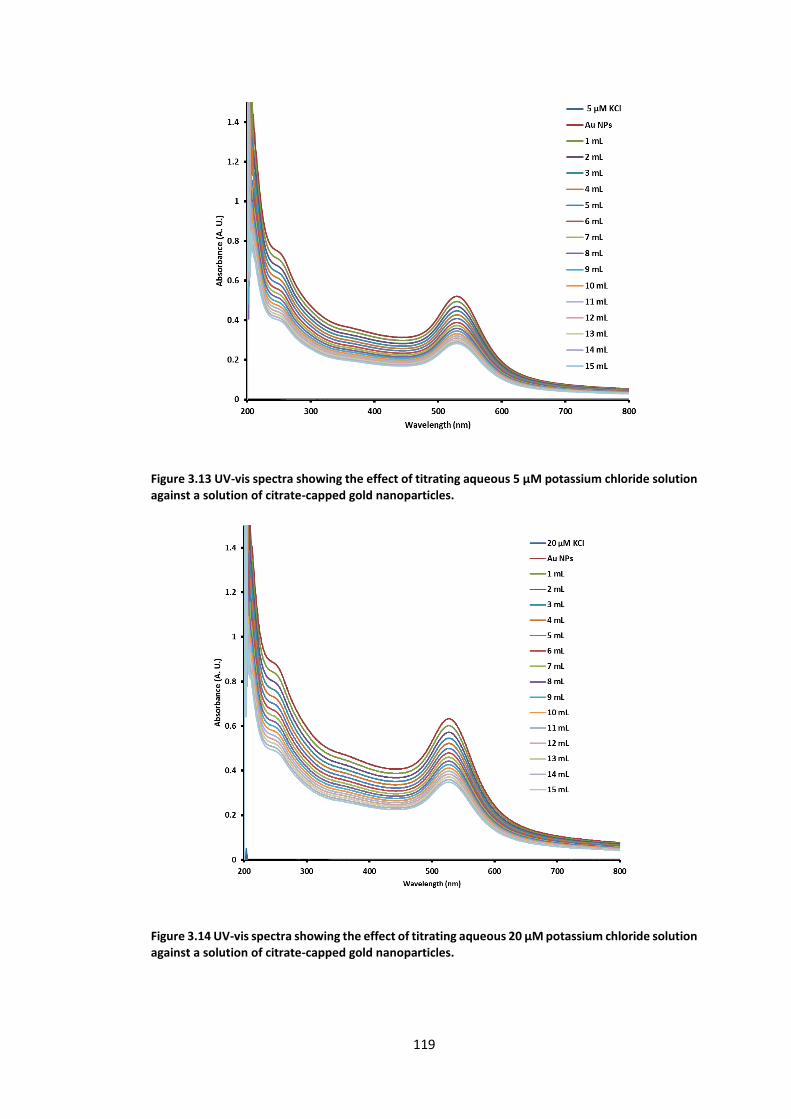
119
Figure 3.13 UV-vis spectra showing the effect of titrating aqueous 5 µM potassium chloride solution against a solution of citrate-capped gold nanoparticles.
Figure 3.14 UV-vis spectra showing the effect of titrating aqueous 20 µM potassium chloride solution against a solution of citrate-capped gold nanoparticles.

120
It is therefore clear that the charge on the dye molecules and consequently the way they
interact with the surface of the nanoparticle or the citrate shell is important. It is suggested
that the electrostatic repulsion between the anionic dyes and the negatively charged citrate
capping ligands prevents them coming close enough to form aggregates. The positively
charged cationic dyes would, however, be attracted to the net-negative citrate shell and
undergo ligand exchange, allowing coordination with the surface of the gold. From this
position there is the potential for the dye molecules to act as linker molecules (a well-
documented phenomenon; see Section 1.2.1.2.3) and to chelate numerous nanoparticles,
driving the formation of the large aggregates that were observed.
3.4.1.3 Citrate-stabilised silver nanoparticles with anionic dyes
Titration of the three anionic dyes with silver nanoparticles also showed no electronic
interaction with well-formed isosbestic points being observed. The spectra of naphthol
green, rose bengal and 2, 7-dichlorofluorescein with silver nanoparticles are shown below
(Figures 3.15, 3.16 and 3.17 respectively).
Figure 3.15 Naphthol green and silver nanoparticles. Isosbestic points indicated by black arrows.
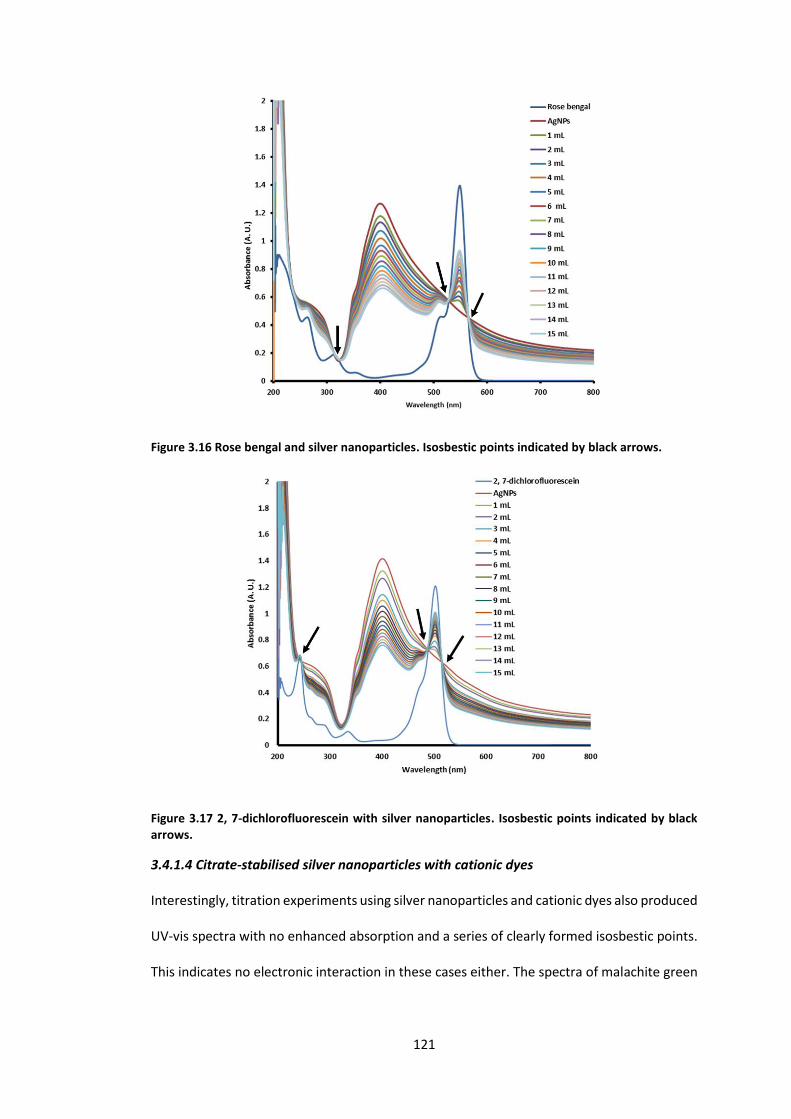
121
Figure 3.16 Rose bengal and silver nanoparticles. Isosbestic points indicated by black arrows.
Figure 3.17 2, 7-dichlorofluorescein with silver nanoparticles. Isosbestic points indicated by black arrows.
3.4.1.4 Citrate-stabilised silver nanoparticles with cationic dyes
Interestingly, titration experiments using silver nanoparticles and cationic dyes also produced
UV-vis spectra with no enhanced absorption and a series of clearly formed isosbestic points.
This indicates no electronic interaction in these cases either. The spectra of malachite green

122
(Figure 3.18), rhodamine 6G (Figure 3.19), toluidine blue (Figure 3.20), crystal violet (Figure
3.21) and acridine orange (Figure 3.22) are shown.
Figure 3.18 UV-vis absorption spectra of malachite green with a solution of silver nanoparticles. Isosbestic points shown by black arrows.
Figure 3.19 UV-vis absorption spectra of rhodamine 6G with a solution of silver nanoparticles. Isosbestic points indicated by black arrows.

123
Figure 3.20 UV-vis absorption spectra of toluidine blue with a solution of silver nanoparticles
Figure 3.21 UV-vis absorption spectra of crystal violet with a solution of silver nanoparticles. Isosbestic points indicated by black arrows.

124
Figure 3.22 UV-vis absorption spectra of acridine orange with a solution of silver nanoparticles
It is unclear why enhanced absorption coupled with aggregation was observed only when
cationic dyes were titrated with gold nanoparticles. The method used to synthesis both the
silver and gold particles results in a nanoparticle with positive surface charge stabilised by
citrate ions, creating a negatively charged capping shell. Theoretically then the two particles
should behave analogously when titrated with the same dyes.
Although not proven at present, it is thought that the dyes used interact with the surface of
the nanoparticle through the amine group (all cationic dyes used in this work have an amine
group in common; see Table 3.2 for structures). Amine groups have been shown to be
aurophilic.333,334 Amines will also complex with silver, though their affinity for silver is
comparatively weaker than for gold. Thus, silver-amine complexes are less stable than gold-
amine complexes.335 The capping citrate ions coordinate to the metal through oxygen atoms.
Gold-oxygen bonds are weaker (223 kJ mol-1) than silver-oxygen analogues (238 kJ mol-1),336
therefore it is probable that the stronger Ag-O interaction cannot be overcome by the weaker
affinity of amines for silver, whereas the gold particles will prefentially bind amine-containing

125
dyes over oxygen-containing citrate. This allows ligand exchange to occur for dyes and gold
particles, where the relative stability of the gold-citrate complexes is lower, but not for the
same dyes and silver particles.
In the case of toluidine blue it is possible that the dye is coordinating through a sulphur atom,
as sulphur is well-known to be exceptionally aurophilic.337,338 This could explain the large
enhancement seen in the UV-vis spectrum of gold-toluidine blue. However sulphur has also
been shown to be argentophilic,339 so why there is a failure of toluidine blue to react with the
silver particles is unclear. Regardless of coordinating atom it has not been established
whether the interaction between the dyes and the nanoparticle surface is covalent or
electrostatic. It is possible that a slightly lower surface charge on the silver nanoparticles or
partial surface oxidation could alter their behaviour towards the cationic dyes compared to
their gold analogues. Further work would help to clarify the mechanisms driving this. Density
functional theory (DFT) calcuations could potentially be used to map the electron density of
the system and elucidate the nature of the bonding, though this would be the subject of
future work.
3.4.1.5 Citrate-stabilised silver-gold nanoparticles with cationic and anionic dyes
3.4.1.5.1 1:3 Au:Ag nanoparticles
Titration of silver-gold alloy particles with cationic dyes gave inconsistent results. As reported
in the previous chapter consistency in colour (and therefore size and shape) was impossible
to achieve. As such, titration of the nanoparticles consisting of different ratios of gold to silver
with cationic dyes gave varied results as exemplified briefly below.
Titration of gold-silver particles with a ratio of 1:3 Au:Ag with toluidine blue showed no
interaction (Figure 3.23). Dilution of the nanoparticle peak at 526 nm was observed as the
total volume of the dye/nanoparticle solution increased, as expected. No further features of
interest were present on the spectrum. Titration of particles using the same molar ratio of

126
gold to silver with crystal violet, however, showed a distinct aggregation peak which formed
at longer wavelengths (670-680 nm, a red shift of ~140 nm), reaching its maximum after 14
aliquots of crystal violet had been added to the nanoparticle solution (Figure 3.24). This is
attributed to aggregation, as in the case of the citrate-stabilised gold nanoparticles with
cationic dyes in Section 3.4.1.1. It is unclear why these particles interacted with crystal violet
but not toluidine blue, though it is postulated that the differences in SPR observed for
particles of the same molar ratio in the previous chapter (Section 2.4.1.3) is due to core-shell
structures of silver- or gold-rich alloys forming. If this is the case, it is possible that the
samples titrated with crystal violet simply had a shell which was richer in gold (which is known
to interact with crystal violet, as shown above) than the sample which was titrated with
toluidine blue, causing the observed differences.
Titration of these particles with anionic naphthol green (Figure 3.25) showed expected
dilution effects as the titration progressed up to 10 aliquots of dyes added, after which the
measured intensity fluctuated rather than decreasing steadily with each additional portion
of dye added. No red shift was observed and no additional peaks were seen on the spectrum.
In this case it is to be expected that the surface presence of silver- or gold-rich alloys would
make no difference, as anionic naphthol green interacted with neither type of metal.

127
Figure 3.23 UV-vis spectra showing the titration of 5 mM toluidine blue with a solution of citrate stabilised silver-gold nanoparticles made using a gold to silver ratio of 1:3.
Figure 3.24 UV-vis spectra showing the titration of 5 mM crystal violet with a solution of citrate stabilised silver-gold nanoparticles made using a gold to silver ratio of 1:3. A second peak was seen to develop at ~680 nm as the titration progressed.

128
Figure 3.25 UV-vis spectra showing the titration of 20 µM naphthol green with a solution of citrate stabilised silver-gold nanoparticles made using a gold to silver ratio of 1:3
3.4.1.5.2 1:1 Au:Ag nanoparticles
Titration of silver-gold particles synthesised using a 1:1 molar ratio of gold to silver with
toluidine blue again produced no interaction; the only noteworthy feature on the UV-vis
spectrum being dilution of the nanoparticle peak (Figure 3.26). Unlike the 1:3 Au:Ag particles
discussed above, however, the 1:1 Au:Ag particles also showed no extra peak in the UV-vis
when titrated with with crystal violet (Figure 3.27); there was a marginal uniform increase in
absorption on the first addition of dye, then a steady, stepwise decrease throughout the
whole experiment. Titration of 1:1 Au:Ag particles with anionic naphthol green also showed
zero interaction, merely the dilution of the nanoparticle peak as the titration progresses
(Figure 3.28).

129
Figure 3.26 UV-vis spectra showing the titration of 5 mM toluidine blue with a solution of citrate stabilised silver-gold nanoparticles made using a gold to silver ratio of 1:1
Figure 3.27 UV-vis spectra showing the titration of 5 mM crystal violet with a solution of citrate stabilised silver-gold nanoparticles made using a gold to silver ratio of 1:1

130
Figure 3.28 UV-vis spectra showing the titration of 20 µM naphthol green with a solution of citrate stabilised silver-gold nanoparticles made using a gold to silver ratio of 1:1
3.4.1.5.3 3:1 Au:Ag nanoparticles
Titration of particles made using a 3:1 ratio of Au:Ag with toluidine blue and crystal violet
showed different results again. Titration of these particles with toluidine blue showed erratic
behaviour; exhibiting a dilution effect after 1 mL dye had been added to the nanoparticle
solution then jumping in intensity to show enhanced absorption after 2 aliquots were added
(Figure 3.29, grey and yellow lines respectively). Addition of a third millilitre of dye caused a
drop in intensity of nearly 1 A. U., before fourth and fifth additions provoked another increase
to above the intensity for the nanoparticles alone. This erratic behaviour continued as further
portions of dye were added, though the variations became less pronounced.
Titration of the same particles with crystal violet also showed irregular behaviour. Aliquots
1-4 caused a simple dilution effect be observed (Figure 3.30). Aliquot 5 then showed an
increase in absorption compared to 4, though not above the observed maximum for the
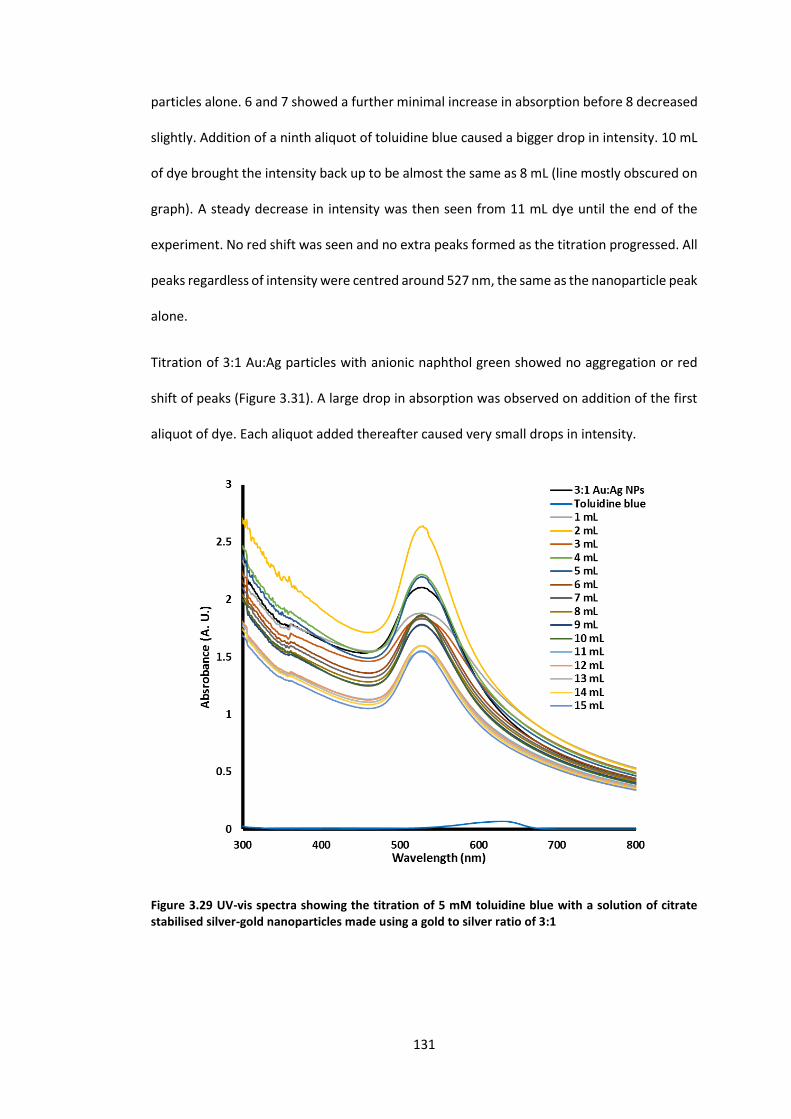
131
particles alone. 6 and 7 showed a further minimal increase in absorption before 8 decreased
slightly. Addition of a ninth aliquot of toluidine blue caused a bigger drop in intensity. 10 mL
of dye brought the intensity back up to be almost the same as 8 mL (line mostly obscured on
graph). A steady decrease in intensity was then seen from 11 mL dye until the end of the
experiment. No red shift was seen and no extra peaks formed as the titration progressed. All
peaks regardless of intensity were centred around 527 nm, the same as the nanoparticle peak
alone.
Titration of 3:1 Au:Ag particles with anionic naphthol green showed no aggregation or red
shift of peaks (Figure 3.31). A large drop in absorption was observed on addition of the first
aliquot of dye. Each aliquot added thereafter caused very small drops in intensity.
Figure 3.29 UV-vis spectra showing the titration of 5 mM toluidine blue with a solution of citrate stabilised silver-gold nanoparticles made using a gold to silver ratio of 3:1
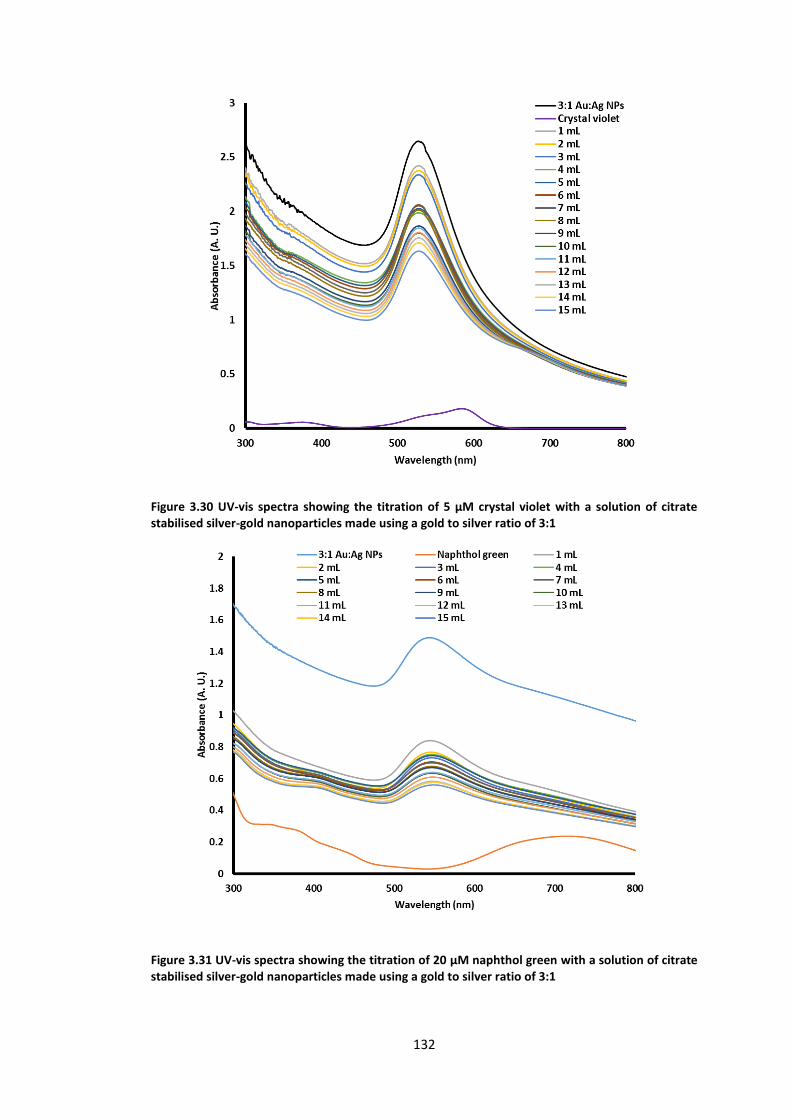
132
Figure 3.30 UV-vis spectra showing the titration of 5 µM crystal violet with a solution of citrate stabilised silver-gold nanoparticles made using a gold to silver ratio of 3:1
Figure 3.31 UV-vis spectra showing the titration of 20 µM naphthol green with a solution of citrate stabilised silver-gold nanoparticles made using a gold to silver ratio of 3:1
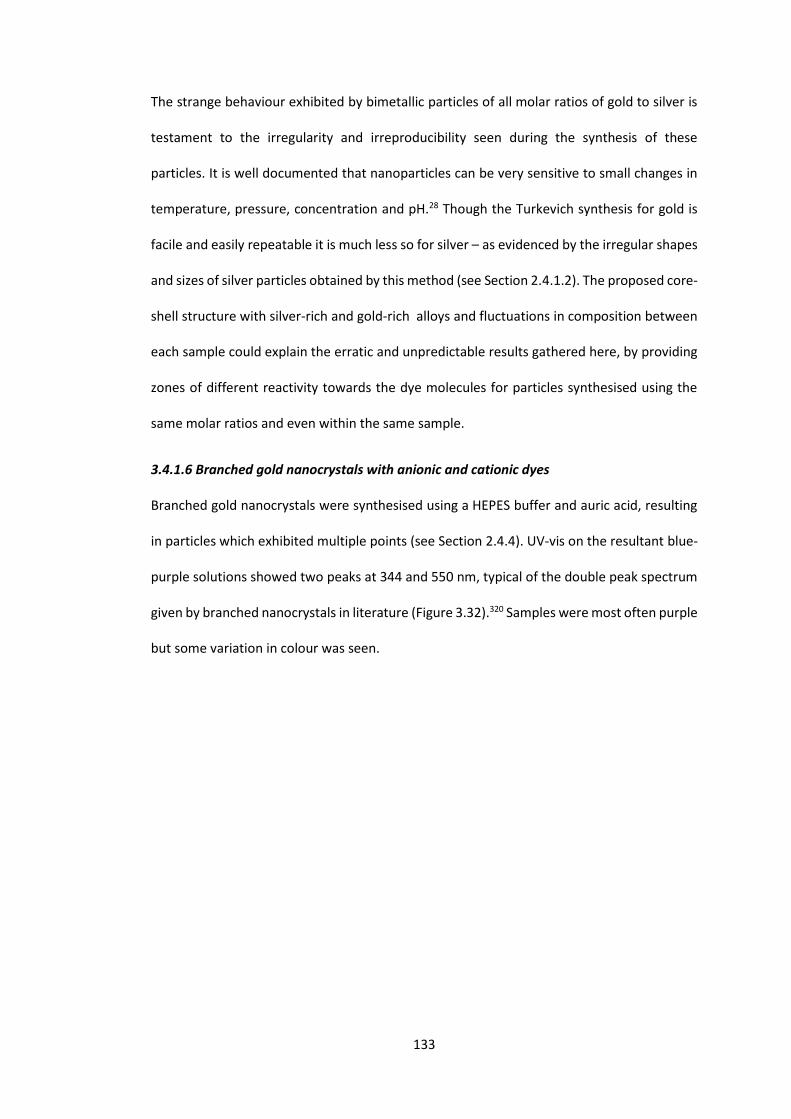
133
The strange behaviour exhibited by bimetallic particles of all molar ratios of gold to silver is
testament to the irregularity and irreproducibility seen during the synthesis of these
particles. It is well documented that nanoparticles can be very sensitive to small changes in
temperature, pressure, concentration and pH.28 Though the Turkevich synthesis for gold is
facile and easily repeatable it is much less so for silver – as evidenced by the irregular shapes
and sizes of silver particles obtained by this method (see Section 2.4.1.2). The proposed core-
shell structure with silver-rich and gold-rich alloys and fluctuations in composition between
each sample could explain the erratic and unpredictable results gathered here, by providing
zones of different reactivity towards the dye molecules for particles synthesised using the
same molar ratios and even within the same sample.
3.4.1.6 Branched gold nanocrystals with anionic and cationic dyes
Branched gold nanocrystals were synthesised using a HEPES buffer and auric acid, resulting
in particles which exhibited multiple points (see Section 2.4.4). UV-vis on the resultant blue-
purple solutions showed two peaks at 344 and 550 nm, typical of the double peak spectrum
given by branched nanocrystals in literature (Figure 3.32).320 Samples were most often purple
but some variation in colour was seen.
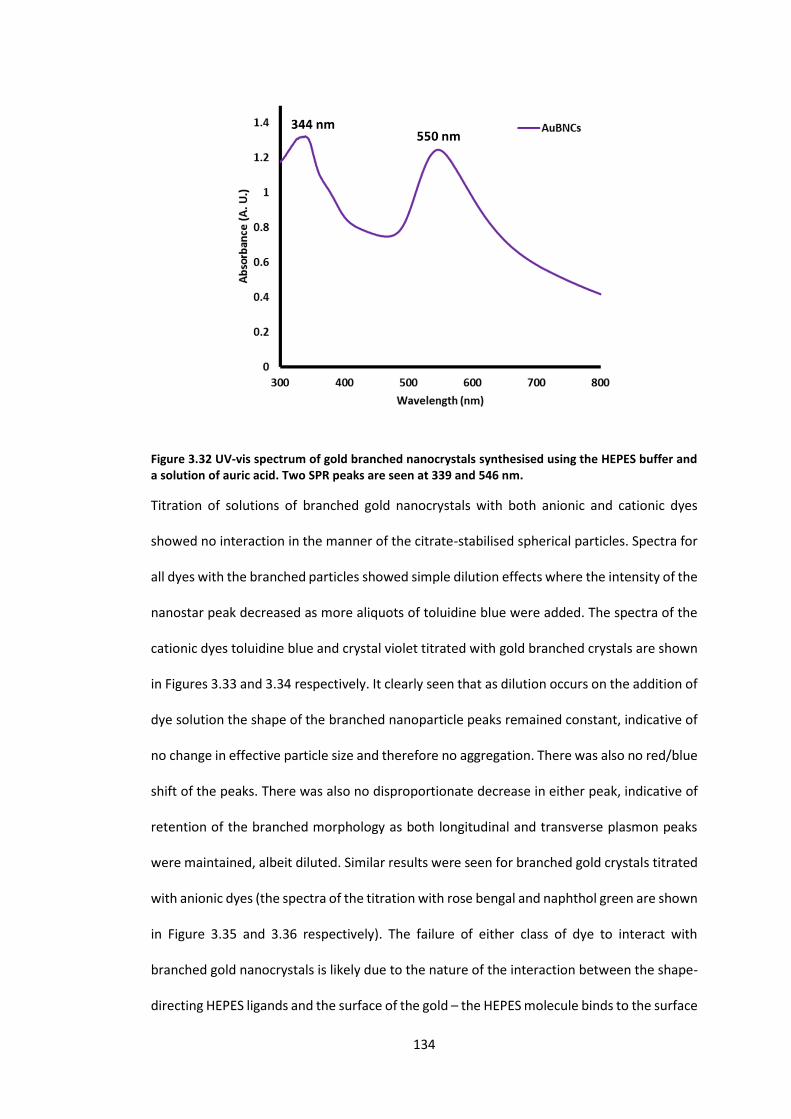
134
Figure 3.32 UV-vis spectrum of gold branched nanocrystals synthesised using the HEPES buffer and a solution of auric acid. Two SPR peaks are seen at 339 and 546 nm.
Titration of solutions of branched gold nanocrystals with both anionic and cationic dyes
showed no interaction in the manner of the citrate-stabilised spherical particles. Spectra for
all dyes with the branched particles showed simple dilution effects where the intensity of the
nanostar peak decreased as more aliquots of toluidine blue were added. The spectra of the
cationic dyes toluidine blue and crystal violet titrated with gold branched crystals are shown
in Figures 3.33 and 3.34 respectively. It clearly seen that as dilution occurs on the addition of
dye solution the shape of the branched nanoparticle peaks remained constant, indicative of
no change in effective particle size and therefore no aggregation. There was also no red/blue
shift of the peaks. There was also no disproportionate decrease in either peak, indicative of
retention of the branched morphology as both longitudinal and transverse plasmon peaks
were maintained, albeit diluted. Similar results were seen for branched gold crystals titrated
with anionic dyes (the spectra of the titration with rose bengal and naphthol green are shown
in Figure 3.35 and 3.36 respectively). The failure of either class of dye to interact with
branched gold nanocrystals is likely due to the nature of the interaction between the shape-
directing HEPES ligands and the surface of the gold – the HEPES molecule binds to the surface

135
of the gold through a sulphur atom (structure of HEPES shown in Figure 3.37). It is known
that gold-thiol bonds are very strong (Au-S dissociation energy is 254 kJ mol-1) thus are
unlikely to be displaced by dyes coordinating either through a nitrogen (Au-N bond energy
unquantified, but reportedly a comparatively weak covalent interaction compared to the
strong Au-S covalent bond340) or oxygen atom (Au-O 223 kJ mol-1).

136
Figure 3.33 UV-vis spectrum of the titration between gold branched nanocrystals and toluidine blue
Figure 3.34 UV-vis spectrum of the titration between branched gold nanocrystals (AUBNCs) and crystal violet
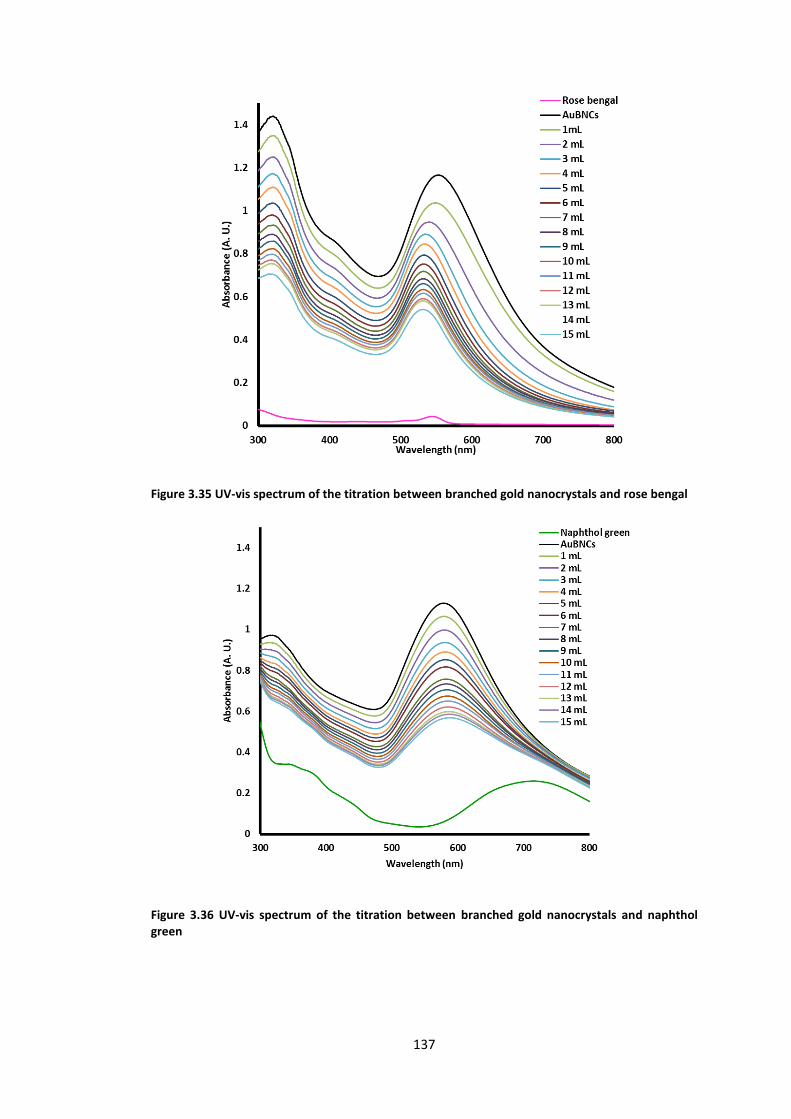
137
Figure 3.35 UV-vis spectrum of the titration between branched gold nanocrystals and rose bengal
Figure 3.36 UV-vis spectrum of the titration between branched gold nanocrystals and naphthol green

138
Figure 3.37 The structure of 2-[4-(2-hydroxyethyl)piperazin-1-yl]ethanesulfonic acid (HEPES)
3.4.1.7 Gold nanorods with anionic and cationic dyes
Titration of CTAB-stabilised gold nanorods with cationic dyes showed only expected dilution
effects. Examples of the titration of gold nanorods with toluidine blue and acridine orange
are shown below (Figures 3.38 and 3.39 respectively). It is clearly seen in the spectrum of
toluidine blue and nanorods that there is a steady decrease in intensity of the nanorods
absorption (black line) as the titration progresses. In the spectrum of acridine orange and
nanorods we see dilution of the nanorods absorption and also an increase in the peak
corresponding to the dye as the concentration of dye in the reaction mixture increases.
Isosbestic points are also seen on this spectrum. These features, coupled with the
conspicuous absence of enhanced dye absorption or red-shifted peaks, indicate there is no
interaction between the cationic dyes and gold nanorods.

139
Figure 3.38 UV-vis spectra showing the titration between CTAB-stabilised gold nanorods and 5 µM toluidine blue.

140
Figure 3.39 UV-vis spectra showing the titration between CTAB-stabilised gold nanorods and 20 µM acridine orange.
Titration between gold nanorods and the anionic dye naphthol green (Figure 3.41) showed
different behaviour. Absorption of the nanorods was uniformly increased on addition of one
aliquot of naphthol green, followed by a slow decrease in absorption for each subsequent
addition. No aggregation peak was seen and no shift of the initial peak was seen, indicating
no change in effective particle size. This slight interaction is most likely a result of the nature
of stabilising CTAB molecules, which by contrast to citrate carry an overall positive charge
(see Figure 3.40 for structure of CTAB). As such, positively charged naphthol green will not
be repelled from the ligand shell in the way that the cationic dyes are, resulting in limited
interaction between the dye molecule and the surface of the gold.
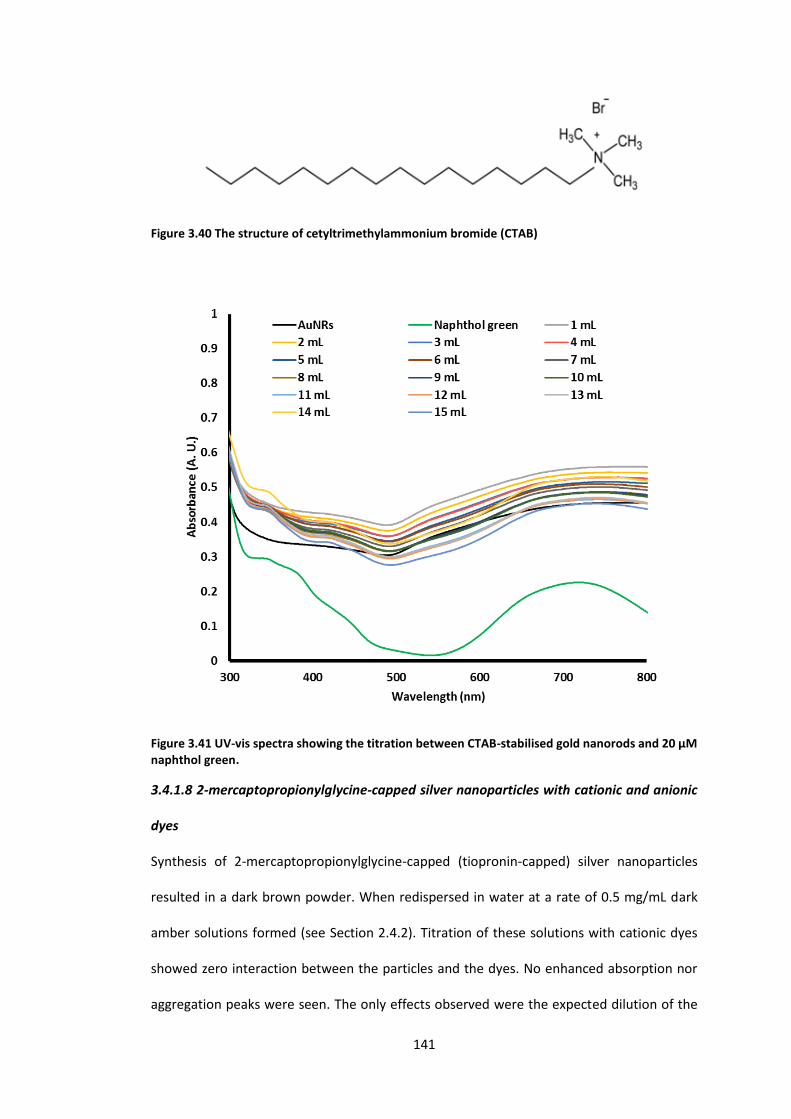
141
Figure 3.40 The structure of cetyltrimethylammonium bromide (CTAB)
Figure 3.41 UV-vis spectra showing the titration between CTAB-stabilised gold nanorods and 20 µM naphthol green.
3.4.1.8 2-mercaptopropionylglycine-capped silver nanoparticles with cationic and anionic
dyes
Synthesis of 2-mercaptopropionylglycine-capped (tiopronin-capped) silver nanoparticles
resulted in a dark brown powder. When redispersed in water at a rate of 0.5 mg/mL dark
amber solutions formed (see Section 2.4.2). Titration of these solutions with cationic dyes
showed zero interaction between the particles and the dyes. No enhanced absorption nor
aggregation peaks were seen. The only effects observed were the expected dilution of the
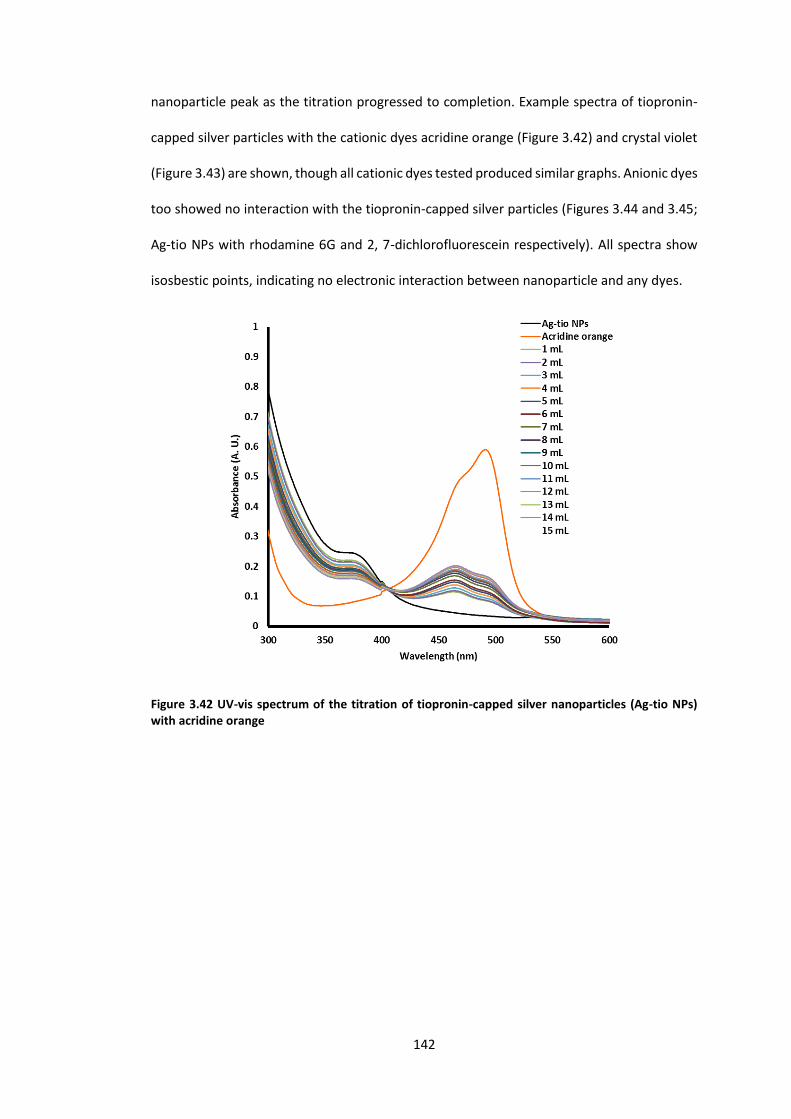
142
nanoparticle peak as the titration progressed to completion. Example spectra of tiopronin-
capped silver particles with the cationic dyes acridine orange (Figure 3.42) and crystal violet
(Figure 3.43) are shown, though all cationic dyes tested produced similar graphs. Anionic dyes
too showed no interaction with the tiopronin-capped silver particles (Figures 3.44 and 3.45;
Ag-tio NPs with rhodamine 6G and 2, 7-dichlorofluorescein respectively). All spectra show
isosbestic points, indicating no electronic interaction between nanoparticle and any dyes.
Figure 3.42 UV-vis spectrum of the titration of tiopronin-capped silver nanoparticles (Ag-tio NPs) with acridine orange
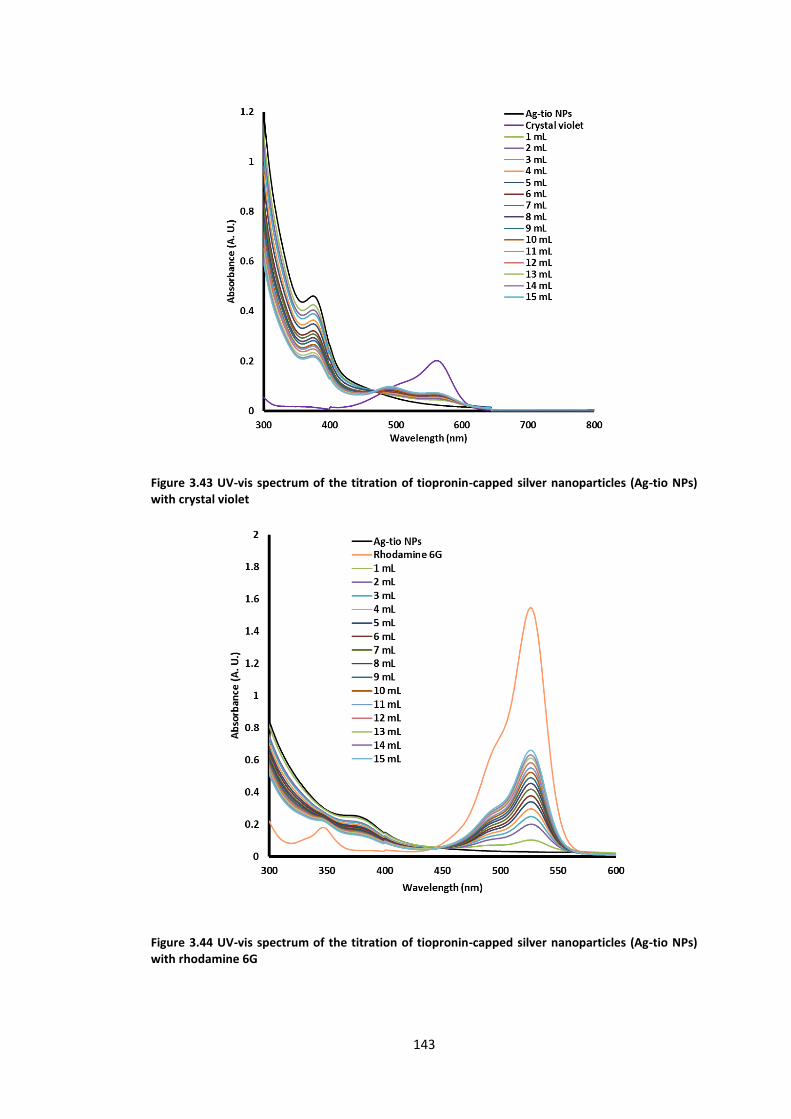
143
Figure 3.43 UV-vis spectrum of the titration of tiopronin-capped silver nanoparticles (Ag-tio NPs) with crystal violet
Figure 3.44 UV-vis spectrum of the titration of tiopronin-capped silver nanoparticles (Ag-tio NPs) with rhodamine 6G
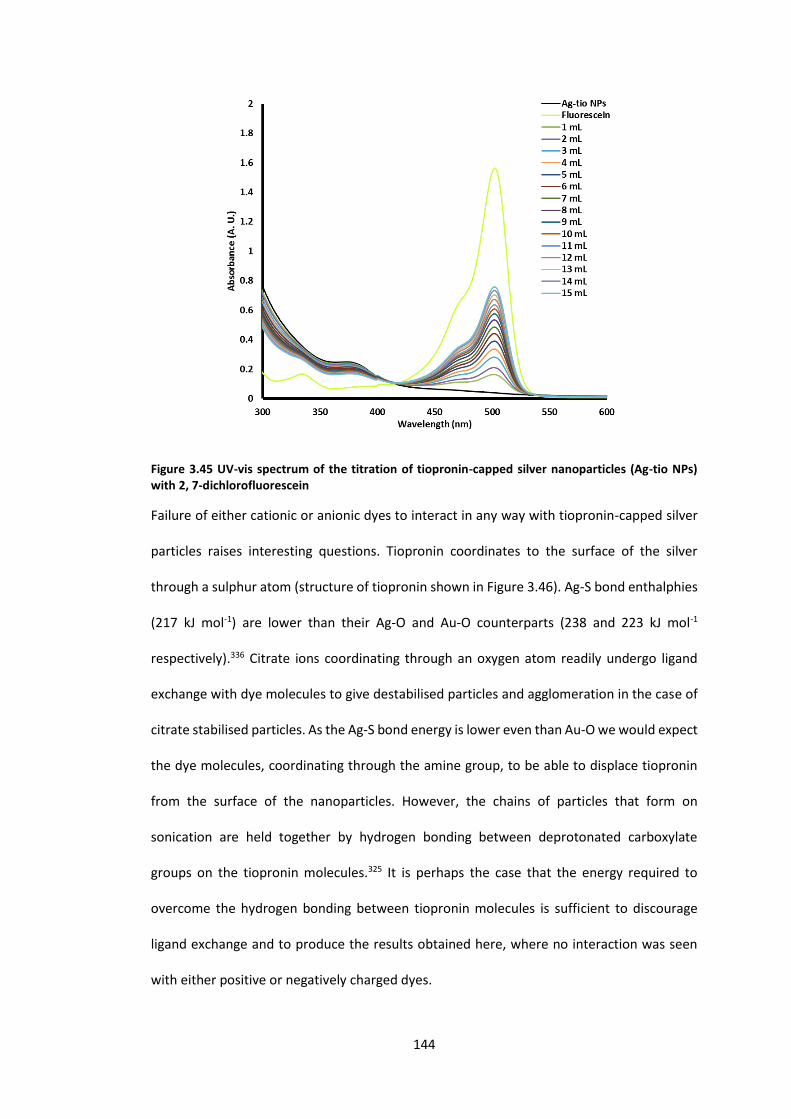
144
Figure 3.45 UV-vis spectrum of the titration of tiopronin-capped silver nanoparticles (Ag-tio NPs) with 2, 7-dichlorofluorescein
Failure of either cationic or anionic dyes to interact in any way with tiopronin-capped silver
particles raises interesting questions. Tiopronin coordinates to the surface of the silver
through a sulphur atom (structure of tiopronin shown in Figure 3.46). Ag-S bond enthalphies
(217 kJ mol-1) are lower than their Ag-O and Au-O counterparts (238 and 223 kJ mol-1
respectively).336 Citrate ions coordinating through an oxygen atom readily undergo ligand
exchange with dye molecules to give destabilised particles and agglomeration in the case of
citrate stabilised particles. As the Ag-S bond energy is lower even than Au-O we would expect
the dye molecules, coordinating through the amine group, to be able to displace tiopronin
from the surface of the nanoparticles. However, the chains of particles that form on
sonication are held together by hydrogen bonding between deprotonated carboxylate
groups on the tiopronin molecules.325 It is perhaps the case that the energy required to
overcome the hydrogen bonding between tiopronin molecules is sufficient to discourage
ligand exchange and to produce the results obtained here, where no interaction was seen
with either positive or negatively charged dyes.

145
Figure 3.46 The structure of 2-mercaptopropionylglycine (tiopronin).
3.4.2 Particle size measurements for citrate-capped gold nanoparticles: TEM
studies and Zetasizer
Particle size studies before, during and after titration were performed for citrate stabilised
gold particles due to the emergence of a UV-vis absorption at large red shifts, indicative of
aggregation. TEM images of other particles can be found in Chapter 2.
TEM studies of the citrate-capped gold nanoparticles on their own showed well-formed,
spherical particles arranged singly or in small groups of 2 - 5 (Figure 3.47). The diameter of
the particles largely fell between 10 – 15 nm, skewed towards the smaller end of the scale.
Average particle diameter was found to be 11 nm. This corresponds well with dynamic light
scattering (DLS) studies on a solution of the gold particles, where the average hydrodynamic
diameter was observed to be 20.5 nm. The hydrodynamic diameter takes the capping and
solvent layers into consideration and is typically twice that of the inorganic core, thus a
hydrodynamic diameter of this size agrees well with the observed average particle size of
approximately 11 nm.

146
Figure 3.47 TEM image showing gold nanoparticles synthesised by the Turkevich method
TEM images of gold nanoparticle samples after cationic dye solutions had been added
showed some significant differences to those of the nanoparticles alone. Images taken of a
gold nanoparticle solution to which 4 mL of toluidine blue had been added (corresponding to
a dye concentration of 1 µM) showed significant aggregation of the particles (Figure 3.48b).
Arrays expanded over several hundred nanometres and consisted of discrete particles in
close proximity to each other, though there were still particles in smaller groups and indeed
found singly. Increasing dye concentration to 1.2 µM by adding 5 mL of toluidine blue
increased the size of the arrays to several micrometres in diameter with very few particles
found outside the aggregates (Figure 3.48c). Increasing the dye concentration further to 1.4
µM (6 mL added; the critical concentration at which enhanced maximum absorption is
observed in the UV-vis) yielded larger, multi-micrometre aggregates in which the particles
had begun to disintegrate into smaller fragments (Figure 3.48d). This differs from the
discrete, well-formed spherical particles in the previous three images. The broken down
particles form a large globular matrix surrounding particles which have not yet disintegrated,
vastly increasing perceived particle size. This correlates excellently with the data from the
Zetasizer measurements on the toluidine blue – gold nanoparticle system (Figure 3.52; blue

147
line), which showed a sudden increase in hydrodynamic radius of the particles after 5 mL
toluidine blue had been added to the system.
Figure 3.48 TEM images showing (a) gold nanoparticles made by the Turkevich method before dye solutions were added; (b) gold nanoparticles to which 4 mL of toluidine blue had been added; (c) gold nanoparticles to which 5 mL toluidine blue had been added; (d) gold nanoparticles to which 6 mL toluidine blue had been added.
Studies on the crystal violet-gold nanoparticle system showed similar results. Below the
critical concentration particles are arranged singly or in small clusters of <5 (Figure 3.49a).
Close to the critical concentration we start to see aggregation into chain-like arrays (Figure
3.49b). Typically these arrays were 200-300 nm in length. Increasing the concentration of the
dye to well above critical resulted in continued aggregation into micrometre-scale,
multidirectional arrays. As in the toluidine blue experiments the particles start to break down
and/or grow together and become much less well-formed, resulting in cloudy areas on the
TEM images. This series of TEM images showing increase in effective particle size from 5 mL
crystal violet added onwards corroborates closely with the Zetasizer data gathered on the
same system (Figure 3.52; purple line).

148
Figure 3.49 TEM images showing the formation of aggregates as crystal violet is added to a solution of gold nanoparticles: (a) 3 mL crystal violet added; (b) 6 mL crystal violet added; (c) and (d) 10 mL crystal violet added.
Acridine orange yields analogous results. From a well-dispersed starting point (Figure 3.50a),
at the critical concentration of 3.2 µM (3 mL acridine orange added) particles aggregated into
micron-scale arrays (Figure 3.50b). Increasing dye concentration past the critical point caused
the breakdown of particles into fragments and a degree of particle growth (Figure 3.50c and
3.50d). Zetasizer studies showed increase in hydrodynamic radius over the course of the
experiment (Figure 3.52; orange line), agreeing well with the TEM images in Figure 3.52.
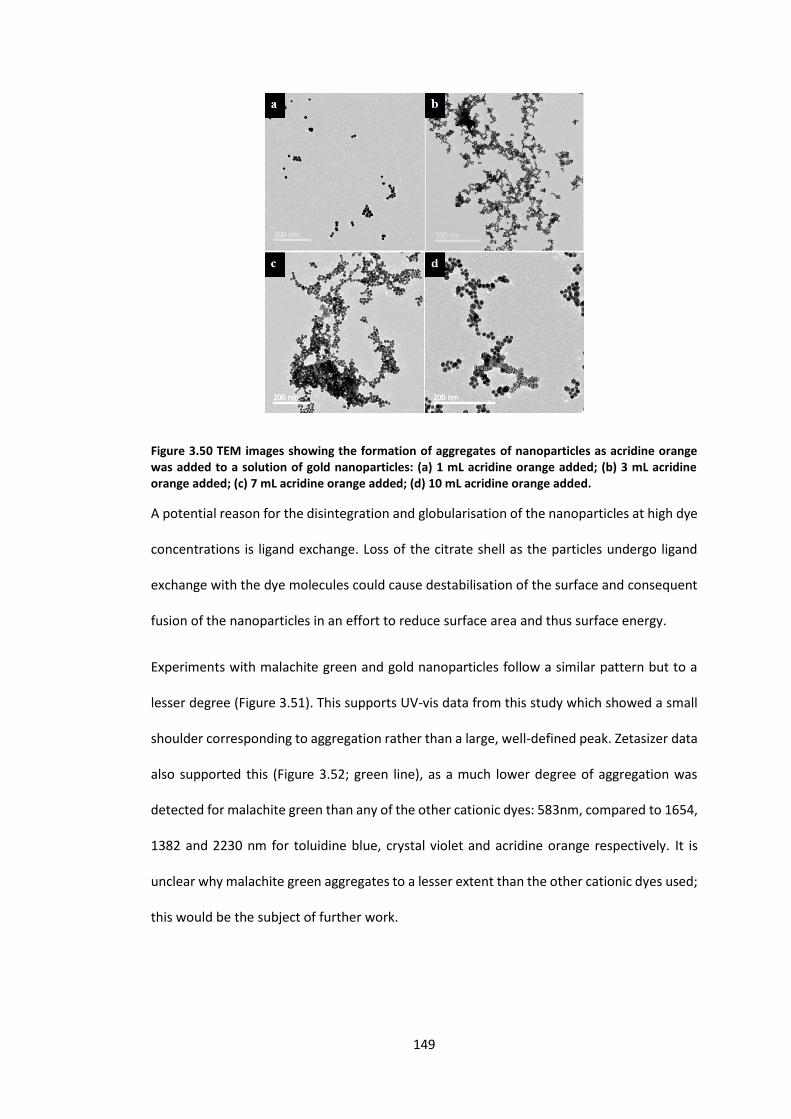
149
Figure 3.50 TEM images showing the formation of aggregates of nanoparticles as acridine orange was added to a solution of gold nanoparticles: (a) 1 mL acridine orange added; (b) 3 mL acridine orange added; (c) 7 mL acridine orange added; (d) 10 mL acridine orange added.
A potential reason for the disintegration and globularisation of the nanoparticles at high dye
concentrations is ligand exchange. Loss of the citrate shell as the particles undergo ligand
exchange with the dye molecules could cause destabilisation of the surface and consequent
fusion of the nanoparticles in an effort to reduce surface area and thus surface energy.
Experiments with malachite green and gold nanoparticles follow a similar pattern but to a
lesser degree (Figure 3.51). This supports UV-vis data from this study which showed a small
shoulder corresponding to aggregation rather than a large, well-defined peak. Zetasizer data
also supported this (Figure 3.52; green line), as a much lower degree of aggregation was
detected for malachite green than any of the other cationic dyes: 583nm, compared to 1654,
1382 and 2230 nm for toluidine blue, crystal violet and acridine orange respectively. It is
unclear why malachite green aggregates to a lesser extent than the other cationic dyes used;
this would be the subject of further work.

150
Figure 3.51 TEM images showing the formation of aggregates as malachite green was added to a solution of gold nanoparticles: (a) 3 mL malachite green added; (b) 6 mL malachite green added.
Figure 3.52 Graph showing the increase in observed hydrodynamic radius of gold nanoparticles as dyes are added to the nanoparticle solution.
To the best of our knowledge TEM and Zetasizer analysis of the interaction of dyes with gold
nanoparticles and observation of the aggregation that occurs had not been reported
previously.
3.5 Conclusions
It was shown that citrate-stabilised gold nanoparticles interact strongly with cationic dyes
and trigger agglomeration of the nanoparticles into large, micrometre-scale arrays. This is
151
accompanied by a new peak developing on the UV-vis spectra at a large red shift, concurrent
with increasing effective particle size. Enhanced absorption of this peak was observed for
toluidine blue (previously reported43), crystal violet and acridine orange. This phenomenon
has not, to the best of our knowledge, been reported for crystal violet or acridine orange.
From the results obtained it is unclear why this effect is seen for acridine orange, crystal violet
and toluidine blue but not malachite green, a structurally similar like-charge dye. From our
results it is not clear why this is the case; future work concerning the nature of the interaction
between the dyes and nanoparticle surface such as time-correlated single photon counting
(TCSPC) and DFT could help to elucidate the reasons behind this.
None of the anionic dyes tested produced aggregation or enhanced absorption. As anionic
dyes failed to cause aggregation in the same manner as cationic it is clear that agglomeration
of the particles is not solely due to an increase in the ionic strength of the solution as
previously asserted in the literature. The charge present on the dyes plays an important part
in aggregation due to electrostatic attraction or repulsion between the dye molecules and
the citrate shell. Silver nanoparticles made by analogous methods to the gold samples
showed no interaction with either anionic or cationic dyes. It is thought that lower gold-
oxygen bond energies compared to silver-oxygen cause citrate to be more weakly bonded to
the surface of the gold particles. Combined with the low affinity of amine groups for silver
compared with the gold, it is thought that ligand exchange is favourable with amine-
containing dyes on gold particles but not silver. Bimetallic particles synthesised in an
analogous way behaved erratically, with no predictable pattern to the results. It is suggested
that the erratic behaviour of the silver-gold alloyed particles is a result of the variation in size,
shape and surface composition obtained using this synthesis.
In the case of zero interaction being recorded for tiopronin-capped silver particles it is
postulated that the extra energy required to overcome hydrogen bonding between tiopronin

152
molecules in the thiolate chains makes ligand exchange unfavourable. Branched gold
nanocrystals also showed no interaction with either class of dye, which is thought to be a
consequence of strong Au-S covalent bonds present between the surface of the particles and
the HEPES molecules. CTAB-stabilised gold nanorods showed no interaction with cationic
dyes but a small different in the spectrum when titrated with anionic naphthol green,
suggesting the net-positively charged CTAB sheath plays a role in allowing the interaction.

153
CHAPTER 4 : THE ANTIMICROBIAL CAPACITY OF CITRATE-STABILISED GOLD AND SILVER
NANOPARTICLE-DYE CONJUGATES IN POLYURETHANE
4.1 Aims
This chapter presents the functional testing of some of the nanoparticle-dye conjugates seen
in Chapter 3. Citrate-stabilised gold and silver nanoparticles were used with acridine orange,
crystal violet and malachite green. The combinations were incorporated into polyurethane
and the antimicrobial properties of the resultant surfaces evaluated. Excellent results against
both gram positive and gram negative bacteria were seen for gold and silver particles with
crystal violet and acridine orange. Acridine orange with citrate-stabilised silver nanoparticles,
a previously unreported combination, outperformed all other samples, effecting total kill of
S. aureus and E. coli within five hours in both light and dark conditions. The rapidity and
potency of the photobactericidal response combined with excellent dark kill ability makes
this an exciting possibility for fabrication of commercial self-sterilising surfaces.
4.2 Introduction and motivations
4.2.1 Nosocomial infections
Nosocomial infections – that is, infections which are acquired in hospital - affect an estimated
9% of all hospital patients and represent 50% of all hospitalization complications.288 These
preventable infections are a huge drain on health care resources worldwide, costing an
estimated £1 billion per year in the UK alone.289 The emergence of drug-resistant strains of
common pathogens as a consequence of antibiotic overprescription has added a new
dimension to this struggle as we race to find new, novel treatments where conventional
antibiotic therapy fails.341
154
It is estimated that 8/10 nosocomial infections are transmitted by touch. Though high
standards of personal hygiene are recommended in hospitals, compliance with
recommended protocol is low among staff, patients and visitors alike.287,292,342 Frequently
touched surfaces in hospitals (such as door handles, bed rails, surgical trays, telephones) can
act as ‘reservoirs’ for pathogenic bacteria to be spread around.343 Infections of staff and
other personnel by direct contact with patients is much less likely than by contact with a
colonised surface. Thus, if surfaces can be made self-sterilising the rate of nosocomial
infections could be significantly reduced.
4.2.2 Light activated antimicrobial surfaces
A possible simple method to achieve this aim is to fabricate reservoir surfaces out of
photosensitizer-impregnated polymers. Photosensitizers are light activated antimicrobial
agents (LAAA) which can be used for PDT, which has been proposed as a promising
alternative to antibiotics to treat common bacterial infections.248 This novel process uses a
photosensitizer (most commonly a dye) to kill bacteria via the production of singlet
oxygen.344 Mechanistically, there are three phases of PDT: excitation of the photosensitizing
molecule, generation of cytotoxic oxygen species, followed by cell death. In the first phase
the photosensitizer is exposed to light (either white or of a target wavelength) and absorbs
a photon of specific frequency, promoting the dye molecule to a high-energy triplet state.
The second stage sees interaction of the excited state with molecular O2, producing either a
reactive oxygen species (ROS) or singlet oxygen. Both of these species are highly cytotoxic
and induce cell death by destroying vital cell features such as mitochondria, lysosomes, cell
walls, membranes and by attacking DNA.345 This process is summarised in Scheme 4.1. It is
believed that the likelihood of microbes developing a resistance to this treatment is
extremely low, as singlet oxygen utilises a non-specific, multi-site mechanistic mode of
destroying microorganisms.301,304,346

155
Scheme 4.1 Illustration showing the mechanism of photodynamic therapy
Incorporation of these LAAAs into surfaces could therefore have great benefit in reducing the
numbers of bacteria present on commonly handled objects and surfaces. The concept of self-
sterilising surfaces is one which has gathered a lot of momentum in recent years as PDT has
becoming increasingly widely studied. Inorganic surfaces such as titania,347,348 glass349,350 and
polymers298,351 have been investigated for this application, but impregnation of polymers
with LAAAs offers one of the most facile and versatile solutions to the problem due to the
flexibility and relative cheapness of the material, durability and ability to choose which LAAAs
are required for a certain application. A range of polymers such as cellulose acetate295,351,352,
polymer resins353 and silicone354 have been utilised for this purpose, combined with many
different dyes from both the triarylmethyl61,355,356 and phenothiazine families.295,301,352,357
General photobactericidal effect was found to be good, with a more efficacious kill (in terms
of rapidity and reducing number of viable counts) observed against gram positive pathogens
than gram negative. Gram positive bacteria are differentiated from gram negative by a
difference in cell wall structure: gram positive species have a thick peptidoglycan cell wall,
whereas gram negative cell walls contain a thin peptidoglycan layer enveloped in a thick
plasma membrane.358 This protective plasma membrane affords additional protection to

156
gram negative organisms and renders them harder to kill by both PDT and traditional
antibiotic methods.
4.2.3 Conjugation of LAAAs and nanomaterials
The potency of the LAAAs can be increased by conjugation with a nanomaterial. Solution
studies have shown that combining toluidine blue with gold nanoparticles (2 nm and 15 nm)
can enhance bacterial kill rates by an order of one log10 compared to toluidine blue alone.282
In polymers, a combination of methylene blue with size-specific gold nanoparticles has been
shown to enhance photobactericidal kill against both gram positive and gram negative
bacteria compared to methylene blue-impregnated polymers only.298,305,306 Seemingly the
size of nanoparticle incorporated into the polymer-dye system is vital: incorporation of gold
nanoparticles over 20 nm in diameter showed a decrease in the antibacterial activity of
methylene blue-silicone samples against gram-positive and negative bacteria.305 5 nm
diameter gold particles in the same methylene blue-silicone system produced no noticeable
enhancement of bacterial kill against E. coli compared to methylene blue alone, but did show
an enhancement (ca. 0.3 log) when assays against S. epidermis were carried out. Smaller
particles ~2 nm in diameter gave even greater activity, increasing bacterial kill by one log10
against E. coli and reducing bacterial numbers to below the detection limit (≥ 4 log reduction;
≥99.99% kill) for S. epidermis.305 2 nm gold particles were successfully used to enhance the
inactivation of both E. coli and S. epidermis by significant amounts.301,306 Silicone containing
2 nm gold particles alone did not show any photobactericidal ability,306 thus the
enhancement of bacterial kill rates observed on the addition of these particles to methylene
blue-containing polymers was deduced to be as a result of a synergic interaction between
the dye molecule and nanoparticle. Metal oxide particles have also been shown to have a
potent light activated antimicrobial effect when combined with gold nanoparticles.308 More
specialised pre-clinical studies found that a 50% reduction in S. epidermis biofilm was

157
achieved using methylene blue and nanogold-impregnated silicone treated with laser
illumination for 10 minutes per hour.307
Activation of the polymers can either be of short duration, using laser illumination,309 or of
longer duration under standard white lighting.359 For self-sterilising surfaces it is
advantageous that the photobactericidal effect is triggered under normal light conditions to
circumvent the need for specialist equipment and to make them useful in a wider variety of
situations.
To be of use as self-sterilising surfaces the modified polymers must fulfil a number of
additional criteria: they must be non-toxic to humans, not leach out as a consequence of
routine washing, be durable and also be environmentally benign. Though covalent
attachment of dyes to the surface of polymers can be achieved,360 a simple swell-
encapsulation-shrink method has been used extensively to great effect.309,359 As noted
previously, the latter process immerses a polymer in a swelling solution containing a solvent
(such as acetone) and the molecule or particle to be encapsulated. The solvent causes the
polymer matrix to expand, allowing diffusion of the dye or particle into the bulk of the
substrate. After the desired time frame, the polymer is removed from the swelling solution
and allowed to dry. The solvent evaporates and allows the polymer matrix to return to its
original size, immobilising the dye molecules or nanoparticles in the sample. Thus trapped,
the target molecules should remain within the polymer and be resistant to leaching. This is
highly important if the polymers are to be used in healthcare settings, either in vivo or not.
Concerning toxicity towards humans, studies have shown that antimicrobial PDT systems
which show good photobactericidal ability do not result in cytotoxicity towards mammalian
cells.361,362 Mammalian cells are larger than bacterial, thus a higher concentration of
photosensitizing molecules and longer illumination times are required produce sufficient
singlet oxygen/ROS to induce cell death.346 These levels are not necessary for bacterial cells,

158
thus concentrations of photosensitizers able to kill bacteria effectively are non-toxic to
humans.363 Advantageously, due to their greater susceptibility it has been shown to be
possible to kill bacteria not only on the surface of the LAAA-modified polymer, but also up to
0.65 mm away from it.359 This has great potential in healthcare situations to reduce biofilm
formation on reservoir surfaces.
In this work, we report the lethal sensitization of E. coli and S. aureus by polyurethane
impregnated with a range of dyes and either gold or silver nanoparticles using the
aforementioned swell-encapsulation-shrink method. The nanoparticles were synthesised
using the citrate-reduction method. These bacterial species were chosen as representative
of common nosocomial pathogenic species (S. aureus accounts for 16% of all nosocomial
infections [29% of which were found to have resistance to methicillin] and E. coli is
particularly prevalent in obstetrics364). It was found that polyurethane embedded with gold
nanoparticles showed no intrinsic toxicity towards either species. Silvernanoparticle-only
samples showed good activity against gram negative E. coli but failed to induce kill against S.
aureus. Addition of gold and silver nanoparticles showed enhancement of the antimicrobial
properties of the dyes. Addition of silver nanoparticles to crystal violet and acridine orange
resulted in excellent photobactericidal ability against both gram-positive and gram-negative
organisms, both giving total kill over five hours under white light. Both systems also showed
good dark kill ability (acridine orange and silver nanoparticles induced complete kill against
E. coli in five hours) giving them huge promise as antimicrobial surfaces. Despite the
antibacterial effects of silver nanoparticles being well-known,365–369 to the best of our
knowledge this is the first reported incidence of using silver nanoparticles in conjunction with
LAAAs to fabricate self-sterilising surfaces. It is also the first report of acridine orange being
used for such a purpose, and the potency of its bactericidal effects when combined with
noble metal nanoparticles is highly exciting.

159
4.3 Experimental methods
4.3.1 Synthesis of nanoparticles
4.3.1.1 Synthesis of gold and silver citrate stabilised nanoparticles.
Nanoparticles of gold and silver were synthesised using the same modified Turkevich method
described in Sections 2.3.1.1 and 2.3.1.2 respectively.
4.3.1.2 Nanoparticle characterisation techniques
UV-vis absorption spectra of nanoparticle and dye solutions were recorded using a Shimadzu
UV-1800 Spectrophotometer. Plastic cuvettes with a light path length of 10 mm were used.
Absorption was measured over the spectral range 200 – 1000 nm.
TEM micrographs were taken using a Jeol 200 kV TEM. Samples of the particles without dyes
were prepared by evaporating drops of the aqueous nanoparticle solution onto carbon
coated copper grids.
4.3.2 Preparation of dye solutions
Two methods of incorporating dyes into the polymer samples were used. Malachite green
and crystal violet were post-coated onto the surface of the polymer samples; acridine orange
and naphthol green were swell encapsulated into the polymer matrix. The dyes used in this
work are shown with their structures in Table 4.1.
Post-coating solutions were made up by dissolving solid dye in deionised water to make 1
mM solutions.
Swell encapsulation solutions were created by making a 9:1 acetone:water solution then
saturating it with solid dye.
Table 4.1 The names and structures of the dyes used in the antimicrobial investigation
Dye Structure
Cationic dyes

160
Malachite green
Crystal violet
Acridine Orange
Anionic dyes
Naphthol green B
4.3.3 Polymer samples for antimicrobial testing
All synthetic work used medical grade flat polyurethane sheets (thickness 0.8 mm; purchased
from American Polyfilm Inc) as the substrate. The sheet polyurethane was cut into
approximately 10x10 mm squares.
The following samples were made up for antimicrobial testing:
1. Control samples. Treated in a 9:1 acetone to water swelling solution for 24 hours
then dried overnight.

161
2. Citrate-capped gold nanoparticle treated samples. Treated in 9:1 acetone to gold
nanoparticle solution for 24 hours, then dried overnight. These were split into five
sub-categories:
i. Gold-only. No further treatment
ii. Gold-crystal violet. Samples post-coated with 1 mM aqueous crystal violet
solution for 24 h, then dried overnight.
iii. Gold-naphthol green. Samples post-coated with 1 mM aqueous naphthol
green solution for 24 h, then dried overnight.
iv. Gold-acridine orange. Samples treated with acridine orange-saturated 9:1
acetone to water solution for 24 h, then dried overnight.
v. Gold-malachite green. Samples treated with malachite green-saturated 9:1
acetone to water solution for 24 h, then dried overnight
3. Citrate-capped silver nanoparticle treated samples. Treated in 9:1 acetone to silver
nanoparticle solution for 24 hours, then dried overnight. These were split into five
sub-categories:
i. Silver-only. No further treatment
ii. Silver-crystal violet. Samples post-coated with 1 mM aqueous crystal violet
solution for 24 h, then dried overnight.
iii. Silver-naphthol green. Samples post-coated with 1 mM aqueous naphthol
green solution for 24 h, then dried overnight.
iv. Silver-acridine orange. Samples treated with acridine orange-saturated 9:1
acetone to water solution for 24 h, then dried overnight.
v. Silver-malachite green. Samples treated with malachite green-saturated 9:1
acetone to water solution for 24 h, then dried overnight.
4. Dye-only samples. These were created by taking control samples with no
nanoparticles. The four dye-only samples were as follows:

162
i. Crystal violet. Samples post-coated with 1 mM aqueous crystal violet
solution for 24 h, then dried overnight.
ii. Naphthol green. Samples post-coated with 1 mM aqueous naphthol green
solution for 24 h, then dried overnight.
iii. Acridine orange. Samples treated with acridine orange-saturated 9:1
acetone to water solution for 24 h, then dried overnight.
iv. Malachite green. Samples treated with malachite green-saturated 9:1
acetone to water solution for 24 h, then dried overnight.
The full range of samples used is summarised in Table 4.2.
All samples were treated and handled in ambient temperatures and light conditions. Samples
were dried in covered transparent petri dishes to ensure minimal contamination of the
sample surface.
Table 4.2 A summary of the polyurethane samples used in antimicrobial testing. Control indicates sample treated with solvent only. Au- and Ag only refer to samples containing either citrate-capped gold or silver nanoparticles exclusively. CV, AO, MG and NG-only denotes samples treated with crystal violet, acridine orange, malachite green or naphthol green dyes only. Au-CV refers to samples containing both gold nanoparticles and crystal violet, Ag-CV to silver nanoparticles and crystal violet. Other dye-nanoparticle combinations are denoted similarly.
Control Gold NPS Silver NPs
Control Control Au only Ag only
Crystal violet CV only Au-CV Ag-CV
Acridine orange AO only Au-AO Ag-AO
Malachite green MG only Au-MG Ag-MG
Naphthol green NG only Au-NG Ag-NG
4.3.3.1 Characterisation of polymer samples
UV-vis absorption measurements were taken on a Lambda 950 spectrophotometer over the
spectral range 800-200 nm. Water contact angle measurements of a ~5 µL drop of deionised

163
water were obtained using a FTA 1000 Drop Shape instrument. Droplets were dispensed by
a gauge 30 needle with a side-photographing camera. Data were analysed using FTA32
software.
4.3.4 Antimicrobial activity assays
The antibacterial activity of all samples was tested against S. aureus 8325-4 and E. coli ATCC
25922. These bacteria were stored in a Brain-Heart-Infusion broth (BHI, Oxoid) containing
20% glycerol by volume and were kept at a temperature of -70 °C. S. aureus was propagated
onto Mannitol Salt agar (MSA, Oxoid) whereas E. coli was propagated on MacConkey agar
(MAC, Oxoid). In both cases there was a maximum of 2 subcultures at intervals of 14 days.
The procedure used is an adaptation of that used by Noimark et al. at the Materials Chemistry
Research Centre at University College London.309 BHI broth was inoculated with a single
colony before being cultured in air at 37 °C for 18 hours with shaking at 200 rpm. The mixture
was centrifuged and the pellet recovered and washed in PBS (10 mL). Further centrifugation
recovered the pellet again before the bacteria were re-suspended in PBS (10 mL). Thousand-
fold dilution of this suspension produced an inoculum of approx. 10-6 cfu mL-1. The inoculum
was confirmed by plating 10-fold serial dilutions on agar for viable counts.
Duplicates of each polymer sample type were inoculated with 25 mL of inoculum and covered
by a sterile cover slip. Samples were then either irradiated by white light (General Electric 28
W Misert T5 2D compact fluorescent lamp) or maintained in the dark for the same duration.
The light source emitted an average of 6600 ± 990 lux and was set a distance of 0.25 m away
from the samples.
Once irradiation was complete the samples and cover slips were added to PBS (450 mL) and
vortexed (20 s). The resultant suspension and 10-fold serial dilutions were plated on agar for
viable counts. Aerobic incubation of the plates at 37 °C for either 48 or 24 hours (S. aureus
and E. coli respectively) was carried out.

164
Each experiment used at least two technical replicates and was repeated three times.
Bacterial kill rates are expressed as a log reduction, where 1 log reduction = 90% bacteria
killed; 2 log reduction = 99% bacteria killed; 3 log reduction = 99.9% bacteria killed etc. The
statistical significance of the nanoparticle, dye and dye-nanoparticle samples vs. control in
both light and dark conditions was analysed in SPSS (IBM) using the Mann–Whitney U test.
4.4 Results and discussion
4.4.1 Nanoparticle synthesis
Gold and silver nanoparticles were synthesised by a modified Turkevich method. Gold
particles produced by this method were predominantly spherical in shape, well-formed and
regular. Particle size ranged from 8 nm-15 nm, with the average particle diameter found to
be 11 nm. Silver nanoparticles formed by analogous methodology were slightly larger on
average (~20 nm, though particles were not uniformly spherical) and occupied a much larger
range of particle diameters (5 – 40 nm). This disparity of size and shape between gold and
silver citrate-capped particles has been previously reported in literature.370 TEM images of
both citrate capped metallic nanoparticles are shown in Figure 4.1.
The gold nanoparticle solution produced using the citrate reduction method had a
characteristic deep red colouration. Silver nanoparticle solutions were a slightly cloudy
yellow. UV-vis studies on the solutions showed SPR peaks at 402 nm for silver and 519 nm
for gold (Figure 4.2).

165
Figure 4.1 TEM images showing A) citrate capped gold nanoparticles showing good uniformity of size and shape, and B) citrate-capped silver nanoparticles produced by the same method showing a greater spread of particle sizes and less regular shape.
Figure 4.2 Graphs showing the UV-vis spectra of A) citrate-capped gold nanoparticles, showing characteristic SPR band at 519 nm, and B) citrate-capped silver nanoparticles showing SPR band at 402 nm.
4.4.2 Polymer samples
10 x 10 mm squares of medical grade polyurethane were exposed to swelling solutions
containing a 9:1 ratio of acetone to aqueous nanoparticle solution. The polymer samples
were left in the swelling solution for 24 h, allowing the polymer matrix to expand and the
nanoparticles to diffuse into the bulk. Samples were allowed to dry at room temperature in
ambient light. Samples exposed to an acetone-gold nanoparticle swelling solution exhibited
a change in colour from translucent creamy white to pinkish, indicating successful
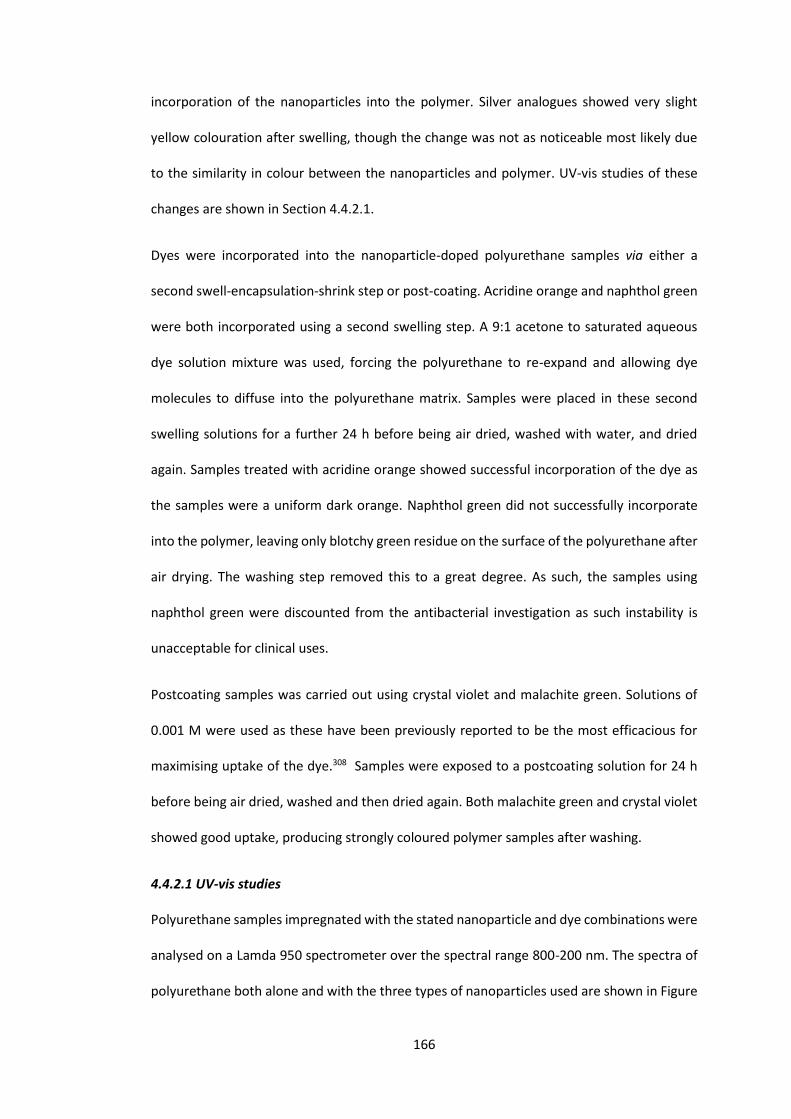
166
incorporation of the nanoparticles into the polymer. Silver analogues showed very slight
yellow colouration after swelling, though the change was not as noticeable most likely due
to the similarity in colour between the nanoparticles and polymer. UV-vis studies of these
changes are shown in Section 4.4.2.1.
Dyes were incorporated into the nanoparticle-doped polyurethane samples via either a
second swell-encapsulation-shrink step or post-coating. Acridine orange and naphthol green
were both incorporated using a second swelling step. A 9:1 acetone to saturated aqueous
dye solution mixture was used, forcing the polyurethane to re-expand and allowing dye
molecules to diffuse into the polyurethane matrix. Samples were placed in these second
swelling solutions for a further 24 h before being air dried, washed with water, and dried
again. Samples treated with acridine orange showed successful incorporation of the dye as
the samples were a uniform dark orange. Naphthol green did not successfully incorporate
into the polymer, leaving only blotchy green residue on the surface of the polyurethane after
air drying. The washing step removed this to a great degree. As such, the samples using
naphthol green were discounted from the antibacterial investigation as such instability is
unacceptable for clinical uses.
Postcoating samples was carried out using crystal violet and malachite green. Solutions of
0.001 M were used as these have been previously reported to be the most efficacious for
maximising uptake of the dye.308 Samples were exposed to a postcoating solution for 24 h
before being air dried, washed and then dried again. Both malachite green and crystal violet
showed good uptake, producing strongly coloured polymer samples after washing.
4.4.2.1 UV-vis studies
Polyurethane samples impregnated with the stated nanoparticle and dye combinations were
analysed on a Lamda 950 spectrometer over the spectral range 800-200 nm. The spectra of
polyurethane both alone and with the three types of nanoparticles used are shown in Figure

167
4.3. Addition of gold nanoparticles to the polyurethane substrate resulted in a defined, broad
peak forming at ~540 nm. This peak was found at a clear red shift (~20 nm) to the peak
observed in the UV-vis absorption spectrum of the same gold nanoparticles in solution, and
was also significantly broader. Addition of citrate-capped silver nanoparticles to
polyurethane increased absorption almost uniformly across all wavelengths but without
changing the shape of the absorption spectrum – no characteristic SPR peak was observed
(Figure 4.3; AgNPs, grey line).
Figure 4.3 Graph showing the UV-vis absorption spectra of (i) solvent-treated polyurethane, (ii) polyurethane with citrate-capped gold nanoparticles and (iii) polyurethane with citrate-capped silver nanoparticles.
Addition of dyes to polyurethane was either by a second swell-encapsulation-shrink step
(acridine orange; naphthol green) or by post-coating the samples in aqueous 0.1 M dye
solution (crystal violet; malachite green). Naphthol green failed to diffuse into the bulk of the
polymer; what little colouration was achieved was blotchy, sat on the surface of the
polyurethane square and was removed during the washing step. UV-vis analysis of
polyurethane treated with naphthol green showed no significant changes in the UV-vis
spectrum compared to polyurethane alone (Figure 4.4, pale green line). Conversely, samples
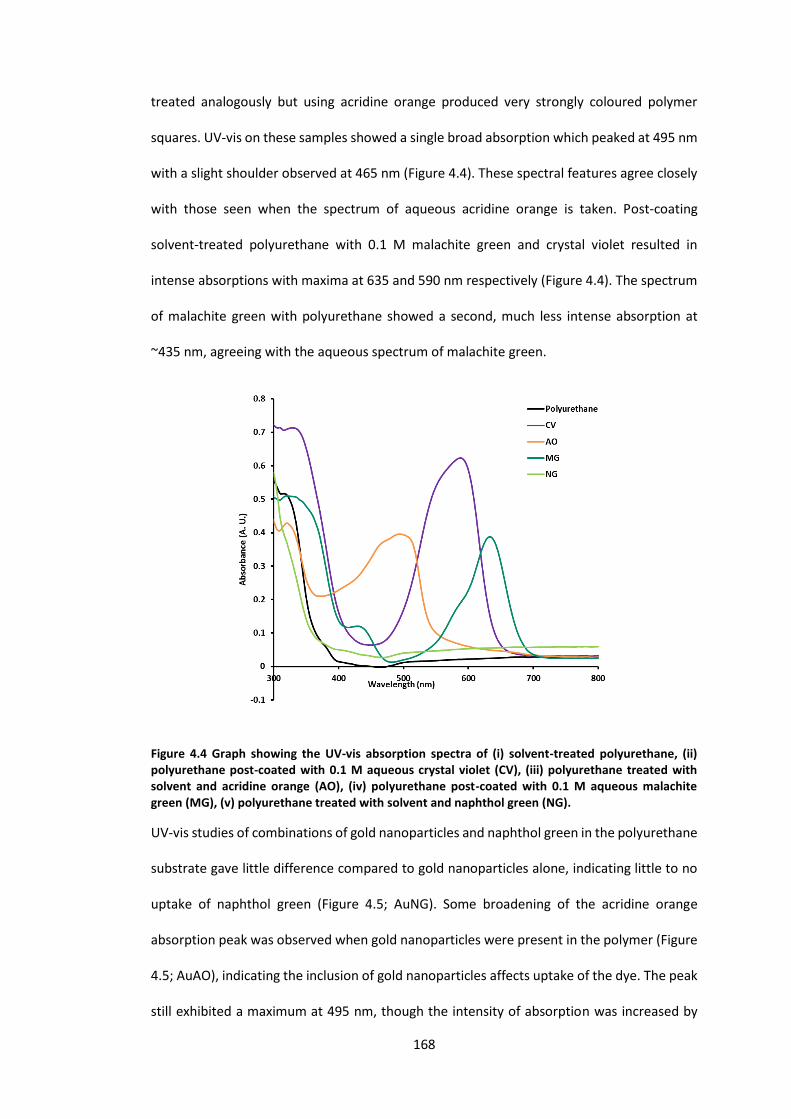
168
treated analogously but using acridine orange produced very strongly coloured polymer
squares. UV-vis on these samples showed a single broad absorption which peaked at 495 nm
with a slight shoulder observed at 465 nm (Figure 4.4). These spectral features agree closely
with those seen when the spectrum of aqueous acridine orange is taken. Post-coating
solvent-treated polyurethane with 0.1 M malachite green and crystal violet resulted in
intense absorptions with maxima at 635 and 590 nm respectively (Figure 4.4). The spectrum
of malachite green with polyurethane showed a second, much less intense absorption at
~435 nm, agreeing with the aqueous spectrum of malachite green.
Figure 4.4 Graph showing the UV-vis absorption spectra of (i) solvent-treated polyurethane, (ii) polyurethane post-coated with 0.1 M aqueous crystal violet (CV), (iii) polyurethane treated with solvent and acridine orange (AO), (iv) polyurethane post-coated with 0.1 M aqueous malachite green (MG), (v) polyurethane treated with solvent and naphthol green (NG).
UV-vis studies of combinations of gold nanoparticles and naphthol green in the polyurethane
substrate gave little difference compared to gold nanoparticles alone, indicating little to no
uptake of naphthol green (Figure 4.5; AuNG). Some broadening of the acridine orange
absorption peak was observed when gold nanoparticles were present in the polymer (Figure
4.5; AuAO), indicating the inclusion of gold nanoparticles affects uptake of the dye. The peak
still exhibited a maximum at 495 nm, though the intensity of absorption was increased by

169
approximately 0.75 A. U. Citrate-capped gold nanoparticles were shown to increase the
absorption of acridine orange in Chapter 3. Little difference was observed in the UV-vis
absorption spectrum of gold nanoparticle and crystal violet-modified polymers (Figure 4.5;
AuCV) compared to crystal violet-only samples (Figure 4.4; CV): maximum absorbance was
still located at 590 nm, no increase in maximum intensity was seen and peak morphology
remained very similar. Gold nanoparticle and malachite green-modified polyurethane (Figure
4.5; AuMG) too showed no shifting of the absorption peak compared to malachite green only
samples, but a large increase in maximum absorption (~0.2 A. U.) was observed.
Figure 4.5 Graph showing the UV-vis absorption spectra of (i) solvent-treated polyurethane with citrate-capped gold nanoparticles (AuNPs), (ii) polyurethane embedded with gold nanoparticles and post-coated with 0.1 M aqueous crystal violet (AuCV), (iii) polyurethane embedded with gold nanoparticles then treated with solvent and acridine orange (AuAO), (iv) polyurethane embedded with gold nanoparticles then post-coated with 0.1 M aqueous malachite green (AuMG), (v) polyurethane embedded with gold nanoparticles treated with solvent and naphthol green (AuNG).
UV-vis studies of silver nanoparticle embedded polymers with dyes showed similar results.
Broadening of the acridine orange peak around the expected maximum of 495 nm was seen
when combined with silver nanoparticles (Figure 4.6; AgAO), though no enhancement in the
absorption was recorded. The crystal violet and silver nanoparticle sample (Figure 4.6; AgCV)
showed the expected peak at 590 nm with little to no change in peak shape. Silver

170
nanoparticles and malachite green in polyurethane (Figure 4.6; AgMG) did not show
enhanced absorption of the dye as the analogous sample with gold nanoparticles did.
Naphthol green again failed to be taken into the silver-modified polymer and exhibited no
spectral changes compared to silver-polyurethane samples alone.
Figure 4.6 Graph showing the UV-vis absorption spectra of (i) solvent-treated polyurethane with citrate-capped silver nanoparticles (AuNPs), (ii) polyurethane embedded with silver nanoparticles and post-coated with 0.1 M aqueous crystal violet (AgCV), (iii) polyurethane embedded with silver nanoparticles then treated with solvent and acridine orange (AgAO), (iv) polyurethane embedded with silver nanoparticles then post-coated with 0.1 M aqueous malachite green (AgMG), (v) polyurethane embedded with silver nanoparticles treated with solvent and naphthol green (AgNG).
4.4.2.2 Water contact angle measurements
Only slight variation in water contact angles was observed on addition of dyes and
nanoparticles to polyurethane. Solvent-treated polyurethane (control) samples with no
additions gave a water contact angle of 98.6° (Figure 4.7a). The variation in angle ranged
from 99.3° for polyurethane containing silver particles and naphthol green (+0.7°; Figure
4.7b) to 81.8° for samples containing silver-citrate particles and malachite green (-16.8°;
Figure 4.7c), a total range of 17.5°. Though variation of the contact angles was small, the
trend was for a decrease in hydrophobicity on the addition of nanoparticles and dyes.

171
Such small variations in hydrophobicity are unlikely to adversely affect the tribological
properties of the polymers.371
Figure 4.7 Images showing the water contact angles achieved on (a) solvent treated polyurethane; (b) polyurethane containing silver particles and naphthol green; (c) polyurethane containing citrate-capped silver particles and malachite green.
4.4.3 Antibacterial testing
The antibacterial capabilities of the samples were tested against both E. coli (gram negative)
and S. aureus (gram positive), which were chosen as representative of common nosocomial
pathogens. The polymer samples were exposed to broad spectrum white light to imitate the
non-specific lighting found in an average hospital. Experiments were either 5 or 2 hours in
duration, and a set of identical samples was incubated for the same time frame in the dark
to provide a control. A summary of the samples used in this investigation can be found above
in Table 4.2.
4.4.3.1 Staphylococcus aureus
Figure 4.8 shows the lethal sensitization of S. aureus over five hours when exposed to
polyurethane samples containing i) nothing (control), ii) acridine orange, iii) malachite green
and iv) crystal violet. The black bar represents the initial bacterial count for reference. The
subsequent four bars represent the bacterial count after incubation of the samples in the
dark; the latter four (in repeated colours) the same four samples exposed to a white light
source for the same duration. It is clear that neither the control polymer nor any of the
samples with incorporated dyes achieved any bacterial kill when incubated in the dark. There

172
is a very slight reduction in bacterial numbers for the same samples exposed to the light
source, but the changes are so small as to be insignificant.
Figure 4.8 Graph showing viable counts of S. aureus after a 5 hour incubation on dye-modified polyurethane, incubated either in the dark or illuminated by a white light source (of 6600 ± 990 lux at a distance of 25 cm).
Incorporation of gold nanoparticles into the polyurethane samples gave more noticeable
results (Figure 4.9). Again, we see no bactericidal activity for the control polymer in either
dark or light conditions. Incorporation of gold nanoparticles into the polyurethane (yellow
bar; ‘Au only’) also showed no significant change in bacterial numbers in either condition.
Polyurethane containing a combination of gold nanoparticles with acridine orange (orange
bar; ‘AuAO’), however, showed a significant (p = 0.05, analysed using the Mann-Whitney U
test in SPSS) 1.5 log reduction of S. aureus when incubated in the dark for five hours.
Incubation of this sample under the white light source for the same duration reduced the
colony forming units per mL (cfu/mL) to below the detection limit of 100, inducing total kill
(p = 0.037). Samples containing gold nanoparticles and crystal violet (purple bar; ‘AuCV’) also
showed good photobactericidal activity, giving 1.2 log reduction in dark conditions and a
highly significant 2.5 log reduction under the light source over five hours. For both samples
p= 0.05. No reduction in bacterial numbers was observed for gold nanoparticles and
malachite green (green bar, ‘AuMG’) either in the light or dark.

173
Figure 4.9 Graph showing viable counts of S. aureus after a 5 hour incubation on gold nanoparticle and dye-modified polyurethane, incubated either in the dark or illuminated by a white light source (of 6600 ± 990 lux at a distance of 25 cm.). A dot indicates that the bacterial numbers were reduced below the detection limit of 100 cfu/mL for that sample.
A similar sample set but using silver nanoparticles rather than gold yielded even better
bactericidal results over five hours (Figure 4.10). Silver nanoparticles alone (grey bar; ‘Ag’)
showed no kill in either dark or light conditions. Combination of silver nanoparticles with
acridine orange, however, exhibited total kill (> 4 log reduction) in both dark and light. Silver
nanoparticles and crystal violet gave ~1.5 log reduction in the dark and total kill when
exposed to the white light source, p = 0.05 and 0.037 respectively. In stark contrast to the
analogous gold sample, malachite green and silver nanoparticles also showed
photobactericidal capabilities: 0.8 and 1.2 log reductions were recorded in the dark and light
respectively, both representing statistically significant results (p = 0.05 for both).
The bactericidal capabilities of the silver nanoparticle-acridine orange combination was so
marked that a 2 hour study was carried out, the results of which are shown in Figure 4.11.
Over a two hour experiment a significant (p = 0.05) 1.8 log reduction was achieved in the
dark, whilst total kill was again achieved by AgAO samples under the white light source. To
the best of our knowledge, the use of acridine orange in to kill bacteria has not been reported

174
before. Limited studies have shown the promise of acridine orange mediated PDT to treat
certain cancers,372–374 but no use of AO in antimicrobial surfaces is found in the literature. The
novelty, rapidity and efficacy of this system, therefore, presents a potentially excellent option
to fabricate commercial bactericidal polymers for medical usage.
Whilst excellent bactericidal results of dye-nanoparticle combinations under a white light
source are expected when using a photosensitizing dye, the significant reduction of bacterial
numbers in the dark is less easy to explain. In the case of silver nanoparticles being present
it is likely that the release of silver ions from the nanoparticle surface causes the cytotoxic
effect. Silver ion release is a well-studied phenomenon and destroys cells by the interaction
of Ag+ ions with thiol-containing groups and thus deactivates enzymes which are vital to the
cell’s survival and replication.284 Regarding gold, it is unclear why dark kill is observed with
certain dyes. Gold is not, to the best of our knowledge, known to undergo ion release in the
manner of silver. It is possible that the stronger interaction observed between gold
nanoparticles and cationic dyes (seen in Chapter 3) activates the dye in some way by
producing reactive sites, rendering the dye cytotoxic independently of photoactivity. Future
work on this topic could involve investigation of the bactericidal polymer after antimicrobial
assays were carried out to assess any changes to particle morphology that could give any
mechanistic clues. It is also potentially useful to repeat the antimicrobial testing with gold-
dye conjugates whilst making more efforts to block photons of all frequencies. It is feasible
that, though isolation from visible photons that would usually induce the expected
photochemical response was achieved, photons outside this portion of the spectrum could
still be impinging upon the gold-dye modified polymers. Increased isolation of the samples
from all frequencies of photons could establish whether introducing the gold nanoparticle to
the dye allows absorption of photons outside the visible spectrum which then produces a
similar singlet oxygen induced kill, or if the mechanism of dark kill in the gold-dye conjugates
is entirely unrelated to that phenomenon.

175
Figure 4.10 Graph showing viable counts of S. aureus after a 5 hour incubation on silver nanoparticle and dye-modified polyurethane, incubated either in the dark or illuminated by a white light source (of 6600 ± 990 lux at a distance of 25 cm.). A dot indicates that the bacterial numbers were reduced below the detection limit of 100 cfu/mL for that sample.
Figure 4.11 Graph showing viable counts of S. aureus after a 2 hour incubation on silver nanoparticle and acridine orange-modified polyurethane, incubated either in the dark or illuminated by a white light source (of 6600 ± 990 lux at a distance of 25 cm.). A dot indicates that the bacterial numbers were reduced below the detection limit of 100 cfu/mL for that sample.

176
4.4.3.2 E. coli
An identical sample set was tested against the gram-negative bacterium E. coli., as it is
important for potential bactericidal systems to be able to kill bacteria with both cell wall
types.
Figure 4.12 shows the lethal sensitization of E. coli over five hours when exposed to
polyurethane samples containing dyes alone. As before, the black bar represents the initial
bacterial count of the inoculum to give a reference point. Very little change in bacterial
numbers was observed for the control polymer, acridine orange or malachite green in either
dark or light conditions after a five hour incubation period. Crystal violet showed no
bactericidal capability in the dark, but when incubated in the light we observed a significant
~1.4 log reduction in viable E. coli counts (p =0.05).
Figure 4.12 Graph showing viable counts of E. coli after a 5 hour incubation on dye-modified polyurethane, incubated either in the dark or illuminated by a white light source (of 6600 ± 990 lux at a distance of 25 cm).
Introducing gold nanoparticles into the polymer with the dyes makes little different to
samples incubated in dark conditions (Figure 4.13). No significant reduction in viable E. coli
counts is observed for either gold nanoparticle-modified polymer or any of the gold

177
nanoparticle and dye-modified samples. Five hours’ incubation under a light source again
gave no significant change for gold particles alone or gold nanoparticles and malachite green.
We see a significant reduction in bacterial count for gold and crystal violet (~0.5 log
reduction; p = 0.05), though it is not large enough to be of substantial clinical use. Acridine
orange and gold nanoparticles shows the greatest bactericidal effect of this sample set,
showing a 1.1 log reduction in bacterial numbers (p = 0.05).
Figure 4.13 Graph showing viable counts of E. coli after a 5 hour incubation on gold nanoparticle and dye-modified polyurethane, incubated either in the dark or illuminated by a white light source (of 6600 ± 990 lux at a distance of 25 cm).
Silver nanoparticles in conjunction with the dyes gave excellent results after five hours
(Figure 4.14). Silver nanoparticle-modified polymer samples gave ~2.2 and 2.3 log reduction
in viable E. coli counts in the dark and light respectively. Combination of malachite green with
silver particles yielded a 2 log reduction in the dark and matched silver alone in the light,
reducing bacterial numbers by 2.3 log. Polymer samples containing silver nanoparticles and
crystal violet showed good activity in the dark (2.1 log reduction) and reduced the E. coli
cfu/mL to undetectable levels when exposed to a white light source. Acridine orange and
silver nanoparticle modified polyurethane was found to be capable of inducing total kill in

178
both dark and light conditions, a superb result that has not, to our knowledge, been reported
before. All samples modified with silver nanoparticles and any of the dyes in this study gave
a p value ≤0.05, indicating all results were statistically significant.
On the strength of the results for silver nanoparticles and both crystal violet and acridine
orange, a second antibacterial investigation was carried out with a shorter 2 hour duration
in order to assess the rapidity of the photobactericidal effect. The results of this are shown
in Figure 4.15. Though total kill was not achieved for either dye-silver particle combination,
significant kill rates were observed. Crystal violet and silver nanoparticles was observed to
give 1.3 and 2 log reduction in the dark and light respectively (p = 0.05). Acridine orange and
silver again exhibited excellent bactericidal activity, reducing viable E. coli counts by 1.3 log
after incubation in the dark and an impressive 3 log on exposure to the white light source for
2 hours (p = 0.05).
Figure 4.14 Graph showing viable counts of E. coli after a 5 hour incubation on silver nanoparticle and dye-modified polyurethane, incubated either in the dark or illuminated by a white light source (of 6600 ± 990 lux at a distance of 25 cm.). A dot indicates that the bacterial numbers were reduced below the detection limit of 100 cfu/mL for that sample.

179
If issues of potential toxicity can be satisfactorily addressed, acridine orange and silver
nanoparticle impregnated polymers could offer powerful assistance in maintaining low
bacterial counts on ‘reservoir’ surfaces in hospitals, cutting the risk of spreading nosocomial
infections. Not only would this represent large monetary savings for the healthcare industry
it would help to reduce the need to prescribe large quantities of antibiotics, helping to slow
the rate of antibiotic-resistant mutations occurring in common pathogens. Their non-
specificity in terms of light source makes them good candidates for installation in the average
hospital, as previous antibacterial polymers have required laser illumination to induce
significant bacterial kill. The potent dark kill exhibited by the system also makes them an
option to be utilised in devices such as catheters, where formation of a biofilm on the device-
body interface is responsible for large numbers of infections.307,375
Figure 4.15 Graph showing viable counts of E. coli after a 2 hour incubation on silver nanoparticle and dye-modified polyurethane, incubated either in the dark or illuminated by a white light source (of 6600 ± 990 lux at a distance of 25 cm.).
4.5 Conclusions
Gold and silver nanoparticles were successfully synthesised via a modified Turkevich
synthesis. These nanoparticles were incorporated into 10 x 10 mm squares of medical-grade
180
polyurethane using a swell-encapsulation-shrink method. Dyes were added to the samples
either by a second swell-encapsulation-shrink step (acridine orange and naphthol green) or
by postcoating (malachite green and crystal violet). Naphthol green failed to incorporate into
the polyurethane samples, but the other three dyes studied gave good colouration as studied
by UV-vis. Water contact angle measurements showed that the wetting properties of the
polymers remained largely unchanged after incorporation of nanoparticles and dyes.
Antibacterial testing of all samples was carried out against gram negative E. coli and gram
positive S. aureus. The presence of dyes only in the polymer was insufficient to induce
bacterial kill in either dark or light conditions against S. aureus or E. coli. Gold nanoparticle-
only samples failed to show any activity against either bacterium. Silver nanoparticle-only
samples showed good (2.2 log reduction over 5 hours) activity against gram negative E. coli
but failed to induce kill against S. aureus.
Combination of dyes with nanoparticles, however, gave good antimicrobial results. Crystal
violet with silver nanoparticles induced 1.5 log reduction of S. aureus in the dark and total kill
under a light source after five hours. The same sample produced a 2 log reduction in the dark
against E. coli and total kill in light. Crystal violet has been previously reported to be an
excellent LAAA and has been successfully incorporated into polymers previously, though to
the best of our knowledge has not been combined with silver nanoparticles for this purpose.
Acridine orange in combination with gold nanoparticles gave 1.5 log reduction of viable S.
aureus counts in the dark after 5 hours, and total kill in the same time frame under a white
light source. 1.1 log reduction in the light was seen for AuAO samples against E. coli.
Combination of acridine orange with silver nanoparticles gave total kill against S. aureus and
E. coli in both light and dark conditions within 5 hours. Moreover, further investigations on
AgAO samples over a shorter 2 hour time frame gave reductions in bacterial numbers of 1.2
and 1.8 log in the dark and 3 log and total kill in the light against E. coli and S. aureus

181
respectively. To the best of our knowledge, this is the first reported incidence of acridine
orange being used to make antimicrobial polymers, either in combination with nanoparticles
or alone. The rapidity and strength of the demonstrated photobactericidal effect combined
with good dark kill ability makes the combination of silver nanoparticles with acridine orange
a powerful option for potential applications in the healthcare sector, where promptness of
bactericidal response and ability to remain functional in sub-optimal, non-specialised lighting
conditions is paramount.

182
CHAPTER 5 : CONCLUDING REMARKS
5.1 Synthesis of gold and silver nanoparticles
Successful synthesis of gold and silver citrate-stabilised nanoparticles was achieved using a
Turkevich method. Gold nanoparticles synthesised in this manner were regular in shape and
size, forming defined spheres with an average diameter of 11 nm, recorded using TEM and
Zetasizer measurements. Particle size varied across the range 10-15 nm and the solutions
had the characteristic deep red colour of gold colloids. Silver nanoparticles synthesised by
this method were less regular, being mostly spherical but with some ellipsoids and non-
spherical particles too. The range of particle sizes was much greater than gold, ranging from
5-40 nm. Solutions were a pale yellow. The less well-formed particles and larger variation for
silver particles synthesised in this way agrees with literature, which records a less tightly
grouped range of sizes for silver nanoparticles made using the citrate reduction method than
gold.324 Citrate-capped silver-gold particles of varying molar ratios were successfully
synthesised by the same method. Though facile, the synthesis of these particles showed
disparity in colour of resultant solutions of the same molar ratios and variation in the position
of the SPR bands. No relationship between the ratio of gold to silver and position of the SPR
band was drawn, indicating the particles were neither a true alloy nor had a true core-shell
structure.
Synthesis of tiopronin-capped silver particles via a borohydride was also achieved. Particles
obtained using this methodology were small (average diameter 6 nm) and spherical, though
variation in size of particles was observed. High aspect ratio chains of these nanoparticles
were obtained by sonication of small quantities of the dried nanoparticle powder (0.5
mg/mL) in deionised water for 2 hours upwards. Particles in chains were smaller on average

183
(~4 nm) and had a narrower size distribution than in the as-prepared samples, a phenomenon
attributed to digestive ripening during the sonication step.
CTAB-stabilised gold nanorods were synthesised, though average aspect ratio was quite short
(<2). Nevertheless the rods showed defined cylindrical shape and definite anisotropic growth
patterns.
5.2 Interaction of gold and silver nanoparticles with anionic and cationic
dyes
It was shown that gold nanoparticles interact strongly with all the cationic dyes used in this
study. Titration of cationic dyes and gold particles triggered aggregation of the nanoparticles
into large arrays spanning hundreds of nanometres across. This physical observation was
accompanied by a new peak developing on the UV-vis spectra of the dye-nanoparticle
mixture at a large red shift characteristic of increasing effective particle size. In three cases
enhanced absorption of this new peak was observed: for gold-toluidine blue (which was
reported in literature),43 gold-crystal violet and gold-acridine orange systems. This
phenomenon has not been previously reported in literature for these combinations to the
best of our knowledge.
Titration of anionic dyes with gold nanoparticles failed to produce similar results – no
aggregation was observed, the red shifted peak did not appear on the UV-vis spectra during
titration experiments and no enhanced absorption was seen. It is clear then that the
assertion in literature that aggregation of the nanoparticles when dyes are added is a
function of the ionic strength of the solution is not true. This was supported by the titration
of isomolar potassium chloride with nanoparticles in place of the dyes, resulting in no
aggregation. The charge on the dye molecules is therefore crucial in triggering or preventing
aggregation due to electrostatic repulsion or attraction between the dye molecule and the
negatively charged citrate shell surrounding the particle.
184
Silver nanoparticles made by the citrate reduction method showed no interaction with
cationic or anionic dyes when titrated against them. It is postulated that the lower affinity of
gold for oxygen (Au-O bond energy is 223 kJ mol-1 compared to 238 kJ mol-1 for Ag-O) results
in the capping citrate ligands, which coordinate through an oxygen atom, to be less strongly
bound to the surface of the gold particles than the silver. Thus it is probable that ligand
exchange with amine group containing dyes is favourable for gold particles but not for silver,
causing silver not to exhibit the aggregation behaviour observed with cationic dyes and gold
particles.
Bimetallic particles synthesised in an analogous way behaved unpredictably, with no
observable pattern to the obtained results. It is suggested that the erratic behaviour of the
silver-gold particles is a result of the variation in size, shape and surface composition
obtained using this synthesis.
Tiopronin-capped silver particles showed no interaction with either anionic or cationic dyes.
It is suggested that the additional energy required to overcome hydrogen bonding between
the structural thiolate chains makes ligand exchange unfavourable. Branched gold
nanocrystals also failed to interact with either dye type, thought to be a result of strong
covalent gold-sulphur bonds present between the directing HEPES molecules and the gold
surface. Nanorods failed to interact with cationic dyes but showed marginal interaction with
anionic naphthol green, likely a result of the positively-charged CTAB capping layer allowing
interaction between negatively charged naphthol green molecules and the surface.
5.3 Incorporation of dyes and nanoparticles into polyurethane for
antimicrobial surfaces
Successful incorporation of citrate capped gold and silver nanoparticles and tiopronin-
capped silver nanoparticles into medical grade polyurethane was achieved via a swell-
encapsulation-shrink method. These samples were then either postcoated with crystal violet

185
or malachite green or underwent a second swell-encapsulation-shrink step to incorporate
acridine orange or naphthol green into the polymer matrix. Crystal violet, malachite green
and acridine orange were successfully introduced into the polyurethane, whereas naphthol
green failed to incorporate, forming faint greenish blotches on the surface which were
removed in the washing step. UV-vis studies showed clear peaks at the characteristic
wavelengths of the three former dyes. Water contact angle measurements showed that the
tribological properties of the polyurethane remained largely the same after treatment with
nanoparticles and dyes, an important result if the polymers are potentially to be used in
applications which necessitate contact with the body such as catheters.
Antimicrobial testing of these samples was carried out against both gram negative E. coli and
gram positive S. aureus. Samples of polyurethane containing dyes only did not induce
bacterial kill against either organism in either light or dark conditions. Samples containing
citrate capped gold nanoparticles only also did not record any antibacterial activity. Citrate
capped silver nanoparticles, however, showed a 2.2 log reduction of bacterial numbers
against gram negative E. coli over a period of five hours though failed to kill S. aureus.
Conversely, combination of citrate capped nanoparticles with the dyes gave good bacterial
kill. Polyurethane containing crystal violet and silver nanoparticles gave 1.5 log reduction in
S. aureus numbers in the dark and complete kill under a white light source over a five hour
time span. The same combination gave a 2 log reduction in the dark and complete kill in the
light against E. coli. Though crystal violet is a well-known photosensitizer and has been added
to polymers for medical applications before,309 to the best of our knowledge this is the first
time it has been combined with silver nanoparticles for antimicrobial purposes.
Excellent results were obtained using acridine orange with citrate-capped particles.
Conjugation with gold particles gave total kill and 1.5 log reduction against S. aureus in five
hours under dark and light conditions respectively. ~1 log reduction of viable E. coli counts

186
was observed for the same sample under white light. Acridine orange and silver
nanoparticles, however, gave total kill against both bacterial species in both light and dark
conditions in five hours. Excitingly, total kill was also achieved by this sample over just two
hours against S. aureus. 1.8 log reduction was seen in the dark. Good kills of 1.2 and 3 log in
the dark and light respectively was observed for AgAO samples against E. coli. This represents
the first report of acridine orange being used to make antimicrobial surfaces, either with or
without nanoparticles. The rapidity of the effect – achieving excellent kills over just two hours
under a normal white light source – and the potent dark kill ability of this combination offers
an excellent tool in medical settings, where its demonstrated power for killing both gram
negative and gram positive organisms under non-specialised lighting could be of great use.
5.4 Future work
Though a commonly used biological stain, relatively little is known about the toxicity of
acridine orange to humans. It is classified as ‘harmful by contact, ingestion and inhalation’,
though little is known about any possible mutagenic and teratogenic effects. As such, it is
crucial to perform extensive leaching testing on polymers impregnated with acridine orange
that are intended for any use where they will be in contact with humans.
Further antimicrobial testing against other common nosocomial pathogens should be
undertaken to ensure that silver-acridine orange modified polyurethane presents a broad
spectrum solution to fabrication of antimicrobial surfaces. Work pertaining to the origin of
dark kill seen in gold samples – such as isolation of the samples from a greater range of
photons and investigation of the samples post-bacterial kill – should be undertaken to
ascertain the mechanism at work.
Further work would be useful to optimise the size of the nanoparticles incorporated into the
polymers before adding dyes. Studies have shown that the size of the nanoparticle
conjugated with the dye can have significant effects of the activity of the system as a

187
whole.305 Studies by Noimark et al. suggest that 2 nm gold particles are optimal for enhancing
the photoactivity of crystal violet.309 Such small particles are harder to make and less stable
than their larger cousins, used here for ease of synthesis. However, if the activity of the silver-
acridine orange system could be enhanced to show total kill against gram-positive and gram-
negative pathogens within 2 hours in ambient lighting, it would certainly present a strong
competitor for fabrication of bactericidal surfaces.
High resolution XRD could be used to elucidate the true structure of the gold-silver hybrid
particles obtained via the citrate reduction method. Understanding of the structures
obtained on an atomic level could help tailor future syntheses to produce the desired result.
Work to investigate the nature of the dye-nanoparticle interaction and therefore the origin
of enhanced absorption of some dyes vs. others should be undertaken. DFT calculations
could provide insight into the dye-nanoparticles bond, whereas more work on TCSPC could
show how combination of a nanoparticle with a dye alters the excitement and relaxation of
the dye in question. Understanding the nature of this interaction would enable theoretical
prediction of dyes that exhibit such behaviour and potential tuning of the interactions
observed.
188
Bibliography
1 M. Auffan, J. Rose, J.-Y. Bottero, G. V. Lowry, J.-P. Jolivet and M. R. Wiesner, Nat.
Nanotechnol., 2009, 4, 634–641.
2 G. Walters, I. P. Parkin, R. Palgrave, I. P. Parkin, S. W. Han, C. Goyes, Y. Jestin, M. L.
Mattarelli, M. Montagna, G. N. Conti, S. Pelli, G. C. Righini, C. Tosello and K. C.
Vishunubhatla, J. Mater. Chem., 2009, 19, 574–590.
3 J.-Y. Bottero, J. Rose and M. R. Wiesner, Integr. Environ. Assess. Manag., 2006, 2, 391–
395.
4 D. F. Emerich and C. G. Thanos, Biomol. Eng., 2006, 23, 171–184.
5 A. K. Gupta and M. Gupta, Biomaterials, 2005, 26, 3995–4021.
6 J. Jolivet, C. Froidefond and A. Pottier, J. Mater., 2004.
7 E. Baudrin, S. Cassaignon, M. Koelsch, J.-P. Jolivet, L. Dupont and J.-M. Tarascon, 2006.
8 R. Lamber, S. Wetjen and N. I. Jaeger, Phys. Rev. B, 1995, 51, 10968–10971.
9 P. Ayyub, V. R. Palkar, S. Chattopadhyay and M. Multani, Phys. Rev. B, 1995.
10 M. Zhang, M. Y. Efremov, F. Schiettekatte, E. A. Olson, A. T. Kwan, S. L. Lai, T. Wisleder,
J. E. Greene and L. H. Allen, Phys. Rev. B, 2000, 62, 10548–10557.
11 S. L. Lai, J. Y. Guo, V. Petrova, G. Ramanath and L. H. Allen, Phys. Rev. Lett., 1996, 77,
99–102.
12 Z. X. Tang, C. M. Sorensen, K. J. Klabunde and G. C. Hadjipanayis, Phys. Rev. Lett., 1991,
67, 3602–3605.
13 S. M. Selbach, T. Tybell, M.-A. Einarsrud and T. Grande, Chem. Mater., 2007, 19, 6478–
6484.

189
14 S. Shetty, V. R. Palkar and R. Pinto, in Pramana - Journal of Physics, 2002.
15 R. Narayanan and M. A. El-Sayed, J. Phys. Chem. B, 2005, 109, 12663–12676.
16 E. Hao, G. C. Schatz and J. T. Hupp, J. Fluoresc., 2004, 14, 331–341.
17 S. Eustis and M. A. El-Sayed, Chem. Soc. Rev., 2006, 35, 209–217.
18 B. Khlebtsov, V. Zharov, A. Melnikov, V. Tuchin and N. Khlebtsov, Nanotechnology,
2006, 17, 5167.
19 S. Link and M. A. El-Sayed, J. Phys. Chem. B, 1999, 103, 4212–4217.
20 X. Huang and M. A. El-Sayed, J. Adv. Res., 2010, 1, 13–28.
21 X. Liu, M. Atwater, J. Wang and Q. Huo, Colloids Surfaces B Biointerfaces, 2007, 58, 3–
7.
22 M. H. V. Werts, M. Lambert, J.-P. Bourgoin and M. Brust, Nano Lett., 2002, 2, 43–47.
23 P. M. Mendes, S. Jacke, K. Critchley, J. Plaza, Y. Chen, K. Nikitin, R. E. Palmer, J. A.
Preece, S. D. Evans and D. Fitzmaurice, Langmuir, 2004, 20, 3766–3768.
24 J. Li, K. Kamata and T. Iyoda, Thin Solid Films, 2008, 516, 2577–2581.
25 S. Sun, P. Mendes, K. Critchley, S. Diegoli, M. Hanwell, S. D. Evans, G. J. Leggett, J. A.
Preece and T. H. Richardson, Nano Lett., 2006, 6, 345–350.
26 C. L. Haynes and R. P. Van Duyne, J. Phys. Chem. B, 2001, 105, 5599–5611.
27 E. M. Hicks, S. Zou, G. C. Schatz, K. G. Spears, R. P. Van Duyne, L. Gunnarsson, T.
Rindzevicius, B. Kasemo and M. Käll, Nano Lett., 2005, 5, 1065–1070.
28 J. Kimling, M. Maier, B. Okenve, V. Kotaidis, H. Ballot and A. Plech, J. Phys. Chem. B,
2006, 110, 15700–15707.
29 J. Zhou, J. Ralston, R. Sedev and D. A. Beattie, J. Colloid Interface Sci., 2009, 331, 251–
190
262.
30 Y. Sun and Y. Xia, Science, 2002, 298, 2176–9.
31 B. Nikoobakht and M. A. El-Sayed, Chem. Mater., 2003, 15, 1957–1962.
32 F. Kim, S. Connor, H. Song, T. Kuykendall and P. Yang, Angew. Chemie, 2004, 116,
3759–3763.
33 Y. Kondo and K. Takayanagi, Science, 2000, 289, 606–8.
34 R. T. Senger, S. Dag and S. Ciraci, Phys. Rev. Lett., 2004, 93, 196807.
35 P. Senthil Kumar, I. Pastoriza-Santos, B. Rodríguez-González, F. Javier García de Abajo
and L. M. Liz-Marzán, Nanotechnology, 2008, 19, 15606.
36 J. Turkevich, P. C. Stevenson and J. Hillier, J. Phys. Chem., 1953, 57, 670–673.
37 Z. S. Pillai and P. V Kamat, J. Phys. Chem. B, 2003, 108, 945–951.
38 A. Rohiman, I. Anshori, A. Surawijaya, I. Idris, F. Iskandar and M. Abdullah, in THE 4TH
NANOSCIENCE AND NANOTECHNOLOGY SYMPOSIUM (NNS2011): An International
Symposium, AIP Publishing, 2011, vol. 1415, pp. 39–42.
39 X. Ji, X. Song, J. Li, Y. Bai, W. Yang and X. Peng, J. Am. Chem. Soc., 2007, 129, 13939–
13948.
40 G. Frens, Kolloid-Zeitschrift und Zeitschrift für Polym., 1972, 250, 736–741.
41 J. W. Slot and H. J. Geuze, Eur. J. Cell Biol., 1985, 38, 87–93.
42 C. J. Sandroff and D. R. Herschbach, Langmuir, 1985, 1, 131–135.
43 N. Narband, M. Uppal, C. W. Dunnill, G. Hyett, M. Wilson and I. P. Parkin, Phys. Chem.
Chem. Phys., 2009, 11, 10513–10518.
44 C. J. Murphy, T. K. Sau, A. M. Gole, C. J. Orendorff, J. Gao, L. Gou, S. E. Hunyadi and T.
191
Li, J. Phys. Chem. B, 2005, 109, 13857–13870.
45 A. Gole and C. J. Murphy, Chem. Mater., 2004, 16, 3633–3640.
46 C. J. Johnson, E. Dujardin, S. A. Davis, C. J. Murphy and S. Mann, J. Mater. Chem., 2002,
12, 1765–1770.
47 M. Brust, M. Walker, D. Bethell, D. J. Schiffrin and R. Whyman, J. Chem. Soc., Chem.
Commun., 1994, 0, 801–802.
48 K. L. Kelly, E. Coronado, L. L. Zhao and G. C. Schatz, J. Phys. Chem. B, 2003, 107, 668–
677.
49 L. Guo, S. Yang, C. Yang, P. Yu, J. Wang, W. Ge and G. K. L. Wong, Appl. Phys. Lett.,
2000, 76, 2901.
50 I. O. Sosa, C. Noguez and R. G. Barrera, J. Phys. Chem. B, 2003, 107, 6269–6275.
51 W. P. Zhou, A. Lewera, R. Larsen, R. I. Masel, P. S. Bagus and A. Wieckowski, J. Phys.
Chem. B, 2006, 110, 13393–8.
52 S.-J. Park, A. A. Lazarides, C. A. Mirkin, P. W. Brazis, C. R. Kannewurf and R. L. Letsinger,
Angew. Chemie, 2000, 39, 3845–3848.
53 D. L. Leslie-Pelecky and R. D. Rieke, Chem. Mater., 1996, 8, 1770–1783.
54 M.-C. Daniel, J. Ruiz and D. Astruc, J. Am. Chem. Soc., 2003, 125, 1150–1.
55 Z.-J. Jiang, C.-Y. Liu and L.-W. Sun, J. Phys. Chem. B, 2005, 109, 1730–5.
56 R. M. Rioux, H. Song, M. Grass, S. Habas, K. Niesz, J. D. Hoefelmeyer, P. Yang and G. A.
Somorjai, Top. Catal., 2006, 39, 167–174.
57 C. B. Murray, C. R. Kagan and M. G. Bawendi, Annu. Rev. Mater. Sci., 2000, 30, 545–
610.

192
58 C. P. Collier, T. Vossmeyer and J. R. Heath, Annu. Rev. Phys. Chem., 1998, 49, 371–404.
59 M. P. Pileni, J. Phys. Chem. B, 2001, 105, 3358–3371.
60 N. A. Kotov, F. C. Meldrum, C. Wu and J. H. Fendler, J. Phys. Chem., 1994, 98, 2735–
2738.
61 J. Hu, T. W. Odom and C. M. Lieber, Acc. Chem. Res., 1999, 32, 435–445.
62 S. A. Maier, P. G. Kik, H. A. Atwater, S. Meltzer, E. Harel, B. E. Koel and A. A. G.
Requicha, Nat. Mater., 2003, 2, 229–232.
63 S. A. Maier, M. L. Brongersma, P. G. Kik, S. Meltzer, A. A. G. Requicha, B. E. Koel and
H. A. Atwater, Adv. Mater., 2003, 15, 562.
64 J.-Y. Bigot, J.-Y. Merle, O. Cregut and A. Daunois, Phys. Rev. Lett., 1995, 75, 4702–4705.
65 G. H. Chan, J. Zhao, E. M. Hicks, G. C. Schatz and R. P. Van Duyne, Nano Lett., 2007, 7,
1947–1952.
66 T. R. Jensen, M. D. Malinsky, C. L. Haynes and R. P. Van Duyne, J. Phys. Chem. B, 2000,
104, 10549–10556.
67 L. J. Sherry, S.-H. Chang, G. C. Schatz, R. P. Van Duyne, B. J. Wiley and Y. Xia, Nano
Lett., 2005, 5, 2034–2038.
68 B. J. Wiley, S. H. Im, Z.-Y. Li, J. McLellan, A. Siekkinen and Y. Xia, J. Phys. Chem. B, 2006,
110, 15666–15675.
69 L. J. Sherry, R. Jin, C. A. Mirkin, G. C. Schatz and R. P. Van Duyne, Nano Lett., 2006, 6,
2060–5.
70 T. Klar, M. Perner, S. Grosse, G. Von Plessen, W. Spirkl and J. Feldmann, Phys. Rev.
Lett., 1998, 80, 4249–4252.

193
71 M. Perner, P. Bost, U. Lemmer, G. Von Plessen, J. Feldmann, U. Becker, M. Mennig,
M. Schmitt and H. Schmidt, Phys. Rev. Lett., 1997, 78, 2192–2195.
72 T. Shimada, K. Ookubo, N. Komuro, T. Shimizu and N. Uehara, Langmuir, 2007, 23,
11225–32.
73 S. K. Ghosh and T. Pal, Chem. Rev., 2007, 107, 4797–862.
74 Z. Nie, A. Petukhova and E. Kumacheva, Nat. Nanotechnol., 2010, 5, 15–25.
75 E. M. Conwell, Proc. Natl. Acad. Sci. U. S. A., 2005, 102, 8795–9.
76 N. C. Seeman, Nature, 2003, 421, 427–31.
77 J. Richter, Phys. E Low-dimensional Syst. Nanostructures, 2003, 16, 157–173.
78 A. P. Alivisatos, K. P. Johnsson, X. Peng, T. E. Wilson, C. J. Loweth, M. P. Bruchez and
P. G. Schultz, 1996.
79 Z. Deng, Y. Tian, S.-H. Lee, A. E. Ribbe and C. Mao, Angew. Chemie, 2005, 117, 3648–
3651.
80 D. Liu, S. L. Daubendiek, M. A. Zillman, K. Ryan and E. T. Kool, J. Am. Chem. Soc., 1996,
118, 1587–1594.
81 E. Braun, Y. Eichen, U. Sivan and G. Ben-Yoseph, Nature, 1998, 391, 775–778.
82 K. Keren, M. Krueger, R. Gilad, G. Ben-Yoseph, U. Sivan and E. Braun, Science (80-. ).,
2002, 297, 72–75.
83 D. Coomber, D. Bartczak, S. R. Gerrard, S. Tyas, A. G. Kanaras and E. Stulz, Langmuir,
2010, 26, 13760–13762.
84 W. Cheng, M. J. Campolongo, J. J. Cha, S. J. Tan, C. C. Umbach, D. A. Muller and D. Luo,
Nat. Mater., 2009, 8, 519–525.
194
85 W. E. Ford, O. Harnack, A. Yasuda and J. M. Wessels, Adv. Mater., 2001, 13, 1793–
1797.
86 K. Nguyen, M. Monteverde, A. Filoramo, L. Goux-Capes, S. Lyonnais, P. Jegou, P. Viel,
M. Goffman and J.-P. Bourgoin, Adv. Mater., 2008, 20, 1099–1104.
87 J. D. Le, Y. Pinto, N. C. Seeman, K. Musier-Forsyth, T. A. Taton and R. A. Kiehl, Nano
Lett., 2004, 4, 2343–2347.
88 Y. Y. Pinto, J. D. Le, N. C. Seeman, K. Musier-Forsyth, T. A. Taton and R. A. Kiehl, Nano
Lett., 2005, 5, 2399–402.
89 J. D. Le, Y. Pinto, N. C. Seeman, K. Musier-Forsyth, T. A. Taton and R. A. Kiehl, Nano
Lett., 2004, 4, 2343–2347.
90 T. Ohshiro, T. Zako, R. Watanabe-Tamaki, T. Tanaka and M. Maeda, Chem. Commun.,
2010, 46, 6132–6134.
91 X. Fu, Y. Wang, L. Huang, Y. Sha, L. Gui, L. Lai and Y. Tang, Adv. Mater., 2003, 15, 902–
906.
92 M. G. Ryadnov and D. N. Woolfson, J. Am. Chem. Soc., 2004, 126, 7454–7455.
93 D. Walsh, L. Arcelli, T. Ikoma, J. Tanaka and S. Mann, Nat. Mater., 2003, 2, 386–390.
94 X. Fu, Y. Wang, L. Huang, Y. Sha, L. Gui, L. Lai and Y. Tang, Adv. Mater., 2003, 15, 902–
906.
95 E. Dujardin, C. Peet, G. Stubbs, J. N. Culver and S. Mann, Nano Lett., 2003, 3, 413–417.
96 Y. Huang, C.-Y. Chiang, S. K. Lee, Y. Gao, E. L. Hu, J. De Yoreo and A. M. Belcher, Nano
Lett., 2005, 5, 1429–1434.
97 C. Mao, C. E. Flynn, A. Hayhurst, R. Sweeney, J. Qi, G. Georgiou, B. Iverson and A. M.

195
Belcher, Proc. Natl. Acad. Sci. U. S. A., 2003, 100, 6946–51.
98 S.-W. Lee, C. Mao, C. E. Flynn and A. M. Belcher, Science, 2002, 296, 892–5.
99 O. K. Zahr and A. S. Blum, Nano Lett., 2012, 12, 629–33.
100 R. Djalali, Y. Chen and H. Matsui, J. Am. Chem. Soc., 2002, 124, 13660–13661.
101 S. Behrens, K. Rahn, W. Habicht, K.-J. Böhm, H. Rösner, E. Dinjus and E. Unger, Adv.
Mater., 2002, 14, 1621–1625.
102 S. Drescher, G. Hempel, W. H. Binder, B. Dobner, A. Blume and A. Meister, Langmuir,
2012, 28, 11615–24.
103 C. Mao, D. J. Solis, B. D. Reiss, S. T. Kottmann, R. Y. Sweeney, A. Hayhurst, G. Georgiou,
B. Iverson and A. M. Belcher, Science, 2004, 303, 213–7.
104 T. Scheibel, R. Parthasarathy, G. Sawicki, X.-M. Lin, H. Jaeger and S. L. Lindquist, Proc.
Natl. Acad. Sci. U. S. A., 2003, 100, 4527–32.
105 J. He, T. Kunitake and A. Nakao, Chem. Mater., 2003, 15, 4401–4406.
106 S. Iijima and T. Ichihashi, Nature, 1993, 363, 603–605.
107 S. C. Tsang, Y. K. Chen, P. J. F. Harris and M. L. H. Green, Nature, 1994, 372, 159–162.
108 D. Ugarte, T. Stöckli, J. M. Bonard, A. Châtelain and W. A. de Heer, Appl. Phys. A Mater.
Sci. Process., 1998, 67, 101–105.
109 S. Fullam, D. Cottell, H. Rensmo and D. Fitzmaurice, Adv. Mater., 2000, 12, 1430–1432.
110 M. J. Moghaddam, S. Taylor, M. Gao, S. Huang, L. Dai and M. J. McCall, Nano Lett.,
2004, 4, 89–93.
111 A. V. Ellis, K. Vijayamohanan, R. Goswami, N. Chakrapani, L. S. Ramanathan, P. M.
Ajayan and G. Ramanath, Nano Lett., 2003, 3, 279–282.

196
112 M. Quintana, X. Ke, G. Van Tendeloo, M. Meneghetti, C. Bittencourt and M. Prato, ACS
Nano, 2010, 4, 6105–13.
113 Y.-P. Sun, W. Huang, Y. Lin, K. Fu, A. Kitaygorodskiy, L. A. Riddle, Y. J. Yu and D. L.
Carroll, Chem. Mater., 2001, 13, 2864–2869.
114 S. Hrapovic, Y. Liu, K. B. Male and J. H. T. Luong, Anal. Chem., 2004, 76, 1083–8.
115 M. Endo, Y. A. Kim, M. Ezaka, K. Osada, T. Yanagisawa, T. Hayashi, M. Terrones and M.
S. Dresselhaus, Nano Lett., 2003, 3, 723–726.
116 Y. Mu, H. Liang, J. Hu, L. Jiang and L. Wan, J. Phys. Chem. B, 2005, 109, 22212–6.
117 L.-M. Ang, T. S. A. Hor, G.-Q. Xu, C. Tung, S. Zhao and J. L. S. Wang, Chem. Mater.,
1999, 11, 2115–2118.
118 K. B. Male, S. Hrapovic, Y. Liu, D. Wang and J. H. . Luong, Anal. Chim. Acta, 2004, 516,
35–41.
119 R. Giordano, P. Serp, P. Kalck, Y. Kihn, J. Schreiber, C. Marhic and J.-L. Duvail, Eur. J.
Inorg. Chem., 2003, 2003, 610–617.
120 R. Larciprete, S. Lizzit, L. Petaccia and A. Goldoni, Appl. Phys. Lett., 2006, 88, 243111.
121 B. M. Quinn, C. Dekker and S. G. Lemay, J. Am. Chem. Soc., 2005, 127, 6146–6147.
122 M. Ding, D. C. Sorescu, G. P. Kotchey and A. Star, J. Am. Chem. Soc., 2012, 134, 3472–
9.
123 T. O. Hutchinson, Y.-P. Liu, C. Kiely, C. J. Kiely and M. Brust, Adv. Mater., 2001, 13,
1800–1803.
124 E. Fort, C. Ricolleau and J. Sau-Pueyo, Nano Lett., 2003, 3, 65–67.
125 E. C. Walter, B. J. Murray, F. Favier, G. Kaltenpoth, M. Grunze and R. M. Penner, J.

197
Phys. Chem. B, 2002, 106, 11407–11411.
126 W. Luo, W. van der Veer, P. Chu, D. L. Mills, R. M. Penner and J. C. Hemminger, J. Phys.
Chem. C, 2008, 112, 11609–11613.
127 A. Fukuoka, T. Higuchi, T. Ohtake, T. Oshio, J. Kimura, Y. Sakamoto, N. Shimomura, S.
Inagaki and M. Ichikawa, Chem. Mater., 2006, 18, 337–343.
128 M. H. Huang, A. Choudrey and P. Yang, Chem. Commun., 2000, 1063–1064.
129 Y.-J. Han, J. M. Kim and G. D. Stucky, Chem. Mater., 2000, 12, 2068–2069.
130 K. Lee, S. Lee and J. Cheon, Adv. Mater., 2001, 13, 517–520.
131 Q. Dai, J. G. Worden, J. Trullinger and Q. Huo, J. Am. Chem. Soc., 2005, 127, 8008–9.
132 K. Takagi and T. Ishiwatari, Chem. Lett., 2002, 990–991.
133 D.-F. Zhang, L.-Y. Niu, L. Jiang, P.-G. Yin, L.-D. Sun, H. Zhang, R. Zhang, L. Guo and C.-
H. Yan, J. Phys. Chem. C, 2008, 112, 16011–16016.
134 X. Shen, L. Chen, D. Li, L. Zhu, H. Wang, C. Liu, Y. Wang, Q. Xiong and H. Chen, ACS
Nano, 2011, 5, 8426–33.
135 D. Coursault, J. Grand, B. Zappone, H. Ayeb, G. Lévi, N. Félidj and E. Lacaze, Adv.
Mater., 2012, 24, 1461–5.
136 J.-Y. Chang, B. Lo, M. Jeng, S.-H. Tzing and Y.-C. Ling, Appl. Phys. Lett., 2004, 85, 2613.
137 A. Cabañas, J. A. Darr, E. Lester and M. Poliakoff, J. Mater. Chem., 2001, 11, 561–568.
138 J. D. Holmes, Science (80-. )., 2000, 287, 1471–1473.
139 J.-Y. Chang, J.-J. Chang, B. Lo, S.-H. Tzing and Y.-C. Ling, Chem. Phys. Lett., 2003, 379,
261–267.
140 J. Liao, Y. Zhang, W. Yu, L. Xu, C. Ge, J. Liu and N. Gu, Colloids Surfaces A Physicochem.

198
Eng. Asp., 2003, 223, 177–183.
141 X. Han, J. Goebl, Z. Lu and Y. Yin, Langmuir, 2011, 27, 5282–9.
142 A. Gangula, J. Chelli, S. Bukka, V. Poonthiyil, R. Podila, R. Kannan and A. M. Rao, J.
Mater. Chem., 2012, 22, 22866.
143 S. Lin, M. Li, E. Dujardin, C. Girard and S. Mann, Adv. Mater., 2005, 17, 2553–2559.
144 A. Y. Sinyagin, A. Belov, Z. Tang and N. A. Kotov, J. Phys. Chem. B, 2006, 110, 7500–7.
145 M. Yang, G. Chen, Y. Zhao, G. Silber, Y. Wang, S. Xing, Y. Han and H. Chen, Phys. Chem.
Chem. Phys., 2010, 12, 11850–60.
146 H. Zhang, K.-H. Fung, J. Hartmann, C. T. Chan and D. Wang, J. Phys. Chem. C, 2008,
112, 16830–16839.
147 K. Butter, P. H. H. Bomans, P. M. Frederik, G. J. Vroege and A. P. Philipse, Nat. Mater.,
2003, 2, 88–91.
148 Z. Jian, H. Liqing, W. Yongchang and L. Yimin, Phys. E Low-dimensional Syst.
Nanostructures, 2004, 25, 114–118.
149 G. A. Devries, M. Brunnbauer, Y. Hu, A. M. Jackson, B. Long, B. T. Neltner, O. Uzun, B.
H. Wunsch and F. Stellacci, Science, 2007, 315, 358–61.
150 I. Hussain, M. Brust, J. Barauskas and A. I. Cooper, Langmuir, 2009, 25, 1934–1939.
151 K. K. Caswell, J. N. Wilson, U. H. F. Bunz and C. J. Murphy, J. Am. Chem. Soc., 2003,
125, 13914–13915.
152 L. Zhu, D. Xue and Z. Wang, Langmuir, 2008, 24, 11385–11389.
153 C. Shi, L. Tian, L. Wu and J. Zhu, J. Phys. Chem. C, 2007, 111, 1243–1247.
154 R. Sardar and J. S. Shumaker-Parry, Nano Lett., 2008, 8, 731–736.

199
155 T. Shirman, T. Arad and M. E. van der Boom, Angew. Chem. Int. Ed. Engl., 2010, 49,
926–9.
156 L. Polavarapu and Q.-H. Xu, Nanotechnology, 2008, 19, 75601.
157 Y. Tan, L. Jiang, Y. Li and D. Zhu, J. Phys. Chem. B, 2002, 106, 3131–3138.
158 H. Kitching, M. J. Shiers, A. J. Kenyon and I. P. Parkin, J. Mater. Chem. A, 2013, 1, 6985.
159 M. V Walter, N. Cheval, O. Liszka, M. Malkoch and A. Fahmi, Langmuir, 2012, 28,
5947–55.
160 Z. Zhu, W. Liu, Z. Li, B. Han, Y. Zhou, Y. Gao and Z. Tang, ACS Nano, 2012, 6, 2326–32.
161 M. Grzelczak, J. Vermant, E. M. Furst and L. M. Liz-Marzán, ACS Nano, 2010, 4, 3591–
605.
162 T. P. Huelser, H. Wiggers, P. Ifeacho, O. Dmitrieva, G. Dumpich and A. Lorke,
Nanotechnology, 2006, 17, 3111–3115.
163 A. Hucht, S. Buschmann and P. Entel, Europhys. Lett., 2007, 77, 57003.
164 R. L. Penn, J. Phys. Chem. B, 2004, 108, 12707–12712.
165 V. M. Yuwono, N. D. Burrows, J. A. Soltis and R. L. Penn, J. Am. Chem. Soc., 2010, 132,
2163–5.
166 R. L. Penn, Science (80-. )., 1998, 281, 969–971.
167 G. Viau, J.-Y. Piquemal, M. Esparrica, D. Ung, N. Chakroune, F. Warmont and F. Fievet,
Chem. Commun., 2003, 2216.
168 M. Giersig, I. Pastoriza-Santos and L. M. Liz-Marzan, J. Mater. Chem., 2004, 14, 607.
169 O. Taratula, A. M. Chen, J. Zhang, J. Chaudry, L. Nagahara, I. Banerjee and H. He, J.
Phys. Chem. C, 2007, 111, 7666–7670.

200
170 L. Manna, D. J. Milliron, A. Meisel, E. C. Scher and A. P. Alivisatos, Nat. Mater., 2003,
2, 382–5.
171 Z. A. Peng and X. Peng, J. Am. Chem. Soc., 2001, 123, 183–184.
172 Q. Lu, F. Gao and D. Zhao, Nano Lett., 2002, 2, 725–728.
173 J. Polleux, N. Pinna, M. Antonietti and M. Niederberger, Adv. Mater., 2004, 16, 436–
439.
174 Y. Sun, Y. Yin, B. T. Mayers, T. Herricks and Y. Xia, Chem. Mater., 2002, 14, 4736–4745.
175 R. F. W. Pease, Contemp. Phys., 2006, 22, 265–290.
176 J. C. Hulteen, J. Vac. Sci. Technol. A Vacuum, Surfaces, Film., 1995, 13, 1553.
177 X. Zhang, E. M. Hicks, J. Zhao, G. C. Schatz and R. P. Van Duyne, Nano Lett., 2005, 5,
1503–1507.
178 T. Bhuvana and G. U. Kulkarni, ACS Nano, 2008, 2, 457–62.
179 D. Yin, S. Horiuchi, M. Morita and A. Takahara, Langmuir, 2005, 21, 9352–8.
180 L. Zhang and A. Eisenberg, Macromolecules, 1996, 29, 8805–8815.
181 Y. Kang, K. J. Erickson and T. A. Taton, J. Am. Chem. Soc., 2005, 127, 13800–1.
182 H. Wang, L. Chen, X. Shen, L. Zhu, J. He and H. Chen, Angew. Chem. Int. Ed. Engl., 2012,
51, 8021–5.
183 Z. Nie, D. Fava, E. Kumacheva, S. Zou, G. C. Walker and M. Rubinstein, Nat. Mater.,
2007, 6, 609–614.
184 Z. Tang and N. A. Kotov, Adv. Mater., 2005, 17, 951–962.
185 L. Zhao, K. L. Kelly and G. C. Schatz, J. Phys. Chem. B, 2003, 107, 7343–7350.

201
186 S. A. Maier and H. A. Atwater, J. Appl. Phys., 2005, 98, 11101.
187 E. Ozbay, Science, 2006, 311, 189–93.
188 M. Rycenga, C. M. Cobley, J. Zeng, W. Li, C. H. Moran, Q. Zhang, D. Qin and Y. Xia,
Chem. Rev., 2011, 111, 3669–712.
189 W. L. Barnes, A. Dereux and T. W. Ebbesen, Nature, 2003, 424, 824–30.
190 B. Wiley, Y. Sun and Y. Xia, Acc. Chem. Res., 2007, 40, 1067–76.
191 A. L. Pyayt, B. Wiley, Y. Xia, A. Chen and L. Dalton, Nat. Nanotechnol., 2008, 3, 660–
665.
192 M. Rang, A. C. Jones, F. Zhou, Z.-Y. Li, B. J. Wiley, Y. Xia and M. B. Raschke, Nano Lett.,
2008, 8, 3357–63.
193 M. Quinten, A. Leitner, J. R. Krenn and F. R. Aussenegg, Opt. Lett., 1998, 23, 1331.
194 H. Ditlbacher, A. Hohenau, D. Wagner, U. Kreibig, M. Rogers, F. Hofer, F. R. Aussenegg
and J. R. Krenn, Phys. Rev. Lett., 2005, 95, 257403.
195 H.-S. Chu, W.-B. Ewe, E.-P. Li and R. Vahldieck, Opt. Express, 2007, 15, 4216.
196 A. W. Sanders, D. A. Routenberg, B. J. Wiley, Y. Xia, E. R. Dufresne and M. A. Reed,
Nano Lett., 2006, 6, 1822–6.
197 Y. Fang, Z. Li, Y. Huang, S. Zhang, P. Nordlander, N. J. Halas and H. Xu, Nano Lett., 2010,
10, 1950–4.
198 A. L. Falk, F. H. L. Koppens, L. Y. Chun, K. Kang, N. de Leon Snapp, A. V Akimov, M.-H.
Jo, M. D. Lukin and H. Park, Nat. Phys., 2009, 5, 475–479.
199 W. M. Saj, Opt. Express, 2005, 13, 4818.
200 S. A. Maier, P. G. Kik and H. A. Atwater, Phys. Rev. B, 2003, 67, 205402.
202
201 S. Link and M. A. El-Sayed, J. Phys. Chem. B, 1999, 103, 8410–8426.
202 S. A. Maier, M. L. Brongersma, P. G. Kik and H. A. Atwater, Phys. Rev. B, 2002, 65,
193408.
203 S. A. Maier, P. G. Kik and H. A. Atwater, Appl. Phys. Lett., 2002.
204 W. Chen, A. Bian, A. Agarwal, L. Liu, H. Shen, L. Wang, C. Xu and N. A. Kotov, Nano
Lett., 2009, 9, 2153–9.
205 J. K. Gansel, M. Thiel, M. S. Rill, M. Decker, K. Bade, V. Saile, G. von Freymann, S. Linden
and M. Wegener, Science, 2009, 325, 1513–5.
206 M. Février, P. Gogol, G. Barbillon, A. Aassime, R. Mégy, B. Bartenlian, J.-M. Lourtioz
and B. Dagens, Opt. Express, 2012, 20, 17402–17409.
207 S. L. D. Solis Jr, B. Willingham, S. L. Nauert, L. S. Slaughter, J. Olson, P. Swanglap, A.
Paul, W.-S. Chang, Nano Lett., 2012, 12, 1349–1353.
208 C. Petit, V. Russier and M. P. Pileni, J. Phys. Chem. B, 2003, 107, 10333–10336.
209 C.-M. Liu, L. Guo, R.-M. Wang, Y. Deng, H.-B. Xu and S. Yang, Chem. Commun. (Camb).,
2004, 2726–7.
210 W. Zhou, L. He, R. Cheng, L. Guo, C. Chen and J. Wang, J. Phys. Chem. C, 2009, 113,
17355–17358.
211 A. N. Rudenko, V. V. Mazurenko, V. I. Anisimov and A. I. Lichtenstein, Phys. Rev. B,
2009, 79, 144418.
212 S. A. Corr, S. J. Byrne, R. Tekoriute, C. J. Meledandri, D. F. Brougham, M. Lynch, C.
Kerskens, L. O’Dwyer and Y. K. Gun’ko, J. Am. Chem. Soc., 2008, 130, 4214–4215.
213 M. Klaui, J. Rothman, L. Lopez-Diaz, C. A. F. Vaz, J. A. C. Bland and Z. Cui, Appl. Phys.

203
Lett., 2001, 78, 3268–3270.
214 S. L. Tripp, R. E. Dunin-Borkowski and A. Wei, Angew. Chemie Int. Ed., 2003, 42, 5591–
5593.
215 S. Si, A. Kotal and T. K. Mandal, J. Phys. Chem. C, 2007, 111, 1248–1255.
216 C. Leiterer, S. Berg, A.-P. Eskelinen, A. Csaki, M. Urban, P. Törmä and W. Fritzsche,
Sensors Actuators B Chem., 2013, 176, 368–373.
217 F. Yang, D. K. Taggart and R. M. Penner, Nano Lett., 2009, 9, 2177–82.
218 C.-M. Chang, M.-H. Hon and I.-C. Leu, RSC Adv., 2012, 2, 2469.
219 W. Si, G. Yu, B. Zhou, Y. Ouyang and L. Qiao, Sens. Lett., 2012, 10, 26–32.
220 E. Garcia-Berrios, T. Gao, M. D. Woodka, S. Maldonado, B. S. Brunschwig, M. W.
Ellsworth and N. S. Lewis, J. Phys. Chem. C, 2010, 114, 21914–21920.
221 S. M. Joun Lee Carlos M. Hangarter, Ashok Mulchandani, Wilfred Chen, Nosang V.
Myung*, Electroanalysis, 2011, 23, 2623–2628.
222 A. M. Jackson, J. W. Myerson and F. Stellacci, Nat. Mater., 2004, 3, 330–6.
223 K. G. Thomas, S. Barazzouk, B. I. Ipe, S. T. S. Joseph and P. V. Kamat, J. Phys. Chem. B,
2004, 108, 13066–13068.
224 B. Spellberg, R. Guidos, D. Gilbert, J. Bradley, H. W. Boucher, W. M. Scheld, J. G.
Bartlett and J. Edwards, Clin. Infect. Dis., 2008, 46, 155–64.
225 M. Unemo and R. A. Nicholas, Future Microbiol., 2012, 7, 1401–1422.
226 M. Sebaihia, B. W. Wren and P. Mullany, Nat. Genet., 2006, 38, 779–86.
227 F. F. Reinthaler, J. Posch, G. Feierl, G. Wüst, D. Haas, G. Ruckenbauer, F. Mascher and
E. Marth, Water Res., 2003, 37, 1685–90.

204
228 A. C. Fluit, FEMS Immunol. Med. Microbiol., 2005, 43, 1–11.
229 Antimicrobial resistance surveillance in Europe, 2010.
230 T. J. Dougherty, C. J. Gomer, B. W. Henderson, G. Jori, D. Kessel, M. Korbelik, J. Moan
and Q. Peng, J. Natl. Cancer Inst., 1998, 90, 889–905.
231 M. D. Daniell and J. S. Hill, ANZ J. Surg., 1991, 61, 340–348.
232 R. Bonnett, Chemical Aspects of Photodynamic Therapy, CRC Press, 2000.
233 R. Roelandts, J. Am. Acad. Dermatol., 2002, 46, 926–930.
234 R. J. Cremer, P. W. Perryman and D. H. Richards, Lancet, 1958, 271, 1094–1097.
235 M. D. D. and J. S. Hill, Aust. N. Z. J. Surg., 1991, 61, 340–348.
236 D. F. & R. K. J. Dennis E.J.G.J. Dolmans, Nat. Rev. cancer, 2003, 3, 380–387.
237 H. F. BLUM, Ann. Intern. Med., 1933, 6, 877–884.
238 B. C. Wilson and M. S. Patterson, Phys. Med. Biol., 1986, 31, 327–360.
239 M. DeRosa, Coord. Chem. Rev., 2002, 233–234, 351–371.
240 G. Bertoloni, F. M. Lauro, G. Cortella and M. Merchat, Biochim. Biophys. Acta - Gen.
Subj., 2000, 1475, 169–174.
241 R. R. Allison, G. H. Downie, R. Cuenca, X.-H. Hu, C. J. Childs and C. H. Sibata,
Photodiagnosis Photodyn. Ther., 2004, 1, 27–42.
242 J. J. Lopez, M. A. G. Carter, Y. P. Tsentalovich, O. B. Morozova, A. V Yurkovskaya and
P. J. Hore, Photochem. Photobiol., 2002, 75, 6–10.
243 K. König, V. Bockhorn, W. Dietel and H. Schubert, J. Cancer Res. Clin. Oncol., 1987, 113,
301–303.

205
244 F. S. De Rosa and M. V. L. B. Bentley, Pharm. Res., 17, 1447–1455.
245 P. S. Zolfaghari, S. Packer, M. Singer, S. P. Nair, J. Bennett, C. Street and M. Wilson,
BMC Microbiol., 2009, 9, 27.
246 J. S. Bellin, L. Lutwick and B. Jonas, Arch. Biochem. Biophys., 1969, 132, 157–164.
247 K. Orth, G. Beck, F. Genze and A. Rück, J. Photochem. Photobiol. B Biol., 2000, 57, 186–
192.
248 I. Diamond, A. Mcdonagh, C. Wilson, S. Granelli, S. Nielsen and R. Jaenicke, Lancet,
1972, 300, 1175–1177.
249 T. J. Dougherty, J. Natl. Cancer Inst., 1974, 52, 1333–1336.
250 S. H. Tomson, E. A. Emmett and S. H. Fox, Cancer Res., 1974, 34, 3124–3127.
251 T. J. Dougherty, J. E. Kaufman, A. Goldfarb, K. R. Weishaupt, D. Boyle and A.
Mittleman, Cancer Res., 1978, 38, 2628–2635.
252 O. J. Balchum, D. R. Doiron and G. C. Huth, Prog. Clin. Biol. Res., 1984, 170, 727–45.
253 H. Kato, J. Photochem. Photobiol. B Biol., 1998, 42, 96–99.
254 J. F. Kelly, M. E. Snell and M. C. Berenbaum, Br. J. Cancer, 1975, 31, 237.
255 G. R. Prout Jr, C.-W. Lin, R. Benson Jr, U. O. Nseyo, J. J. Daly, P. P. Griffin, J. Kinsey, M.
Tian, Y. Lao and Y. Mian, N. Engl. J. Med., 1987, 317, 1251–1255.
256 D. E. Schuller, J. S. McCaughan and R. P. Rock, Arch. Otolaryngol. - Head Neck Surg.,
1985, 111, 351–355.
257 J. Feyh, A. Goetz, W. Müller, R. Königsberger and E. Kastenbauer, J. Photochem.
Photobiol. B Biol., 1990, 7, 353–358.
258 S. S. Stylli, A. H. Kaye, L. MacGregor, M. Howes and P. Rajendra, J. Clin. Neurosci., 2005,

206
12, 389–98.
259 A. H. Kaye and J. S. Hill, Ann. Acad. Med. Singapore, 1993, 22, 470.
260 B. W. Henderson, T. M. Busch, L. A. Vaughan, N. P. Frawley, D. Babich, T. A. Sosa, J. D.
Zollo, A. S. Dee, M. T. Cooper and D. A. Bellnier, Cancer Res., 2000, 60, 525–529.
261 V. X. D. Yang, P. J. Muller, P. Herman and B. C. Wilson, Lasers Surg. Med., 2003, 32,
224–232.
262 X.-Y. He, R. A. Sikes, S. Thomsen, L. W. K. Chung and S. L. Jacques, Photochem.
Photobiol., 1994, 59, 468–473.
263 B. F. Overholt, K. K. Wang, J. S. Burdick, C. J. Lightdale, M. Kimmey, H. R. Nava, M. V
Sivak, N. Nishioka, H. Barr and N. Marcon, Gastrointest. Endosc., 2007, 66, 460–468.
264 A. Sharwani, W. Jerjes, V. Salih, A. J. MacRobert, M. El-Maaytah, H. S. M. Khalil and C.
Hopper, J. Photochem. Photobiol. B Biol., 2006, 83, 27–33.
265 O. Driemel, M. Kunkel, M. Hullmann, F. von Eggeling, U. Müller-Richter, H. Kosmehl
and T. E. Reichert, J. Dtsch. Dermatol. Ges., 2007, 5, 1095–100.
266 L. E. Bockstahler, T. P. Coohill, K. B. Hellman, C. David Lytle and J. E. Roberts,
Pharmacol. Ther., 1979, 4, 473–499.
267 J. Marotti, A. C. C. Aranha, C. D. P. Eduardo and M. S. Ribeiro, Photomed. Laser Surg.,
2009, 27, 357–63.
268 B. Lambrecht, H. Mohr, J. Knüver-Hopf and H. Schmitt, Vox Sang., 1991, 60, 207–213.
269 B. Bachmann, J. Knüver-Hopf, B. Lambrecht and H. Mohr, J. Med. Virol., 1995, 47, 172–
178.
270 Z. Smetana, Z. Malik, A. Orenstein, E. Mendelson and E. Ben-Hur, Lasers Surg. Med.,

207
1997, 21, 351–358.
271 C. Propst and L. Lubin, Infect. Immun., 1978, 20, 136–141.
272 M. Wilson and N. Mia, J. Oral Pathol. Med., 1993, 22, 354–357.
273 M. C. Teichert, J. W. Jones, M. N. Usacheva and M. A. Biel, Oral Surgery, Oral Med.
Oral Pathol. Oral Radiol. Endodontology, 2002, 93, 155–160.
274 T. Burns, M. Wilson and G. J. Pearson, J. Dent., 1994, 22, 273–278.
275 A. Pfitzner, B. W. Sigusch, V. Albrecht and E. Glockmann, J. Periodontol., 2004, 75,
1343–9.
276 S. A. G. Lambrechts, T. N. Demidova, M. C. G. Aalders, T. Hasan and M. R. Hamblin,
Photochem. Photobiol. Sci., 2005, 4, 503–509.
277 T. Dai, G. P. Tegos, T. Zhiyentayev, E. Mylonakis and M. R. Hamblin, Lasers Surg. Med.,
2010, 42, 38–44.
278 M. L. Embleton, S. P. Nair, B. D. Cookson and M. Wilson, Microb. Drug Resist., 2004,
10, 92–7.
279 B. Zeina, J. Greenman, W. M. Purcell and B. Das, Br. J. Dermatol., 2001, 144, 274–278.
280 A. C. Khazraji, S. Hotchandani, S. Das and P. V Kamat, J. Phys. Chem. B, 1999, 103,
4693–4700.
281 A. Khdair, B. Gerard, H. Handa, G. Mao, M. P. V Shekhar and J. Panyam, Mol. Pharm.,
2008, 5, 795–807.
282 N. Narband, S. Tubby, I. Parkin, J. Gil-Tomas, D. Ready, S. Nair and M. Wilson, Curr.
Nanosci., 2008, 4, 409–414.
283 M. Rai, A. Yadav and A. Gade, Biotechnol. Adv., 2009, 27, 76–83.

208
284 J. Liu and R. H. Hurt, Environ. Sci. Technol., 2010, 44, 2169–2175.
285 S. Noimark, C. W. Dunnill and I. P. Parkin, Adv. Drug Deliv. Rev., 2013, 65, 570–580.
286 J. M. Bartley and R. N. Olmsted, Clin. Microbiol. Newsl., 2008, 30, 113–117.
287 R. A. Weinstein and B. Hota, Clin. Infect. Dis., 2004, 39, 1182–1189.
288 Robert P. Gaynes, Infect. Control Hosp. Epidemiol., 1997, 18, 475–478.
289 House of Commons Public Accounts Committee, Reducing Healthcare Associated
Infection in Hospitals in England, London, 2009.
290 K. Page, R. G. Palgrave, I. P. Parkin, M. Wilson, S. L. P. Savin and A. V. Chadwick, J.
Mater. Chem., 2007, 17, 95–104.
291 P. Evans and D. W. Sheel, Surf. Coatings Technol., 2007, 201, 9319–9324.
292 K. Page, M. Wilson and I. P. Parkin, J. Mater. Chem., 2009, 19, 3819.
293 B. Gottenbos, H. C. van der Mei, F. Klatter, P. Nieuwenhuis and H. J. Busscher,
Biomaterials, 2002, 23, 1417–1423.
294 A. E. Madkour, J. M. Dabkowski, K. Nüsslein and G. N. Tew, Langmuir, 2009, 25, 1060–
1067.
295 V. Decraene, J. Pratten and M. Wilson, Appl. Environ. Microbiol., 2006, 72, 4436–4439.
296 S. Gemili, A. Yemenicioğlu and S. A. Altınkaya, J. Food Eng., 2009, 90, 453–462.
297 S. L. Haynie, G. A. Crum and B. A. Doele, Antimicrob. Agents Chemother., 1995, 39,
301–307.
298 A. J. T. Naik, S. Ismail, C. Kay, M. Wilson and I. P. Parkin, Mater. Chem. Phys., 2011,
129, 446–450.
299 J.-P. Guggenbichler, M. Böswald, S. Lugauer and T. Krall, Infection, 1999, 27, S16–S23.

209
300 U. Makal, L. Wood, D. E. Ohman and K. J. Wynne, Biomaterials, 2006, 27, 1316–1326.
301 S. Perni, P. Prokopovich, C. Piccirillo, J. Pratten, I. P. Parkin and M. Wilson, J. Mater.
Chem., 2009, 19, 2715.
302 T. Maisch, C. Bosl, R.-M. Szeimies, N. Lehn and C. Abels, Antimicrob. Agents
Chemother., 2005, 49, 1542–1552.
303 M. Soncin, C. Fabris and A. Busetti, Photochem. Photobiol. Sci., 2002, 1, 815–819.
304 M. A. Kohanski, D. J. Dwyer, B. Hayete, C. A. Lawrence and J. J. Collins, Cell, 2007, 130,
797–810.
305 S. Perni, C. Piccirillo, A. Kafizas, M. Uppal, J. Pratten, M. Wilson and I. P. Parkin, J. Clust.
Sci., 2010, 21, 427–438.
306 S. Perni, C. Piccirillo, J. Pratten, P. Prokopovich, W. Chrzanowski, I. P. Parkin and M.
Wilson, Biomaterials, 2009, 30, 89–93.
307 S. Perni, P. Prokopovich, I. P. Parkin, M. Wilson and J. Pratten, J. Mater. Chem., 2010,
20, 8668.
308 Sehmi, S. K., Noimark, S., Bear, J. C., Peveler, W. J., Bovis, M., Allan, E., MacRobert, A.
J. and Parkin, I. P., J. Mater. Chem. B, 2015, 6490–6500.
309 S. Noimark, M. Bovis, A. J. MacRobert, A. Correia, E. Allan, M. Wilson and I. P. Parkin,
RSC Adv., 2013, 3, 18383.
310 V. J. Gandubert and R. B. Lennox, Langmuir, 2005, 21, 6532–6539.
311 S. Jaiswal, B. Duffy, A. K. Jaiswal, N. Stobie and P. McHale, Int. J. Antimicrob. Agents,
2010, 36, 280–283.
312 A. A. El-Kheshen and S. F. Gad El-Rab, 2012, 4, 53–65.
210
313 S. S. Shankar, S. Bhargava and M. Sastry, .
314 H. J. Wang, C. Y. Xue, R. Chen and W. D. Zhang, Adv. Mater. Res., 2010, 152–153, 600–
604.
315 C.-H. Kuo and M. H. Huang, Langmuir, 2005, 21, 2012–2016.
316 H.-Y. Wu, M. Liu and M. H. Huang, J. Phys. Chem. B, 2006, 110, 19291–19294.
317 E. Hao, R. C. Bailey, G. C. Schatz, J. T. Hupp and S. Li, Nano Lett., 2004, 4, 327–330.
318 M. Yamamoto, Y. Kashiwagi, T. Sakata, H. Mori and M. Nakamoto, Chem. Mater.,
2005, 17, 5391–5393.
319 O. M. Bakr, B. H. Wunsch and F. Stellacci, Chem. Mater., 2006, 18, 3297–3301.
320 J. Xie, J. Y. Lee and D. I. C. Wang, Chem. Mater., 2007, 19, 2823–2830.
321 B. Rodríguez-González, A. Burrows, M. Watanabe, C. J. Kiely and L. M. Liz Marzán, J.
Mater. Chem., 2005, 15, 1755.
322 M. A. Uppal, M. B. Ewing and I. P. Parkin, Eur. J. Inorg. Chem., 2011, 2011, 4534–4544.
323 S. Link, Z. L. Wang and M. A. El-Sayed, J. Phys. Chem. B, 1999, 103, 3529–3533.
324 Z. S. Pillai and P. V. Kamat, J. Phys. Chem. B, 2004, 108, 945–951.
325 M. J. Shiers, R. Leech, C. J. Carmalt, I. P. Parkin and A. J. Kenyon, Adv. Mater., 2012,
24, 5227–35.
326 Y. H. Su, S.-L. Tu, S.-W. Tseng, Y.-C. Chang, S.-H. Chang, W.-M. Zhang, F. Hao, Y.
Sonnefraud, P. Van Dorpe, S. A. Maier, N. J. Halas, P. Nordlander, J. Maly, H. Lampova,
A. Semeradtova, M. Stofik, L. Kovacik, J. P. Camden, J. A. Dieringer, Y. Wang, D. J.
Masiello, L. D. Marks, G. C. Schatz, R. P. Van Duyne, M. Zhu, C. M. Aikens, F. J.
Hollander, G. C. Schatz, R. Jin, H. B. Li, F. Y. Li, C. P. Han, Z. M. Cui, G. Y. Xie, A. Q. Zhang,
211
F. Z. Henari, A. A. Dakhel, X. Y. Hu, Z. Y. Wang, T. C. Zhang, X. Y. Zeng, W. Xu, J. X.
Zhang, J. Yan, J. P. Zhang, L. D. Zhang, A. Bouhelier, R. Bachelot, G. Lerondel, S.
Kostcheev, P. Royer, G. P. Wiederrecht1, Y. Bao, C. Zhong, D. M. Vu, J. P. Temirov, R.
B. Dyer, J. S. Martinez, J. Zheng, C. W. Zhang, R. M. Dickson, D. J. Roaf, C. T. Yuan, W.
C. Chou, J. Tang, C. A. Lin, W. H. Chang, J. L. Shen, D. S. Chuu, P. Frantsuzov, M. Kuno,
B. Janko, R. A. Marcus, B. N. Khlebtsov, V. A. Khanadeev, N. G. Khlebtsov, H. L. Wu, C.
H. Chen, M. H. Huang, L. Wang, S. J. Guo, J. F. Zhai, S. J. Dong, S. J. Guo, L. Wang, S. J.
Dong, E. K. Wang, P. Zhou, Z. H. Dai, M. Fang, X. H. Huang, J. C. Bao, J. F. Gong, K. F.
Yu, K. L. Kelly, N. Sakai, T. Tatsuma, Y. H. Su, W. H. Lai, W. Y. Chen, M. H. Hon, S.-H.
Chang, O. M. Bakr, B. H. Wunsch, F. Stellacci, G. H. Jeong, Y. W. Lee, M. Kim, S. W. Han,
C. L. Nehl, J. H. Hafner, Y. H. Su, L. G. Teoh, S.-L. Tu, J.-H. Lee, M. H. Hon, L. Frolov, Y.
Rosenwaks, S. Richter, C. Carmeli, I. Carmeli, C. Curutchet, A. Franceschetti, A. Zunger,
G. D. Scholes, Y. H. Su, W. H. Lai, S.-H. Chang, M. H. Hon, M. Zhu, C. M. Aikens, F. J.
Hollander, G. C. Schatz, R. Jin, H. Kawasaki, H. Yamamoto, H. Fujimori, R. Arakawa, Y.
Iwasaki, M. Inada, M. Kuno, D. P. Fromm, H. F. Hamann, A. Gallagher, D. J. Nesbitt, T.
Ozaki, H. Kino, B. Mahler, P. Spinicelli, S. Buil, X. Quelin, J.-P. Hermier, B. Dubertret1,
T. Ming, L. Zhao, Z. Yang, H. J. Chen, L. D. Sun, J. F. Wang, C. H. Yan, Z. Yang, W. H. Ni,
X. S. Kou, S. Z. Zhang, Z. H. Sun, L.-D. Sun, J. F. Wang and C.-H. Yan, Nanoscale, 2010,
2, 2639.
327 B. Spellberg, R. Guidos, D. Gilbert, J. Bradley, H. W. Boucher, W. M. Scheld, J. G.
Bartlett, J. Edwards and the I. D. S. of America, Clin. Infect. Dis., 2008, 46, 155–164.
328 M. D. Iseman and L. A. Madsen, Clin. Chest Med., 1989, 10, 341–53.
329 T. Maisch, Lasers Med. Sci., 2007, 22, 83–91.
330 J. P. Tardivo, A. Del Giglio, C. S. de Oliveira, D. S. Gabrielli, H. C. Junqueira, D. B. Tada,
D. Severino, R. de Fátima Turchiello and M. S. Baptista, Photodiagnosis Photodyn.

212
Ther., 2005, 2, 175–191.
331 S. T. Naima Narband Ivan P. Parkin, Jesús Gil-Tomás, Derren Ready, Sean P. Nair and
Michael Wilson, Curr. Nanosci., 2008, 4, 409–414.
332 Y. Wang, G. Chen, M. Yang, G. Silber, S. Xing, L. H. Tan, F. Wang, Y. Feng, X. Liu and S.
Li, Nat. Commun., 2010, 1, 87.
333 D. V Leff, L. Brandt and J. R. Heath, Langmuir, 1996, 12, 4723–4730.
334 S. L. Westcott, S. J. Oldenburg, T. R. Lee and N. J. Halas, Langmuir, 1998, 14, 5396–
5401.
335 S. Bharathi, N. Fishelson and O. Lev, Langmuir, 1999, 15, 1929–1937.
336 Y.-R. Luo, Comprehensive Handbook of Chemical Bond Energies, CRC Press, Taylor &
Francis Group, 2007.
337 T. Konno, M. Usami, A. Toyota, M. Hirotsu and T. Kawamoto, Chem. Lett., 2005, 34,
1146–1147.
338 N. Gonzalez-Lakunza, N. Lorente and A. Arnau, J. Phys. Chem. C, 2007, 111, 12383–
12390.
339 D. R. Whitcomb and M. Rajeswaran, J. Coord. Chem., 2006, 59, 1253–1260.
340 F. Chen, X. Li, J. Hihath, Z. Huang and N. Tao, J. Am. Chem. Soc., 2006, 128, 15874–
15881.
341 A.-P. Magiorakos, A. Srinivasan, R. B. Carey, Y. Carmeli, M. E. Falagas, C. G. Giske, S.
Harbarth, J. F. Hindler, G. Kahlmeter, B. Olsson-Liljequist, D. L. Paterson, L. B. Rice, J.
Stelling, M. J. Struelens, A. Vatopoulos, J. T. Weber and D. L. Monnet, Clin. Microbiol.
Infect., 2012, 18, 268–281.

213
342 D. Pittet, Infect. Control Hosp. Epidemiol., 2000, 21, 381–386.
343 E. R. Goodman, R. Platt, R. Bass, A. B. Onderdonk, D. S. Yokoe and S. S. Huang, Infect.
Control Hosp. Epidemiol., 2008, 29, 593–599.
344 H. I. Pass, JNCI J. Natl. Cancer Inst., 1993, 85, 443–456.
345 D. E. J. G. J. Dolmans, D. Fukumura and R. K. Jain, Nat. Rev. Cancer, 2003, 3, 380–7.
346 S. Noimark, C. W. Dunnill, M. Wilson and I. P. Parkin, Chem. Soc. Rev., 2009, 38, 3435–
48.
347 Y. Sekiguchi, Y. Yao, Y. Ohko, K. Tanaka, T. Ishido, A. Fujishima and Y. Kubota, Int. J.
Urol., 2007, 14, 426–430.
348 Y. Ohko, Y. Utsumi, C. Niwa, T. Tatsuma, K. Kobayakawa, Y. Satoh, Y. Kubota and A.
Fujishima, J. Biomed. Mater. Res., 2001, 58, 97–101.
349 C. W. Dunnill, K. Page, Z. A. Aiken, S. Noimark, G. Hyett, A. Kafizas, J. Pratten, M.
Wilson and I. P. Parkin, J. Photochem. Photobiol. A Chem., 2011, 220, 113–123.
350 Z. A. Aiken, G. Hyett, C. W. Dunnill, M. Wilson, J. Pratten and I. P. Parkin, Chem. Vap.
Depos., 2010, 16, 19–22.
351 V. Decraene, J. Pratten and M. Wilson, Infect. Control Hosp. Epidemiol., 2008, 29,
1181–1184.
352 M. Wilson, Infect. Control Hosp. Epidemiol., 2003, 24, 782–784.
353 M. Wainwright, M. N. Byrne and M. A. Gattrell, Phenothiazinium-based
photobactericidal materials, 2006, vol. 84.
354 M. Wainwright, D. A. Phoenix, P. B. Nickson and G. Morton, Biofouling, 2002, 18, 247–
249.

214
355 R. Hachem, R. Reitzel, A. Borne, Y. Jiang, P. Tinkey, R. Uthamanthil, J. Chandra, M.
Ghannoum and I. Raad, Antimicrob. Agents Chemother., 2009, 53, 5145–5149.
356 D. P. Camacho, A. Gasparetto and T. I. E. Svidzinski, Mycopathologia, 2007, 163, 261–
266.
357 V. Decraene, J. Pratten and M. Wilson, Curr. Microbiol., 2008, 57, 269–273.
358 I. Sondi and B. Salopek-Sondi, J. Colloid Interface Sci., 2004, 275, 177–182.
359 S. Noimark, E. Allan and I. P. Parkin, Chem. Sci., 2014, 5, 2216.
360 C. Piccirillo, S. Perni, J. Gil-Thomas, P. Prokopovich, M. Wilson, J. Pratten and I. P.
Parkin, J. Mater. Chem., 2009, 19, 6167.
361 B. Zeina, J. Greenman, D. Corry and W. M. Purcell, Br. J. Dermatol., 2003, 148, 229–
232.
362 B. Zeina, J. Greenman, D. Corry and W. M. Purcell, Br. J. Dermatol., 2002, 146, 568–
573.
363 B. Zeina, J. Greenman, W. M. Purcell and B. Das, Br. J. Dermatol., 2001, 144, 274–278.
364 M. B. Edmond, S. E. Wallace, D. K. McClish, M. A. Pfaller, R. N. Jones and R. P. Wenzel,
Clin. Infect. Dis., 1999, 29, 239–244.
365 A. Panácek, L. Kvitek, R. Prucek, M. Kolář, R. Veceřová, N. Pizúrová, V. K. Sharma, T.
Nevěcná and R. Zbořil, J. Phys. Chem. B, 2006, 110, 16248–16253.
366 I. Sondi and B. Salopek-Sondi, J. Colloid Interface Sci., 2004, 275, 177–182.
367 M. Rai, A. Yadav and A. Gade, Biotechnol. Adv., 2009, 27, 76–83.
368 S. Pal, Y. K. Tak and J. M. Song, Appl. Environ. Microbiol., 2007, 73, 1712–1720.
369 C.-N. Lok, C.-M. Ho, R. Chen, Q.-Y. He, W.-Y. Yu, H. Sun, P. K.-H. Tam, J.-F. Chiu and C.-
215
M. Che, JBIC J. Biol. Inorg. Chem., 2007, 12, 527–534.
370 P. C. Lee and D. Meisel, J. Phys. Chem., 1982, 86, 3391–3395.
371 P. Prokopovich, S. Perni, C. Piccirillo, J. Pratten, I. P. Parkin and M. Wilson, J. Mater.
Sci. Mater. Med., 2010, 21, 815–821.
372 K. Kusuzaki, K. Aomori, T. Suginoshita, G. Minami, H. Takeshita, H. Murata, S.
Hashiguchi, T. Ashihara and Y. Hirasawa, Oncology, 2000, 59, 174–180.
373 K. Kusuzaki, H. Murata, T. Matsubara, S. Miyazaki, A. Okamura, M. Seto, A.
Matsumine, H. Hosoi, T. Sugimoto and A. Uchida, Anticancer Res., 2005, 25, 1225–35.
374 K. Kusuzaki, H. Murata, T. Matsubara, S. Miyazaki, K. Shintani, M. Seto, A. Matsumine,
H. Hosoi, T. Sugimoto and A. Uchida, Photochem. Photobiol., 2005, 81, 705.
375 J. W. Costerton, P. S. Stewart and E. P. Greenberg, Science, 1999, 284, 1318–22.