the swiss glacie rs - glamos glacier monitoring...
TRANSCRIPT

The Swiss Glaciers
2013/14 and 2014/15
Glaciological Report (Glacier) No. 135/136
2017

The Swiss Glaciers
2013/14 and 2014/15
Glaciological Report No. 135/136
Edited by
Andreas Bauder1
With contributions from
Andreas Bauder1, Mauro Fischer2, Martin Funk1,
Jeannette Gabbi1,4,∗, Martin Hoelzle2, Matthias Huss1,2,
Giovanni Kappenberger3 , Urs Steinegger 4
1 Laboratory of Hydraulics, Hydrology and Glaciology (VAW), ETH Zurich
2 Department of Geosciences, University of Fribourg
3 6654 Cavigliano
4 Meteodat GmbH, 8005 Zurich
∗ now at beffa tognacca sagl, 6702 Claro
2017
Publication of the Cryospheric Commission (EKK) of the Swiss Academy of Sciences (SCNAT)
c/o Laboratory of Hydraulics, Hydrology and Glaciology (VAW)
at the Swiss Federal Institute of Technology Zurich (ETH Zurich)
Honggerbergring 26, CH-8093 Zurich, Switzerland
http://glaciology.ethz.ch/swiss-glaciers/
c© Cryospheric Commission (EKK) 2017
DOI: http://doi.org/10.18752/glrep 135-136
ISSN 1424-2222
Imprint of author contributions:
Andreas Bauder : Chapt. 1, 2, 3, 4, 5, App. A, B, C
Mauro Fischer : Chapt. 4
Martin Funk : Chapt. 1, 4, 7
Jeannette Gabbi : Chapt. 4
Martin Hoelzle : Chapt. 6
Matthias Huss : Chapt. 1, 2, 4
Giovanni Kappenberger : Chapt. 4
Urs Steinegger : Chapt. 4
Ebnoether Joos AG
print and publishing
Sihltalstrasse 82
Postfach 134
CH-8135 Langnau am Albis
Switzerland
Cover Page: Langgletscher (Hans Henzen, 10.11.2015)

Summary
During the 135th and 136th year under review by the Cryospheric Commission (EKK), Swiss glaciers
continued to lose both length and mass. The two periods were characterized by average amounts
of snow accumulation during winter, and moderate to very high melt rates in summer. The results
presented in this report reflect the weather conditions in the measurement periods as well as the
effects of ongoing atmospheric warming over the past decades.
In autumn 2014, a length variation was determined for more than 96 of the 114 glaciers currently
under active observation, while one year later 99 glaciers were measured. In the two observation
periods, 2013/14 and 2014/15, Swiss glaciers experienced further losses in length. Most of the
measurement values lay between 0 and -30 m in both periods. Several glaciers displayed remarkably
high retreat values in a single year. These can be attributed to the detachment of a mass of dead
ice from the glacier snout, or to the melting of sections of the glacier that had been thinning
constantly for many years.
Detailed mass balance observations at seasonal resolution were carried out at ten glaciers: Basodino,
Findelen, Gries, Pizol, Plaine Morte, Murtel, Rhone, Sankt Anna, Silvretta and Tsanfleuron, but
measurements were also conducted at several additional glaciers. In the first period (2013/14),
glaciers in the Southern Valais showed a balanced mass budget, whereas mass loss was for the
most part moderate in the other regions. During the second period (2014/15), strong glacier
mass losses occurred throughout the entire Swiss Alps. In addition to the results of new measure-
ments, a homogenized 100-year series of point mass balance on Claridenfirn, as well as re-anaylzed
long-term mass balance series of glacier-wide balance for nine glaciers are presented.
Measurements of ice surface velocity were performed at selected glaciers in the Mauvoisin and
Mattmark regions. The trend continued toward diminishing velocities, reflecting the reduction in
ice thickness due to ongoing negative mass balances.
Measurements of borehole firn temperature at Colle Gnifetti, Valais, showed further warming over
the last pentade indicating a regime shift with melting occurring even at very high elevations in
the Alps during summer.
An update of the inventory of hazardous glaciers documents known events that ocurred since 2003
in the Swiss Alps. The list also includes glaciers that are now considered as potentially hazardous
and are under frequent observation.
iii
Published Reports
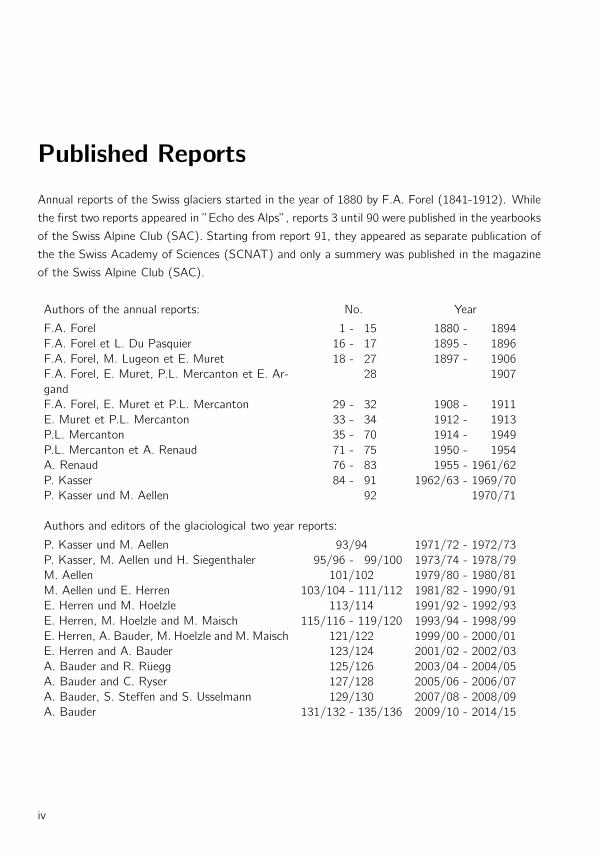
Annual reports of the Swiss glaciers started in the year of 1880 by F.A. Forel (1841-1912). While
the first two reports appeared in ”Echo des Alps”, reports 3 until 90 were published in the yearbooks
of the Swiss Alpine Club (SAC). Starting from report 91, they appeared as separate publication of
the the Swiss Academy of Sciences (SCNAT) and only a summery was published in the magazine
of the Swiss Alpine Club (SAC).
Authors of the annual reports: No. Year
F.A. Forel 1 - 15 1880 - 1894
F.A. Forel et L. Du Pasquier 16 - 17 1895 - 1896
F.A. Forel, M. Lugeon et E. Muret 18 - 27 1897 - 1906
F.A. Forel, E. Muret, P.L. Mercanton et E. Ar-
gand
28 1907
F.A. Forel, E. Muret et P.L. Mercanton 29 - 32 1908 - 1911
E. Muret et P.L. Mercanton 33 - 34 1912 - 1913
P.L. Mercanton 35 - 70 1914 - 1949
P.L. Mercanton et A. Renaud 71 - 75 1950 - 1954
A. Renaud 76 - 83 1955 - 1961/62
P. Kasser 84 - 91 1962/63 - 1969/70
P. Kasser und M. Aellen 92 1970/71
Authors and editors of the glaciological two year reports:
P. Kasser und M. Aellen 93/94 1971/72 - 1972/73
P. Kasser, M. Aellen und H. Siegenthaler 95/96 - 99/100 1973/74 - 1978/79
M. Aellen 101/102 1979/80 - 1980/81
M. Aellen und E. Herren 103/104 - 111/112 1981/82 - 1990/91
E. Herren und M. Hoelzle 113/114 1991/92 - 1992/93
E. Herren, M. Hoelzle and M. Maisch 115/116 - 119/120 1993/94 - 1998/99
E. Herren, A. Bauder, M. Hoelzle and M. Maisch 121/122 1999/00 - 2000/01
E. Herren and A. Bauder 123/124 2001/02 - 2002/03
A. Bauder and R. Ruegg 125/126 2003/04 - 2004/05
A. Bauder and C. Ryser 127/128 2005/06 - 2006/07
A. Bauder, S. Steffen and S. Usselmann 129/130 2007/08 - 2008/09
A. Bauder 131/132 - 135/136 2009/10 - 2014/15
iv
Contents
Summary iii
Published Reports iv
1 Introduction 1
2 Weather and Climate 3
2.1 Weather and Climate in 2013/14 . . . . . . . . . . . . . . . . . . . . . . . . . . . 3
2.2 Weather and Climate in 2014/15 . . . . . . . . . . . . . . . . . . . . . . . . . . . 4
3 Length Variation 7
3.1 Introduction . . . . . . . . . . . . . . . . . . . . . . . . . . . . . . . . . . . . . . 7
3.2 Length Variations in 2013/14 . . . . . . . . . . . . . . . . . . . . . . . . . . . . . 7
3.3 Length Variations in 2014/15 . . . . . . . . . . . . . . . . . . . . . . . . . . . . . 8
3.4 Length Variations in 2013/14 and in 2014/15, Summary . . . . . . . . . . . . . . 9
3.5 Length Variations - Statistics for 1880-2015 . . . . . . . . . . . . . . . . . . . . . 14
4 Mass Balance 19
4.1 Introduction, cumulative mean specific mass balances . . . . . . . . . . . . . . . . 19
4.2 Mass Balance in 2013/14 . . . . . . . . . . . . . . . . . . . . . . . . . . . . . . . 21
4.3 Mass Balance in 2014/15 . . . . . . . . . . . . . . . . . . . . . . . . . . . . . . . 22
4.4 Ghiacciaio del Basodino . . . . . . . . . . . . . . . . . . . . . . . . . . . . . . . . 23
4.5 Findelengletscher . . . . . . . . . . . . . . . . . . . . . . . . . . . . . . . . . . . . 27
4.6 Griesgletscher (Aegina) . . . . . . . . . . . . . . . . . . . . . . . . . . . . . . . . 32
4.7 Vadret dal Murtel . . . . . . . . . . . . . . . . . . . . . . . . . . . . . . . . . . . 37
4.8 Pizolgletscher . . . . . . . . . . . . . . . . . . . . . . . . . . . . . . . . . . . . . 40
4.9 Glacier de la Plaine Morte . . . . . . . . . . . . . . . . . . . . . . . . . . . . . . . 43
4.10 Rhonegletscher . . . . . . . . . . . . . . . . . . . . . . . . . . . . . . . . . . . . . 46
4.11 Sankt Annafirn . . . . . . . . . . . . . . . . . . . . . . . . . . . . . . . . . . . . . 50
4.12 Silvrettagletscher . . . . . . . . . . . . . . . . . . . . . . . . . . . . . . . . . . . . 54
4.13 Glacier de Tsanfleuron . . . . . . . . . . . . . . . . . . . . . . . . . . . . . . . . . 59
4.14 Claridenfirn . . . . . . . . . . . . . . . . . . . . . . . . . . . . . . . . . . . . . . . 63
4.15 Grosser Aletsch (Jungfraufirn) . . . . . . . . . . . . . . . . . . . . . . . . . . . . 66
4.16 Homogenized time series of Claridenfirn . . . . . . . . . . . . . . . . . . . . . . . 68
4.17 Re-analyzed mass balance series . . . . . . . . . . . . . . . . . . . . . . . . . . . . 74
v
5 Velocity 83
5.1 Introduction . . . . . . . . . . . . . . . . . . . . . . . . . . . . . . . . . . . . . . 83
5.2 Glacier du Gietro . . . . . . . . . . . . . . . . . . . . . . . . . . . . . . . . . . . . 84
5.3 Glacier de Corbassiere . . . . . . . . . . . . . . . . . . . . . . . . . . . . . . . . . 87
5.4 Mattmark . . . . . . . . . . . . . . . . . . . . . . . . . . . . . . . . . . . . . . . 90
6 Englacial Temperature 93
6.1 Introduction . . . . . . . . . . . . . . . . . . . . . . . . . . . . . . . . . . . . . . 93
6.2 Colle Gnifetti (Monte Rosa) . . . . . . . . . . . . . . . . . . . . . . . . . . . . . . 94
7 Hazardous Glaciers in Switzerland 99
7.1 Introduction . . . . . . . . . . . . . . . . . . . . . . . . . . . . . . . . . . . . . . 99
7.2 Canton of Valais . . . . . . . . . . . . . . . . . . . . . . . . . . . . . . . . . . . . 99
7.3 Canton of Berne . . . . . . . . . . . . . . . . . . . . . . . . . . . . . . . . . . . . 101
7.4 Canton of Graubunden (Grisons) . . . . . . . . . . . . . . . . . . . . . . . . . . . 104
References 105
Acknowledgements 110
A Remote Sensing 111
A.1 Aerial photographs . . . . . . . . . . . . . . . . . . . . . . . . . . . . . . . . . . . 111
B Remarks on Individual Glaciers 115
C Investigators 135
C.1 Length Variation (2015) . . . . . . . . . . . . . . . . . . . . . . . . . . . . . . . . 135
C.2 Mass Balance and Velocity . . . . . . . . . . . . . . . . . . . . . . . . . . . . . . 138
C.3 Englacial Temperature . . . . . . . . . . . . . . . . . . . . . . . . . . . . . . . . . 138
vi
1 Introduction
Systematic and long-term records of glacier changes in Switzerland started in 1880 with annual
length change measurements of selected glaciers. At that time, these measurements were moti-
vated by questions about past and future ice ages. In the meantime, the goals of worldwide glacier
monitoring have evolved and multiplied. Glacier change data are necessary for investigations of the
glacier-climate interaction, but the data are also important for the assessment of water resources,
sea-level rise and natural hazards. Finally, the broad public manifests an increasing interest in
glacier retreat as an element of the Alpine environment excellently illustrating climate change.
The main focus of the Swiss glacier monitoring network is to collect the following data: (1) length
change, (2) mass balance, (3) volume change, (4) surface flow speed, (5) glacier parameters
(e.g. surface area), and (6) englacial temperature. The programme for GLAcier MOnitoring in
Switzerland (GLAMOS) has been adopted by the Cryospheric Commission in March 2007 and
receives long-term funding by the Federal Office for Environment (BAFU), MeteoSwiss within the
Global Climate Observing System (GCOS) Switzerland, the Swiss Academy of Sciences (SCNAT),
and support by the Federal Office of Topography (swisstopo) since 1.1.2016. A detailed description
of the aims, the current status and perspectives of the monitoring programme was presented in
Chapter 1.1 of ”The Swiss Glaciers” Volume 125/126.
The results of Swiss glacier monitoring contribute to the international efforts to document glacier
fluctuations worldwide as part of global environmental monitoring initiatives of the Global Terres-
trial Network for Glaciers (GTN-G) within the Global Terrestrial and Climate Observing System
(GTOS/GCOS). Results are reported to the World Glacier Monitoring Service (WGMS).
This report is the new volume No. 135/136 in the series ”The Swiss Glaciers” and presents the
results of the two observational periods 2013/14 and 2014/15. It carries on the long tradition of
yearbooks documenting monitored fluctuations of Swiss glaciers since 1880 (see page iv). Data and
digital versions of the present and earlier volumes are available at http://glaciology.ethz.ch/swiss-
glaciers. Thanks to the continuous efforts of many people, public and private organisations in
Switzerland, long time-series of data related to glacier changes have been acquired and are highly
valuable for scientific research, applied questions and outreach.
The present data-report expands the short overview of general outcomes published annually in
German, French and Italian in the magazine ”Die Alpen - Les Alpes - Le Alpi” of the Swiss Alpine
Club with detailed facts and figures.
1

2 Weather and Climate
In this section the weather and climate conditions for 2013/14 and 2014/15, the two periods
under review, are described. We focus on the two variables that are most relevant for glacier mass
balance: temperature and precipitation. In general, glacier mass balance is determined largely by
the amount of winter snowfall and by air temperature during summer. High temperatures in April,
May or June can diminish the winter snowpack rapidly and expose the much darker ice surface as
early as July. During July and August the amount of solar radiation is high, which enhances the
melting of the unprotected ice surface. When these two factors are combined, very negative mass
balances can be expected, as occurred during the heatwave of summer 2003. On the other hand,
summer snow down to the glacier termini protects the ice surface from melting and leads to less
negative mass balances.
We have selected the four high-elevation climate stations at Grand St-Bernard (2472 m a.s.l.),
Jungfraujoch (3580 m a.s.l.), Santis (2502 m a.s.l.) and Weissfluhjoch (2690 m a.s.l.) to illustrate
the monthly anomalies in air temperature (Figure 2.1), and 14 stations (Airolo, Chateau-d’Oex,
Disentis, Engelberg, Elm, Grand St-Bernard, Grimsel Hospiz, Montana, Lauterbrunnen, Santis,
Scuol, Sils-Maria, Weissfluhjoch, Zermatt) throughout all regions of the Swiss Alps for monthly
anomalies in precipitation (Figure 2.2) during the two periods. For annual precipitation and mean
summer temperature, the long-term record since 1880 is shown in Figures 2.3 and 2.4 as a mean
of 12 homogenized climate stations (Begert et al., 2005). All stations belong to the observational
networks maintained by MeteoSwiss. The description of the weather conditions in the two periods
under review stems from the figures and the annual and monthly reports of the meteorological
conditions found in the data provided by the observational networks maintained by MeteoSwiss.
2.1 Weather and Climate in 2013/14
Despite ample snowfalls in November 2013, mostly in the eastern Swiss Alps, snow depth remained
well below average until Christmas in all regions of Switzerland. After that, the southern side of the
Alps in particular was affected by extreme snow precipitation events that in some places experienced
more than 100 cm of snowfall in 24 hours. Until February 2014, two to three times the normal
amount of snow was recorded south of the main Alpine divide with snow depths of 2-2.5 m at
1500 m a.s.l. Since the beginning of the measurements, the Winter 2013/14 was the wettest on
the south side of the Alps since measurements began. By contrast, frequent fohn led to mild
temperatures, sparse precipitation and snow depth well below average in the north. At some low-
3

The Swiss Glaciers 2013/14 and 2014/15
Oct Nov Dec Jan Feb Mar Apr May Jun Jul Aug Sep-6
-4
-2
0
2
4
6
Tem
pera
ture
ano
mal
y (d
eg C
)
2013/142014/15
Figure 2.1: Mean monthly anomaly of temperature from the long-term climatic mean
(period 1961-1990) for four selected stations in the MeteoSwiss network.
Anomalies in the two reporting periods 2013/14 and 2014/15 are shown.
elevation stations not a single day with snow was observed. The warm and rather dry months of
March and April contributed to an early onset of snowmelt on the glacier tongues. July and August
were characterized by average air temperatures (Figure 2.1) but also by significant precipitations
amounts, especially in July, when almost twice the typical amount was recorded at alpine stations
(Figure 2.2). In combination, these weather conditions led to frequent fresh snowfalls at elevations
of more than 3000 m a.s.l. and, hence, contributed to favourable conditions for the glaciers. In
September, however, relatively high temperatures prolonged the melting of snow and ice well into
autumn.
Compared to the period 1961-1990, summer air temperatures (May to September) were 0.9◦C
higher than the long-term mean (Figure 2.3). Annual precipitation amounts were 7% above
average for the whole of Switzerland (Figure 2.4). Winter precipitation in particular strongly
differed between the south and the north side of the Alps. For glaciers influenced by both large
amounts of winter snow and, at sufficiently high elevations, by summer snow events (Engadine,
Valais at the border to Italy), the particular weather conditions in 2013/14 resulted in the first
year of slightly positive glacier mass balances for over a decade.
2.2 Weather and Climate in 2014/15
Early winter 2014/15 was characterized by record warm temperatures and very below-average
amounts of snow (Figures 2.1 and 2.2). Until Christmas almost no snow was present in the Alpine
valleys, while in the second half of January, several events brought a significant amount of snow,
especially on the south side of the Alps. Considering the entire winter season, snow depth was close
to average only above 2200 m a.s.l., which can be attributed to the relatively high air temperatures
throughout the winter months. Significant differences in snow depth between the North and the
4
2. Weather and Climate
Oct Nov Dec Jan Feb Mar Apr May Jun Jul Aug Sep-100
-50
0
50
100
Per
cipi
tatio
n an
omal
y (%
)
2013/142014/15
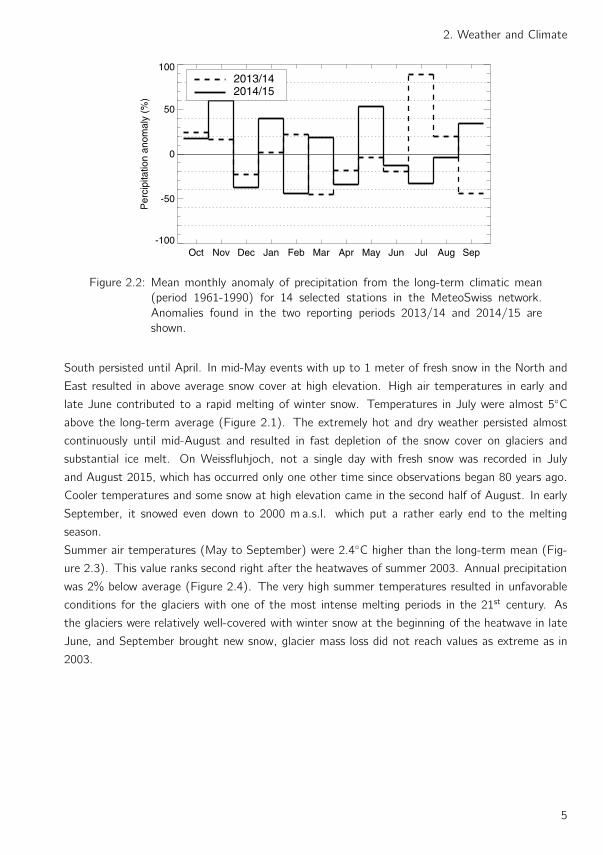
Figure 2.2: Mean monthly anomaly of precipitation from the long-term climatic mean
(period 1961-1990) for 14 selected stations in the MeteoSwiss network.
Anomalies found in the two reporting periods 2013/14 and 2014/15 are
shown.
South persisted until April. In mid-May events with up to 1 meter of fresh snow in the North and
East resulted in above average snow cover at high elevation. High air temperatures in early and
late June contributed to a rapid melting of winter snow. Temperatures in July were almost 5◦C
above the long-term average (Figure 2.1). The extremely hot and dry weather persisted almost
continuously until mid-August and resulted in fast depletion of the snow cover on glaciers and
substantial ice melt. On Weissfluhjoch, not a single day with fresh snow was recorded in July
and August 2015, which has occurred only one other time since observations began 80 years ago.
Cooler temperatures and some snow at high elevation came in the second half of August. In early
September, it snowed even down to 2000 m a.s.l. which put a rather early end to the melting
season.
Summer air temperatures (May to September) were 2.4◦C higher than the long-term mean (Fig-
ure 2.3). This value ranks second right after the heatwaves of summer 2003. Annual precipitation
was 2% below average (Figure 2.4). The very high summer temperatures resulted in unfavorable
conditions for the glaciers with one of the most intense melting periods in the 21st century. As
the glaciers were relatively well-covered with winter snow at the beginning of the heatwave in late
June, and September brought new snow, glacier mass loss did not reach values as extreme as in
2003.
5

The Swiss Glaciers 2013/14 and 2014/15
1880 1900 1920 1940 1960 1980 2000 −2
−1
0
1
2
3
Tem
pera
ture
ano
mal
ies
(o C
)
Figure 2.3: Anomalies of mean summer air temperature (May-September) from the
mean value 1961-1990 in degrees Celcius for the period 1864-2015. The
gray shaded area highlights the years of the current report.
1880 1900 1920 1940 1960 1980 2000
−40
−20
0
20
Pre
cipi
tatio
n an
omal
ies
(%
)
Figure 2.4: Anomalies of annual precipitation (hydrological year) from the mean value
1961-1990 in percentage for the period 1864-2015. The gray shaded area
highlights the years of the current report.
6

3 Length Variation
3.1 Introduction
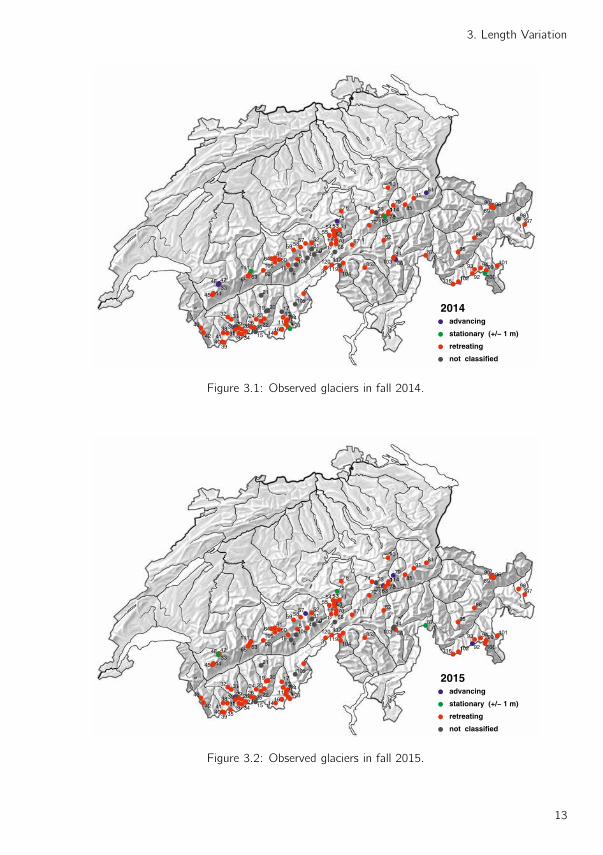
In the two periods covered this report, 114 of about 125 glaciers in the observational network were
actively observed (Figures 3.1, 3.2 and Table 3.1). The other glaciers have melted back drastically
and are often debris-covered, on one hand, with the result that it is simply not possible to carry
out a proper survey at yearly intervals. On the other hand, a number of glaciers were observed
only at irregular intervals, and the measurement values obtained were rather imprecise, which does
not justify retaining these figures in the charts and analyses.
During the two years under review, 2013/14 and 2014/15, Swiss glaciers suffered further losses in
length. As in previous periods, most of the measurements were within the range of 0 to -30m for
both periods. This overall trend was overshadowed in both years by a few very high retreat values,
which could be traced to local influences as in previous years, or which relate to larger glaciers,
and in some cases also pertain to a period of several years. They are usually also the result of a
process extending over a longer period of time and thus are not unexpected.
3.2 Length Variations in 2013/14
In autumn 2014 changes in the terminus position as compared to the previous years were determined
at 96 glaciers (Figure 3.1). Of these, 88 were found to be in recession, for four there was no change
observed, and another four glaciers showed a positive value. With the exception of three glaciers,
the values ranged from a retreat of -100m at Bluemlisalpgletscher to a slight advance of +8m at
Firnalpelifirn. Approximately two-thirds of the measurement values lay between -1 and -30m.
The three exceptions refer to the massive retreats of Schwarzgletscher, Unterer Grindelwald-
gletscher and Kehlengletscher. The large retreat values are a result of the evolution of the glaciers
over the past ten years. The heavily debris-covered tongue and the absence of ice supply from the
accumulation area resulted in a gradual thinning of the flat tongues, while no change in length oc-
curred. At all three glaciers, the dynamic terminus shifted back abruptly during the summer when
a large portion of the tongue detached at a break in the terrain where the ice was thinned out.
The timing of these events was rather arbitrary and only poorly reflects the overall and continuous
change in these glaciers. The sporadic positive measurement values stem from the specific weather
conditions in the year under review, and not from an advance due to a surplus of ice supply from
7

The Swiss Glaciers 2013/14 and 2014/15
the accumulation area after consecutive years of a positive mass balance. The increase in length
resulted from local conditions in an individual year, with both firn deposits at the margin of the
glacier and reduced melting at the terminus.
3.3 Length Variations in 2014/15
Length variations were determined for 99 glaciers in autumn 2015 (Figure 3.2). Of these, 91
became shorter, four did not change their position, and another four were slightly in advance.
With six exceptions, the values ranged from a recession of barely 100 meters at Schwarzgletscher
to an advance of 18 meters at Bifertenfirn. More than two thirds of the measurement values lay
between -1 and -30 meters.
Unterer Grindelwaldgletscher, Gamchigletscher, Vadret da Morteratsch and Turtmanngletscher
were the exceptions, together with two additional glaciers, where the length change was evaluated
in a multi-year period. The high retreat values for each is linked to a process that has been underway
for many years. Due to an increasingly thicker debris cover on the tongue or the continued absence
of ice flow from the accumulation areas, the glaciers have been melting irregularly or have thinned
out without any reduction in length. In an individual year such as the period under review, a large,
flat area melted suddenly and completely, disintegrated into individual ice masses, or broke apart in
a steep section of terrain. As a result, the active terminus shifted back abruptly and substantially.
8

3. Length Variation
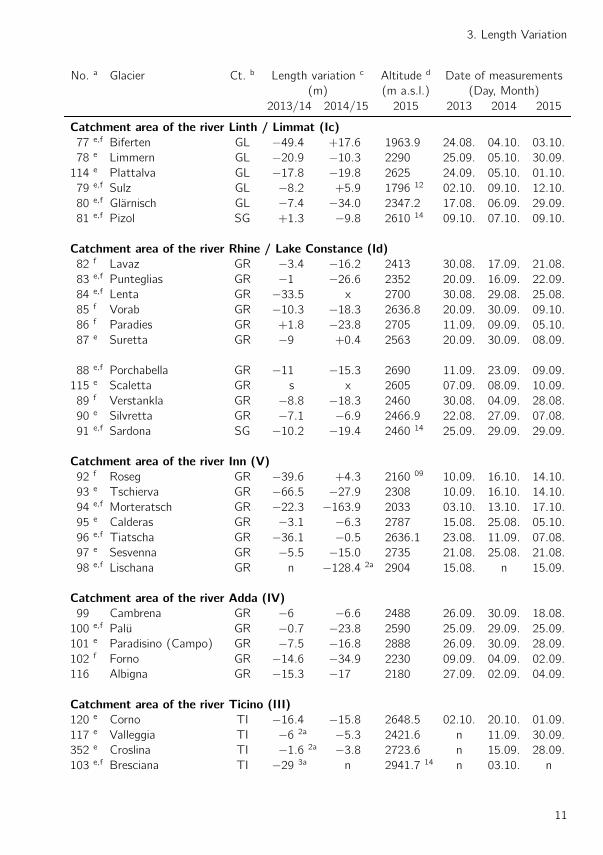
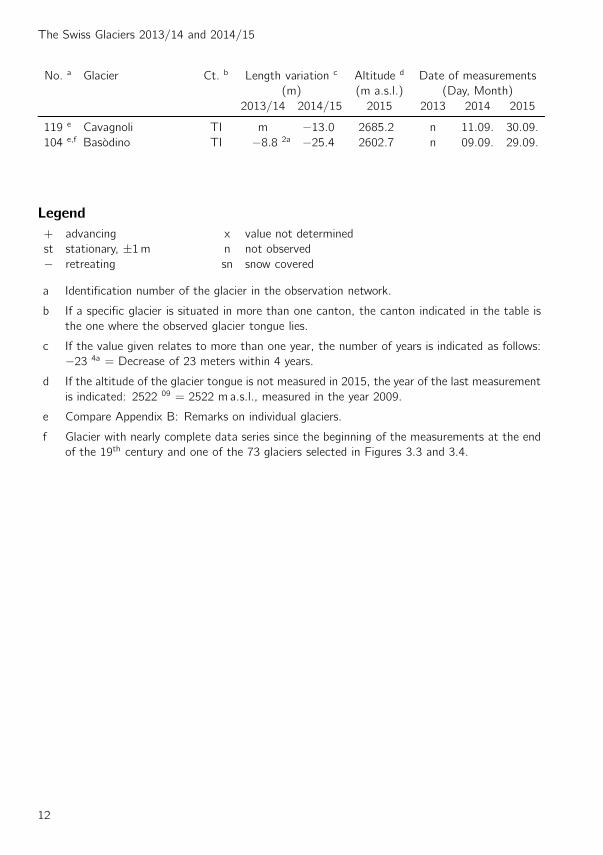
3.4 Length Variations in 2013/14 and in 2014/15, Summary
No. a Glacier Ct. b Length variation c Altitude d Date of measurements
(m) (m a.s.l.) (Day, Month)
2013/14 2014/15 2015 2013 2014 2015
Catchment area of the river Rhone (II)
1 e,f Rhone VS −27.6 −6.2 2208.1 23.09. 23.09. 05.08.
3 e,f Gries VS −44.7 −45.2 2427.0 21.08. 23.09. 31.08.
4 e,f Fiescher VS n −210 3a 1682 n n 28.08.
5 e,f Grosser Aletsch VS −31.9 −53.5 1598.5 21.08. 22.08. 26.08.
7 e,f Kaltwasser VS −14.3 −6 2660 12 26.09. 26.09. 30.09.
173 e Seewjinen VS −1.0 −12.8 2735.5 04.09. 02.10. 21.09.
10 e,f Schwarzberg VS −16.4 −22.8 2663.2 04.09. 02.10. 21.09.
11 e,f Allalin VS −8.6 −15.9 2681.2 04.09. 02.10. 21.09.
174 e Hohlaub VS −1.6 −3.7 2839.4 04.09. 02.10. 21.09.
12 e Kessjen VS −3.5 −3.3 2866.1 04.09. 02.10. 21.09.
13 e,f Fee VS −21.1 −44.5 2259 26.09. 24.09. 02.10.
14 e,f Gorner VS −30 −72 2211 21.10. 03.10. 21.09.
16 e,f Findelen VS −33.3 −62.4 2553.2 20.08. 27.08. 05.08.
17 e Ried VS x −30 2319 20.10 14.09 10.10.
18 e,f Lang VS −14 −16 2033 09.10. 04.09. 10.11.
19 e,f Turtmann VS −13 −133.1 2270 10 03.10 08.09 07.10.
20 e Brunegg (Turtmann) VS x −21.8 2500 10 03.10 08.09 07.10.
22 e,f Zinal VS −30.4 2a −9.6 2178 n 12.09. 12.10.
23 e,f Moming VS −7.9 −4.3 2580 13 25.10. 06.10. 29.09.
24 e,f Moiry VS −5.5 −30 2390 25.10. 12.09. 23.09.
25 e,f Ferpecle VS −12.9 −24.8 2205 14 25.10. 09.10. 22.10.
26 Mont Mine VS −14.6 −14 2090 12 25.10. 09.10. 22.10.
27 e,f Arolla (Mont Collon) VS −15.1 −16.2 28.10. 29.09. 21.10.
28 e,f Tsidjiore Nouve VS −8.1 −10.3 2320 28.10. 29.09. 21.10.
29 e,f Cheillon VS −11.4 −15.2 2706 08.10. 31.10. 30.09.
30 e,f En Darrey VS x x 2510 11 n 31.10. 30.09.
31 e,f Grand Desert VS −5.6 −13.4 2817 22.09. 20.09. 19.09.
32 e,f Mont Fort (Tortin) VS −16.5 −14.5 2790 09.10. 28.09. 27.09.
33 e,f Tsanfleuron VS −19.4 −20 2550 22.10. 02.10. 23.10.
34 e Otemma VS −32.8 −24.3 2480 20.09. 08.09. 29.08.
35 e Mont Durand VS x −5 2380 13.09. 12.09. 27.08.
36 e Breney VS −6 −35 2575 21.09. 03.09. 30.08.
37 e Gietro VS −7.9 −17.4 2712.2 04.09. 02.10. 21.09.
38 e Corbassiere VS −36.8 −24.2 2306.7 13.08. 02.10. 21.09.
39 f Valsorey VS −18.6 −18.5 2534 17.10. 14.10. 19.10.
9

The Swiss Glaciers 2013/14 and 2014/15
No. a Glacier Ct. b Length variation c Altitude d Date of measurements
(m) (m a.s.l.) (Day, Month)
2013/14 2014/15 2015 2013 2014 2015
40 e Tseudet VS −13.7 −11.4 2483.5 11 17.10. 14.10. 19.10.
41 Boveyre VS −27 −27.1 2680 14 17.10. 17.10. 19.10.
42 f Saleina VS −29.7 −29.4 1835.3 12 16.10. 18.09. 01.10.
43 e,f Trient VS −41 −4 2110 22.09. 06.09. 27.09.
44 e,f Paneyrosse VD −8.7 −7.4 28.09. 17.09. 30.09.
45 e,f Grand Plan Neve VD −3.5 −11.9 27.09. 12.09. 02.10.
47 e,f Sex Rouge VD +1.1 −4.2 04.09. 11.09. 06.08.
48 e Prapio VD +5.0 −1 2540 27.09. 27.09. 27.08.
Catchment area of the river Aare (Ia)
50 f Oberaar BE n n 2306.9 09 04.09 n n
51 f Unteraar BE n n 1930.3 09 04.09 n n
52 e Gauli BE −51 −13 2170 21.09. 12.09. 21.09.
53 e,f Stein BE −88 −99 2125 22.09. 07.09. 13.09.
54 e Steinlimi BE −88.5 −39 2390 22.09. 07.09. 13.09.
55 e,f Trift (Gadmen) BE −1.2 −3.4 2114.0 22.08. 23.09. 05.08.
57 e,f Oberer Grindelwald BE −11.6 +2.0 2177.1 23.09. 23.09. 05.08.
58 e,f Unterer Grindelwald BE −471.7 −450 1491.6 23.09. 23.09. 05.08.
59 e Eiger BE −7 −12 2397 20.09. 15.09. 25.09.
60 e Tschingel BE −13.6 −7.9 2270 26.09. 16.09. 22.09.
61 e,f Gamchi BE −50 −387 2140 28.09. 27.09. 01.10.
109 e Alpetli (Kanderfirn) BE −24.3 −24.3 2305 21.09. 23.09. 29.90.
62 e,f Schwarz VS −959 2a −100 2540 n 30.09. 12.09.
63 Lammern VS −12 −16 2550 14.09. 29.09. 11.09.
64 e,f Bluemlisalp BE −100.7 −39 2360 23.09. 24.09. 21.09.
65 e,f Ratzli BE −8.8 −3.8 2465.8 21.08. 23.09. 05.08.
111 e Ammerten BE −0.1 −3.3 2350 22.09. 11.09. 20.09.
Catchment area of the river Reuss (Ib)
66 e,f Tiefen UR −29.5 −36.5 2520 13 22.09. 26.09. 02.10.
67 e,f Sankt Anna UR −9.2 −12.9 2600 13 06.09. 26.09. 02.10.
68 e,f Kehlen UR −302.6 −31.1 2380 05.09. 19.09. 21.09.
69 e Rotfirn (Nord) UR −22 −14.3 2070 05.09. 19.09. 21.09.
70 e,f Damma UR −9.4 −25.6 2380 06.09. 20.09. 22.09.
71 e,f Wallenbur UR −43.4 −29.9 2290 08.10. 02.10. 29.09.
72 e,f Brunni UR −3.9 5a −3.5 2560 n 28.08. 26.08.
74 e,f Griess UR −8.1 −13.0 2228 25.09. 03.10. 01.10.
75 e,f Firnalpeli (Ost) OW +8.4 2a +0.2 2220 n 28.08. 10.09.
76 e,f Griessen OW −7.8 2a −14.5 2525 n 19.08. 02.10.
10
3. Length Variation
No. a Glacier Ct. b Length variation c Altitude d Date of measurements
(m) (m a.s.l.) (Day, Month)
2013/14 2014/15 2015 2013 2014 2015
Catchment area of the river Linth / Limmat (Ic)
77 e,f Biferten GL −49.4 +17.6 1963.9 24.08. 04.10. 03.10.
78 e Limmern GL −20.9 −10.3 2290 25.09. 05.10. 30.09.
114 e Plattalva GL −17.8 −19.8 2625 24.09. 05.10. 01.10.
79 e,f Sulz GL −8.2 +5.9 1796 12 02.10. 09.10. 12.10.
80 e,f Glarnisch GL −7.4 −34.0 2347.2 17.08. 06.09. 29.09.
81 e,f Pizol SG +1.3 −9.8 2610 14 09.10. 07.10. 09.10.
Catchment area of the river Rhine / Lake Constance (Id)
82 f Lavaz GR −3.4 −16.2 2413 30.08. 17.09. 21.08.
83 e,f Punteglias GR −1 −26.6 2352 20.09. 16.09. 22.09.
84 e,f Lenta GR −33.5 x 2700 30.08. 29.08. 25.08.
85 f Vorab GR −10.3 −18.3 2636.8 20.09. 30.09. 09.10.
86 f Paradies GR +1.8 −23.8 2705 11.09. 09.09. 05.10.
87 e Suretta GR −9 +0.4 2563 20.09. 30.09. 08.09.
88 e,f Porchabella GR −11 −15.3 2690 11.09. 23.09. 09.09.
115 e Scaletta GR s x 2605 07.09. 08.09. 10.09.
89 f Verstankla GR −8.8 −18.3 2460 30.08. 04.09. 28.08.
90 e Silvretta GR −7.1 −6.9 2466.9 22.08. 27.09. 07.08.
91 e,f Sardona SG −10.2 −19.4 2460 14 25.09. 29.09. 29.09.
Catchment area of the river Inn (V)
92 f Roseg GR −39.6 +4.3 2160 09 10.09. 16.10. 14.10.
93 e Tschierva GR −66.5 −27.9 2308 10.09. 16.10. 14.10.
94 e,f Morteratsch GR −22.3 −163.9 2033 03.10. 13.10. 17.10.
95 e Calderas GR −3.1 −6.3 2787 15.08. 25.08. 05.10.
96 e,f Tiatscha GR −36.1 −0.5 2636.1 23.08. 11.09. 07.08.
97 e Sesvenna GR −5.5 −15.0 2735 21.08. 25.08. 21.08.
98 e,f Lischana GR n −128.4 2a 2904 15.08. n 15.09.
Catchment area of the river Adda (IV)
99 Cambrena GR −6 −6.6 2488 26.09. 30.09. 18.08.
100 e,f Palu GR −0.7 −23.8 2590 25.09. 29.09. 25.09.
101 e Paradisino (Campo) GR −7.5 −16.8 2888 26.09. 30.09. 28.09.
102 f Forno GR −14.6 −34.9 2230 09.09. 04.09. 02.09.
116 Albigna GR −15.3 −17 2180 27.09. 02.09. 04.09.
Catchment area of the river Ticino (III)
120 e Corno TI −16.4 −15.8 2648.5 02.10. 20.10. 01.09.
117 e Valleggia TI −6 2a −5.3 2421.6 n 11.09. 30.09.
352 e Croslina TI −1.6 2a −3.8 2723.6 n 15.09. 28.09.
103 e,f Bresciana TI −29 3a n 2941.7 14 n 03.10. n
11
The Swiss Glaciers 2013/14 and 2014/15
No. a Glacier Ct. b Length variation c Altitude d Date of measurements
(m) (m a.s.l.) (Day, Month)
2013/14 2014/15 2015 2013 2014 2015
119 e Cavagnoli TI m −13.0 2685.2 n 11.09. 30.09.
104 e,f Basodino TI −8.8 2a −25.4 2602.7 n 09.09. 29.09.
Legend
+ advancing x value not determined
st stationary, ±1m n not observed
− retreating sn snow covered
a Identification number of the glacier in the observation network.
b If a specific glacier is situated in more than one canton, the canton indicated in the table is
the one where the observed glacier tongue lies.
c If the value given relates to more than one year, the number of years is indicated as follows:
−23 4a = Decrease of 23 meters within 4 years.
d If the altitude of the glacier tongue is not measured in 2015, the year of the last measurement
is indicated: 2522 09 = 2522 m a.s.l., measured in the year 2009.
e Compare Appendix B: Remarks on individual glaciers.
f Glacier with nearly complete data series since the beginning of the measurements at the end
of the 19th century and one of the 73 glaciers selected in Figures 3.3 and 3.4.
12
3. Length Variation
12
3
45
6
7
10111213
141516
17
18
19 20
21
22
2324
2526
27282930
3132
33
343637
38
39404142
43
4445
4748
505152
535455
575859
6061
6263
64
65
6667
6869 70
7172
7374
75
76
77 78
79
8081
82
83
84
85
86
87
88
89
9091
92
93 94
95
96
9798
99
100
101
102
103
104
105
106109111
114
116
117
119120
173174
352
2014advancing
stationary (+/− 1 m)
retreating
not classified
Figure 3.1: Observed glaciers in fall 2014.
12
3
45
6
7
10111213
141516
17
18
19 20
21
22
2324
2526
27282930
3132
33
3435
3637
38
39404142
43
4445
4748
505152
535455
575859
6061
6263
64
65
6667
6869 70
7172
7374
75
76
77 78
79
8081
82
83
84
85
86
87
88
89
9091
92
93 94
95
96
9798
99
100
101
102
103
104
105
106109111
114
116
117
119120
173174
352
2015advancing
stationary (+/− 1 m)
retreating
not classified
Figure 3.2: Observed glaciers in fall 2015.
13
The Swiss Glaciers 2013/14 and 2014/15
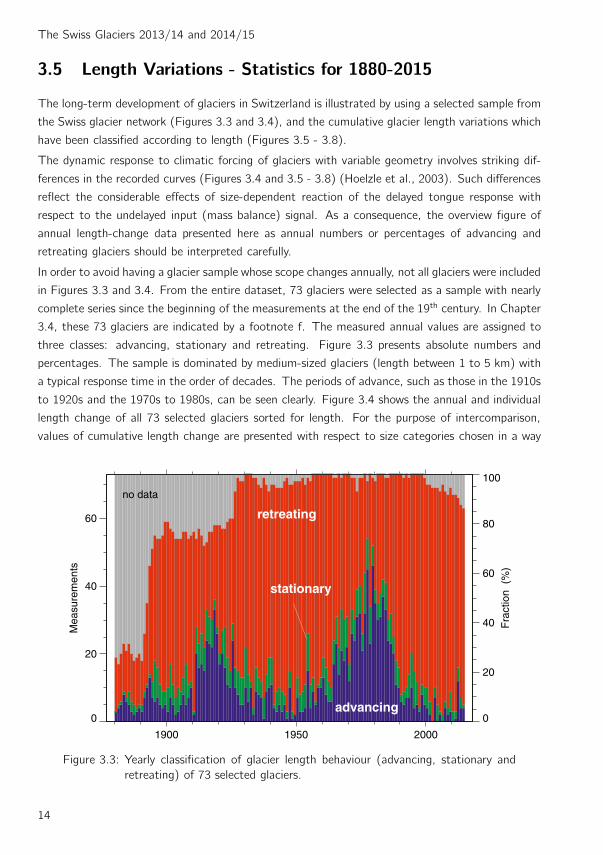
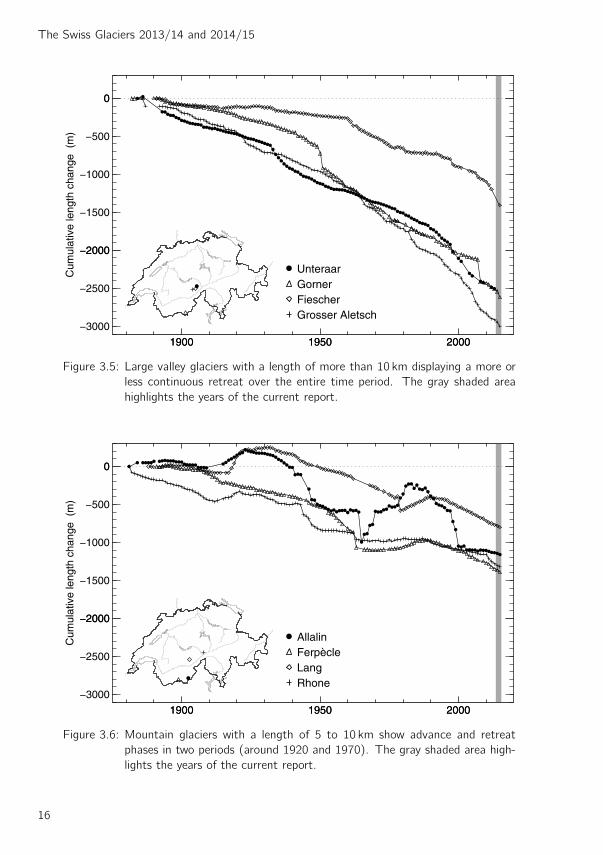
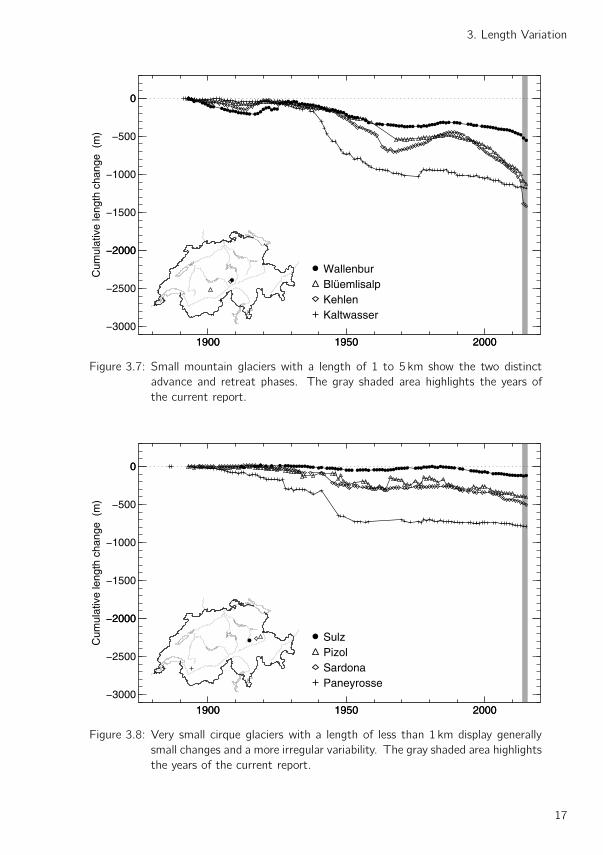
3.5 Length Variations - Statistics for 1880-2015
The long-term development of glaciers in Switzerland is illustrated by using a selected sample from
the Swiss glacier network (Figures 3.3 and 3.4), and the cumulative glacier length variations which
have been classified according to length (Figures 3.5 - 3.8).
The dynamic response to climatic forcing of glaciers with variable geometry involves striking dif-
ferences in the recorded curves (Figures 3.4 and 3.5 - 3.8) (Hoelzle et al., 2003). Such differences
reflect the considerable effects of size-dependent reaction of the delayed tongue response with
respect to the undelayed input (mass balance) signal. As a consequence, the overview figure of
annual length-change data presented here as annual numbers or percentages of advancing and
retreating glaciers should be interpreted carefully.
In order to avoid having a glacier sample whose scope changes annually, not all glaciers were included
in Figures 3.3 and 3.4. From the entire dataset, 73 glaciers were selected as a sample with nearly
complete series since the beginning of the measurements at the end of the 19th century. In Chapter
3.4, these 73 glaciers are indicated by a footnote f. The measured annual values are assigned to
three classes: advancing, stationary and retreating. Figure 3.3 presents absolute numbers and
percentages. The sample is dominated by medium-sized glaciers (length between 1 to 5 km) with
a typical response time in the order of decades. The periods of advance, such as those in the 1910s
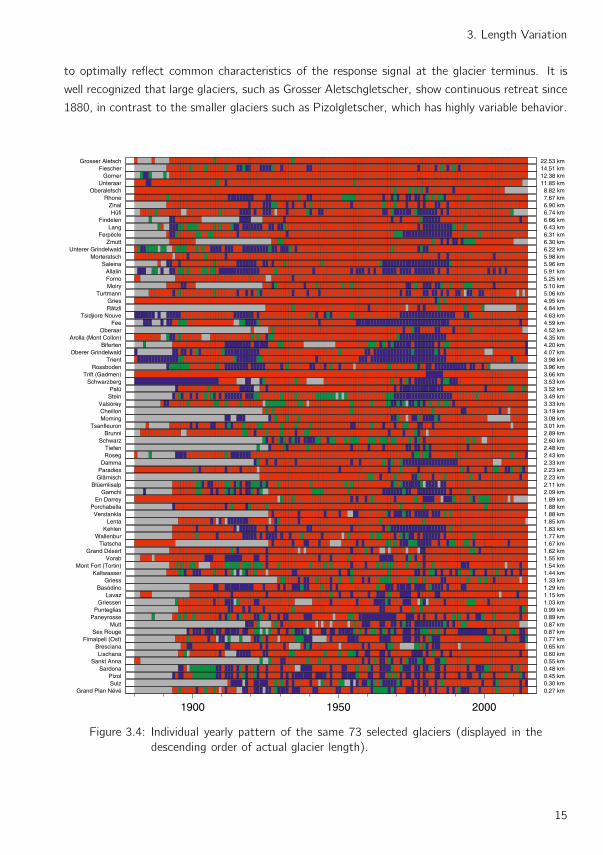
to 1920s and the 1970s to 1980s, can be seen clearly. Figure 3.4 shows the annual and individual
length change of all 73 selected glaciers sorted for length. For the purpose of intercomparison,
values of cumulative length change are presented with respect to size categories chosen in a way
1900 1950 2000
0
20
40
60
Mea
sure
men
ts
no data
retreating
stationary
advancing0
20
40
60
80
100
Fra
ctio
n (
%)
Figure 3.3: Yearly classification of glacier length behaviour (advancing, stationary and
retreating) of 73 selected glaciers.
14
3. Length Variation
to optimally reflect common characteristics of the response signal at the glacier terminus. It is
well recognized that large glaciers, such as Grosser Aletschgletscher, show continuous retreat since
1880, in contrast to the smaller glaciers such as Pizolgletscher, which has highly variable behavior.
1900 1950 2000
Grand Plan Névé 0.27 kmSulz 0.30 kmPizol 0.45 km
Sardona 0.48 kmSankt Anna 0.55 km
Lischana 0.60 kmBresciana 0.65 km
Firnalpeli (Ost) 0.77 kmSex Rouge 0.87 km
Mutt 0.87 kmPaneyrosse 0.89 km
Punteglias 0.99 kmGriessen 1.03 km
Lavaz 1.15 kmBasòdino 1.29 km
Griess 1.33 kmKaltwasser 1.44 km
Mont Fort (Tortin) 1.54 kmVorab 1.55 km
Grand Désert 1.62 kmTiatscha 1.67 km
Wallenbur 1.77 kmKehlen 1.83 km
Lenta 1.85 kmVerstankla 1.88 km
Porchabella 1.88 kmEn Darrey 1.89 km
Gamchi 2.09 kmBlüemlisalp 2.11 km
Glärnisch 2.23 kmParadies 2.23 kmDamma 2.33 km
Roseg 2.43 kmTiefen 2.48 km
Schwarz 2.60 kmBrunni 2.89 km
Tsanfleuron 3.01 kmMoming 3.08 kmCheillon 3.19 kmValsorey 3.33 km
Stein 3.49 kmPalü 3.52 km
Schwarzberg 3.53 kmTrift (Gadmen) 3.66 km
Rossboden 3.96 kmTrient 3.98 km
Oberer Grindelwald 4.07 kmBiferten 4.20 km
Arolla (Mont Collon) 4.35 kmOberaar 4.52 km
Fee 4.59 kmTsidjiore Nouve 4.63 km
Rätzli 4.84 kmGries 4.95 km
Turtmann 5.06 kmMoiry 5.10 kmForno 5.25 kmAllalin 5.91 km
Saleina 5.96 kmMorteratsch 5.98 km
Unterer Grindelwald 6.22 kmZmutt 6.30 km
Ferpècle 6.31 kmLang 6.43 km
Findelen 6.66 kmHüfi 6.74 km
Zinal 6.90 kmRhone 7.67 km
Oberaletsch 8.82 kmUnteraar 11.85 km
Gorner 12.38 kmFiescher 14.51 km
Grosser Aletsch 22.53 km
Figure 3.4: Individual yearly pattern of the same 73 selected glaciers (displayed in the
descending order of actual glacier length).
15
The Swiss Glaciers 2013/14 and 2014/15
1900 1950 2000
−3000
−2500
−2000
−1500
−1000
−500
0
Cum
ulat
ive
leng
th c
hang
e (
m)
1900 1950 2000
−2000
0
Grosser AletschFiescherGornerUnteraar
Figure 3.5: Large valley glaciers with a length of more than 10 km displaying a more or
less continuous retreat over the entire time period. The gray shaded area
highlights the years of the current report.
1900 1950 2000
−3000
−2500
−2000
−1500
−1000
−500
0
Cum
ulat
ive
leng
th c
hang
e (
m)
1900 1950 2000
−2000
0
RhoneLangFerpècleAllalin
Figure 3.6: Mountain glaciers with a length of 5 to 10 km show advance and retreat
phases in two periods (around 1920 and 1970). The gray shaded area high-
lights the years of the current report.
16
3. Length Variation
1900 1950 2000
−3000
−2500
−2000
−1500
−1000
−500
0C
umul
ativ
e le
ngth
cha
nge
(m
)
1900 1950 2000
−2000
0
KaltwasserKehlenBlüemlisalpWallenbur
Figure 3.7: Small mountain glaciers with a length of 1 to 5 km show the two distinct
advance and retreat phases. The gray shaded area highlights the years of
the current report.
1900 1950 2000
−3000
−2500
−2000
−1500
−1000
−500
0
Cum
ulat
ive
leng
th c
hang
e (
m)
1900 1950 2000
−2000
0
PaneyrosseSardonaPizolSulz
Figure 3.8: Very small cirque glaciers with a length of less than 1 km display generally
small changes and a more irregular variability. The gray shaded area highlights
the years of the current report.
17
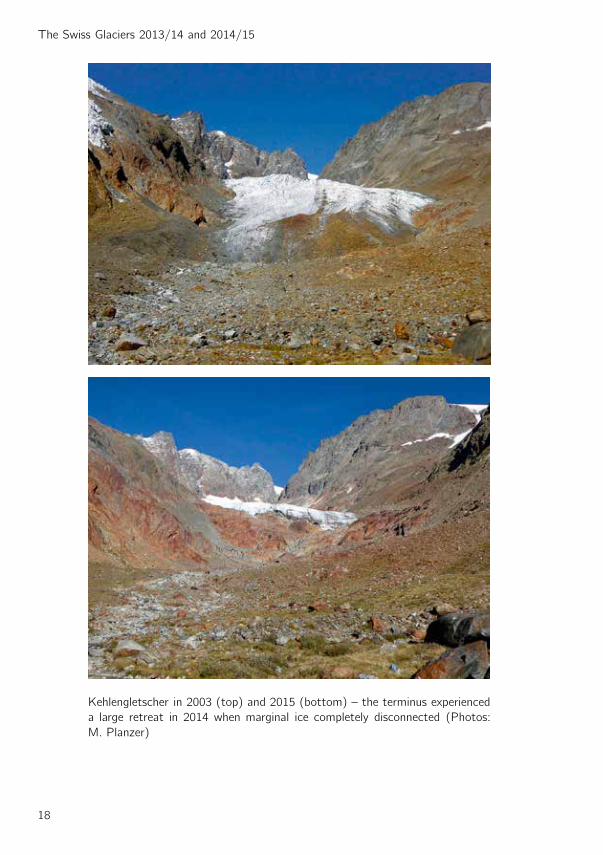
The Swiss Glaciers 2013/14 and 2014/15
Kehlengletscher in 2003 (top) and 2015 (bottom) – the terminus experienced
a large retreat in 2014 when marginal ice completely disconnected (Photos:
M. Planzer)
18

4 Mass Balance
4.1 Introduction, cumulative mean specific mass balances
Detailed mass balance data were collected using the glaciological method for Ghiacciaio del
Basodino, Findelengletscher, Griesgletscher, Vadret dal Murtel, Pizolgletscher, Glacier de la Plaine
Morte, Rhonegletscher, Sankt Annafirn, Silvrettagletscher and Glacier de Tsanfleuron in Switzer-
land. In addition to these investigations measurements of mass balance were also taken at Clar-
idenfirn, Jungfraufirn (Grosser Aletschgletscher), Glacier du Gietro and Glacier de Corbassiere
(cf. Chapter 5), as well as in the Mattmark region (Allalin, Hohlaub, Schwarzberg, Chapter 5). In
Figure 4.1 the location within Switzerland of all these glaciers is shown.
The mass balance measurements at stakes, in snow pits and extensive snow probing in spring were
Basòdino
Findelen
Gries
Pizol
Sankt Anna
Silvretta
Rhone
Tsanfleuron
Plaine MorteMurtèl
Clariden
Grosser Aletsch
Allalin
SchwarzbergCorbassière
Giétro
Figure 4.1: Investigated glaciers for mass balance with the focus on spatial distribution
and analysis of mean specific seasonal components of mass balance (dark
blue) or point measurements (light blue).
19

The Swiss Glaciers 2013/14 and 2014/15
1960 1980 2000−40
−30
−20
−10
0C
umul
ativ
e m
ass
bala
nce
(m
w.e
.)
1960 1980 2000−40
−30
−20
−10
0
Basòdino
Findelen
Gries
Pizol
Rhone
Silvretta
Figure 4.2: Cumulative mean specific mass balance over the whole observation period
for the glaciers Silvretta, Rhone, Pizol, Gries, Findelen and Basodino. The
gray shaded area highlights the years of the current report.
used to calculate the mean specific components of mass balance following the methods described
in Huss et al. (2009). Extrapolation from individual measurements to the entire glacier surface was
performed using a mass balance model including the most important processes governing glacier
mass balance distribution. The procedure is divided into two steps:
(1) The model is tuned such that both the measurements of winter accumulation and summer
ablation are matched optimally over the periods defined by the exact dates of the in-situ
measurements which are reported for the years of the current report. This allows extrapola-
tion of mass balance based on a physical representation of the spatial variability, as well as
the calculation of mass balance over fixed date periods (e.g. the hydrological year).
(2) A periodical final reanalysis and homogenisation with independently derived ice volume changes
is reported separately in five to ten year intervals after evaluation.
The cumulative mean specific winter and annual balances of the glaciers with extensive obser-
vation series are presented in Table 4.1. Numbers for Adlergletscher as a former tributary of
Findelengletscher have been evaluated separately but detailed figures are presented together with
Findelengletscher. A similar situation exists at Glacier du Sex Rouge, a small glacier that is con-
nected by an ice-divide to Glacier de Tsanfleuron. The long-term trends are very well recognizable
for Griesgletscher and Silvrettagletscher with long time-series (Figure 4.2). Notably, the acceler-
ated mass loss since the mid-1980s is remarkable, as are the balanced mass budgets recorded in
20

4. Mass Balance
Table 4.1: Summary table with area, mean specific winter and annual balance, ELA and
AAR for the measurement periods 2013/14 and 2014/15.
Glacier No. Period Area Bw Ba ELA AAR
(km2) (mm w.e.) (mm w.e.) (m a.s.l.) (%)
Basodino 104 2013/14 1.842 1896 −211 2945 36
2014/15 1.842 1928 −1345 3125 1
Findelen 16 2013/14 12.880 1258 159 3185 70
2014/15 12.880 1197 −606 3305 53
Adler 16 2013/14 2.011 975 230 3355 65
2014/15 2.011 985 −378 3495 41
Gries 3 2013/14 4.431 1638 −568 2995 41
2014/15 4.431 1764 −1713 3255 0
Murtel 377 2013/14 0.301 1439 534 3157 74
2014/15 0.302 1076 −902 3222 19
Pizol 81 2013/14 0.067 1148 −1222 2777 1
2014/15 0.067 1856 −1501 2777 1
Plaine Morte 65 2013/14 7.549 1011 −991 2805 1
2014/15 7.549 1235 −2395 2935 0
Rhone 1 2013/14 15.571 1197 −353 2915 57
2014/15 15.571 1723 −1083 2995 45
Sankt Anna 67 2013/14 0.195 1881 −437 2792 33
2014/15 0.193 1801 −1477 2917 0
Silvretta 90 2013/14 2.684 1202 −786 2925 21
2014/15 2.684 1397 −1649 3025 1
Tsanfleuron 33 2013/14 2.618 1391 −610 2835 18
2014/15 2.618 1565 −2744 2975 0
Sex Rouge 47 2013/14 0.270 1176 −613 2832 9
2014/15 0.270 1447 −2213 2882 0
the 1960s and 70s. The point measurements of the mass balance are of particular significance
with regard to answering questions related to climate change (Ohmura et al., 2007; Huss and
Bauder, 2009; Gabbi et al., 2015). The four existing long-term time series (Claridenfirn, Grosser
Aletschgletscher, Silvrettagletscher) start in the 1910s and cover almost the entire 20th century.
Mass balance data of the present report have also been submitted to the World Glacier Monitor-
ing Service (WGMS) as a contribution to the efforts of international glacier monitoring (WGMS,
2013).
4.2 Mass Balance in 2013/14
The glacier-wide mass balance in seasonal resolution was determined by measuring snow accumu-
lation during winter and melting in summer for the ten glaciers: Basodino, Findelen, Gries, Murtel,
Pizol, Plaine Morte, Rhone, Sankt Anna, Silvretta and Tsanfleuron. On glaciers located south of
the main Alpine ridge and in Engadine (e.g., Findelen, Murtel) a balanced or slightly positive mass
21
The Swiss Glaciers 2013/14 and 2014/15
balance was observed. Glaciers investigated on the north slopes of the Alps showed moderate mass
losses. However, the reduction in average ice thickness between 0.3 and 0.6m w.e. was relatively
small compared with the values registered during the last decade. Most negative mass balances of
a meter or more were found on the glaciers Plaine Morte in the western Swiss Alps and Pizol in
the north-east. Regional differences in mass balance were considerable in this period. The main
Alpine ridge acts as a weather divide and differences between north and south are common. In
this period, they can be attributed to frequent damming of low pressure systems from the south
in winter and spring. This resulted in large amount of snow on the south slopes, whereas dry
conditions predominated in the north. These general conclusions drawn from the glaciers with
focus on glacier-wide results are in accordance with the results on interannual variability revealed
by the long-term point measurements at Claridenfirn and Jungfraufirn.
By upscaling the measurements on individual glaciers to all glaciers in the Swiss Alps, a total
loss in ice volume in the order of 300 million m3 was estimated during this period. This amount
corresponds to a reduction of about 0.6% in the ice volume presently existing. However, we
conclude for this period that the weather conditions were relatively favorable for the glaciers. Only
in the previous period 2012/13 were conditions over the last 10 years even more favorable. Even
though the melting was less dramatic than previously, the mass loss was still substantial.
4.3 Mass Balance in 2014/15
The same ten glaciers were investigated during this period as well with regard to their mass balance.
The differences in mass balance between these glaciers were higher than in previous periods. The
most negative mass balance results were observed at glaciers in the western Swiss Alps. Extreme
values of over -2.5m w.e. were registered at Tsanfleuron and Plaine Morte. The least amount
of mass loss for glaciers under detailed investigations, with average thickness changes at about
-0.6m w.e., was found on Findelen and Allalin in the southern Valais. All other glaciers ranged
between one and two meters of mass loss. The very hot period in summer had an especially strong
impact on the smaller glaciers with areas not extending to higher elevations. At the end of July,
the winter accumulation on most of them had already disppeared completely. The 2015 calendar
year is on record as one of the hottest year since systematic weather observation started in 1864.
However, the slow melt-out in early summer as well as repeated snowfalls in mid-August and in
September prevented a more intensive melt.
Extrapolated over the entire glacierized area in Switzerland, a loss in ice volume of 1300 million
m3 was found. This corresponds to 2.5% of the estimated current ice volume. In summary, the
weather conditions during the period under review were unfavorable for the glaciers in Switzerland.
Snow accumulation during winter was about average, while the summer season turned out to be
very melt-intensive. In comparison to recent decades, as well as the period covering the last 100
years with systematic measurements on the glaciers, this period was among the most negative.
22

4. Mass Balance
4.4 Ghiacciaio del Basodino
Introduction
Ghiacciaio del Basodino is a small north-east facing temperate mountain glacier in the southern
Swiss Alps. The small individual branch descending to the north with a separate tongue is not
considered part of the glacier and not included in the mass balance determination. The main
branch presently covers an area of 1.8 km2 and extends from 2562 to 3186 m a.s.l. Detailed mass
balance investigations have been carried out since 1990. Determination of volumetric changes
in decadal resolution reach further back to 1929 (Bauder et al., 2007). Topographic maps or
photogrammetrical surveys exist for 1929, 1949, 1971, 1985, 1991, 2002, 2008 and 2013. Huss
et al. (2015) re-analyzed and homogenized the seasonal stake data and ice volume changes for the
period 1991 to 2013. The results of the mean specific winter and annual balance for comparable
fixed date periods are presented in Section 4.17 of this report.
3000
3000
2800
2800
23
4
6
7
8
9
1011
12
14
15
6790
00
140250
6815
00
141500
0 1km
Figure 4.3: Surface topography and observational network of the Ghiacciaio del
Basodino.
Investigations in 2013/14
The measurement period extended from 13th September 2013 to 26th September 2014 with a
field visit in spring on 16th May 2014. Abundant firn accumulation was present at the end of the
balance year in September 2014. Snow depth was measured at about 16 locations during the
spring measurement period and supplemented by a density profile from the central sector of the
glacier.
23
The Swiss Glaciers 2013/14 and 2014/15
Investigations in 2014/15
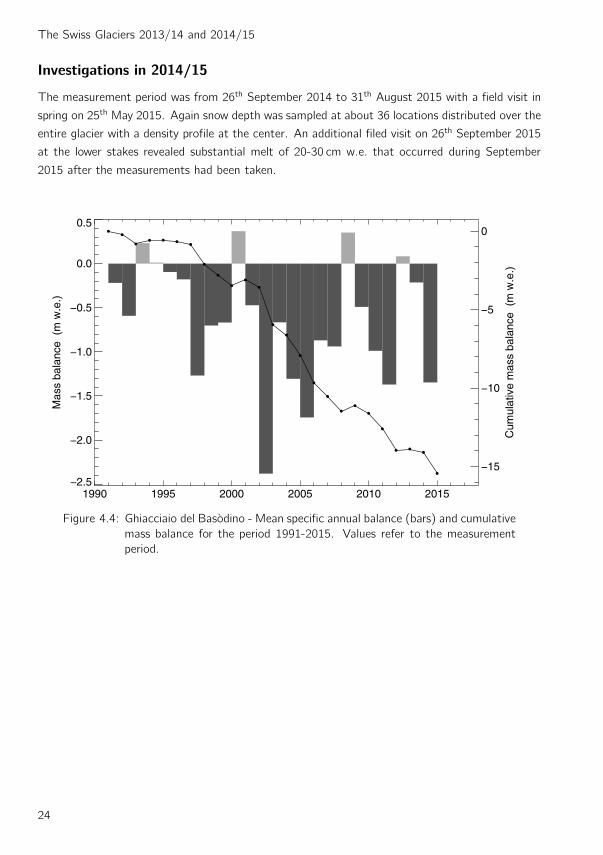
The measurement period was from 26th September 2014 to 31th August 2015 with a field visit in
spring on 25th May 2015. Again snow depth was sampled at about 36 locations distributed over the
entire glacier with a density profile at the center. An additional filed visit on 26th September 2015
at the lower stakes revealed substantial melt of 20-30 cm w.e. that occurred during September
2015 after the measurements had been taken.
1990 1995 2000 2005 2010 2015−2.5
−2.0
−1.5
−1.0
−0.5
0.0
0.5
Mas
s ba
lanc
e (
m w
.e.)
−15
−10
−5
0
Cum
ulat
ive
mas
s ba
lanc
e (
m w
.e.)
Figure 4.4: Ghiacciaio del Basodino - Mean specific annual balance (bars) and cumulative
mass balance for the period 1991-2015. Values refer to the measurement
period.
24

4. Mass Balance
Table 4.2: Ghiacciaio del Basodino - Specific winter and annual balance versus altitude
in the two periods 2013/14 and 2014/15, evaluated for the measurement
period defined by the dates of field survey.
Altitude 2013/14 2014/15
Area bw ba Area bw ba(m a.s.l.) (km2) (mm w.e.) (mm w.e.) (km2) (mm w.e.) (mm w.e.)
2500 - 2600 0.010 2049 −681 0.010 1980 −2114
2600 - 2700 0.141 1967 −377 0.141 1985 −1510
2700 - 2800 0.360 1903 −393 0.360 1982 −1534
2800 - 2900 0.429 1854 −542 0.429 1911 −2326
2900 - 3000 0.528 1960 3 0.528 1968 −744
3000 - 3100 0.314 1868 116 0.314 1882 −711
3100 - 3200 0.059 1526 111 0.059 1481 −1295
2500 - 3200 1.842 1896 −211 1.842 1928 −1345
Table 4.3: Ghiacciaio del Basodino - Individual stake measurements of winter and annual
balance.
Stake Period Coordinates Mass balance
Start Spring End bw ba(m / m / m a.s.l.) (mm w.e.)
4 13.09.2013 16.05.2014 26.09.2014 680061 / 141294 / 2819 1562 −864
6 13.09.2013 16.05.2014 26.09.2014 679650 / 141450 / 2890 1672 −816
8 13.09.2013 16.05.2014 26.09.2014 679500 / 140800 / 3040 2002 426
9 13.09.2013 16.05.2014 26.09.2014 680557 / 141167 / 2758 1786 −608
10 13.09.2013 16.05.2014 26.09.2014 681000 / 141130 / 2689 1782 −976
11 13.09.2013 16.05.2014 26.09.2014 681336 / 141054 / 2610 2433 −432
12 13.09.2013 16.05.2014 26.09.2014 679781 / 140828 / 2990 1870 168
14 13.09.2013 16.05.2014 26.09.2014 679983 / 141017 / 2904 1672 −140
15 13.09.2013 16.05.2014 26.09.2014 679391 / 140978 / 3040 1665 −196
2 26.09.2014 25.05.2015 31.08.2015 680067 / 141303 / 2792 1700 −2440
6 26.09.2014 25.05.2015 31.08.2015 679666 / 141432 / 2848 1850 −1728
8 26.09.2014 25.05.2015 31.08.2015 679618 / 140718 / 3020 2300 90
9 26.09.2014 25.05.2015 31.08.2015 680559 / 141158 / 2738 1700 −1292
10 26.09.2014 25.05.2015 31.08.2015 680990 / 141125 / 2680 2300 −1819
11 26.09.2014 25.05.2015 31.08.2015 681303 / 141021 / 2586 2250 −1080
12 26.09.2014 25.05.2015 31.08.2015 679790 / 140827 / 2970 1900 −140
14 26.09.2014 25.05.2015 31.08.2015 679986 / 141022 / 2874 1750 −1428
15 26.09.2014 25.05.2015 31.08.2015 679390 / 140974 / 3020 1900 −1440
25
The Swiss Glaciers 2013/14 and 2014/15
−4 −2 0 2Specific balance (m w.e.)
2600
2800
3000
3200
Alti
tude
(m
a.s
.l.)
2013/14
−2 0 2Volumetric balance (106 m3 w.e.)
−4 −2 0 2Specific balance (m w.e.)
2600
2800
3000
3200
Alti
tude
(m
a.s
.l.)
2014/15
−2 0 2Volumetric balance (106 m3 w.e.)
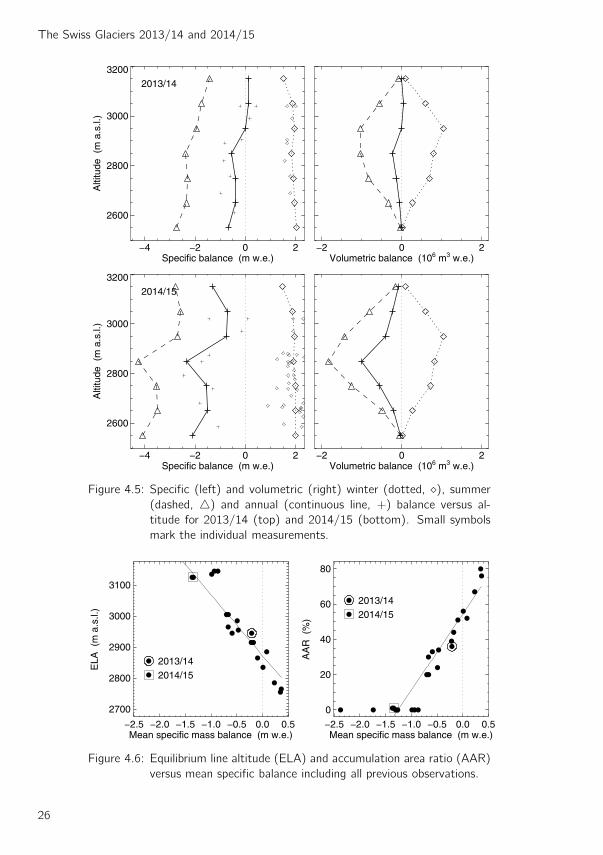
Figure 4.5: Specific (left) and volumetric (right) winter (dotted, ⋄), summer
(dashed, △) and annual (continuous line, +) balance versus al-
titude for 2013/14 (top) and 2014/15 (bottom). Small symbols
mark the individual measurements.
−2.5 −2.0 −1.5 −1.0 −0.5 0.0 0.5Mean specific mass balance (m w.e.)
2700
2800
2900
3000
3100
ELA
(m
a.s
.l.)
2013/142014/15
−2.5 −2.0 −1.5 −1.0 −0.5 0.0 0.5Mean specific mass balance (m w.e.)
0
20
40
60
80
AA
R (
%)
2013/142014/15
Figure 4.6: Equilibrium line altitude (ELA) and accumulation area ratio (AAR)
versus mean specific balance including all previous observations.
26

4. Mass Balance
4.5 Findelengletscher
Introduction
Findelengletscher (12.9 km2) and its former tributary Adlergletscher (2.0 km2) are located in the
southern Valais in the Zermatt area. The two glaciers cover an elevation range from 2580 m a.s.l. to
4120 m a.s.l. Findelengletscher is west-facing and is characterized by gently sloping high-elevation
accumulation basins and a comparatively narrow glacier tongue. The region is relatively dry with
equilibrium line altitudes being among the highest in the Alps. Mass balance measurements on
Findelengletscher were initiated in fall 2004 and the observational network was extended to Adler-
gletscher one year later.
3400
3400
3600
3200
3200
3800
380036
0034003200
2800
2600
3000
F2
F31
F32F4
F5F6
F7
F8
F81
F82
F93
F94
F10
F11
A4
A2
A3
A6
6300
00
96000
6360
00
92000
0 1km
Adlergletscher
Findelengletscher
Figure 4.7: Surface topography and observational network on Findelengletscher and the
former tributary Adlergletscher.
Investigations in 2013/14
Winter mass balance of Findelen- and Adlergletscher was determined on 9th April 2014. Snow
probings were obtained for 321 locations and snow density was measured in five snow pits distributed
over the entire elevation range of the glacier. Ground-based radar provided supplementary data
27
The Swiss Glaciers 2013/14 and 2014/15
2005 2010 2015
−0.8
−0.6
−0.4
−0.2
0.0
0.2
Mas
s ba
lanc
e (
m w
.e.)
−5
−4
−3
−2
−1
0
Cum
ulat
ive
mas
s ba
lanc
e (
m w
.e.)
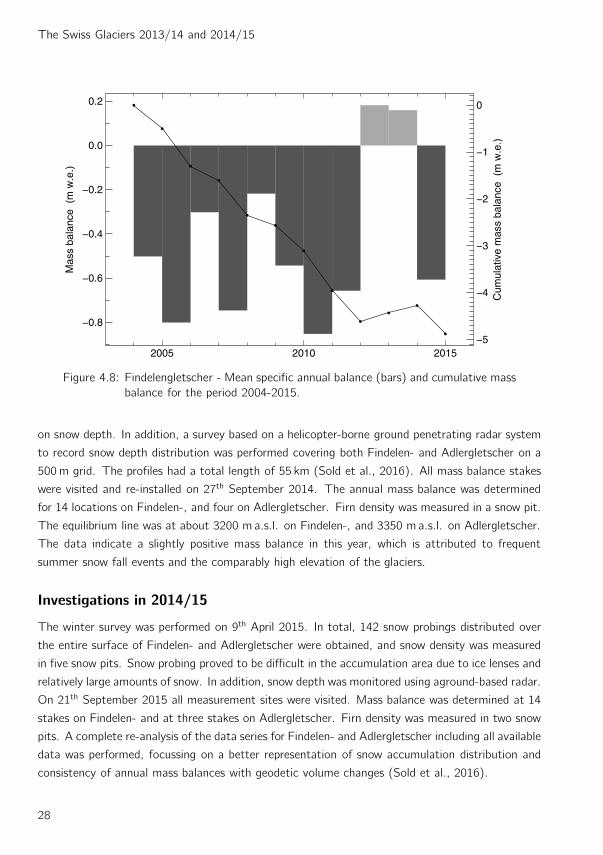
Figure 4.8: Findelengletscher - Mean specific annual balance (bars) and cumulative mass
balance for the period 2004-2015.
on snow depth. In addition, a survey based on a helicopter-borne ground penetrating radar system
to record snow depth distribution was performed covering both Findelen- and Adlergletscher on a
500m grid. The profiles had a total length of 55 km (Sold et al., 2016). All mass balance stakes
were visited and re-installed on 27th September 2014. The annual mass balance was determined
for 14 locations on Findelen-, and four on Adlergletscher. Firn density was measured in a snow pit.
The equilibrium line was at about 3200 m a.s.l. on Findelen-, and 3350 m a.s.l. on Adlergletscher.
The data indicate a slightly positive mass balance in this year, which is attributed to frequent
summer snow fall events and the comparably high elevation of the glaciers.
Investigations in 2014/15
The winter survey was performed on 9th April 2015. In total, 142 snow probings distributed over
the entire surface of Findelen- and Adlergletscher were obtained, and snow density was measured
in five snow pits. Snow probing proved to be difficult in the accumulation area due to ice lenses and
relatively large amounts of snow. In addition, snow depth was monitored using aground-based radar.
On 21th September 2015 all measurement sites were visited. Mass balance was determined at 14
stakes on Findelen- and at three stakes on Adlergletscher. Firn density was measured in two snow
pits. A complete re-analysis of the data series for Findelen- and Adlergletscher including all available
data was performed, focussing on a better representation of snow accumulation distribution and
consistency of annual mass balances with geodetic volume changes (Sold et al., 2016).
28

4. Mass Balance
Table 4.4: Findelengletscher - Specific winter and annual balance versus altitude in the
two periods 2013/14 and 2014/15, evaluated for the measurement period
defined by the dates of field survey.
Altitude 2013/14 2014/15
Area bw ba Area bw ba(m a.s.l.) (km2) (mm w.e.) (mm w.e.) (km2) (mm w.e.) (mm w.e.)
2500 - 2600 0.028 363 −5841 0.028 462 −8229
2600 - 2700 0.259 454 −5417 0.259 623 −7198
2700 - 2800 0.217 583 −4006 0.217 619 −5988
2800 - 2900 0.338 726 −2790 0.338 825 −4410
2900 - 3000 0.578 839 −2190 0.578 892 −3576
3000 - 3100 0.977 991 −1212 0.977 982 −2558
3100 - 3200 1.736 1147 −329 1.736 1227 −1220
3200 - 3300 1.834 1329 440 1.834 1229 −230
3300 - 3400 1.945 1421 791 1.945 1360 345
3400 - 3500 2.357 1528 1201 2.357 1428 732
3500 - 3600 1.608 1464 1360 1.608 1266 765
3600 - 3700 0.439 1194 1120 0.439 1154 815
3700 - 3800 0.301 988 943 0.301 759 320
3800 - 3900 0.252 1059 1179 0.252 710 344
3900 - 4000 0.011 1030 1286 0.011 571 301
2500 - 4000 12.880 1258 159 12.880 1197 −606
Table 4.5: Adlergletscher - Specific winter and annual balance versus altitude in the two
periods 2013/14 and 2014/15, evaluated for the measurement period defined
by the dates of field survey.
Altitude 2013/14 2014/15
Area bw ba Area bw ba(m a.s.l.) (km2) (mm w.e.) (mm w.e.) (km2) (mm w.e.) (mm w.e.)
2900 - 3000 0.004 757 −1789 0.004 856 −3201
3000 - 3100 0.099 786 −1566 0.099 952 −2736
3100 - 3200 0.119 831 −1470 0.119 1030 −2055
3200 - 3300 0.248 850 −757 0.248 1027 −1387
3300 - 3400 0.421 926 −40 0.421 1015 −555
3400 - 3500 0.316 1042 435 0.316 945 −333
3500 - 3600 0.249 1159 951 0.249 986 200
3600 - 3700 0.209 1175 1221 0.209 878 343
3700 - 3800 0.177 1041 1219 0.177 1152 1083
3800 - 3900 0.104 872 1066 0.104 903 830
3900 - 4000 0.046 671 800 0.046 876 868
4000 - 4100 0.014 554 672 0.014 657 611
4100 - 4200 0.004 529 664 0.004 565 512
2900 - 4200 2.011 975 230 2.011 985 −378
29

The Swiss Glaciers 2013/14 and 2014/15
Table 4.6: Findelengletscher and Adlergletscher - Individual stake measurements of win-
ter and annual balance.
Stake Period Coordinates Mass balance
Start Spring End bw ba(m / m / m a.s.l.) (mm w.e.)
F2 25.09.2013 09.04.2014 27.09.2014 630313 / 95442 / 2624 370 −6120
F31 25.09.2013 09.04.2014 27.09.2014 630880 / 95426 / 2692 290 −4410
F32 25.09.2013 09.04.2014 27.09.2014 630987 / 95262 / 2705 490 −5260
F4 25.09.2013 09.04.2014 27.09.2014 631493 / 95381 / 2803 550 −3550
F5 25.09.2013 09.04.2014 27.09.2014 632115 / 95108 / 2909 830 −2350
F6 25.09.2013 09.04.2014 27.09.2014 632359 / 95025 / 2953 1150 −2110
F7 25.09.2013 09.04.2014 27.09.2014 632470 / 94383 / 3037 1000 −1320
F8 25.09.2013 09.04.2014 27.09.2014 633245 / 93889 / 3117 1020 −610
F81 25.09.2013 09.04.2014 27.09.2014 633346 / 94524 / 3150 780 −930
F82 25.09.2013 09.04.2014 27.09.2014 632557 / 93740 / 3088 980 −890
F93 25.09.2013 09.04.2014 27.09.2014 634374 / 94325 / 3259 1190 400
F94 25.09.2013 09.04.2014 27.09.2014 633576 / 93127 / 3250 1280 350
F10 25.09.2013 09.04.2014 27.09.2014 635070 / 93938 / 3341 1290 1010
F11 25.09.2013 09.04.2014 27.09.2014 634140 / 92337 / 3450 1900 1640
A2 25.09.2013 09.04.2014 27.09.2014 632509 / 95498 / 3076 780 −1700
A3 25.09.2013 09.04.2014 27.09.2014 632693 / 95539 / 3132 1130 −1450
A4 25.09.2013 09.04.2014 27.09.2014 633126 / 95617 / 3247 840 −750
A6 25.09.2013 09.04.2014 27.09.2014 633704 / 95584 / 3339 1010 50
A6o 25.09.2013 09.04.2014 27.09.2014 633522 / 95543 / 3331 940 −450
F2 27.09.2014 09.04.2015 21.09.2015 630323 / 95445 / 2624 630 −7780
F31 27.09.2014 09.04.2015 21.09.2015 630909 / 95418 / 2695 640 −5730
F32 27.09.2014 09.04.2015 21.09.2015 630984 / 95270 / 2705 630 −7030
F5 27.09.2014 09.04.2015 21.09.2015 632156 / 95069 / 2917 900 −3880
F6 27.09.2014 09.04.2015 21.09.2015 632392 / 94988 / 2961 1010 −3560
F7 27.09.2014 09.04.2015 21.09.2015 632497 / 94371 / 3036 1060 −2610
F8 27.09.2014 09.04.2015 21.09.2015 633320 / 93841 / 3123 1360 −1280
F8o 27.09.2014 09.04.2015 21.09.2015 633245 / 93889 / 3117 1310 −930
F81 27.09.2014 09.04.2015 21.09.2015 633326 / 94526 / 3147 1240 −2010
F82 27.09.2014 09.04.2015 21.09.2015 632540 / 93763 / 3087 970 −2330
F93 27.09.2014 09.04.2015 21.09.2015 634332 / 94322 / 3255 1370 −250
F94 27.09.2014 09.04.2015 21.09.2015 633542 / 93155 / 3247 1130 −170
F10 27.09.2014 09.04.2015 21.09.2015 635095 / 93918 / 3345 1330 660
F11 27.09.2014 09.04.2015 21.09.2015 634158 / 92339 / 3450 1300 1240
A2 27.09.2014 09.04.2015 21.09.2015 632502 / 95506 / 3076 900 −2790
A4 27.09.2014 09.04.2015 21.09.2015 633101 / 95610 / 3242 1000 −1600
A6 27.09.2014 09.04.2015 21.09.2015 633695 / 95575 / 3339 1150 −500
30
4. Mass Balance
−8 −6 −4 −2 0 2Specific balance (m w.e.)
2500
3000
3500
4000
Alti
tude
(m
a.s
.l.)
2013/2014
−6 −4 −2 0 2 4Volumetric balance (106 m3 w.e.)
−8 −6 −4 −2 0 2Specific balance (m w.e.)
2500
3000
3500
4000
Alti
tude
(m
a.s
.l.)
2014/2015
−6 −4 −2 0 2 4Volumetric balance (106 m3 w.e.)
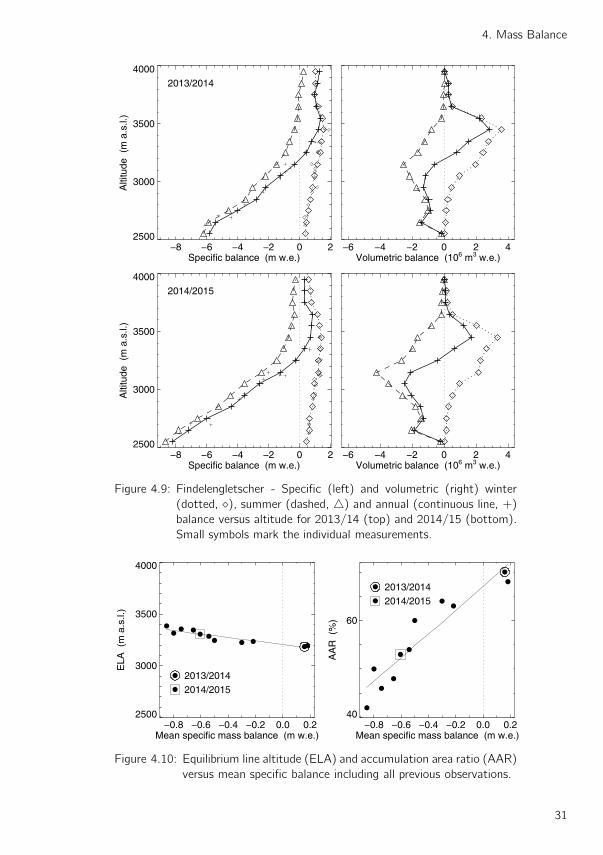
Figure 4.9: Findelengletscher - Specific (left) and volumetric (right) winter
(dotted, ⋄), summer (dashed, △) and annual (continuous line, +)
balance versus altitude for 2013/14 (top) and 2014/15 (bottom).
Small symbols mark the individual measurements.
−0.8 −0.6 −0.4 −0.2 0.0 0.2Mean specific mass balance (m w.e.)
2500
3000
3500
4000
ELA
(m
a.s
.l.)
2013/20142014/2015
−0.8 −0.6 −0.4 −0.2 0.0 0.2Mean specific mass balance (m w.e.)
40
60
AA
R (
%)
2013/20142014/2015
Figure 4.10: Equilibrium line altitude (ELA) and accumulation area ratio (AAR)
versus mean specific balance including all previous observations.
31
The Swiss Glaciers 2013/14 and 2014/15
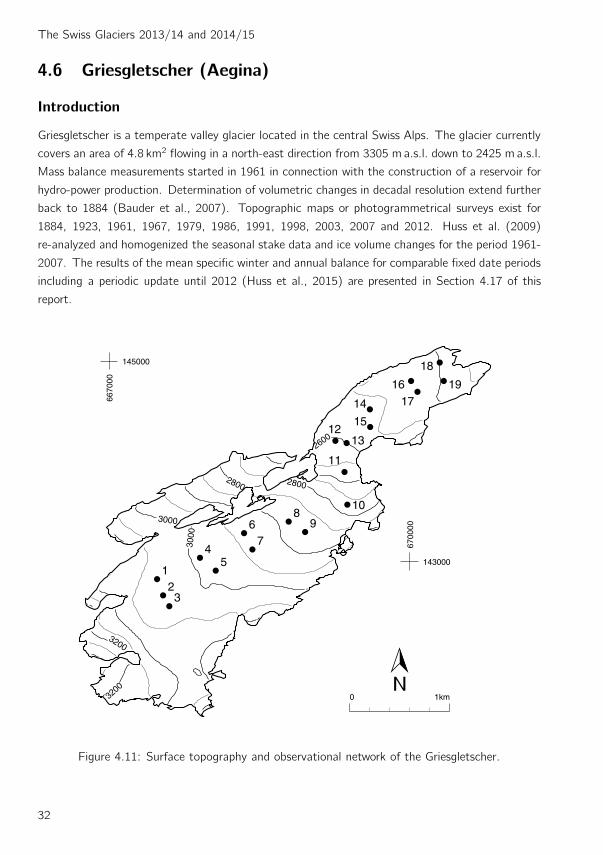
4.6 Griesgletscher (Aegina)
Introduction
Griesgletscher is a temperate valley glacier located in the central Swiss Alps. The glacier currently
covers an area of 4.8 km2 flowing in a north-east direction from 3305 m a.s.l. down to 2425 m a.s.l.
Mass balance measurements started in 1961 in connection with the construction of a reservoir for
hydro-power production. Determination of volumetric changes in decadal resolution extend further
back to 1884 (Bauder et al., 2007). Topographic maps or photogrammetrical surveys exist for
1884, 1923, 1961, 1967, 1979, 1986, 1991, 1998, 2003, 2007 and 2012. Huss et al. (2009)
re-analyzed and homogenized the seasonal stake data and ice volume changes for the period 1961-
2007. The results of the mean specific winter and annual balance for comparable fixed date periods
including a periodic update until 2012 (Huss et al., 2015) are presented in Section 4.17 of this
report.
3200
3200
2800
3000
3000
2800
2600
123
45
67
89
10
11
1213
14
15
1617
18
19
6670
00
145000
6700
00
143000
0 1km
Figure 4.11: Surface topography and observational network of the Griesgletscher.
32

4. Mass Balance
Investigations in 2013/14
The measurement period extended from 29th September 2013 to 10th September 2014 with a field
visit in spring on 24th April 2014. Snow depth soundings were collected at 19 stake locations and
supplemented by two density profiles obtained by firn drilling on the tongue and in the upper area.
For only the second time in the last 15 years, the abundant snow which accumulated during winter
remained into fall. This accumulation extended over the entire firn plateau above 3000 m a.s.l.
1960 1980 2000 2020
−2
−1
0
1
Mas
s ba
lanc
e (
m w
.e.)
−40
−30
−20
−10
0
Cum
ulat
ive
mas
s ba
lanc
e (
m w
.e.)
Figure 4.12: Griesgletscher - Mean specific annual balance (bars) and cumulative mass
balance for the period 1961-2015.
Investigations in 2014/15
The measurement period extended from 10th September 2014 to 8th September 2015 with a field
visit in spring on 24th April 2015. The melt extent at the end of the summer covered the entire
surface area, leaving only a few marginal firn patches. Snow depth was sampled at 19 stake
locations and the density was determined at two locations using a firn drill.
33

The Swiss Glaciers 2013/14 and 2014/15
Table 4.7: Griesgletscher - Specific winter and annual balance versus altitude in the two
periods 2013/14 and 2014/15, evaluated for the measurement period defined
by the dates of field survey.
Altitude 2013/14 2014/15
Area bw ba Area bw ba(m a.s.l.) (km2) (mm w.e.) (mm w.e.) (km2) (mm w.e.) (mm w.e.)
2400 - 2500 0.106 1075 −2918 0.106 1479 −4512
2500 - 2600 0.613 1114 −2597 0.613 1452 −3865
2600 - 2700 0.178 1309 −1880 0.178 1660 −2978
2700 - 2800 0.296 1521 −985 0.296 1799 −2302
2800 - 2900 0.566 1646 −578 0.566 1861 −1864
2900 - 3000 0.977 1713 −196 0.977 1884 −1206
3000 - 3100 1.417 1928 315 1.417 1864 −760
3100 - 3200 0.206 1753 420 0.206 1619 −645
3200 - 3300 0.071 1121 −107 0.071 1000 −1255
2400 - 3300 4.431 1638 −568 4.431 1764 −1713
34
4. Mass Balance
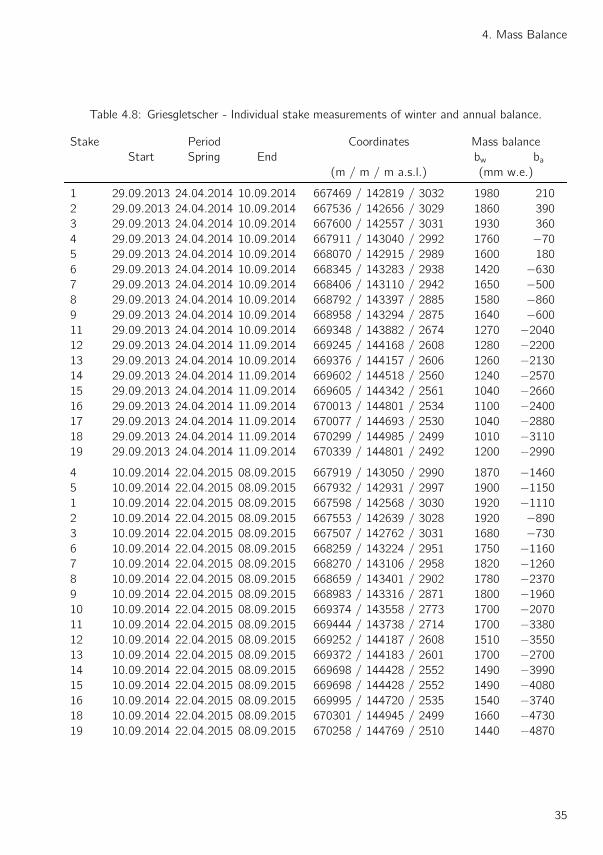
Table 4.8: Griesgletscher - Individual stake measurements of winter and annual balance.
Stake Period Coordinates Mass balance
Start Spring End bw ba(m / m / m a.s.l.) (mm w.e.)
1 29.09.2013 24.04.2014 10.09.2014 667469 / 142819 / 3032 1980 210
2 29.09.2013 24.04.2014 10.09.2014 667536 / 142656 / 3029 1860 390
3 29.09.2013 24.04.2014 10.09.2014 667600 / 142557 / 3031 1930 360
4 29.09.2013 24.04.2014 10.09.2014 667911 / 143040 / 2992 1760 −70
5 29.09.2013 24.04.2014 10.09.2014 668070 / 142915 / 2989 1600 180
6 29.09.2013 24.04.2014 10.09.2014 668345 / 143283 / 2938 1420 −630
7 29.09.2013 24.04.2014 10.09.2014 668406 / 143110 / 2942 1650 −500
8 29.09.2013 24.04.2014 10.09.2014 668792 / 143397 / 2885 1580 −860
9 29.09.2013 24.04.2014 10.09.2014 668958 / 143294 / 2875 1640 −600
11 29.09.2013 24.04.2014 10.09.2014 669348 / 143882 / 2674 1270 −2040
12 29.09.2013 24.04.2014 11.09.2014 669245 / 144168 / 2608 1280 −2200
13 29.09.2013 24.04.2014 10.09.2014 669376 / 144157 / 2606 1260 −2130
14 29.09.2013 24.04.2014 11.09.2014 669602 / 144518 / 2560 1240 −2570
15 29.09.2013 24.04.2014 11.09.2014 669605 / 144342 / 2561 1040 −2660
16 29.09.2013 24.04.2014 11.09.2014 670013 / 144801 / 2534 1100 −2400
17 29.09.2013 24.04.2014 11.09.2014 670077 / 144693 / 2530 1040 −2880
18 29.09.2013 24.04.2014 11.09.2014 670299 / 144985 / 2499 1010 −3110
19 29.09.2013 24.04.2014 11.09.2014 670339 / 144801 / 2492 1200 −2990
4 10.09.2014 22.04.2015 08.09.2015 667919 / 143050 / 2990 1870 −1460
5 10.09.2014 22.04.2015 08.09.2015 667932 / 142931 / 2997 1900 −1150
1 10.09.2014 22.04.2015 08.09.2015 667598 / 142568 / 3030 1920 −1110
2 10.09.2014 22.04.2015 08.09.2015 667553 / 142639 / 3028 1920 −890
3 10.09.2014 22.04.2015 08.09.2015 667507 / 142762 / 3031 1680 −730
6 10.09.2014 22.04.2015 08.09.2015 668259 / 143224 / 2951 1750 −1160
7 10.09.2014 22.04.2015 08.09.2015 668270 / 143106 / 2958 1820 −1260
8 10.09.2014 22.04.2015 08.09.2015 668659 / 143401 / 2902 1780 −2370
9 10.09.2014 22.04.2015 08.09.2015 668983 / 143316 / 2871 1800 −1960
10 10.09.2014 22.04.2015 08.09.2015 669374 / 143558 / 2773 1700 −2070
11 10.09.2014 22.04.2015 08.09.2015 669444 / 143738 / 2714 1700 −3380
12 10.09.2014 22.04.2015 08.09.2015 669252 / 144187 / 2608 1510 −3550
13 10.09.2014 22.04.2015 08.09.2015 669372 / 144183 / 2601 1700 −2700
14 10.09.2014 22.04.2015 08.09.2015 669698 / 144428 / 2552 1490 −3990
15 10.09.2014 22.04.2015 08.09.2015 669698 / 144428 / 2552 1490 −4080
16 10.09.2014 22.04.2015 08.09.2015 669995 / 144720 / 2535 1540 −3740
18 10.09.2014 22.04.2015 08.09.2015 670301 / 144945 / 2499 1660 −4730
19 10.09.2014 22.04.2015 08.09.2015 670258 / 144769 / 2510 1440 −4870
35
The Swiss Glaciers 2013/14 and 2014/15
−6 −4 −2 0 2Specific balance (m w.e.)
2400
2600
2800
3000
3200
3400
Alti
tude
(m
a.s
.l.)
2013/14
−4 −2 0 2 4Volumetric balance (106 m3 w.e.)
−6 −4 −2 0 2Specific balance (m w.e.)
2400
2600
2800
3000
3200
3400
Alti
tude
(m
a.s
.l.)
2014/15
−4 −2 0 2 4Volumetric balance (106 m3 w.e.)
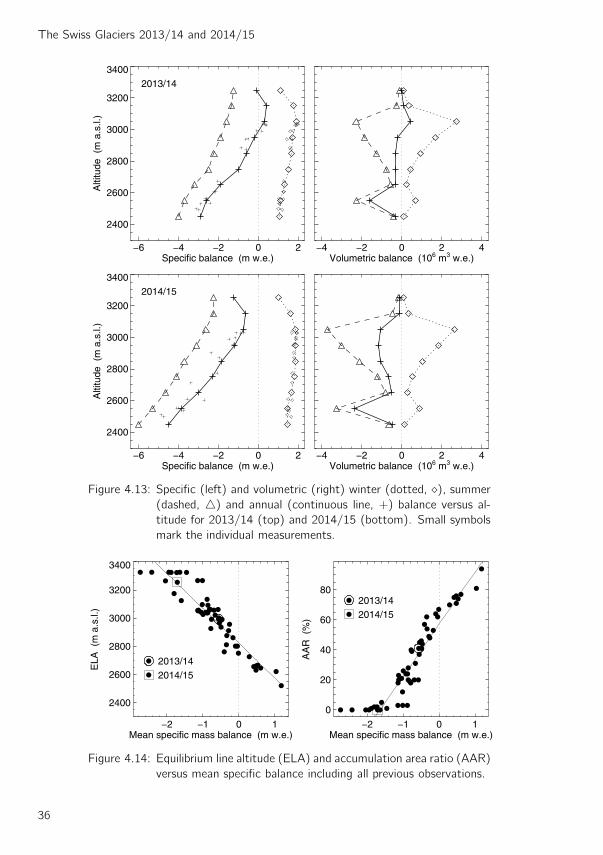
Figure 4.13: Specific (left) and volumetric (right) winter (dotted, ⋄), summer
(dashed, △) and annual (continuous line, +) balance versus al-
titude for 2013/14 (top) and 2014/15 (bottom). Small symbols
mark the individual measurements.
−2 −1 0 1Mean specific mass balance (m w.e.)
2400
2600
2800
3000
3200
3400
ELA
(m
a.s
.l.)
2013/142014/15
−2 −1 0 1Mean specific mass balance (m w.e.)
0
20
40
60
80
AA
R (
%)
2013/142014/15
Figure 4.14: Equilibrium line altitude (ELA) and accumulation area ratio (AAR)
versus mean specific balance including all previous observations.
36
4. Mass Balance
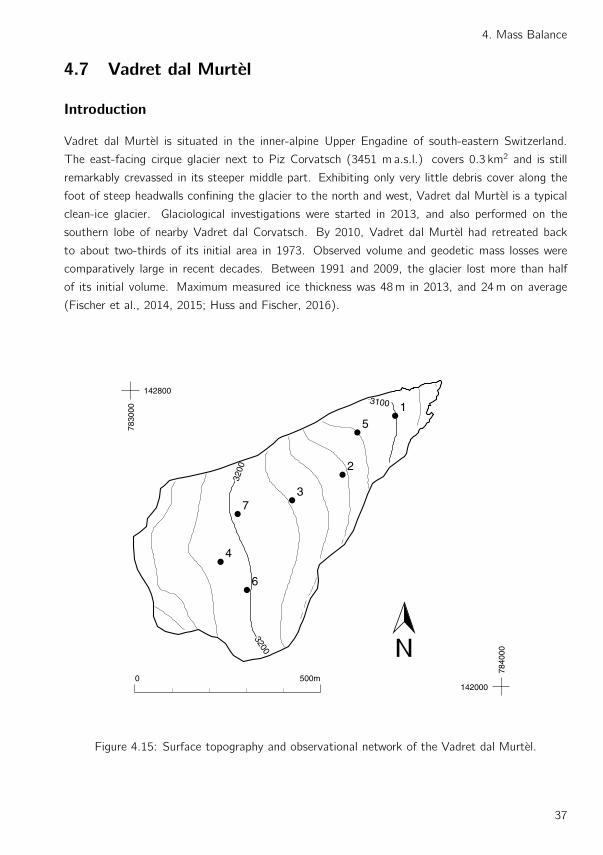
4.7 Vadret dal Murtel
Introduction
Vadret dal Murtel is situated in the inner-alpine Upper Engadine of south-eastern Switzerland.
The east-facing cirque glacier next to Piz Corvatsch (3451 ma.s.l.) covers 0.3 km2 and is still
remarkably crevassed in its steeper middle part. Exhibiting only very little debris cover along the
foot of steep headwalls confining the glacier to the north and west, Vadret dal Murtel is a typical
clean-ice glacier. Glaciological investigations were started in 2013, and also performed on the
southern lobe of nearby Vadret dal Corvatsch. By 2010, Vadret dal Murtel had retreated back
to about two-thirds of its initial area in 1973. Observed volume and geodetic mass losses were
comparatively large in recent decades. Between 1991 and 2009, the glacier lost more than half
of its initial volume. Maximum measured ice thickness was 48m in 2013, and 24m on average
(Fischer et al., 2014, 2015; Huss and Fischer, 2016).
3200
3200
3100 1
2
3
4
5
6
7
7830
00
142800
7840
00
1420000 500m
Figure 4.15: Surface topography and observational network of the Vadret dal Murtel.
37
The Swiss Glaciers 2013/14 and 2014/15
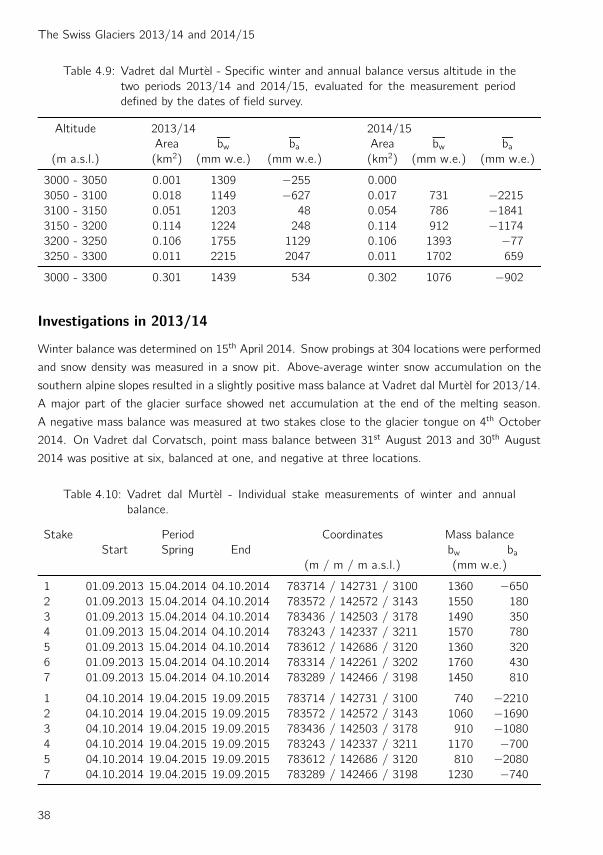
Table 4.9: Vadret dal Murtel - Specific winter and annual balance versus altitude in the
two periods 2013/14 and 2014/15, evaluated for the measurement period
defined by the dates of field survey.
Altitude 2013/14 2014/15
Area bw ba Area bw ba(m a.s.l.) (km2) (mm w.e.) (mm w.e.) (km2) (mm w.e.) (mm w.e.)
3000 - 3050 0.001 1309 −255 0.000
3050 - 3100 0.018 1149 −627 0.017 731 −2215
3100 - 3150 0.051 1203 48 0.054 786 −1841
3150 - 3200 0.114 1224 248 0.114 912 −1174
3200 - 3250 0.106 1755 1129 0.106 1393 −77
3250 - 3300 0.011 2215 2047 0.011 1702 659
3000 - 3300 0.301 1439 534 0.302 1076 −902
Investigations in 2013/14
Winter balance was determined on 15th April 2014. Snow probings at 304 locations were performed
and snow density was measured in a snow pit. Above-average winter snow accumulation on the
southern alpine slopes resulted in a slightly positive mass balance at Vadret dal Murtel for 2013/14.
A major part of the glacier surface showed net accumulation at the end of the melting season.
A negative mass balance was measured at two stakes close to the glacier tongue on 4th October
2014. On Vadret dal Corvatsch, point mass balance between 31st August 2013 and 30th August
2014 was positive at six, balanced at one, and negative at three locations.
Table 4.10: Vadret dal Murtel - Individual stake measurements of winter and annual
balance.
Stake Period Coordinates Mass balance
Start Spring End bw ba(m / m / m a.s.l.) (mm w.e.)
1 01.09.2013 15.04.2014 04.10.2014 783714 / 142731 / 3100 1360 −650
2 01.09.2013 15.04.2014 04.10.2014 783572 / 142572 / 3143 1550 180
3 01.09.2013 15.04.2014 04.10.2014 783436 / 142503 / 3178 1490 350
4 01.09.2013 15.04.2014 04.10.2014 783243 / 142337 / 3211 1570 780
5 01.09.2013 15.04.2014 04.10.2014 783612 / 142686 / 3120 1360 320
6 01.09.2013 15.04.2014 04.10.2014 783314 / 142261 / 3202 1760 430
7 01.09.2013 15.04.2014 04.10.2014 783289 / 142466 / 3198 1450 810
1 04.10.2014 19.04.2015 19.09.2015 783714 / 142731 / 3100 740 −2210
2 04.10.2014 19.04.2015 19.09.2015 783572 / 142572 / 3143 1060 −1690
3 04.10.2014 19.04.2015 19.09.2015 783436 / 142503 / 3178 910 −1080
4 04.10.2014 19.04.2015 19.09.2015 783243 / 142337 / 3211 1170 −700
5 04.10.2014 19.04.2015 19.09.2015 783612 / 142686 / 3120 810 −2080
7 04.10.2014 19.04.2015 19.09.2015 783289 / 142466 / 3198 1230 −740
38
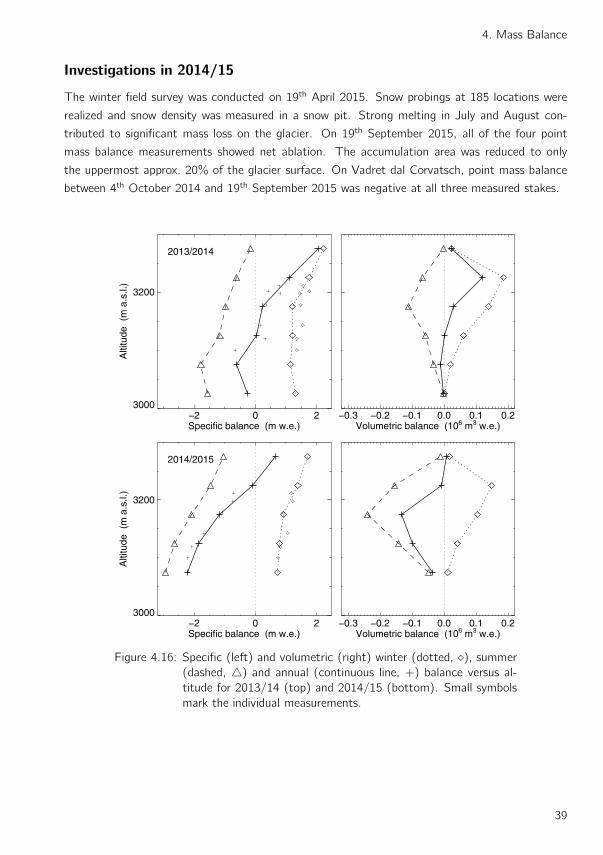
4. Mass Balance
Investigations in 2014/15
The winter field survey was conducted on 19th April 2015. Snow probings at 185 locations were
realized and snow density was measured in a snow pit. Strong melting in July and August con-
tributed to significant mass loss on the glacier. On 19th September 2015, all of the four point
mass balance measurements showed net ablation. The accumulation area was reduced to only
the uppermost approx. 20% of the glacier surface. On Vadret dal Corvatsch, point mass balance
between 4th October 2014 and 19th September 2015 was negative at all three measured stakes.
−2 0 2Specific balance (m w.e.)
3000
3200
Alti
tude
(m
a.s
.l.)
2013/2014
−0.3 −0.2 −0.1 0.0 0.1 0.2Volumetric balance (106 m3 w.e.)
−2 0 2Specific balance (m w.e.)
3000
3200
Alti
tude
(m
a.s
.l.)
2014/2015
−0.3 −0.2 −0.1 0.0 0.1 0.2Volumetric balance (106 m3 w.e.)
Figure 4.16: Specific (left) and volumetric (right) winter (dotted, ⋄), summer
(dashed, △) and annual (continuous line, +) balance versus al-
titude for 2013/14 (top) and 2014/15 (bottom). Small symbols
mark the individual measurements.
39

The Swiss Glaciers 2013/14 and 2014/15
4.8 Pizolgletscher
Introduction
Pizolgletscher is a steep cirque glacier in the north-eastern Swiss Alps. With a surface area of
about 0.06 km2 Pizolgletscher represents the size class of glacierets that include almost 80% of
the total number of glaciers in Switzerland (Fischer et al., 2014). Pizolgletscher is north-exposed
and located at a relatively low elevation (2630-2780 m a.s.l.) which indicates that it depends on
high quantities of winter accumulation. Seasonal mass balance measurements were started in 2006
(Huss, 2010).
2750
2700
2650
P1
P2
P3
P4P5
P6P7
P8
P9
7482
00
202600
7487
00
203000
0 200m
Figure 4.17: Surface topography and observational network of the Pizolgletscher.
Investigations in 2013/14
Winter balance was determined on 31st March 2014. Snow probings at 118 locations were per-
formed and snow density was measured in a snow pit. During the late summer field survey on 20th
September 2014 a negative mass balance was observed at eight stakes. Despite frequent summer
snowfall events winter snow cover was completely depleted by the end of the ablation season, and
40

4. Mass Balance
Table 4.11: Pizolgletscher - Specific winter and annual balance versus altitude in the
two periods 2013/14 and 2014/15, evaluated for the measurement period
defined by the dates of field survey.
Altitude 2013/14 2014/15
Area bw ba Area bw ba(m a.s.l.) (km2) (mm w.e.) (mm w.e.) (km2) (mm w.e.) (mm w.e.)
2600 - 2650 0.011 1069 −1502 0.011 1679 −1966
2650 - 2700 0.032 1091 −1405 0.032 1812 −1841
2700 - 2750 0.018 1233 −870 0.018 2002 −836
2750 - 2800 0.005 1386 −727 0.005 1990 −743
2600 - 2800 0.067 1148 −1222 0.067 1856 −1501
debris coverage of the remaining ice accelerated. A surface elevation model was generated using a
terrestrial laser scanner in order to determine annual geodetic mass balances (Fischer et al., 2016).
Investigations in 2014/15
The winter field survey was conducted later than in previous years (11.5.2015) because of adverse
weather conditions in early April. Snow probings were conducted at 50 locations and snow density
was estimated based on measurements on Claridenfirn performed in the same week. Strong melting
in July and August contributed to significant mass loss on the glacier. On 9th September 2015 a
Table 4.12: Pizolgletscher - Individual stake measurements of winter and annual balance.
Stake Period Coordinates Mass balance
Start Spring End bw ba(m / m / m a.s.l.) (mm w.e.)
P1 23.09.2013 31.03.2014 20.09.2014 748521 / 202898 / 2629 1140 −1310
P2 23.09.2013 31.03.2014 20.09.2014 748432 / 202789 / 2692 1090 −1140
P3 23.09.2013 31.03.2014 20.09.2014 748342 / 202644 / 2777 1660 −950
P4 23.09.2013 31.03.2014 20.09.2014 748427 / 202906 / 2658 1050 −2310
P5 23.09.2013 31.03.2014 20.09.2014 748395 / 202879 / 2675 990 −1490
P7 23.09.2013 31.03.2014 20.09.2014 748381 / 202672 / 2753 1200 −1380
P8a 23.09.2013 31.03.2014 20.09.2014 748524 / 202792 / 2672 950 −1500
P8b 23.09.2013 31.03.2014 20.09.2014 748519 / 202799 / 2668 1050 −1710
P9 23.09.2013 31.03.2014 20.09.2014 748481 / 202701 / 2713 1010 −1170
P1 20.09.2014 11.05.2015 27.09.2015 748522 / 202896 / 2631 1530 −1860
P2 20.09.2014 11.05.2015 27.09.2015 748432 / 202789 / 2692 1860 −1300
P4 20.09.2014 11.05.2015 27.09.2015 748427 / 202895 / 2662 1550 −3280
P5 20.09.2014 11.05.2015 27.09.2015 748384 / 202874 / 2677 2000 −1750
P6 20.09.2014 11.05.2015 27.09.2015 748544 / 202679 / 2710 1970 −700
P8 20.09.2014 11.05.2015 27.09.2015 748525 / 202800 / 2667 1530 −2070
P9 20.09.2014 11.05.2015 27.09.2015 748470 / 202700 / 2715 2020 −1640
41

The Swiss Glaciers 2013/14 and 2014/15
surface elevation model was generated using terrestrial laser scanning and all stakes were visited
and re-installed during the late summer field survey on 27th September 2015. Mass balance was
determined at seven stakes. No measurements at the two uppermost stakes were possible as they
were hit by a rockslide. Ablation was above-average, with record melt rates of almost 4m at one
location.
−2 0 2Specific balance (m w.e.)
2600
2650
2700
2750
2800
Alti
tude
(m
a.s
.l.)
2013/14
−0.15 −0.10 −0.05 0.00 0.05 0.10Volumetric balance (106 m3 w.e.)
−2 0 2Specific balance (m w.e.)
2600
2650
2700
2750
2800
Alti
tude
(m
a.s
.l.)
2014/15
−0.15 −0.10 −0.05 0.00 0.05 0.10Volumetric balance (106 m3 w.e.)
Figure 4.18: Specific (left) and volumetric (right) winter (dotted, ⋄), summer
(dashed, △) and annual (continuous line, +) balance versus al-
titude for 2013/14 (top) and 2014/15 (bottom). Small symbols
mark the individual measurements.
42
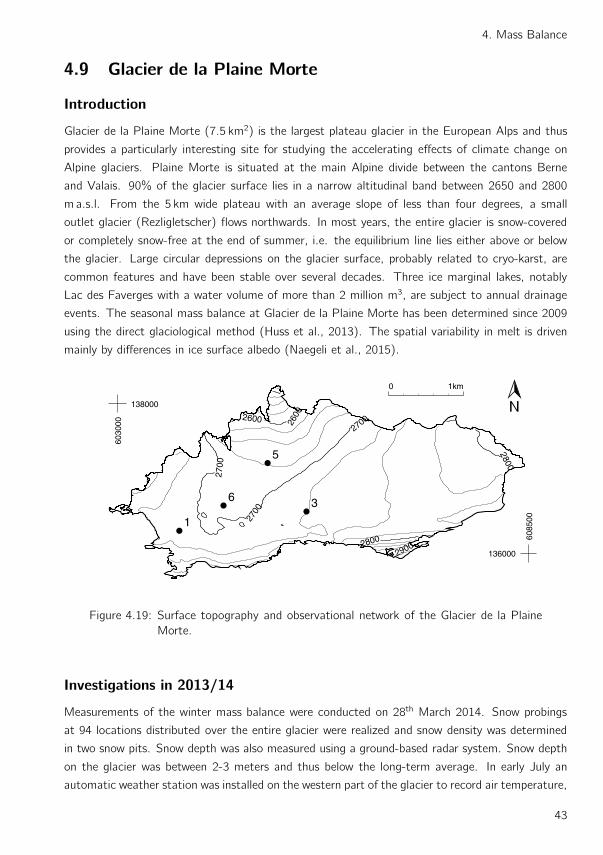
4. Mass Balance
4.9 Glacier de la Plaine Morte
Introduction
Glacier de la Plaine Morte (7.5 km2) is the largest plateau glacier in the European Alps and thus
provides a particularly interesting site for studying the accelerating effects of climate change on
Alpine glaciers. Plaine Morte is situated at the main Alpine divide between the cantons Berne
and Valais. 90% of the glacier surface lies in a narrow altitudinal band between 2650 and 2800
m a.s.l. From the 5 km wide plateau with an average slope of less than four degrees, a small
outlet glacier (Rezligletscher) flows northwards. In most years, the entire glacier is snow-covered
or completely snow-free at the end of summer, i.e. the equilibrium line lies either above or below
the glacier. Large circular depressions on the glacier surface, probably related to cryo-karst, are
common features and have been stable over several decades. Three ice marginal lakes, notably
Lac des Faverges with a water volume of more than 2 million m3, are subject to annual drainage
events. The seasonal mass balance at Glacier de la Plaine Morte has been determined since 2009
using the direct glaciological method (Huss et al., 2013). The spatial variability in melt is driven
mainly by differences in ice surface albedo (Naegeli et al., 2015).
2700
2700
2700
26002600
2800
29002800
1
3
5
6
6030
00
138000
6085
00
136000
0 1km
Figure 4.19: Surface topography and observational network of the Glacier de la Plaine
Morte.
Investigations in 2013/14
Measurements of the winter mass balance were conducted on 28th March 2014. Snow probings
at 94 locations distributed over the entire glacier were realized and snow density was determined
in two snow pits. Snow depth was also measured using a ground-based radar system. Snow depth
on the glacier was between 2-3 meters and thus below the long-term average. In early July an
automatic weather station was installed on the western part of the glacier to record air temperature,
43
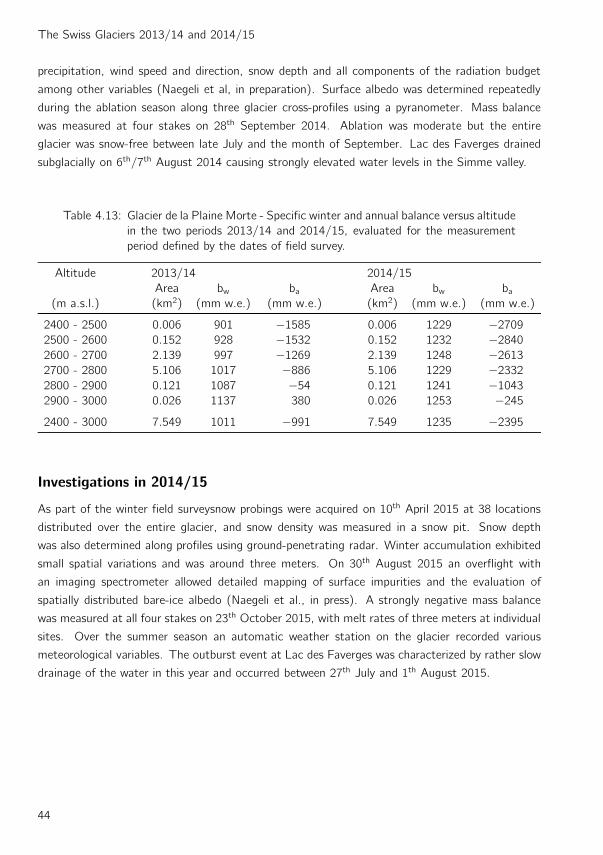
The Swiss Glaciers 2013/14 and 2014/15
precipitation, wind speed and direction, snow depth and all components of the radiation budget
among other variables (Naegeli et al, in preparation). Surface albedo was determined repeatedly
during the ablation season along three glacier cross-profiles using a pyranometer. Mass balance
was measured at four stakes on 28th September 2014. Ablation was moderate but the entire
glacier was snow-free between late July and the month of September. Lac des Faverges drained
subglacially on 6th/7th August 2014 causing strongly elevated water levels in the Simme valley.
Table 4.13: Glacier de la Plaine Morte - Specific winter and annual balance versus altitude
in the two periods 2013/14 and 2014/15, evaluated for the measurement
period defined by the dates of field survey.
Altitude 2013/14 2014/15
Area bw ba Area bw ba(m a.s.l.) (km2) (mm w.e.) (mm w.e.) (km2) (mm w.e.) (mm w.e.)
2400 - 2500 0.006 901 −1585 0.006 1229 −2709
2500 - 2600 0.152 928 −1532 0.152 1232 −2840
2600 - 2700 2.139 997 −1269 2.139 1248 −2613
2700 - 2800 5.106 1017 −886 5.106 1229 −2332
2800 - 2900 0.121 1087 −54 0.121 1241 −1043
2900 - 3000 0.026 1137 380 0.026 1253 −245
2400 - 3000 7.549 1011 −991 7.549 1235 −2395
Investigations in 2014/15
As part of the winter field surveysnow probings were acquired on 10th April 2015 at 38 locations
distributed over the entire glacier, and snow density was measured in a snow pit. Snow depth
was also determined along profiles using ground-penetrating radar. Winter accumulation exhibited
small spatial variations and was around three meters. On 30th August 2015 an overflight with
an imaging spectrometer allowed detailed mapping of surface impurities and the evaluation of
spatially distributed bare-ice albedo (Naegeli et al., in press). A strongly negative mass balance
was measured at all four stakes on 23th October 2015, with melt rates of three meters at individual
sites. Over the summer season an automatic weather station on the glacier recorded various
meteorological variables. The outburst event at Lac des Faverges was characterized by rather slow
drainage of the water in this year and occurred between 27th July and 1th August 2015.
44

4. Mass Balance
Table 4.14: Glacier de la Plaine Morte - Individual stake measurements of winter and
annual balance.
Stake Period Coordinates Mass balance
Start Spring End bw ba(m / m / m a.s.l.) (mm w.e.)
1 02.10.2013 28.03.2014 28.09.2014 603819 / 136301 / 2704 1080 −1440
3 02.10.2013 28.03.2014 28.09.2014 605524 / 136559 / 2721 1200 −680
5 02.10.2013 28.03.2014 28.09.2014 605006 / 137212 / 2671 1070 −1160
6 02.10.2013 28.03.2014 28.09.2014 604417 / 136636 / 2691 1070 −1180
1 28.09.2014 10.04.2015 23.10.2015 603819 / 136301 / 2704 1260 −2890
3 28.09.2014 10.04.2015 23.10.2015 605524 / 136559 / 2721 1310 −2220
5 28.09.2014 10.04.2015 23.10.2015 605006 / 137212 / 2671 1390 −2620
6 28.09.2014 10.04.2015 23.10.2015 604417 / 136636 / 2691 1300 −2480
−4 −2 0Specific balance (m w.e.)
2400
2600
2800
3000
Alti
tude
(m
a.s
.l.)
2013/2014
−20 −15 −10 −5 0 5 10Volumetric balance (106 m3 w.e.)
−4 −2 0Specific balance (m w.e.)
2400
2600
2800
3000
Alti
tude
(m
a.s
.l.)
2014/2015
−20 −15 −10 −5 0 5 10Volumetric balance (106 m3 w.e.)
Figure 4.20: Specific (left) and volumetric (right) winter (dotted, ⋄), summer
(dashed, △) and annual (continuous line, +) balance versus al-
titude for 2013/14 (top) and 2014/15 (bottom). Small symbols
mark the individual measurements.
45

The Swiss Glaciers 2013/14 and 2014/15
4.10 Rhonegletscher
Introduction
Rhonegletscher is a temperate valley glacier located in the central Swiss Alps, and is the primary
source of water for the Rhone river. The glacier is easily accessible and therefore has been under
observation since the 19th century. The total surface area of the glacier is 15.6 km2 flowing in a
southern direction from 3600 m a.s.l. down to 2200 m a.s.l. The first mass balance measurements
were carried out in 1884 and are first ever recorded worldwide. After two periods of measurements
between 1884-1910, and 1980-1982, the measurement series was resumed in 2006. Determination
of volumetric changes in decadal resolution extend even further back to 1874 (Bauder et al., 2007).
2400
2600
30003000
3000
2800
3200
3400
32001
2
3
4
5
6
7
8910
11
12
13
6720
00
167000
6740
00
161000
0 1km
Figure 4.21: Surface topography and observational network of the Rhonegletscher.
46
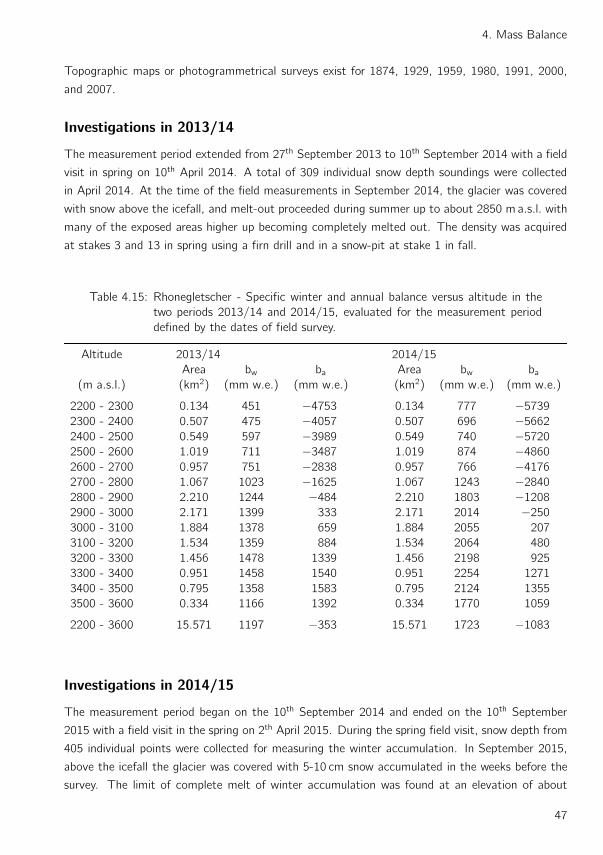
4. Mass Balance
Topographic maps or photogrammetrical surveys exist for 1874, 1929, 1959, 1980, 1991, 2000,
and 2007.
Investigations in 2013/14
The measurement period extended from 27th September 2013 to 10th September 2014 with a field
visit in spring on 10th April 2014. A total of 309 individual snow depth soundings were collected
in April 2014. At the time of the field measurements in September 2014, the glacier was covered
with snow above the icefall, and melt-out proceeded during summer up to about 2850 m a.s.l. with
many of the exposed areas higher up becoming completely melted out. The density was acquired
at stakes 3 and 13 in spring using a firn drill and in a snow-pit at stake 1 in fall.
Table 4.15: Rhonegletscher - Specific winter and annual balance versus altitude in the
two periods 2013/14 and 2014/15, evaluated for the measurement period
defined by the dates of field survey.
Altitude 2013/14 2014/15
Area bw ba Area bw ba(m a.s.l.) (km2) (mm w.e.) (mm w.e.) (km2) (mm w.e.) (mm w.e.)
2200 - 2300 0.134 451 −4753 0.134 777 −5739
2300 - 2400 0.507 475 −4057 0.507 696 −5662
2400 - 2500 0.549 597 −3989 0.549 740 −5720
2500 - 2600 1.019 711 −3487 1.019 874 −4860
2600 - 2700 0.957 751 −2838 0.957 766 −4176
2700 - 2800 1.067 1023 −1625 1.067 1243 −2840
2800 - 2900 2.210 1244 −484 2.210 1803 −1208
2900 - 3000 2.171 1399 333 2.171 2014 −250
3000 - 3100 1.884 1378 659 1.884 2055 207
3100 - 3200 1.534 1359 884 1.534 2064 480
3200 - 3300 1.456 1478 1339 1.456 2198 925
3300 - 3400 0.951 1458 1540 0.951 2254 1271
3400 - 3500 0.795 1358 1583 0.795 2124 1355
3500 - 3600 0.334 1166 1392 0.334 1770 1059
2200 - 3600 15.571 1197 −353 15.571 1723 −1083
Investigations in 2014/15
The measurement period began on the 10th September 2014 and ended on the 10th September
2015 with a field visit in the spring on 2th April 2015. During the spring field visit, snow depth from
405 individual points were collected for measuring the winter accumulation. In September 2015,
above the icefall the glacier was covered with 5-10 cm snow accumulated in the weeks before the
survey. The limit of complete melt of winter accumulation was found at an elevation of about
47

The Swiss Glaciers 2013/14 and 2014/15
2900 m a.s.l. Density measurements were carried out using a firn drill at stakes at 3 and 10 in
spring and at all stakes where accumulation was registered (uppermost 3 stakes) in fall.
Table 4.16: Rhonegletscher - Individual stake measurements of winter and annual bal-
ance.
Stake Period Coordinates Mass balance
Start Spring End bw ba(m / m / m a.s.l.) (mm w.e.)
01 27.09.2013 10.04.2014 11.09.2014 673815 / 166615 / 3235 1508 1842
02 27.09.2013 10.04.2014 11.09.2014 673565 / 165925 / 3123 1348 1145
03 27.09.2013 10.04.2014 11.09.2014 673105 / 164929 / 2931 1304 948
04 27.09.2013 10.04.2014 10.09.2014 673358 / 162750 / 2748 1036 −1190
05 23.09.2013 10.04.2014 10.09.2014 672516 / 161935 / 2608 618 −3086
06 23.09.2013 10.04.2014 10.09.2014 672414 / 160851 / 2472 552 −4148
07 23.09.2013 10.04.2014 10.09.2014 672654 / 160180 / 2367 510 −3281
08 23.09.2013 10.04.2014 10.09.2014 672686 / 159724 / 2304 664 −3893
09 27.09.2013 10.04.2014 10.09.2014 672623 / 159516 / 2263 656 −4412
10 23.09.2013 10.04.2014 10.09.2014 672541 / 159387 / 2240 506 −3749
12 27.09.2013 10.04.2014 11.09.2014 673503 / 163990 / 2847 1184 −672
13 23.09.2013 10.04.2014 10.09.2014 672700 / 159945 / 2329 531 −4293
01 11.09.2014 22.04.2015 10.09.2015 673815 / 166615 / 3236 1995 1306
02 11.09.2014 22.04.2015 09.09.2015 673565 / 165925 / 3124 2104 1094
03 11.09.2014 22.04.2015 09.09.2015 673099 / 164929 / 2931 1948 894
04 10.09.2014 22.04.2015 10.09.2015 673364 / 162767 / 2748 1463 −2057
05 10.09.2014 22.04.2015 10.09.2015 672521 / 161920 / 2606 732 −4310
06 10.09.2014 22.04.2015 10.09.2015 672415 / 160846 / 2470 827 −5576
07 10.09.2014 22.04.2015 10.09.2015 672657 / 160175 / 2363 855 −5950
08 10.09.2014 22.04.2015 10.09.2015 672680 / 159725 / 2301 1340 −5109
09 10.09.2014 22.04.2015 10.09.2015 672605 / 159501 / 2254 1093 −5228
10 10.09.2014 22.04.2015 10.09.2015 672533 / 159390 / 2235 1012 −5296
12 11.09.2014 22.04.2015 09.09.2015 673497 / 163990 / 2845 1867 −1284
13 10.09.2014 22.04.2015 10.09.2015 672701 / 159936 / 2325 1121 −5627
48
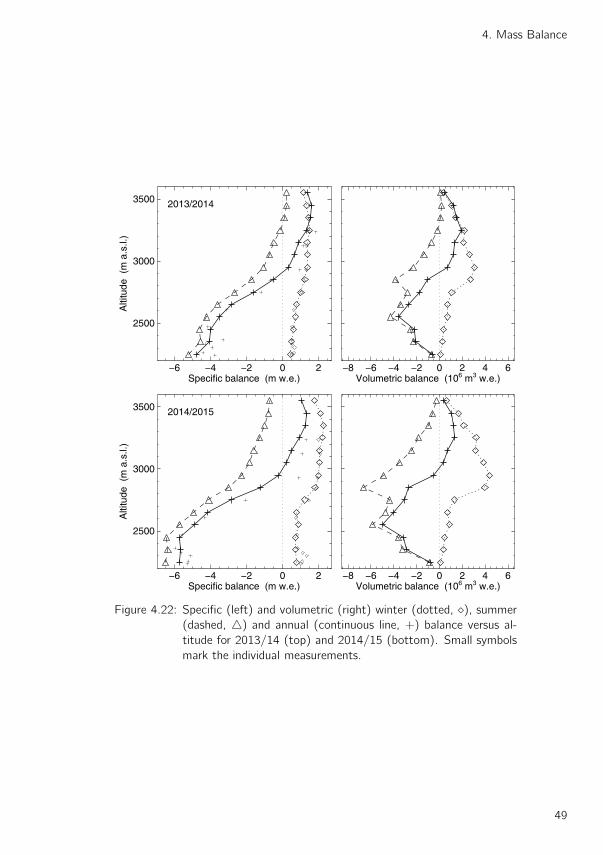
4. Mass Balance
−6 −4 −2 0 2Specific balance (m w.e.)
2500
3000
3500
Alti
tude
(m
a.s
.l.)
2013/2014
−8 −6 −4 −2 0 2 4 6Volumetric balance (106 m3 w.e.)
−6 −4 −2 0 2Specific balance (m w.e.)
2500
3000
3500
Alti
tude
(m
a.s
.l.)
2014/2015
−8 −6 −4 −2 0 2 4 6Volumetric balance (106 m3 w.e.)
Figure 4.22: Specific (left) and volumetric (right) winter (dotted, ⋄), summer
(dashed, △) and annual (continuous line, +) balance versus al-
titude for 2013/14 (top) and 2014/15 (bottom). Small symbols
mark the individual measurements.
49
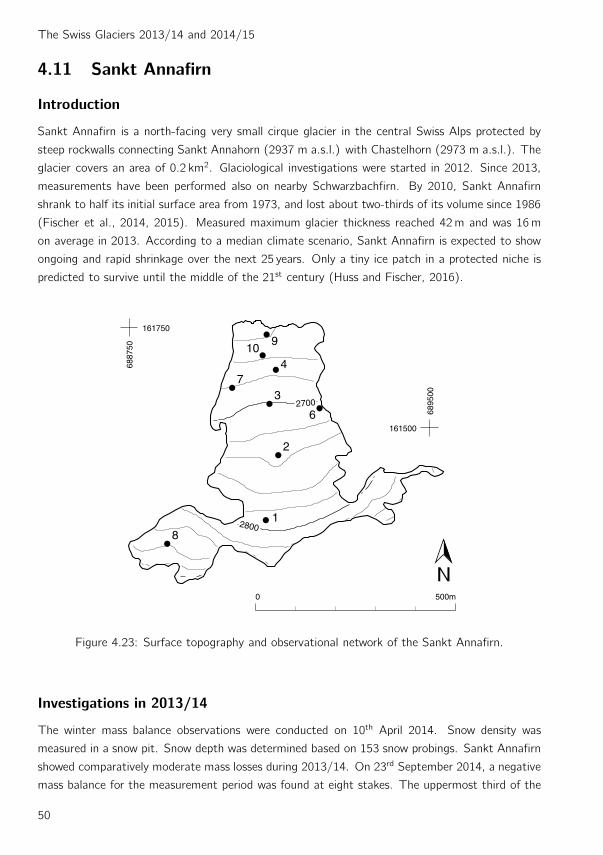
The Swiss Glaciers 2013/14 and 2014/15
4.11 Sankt Annafirn
Introduction
Sankt Annafirn is a north-facing very small cirque glacier in the central Swiss Alps protected by
steep rockwalls connecting Sankt Annahorn (2937 m a.s.l.) with Chastelhorn (2973 m a.s.l.). The
glacier covers an area of 0.2 km2. Glaciological investigations were started in 2012. Since 2013,
measurements have been performed also on nearby Schwarzbachfirn. By 2010, Sankt Annafirn
shrank to half its initial surface area from 1973, and lost about two-thirds of its volume since 1986
(Fischer et al., 2014, 2015). Measured maximum glacier thickness reached 42m and was 16m
on average in 2013. According to a median climate scenario, Sankt Annafirn is expected to show
ongoing and rapid shrinkage over the next 25 years. Only a tiny ice patch in a protected niche is
predicted to survive until the middle of the 21st century (Huss and Fischer, 2016).
2800
2700
1
2
3
4
6
7
8
910
6887
50
161750
6895
00161500
0 500m
Figure 4.23: Surface topography and observational network of the Sankt Annafirn.
Investigations in 2013/14
The winter mass balance observations were conducted on 10th April 2014. Snow density was
measured in a snow pit. Snow depth was determined based on 153 snow probings. Sankt Annafirn
showed comparatively moderate mass losses during 2013/14. On 23rd September 2014, a negative
mass balance for the measurement period was found at eight stakes. The uppermost third of the
50

4. Mass Balance
Table 4.17: Sankt Annafirn - Specific winter and annual balance versus altitude in the
two periods 2013/14 and 2014/15, evaluated for the measurement period
defined by the dates of field survey.
Altitude 2013/14 2014/15
Area bw ba Area bw ba(m a.s.l.) (km2) (mm w.e.) (mm w.e.) (km2) (mm w.e.) (mm w.e.)
2600 - 2650 0.014 1448 −1073 0.012 1594 −2494
2650 - 2700 0.037 1469 −1131 0.037 1501 −2402
2700 - 2750 0.046 1757 −619 0.046 1955 −1045
2750 - 2800 0.040 2231 127 0.040 1907 −1170
2800 - 2850 0.042 2196 49 0.042 1913 −1155
2850 - 2900 0.016 1902 −408 0.016 1667 −1448
2900 - 2950 0.001 1233 −1017 0.001 1145 −1470
2600 - 2950 0.195 1881 −437 0.193 1801 −1477
glacier surface showed net accumulation, the rates of which were determined based on three firn
pits. Both during the winter and the late summer survey, digital terrain models of Sankt Annafirn
and the nearby Schwarzbachfirn were acquired using terrestrial laser scanning (Fischer et al., 2016).
At the end of September 2014, englacial temperature was measured in two approx. 10m deep
boreholes on Sankt Annafirn, indicating the co-existence of slightly cold and temperate ice (Huss
and Fischer, 2016). On nearby Schwarzbachfirn, point mass balance between 7th September 2013
and 24th September 2014 was negative at two stakes.
Investigations in 2014/15
On 15th April 2015, end-of-winter snow depth was measured at 81 locations on Sankt Annafirn
during the winter field survey, and snow density was determined in a snow pit. Due to the excep-
tionally high temperatures in July and August 2015, summer melt was above average and the mass
balance on Sankt Annafirn was strongly negative for 2014/15. The whole glacier surface showed
net ablation over this period. Mass losses were measured at nine stakes on 28th September 2015.
Comparison of high-resolution digital elevation models for Sankt Annafirn and Schwarzbachfirn
derived by terrestrial laser scanning indicated good agreement with direct mass balance measure-
ments (Fischer et al., 2016). On Schwarzbachfirn, point mass balance between 24th September
2014 and 28th September 2015 was negative at all three measured stakes.
51

The Swiss Glaciers 2013/14 and 2014/15
Table 4.18: Sankt Annafirn - Individual stake measurements of winter and annual bal-
ance.
Stake Period Coordinates Mass balance
Start Spring End bw ba(m / m / m a.s.l.) (mm w.e.)
1 02.10.2013 10.04.2014 23.09.2014 689091 / 161270 / 2791 2210 −70
2 02.10.2013 10.04.2014 23.09.2014 689122 / 161432 / 2735 1630 −170
3 02.10.2013 10.04.2014 23.09.2014 689100 / 161560 / 2701 1700 −740
4 02.10.2013 10.04.2014 23.09.2014 689115 / 161658 / 2667 1100 −1580
6 02.10.2013 10.04.2014 23.09.2014 689225 / 161549 / 2706 1630 −1100
7 02.10.2013 10.04.2014 23.09.2014 689007 / 161600 / 2681 1630 −960
8 02.10.2013 10.04.2014 23.09.2014 688863 / 161221 / 2856 1510 −960
9 02.10.2013 10.04.2014 23.09.2014 689093 / 161733 / 2639 1470 −1220
1 23.09.2014 15.04.2015 28.09.2015 689091 / 161270 / 2791 1830 −1170
2 23.09.2014 15.04.2015 28.09.2015 689122 / 161432 / 2735 1850 −850
3 23.09.2014 15.04.2015 28.09.2015 689100 / 161560 / 2701 1760 −1360
4 23.09.2014 15.04.2015 28.09.2015 689116 / 161645 / 2676 1270 −3000
6 23.09.2014 15.04.2015 28.09.2015 689225 / 161549 / 2706 1700 −1810
7 23.09.2014 15.04.2015 28.09.2015 689007 / 161600 / 2681 1660 −2090
8 23.09.2014 15.04.2015 28.09.2015 688845 / 161211 / 2858 1420 −1870
9 23.09.2014 15.04.2015 28.09.2015 689093 / 161733 / 2639 1620 −2920
10 23.09.2014 15.04.2015 28.09.2015 689083 / 161681 / 2656 1360 −2920
52

4. Mass Balance
−4 −2 0 2Specific balance (m w.e.)
2600
2800
Alti
tude
(m
a.s
.l.)
2013/2014
−0.15 −0.10 −0.05 0.00 0.05 0.10Volumetric balance (106 m3 w.e.)
−4 −2 0 2Specific balance (m w.e.)
2600
2800
Alti
tude
(m
a.s
.l.)
2014/2015
−0.15 −0.10 −0.05 0.00 0.05 0.10Volumetric balance (106 m3 w.e.)
Figure 4.24: Specific (left) and volumetric (right) winter (dotted, ⋄), summer
(dashed, △) and annual (continuous line, +) balance versus al-
titude for 2013/14 (top) and 2014/15 (bottom). Small symbols
mark the individual measurements.
53

The Swiss Glaciers 2013/14 and 2014/15
4.12 Silvrettagletscher
Introduction
Silvrettagletscher is a small temperate mountain glacier located in the north-eastern part of
Switzerland in the Silvretta massif at the border to Austria. The present surface area is 2.7 km2,
extending from 3090 m a.s.l. down to 2470 m a.s.l. First mass balance measurements date back to
the 1910s (Firnberichte, 1978). Seasonal observations at two stakes were conducted until 1959,
when the stake network was increased to about 40 stakes. Huss and Bauder (2009) compiled
and homogenized all existing measurements of stake 5 to a continuous time series of seasonal
resolution for the period 1914 to 2007 (see Section 4.10 in Volume 127/128). Determination of
volumetric changes in decadal resolution extends even further back to 1892 (Bauder et al., 2007).
Topographic maps and photogrammetrical surveys exist for 1892, 1938, 1959, 1973, 1986, 1994,
2003, 2007 and 2012. Huss et al. (2009) re-analyzed and homogenized the seasonal stake data
and ice volume changes for the period 1959 to 2007. An update for the period 1919 to 2012
with corresponding values of the mean specific winter and annual balance for fixed date periods is
presented in Section 4.17 of this report.
2600
2800
2800
3000
3000
1
2
3
45
67
89
10
11
1213
15
16
17
18
8000
00
192000
8025
00
193000
0 1km
Figure 4.25: Surface topography and observational network of the Silvrettagletscher.
Investigations in 2013/14
The measurement period extended from 22nd September 2013 to 21st September 2014. The winter
mass balance was determined during a field visit in spring, on 24th May 2014. Snow depth samples
54

4. Mass Balance
1960 1980 2000 2020
−2
−1
0
1M
ass
bala
nce
(m
w.e
.)
−20
−15
−10
−5
0
Cum
ulat
ive
mas
s ba
lanc
e (
m w
.e.)
Figure 4.26: Silvrettagletscher - Mean specific annual balance (bars) and cumulative
mass balance (line) for the period 1959-2015.
were taken at 196 locations and supplemented by density profiles in a snow pit at two sites. At the
time of the measurements in autumn 2014, the tongue was free of snow from any recent snowfalls.
Melt-out of the winter accumulation occurred up to an elevation of 2850 m a.s.l., and a larger area
with accumulation remained, compared to previous years. Density measurements were taken in a
snow pit at Stake 2, and measurements from 16 stakes were available for determining the annual
mass balance.
Table 4.19: Silvrettagletscher - Specific winter and annual balance versus altitude in the
two periods 2013/14 and 2014/15, evaluated for the measurement period
defined by the dates of field survey.
Altitude 2013/14 2014/15
Area bw ba Area bw ba(m a.s.l.) (km2) (mm w.e.) (mm w.e.) (km2) (mm w.e.) (mm w.e.)
2400 - 2500 0.016 934 −2495 0.016 1310 −3423
2500 - 2600 0.338 886 −2236 0.338 1378 −3220
2600 - 2700 0.392 1104 −1235 0.392 1365 −2552
2700 - 2800 0.663 1190 −960 0.663 1432 −1820
2800 - 2900 0.576 1293 −440 0.576 1404 −978
2900 - 3000 0.583 1371 54 0.583 1430 −671
3000 - 3100 0.117 1268 227 0.117 1184 −1049
2400 - 3100 2.684 1202 −786 2.684 1397 −1649
55

The Swiss Glaciers 2013/14 and 2014/15
Investigations in 2014/15
The measuring period was from 21st September 2014 to 25th September 2015. During a spring
field visit on 4th May 2015, snow depth probings from about 183 individual points were collected.
Density was determined in snow pits at the same two locations as in previous years. The melt-out
of winter accumulation extended to almost the entire area already by the end of August 2015.
During the measurements in September 2015 the glacier was covered with 20-25 cm of fresh snow
from the previous days. No density measurements were possible as no accumulation from the
winter survived the melting season. Measurements of mass balance collected at 16 stakes were
available for determining the annual mass balance. A short field visit at the end of October 2015
revealed some further melting on the glacier tongue after the field campaign in the order of 2 to
22 cm of ice, depending on the locations.
Installation of an ablation stake using a steam drill on Vadret dal Murtel in September
2015 with Vadret dal Tschierva visible in the background. (Photo: M. Huss)
56
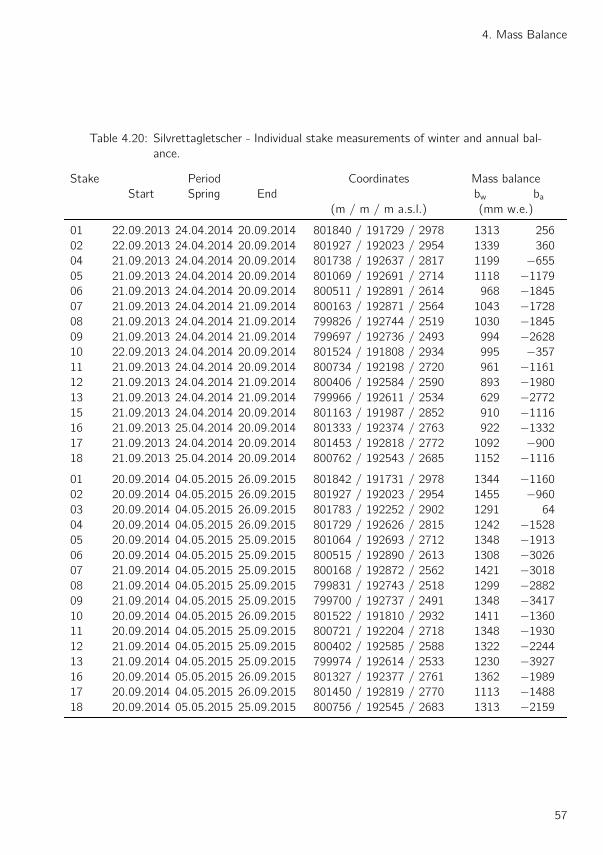
4. Mass Balance
Table 4.20: Silvrettagletscher - Individual stake measurements of winter and annual bal-
ance.
Stake Period Coordinates Mass balance
Start Spring End bw ba(m / m / m a.s.l.) (mm w.e.)
01 22.09.2013 24.04.2014 20.09.2014 801840 / 191729 / 2978 1313 256
02 22.09.2013 24.04.2014 20.09.2014 801927 / 192023 / 2954 1339 360
04 21.09.2013 24.04.2014 20.09.2014 801738 / 192637 / 2817 1199 −655
05 21.09.2013 24.04.2014 20.09.2014 801069 / 192691 / 2714 1118 −1179
06 21.09.2013 24.04.2014 20.09.2014 800511 / 192891 / 2614 968 −1845
07 21.09.2013 24.04.2014 21.09.2014 800163 / 192871 / 2564 1043 −1728
08 21.09.2013 24.04.2014 21.09.2014 799826 / 192744 / 2519 1030 −1845
09 21.09.2013 24.04.2014 21.09.2014 799697 / 192736 / 2493 994 −2628
10 22.09.2013 24.04.2014 20.09.2014 801524 / 191808 / 2934 995 −357
11 21.09.2013 24.04.2014 20.09.2014 800734 / 192198 / 2720 961 −1161
12 21.09.2013 24.04.2014 21.09.2014 800406 / 192584 / 2590 893 −1980
13 21.09.2013 24.04.2014 21.09.2014 799966 / 192611 / 2534 629 −2772
15 21.09.2013 24.04.2014 20.09.2014 801163 / 191987 / 2852 910 −1116
16 21.09.2013 25.04.2014 20.09.2014 801333 / 192374 / 2763 922 −1332
17 21.09.2013 24.04.2014 20.09.2014 801453 / 192818 / 2772 1092 −900
18 21.09.2013 25.04.2014 20.09.2014 800762 / 192543 / 2685 1152 −1116
01 20.09.2014 04.05.2015 26.09.2015 801842 / 191731 / 2978 1344 −1160
02 20.09.2014 04.05.2015 26.09.2015 801927 / 192023 / 2954 1455 −960
03 20.09.2014 04.05.2015 26.09.2015 801783 / 192252 / 2902 1291 64
04 20.09.2014 04.05.2015 26.09.2015 801729 / 192626 / 2815 1242 −1528
05 20.09.2014 04.05.2015 25.09.2015 801064 / 192693 / 2712 1348 −1913
06 20.09.2014 04.05.2015 25.09.2015 800515 / 192890 / 2613 1308 −3026
07 21.09.2014 04.05.2015 25.09.2015 800168 / 192872 / 2562 1421 −3018
08 21.09.2014 04.05.2015 25.09.2015 799831 / 192743 / 2518 1299 −2882
09 21.09.2014 04.05.2015 25.09.2015 799700 / 192737 / 2491 1348 −3417
10 20.09.2014 04.05.2015 26.09.2015 801522 / 191810 / 2932 1411 −1360
11 20.09.2014 04.05.2015 25.09.2015 800721 / 192204 / 2718 1348 −1930
12 21.09.2014 04.05.2015 25.09.2015 800402 / 192585 / 2588 1322 −2244
13 21.09.2014 04.05.2015 25.09.2015 799974 / 192614 / 2533 1230 −3927
16 20.09.2014 05.05.2015 26.09.2015 801327 / 192377 / 2761 1362 −1989
17 20.09.2014 04.05.2015 26.09.2015 801450 / 192819 / 2770 1113 −1488
18 20.09.2014 05.05.2015 25.09.2015 800756 / 192545 / 2683 1313 −2159
57

The Swiss Glaciers 2013/14 and 2014/15
−4 −2 0Specific balance (m w.e.)
2400
2600
2800
3000A
ltitu
de (
m a
.s.l.
)2013/2014
−4 −2 0 2Volumetric balance (106 m3 w.e.)
−4 −2 0Specific balance (m w.e.)
2400
2600
2800
3000
Alti
tude
(m
a.s
.l.)
2014/2015
−4 −2 0 2Volumetric balance (106 m3 w.e.)
Figure 4.27: Specific (left) and volumetric (right) winter (dotted, ⋄), summer
(dashed, △) and annual (continuous line, +) balance versus al-
titude for 2013/14 (top) and 2014/15 (bottom). Small symbols
mark the individual measurements.
−2 −1 0 1Mean specific mass balance (m w.e.)
2400
2600
2800
3000
ELA
(m
a.s
.l.)
2013/20142014/2015
−2 −1 0 1Mean specific mass balance (m w.e.)
0
20
40
60
80
100
AA
R (
%)
2013/20142014/2015
Figure 4.28: Equilibrium line altitude (ELA) and accumulation area ratio (AAR)
versus mean specific balance including all previous observations.
58
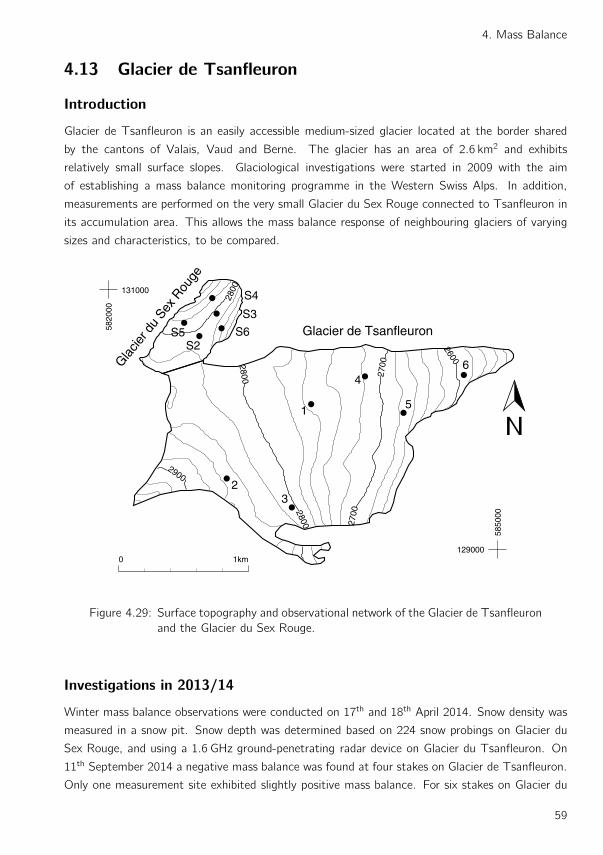
4. Mass Balance
4.13 Glacier de Tsanfleuron
Introduction
Glacier de Tsanfleuron is an easily accessible medium-sized glacier located at the border shared
by the cantons of Valais, Vaud and Berne. The glacier has an area of 2.6 km2 and exhibits
relatively small surface slopes. Glaciological investigations were started in 2009 with the aim
of establishing a mass balance monitoring programme in the Western Swiss Alps. In addition,
measurements are performed on the very small Glacier du Sex Rouge connected to Tsanfleuron in
its accumulation area. This allows the mass balance response of neighbouring glaciers of varying
sizes and characteristics, to be compared.
2900
2800
2800
2800 2700
2700
2600
23
4
5
6
1
S2
S3
S4
S5 S65820
00
131000
5850
00
1290000 1km
Gla
cier d
u Sex
Rou
ge
Glacier de Tsanfleuron
Figure 4.29: Surface topography and observational network of the Glacier de Tsanfleuron
and the Glacier du Sex Rouge.
Investigations in 2013/14
Winter mass balance observations were conducted on 17th and 18th April 2014. Snow density was
measured in a snow pit. Snow depth was determined based on 224 snow probings on Glacier du
Sex Rouge, and using a 1.6 GHz ground-penetrating radar device on Glacier du Tsanfleuron. On
11th September 2014 a negative mass balance was found at four stakes on Glacier de Tsanfleuron.
Only one measurement site exhibited slightly positive mass balance. For six stakes on Glacier du
59
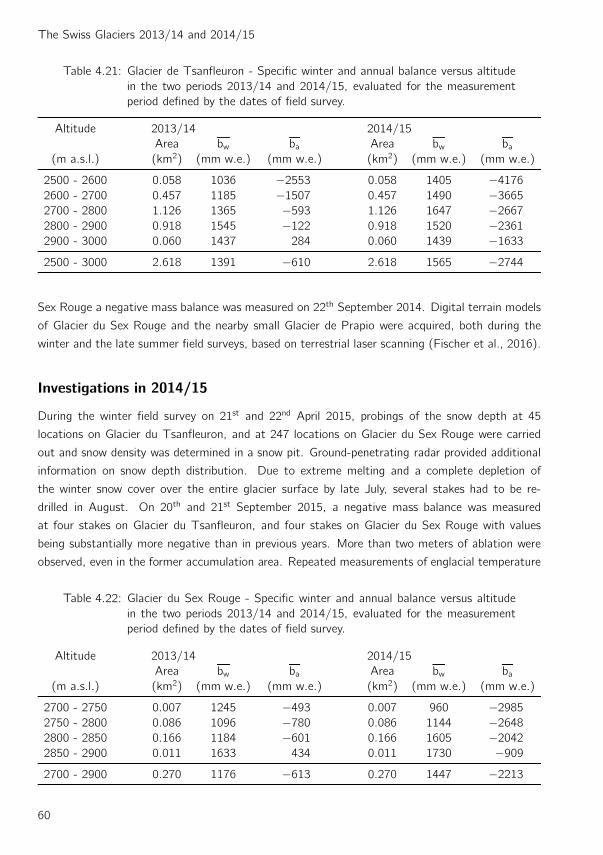
The Swiss Glaciers 2013/14 and 2014/15
Table 4.21: Glacier de Tsanfleuron - Specific winter and annual balance versus altitude
in the two periods 2013/14 and 2014/15, evaluated for the measurement
period defined by the dates of field survey.
Altitude 2013/14 2014/15
Area bw ba Area bw ba(m a.s.l.) (km2) (mm w.e.) (mm w.e.) (km2) (mm w.e.) (mm w.e.)
2500 - 2600 0.058 1036 −2553 0.058 1405 −4176
2600 - 2700 0.457 1185 −1507 0.457 1490 −3665
2700 - 2800 1.126 1365 −593 1.126 1647 −2667
2800 - 2900 0.918 1545 −122 0.918 1520 −2361
2900 - 3000 0.060 1437 284 0.060 1439 −1633
2500 - 3000 2.618 1391 −610 2.618 1565 −2744
Sex Rouge a negative mass balance was measured on 22th September 2014. Digital terrain models
of Glacier du Sex Rouge and the nearby small Glacier de Prapio were acquired, both during the
winter and the late summer field surveys, based on terrestrial laser scanning (Fischer et al., 2016).
Investigations in 2014/15
During the winter field survey on 21st and 22nd April 2015, probings of the snow depth at 45
locations on Glacier du Tsanfleuron, and at 247 locations on Glacier du Sex Rouge were carried
out and snow density was determined in a snow pit. Ground-penetrating radar provided additional
information on snow depth distribution. Due to extreme melting and a complete depletion of
the winter snow cover over the entire glacier surface by late July, several stakes had to be re-
drilled in August. On 20th and 21st September 2015, a negative mass balance was measured
at four stakes on Glacier du Tsanfleuron, and four stakes on Glacier du Sex Rouge with values
being substantially more negative than in previous years. More than two meters of ablation were
observed, even in the former accumulation area. Repeated measurements of englacial temperature
Table 4.22: Glacier du Sex Rouge - Specific winter and annual balance versus altitude
in the two periods 2013/14 and 2014/15, evaluated for the measurement
period defined by the dates of field survey.
Altitude 2013/14 2014/15
Area bw ba Area bw ba(m a.s.l.) (km2) (mm w.e.) (mm w.e.) (km2) (mm w.e.) (mm w.e.)
2700 - 2750 0.007 1245 −493 0.007 960 −2985
2750 - 2800 0.086 1096 −780 0.086 1144 −2648
2800 - 2850 0.166 1184 −601 0.166 1605 −2042
2850 - 2900 0.011 1633 434 0.011 1730 −909
2700 - 2900 0.270 1176 −613 0.270 1447 −2213
60

4. Mass Balance
in a 35m deep borehole on Glacier du Sex Rouge indicated ice at temperatures of around -1◦C,
and thus polythermal conditions in the ablation area (Huss and Fischer, 2016). Comparison of
high-resolution digital elevation models for Glacier du Sex Rouge and Glacier de Prapio based
on terrestrial laser scanning indicated good agreement with direct mass balance measurements
(Fischer et al., 2016).
Table 4.23: Glacier de Tsanfleuron and Glacier du Sex Rouge - Individual stake measure-
ments of winter and annual balance.
Stake Period Coordinates Mass balance
Start Spring End bw ba(m / m / m a.s.l.) (mm w.e.)
2 13.09.2013 17.04.2014 11.09.2014 582913 / 129545 / 2851 1750 130
3 13.09.2013 17.04.2014 11.09.2014 583415 / 129322 / 2805 1310 −230
4 13.09.2013 17.04.2014 11.09.2014 583979 / 130337 / 2719 1390 −640
5 13.09.2013 17.04.2014 11.09.2014 584261 / 130049 / 2689 1270 −1420
6 13.09.2013 17.04.2014 11.09.2014 584742 / 130347 / 2603 1280 −2470
S2 14.09.2013 16.04.2014 22.09.2014 582702 / 130654 / 2805 850 −1030
S3 14.09.2013 16.04.2014 22.09.2014 582835 / 130816 / 2806 1020 −520
S4 14.09.2013 16.04.2014 22.09.2014 582801 / 130936 / 2777 900 −1090
S5 14.09.2013 16.04.2014 22.09.2014 582585 / 130745 / 2785 1050 −800
S6 14.09.2013 16.04.2014 22.09.2014 582873 / 130703 / 2835 1350 −200
S7 14.09.2013 16.04.2014 22.09.2014 582609 / 130602 / 2810 1130 −670
1 11.09.2014 20.04.2015 21.09.2015 583527 / 130148 / 2756 1530 −2370
2 11.09.2014 20.04.2015 21.09.2015 582918 / 129553 / 2851 1350 −2100
5 11.09.2014 20.04.2015 21.09.2015 584264 / 130051 / 2685 1460 −3720
6 11.09.2014 20.04.2015 21.09.2015 584735 / 130346 / 2608 1570 −3970
S2 22.09.2014 21.04.2015 20.09.2015 582702 / 130654 / 2805 1430 −1950
S3 22.09.2014 21.04.2015 20.09.2015 582835 / 130816 / 2806 1380 −2020
S5 22.09.2014 21.04.2015 20.09.2015 582583 / 130742 / 2785 780 −2950
S7 22.09.2014 21.04.2015 20.09.2015 582609 / 130602 / 2810 1080 −2300
61
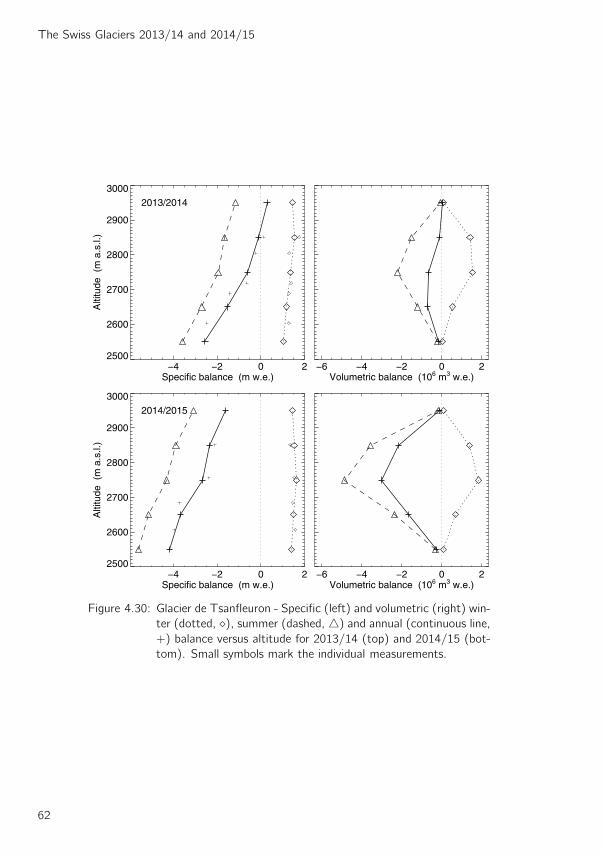
The Swiss Glaciers 2013/14 and 2014/15
−4 −2 0 2Specific balance (m w.e.)
2500
2600
2700
2800
2900
3000
Alti
tude
(m
a.s
.l.)
2013/2014
−6 −4 −2 0 2Volumetric balance (106 m3 w.e.)
−4 −2 0 2Specific balance (m w.e.)
2500
2600
2700
2800
2900
3000
Alti
tude
(m
a.s
.l.)
2014/2015
−6 −4 −2 0 2Volumetric balance (106 m3 w.e.)
Figure 4.30: Glacier de Tsanfleuron - Specific (left) and volumetric (right) win-
ter (dotted, ⋄), summer (dashed, △) and annual (continuous line,
+) balance versus altitude for 2013/14 (top) and 2014/15 (bot-
tom). Small symbols mark the individual measurements.
62
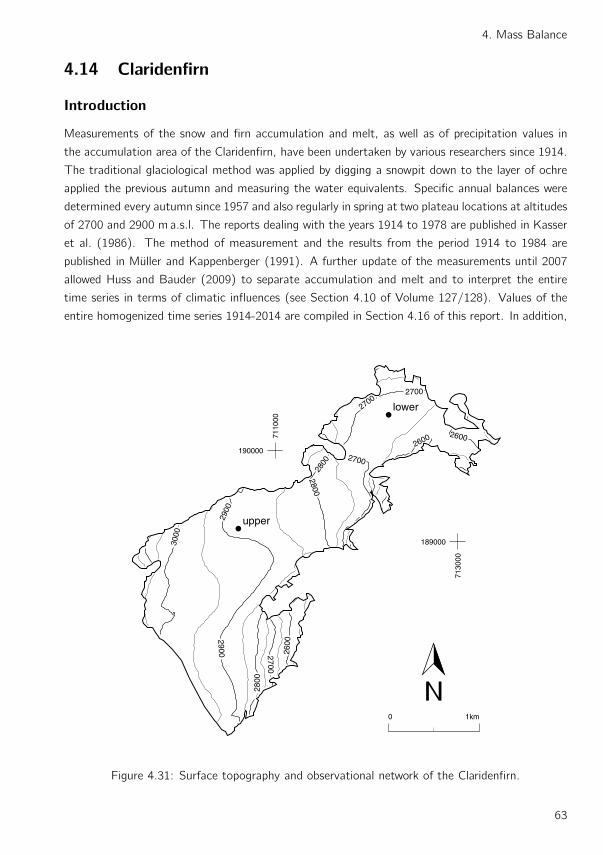
4. Mass Balance
4.14 Claridenfirn
Introduction
Measurements of the snow and firn accumulation and melt, as well as of precipitation values in
the accumulation area of the Claridenfirn, have been undertaken by various researchers since 1914.
The traditional glaciological method was applied by digging a snowpit down to the layer of ochre
applied the previous autumn and measuring the water equivalents. Specific annual balances were
determined every autumn since 1957 and also regularly in spring at two plateau locations at altitudes
of 2700 and 2900 m a.s.l. The reports dealing with the years 1914 to 1978 are published in Kasser
et al. (1986). The method of measurement and the results from the period 1914 to 1984 are
published in Muller and Kappenberger (1991). A further update of the measurements until 2007
allowed Huss and Bauder (2009) to separate accumulation and melt and to interpret the entire
time series in terms of climatic influences (see Section 4.10 of Volume 127/128). Values of the
entire homogenized time series 1914-2014 are compiled in Section 4.16 of this report. In addition,
2900
2900
2800
2700
2600
2800
2800
2700
2700
2700
26002600
3000
lower
upper
190000
7110
00
189000
7130
00
0 1km
Figure 4.31: Surface topography and observational network of the Claridenfirn.
63
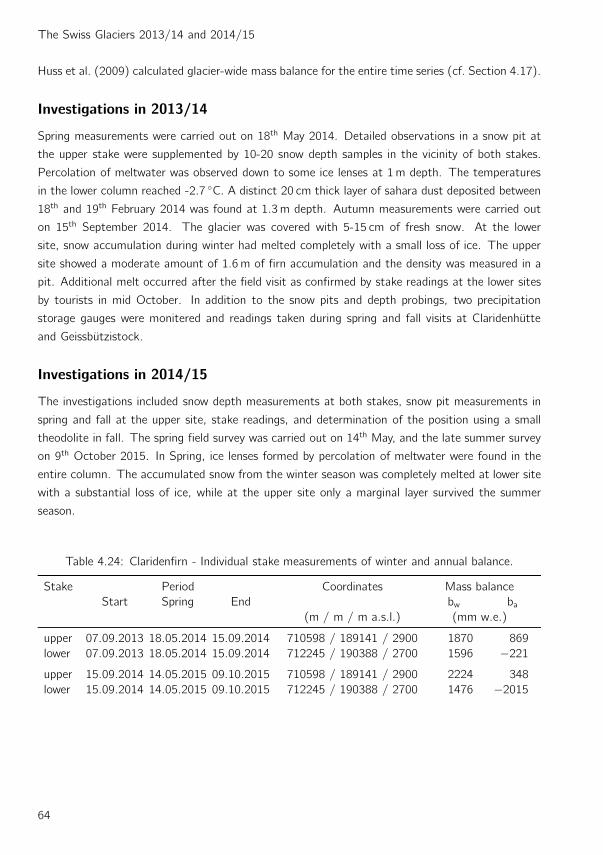
The Swiss Glaciers 2013/14 and 2014/15
Huss et al. (2009) calculated glacier-wide mass balance for the entire time series (cf. Section 4.17).
Investigations in 2013/14
Spring measurements were carried out on 18th May 2014. Detailed observations in a snow pit at
the upper stake were supplemented by 10-20 snow depth samples in the vicinity of both stakes.
Percolation of meltwater was observed down to some ice lenses at 1m depth. The temperatures
in the lower column reached -2.7 ◦C. A distinct 20 cm thick layer of sahara dust deposited between
18th and 19th February 2014 was found at 1.3m depth. Autumn measurements were carried out
on 15th September 2014. The glacier was covered with 5-15 cm of fresh snow. At the lower
site, snow accumulation during winter had melted completely with a small loss of ice. The upper
site showed a moderate amount of 1.6m of firn accumulation and the density was measured in a
pit. Additional melt occurred after the field visit as confirmed by stake readings at the lower sites
by tourists in mid October. In addition to the snow pits and depth probings, two precipitation
storage gauges were monitered and readings taken during spring and fall visits at Claridenhutte
and Geissbutzistock.
Investigations in 2014/15
The investigations included snow depth measurements at both stakes, snow pit measurements in
spring and fall at the upper site, stake readings, and determination of the position using a small
theodolite in fall. The spring field survey was carried out on 14th May, and the late summer survey
on 9th October 2015. In Spring, ice lenses formed by percolation of meltwater were found in the
entire column. The accumulated snow from the winter season was completely melted at lower site
with a substantial loss of ice, while at the upper site only a marginal layer survived the summer
season.
Table 4.24: Claridenfirn - Individual stake measurements of winter and annual balance.
Stake Period Coordinates Mass balance
Start Spring End bw ba(m / m / m a.s.l.) (mm w.e.)
upper 07.09.2013 18.05.2014 15.09.2014 710598 / 189141 / 2900 1870 869
lower 07.09.2013 18.05.2014 15.09.2014 712245 / 190388 / 2700 1596 −221
upper 15.09.2014 14.05.2015 09.10.2015 710598 / 189141 / 2900 2224 348
lower 15.09.2014 14.05.2015 09.10.2015 712245 / 190388 / 2700 1476 −2015
64
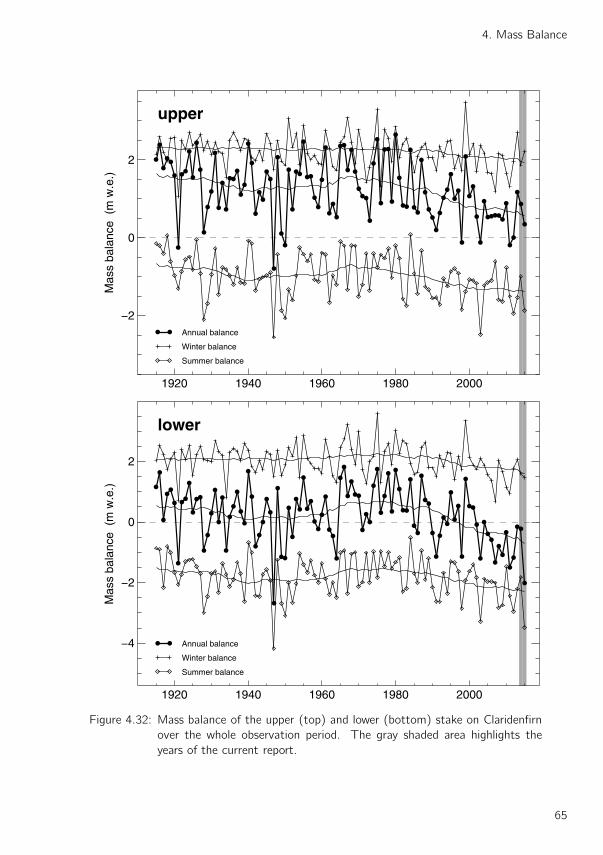
4. Mass Balance
1920 1940 1960 1980 2000
−2
0
2
Mas
s ba
lanc
e (
m w
.e.)
Annual balance
Winter balance
Summer balance
upper
1920 1940 1960 1980 2000
−4
−2
0
2
Mas
s ba
lanc
e (
m w
.e.)
Annual balance
Winter balance
Summer balance
lower
Figure 4.32: Mass balance of the upper (top) and lower (bottom) stake on Claridenfirn
over the whole observation period. The gray shaded area highlights the
years of the current report.
65
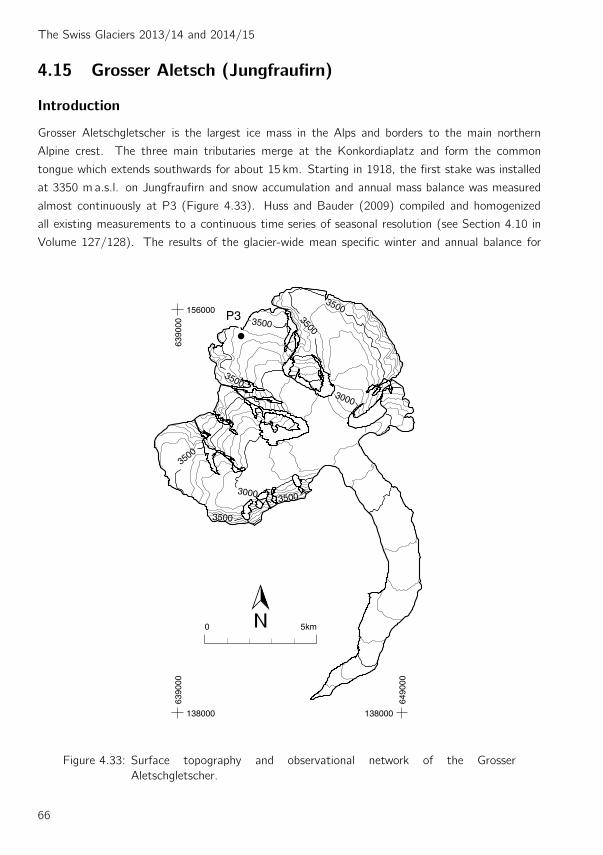
The Swiss Glaciers 2013/14 and 2014/15
4.15 Grosser Aletsch (Jungfraufirn)
Introduction
Grosser Aletschgletscher is the largest ice mass in the Alps and borders to the main northern
Alpine crest. The three main tributaries merge at the Konkordiaplatz and form the common
tongue which extends southwards for about 15 km. Starting in 1918, the first stake was installed
at 3350 m a.s.l. on Jungfraufirn and snow accumulation and annual mass balance was measured
almost continuously at P3 (Figure 4.33). Huss and Bauder (2009) compiled and homogenized
all existing measurements to a continuous time series of seasonal resolution (see Section 4.10 in
Volume 127/128). The results of the glacier-wide mean specific winter and annual balance for
3000
35003500
3500
3500
3500
35003000
3500P3
6390
00
156000
6390
00
138000
6490
00
138000
0 5km
Figure 4.33: Surface topography and observational network of the Grosser
Aletschgletscher.
66
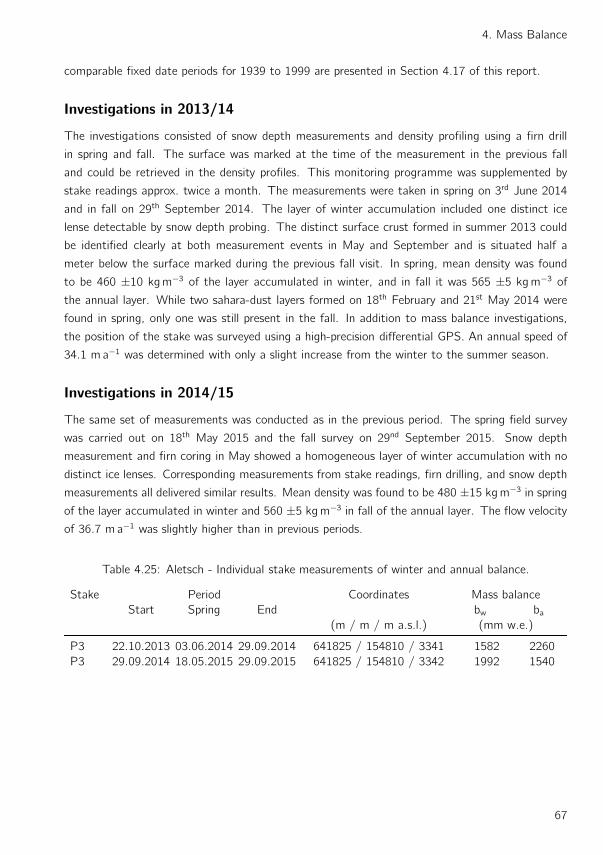
4. Mass Balance
comparable fixed date periods for 1939 to 1999 are presented in Section 4.17 of this report.
Investigations in 2013/14
The investigations consisted of snow depth measurements and density profiling using a firn drill
in spring and fall. The surface was marked at the time of the measurement in the previous fall
and could be retrieved in the density profiles. This monitoring programme was supplemented by
stake readings approx. twice a month. The measurements were taken in spring on 3rd June 2014
and in fall on 29th September 2014. The layer of winter accumulation included one distinct ice
lense detectable by snow depth probing. The distinct surface crust formed in summer 2013 could
be identified clearly at both measurement events in May and September and is situated half a
meter below the surface marked during the previous fall visit. In spring, mean density was found
to be 460 ±10 kgm−3 of the layer accumulated in winter, and in fall it was 565 ±5 kgm−3 of
the annual layer. While two sahara-dust layers formed on 18th February and 21st May 2014 were
found in spring, only one was still present in the fall. In addition to mass balance investigations,
the position of the stake was surveyed using a high-precision differential GPS. An annual speed of
34.1 m a−1 was determined with only a slight increase from the winter to the summer season.
Investigations in 2014/15
The same set of measurements was conducted as in the previous period. The spring field survey
was carried out on 18th May 2015 and the fall survey on 29nd September 2015. Snow depth
measurement and firn coring in May showed a homogeneous layer of winter accumulation with no
distinct ice lenses. Corresponding measurements from stake readings, firn drilling, and snow depth
measurements all delivered similar results. Mean density was found to be 480 ±15 kgm−3 in spring
of the layer accumulated in winter and 560 ±5 kgm−3 in fall of the annual layer. The flow velocity
of 36.7 m a−1 was slightly higher than in previous periods.
Table 4.25: Aletsch - Individual stake measurements of winter and annual balance.
Stake Period Coordinates Mass balance
Start Spring End bw ba(m / m / m a.s.l.) (mm w.e.)
P3 22.10.2013 03.06.2014 29.09.2014 641825 / 154810 / 3341 1582 2260
P3 29.09.2014 18.05.2015 29.09.2015 641825 / 154810 / 3342 1992 1540
67
The Swiss Glaciers 2013/14 and 2014/15
4.16 Homogenized time series of Claridenfirn
The record of mass balance measurements at Claridenfirn, the longest time series of mass balances
worldwide, celebrated its 100-year anniversary in 2014. On this occasion, the time series was re-
analysed in order to provide consistent time series of seasonal mass balances for the period 1914
to 2014.
Already in an earlier analysis, the mass balance record from the period 1914 to 1984 was checked
for consistency, and data gaps were filled based on the best possible estimates. Results from this
review were published in Muller and Kappenberger (1991). A subsequent re-analysis and update
until 2007 was done by Huss and Bauder (2009) and their results were reported in Section 4.10
of Volume 127/128 of the Glaciological Reports. In the present investigations, the evaluation has
been extended to the years 1914 to 2015. Additionally, original field book notes were consulted to
look for further, not yet published measurements and to clarify whether the declared values reflect
true measurements or whether assumptions are involved.
The mass balance at Claridenfirn was measured twice a year, at the end of the accumulation period
(May) and at the end of the ablation season (September) for a lower site (2700 m a.s.l.), situated
close to the equilibrium line, and for an upper site (2900 m a.s.l.), located in the accumulation
area. The mass balance was determined in three different ways, by (1) stake readings, (2) drilling
or digging to the marked horizon of the previous fall and (3) snow depth probing. If available, snow
pit data was used for the final mass balance time series, as they appear to provide the most reliable
values, otherwise snow depth probing and, as a last option, stake readings were used. Snow density
measurements have been carried out simultaneously, on a regular basis since the late 1950s. For
years without density records, a density of 550 kgm−3 was assumed for one-year-old snow, 600
kgm−3 for two-year-old or older snow, 450 kgm−3 for winter snow and 320 kgm−3 for fresh snow.
The resulting winter and annual mass balances in water equivalents for the two sites at Claridenfirn
are presented in Tables 4.26 and 4.27. The tables also provide further information on the type and
the quality of the mass balance measurements. Data for years with missing values, for the most
part during the first half of the period, were determined based on best possible estimates (Muller
and Kappenberger, 1991; Huss and Bauder, 2009).
68

4. Mass Balance
Table 4.26: Time series of winter (bw) and annual (ba) mass balance in mmw.e. at the
lower stake at Claridenfirn during the period 1914 to 2015. The type of mass
balance measurements is indicated by the abbreviations P for stake reading,
H for marked horizon and S for snow depth probing. The column ρ reports
the availability of density (in kgm−3) measurements. Regular font refers to
measured values and italic font to estimated values or measurements which
are subject to uncertainty.
Year Period Measurements
Start Spring End bw type ρ ba type ρ
1914/15 28.09.1914 16.05.1915 08.08.1915 1913 P 450 1108 H 530
1915/16 08.08.1915 25.05.1916 15.08.1916 2530 1640
1916/17 15.08.1916 25.05.1917 26.09.1917 1800 P 450 44 H 550
1917/18 26.09.1917 30.03.1918 18.09.1918 1845 P 450 1171 H 610
1918/19 18.09.1918 25.05.1919 17.09.1919 2080 1248 H 615
1919/20 17.09.1919 26.06.1920 25.09.1920 1800 P 450 840 H 600
1920/21 25.09.1920 31.03.1921 15.09.1921 855 P 450 -1410 P 600
1921/22 15.09.1921 25.05.1922 25.09.1922 2390 776 P 550
1922/23 25.09.1922 25.05.1923 12.09.1923 2070 714 H 550
1923/24 12.09.1923 06.07.1924 17.09.1924 1530 P 450 1220 H 464
1924/25 17.09.1924 06.06.1925 01.09.1925 1058 P 450 186 H 550
1925/26 01.09.1925 25.05.1926 11.09.1926 2220 765 H 550
1926/27 11.09.1926 25.05.1927 23.09.1927 2510 1032 H 550
1927/28 23.09.1927 08.04.1928 12.09.1928 1755 P 450 -1032 P 600
1928/29 12.09.1928 14.07.1929 15.09.1929 1071 P 450 -450 P 600
1929/30 15.09.1929 31.05.1930 26.09.1930 1990 385 H 550
1930/31 26.09.1930 08.07.1931 16.09.1931 1674 P 450 1067 H 550
1931/32 16.09.1931 13.06.1932 15.09.1932 1868 P 450 0 H 550
1932/33 15.09.1932 14.05.1933 12.09.1933 1958 P 450 935 H 550
1933/34 12.09.1933 25.05.1934 19.09.1934 630 P 450 -984 P 600
1934/35 19.09.1934 13.07.1935 16.09.1935 720 P 450 389 H 598
1935/36 16.09.1935 30.07.1936 20.09.1936 1328 P 450 523 H 550
1936/37 20.09.1936 25.07.1937 20.09.1937 1350 P 450 953 H 550
1937/38 20.09.1937 04.06.1938 14.09.1938 1868 P 450 352 H 550
1938/39 14.09.1938 11.06.1939 24.09.1939 2590 176 H 550
1939/40 24.09.1939 01.03.1940 25.09.1940 2048 1590 P 550
1940/41 25.09.1940 25.05.1941 18.09.1941 1850 842 H 550
1941/42 18.09.1941 28.06.1942 13.09.1942 1125 P 450 -870 P 600
1942/43 13.09.1942 25.05.1943 17.09.1943 2030 -480 P 600
1943/44 17.09.1943 25.05.1944 14.09.1944 1740 40 H 550
1944/45 14.09.1944 25.05.1945 12.09.1945 2330 849 H 550
1945/46 12.09.1945 13.07.1946 11.09.1946 1845 P 450 450 H 550
1946/47 11.09.1946 14.04.1947 12.09.1947 1598 P 450 -2346 P 600
1947/48 12.09.1947 25.05.1948 03.10.1948 2370 1389 H 550
1948/49 03.10.1948 06.06.1949 20.09.1949 1305 P 450 -1200 P 600
1949/50 20.09.1949 20.05.1950 14.09.1950 1530 P 450 -1002 P 600
1950/51 14.09.1950 15.06.1951 12.09.1951 2025 P 450 479 H 550
69
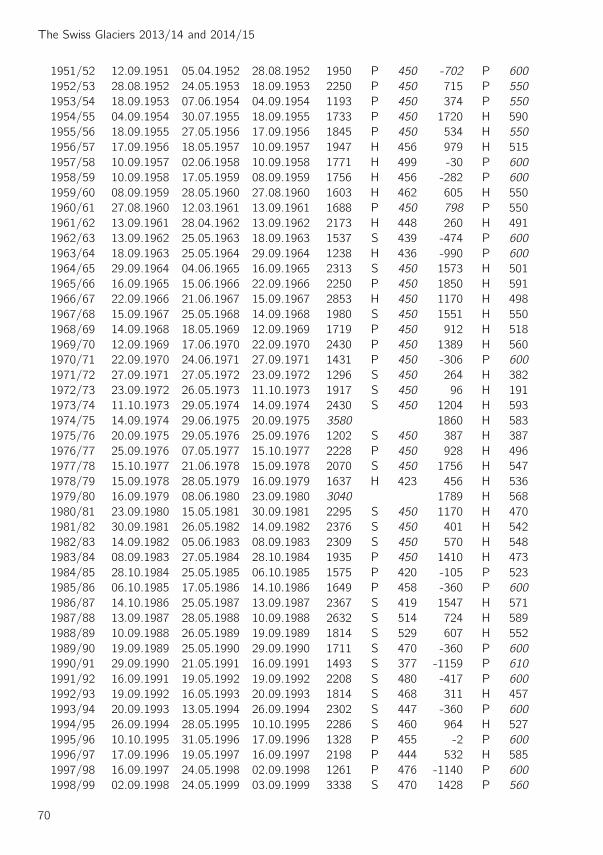
The Swiss Glaciers 2013/14 and 2014/15
1951/52 12.09.1951 05.04.1952 28.08.1952 1950 P 450 -702 P 600
1952/53 28.08.1952 24.05.1953 18.09.1953 2250 P 450 715 P 550
1953/54 18.09.1953 07.06.1954 04.09.1954 1193 P 450 374 P 550
1954/55 04.09.1954 30.07.1955 18.09.1955 1733 P 450 1720 H 590
1955/56 18.09.1955 27.05.1956 17.09.1956 1845 P 450 534 H 550
1956/57 17.09.1956 18.05.1957 10.09.1957 1947 H 456 979 H 515
1957/58 10.09.1957 02.06.1958 10.09.1958 1771 H 499 -30 P 600
1958/59 10.09.1958 17.05.1959 08.09.1959 1756 H 456 -282 P 600
1959/60 08.09.1959 28.05.1960 27.08.1960 1603 H 462 605 H 550
1960/61 27.08.1960 12.03.1961 13.09.1961 1688 P 450 798 P 550
1961/62 13.09.1961 28.04.1962 13.09.1962 2173 H 448 260 H 491
1962/63 13.09.1962 25.05.1963 18.09.1963 1537 S 439 -474 P 600
1963/64 18.09.1963 25.05.1964 29.09.1964 1238 H 436 -990 P 600
1964/65 29.09.1964 04.06.1965 16.09.1965 2313 S 450 1573 H 501
1965/66 16.09.1965 15.06.1966 22.09.1966 2250 P 450 1850 H 591
1966/67 22.09.1966 21.06.1967 15.09.1967 2853 H 450 1170 H 498
1967/68 15.09.1967 25.05.1968 14.09.1968 1980 S 450 1551 H 550
1968/69 14.09.1968 18.05.1969 12.09.1969 1719 P 450 912 H 518
1969/70 12.09.1969 17.06.1970 22.09.1970 2430 P 450 1389 H 560
1970/71 22.09.1970 24.06.1971 27.09.1971 1431 P 450 -306 P 600
1971/72 27.09.1971 27.05.1972 23.09.1972 1296 S 450 264 H 382
1972/73 23.09.1972 26.05.1973 11.10.1973 1917 S 450 96 H 191
1973/74 11.10.1973 29.05.1974 14.09.1974 2430 S 450 1204 H 593
1974/75 14.09.1974 29.06.1975 20.09.1975 3580 1860 H 583
1975/76 20.09.1975 29.05.1976 25.09.1976 1202 S 450 387 H 387
1976/77 25.09.1976 07.05.1977 15.10.1977 2228 P 450 928 H 496
1977/78 15.10.1977 21.06.1978 15.09.1978 2070 S 450 1756 H 547
1978/79 15.09.1978 28.05.1979 16.09.1979 1637 H 423 456 H 536
1979/80 16.09.1979 08.06.1980 23.09.1980 3040 1789 H 568
1980/81 23.09.1980 15.05.1981 30.09.1981 2295 S 450 1170 H 470
1981/82 30.09.1981 26.05.1982 14.09.1982 2376 S 450 401 H 542
1982/83 14.09.1982 05.06.1983 08.09.1983 2309 S 450 570 H 548
1983/84 08.09.1983 27.05.1984 28.10.1984 1935 P 450 1410 H 473
1984/85 28.10.1984 25.05.1985 06.10.1985 1575 P 420 -105 P 523
1985/86 06.10.1985 17.05.1986 14.10.1986 1649 P 458 -360 P 600
1986/87 14.10.1986 25.05.1987 13.09.1987 2367 S 419 1547 H 571
1987/88 13.09.1987 28.05.1988 10.09.1988 2632 S 514 724 H 589
1988/89 10.09.1988 26.05.1989 19.09.1989 1814 S 529 607 H 552
1989/90 19.09.1989 25.05.1990 29.09.1990 1711 S 470 -360 P 600
1990/91 29.09.1990 21.05.1991 16.09.1991 1493 S 377 -1159 P 610
1991/92 16.09.1991 19.05.1992 19.09.1992 2208 S 480 -417 P 600
1992/93 19.09.1992 16.05.1993 20.09.1993 1814 S 468 311 H 457
1993/94 20.09.1993 13.05.1994 26.09.1994 2302 S 447 -360 P 600
1994/95 26.09.1994 28.05.1995 10.10.1995 2286 S 460 964 H 527
1995/96 10.10.1995 31.05.1996 17.09.1996 1328 P 455 -2 P 600
1996/97 17.09.1996 19.05.1997 16.09.1997 2198 P 444 532 H 585
1997/98 16.09.1997 24.05.1998 02.09.1998 1261 P 476 -1140 P 600
1998/99 02.09.1998 24.05.1999 03.09.1999 3338 S 470 1428 P 560
70
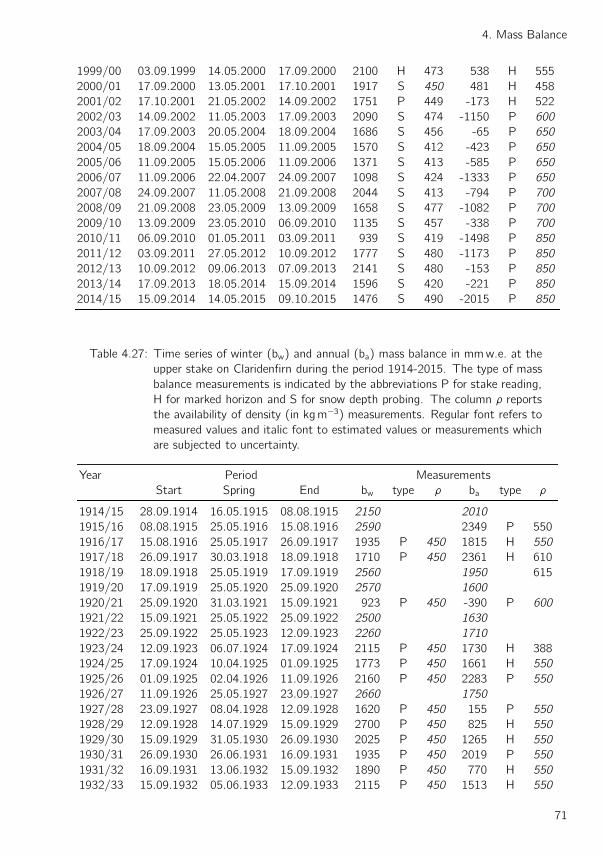
4. Mass Balance
1999/00 03.09.1999 14.05.2000 17.09.2000 2100 H 473 538 H 555
2000/01 17.09.2000 13.05.2001 17.10.2001 1917 S 450 481 H 458
2001/02 17.10.2001 21.05.2002 14.09.2002 1751 P 449 -173 H 522
2002/03 14.09.2002 11.05.2003 17.09.2003 2090 S 474 -1150 P 600
2003/04 17.09.2003 20.05.2004 18.09.2004 1686 S 456 -65 P 650
2004/05 18.09.2004 15.05.2005 11.09.2005 1570 S 412 -423 P 650
2005/06 11.09.2005 15.05.2006 11.09.2006 1371 S 413 -585 P 650
2006/07 11.09.2006 22.04.2007 24.09.2007 1098 S 424 -1333 P 650
2007/08 24.09.2007 11.05.2008 21.09.2008 2044 S 413 -794 P 700
2008/09 21.09.2008 23.05.2009 13.09.2009 1658 S 477 -1082 P 700
2009/10 13.09.2009 23.05.2010 06.09.2010 1135 S 457 -338 P 700
2010/11 06.09.2010 01.05.2011 03.09.2011 939 S 419 -1498 P 850
2011/12 03.09.2011 27.05.2012 10.09.2012 1777 S 480 -1173 P 850
2012/13 10.09.2012 09.06.2013 07.09.2013 2141 S 480 -153 P 850
2013/14 17.09.2013 18.05.2014 15.09.2014 1596 S 420 -221 P 850
2014/15 15.09.2014 14.05.2015 09.10.2015 1476 S 490 -2015 P 850
Table 4.27: Time series of winter (bw) and annual (ba) mass balance in mmw.e. at the
upper stake on Claridenfirn during the period 1914-2015. The type of mass
balance measurements is indicated by the abbreviations P for stake reading,
H for marked horizon and S for snow depth probing. The column ρ reports
the availability of density (in kgm−3) measurements. Regular font refers to
measured values and italic font to estimated values or measurements which
are subjected to uncertainty.
Year Period Measurements
Start Spring End bw type ρ ba type ρ
1914/15 28.09.1914 16.05.1915 08.08.1915 2150 2010
1915/16 08.08.1915 25.05.1916 15.08.1916 2590 2349 P 550
1916/17 15.08.1916 25.05.1917 26.09.1917 1935 P 450 1815 H 550
1917/18 26.09.1917 30.03.1918 18.09.1918 1710 P 450 2361 H 610
1918/19 18.09.1918 25.05.1919 17.09.1919 2560 1950 615
1919/20 17.09.1919 25.05.1920 25.09.1920 2570 1600
1920/21 25.09.1920 31.03.1921 15.09.1921 923 P 450 -390 P 600
1921/22 15.09.1921 25.05.1922 25.09.1922 2500 1630
1922/23 25.09.1922 25.05.1923 12.09.1923 2260 1710
1923/24 12.09.1923 06.07.1924 17.09.1924 2115 P 450 1730 H 388
1924/25 17.09.1924 10.04.1925 01.09.1925 1773 P 450 1661 H 550
1925/26 01.09.1925 02.04.1926 11.09.1926 2160 P 450 2283 P 550
1926/27 11.09.1926 25.05.1927 23.09.1927 2660 1750
1927/28 23.09.1927 08.04.1928 12.09.1928 1620 P 450 155 P 550
1928/29 12.09.1928 14.07.1929 15.09.1929 2700 P 450 825 H 550
1929/30 15.09.1929 31.05.1930 26.09.1930 2025 P 450 1265 H 550
1930/31 26.09.1930 26.06.1931 16.09.1931 1935 P 450 2019 P 550
1931/32 16.09.1931 13.06.1932 15.09.1932 1890 P 450 770 H 550
1932/33 15.09.1932 05.06.1933 12.09.1933 2115 P 450 1513 H 550
71

The Swiss Glaciers 2013/14 and 2014/15
1933/34 12.09.1933 25.05.1934 19.09.1934 1323 P 450 741 H 550
1934/35 19.09.1934 13.07.1935 16.09.1935 1485 P 450 1491 P 550
1935/36 16.09.1935 25.05.1936 20.09.1936 2710 1510
1936/37 20.09.1936 30.07.1937 20.09.1937 1395 P 450 1681 P 550
1937/38 20.09.1937 04.06.1938 14.09.1938 2223 P 450 1118 H 550
1938/39 14.09.1938 11.06.1939 24.09.1939 2025 P 450 1511 H 550
1939/40 24.09.1939 25.05.1940 25.09.1940 2500 2420
1940/41 25.09.1940 12.04.1941 18.09.1941 1935 P 450 2112 P 550
1941/42 18.09.1941 16.05.1942 13.09.1942 1845 P 450 715 H 550
1942/43 13.09.1942 25.05.1943 17.09.1943 2230 1238 H 550
1943/44 17.09.1943 16.07.1944 14.09.1944 2025 P 450 1007 H 550
1944/45 14.09.1944 25.05.1945 12.09.1945 2670 1700
1945/46 12.09.1945 25.05.1946 11.09.1946 2410 1458 P 550
1946/47 11.09.1946 14.04.1947 12.09.1947 1508 P 450 -840 P 600
1947/48 12.09.1947 25.05.1948 03.10.1948 2490 2292 H 550
1948/49 03.10.1948 06.06.1949 20.09.1949 1755 P 450 110 H 550
1949/50 20.09.1949 20.05.1950 14.09.1950 1620 P 450 -240 P 600
1950/51 14.09.1950 13.07.1951 12.09.1951 2475 P 450 1705 P 550
1951/52 12.09.1951 05.04.1952 28.08.1952 2020 S 387 688 P 550
1952/53 28.08.1952 24.05.1953 18.09.1953 2610 P 450 1744 P 550
1953/54 18.09.1953 07.06.1954 04.09.1954 1800 P 450 1601 P 550
1954/55 04.09.1954 30.07.1955 18.09.1955 2318 P 450 2530 P 590
1955/56 18.09.1955 27.05.1955 17.09.1956 2025 P 450 1447 P 550
1956/57 17.09.1956 09.06.1957 10.09.1957 1926 P 450 1716 S 550
1957/58 10.09.1957 02.06.1958 10.09.1958 2305 S 499 1031 H 534
1958/59 10.09.1958 17.05.1959 08.09.1959 2079 S 459 940 H 599
1959/60 08.09.1959 28.05.1960 27.08.1960 1884 H 497 1447 P 550
1960/61 27.08.1960 25.05.1961 13.09.1961 2750 2332 S 550
1961/62 13.09.1961 28.04.1962 13.09.1962 2285 S 448 1039 H 574
1962/63 13.09.1962 25.05.1963 17.09.1963 1840 S 436 917 H 515
1963/64 17.09.1963 25.05.1964 29.09.1964 1746 H 447 623 H 448
1964/65 29.09.1964 03.06.1965 17.09.1965 2492 H 465 2426 H 513
1965/66 17.09.1965 15.06.1966 20.09.1966 2590 H 533 2381 H 563
1966/67 20.09.1966 21.06.1967 18.09.1967 3085 H 482 1989 H 496
1967/68 18.09.1967 25.05.1968 19.09.1968 2453 H 435 2430 H 517
1968/69 19.09.1968 18.05.1969 11.09.1969 1905 H 440 1700 H 533
1969/70 11.09.1969 17.06.1970 24.09.1970 2771 H 517 1644 H 548
1970/71 24.09.1970 24.06.1971 27.09.1971 2284 H 512 1118 H 535
1971/72 27.09.1971 27.05.1972 22.09.1972 1432 H 438 1024 H 459
1972/73 22.09.1972 26.05.1973 11.10.1973 1796 H 448 499 H 367
1973/74 11.10.1973 29.05.1974 12.09.1974 2313 H 458 1910 H 565
1974/75 12.09.1974 29.06.1975 19.09.1975 3305 H 549 2670 H 578
1975/76 19.09.1975 29.05.1976 24.09.1976 1312 H 457 963 H 430
1976/77 24.09.1976 07.05.1977 14.10.1977 2736 P 450 2336 H 518
1977/78 14.10.1977 20.06.1978 15.09.1978 2568 H 535 2409 H 582
1978/79 15.09.1978 28.05.1979 16.09.1979 1963 H 423 1006 H 541
1979/80 16.09.1979 08.06.1980 23.09.1980 2850 H 475 2699 H 588
1980/81 23.09.1980 15.05.1981 30.09.1981 2059 H 421 1580 H 473
72
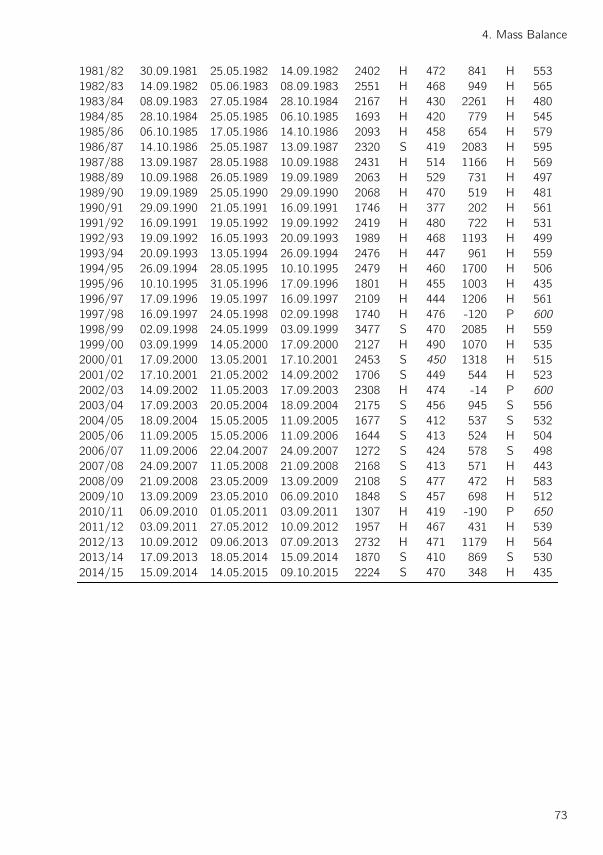
4. Mass Balance
1981/82 30.09.1981 25.05.1982 14.09.1982 2402 H 472 841 H 553
1982/83 14.09.1982 05.06.1983 08.09.1983 2551 H 468 949 H 565
1983/84 08.09.1983 27.05.1984 28.10.1984 2167 H 430 2261 H 480
1984/85 28.10.1984 25.05.1985 06.10.1985 1693 H 420 779 H 545
1985/86 06.10.1985 17.05.1986 14.10.1986 2093 H 458 654 H 579
1986/87 14.10.1986 25.05.1987 13.09.1987 2320 S 419 2083 H 595
1987/88 13.09.1987 28.05.1988 10.09.1988 2431 H 514 1166 H 569
1988/89 10.09.1988 26.05.1989 19.09.1989 2063 H 529 731 H 497
1989/90 19.09.1989 25.05.1990 29.09.1990 2068 H 470 519 H 481
1990/91 29.09.1990 21.05.1991 16.09.1991 1746 H 377 202 H 561
1991/92 16.09.1991 19.05.1992 19.09.1992 2419 H 480 722 H 531
1992/93 19.09.1992 16.05.1993 20.09.1993 1989 H 468 1193 H 499
1993/94 20.09.1993 13.05.1994 26.09.1994 2476 H 447 961 H 559
1994/95 26.09.1994 28.05.1995 10.10.1995 2479 H 460 1700 H 506
1995/96 10.10.1995 31.05.1996 17.09.1996 1801 H 455 1003 H 435
1996/97 17.09.1996 19.05.1997 16.09.1997 2109 H 444 1206 H 561
1997/98 16.09.1997 24.05.1998 02.09.1998 1740 H 476 -120 P 600
1998/99 02.09.1998 24.05.1999 03.09.1999 3477 S 470 2085 H 559
1999/00 03.09.1999 14.05.2000 17.09.2000 2127 H 490 1070 H 535
2000/01 17.09.2000 13.05.2001 17.10.2001 2453 S 450 1318 H 515
2001/02 17.10.2001 21.05.2002 14.09.2002 1706 S 449 544 H 523
2002/03 14.09.2002 11.05.2003 17.09.2003 2308 H 474 -14 P 600
2003/04 17.09.2003 20.05.2004 18.09.2004 2175 S 456 945 S 556
2004/05 18.09.2004 15.05.2005 11.09.2005 1677 S 412 537 S 532
2005/06 11.09.2005 15.05.2006 11.09.2006 1644 S 413 524 H 504
2006/07 11.09.2006 22.04.2007 24.09.2007 1272 S 424 578 S 498
2007/08 24.09.2007 11.05.2008 21.09.2008 2168 S 413 571 H 443
2008/09 21.09.2008 23.05.2009 13.09.2009 2108 S 477 472 H 583
2009/10 13.09.2009 23.05.2010 06.09.2010 1848 S 457 698 H 512
2010/11 06.09.2010 01.05.2011 03.09.2011 1307 H 419 -190 P 650
2011/12 03.09.2011 27.05.2012 10.09.2012 1957 H 467 431 H 539
2012/13 10.09.2012 09.06.2013 07.09.2013 2732 H 471 1179 H 564
2013/14 17.09.2013 18.05.2014 15.09.2014 1870 S 410 869 S 530
2014/15 15.09.2014 14.05.2015 09.10.2015 2224 S 470 348 H 435
73
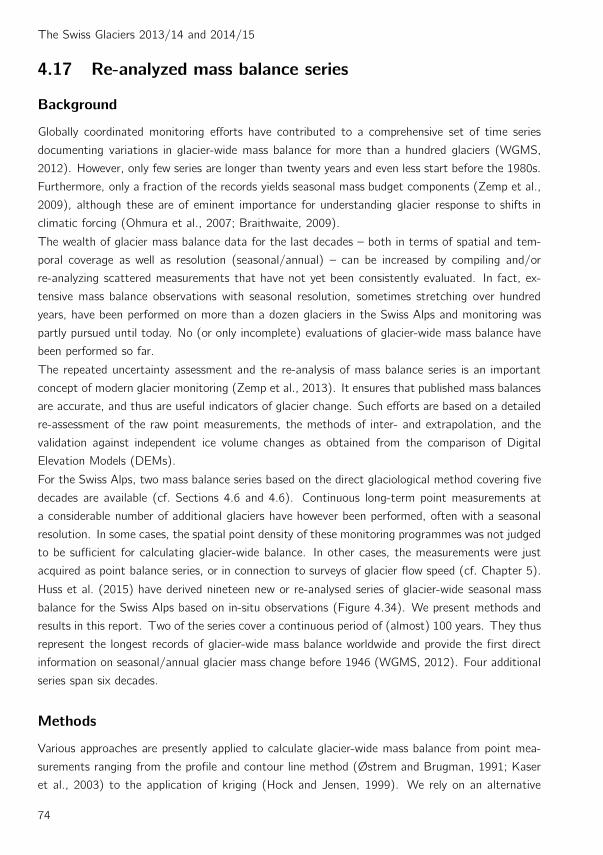
The Swiss Glaciers 2013/14 and 2014/15
4.17 Re-analyzed mass balance series
Background
Globally coordinated monitoring efforts have contributed to a comprehensive set of time series
documenting variations in glacier-wide mass balance for more than a hundred glaciers (WGMS,
2012). However, only few series are longer than twenty years and even less start before the 1980s.
Furthermore, only a fraction of the records yields seasonal mass budget components (Zemp et al.,
2009), although these are of eminent importance for understanding glacier response to shifts in
climatic forcing (Ohmura et al., 2007; Braithwaite, 2009).
The wealth of glacier mass balance data for the last decades – both in terms of spatial and tem-
poral coverage as well as resolution (seasonal/annual) – can be increased by compiling and/or
re-analyzing scattered measurements that have not yet been consistently evaluated. In fact, ex-
tensive mass balance observations with seasonal resolution, sometimes stretching over hundred
years, have been performed on more than a dozen glaciers in the Swiss Alps and monitoring was
partly pursued until today. No (or only incomplete) evaluations of glacier-wide mass balance have
been performed so far.
The repeated uncertainty assessment and the re-analysis of mass balance series is an important
concept of modern glacier monitoring (Zemp et al., 2013). It ensures that published mass balances
are accurate, and thus are useful indicators of glacier change. Such efforts are based on a detailed
re-assessment of the raw point measurements, the methods of inter- and extrapolation, and the
validation against independent ice volume changes as obtained from the comparison of Digital
Elevation Models (DEMs).
For the Swiss Alps, two mass balance series based on the direct glaciological method covering five
decades are available (cf. Sections 4.6 and 4.6). Continuous long-term point measurements at
a considerable number of additional glaciers have however been performed, often with a seasonal
resolution. In some cases, the spatial point density of these monitoring programmes was not judged
to be sufficient for calculating glacier-wide balance. In other cases, the measurements were just
acquired as point balance series, or in connection to surveys of glacier flow speed (cf. Chapter 5).
Huss et al. (2015) have derived nineteen new or re-analysed series of glacier-wide seasonal mass
balance for the Swiss Alps based on in-situ observations (Figure 4.34). We present methods and
results in this report. Two of the series cover a continuous period of (almost) 100 years. They thus
represent the longest records of glacier-wide mass balance worldwide and provide the first direct
information on seasonal/annual glacier mass change before 1946 (WGMS, 2012). Four additional
series span six decades.
Methods
Various approaches are presently applied to calculate glacier-wide mass balance from point mea-
surements ranging from the profile and contour line method (Østrem and Brugman, 1991; Kaser
et al., 2003) to the application of kriging (Hock and Jensen, 1999). We rely on an alternative
74
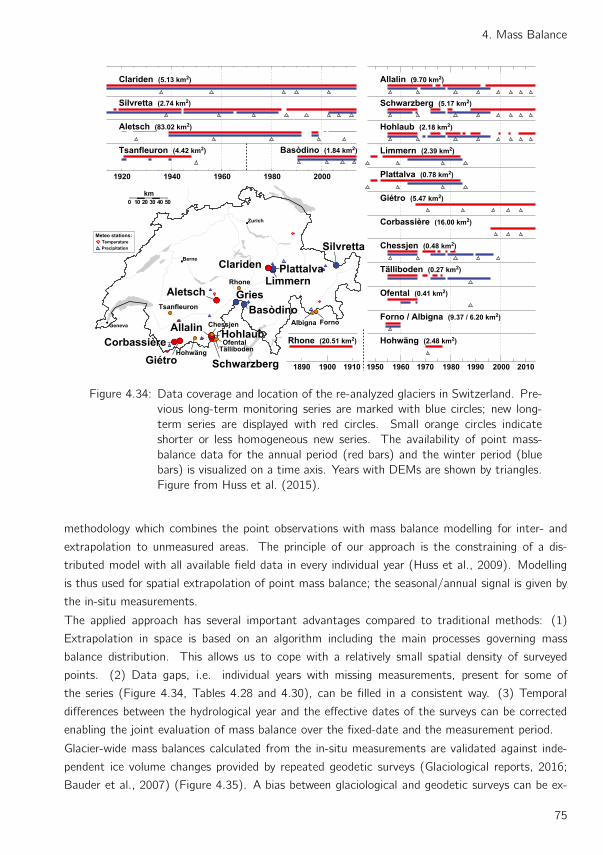
4. Mass Balance
Silvretta
GriesBasòdino
LimmernClariden
GiétroCorbassière
Allalin
Schwarzberg
HohlaubChessjen
Rhone
Forno
Hohwäng
Tsanfleuron
TällibodenOfental
Albigna
0 10 20 30 40 50km
Zurich
Berne
Geneva
1920 1940 1960 1980 2000
Tsanfleuron (4.42 km2)
1960 1980 20001950 1970 1990 2010
Rhone (20.51 km2)
19001890 1910
Basòdino (1.84 km2)
Clariden (5.13 km2)
Silvretta (2.74 km2)
Aletsch (83.02 km2)
Allalin (9.70 km2)
Schwarzberg (5.17 km2)
Hohlaub (2.18 km2)
Limmern (2.39 km2)
Plattalva (0.78 km2)
Giétro (5.47 km2)
Corbassière (16.00 km2)
Chessjen (0.48 km2)
Tälliboden (0.27 km2)
Ofental (0.41 km2)
Forno / Albigna (9.37 / 6.20 km2)
Hohwäng (2.48 km2)
Aletsch
Plattalva
Meteo stations:
PrecipitationTemperature
Figure 4.34: Data coverage and location of the re-analyzed glaciers in Switzerland. Pre-
vious long-term monitoring series are marked with blue circles; new long-
term series are displayed with red circles. Small orange circles indicate
shorter or less homogeneous new series. The availability of point mass-
balance data for the annual period (red bars) and the winter period (blue
bars) is visualized on a time axis. Years with DEMs are shown by triangles.
Figure from Huss et al. (2015).
methodology which combines the point observations with mass balance modelling for inter- and
extrapolation to unmeasured areas. The principle of our approach is the constraining of a dis-
tributed model with all available field data in every individual year (Huss et al., 2009). Modelling
is thus used for spatial extrapolation of point mass balance; the seasonal/annual signal is given by
the in-situ measurements.
The applied approach has several important advantages compared to traditional methods: (1)
Extrapolation in space is based on an algorithm including the main processes governing mass
balance distribution. This allows us to cope with a relatively small spatial density of surveyed
points. (2) Data gaps, i.e. individual years with missing measurements, present for some of
the series (Figure 4.34, Tables 4.28 and 4.30), can be filled in a consistent way. (3) Temporal
differences between the hydrological year and the effective dates of the surveys can be corrected
enabling the joint evaluation of mass balance over the fixed-date and the measurement period.
Glacier-wide mass balances calculated from the in-situ measurements are validated against inde-
pendent ice volume changes provided by repeated geodetic surveys (Glaciological reports, 2016;
Bauder et al., 2007) (Figure 4.35). A bias between glaciological and geodetic surveys can be ex-
75
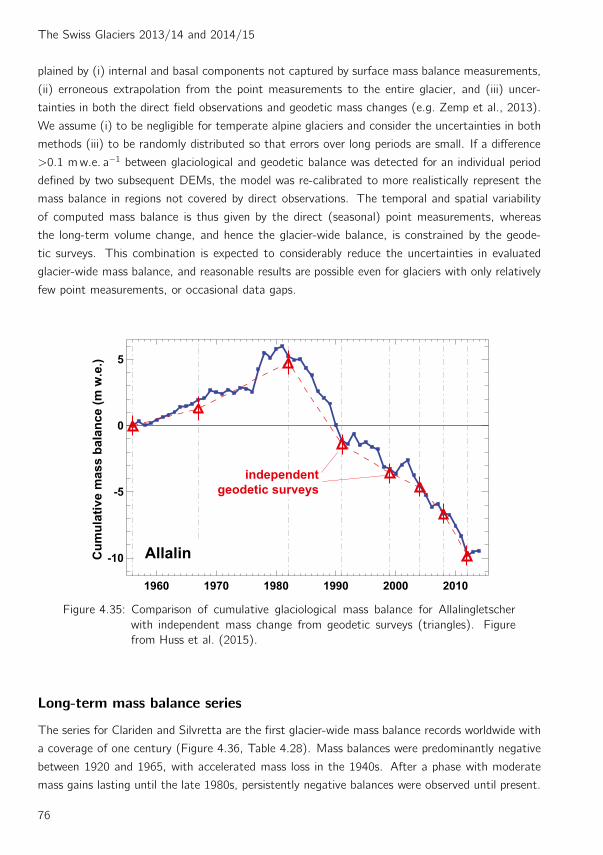
The Swiss Glaciers 2013/14 and 2014/15
plained by (i) internal and basal components not captured by surface mass balance measurements,
(ii) erroneous extrapolation from the point measurements to the entire glacier, and (iii) uncer-
tainties in both the direct field observations and geodetic mass changes (e.g. Zemp et al., 2013).
We assume (i) to be negligible for temperate alpine glaciers and consider the uncertainties in both
methods (iii) to be randomly distributed so that errors over long periods are small. If a difference
>0.1 mw.e. a−1 between glaciological and geodetic balance was detected for an individual period
defined by two subsequent DEMs, the model was re-calibrated to more realistically represent the
mass balance in regions not covered by direct observations. The temporal and spatial variability
of computed mass balance is thus given by the direct (seasonal) point measurements, whereas
the long-term volume change, and hence the glacier-wide balance, is constrained by the geode-
tic surveys. This combination is expected to considerably reduce the uncertainties in evaluated
glacier-wide mass balance, and reasonable results are possible even for glaciers with only relatively
few point measurements, or occasional data gaps.
1960 1970 1980 1990 2000 2010
-10
-5
0
5
Cu
mu
lati
ve m
ass b
ala
nce (
m w
.e.)
Allalin
independent
geodetic surveys
Figure 4.35: Comparison of cumulative glaciological mass balance for Allalingletscher
with independent mass change from geodetic surveys (triangles). Figure
from Huss et al. (2015).
Long-term mass balance series
The series for Clariden and Silvretta are the first glacier-wide mass balance records worldwide with
a coverage of one century (Figure 4.36, Table 4.28). Mass balances were predominantly negative
between 1920 and 1965, with accelerated mass loss in the 1940s. After a phase with moderate
mass gains lasting until the late 1980s, persistently negative balances were observed until present.
76
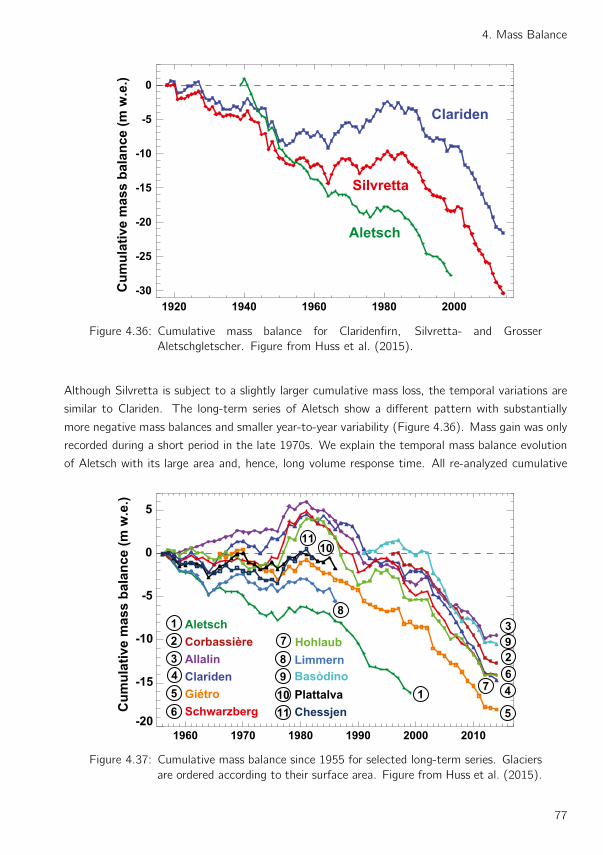
4. Mass Balance
1920 1940 1960 1980 2000
-30
-25
-20
-15
-10
-5
0
Cu
mu
lati
ve
ma
ss
ba
lan
ce
(m
w.e
.)
Aletsch
Clariden
Silvretta
Figure 4.36: Cumulative mass balance for Claridenfirn, Silvretta- and Grosser
Aletschgletscher. Figure from Huss et al. (2015).
Although Silvretta is subject to a slightly larger cumulative mass loss, the temporal variations are
similar to Clariden. The long-term series of Aletsch show a different pattern with substantially
more negative mass balances and smaller year-to-year variability (Figure 4.36). Mass gain was only
recorded during a short period in the late 1970s. We explain the temporal mass balance evolution
of Aletsch with its large area and, hence, long volume response time. All re-analyzed cumulative
1960 1970 1980 1990 2000 2010
-20
-15
-10
-5
0
5
Cu
mu
lati
ve
ma
ss
ba
lan
ce
(m
w.e
.)
Aletsch
Corbassière
Allalin
Clariden
Giétro
Schwarzberg
Hohlaub
Limmern
Plattalva
Chessjen
1
2
3
4
5
6
7
8
10
11
1
2
3
4
5
67
8
1011
Basòdino9
9
Figure 4.37: Cumulative mass balance since 1955 for selected long-term series. Glaciers
are ordered according to their surface area. Figure from Huss et al. (2015).
77
The Swiss Glaciers 2013/14 and 2014/15
long-term mass balance series show mass loss since the mid-1980s, the rates being similar for
most glaciers (Figure 4.37). In the 1960s and 1970s, however, the differences are remarkable.
Whereas some glaciers (Allalin, Clariden, Schwarzberg) gained mass, other glaciers (e.g. Aletsch)
were subject to a reduction in ice volume (Table 4.28).
The uncertainty in the seasonal mass balance records depends on numerous factors. In general,
we can qualitatively divide between two levels of uncertainty: (1) Long-term average balances, e.g.
decadal means, are expected to be relatively accurate as they are partly constrained by observed ice
volume changes (about σ(1)=±0.05-0.15 mw.e. a−1). The accuracy of inferred long-term means of
annual mass balance is expected to be higher with increasing length of the time interval considered.
(2) Annual and seasonal mass balances are likely to be somewhat more uncertain. Year-to-year
variability, as well as the seasonal components, are directly given by the field measurements. The
results are thus prone to various uncertainties related to the acquisition and evaluation of in-situ
mass balance data and are expected to range between σ(2)=±0.15-0.40 mw.e. a−1.
After the re-analysis of the mass balance series of Silvretta and Gries for the period 1959/1961
to 2007 (Section 4.9 of Volume 125/126, Huss et al., 2009) this chapter provides a complete
re-analyzed series for all other long-term glacier mass balance monitoring programs in Switzerland
(Basodino, Limmern, Plattalva, updated until 2015 for Silvretta and Gries; Tables 4.28 and 4.30).
Glacier-wide annual mass balance for glaciers, for which only point measurements have been re-
ported in the Glaciological Reports so far (Allain, Schwarzberg, Clariden, Gietro etc.) are evaluated
regularly in the future and will be periodically published in ”The Swiss Glaciers”.
78

4. Mass Balance
Table 4.28: Seasonal mass-balance time-series for selected glaciers: Grosser Aletsch,
Clariden, Silvretta, Allalin and Schwarzberg for the period 1915-2015 and
fixed date periods 1 Oct - 30 Apr (Bw) and 1 Oct - 30 Sep (Ba). Regular font
refers to values where corresponding seasonal measurements were available
and italic font to modelled values to fill gaps.
Period Gr. Aletsch Clariden Silvretta Allalin Schwarzberg
Bw Ba Bw Ba Bw Ba Bw Ba Bw Ba(mm w.e.) (mm w.e.) (mm w.e.) (mm w.e.) (mm w.e.)
1914/15 1556 717
1915/16 1607 1202
1916/17 1505 -335
1917/18 1390 645
1918/19 1549 625
1919/20 1761 -68 1950 -67
1920/21 584 -1865 717 -2339
1921/22 1476 343 909 14
1922/23 1531 395 1385 -150
1923/24 1668 514 1230 395
1924/25 1414 247 998 224
1925/26 1249 244 1857 -458
1926/27 1811 605 1882 220
1927/28 1066 -1764 1130 -2059
1928/29 1519 -1066 1169 -1336
1929/30 1072 -18 883 -382
1930/31 2075 337 1347 478
1931/32 1240 -1135 1034 -1247
1932/33 1097 472 968 193
1933/34 753 -1155 768 -445
1934/35 1637 21 1744 233
1935/36 1836 53 1474 116
1936/37 1669 530 1784 55
1937/38 1198 -300 899 -325
1938/39 1475 -122 1258 -159
1939/40 434 897 1724 1085 1280 429
1940/41 482 -919 1277 534 1287 740
1941/42 641 -1323 1180 -702 876 -1077
1942/43 474 -1203 1366 -577 1164 -449
1943/44 419 -1316 1150 -229 1072 -279
1944/45 1202 -612 2030 407 2330 -158
1945/46 963 -321 1561 -204 1199 76
1946/47 413 -1838 1080 -2611 803 -2640
1947/48 742 437 1825 967 1889 1091
1948/49 316 -1039 1026 -1594 887 -1453
1949/50 504 -2043 1268 -1317 1104 -1347
1950/51 1056 -207 1933 54 1667 -260
1951/52 890 -881 1602 -565 1198 -978
79
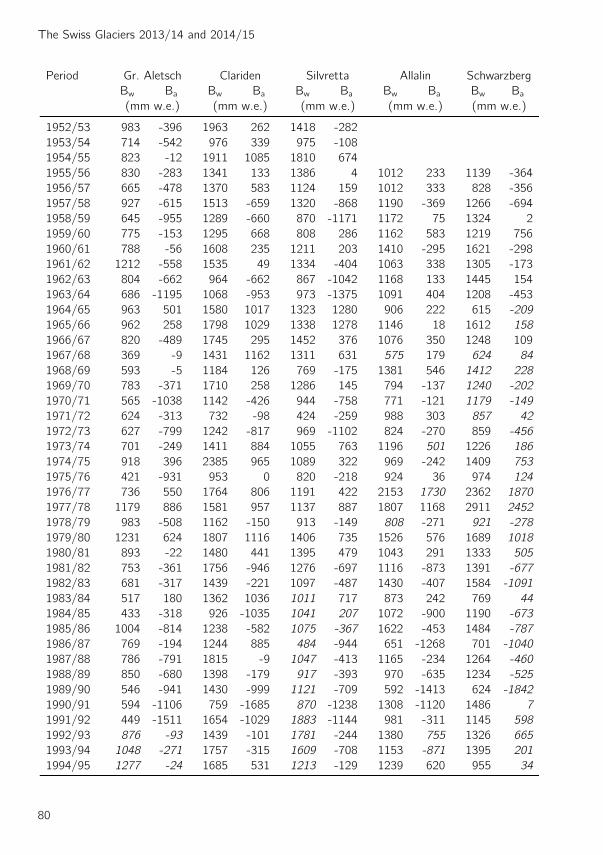
The Swiss Glaciers 2013/14 and 2014/15
Period Gr. Aletsch Clariden Silvretta Allalin Schwarzberg
Bw Ba Bw Ba Bw Ba Bw Ba Bw Ba(mm w.e.) (mm w.e.) (mm w.e.) (mm w.e.) (mm w.e.)
1952/53 983 -396 1963 262 1418 -282
1953/54 714 -542 976 339 975 -108
1954/55 823 -12 1911 1085 1810 674
1955/56 830 -283 1341 133 1386 4 1012 233 1139 -364
1956/57 665 -478 1370 583 1124 159 1012 333 828 -356
1957/58 927 -615 1513 -659 1320 -868 1190 -369 1266 -694
1958/59 645 -955 1289 -660 870 -1171 1172 75 1324 2
1959/60 775 -153 1295 668 808 286 1162 583 1219 756
1960/61 788 -56 1608 235 1211 203 1410 -295 1621 -298
1961/62 1212 -558 1535 49 1334 -404 1063 338 1305 -173
1962/63 804 -662 964 -662 867 -1042 1168 133 1445 154
1963/64 686 -1195 1068 -953 973 -1375 1091 404 1208 -453
1964/65 963 501 1580 1017 1323 1280 906 222 615 -209
1965/66 962 258 1798 1029 1338 1278 1146 18 1612 158
1966/67 820 -489 1745 295 1452 376 1076 350 1248 109
1967/68 369 -9 1431 1162 1311 631 575 179 624 84
1968/69 593 -5 1184 126 769 -175 1381 546 1412 228
1969/70 783 -371 1710 258 1286 145 794 -137 1240 -202
1970/71 565 -1038 1142 -426 944 -758 771 -121 1179 -149
1971/72 624 -313 732 -98 424 -259 988 303 857 42
1972/73 627 -799 1242 -817 969 -1102 824 -270 859 -456
1973/74 701 -249 1411 884 1055 763 1196 501 1226 186
1974/75 918 396 2385 965 1089 322 969 -242 1409 753
1975/76 421 -931 953 0 820 -218 924 36 974 124
1976/77 736 550 1764 806 1191 422 2153 1730 2362 1870
1977/78 1179 886 1581 957 1137 887 1807 1168 2911 2452
1978/79 983 -508 1162 -150 913 -149 808 -271 921 -278
1979/80 1231 624 1807 1116 1406 735 1526 576 1689 1018
1980/81 893 -22 1480 441 1395 479 1043 291 1333 505
1981/82 753 -361 1756 -946 1276 -697 1116 -873 1391 -677
1982/83 681 -317 1439 -221 1097 -487 1430 -407 1584 -1091
1983/84 517 180 1362 1036 1011 717 873 242 769 44
1984/85 433 -318 926 -1035 1041 207 1072 -900 1190 -673
1985/86 1004 -814 1238 -582 1075 -367 1622 -453 1484 -787
1986/87 769 -194 1244 885 484 -944 651 -1268 701 -1040
1987/88 786 -791 1815 -9 1047 -413 1165 -234 1264 -460
1988/89 850 -680 1398 -179 917 -393 970 -635 1234 -525
1989/90 546 -941 1430 -999 1121 -709 592 -1413 624 -1842
1990/91 594 -1106 759 -1685 870 -1238 1308 -1120 1486 7
1991/92 449 -1511 1654 -1029 1883 -1144 981 -311 1145 598
1992/93 876 -93 1439 -101 1781 -244 1380 755 1326 665
1993/94 1048 -271 1757 -315 1609 -708 1153 -871 1395 201
1994/95 1277 -24 1685 531 1213 -129 1239 620 955 34
80
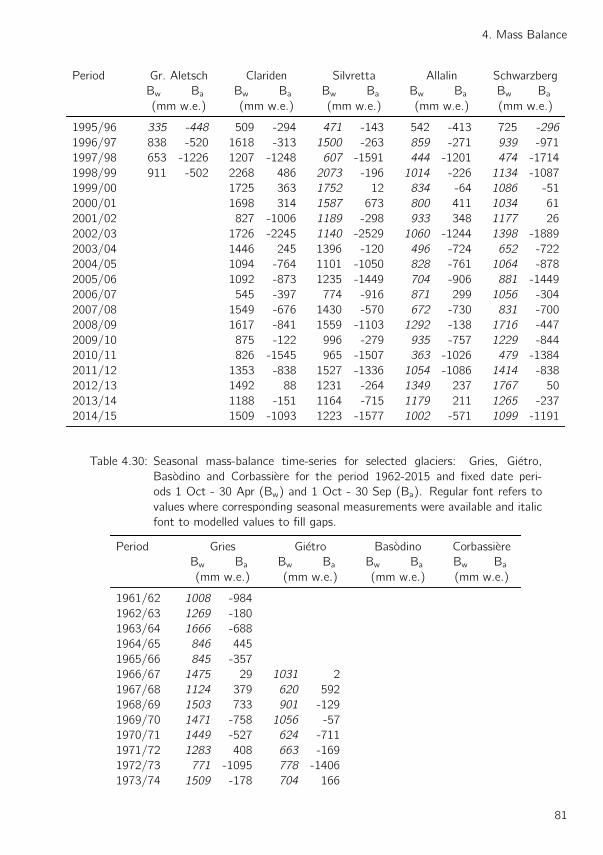
4. Mass Balance
Period Gr. Aletsch Clariden Silvretta Allalin Schwarzberg
Bw Ba Bw Ba Bw Ba Bw Ba Bw Ba(mm w.e.) (mm w.e.) (mm w.e.) (mm w.e.) (mm w.e.)
1995/96 335 -448 509 -294 471 -143 542 -413 725 -296
1996/97 838 -520 1618 -313 1500 -263 859 -271 939 -971
1997/98 653 -1226 1207 -1248 607 -1591 444 -1201 474 -1714
1998/99 911 -502 2268 486 2073 -196 1014 -226 1134 -1087
1999/00 1725 363 1752 12 834 -64 1086 -51
2000/01 1698 314 1587 673 800 411 1034 61
2001/02 827 -1006 1189 -298 933 348 1177 26
2002/03 1726 -2245 1140 -2529 1060 -1244 1398 -1889
2003/04 1446 245 1396 -120 496 -724 652 -722
2004/05 1094 -764 1101 -1050 828 -761 1064 -878
2005/06 1092 -873 1235 -1449 704 -906 881 -1449
2006/07 545 -397 774 -916 871 299 1056 -304
2007/08 1549 -676 1430 -570 672 -730 831 -700
2008/09 1617 -841 1559 -1103 1292 -138 1716 -447
2009/10 875 -122 996 -279 935 -757 1229 -844
2010/11 826 -1545 965 -1507 363 -1026 479 -1384
2011/12 1353 -838 1527 -1336 1054 -1086 1414 -838
2012/13 1492 88 1231 -264 1349 237 1767 50
2013/14 1188 -151 1164 -715 1179 211 1265 -237
2014/15 1509 -1093 1223 -1577 1002 -571 1099 -1191
Table 4.30: Seasonal mass-balance time-series for selected glaciers: Gries, Gietro,
Basodino and Corbassiere for the period 1962-2015 and fixed date peri-
ods 1 Oct - 30 Apr (Bw) and 1 Oct - 30 Sep (Ba). Regular font refers to
values where corresponding seasonal measurements were available and italic
font to modelled values to fill gaps.
Period Gries Gietro Basodino Corbassiere
Bw Ba Bw Ba Bw Ba Bw Ba(mm w.e.) (mm w.e.) (mm w.e.) (mm w.e.)
1961/62 1008 -984
1962/63 1269 -180
1963/64 1666 -688
1964/65 846 445
1965/66 845 -357
1966/67 1475 29 1031 2
1967/68 1124 379 620 592
1968/69 1503 733 901 -129
1969/70 1471 -758 1056 -57
1970/71 1449 -527 624 -711
1971/72 1283 408 663 -169
1972/73 771 -1095 778 -1406
1973/74 1509 -178 704 166
81
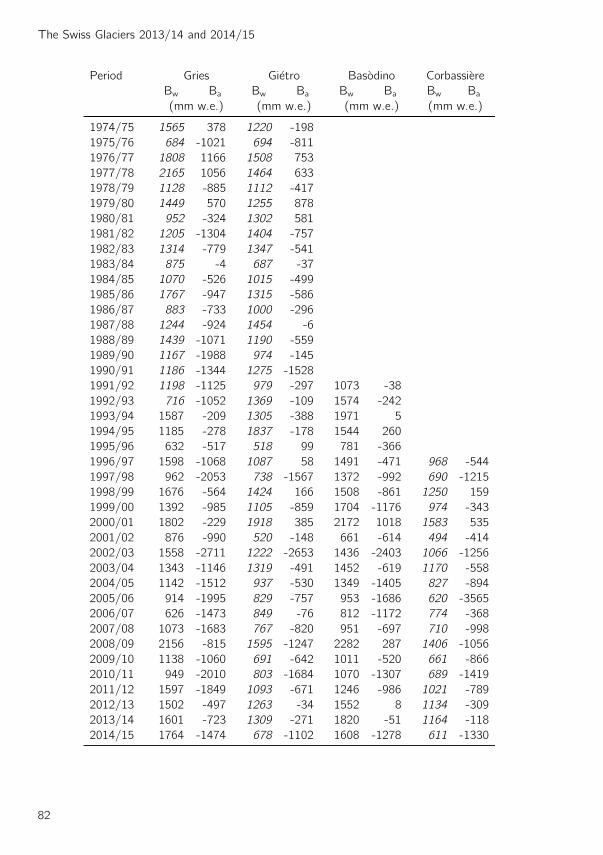
The Swiss Glaciers 2013/14 and 2014/15
Period Gries Gietro Basodino Corbassiere
Bw Ba Bw Ba Bw Ba Bw Ba(mm w.e.) (mm w.e.) (mm w.e.) (mm w.e.)
1974/75 1565 378 1220 -198
1975/76 684 -1021 694 -811
1976/77 1808 1166 1508 753
1977/78 2165 1056 1464 633
1978/79 1128 -885 1112 -417
1979/80 1449 570 1255 878
1980/81 952 -324 1302 581
1981/82 1205 -1304 1404 -757
1982/83 1314 -779 1347 -541
1983/84 875 -4 687 -37
1984/85 1070 -526 1015 -499
1985/86 1767 -947 1315 -586
1986/87 883 -733 1000 -296
1987/88 1244 -924 1454 -6
1988/89 1439 -1071 1190 -559
1989/90 1167 -1988 974 -145
1990/91 1186 -1344 1275 -1528
1991/92 1198 -1125 979 -297 1073 -38
1992/93 716 -1052 1369 -109 1574 -242
1993/94 1587 -209 1305 -388 1971 5
1994/95 1185 -278 1837 -178 1544 260
1995/96 632 -517 518 99 781 -366
1996/97 1598 -1068 1087 58 1491 -471 968 -544
1997/98 962 -2053 738 -1567 1372 -992 690 -1215
1998/99 1676 -564 1424 166 1508 -861 1250 159
1999/00 1392 -985 1105 -859 1704 -1176 974 -343
2000/01 1802 -229 1918 385 2172 1018 1583 535
2001/02 876 -990 520 -148 661 -614 494 -414
2002/03 1558 -2711 1222 -2653 1436 -2403 1066 -1256
2003/04 1343 -1146 1319 -491 1452 -619 1170 -558
2004/05 1142 -1512 937 -530 1349 -1405 827 -894
2005/06 914 -1995 829 -757 953 -1686 620 -3565
2006/07 626 -1473 849 -76 812 -1172 774 -368
2007/08 1073 -1683 767 -820 951 -697 710 -998
2008/09 2156 -815 1595 -1247 2282 287 1406 -1056
2009/10 1138 -1060 691 -642 1011 -520 661 -866
2010/11 949 -2010 803 -1684 1070 -1307 689 -1419
2011/12 1597 -1849 1093 -671 1246 -986 1021 -789
2012/13 1502 -497 1263 -34 1552 8 1134 -309
2013/14 1601 -723 1309 -271 1820 -51 1164 -118
2014/15 1764 -1474 678 -1102 1608 -1278 611 -1330
82
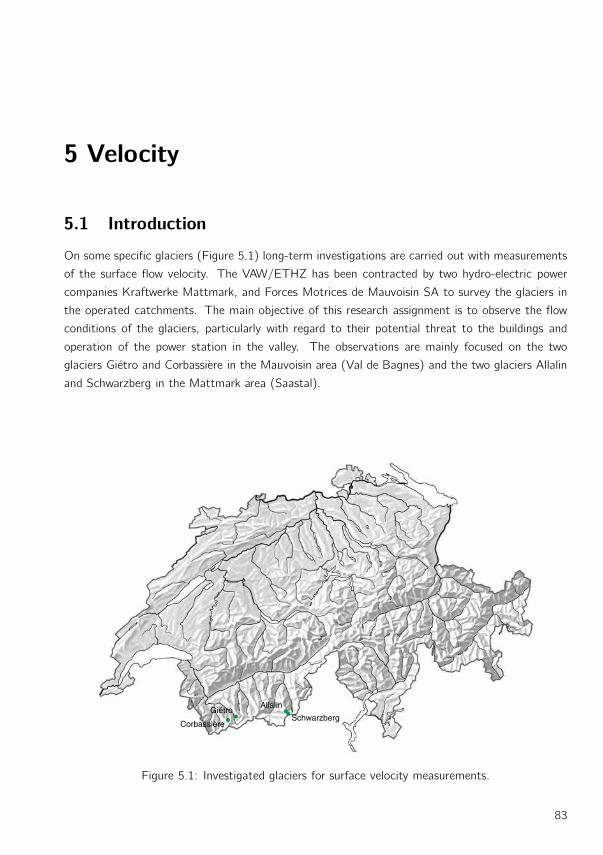
5 Velocity
5.1 Introduction
On some specific glaciers (Figure 5.1) long-term investigations are carried out with measurements
of the surface flow velocity. The VAW/ETHZ has been contracted by two hydro-electric power
companies Kraftwerke Mattmark, and Forces Motrices de Mauvoisin SA to survey the glaciers in
the operated catchments. The main objective of this research assignment is to observe the flow
conditions of the glaciers, particularly with regard to their potential threat to the buildings and
operation of the power station in the valley. The observations are mainly focused on the two
glaciers Gietro and Corbassiere in the Mauvoisin area (Val de Bagnes) and the two glaciers Allalin
and Schwarzberg in the Mattmark area (Saastal).
Allalin
SchwarzbergCorbassière
Giétro
Figure 5.1: Investigated glaciers for surface velocity measurements.
83

The Swiss Glaciers 2013/14 and 2014/15
5.2 Glacier du Gietro
Introduction
One of the longest measurement series in existence, for Glacier du Gietro (Figure 5.2) in the Val
de Bagnes (Valais), is being continued by VAW/ETHZ under contract of the Forces Motrices de
Mauvoisin SA. The aim of these annual observations is the early recognition of glacier break-off,
which can endanger the dammed lake located in the outreach of ice avalanches. The measurements,
which have been carried out for more than 40 years, include periods of glacier growth and recession
(VAW, 1997, 1998; Bauder et al., 2002; Raymond et al., 2003). In addition, annual mass balance
is determined at the stakes. Huss et al. (2015) re-analyzed and homogenized the seasonal stake
data and ice volume changes for the period 1966 to 2014. The results of the glacier-wide mean
specific winter and annual balance for comparable fixed date periods are presented in Section 4.17
of this report.
3400
3400
3400 3600
3200
3000
2800
1
2
4
5
6
8
10
5980
00
95000
5940
00
93000
0 1km
Figure 5.2: Surface topography and observational network of the Glacier du Gietro.
Figure 5.3 shows the surface flow velocity mesurements at 7 stakes along the central flow line of
the glacier, taken since 1966. There are three distinct periods: in the first (1966 to 1976), the
84

5. Velocity
velocities in the accumulation area (Stakes 1, 2 and 4) were approximately 5-20m per year, in the
central region of the glacier (Stake 5) about 35m per year and in the steep tongue area (Stakes
6, 8 and 10) they were in the range of 50-90m annually. The second period (1977 to 1982) is
marked by a distinct acceleration phase, in which the speeds (for example at Stake 6) increased
from 90m to 120m per year. From the mid-1980s onward, the velocities decreased sharply again,
and in the last years reached the lowest values measured since 1966.
Investigations in 2013/14 and in 2014/15
Five stakes provided measurements of velocity and local mass balance. The field survey in fall
2014 was carried out on 8th September. The position of the snowline was just below of the lower
edge of the firn plateau at an altitude of about 3200 m a.s.l. Accumulation of winter snow was
observed at the the Stakes 1 and 2. On 8th September 2015, the field measurements were taken
for the second period. At the end of August melt had occurred over almost the entire extent of
the firn plateau, and only a few thin patches remained of the snow accumulated during winter.
Table 5.1: Glacier du Gietro - Individual measurements of surface flow velocity, thickness
change and annual balance.
Stake Period Coordinates Thickness Velocity Mass
change balance
Start End (m / m / m a.s.l.) (m) (m a−1) (mm w.e.)
1 25.09.2013 08.09.2014 596143 / 92346 / 3300 0.26 2.88 313
1 08.09.2014 08.09.2015 596143 / 92346 / 3300 −1.45 2.80 −832
2 25.09.2013 08.09.2014 596605 / 92835 / 3250 0.09 8.77 243
2 08.09.2014 08.09.2015 596605 / 92835 / 3250 −1.16 8.36 −608
4 25.09.2013 08.09.2014 596211 / 93400 / 3185 0.21 12.48 −179
4 08.09.2014 08.09.2015 596211 / 93400 / 3185 −1.17 11.92 −1275
5 25.09.2013 08.09.2014 595615 / 94303 / 3055 0.02 16.90 −846
5 08.09.2014 08.09.2015 595615 / 94303 / 3055 −0.14 17.19 −2997
6 25.09.2013 08.09.2014 594568 / 94497 / 2820 22.80 −2610
6 08.09.2014 08.09.2015 594568 / 94497 / 2820 −3.72 23.18 −5076
Velocity in 2013/14 and in 2014/15
Due to the glacier retreat with complete icemelt at the glacier snout, the two sites 8 and 10 had
to be abandoned in 2010 and are no longer under observation. The decrease in speed over the
past years did not continued further during the two periods covered by this report. At the two
lower sites (5 and 6) a slight increase during the second period may reflect the high melt rates
that favored sliding.
85
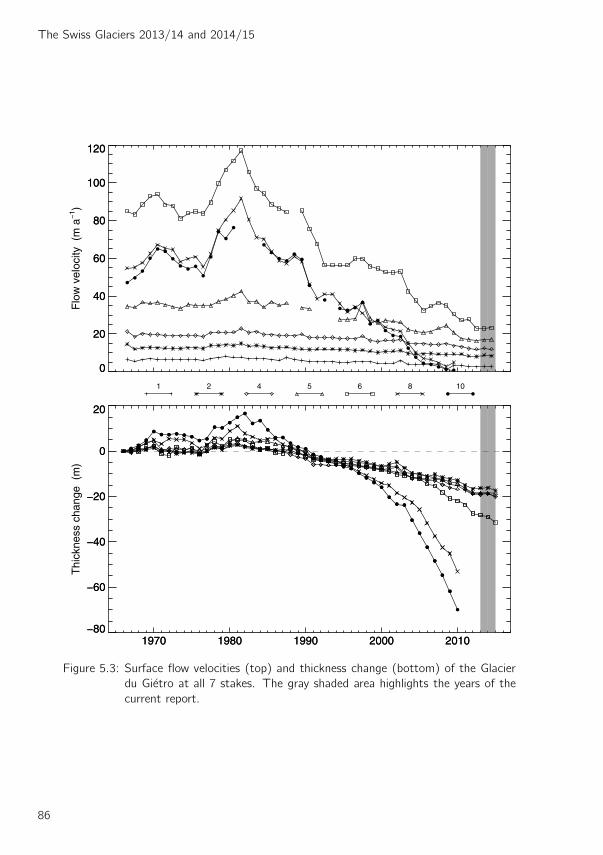
The Swiss Glaciers 2013/14 and 2014/15
0
20
40
60
80
100
120
Flo
w v
eloc
ity (
m a
−1 )
0
20
40
60
80
100
120
1 2 4 5 6 8 10
1970 1980 1990 2000 2010−80
−60
−40
−20
0
20
Thi
ckne
ss c
hang
e (
m)
1970 1980 1990 2000 2010−80
−60
−40
−20
0
20
Figure 5.3: Surface flow velocities (top) and thickness change (bottom) of the Glacier
du Gietro at all 7 stakes. The gray shaded area highlights the years of the
current report.
86

5. Velocity
5.3 Glacier de Corbassiere
Introduction
Since 1955, Glacier de Corbassiere (Figure 5.4) has been under observation by taking length change
measurements. In the past, this glacier was threatening the water intake of the Mauvoisin power
company at the front of the tongue. In the ablation area of the glacier, two profiles with stakes
are being observed annually to determine the velocities and local mass balance (Table 5.2). Figure
5.5 shows the surface flow velocities for the two profiles since 1967. Results of the glacier-wide
mean specific winter and annual balance for comparable fixed date periods for 1996 to 2015 are
presented in Section 4.17 of this report.
Figure 5.4: Surface topography and observational network of the Glacier du Corbassiere.
Investigations in 2013/14 and in 2014/15
The field surveys were carried out on 8th/9th September 2014 and on 8th/9th September 2015. As
in previous years, seven stakes were maintained on the glacier tongue. The continuous reduction
in ice thickness and glacier width in the lower profile increasingly impeded surveying activities and
efforts to restore the stakes to their initial position.
Velocity in 2013/14 and in 2014/15
During the two periods under review the general trend of decreasing speed did not continue. The
stakes in the upper profile (B2 - B6) do show a slight increase lasting for the two consecutive
87

The Swiss Glaciers 2013/14 and 2014/15
periods. However, the lowering of the surface height at all stakes is sustained. Extraordinarily high
rates of lowering have been observed at stakes A2 and A4 on the lower profile.
0
20
40
60
80
Flo
w v
eloc
ity (
m a
−1 )
0
20
40
60
80
B2 B4 B6 R A2 A4 A6
1970 1980 1990 2000 2010−100
−80
−60
−40
−20
0
20
Thi
ckne
ss c
hang
e (
m)
1970 1980 1990 2000 2010−100
−80
−60
−40
−20
0
20
Figure 5.5: Surface flow velocities (top) and thickness change (bottom) of the Glacier
de Corbassiere at two profiles with 3 stakes each and the additional stake in
between. The gray shaded area highlights the years of the current report.
88
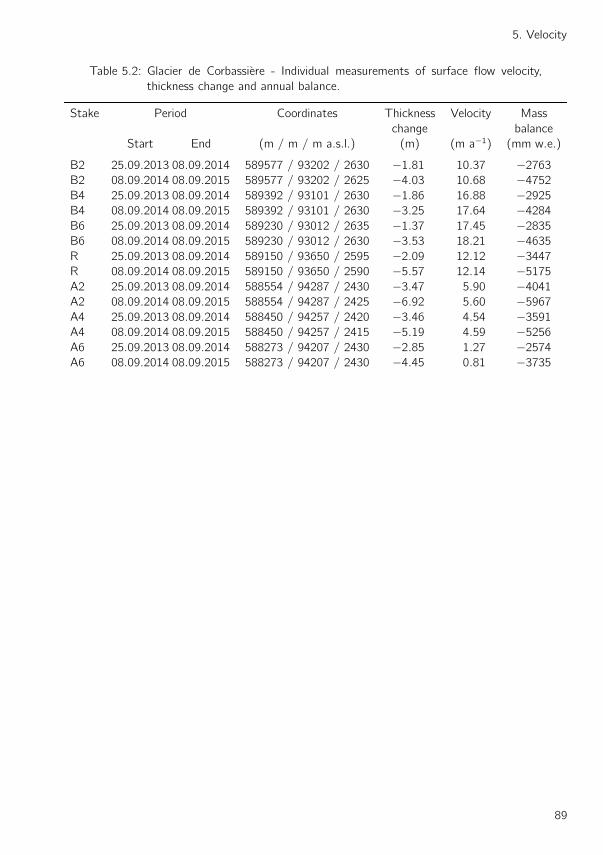
5. Velocity
Table 5.2: Glacier de Corbassiere - Individual measurements of surface flow velocity,
thickness change and annual balance.
Stake Period Coordinates Thickness Velocity Mass
change balance
Start End (m / m / m a.s.l.) (m) (m a−1) (mm w.e.)
B2 25.09.2013 08.09.2014 589577 / 93202 / 2630 −1.81 10.37 −2763
B2 08.09.2014 08.09.2015 589577 / 93202 / 2625 −4.03 10.68 −4752
B4 25.09.2013 08.09.2014 589392 / 93101 / 2630 −1.86 16.88 −2925
B4 08.09.2014 08.09.2015 589392 / 93101 / 2630 −3.25 17.64 −4284
B6 25.09.2013 08.09.2014 589230 / 93012 / 2635 −1.37 17.45 −2835
B6 08.09.2014 08.09.2015 589230 / 93012 / 2630 −3.53 18.21 −4635
R 25.09.2013 08.09.2014 589150 / 93650 / 2595 −2.09 12.12 −3447
R 08.09.2014 08.09.2015 589150 / 93650 / 2590 −5.57 12.14 −5175
A2 25.09.2013 08.09.2014 588554 / 94287 / 2430 −3.47 5.90 −4041
A2 08.09.2014 08.09.2015 588554 / 94287 / 2425 −6.92 5.60 −5967
A4 25.09.2013 08.09.2014 588450 / 94257 / 2420 −3.46 4.54 −3591
A4 08.09.2014 08.09.2015 588450 / 94257 / 2415 −5.19 4.59 −5256
A6 25.09.2013 08.09.2014 588273 / 94207 / 2430 −2.85 1.27 −2574
A6 08.09.2014 08.09.2015 588273 / 94207 / 2430 −4.45 0.81 −3735
89
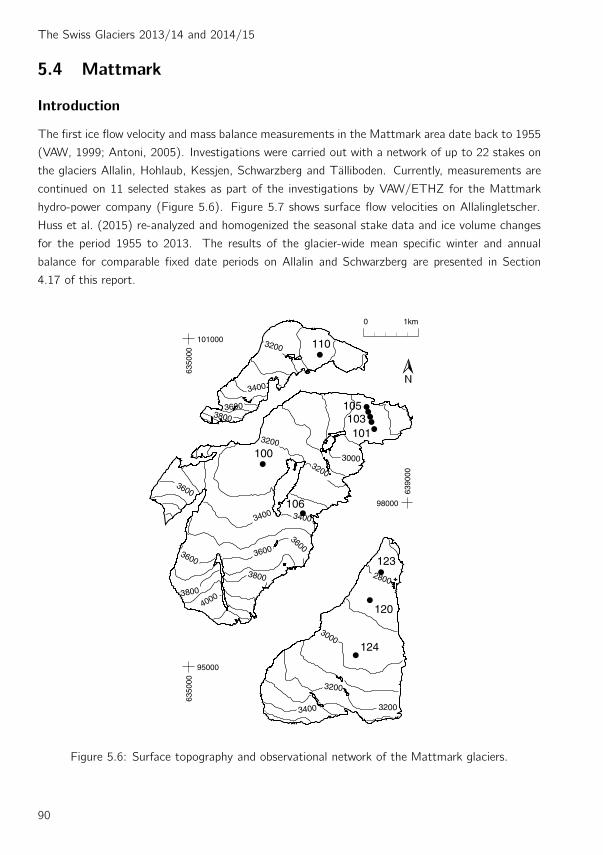
The Swiss Glaciers 2013/14 and 2014/15
5.4 Mattmark
Introduction
The first ice flow velocity and mass balance measurements in the Mattmark area date back to 1955
(VAW, 1999; Antoni, 2005). Investigations were carried out with a network of up to 22 stakes on
the glaciers Allalin, Hohlaub, Kessjen, Schwarzberg and Talliboden. Currently, measurements are
continued on 11 selected stakes as part of the investigations by VAW/ETHZ for the Mattmark
hydro-power company (Figure 5.6). Figure 5.7 shows surface flow velocities on Allalingletscher.
Huss et al. (2015) re-analyzed and homogenized the seasonal stake data and ice volume changes
for the period 1955 to 2013. The results of the glacier-wide mean specific winter and annual
balance for comparable fixed date periods on Allalin and Schwarzberg are presented in Section
4.17 of this report.
4000
3800
3800
360036003600
34003400
3600
38003600
3400
3200
3200
3200
3000
2800
3200
3200
3400
3000
100
101103
105
106
110
120
123
124
6350
00
101000
6390
00
98000
6350
00
95000
0 1km
Figure 5.6: Surface topography and observational network of the Mattmark glaciers.
90
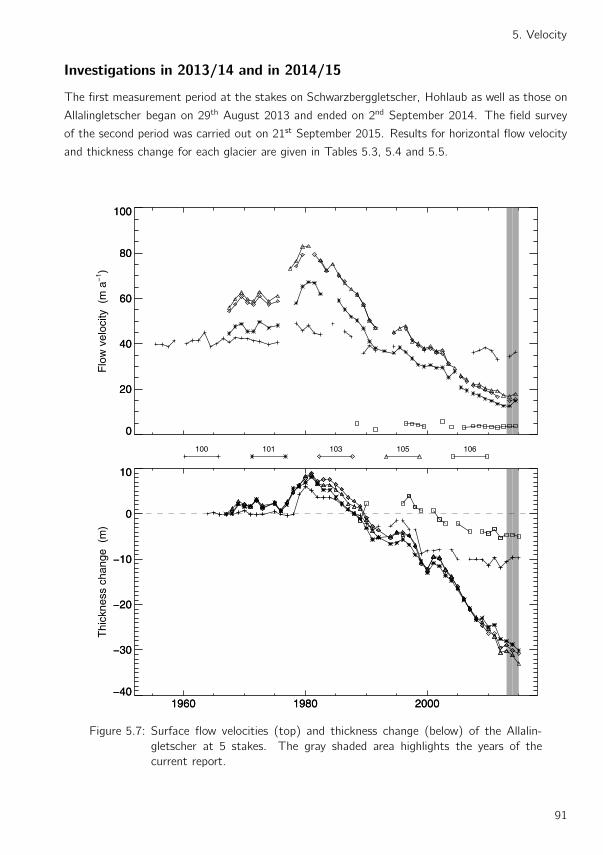
5. Velocity
Investigations in 2013/14 and in 2014/15
The first measurement period at the stakes on Schwarzberggletscher, Hohlaub as well as those on
Allalingletscher began on 29th August 2013 and ended on 2nd September 2014. The field survey
of the second period was carried out on 21st September 2015. Results for horizontal flow velocity
and thickness change for each glacier are given in Tables 5.3, 5.4 and 5.5.
0
20
40
60
80
100
Flo
w v
eloc
ity (
m a
−1 )
0
20
40
60
80
100
100 101 103 105 106
1960 1980 2000−40
−30
−20
−10
0
10
Thi
ckne
ss c
hang
e (
m)
1960 1980 2000−40
−30
−20
−10
0
10
Figure 5.7: Surface flow velocities (top) and thickness change (below) of the Allalin-
gletscher at 5 stakes. The gray shaded area highlights the years of the
current report.
91

The Swiss Glaciers 2013/14 and 2014/15
Table 5.3: Allalingletscher - Individual measurements of surface flow velocity, thickness
change and annual balance.
Stake Period Coordinates Thickness Velocity Mass
change balance
Start End (m / m / m a.s.l.) (m) (m a−1) (mm w.e.)
100 29.08.2013 02.09.2014 636510 / 98800 / 3220 0.96 34.43 −417
100 02.09.2014 21.09.2015 636510 / 98800 / 3220 3.89 36.43 −666
101 29.08.2013 02.09.2014 638400 / 99360 / 2825 −0.75 12.52 −2700
101 02.09.2014 21.09.2015 638400 / 99360 / 2825 −1.36 −4500
102 29.08.2013 02.09.2014 638350 / 99480 / 2830 −0.85 14.10 −1530
102 02.09.2014 21.09.2015 638350 / 99480 / 2830 −0.82 14.53 −2970
103 29.08.2013 02.09.2014 638325 / 99575 / 2830 −1.18 14.87 −1980
103 02.09.2014 21.09.2015 638325 / 99575 / 2830 −0.64 15.45 −4500
104 29.08.2013 02.09.2014 638290 / 99665 / 2840 −0.41 15.73 −1980
104 02.09.2014 21.09.2015 638290 / 99665 / 2840 −0.69 16.51 −4140
105 29.08.2013 02.09.2014 638260 / 99755 / 2860 −0.93 16.88 −2700
105 02.09.2014 21.09.2015 638260 / 99755 / 2860 −1.84 17.97 −4500
106 29.08.2013 02.09.2014 637095 / 97810 / 3370 −0.50 3.73 534
106 02.09.2014 21.09.2015 637095 / 97810 / 3370 −0.33 3.75 348
Table 5.4: Hohlaubgletscher - Individual measurements of surface flow velocity, thickness
change and annual balance.
Stake Period Coordinates Thickness Velocity Mass
change balance
Start End (m / m / m a.s.l.) (m) (m a−1) (mm w.e.)
110 29.08.201302.09.2014 637405 / 100710 / 3030 −0.54 10.13 −720
110 02.09.201421.09.2015 637405 / 100710 / 3030 −1.48 10.39 −2070
Table 5.5: Schwarzberggletscher - Individual measurements of surface flow velocity,
thickness change and annual balance.
Stake Period Coordinates Thickness Velocity Mass
change balance
Start End (m / m / m a.s.l.) (m) (m a−1) (mm w.e.)
120 29.08.2013 02.09.2014 638320 / 96220 / 2850 −0.89 6.68 −1827
120 02.09.2014 21.09.2015 638320 / 96220 / 2850 −2.38 6.61 −2970
123 29.08.2013 02.09.2014 638525 / 96730 / 2770 −2.47 5.50 −2079
123 02.09.2014 21.09.2015 638525 / 96730 / 2770 −3.09 5.30 −3726
124 29.08.2013 02.09.2014 638062 / 95212 / 2980 −0.46 7.48 −801
124 02.09.2014 21.09.2015 638062 / 95212 / 2980 −0.87 7.71 −2016
92

6 Englacial Temperature
6.1 Introduction
Colle Gnifetti
Figure 6.1: Investigated site for englacial temperatures.
Besides glacier mass balance, firn and ice temperatures of ice bodies can be considered as a key
parameter in detecting global warming trends. These temperatures have a sort of a memory
function as they register short- and mid-term evolution of the energy balance at the surface.
By looking at firn and ice temperature measurements it is possible to assess climate changes in
areas where no direct measurement of common climatic parameters are available. Cold firn and
ice in glaciers, ice caps and ice sheets occur when the firn and ice show permanently negative
temperatures over the minimum time span of a year. If this is not the case, glaciers are temperate,
thus their temperature is at the pressure melting point. Most of the existing cold ice bodies are
not cold throughout. These ice bodies are called polythermal (Blatter and Hutter, 1991; Cuffey
and Paterson, 2010).
93
The Swiss Glaciers 2013/14 and 2014/15
Measurements of englacial temperatures have been added to the Swiss glacier monitoring pro-
gramme (see Chapter 1.1 of Volume 125/126). The Colle Gnifetti site was selected for performing
regular measurements to update the existing ones made in the years 1983, 1991, 1999, 2000, 2007
and 2008. The results of measurements taken in the years 2008, 2013, 2014 and 2015 on Colle
Gnifetti are presented in this report. The previous results have been reported in Volume 129/130.
6.2 Colle Gnifetti (Monte Rosa)
Introduction
Colle Gnifetti is a small and very wind-exposed firn saddle at 4450 m a.s.l. in the region of Monte
Rosa, Valais Alps, Switzerland. The saddle is situated between Zumsteinspitze and Signalkuppe
with the famous Margerita hut, and belongs to the accumulation area of Grenzgletscher, a tributary
of Gornergletscher. Strong wind erosion causes extraordinarily low annual accumulation of snow.
Alean et al. (1983) and Luthi (2000) showed accumulation rates of 0.1 m a−1 at the north-west
slope of Signalkuppe to 1.2 m a−1 at the sunny south slope of Zumsteinspitze. Thus, Colle Gnifetti
represents a unique Alpine key site for collecting long-term ice core records.
Investigations 2007 - 2015
In summer 2005, the University of Heidelberg (D. Wagenbach / O. Eisen) drilled the borehole
CG05-1 to 62 m depth (measurements CG05-1/07 and CG05-1/08 also called KCI). Temperature
measurements in this borehole were taken in November 2007 to a depth of 62 m and in August
2008 to a depth of 58 m. In the year 2007, a permanent thermistor cable was installed in the
borehole CG07-1 by the University of Zurich (M. Hoelzle, M. Zemp), and the first measurement
was taken in November 2007 (CG07-1/07), and a second in August 2008 (CG07-1/08). As a part
of the major field campaign in 2008, the University of Zurich (G. Darms, M. Hoelzle) drilled seven
additional boreholes on Colle Gnifetti, Grenzgletscher and Seserjoch (CG08-1, CG08-2, CG08-3,
GG08-5, SJ08-6, SJ08-7 and SJ08-8) using the Heucke steam drill equipment. Since 2009, the
University of Fribourg has been responsible for the long-term englacial temperature observations
at Colle Gnifetti, which are in general performed every five years. In keeping with this plan, a
major field campaign was carried out in 2013 by the University of Heidelberg (P. Bohleber, D.
Wagenbach, C. Licciulli), who drilled a new core on the saddle (CG13-1/13 also called KCC) down
to 71 m. In addition to this borehole, five other boreholes were drilled using a Heucke steam drill
down to depths of around 20 m (CG13-2/13, CG13-3/13, CG13-4/13, GG13-5/13 and SJ/13-
6/13) by the University of Fribourg. After 2007 and 2008 borehole CG05-1 was measured again in
2013 and 2015. Borehole CG13-1 was remeasured in 2014 and 2015. In 2015, the Paul Scherrer
Institute drilled a new borehole with a depth of 76 m down to bedrock (CG15-1). The measured
temperatures at a depth of around 20 m (corresponding roughly to the zero annual amplitude ZAA)
were in a range of -2.5◦C to -13.14◦C. At the Seserjoch (SJ08-6/08, SJ08-7/08 and SJ08-8/08)
94
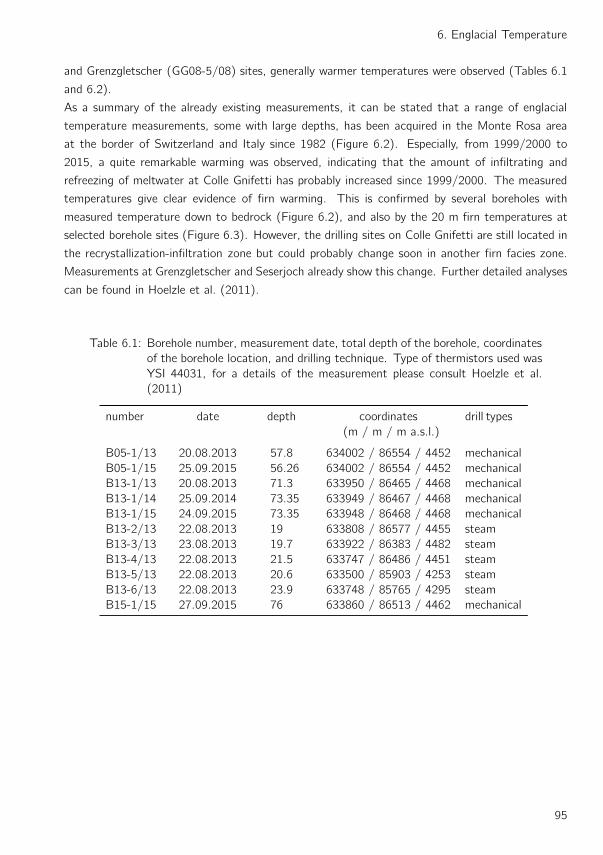
6. Englacial Temperature
and Grenzgletscher (GG08-5/08) sites, generally warmer temperatures were observed (Tables 6.1
and 6.2).
As a summary of the already existing measurements, it can be stated that a range of englacial
temperature measurements, some with large depths, has been acquired in the Monte Rosa area
at the border of Switzerland and Italy since 1982 (Figure 6.2). Especially, from 1999/2000 to
2015, a quite remarkable warming was observed, indicating that the amount of infiltrating and
refreezing of meltwater at Colle Gnifetti has probably increased since 1999/2000. The measured
temperatures give clear evidence of firn warming. This is confirmed by several boreholes with
measured temperature down to bedrock (Figure 6.2), and also by the 20 m firn temperatures at
selected borehole sites (Figure 6.3). However, the drilling sites on Colle Gnifetti are still located in
the recrystallization-infiltration zone but could probably change soon in another firn facies zone.
Measurements at Grenzgletscher and Seserjoch already show this change. Further detailed analyses
can be found in Hoelzle et al. (2011).
Table 6.1: Borehole number, measurement date, total depth of the borehole, coordinates
of the borehole location, and drilling technique. Type of thermistors used was
YSI 44031, for a details of the measurement please consult Hoelzle et al.
(2011)
number date depth coordinates drill types
(m / m / m a.s.l.)
B05-1/13 20.08.2013 57.8 634002 / 86554 / 4452 mechanical
B05-1/15 25.09.2015 56.26 634002 / 86554 / 4452 mechanical
B13-1/13 20.08.2013 71.3 633950 / 86465 / 4468 mechanical
B13-1/14 25.09.2014 73.35 633949 / 86467 / 4468 mechanical
B13-1/15 24.09.2015 73.35 633948 / 86468 / 4468 mechanical
B13-2/13 22.08.2013 19 633808 / 86577 / 4455 steam
B13-3/13 23.08.2013 19.7 633922 / 86383 / 4482 steam
B13-4/13 22.08.2013 21.5 633747 / 86486 / 4451 steam
B13-5/13 22.08.2013 20.6 633500 / 85903 / 4253 steam
B13-6/13 22.08.2013 23.9 633748 / 85765 / 4295 steam
B15-1/15 27.09.2015 76 633860 / 86513 / 4462 mechanical
95

The Swiss Glaciers 2013/14 and 2014/15
N
CG05-1
CG77-1/77
CG82-1
CG03-1
CG15-1
CG95-1
CG95-2
CG13-1
4460 44204400
4340
4460
4440
4480
4500
4520
CG76-1/77
-120
-100
-80
-60
-40
-20
CG76-1/77
CG77-1/77
CG82-1/82
CG95-1/97
CG95-2/97
CG03-1/03
CG15-1/15
CG05-1/07
CG05-1/15
CG13-1/15
CG13-1/14
Figure 6.2: Englacial temperatures measured in all deep boreholes since 1977 on Colle
Gnifetti.
-15
-14
-13
-12
-11
-10
-9
-8
1980 1985 1990 1995 2000 2005 2010 2015
CG95-1 site measured in 1996 and 2013CG95-2 site measured in 1996 and 2013CG82-1 site measured in 1983,1991, 1999, 2000, 2008 and 2013SJ98-A site measured in 1999 and 2013
Eng
laci
al T
empe
ratu
res
at 2
0m d
epth
(°C
)
Figure 6.3: Englacial temperatures measured from 1982 to 2013.
96
Eng
laci
al te
mpe
ratu
res
at 2
0m d
epth
(°C
)
Englacial temperature (°C)
Dep
th (
m)

6. Englacial Temperature
Table 6.2: Colle Gnifetti - Englacial temperature measurements in the years 2013, 2014
and 2015 in boreholes.
Borehole: B05-1
20.08.2013 25.09.2015
depth temperature temperature
(m) (◦C) (◦C)
0.1 −7.224
0.6 −6.84
1.1 −6.669
1.6 −6.58
2.1 −6.735
2.6 −7.074
3.6 −8.07
5.6 −10.3
7.6 −11.77
8.1 −13.411
8.6 −12.12
9.6 −12.43
18.1 −12.87
19.26 −12.69
22.6 −12.844
24.6 −12.796
25.6 −12.796
26.6 −12.793
28.1 −12.793
28.6 −12.736
29.26 −12.53
30.6 −12.731
35.6 −12.63
38.1 −12.626
39.26 −12.48
40.6 −12.56
43.1 −12.551
44.26 −12.35
45.6 −12.448
48.1 −12.41
49.26 −12.34
53.1 −12.349
54.26 −12.2
55.3 −12.302
56.26 −12.19
57.8 −12.245
Borehole: B13-1
20.08.2013 25.09.2014 24.09.2015
depth temperature temperature
(m) (◦C) (◦C)
11.3 −13.64
13.35 −13.57 −13.28
21.3 −13.26
23.35 −13.29 −13.16
31.3 −12.99
33.35 −13.07 −13
41.3 −12.82
43.35 −12.91 −12.82
51.3 −12.68
53.35 −12.78 −12.66
56.3 −12.71
58.35 −12.67 −12.6
61.3 −12.49
63.35 −12.6 −12.49
66.3 −12.51
68.35 −12.51 −12.45
68.8 −12.43
70.85 −12.45 −12.4
71.3 −12.41
73.35 −12.42 −12.39
97
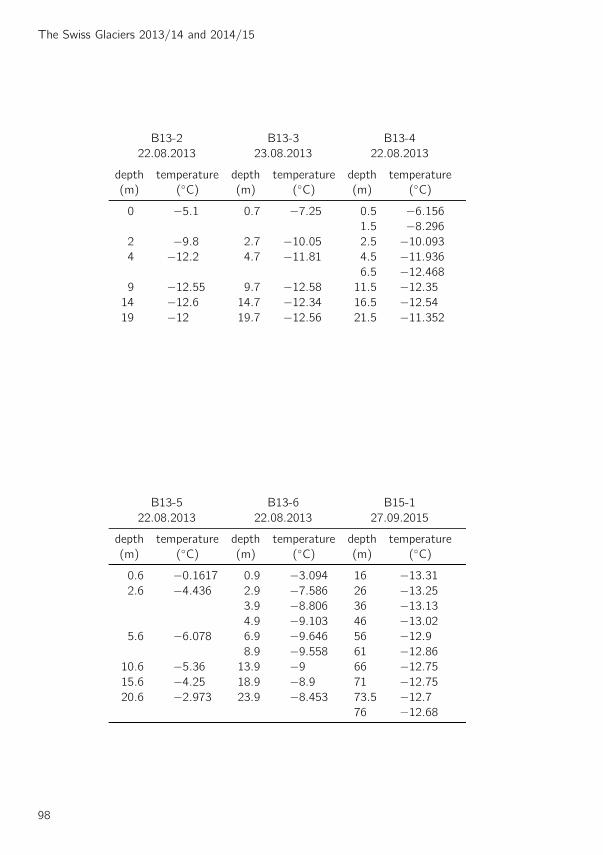
The Swiss Glaciers 2013/14 and 2014/15
B13-2 B13-3 B13-4
22.08.2013 23.08.2013 22.08.2013
depth temperature depth temperature depth temperature
(m) (◦C) (m) (◦C) (m) (◦C)
0 −5.1 0.7 −7.25 0.5 −6.156
1.5 −8.296
2 −9.8 2.7 −10.05 2.5 −10.093
4 −12.2 4.7 −11.81 4.5 −11.936
6.5 −12.468
9 −12.55 9.7 −12.58 11.5 −12.35
14 −12.6 14.7 −12.34 16.5 −12.54
19 −12 19.7 −12.56 21.5 −11.352
B13-5 B13-6 B15-1
22.08.2013 22.08.2013 27.09.2015
depth temperature depth temperature depth temperature
(m) (◦C) (m) (◦C) (m) (◦C)
0.6 −0.1617 0.9 −3.094 16 −13.31
2.6 −4.436 2.9 −7.586 26 −13.25
3.9 −8.806 36 −13.13
4.9 −9.103 46 −13.02
5.6 −6.078 6.9 −9.646 56 −12.9
8.9 −9.558 61 −12.86
10.6 −5.36 13.9 −9 66 −12.75
15.6 −4.25 18.9 −8.9 71 −12.75
20.6 −2.973 23.9 −8.453 73.5 −12.7
76 −12.68
98

7 Hazardous Glaciers in Switzerland
7.1 Introduction
In 2003 the VAW published an inventory of hazardous glaciers (Raymond et al., 2003). An update
of this inventory is presented including the hazardous events which have occurred in the meantime,
as well as the glaciers which are now considered as potentially hazardous.
7.2 Canton of Valais
Minstigergletscher
21 August 2008: After the sudden release of a subglacial lake located immediately below the
glacier surface at the left margin, a debris flow was formed which filled a safety reservoir
Minstiger
Trift (Weissmies)
Fee
Bis
Birch
Hochfirn/SilberlouwenaEiger−West Unterer GrindelwaldOberer Grindelwald
Plaine Morte
RottalBalmhorn
Gutz
BlüemlisalpAlp Ota Cambrena
Figure 7.1: Glaciers with hazardous events (red) an potentially hazardous (yellow).
99

The Swiss Glaciers 2013/14 and 2014/15
upstream of the village of Munster. Unfortunately, the front part of the reservoir was unable
to withstand the tremendous pressure from the water/debris and the floodwaters inundated
parts of the village resulting in major damage (http://glaciology.ethz.ch/glacier-hazards/).
Triftgletscher (Weissmies)
A large sector of the glacierized northwest face of Weissmies mountain in the Saas valley recently
became unstable. This new development likely stems from a climate-induced glacier thinning of
the supporting Triftgletscher and the steady progression from freezing to melting conditions at
the ice/bed interface. Consequently, in the summer of 2014 a section of the glacierized face with
800’000 m3 of ice reverted to an ”active phase” with high surface flow velocities, thereby increas-
ing the likelihood of a major icefall. In such an event, an ice/snow avalanche could threaten the
population and infrastructure of the Saas valley. A monitoring campaign was initiated to detect
warning signals of dangerous break-off events in order to enable timely evacuation of endangered
areas. Interferometric and Doppler radar, seismic and acoustic sensors, optical imaging and GPS
receivers were installed to provide real-time continuous surface displacement and ice fracture de-
velopment data. A critical increase in surface velocities is a clear sign of an impending icefall. Thus
it is possible to predict rupture time based on surface velocity data. Up to now, only minor icefalls
have been observed (Preiswerk et al., 2016).
Feegletscher
15-20 September 2009: Several icefalls from the tongue of Feegletscher. In total, 300’000m3
of ice broke off in the course of several events. The ice avalanche resulting from three events
(on the 15th, 19th and 20th September 2009) extended as far down as a hiking trail, but
fortunately no damage or injuries occurred (DWL/VS, 2009).
Bisgletscher
23 and 31 March 2005: Part of the hanging glacier located immediately below the eastern ridge
broke off in two events with a total ice volume of 460’000m3. A real-time monitoring system
was installed for early warning purposes (Faillettaz et al., 2008; w/s/l, 2014). No damage
occurred (http://glaciology.ethz.ch/glacier-hazards/).
24 January 2007: An ice avalanche from Bisgletscher reached the village of Randa at 10:50 pm,
also releasing a great deal of powder snow (w/s/l, 2013).
28 February 2007: An avalanche originating at the eastern face of Weisshorn came down on
”Sennjini” near Randa at 10:40 am. At 9:50 pm another avalanche reached the valley
bottom. No damage occurred (w/s/l, 2013).
5 January 2012: An icefall from the steep part of Bisgletscher (approx. 3,300 m a.s.l.) triggered
a large combined ice/snow avalanche which reached the road and railway leading to Zermatt.
100
7. Hazardous Glaciers in Switzerland
Damage was incurred to trees, buildings and electricity conduits. Two cars and a truck (with
persons inside) were displaced by the avalanche (w/s/l, 2013).
13 December 2012: A glacier break-off from the steep part of Bisgletscher (3300 m a.s.l.) caused
an ice avalanche reaching down to an elevation of between 1450 and 1480 m a.s.l., immedi-
ately above the valley bottom. Powder snow extended down to parts of the village of Randa.
No damage occurred (w/s/l, 2013).
21 February 2013: Part of the hanging glacier below the Weisshorn peak broke off (250’000m3
ice) and the avalanche moved down as far as the valley bottom. The village of Randa was
covered by powder snow. No damage occurred (w/s/l, 2013).
Birchgletscher
22 March 2008, 7 am: Following heavy snowfall, a combined ice/snow avalanche reached the
road between Ried and Blatten and covered it along a 30m stretch, with more than 1m of
ice/snow. Luckily no damage occurred (A. Henzen, personal communication).
Monch-Sud
24 May 2009, 1 pm: An ice lamella (50’000-70’000 m3 of ice) broke off from the hanging glacier
in the south face of Monch on Grosser Aletschgletscher. A part of the avalanche reached
the well-attended touristic facilities close to the tunnel entrance in the Sphynx mountain. By
chance all tourists could timely leave the endangered area (VAW, 2009).
7.3 Canton of Berne
Hochfirn/Silberlouwena
30 January 2005: Large avalanche, probably triggered by an icefall. Damages caused to forest
and the telephone lines to Steinberg (Lawinenkataster des Kantons Bern).
17 February 2011: Major ice avalanche with 500’000m3 of ice. Significant damage to the forest
and to alpine cowsheds (http://glaciology.ethz.ch/glacier-hazards/).
26 June 2016: Ice avalanche reached Gletscherweid (1’100 m a.s.l.). No damage occurred
(N. Hahlen, personal communication).
Eiger (hanging glacier at the west face)
20 August 1990: Glacier break-off event and major ice avalanche (Lawinenkataster des Kantons
Bern).
101

The Swiss Glaciers 2013/14 and 2014/15
28 January 2012: Ice rupture triggered a ice/snow avalanche. A mixture of ice and powder snow
invaded the cabin of a ski groomer through an open window at the Black Rock ski run. The
windows (including the frames) of the uppermost building at Eigergletscher were pushed in
by the pressure. The tables on the terrace were flattened against the wall, some of them
flew over the rail. Never in the past 30 years has an ice avalanche come this far down
(Lawinenkataster des Kantons Bern).
Ever since a crevasse began to form in the summer of 2015 behind the glacier front, an icefall with
a maximum ice volume of 80’000m3 has been expected to occur. In order to secure the railway
route to Jungfraujoch at the Eigergletscher station, a radar interferometry early warning system
was installed in March 2016 by GEOPRAEVENT AG. Minor events only were detected shortly
after the installation.
Unterer Grindelwaldgletscher
The tongue of Unterer Grindelwaldgletscher is covered with an uneven layer of debris. The layer is
thicker towards the terminus due to the ongoing collapse of an unstable rock face located there,
with the result that the surface lowering rates are higher upglacier than at the terminus. This led
to the development of a topographical depression where a lake started to form in 2005. This basin
increased in size in the following years and poses a growing threat to the downstream communities,
as the lake, which it can contain, could potentially drain rapidly and cause floods.
30 May 2008: Subglacial drainage of a supraglacial lake occurred with a water volume of 750’000m3
and a peak discharge of 100m3/s in the Lutschine river. Pastureland as well as the golf
course were flooded. The river channel was filled completely with debris, and damage total-
ing 400’000 Swiss francs (CHF) was caused to several protective structures (Hahlen, 2013b).
In the years that followed, damages were expected to occur in the Lutschental as well as further
downstream due to drainage of the glacier lake (Werder et al., 2010). An early warning system was
installed in the glacier lake, which continuously recorded the lake water level by means of a water
pressure sensor. As soon as a critical decrease in the lake level was recorded, a warning message
was automatically sent to the person in charge of regional natural hazard prevention. This system
functioned perfectly during the lake drainage flood which occurred on 30th May 2008.
To avert future destructive floods, the lake level should be kept as low as possible to keep potential
overall lake water volume within a safe limit. To achieve this goal, in 2009 the Bernese authorities
constructed a 2.1 km long drainage tunnel on the right side of the gorge from Marmorbruch to the
lake. The tunnel exits onto the glacier surface behind the debris-covered ice dam at the lowest
possible level, so that the water from the lake can drain through the tunnel. It is planned to adjust
the tunnel exit level to the lowering glacier surface as required. After 2009, the glacier surface in
the vicinity of the ice dam experienced a substantial thinning because huge amounts of debris were
removed during tunnel construction in order to keep the tunnel entrance safe and the lake level low.
102

7. Hazardous Glaciers in Switzerland
As a consequence, the glacier surface was largely debris-free in the vicinity of the ice dam, giving
rise to high melt rates and subsequent surface lowering. Presently the glacier surface is 10-20m
below the tunnel entrance. The location of the glacier lake has moved some 500m upstream,
close to the confluence of Ischmeer and Unders Ischmeer. The lake is no longer supraglacial, it is
proglacial. This means that rapid drainage through the ice is no longer possible with the present
configuration.
Oberer Grindelwaldgletscher
14-15 July 2003: The Schwarze Lutschine river was temporarily dammed as a result of the col-
lapse of the glacier terminus, triggering a number of floods. A bridge and several protective
structures in the river were damaged (N. Hahlen, personal communication).
26 August 2009: Sudden release of an ice-dammed water volume of 30’000m3 followed by a flood
wave in the Schwarze Lutschine river. Two bridges were damaged (incurring costs of 70’000
CHF), and the damage caused by channel fill and destroyed protective structures came to
300’000 CHF (Ereigniskataster des Kantons Bern, Abteilung Naturgefahren).
29 June 2011: Sudden release of an ice-dammed water volume of 10’000m3, and entrainment of
a significant volume of sediment (Hahlen, 2011b).
23 August – 13 September 2011: Sudden drainage of several ice-dammed water bodies accom-
panied by major quantities of sediments (peak discharge up to 200m3/s and 100’000m3 of
sediment). Damage estimated at up to 5 million CHF (Hahlen, 2011a).
Glacier de la Plaine Morte
During the past decade, three glacier-dammed lakes formed around the Glacier de la Plaine Morte.
These lakes, especially Lac de Faverges, represent a considerable hazard potential in the Simme
Valley north of the glacier. With the expected further retreat of Glacier de la Plaine Morte, the
potential water volume of Lac de Faverges will increase considerably in the coming decades (up
to several million m3 of water, Huss et al., 2013). The lake level has been monitored in real time
since 2012 by GEOPRAEVENT AG for early warning purposes.
11 July 2011: Sudden drainage of Lac de Faverges (approx. 1 million m3 of water) and Strubelsee
(approx. 0.2 million m3 water). No damage occurred (Hahlen, 2013a).
16 July 2012: Sudden drainage of Lac de Faverges, approx. same water volume as in 2011. No
damage occurred (Hahlen, 2012).
2 August 2013: Sudden drainage of Lac de Faverges (approx. 1.3 million m3 of water). The
retention basin for debris filled up completely in the valley (Ereigniskataster des Kantons
Bern, Abteilung Naturgefahren).
103

The Swiss Glaciers 2013/14 and 2014/15
7 August 2014: Sudden drainage of Lac de Faverges (approx. 1.5 million m3 of water), again the
retention basin filled up completely (Ereigniskataster des Kantons Bern, Abteilung Naturge-
fahren).
1 August 2015: Sudden drainage of Lac de Faverges (approx. 1.8 million m3 water), no damage
occurred (Ereigniskataster des Kantons Bern, Abteilung Naturgefahren).
Rottalgletscher
31 July 2014: Outburst of an englacial water reservoir holding 1.2-1.8 million m3 of water. 10’000m3
of sediment were deposited in the Weisse Lutschine river and then artificially removed in order
to prevent inundations (GEOTEST AG, 2015).
Balmhorngletscher
9 July 2015: Ice avalanche almost reached the hiking trail to Balmhornhutte; no damage occurred
(Ereigniskataster des Kantons Bern, Abteilung Naturgefahren).
Gutzgletscher
12 September 2015: Icefall from Gutzgletscher caused an ice avalanche over Watterlouiwang
(Ereigniskataster des Kantons Bern, Abteilung Naturgefahren).
Bluemlisalpgletscher
6, 18 and 26 August 2004: Icefall of 130’000m3 of ice; no damage (Ereigniskataster des Kan-
tons Bern, Abteilung Naturgefahren).
7.4 Canton of Graubunden (Grisons)
Vadret da l’Alp Ota
11 July 2006: After the sudden release of a subglacial water pocket, a debris flow was formed
in the proglacial area covered with unconsolidated sediments. This debris flowed across a
hiking trail and killed one person (http://glaciology.ethz.ch/glacier-hazards/).
Vadret da Cambrena
Due to the retreat of the glacier, its terminus has ended in a steep slope since 2012. The glacier
tongue covering this steep slope is potentially unstable. Should there occur a major break-off
event, the ice avalanche could extend down to the Bernina reservoir and cause a dangerous flood
wave (VAW, 2013). As an early warning measure, a time-lapse camera was installed next to glacier
in July 2015 in order to detect a potentially dangerous icefall in advance.
104
References
Alean, J., Haeberli, W., and Schadler, B. (1983). Snow accumulation, firn temperature and solar
radiation in the area of the Colle Gnifetti core drilling site (Monte Rosa, Swiss Alps): distribution
patterns and interrelationships. Zeitschrift fur Gletscherkunde und Glazialgeologie, 19(2):131–
147.
Antoni, C. (2005). Langjahrige Messreihen in den Schweizer Alpen. Praktikumsararbeit ausgefuhrt
an der VAW, ETH Zurich, unter Anleitung von A. Bauder (unveroffentlicht).
Bauder, A., Funk, M., and Bosch, H. (2002). Glaziologische Untersuchungen am Glacier de
Gietro im Zusammenhang mit der Sicherheit der Stauanlage Mauvoisin. In Moderne Methoden
und Konzepte im Wasserbau, volume 175, (Band 2), pages 419–431. Mitteilung der Versuch-
sanstalt fur Wasserbau, Hydrologie und Glaziologie, ETH Zurich. Internationales Symposium
7.-9. Oktober 2002 in Zurich.
Bauder, A., Funk, M., and Huss, M. (2007). Ice volume changes of selected glaciers in the Swiss
Alps since the end of the 19th century. Annals of Glaciology, 46:145–149.
Begert, M., Schlegel, T., and Kirchhofer, W. (2005). Homogeneous temperature and precipitation
series of switzerland from 1864 to 2000. International Journal of Climatology, 25(1):65–80.
Blatter, H. and Hutter, K. (1991). Polythermal conditions in Arctic glaciers. Journal of Glaciology,
37(126):261–269.
Braithwaite, R. J. (2009). After six decades of monitoring glacier mass balance we still need data
but it should be richer data. Annals of Glaciology, 50(50):191–197.
Cuffey, K. M. and Paterson, W. S. B. (2010). The Physics of Glaciers. Elsevier B.V., New York,
forth edition. pp. 480.
DWL/VS (2009). Aktennotiz zum Abbruch Feegletscher. Sektion Naturgefahren, Dienststelle fur
Wald und Landschaft, Kanton Wallis (unveroffentlicht).
Faillettaz, J., Pralong, A., Funk, M., and Deichmann, N. (2008). Evidence of log-periodic oscil-
lations and increasing icequake activity during the breaking-off of large ice masses. Journal of
Glaciology, 54(187):725–737.
105
The Swiss Glaciers 2013/14 and 2014/15
Firnberichte (1914–1978). Der Firnzuwachs 1913/14–1976/77 in einigen schweizerischen Firnge-
bieten, number 1-64 in Vierteljahrsschrift der Naturforschenden Gesellschaft in Zurich. Jahres-
berichte herausgegeben von der Gletscher-Kommission der Physikalischen Gesellschaft Zurich,
spater Schweizerische Meteorologische Zentralanstalt und ab 1973 durch A. Lemans.
Fischer, M., Huss, M., Barboux, C., and Hoelzle, M. (2014). The new swiss glacier inventory
SGI2010: Relevance of using high-resolution source data in areas dominated by very small
glaciers. Arctic, Antarctic, and Alpine Research, 46(4):933–945.
Fischer, M., Huss, M., and Hoelzle, M. (2015). Surface elevation and mass changes of all Swiss
glaciers 1980–2010. The Cryosphere, 9(2):525–540.
Fischer, M., Huss, M., Kummert, M., and Hoelzle, M. (2016). Application and validation of long-
range terrestrial laser scanning to monitor the mass balance of very small glaciers in the Swiss
Alps. The Cryosphere, 10(3):1279–1295.
Gabbi, J., Huss, M., Bauder, A., Cao, F., and Schwikowski, M. (2015). The impact of Saharan dust
and black carbon on albedo and long-term mass balance of an Alpine glacier. The Cryosphere,
9(4):1385–1400.
GEOTEST AG (2015). Ereignisdokumentation Wasserausbruch 31. Juli 2014. Aktennotiz 5.8.2015
(I. Kull and D. Tobler).
Glaciological reports (1881–2016). The Swiss Glaciers, 1880–2012/13. Yearbooks 1-
134, Cryospheric Commission of the Swiss Academy of Sciences (SCNAT). published
since 1964 by Laboratory of Hydraulics, Hydrology and Glaciology (VAW) of ETH Zurich,
http://glaciology.ethz.ch/swiss-glaciers/.
Hahlen, N. (2011a). Oberer Grindelwaldgletscher – Wasserwellen und Geschiebetrieb 25. August
bis 13. September 2011. Ereignisbericht und erste Grobanalyse vom 16. Dezember 2011, 31 S.
& Anhang.
Hahlen, N. (2011b). Oberingenieurkreis I Kt. Bern 2011a: Oberer Grindelwaldgletscher – Wasser-
ausbruch vom 29. Juni 2011. unveroffentlichter Bericht vom 30. Juni 2011, 10 S.
Hahlen, N. (2012). Oberingenieurkreis I Kt. Bern 2012: Ausbruch Gletschersee de Faverges 16.
Juli 2012. unveroffentlichter Bericht vom 25. Juli 2012, 10 S.
Hahlen, N. (2013a). Oberingenieurkreis I Kt. Bern 2013a: Ausbruch Gletschersee Plaine Morte
11. Juli 2011. unveroffentlichter Bericht vom 15. Oktober 2013, 3 S.
Hahlen, N. (2013b). Oberingenieurkreis I Kt. Bern 2013b: Unterer Grindelwaldgletscher 2006-
2013, Ereignisse, Erkenntnisse und Entscheide rund um den Unteren Grindelwaldgletscher im
Zeitraum 2006 bis 2013. unveroffentlichter Bericht, 126 S.
106
7. REFERENCES
Hock, R. and Jensen, H. (1999). Application of kriging interpolation for glacier mass balance com-
putations. Geografiska Annaler, 81A(4):611–619. in Methods of Mass Balance Measurements
and Modelling.
Hoelzle, M., Darms, G., Luthi, M. P., and Suter, S. (2011). Evidence of accelerated englacial
warming in the Monte Rosa area, Switzerland/Italy. The Cryosphere, 5(1):231–243.
Hoelzle, M., Haeberli, W., Dischl, M., and Peschke, W. (2003). Secular glacier mass balances
derived from cumulative glacier length changes. Global and Planetary Change, 36(4):295–306.
Huss, M. (2010). Mass balance of Pizolgletscher. Geographica Helvetica, 65(2):80–91.
Huss, M. and Bauder, A. (2009). 20th-century climate change inferred from four long-term point
observations of seasonal mass balance. Annals of Glaciology, 50(50):207–214.
Huss, M., Bauder, A., and Funk, M. (2009). Homogenization of long-term mass-balance time
series. Annals of Glaciology, 50(50):198–206.
Huss, M., Dhulst, L., and Bauder, A. (2015). New long-term mass balance series for the swiss
alps. Journal of Glaciology, 61(227):551–562.
Huss, M. and Fischer, M. (2016). Sensitivity of very small glaciers in the Swiss Alps to future
climate change. Frontiers in Earth Science, 4(34):1–17.
Huss, M., Voinesco, A., and Hoelzle, M. (2013). Implications of climate change on Glacier de la
Plaine Morte, switzerland. Geographica Helvetica, 68(4):227–237.
Kaser, G., Fountain, A., Jansson, P., Heucke, E., and Knaus, M. (2003). A manual for monitoring
the mass balance of mountain glaciers with particular attention to low latitude characteristics.
Technical documents in hydrology 59, UNESCO, International Hydrological Programme. 137 p.
Kasser, P., Aellen, M., and Siegenthaler, H. (1986). Clariden. In Die Gletscher der Schweizer
Alpen, 1977/78 und 1978/79, volume 99/100 of Glaziologisches Jahrbuch der Gletscherkom-
mission SNG, pages 142–148. Versuchsanstalt fur Wasserbau, Hydrologie und Glaziologie der
ETH Zurich.
Luthi, M. (2000). Rheology of cold firn and dynamics of a polythermal ice stream: Studies on Colle
Gnifetti and Jakobshavns Isbræ. Mitteilung 165, Versuchsanstalt fur Wasserbau, Hydrologie und
Glaziologie der ETH Zurich. pp. 212.
Muller, H. and Kappenberger, G. (1991). Claridenfirn-Messungen 1914-1984. Technical Report 40,
Zurcher Geographische Schriften, Geographisches Institut der ETH Zurich. pp. 79.
Naegeli, K., Damm, A., Huss, M., Joerg, P., Wulf, H., Schaepman, M., and Hoelzle, M. (in press).
Cross-comparison of albedo products for glacier surfaces in 2015. Remote Sensing.
107
The Swiss Glaciers 2013/14 and 2014/15
Naegeli, K., Damm, A., Huss, M., Schaepman, M., and Hoelzle, M. (2015). Imaging spectroscopy
to assess the composition of ice surface materials and their impact on glacier mass balance.
Remote Sensing of Environment, 168:388–402.
Ohmura, A., Bauder, A., Muller, H., and Kappenberger, G. (2007). Long-term change of mass
balance and the role of radiation. Annals of Glaciology, 46:367–374.
Østrem, G. and Brugman, M. (1991). Glacier mass-balance measurements – a manual for field
and office work. Technical report, National Hydrology Research Institute. NHRI Science Report
No. 4.
Preiswerk, L., Walter, F., Anandakrishnan, S., Barfucci, G., Beutel, J., Berkett, P., Canassy, P. D.,
Funk, M., Limpach, P., Marchetti, E., Meier, L., and Neyer, F. (2016). Monitoring unstable
parts in the ice-covered Weissmies northwest face. In INTERPRAEVENT, pages 434–443.
Internationales Symposium 2016, Lucerne, Switzerland.
Raymond, M., Wegmann, M., and Funk, M. (2003). Inventar gefahrlicher Gletscher in der Schweiz.
Mitteilungen 182, Versuchsanstalt fur Wasserbau, Hydrologie und Glaziologie der ETH Zurich,
Gloriastrasse 37-39, CH-8092 Zurich. pp. 368.
Sold, L., Huss, M., Machguth, H., Joerg, P. C., Vieli, G. L., Linsbauer, A., Salzmann, N., Zemp,
M., and Hoelzle, M. (2016). Mass balance re-analysis of Findelengletscher, Switzerland; benefits
of extensive snow accumulation measurements. Frontiers in Earth Science, 4(18):1–16.
VAW (1997). Gletscherveranderungen im Val de Bagnes 1966 – 1996. Untersuchungen im
Zusammenhang mit den Anlagen der Kraftwerke Mauvoisin AG. Zusammenfassend dargestellte
Hauptergebnisse der jahrlichen Messungen. Bericht Nr. 7903.55.04 (M. Aellen, unveroffentlicht).
Im Auftrag der Kraftwerke Mauvoisin AG.
VAW (1998). Mauvoisin – Gietrogletscher – Corbassieregletscher. Glaziologische Studien im
Zusammenhang mit den Stauanlagen Mauvoisin. Bericht Nr. 55.05.7903 (M. Funk, un-
veroffentlicht). Im Auftrag der Elektrizitatsgesellschaft Lauffenburg AG.
VAW (1999). Mattmark – Zusammenfassender Bericht uber die hydrologischen und glaziologis-
chen Messungen im Mattmarkgebiet. Bericht Nr. 7902.52.45 (H. Bosch und M. Funk, un-
veroffentlicht), Versuchsanstalt fur Wasserbau, Hydrologie und Glaziologie der ETH Zurich. Im
Auftrag der Kraftwerke Mattmark AG.
VAW (2009). Eisabbruch vom Hangegletscher Monch-Sud. Bericht uber die Feldbegehung vom 25.
Mai 2009, Bericht Nr. 7902.52.56 (unveroffentlicht), Versuchsanstalt fur Wasserbau, Hydrologie
und Glaziologie der ETH Zurich. Im Auftrag der Jungfraubahnen.
VAW (2013). Vadret dal Cambrena, Untersuchungen zur Gefahr von Eislawinen im Zusammen-
hang mit dem Projekt Lago Bianco. Bericht Nr. 70.03.2013 (unveroffentlicht) im Auftrag der
REPOWER AG. pp. 20.
108

7. REFERENCES
Werder, M. A., Bauder, A., Funk, M., and Keusen, H. R. (2010). Hazard assessment investigations
in connection with the formation of a lake on the tongue of the Unterer Grindelwaldgletscher,
Bernese Alps, Switzerland. Natural Hazards and Earth System Sciences, 10(2):227–237.
WGMS (2012). Fluctuations of Glaciers, 2005–2010, Vol. X. Technical report,
ICSU(WDS)/IUGG(IACS)/UNEP/UNESCO/WMO, World Glacier Monitoring Service, Zurich,
Switzerland.
WGMS (2013). Glacier Mass Balance Bulletin No. 12, (2010–2011). ICSU(FAGS)–IUGG(IACS)–
UNEP–UNESCO–WMO, World Glacier Monitoring Service, Zurich.
w/s/l (2013). Lawinenzug Bisbach, Uberarbeitung der Lawinengefahrenkarte. Technical report,
wasser/schnee/lawinen - Ingenieurburo Andre Burkard AG, Brig. pp. 20.
w/s/l (2014). Sicherheitskonzept Bisgletscher, Mess- und Alarmsystem Bisbachlawine. Technical
report, wasser/schnee/lawinen - Ingenieurburo Andre Burkard AG, Brig. pp. 16.
Zemp, M., Hoelzle, M., and Haeberli, W. (2009). Six decades of glacier mass-balance observations:
a review of the worldwide monitoring network. Annals of Glaciology, 50(50):101–111.
Zemp, M., Thibert, E., Huss, M., Stumm, D., Denby, C. R., Nuth, C., Nussbaumer, S. U.,
Moholdt, G., Mercer, A., Mayer, C., Joerg, P. C., Jansson, P., Hynek, B., Fischer, A., Escher-
Vetter, H., Elvehøy, H., and Andreassen, L. M. (2013). Reanalysing glacier mass balance
measurement series. The Cryosphere, 7(4):1227–1245.
109

Acknowledgements
The Cryospheric Commission through its GLAMOS programme acknowledges long-term funding by
the Federal Office for the Environment (BAFU), MeteoSwiss within GCOS Switzerland, the Swiss
Academy of Sciences (SCNAT), and the support by the Federal Office of Topography (swisstopo).
The Cryospheric Commission again received solid support in this 135th/136th measuring period
from its reliable team of observers. Sincere thanks for their cooperation are extended to: the
forestry services from the cantons of Berne, Glarus, Grisons, Obwalden, St. Gallen, Uri, Ticino,
Vaud and Wallis, the staff of the hydro-power stations Aegina, Mattmark and, Mauvoisin, all the
individual helpers, the Aerial Photography Flying and Coordination Service (CCAP) of the Swiss
Federal Office of Topography swisstopo and Flotron AG (Gumligen). The Laboratory of Hydraulics,
Hydrology and Glaciology (VAW) of the ETH Zurich, colleagues from the Geographical Institutes
of the University of Fribourg and Zurich provided valuable contributions to the publication of this
glaciological report. Maria Vorkauf helped with collecting data and information from archived
reports of the investigations at Claridenfirn. Barbara Bauder is acknowledged for typewriting the
many remarks on the individual glaciers. A special vote of thanks goes to Susan Braun-Clarke for
proof-reading the report.
110

A Remote Sensing
A.1 Aerial photographs
Aerial photographs were taken at periodic intervals in order to provide a baseline documentation for
various applications (mapping, glacier change, natural hazards, etc). In addition to the periodical
surveys conducted by the Swiss Federal Office of Topography (swisstopo), high resolution aerial
photographs have been acquired which are designed in particular for glaciological applications. In
addition to the aerial photographs listed in the following tables (A.1 and A.2), other aerial photos
for updating the National Maps are available from swisstopo. In the year 2014, pictures were taken
for the sheets 1:50’000 nos. 237, 247, 248, 249, 264 and 274 and in 2015 for nos. 254, 258,
259, 265, 266, 267, 268, 269, 275, 276, 277, 278, 279, 284 and 294, respectively. More detailed
information is available on swisstopo’s webviewer http://www.luftbildindex.ch.
Figure A.1: Aerial photographs from the years 2014 and 2015.
111
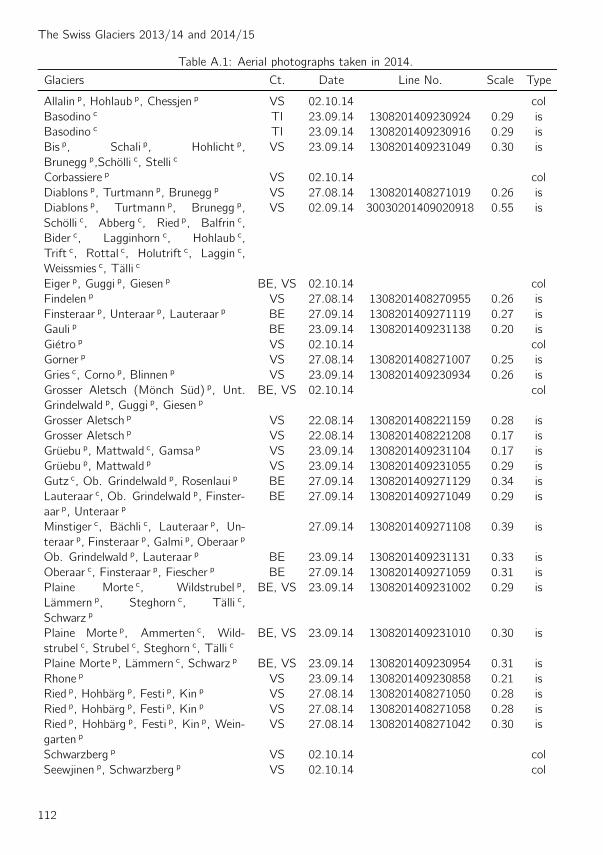
The Swiss Glaciers 2013/14 and 2014/15
Table A.1: Aerial photographs taken in 2014.
Glaciers Ct. Date Line No. Scale Type
Allalin p, Hohlaub p, Chessjen p VS 02.10.14 col
Basodino c TI 23.09.14 1308201409230924 0.29 is
Basodino c TI 23.09.14 1308201409230916 0.29 is
Bis p, Schali p, Hohlicht p,
Brunegg p,Scholli c, Stelli cVS 23.09.14 1308201409231049 0.30 is
Corbassiere p VS 02.10.14 col
Diablons p, Turtmann p, Brunegg p VS 27.08.14 1308201408271019 0.26 is
Diablons p, Turtmann p, Brunegg p,
Scholli c, Abberg c, Ried p, Balfrin c,
Bider c, Lagginhorn c, Hohlaub c,
Trift c, Rottal c, Holutrift c, Laggin c,
Weissmies c, Talli c
VS 02.09.14 30030201409020918 0.55 is
Eiger p, Guggi p, Giesen p BE, VS 02.10.14 col
Findelen p VS 27.08.14 1308201408270955 0.26 is
Finsteraar p, Unteraar p, Lauteraar p BE 27.09.14 1308201409271119 0.27 is
Gauli p BE 23.09.14 1308201409231138 0.20 is
Gietro p VS 02.10.14 col
Gorner p VS 27.08.14 1308201408271007 0.25 is
Gries c, Corno p, Blinnen p VS 23.09.14 1308201409230934 0.26 is
Grosser Aletsch (Monch Sud) p, Unt.
Grindelwald p, Guggi p, Giesen pBE, VS 02.10.14 col
Grosser Aletsch p VS 22.08.14 1308201408221159 0.28 is
Grosser Aletsch p VS 22.08.14 1308201408221208 0.17 is
Gruebu p, Mattwald c, Gamsa p VS 23.09.14 1308201409231104 0.17 is
Gruebu p, Mattwald p VS 23.09.14 1308201409231055 0.29 is
Gutz c, Ob. Grindelwald p, Rosenlaui p BE 27.09.14 1308201409271129 0.34 is
Lauteraar c, Ob. Grindelwald p, Finster-
aar p, Unteraar pBE 27.09.14 1308201409271049 0.29 is
Minstiger c, Bachli c, Lauteraar p, Un-
teraar p, Finsteraar p, Galmi p, Oberaar p27.09.14 1308201409271108 0.39 is
Ob. Grindelwald p, Lauteraar p BE 23.09.14 1308201409231131 0.33 is
Oberaar c, Finsteraar p, Fiescher p BE 27.09.14 1308201409271059 0.31 is
Plaine Morte c, Wildstrubel p,
Lammern p, Steghorn c, Talli c,
Schwarz p
BE, VS 23.09.14 1308201409231002 0.29 is
Plaine Morte p, Ammerten c, Wild-
strubel c, Strubel c, Steghorn c, Talli cBE, VS 23.09.14 1308201409231010 0.30 is
Plaine Morte p, Lammern c, Schwarz p BE, VS 23.09.14 1308201409230954 0.31 is
Rhone p VS 23.09.14 1308201409230858 0.21 is
Ried p, Hohbarg p, Festi p, Kin p VS 27.08.14 1308201408271050 0.28 is
Ried p, Hohbarg p, Festi p, Kin p VS 27.08.14 1308201408271058 0.28 is
Ried p, Hohbarg p, Festi p, Kin p, Wein-
garten pVS 27.08.14 1308201408271042 0.30 is
Schwarzberg p VS 02.10.14 col
Seewjinen p, Schwarzberg p VS 02.10.14 col
112

A. Remote Sensing
Silvretta c, Verstancla c, Tiatscha c,
Plan Rai cGR 27.09.14 1308201409270933 0.37 is
Trift p BE 23.09.14 1308201409230849 0.21 is
Turtmann p, Bis p, Weisshorn p, Schali c,
Hohlicht p, Trift pVS 23.09.14 1308201409231039 0.33 is
Turtmann p, Brunegg p, Bis p, Weis-
shorn p, Schali c, Moming p, Hohlicht p,
Trift p
VS 27.08.14 1308201408271031 0.34 is
Unt. Grindelwald p BE 23.09.14 1308201409231114 0.30 is
Unteraar c, Lauteraar p, Finsteraar p BE 27.09.14 1308201409271039 0.23 is
c Glacier shown completely Type of acquisition: col colour framesp Glacier shown partially is image stripe
Table A.2: Aerial photographs taken in 2015.
Glaciers Ct. Date Line No. Scale Type
Allalin p, Hohlaub p, Chessjen p VS 21.09.15 col
Bider p, Lagginhorn c, Hohlaub c, Trift c,
Rottal c, Holutrift c, Laggin c, Weiss-
mies c, Talli c
VS 21.09.15 30030201509211000 0.58 is
Birch c, Nest c, Stampbach c, Bietsch c,
Joli c, Ussere Baltschieder pVS 09.09.15 1308201509091020 0.22 is
Bis p, Schali c, Hohlicht p, Trift p,
Weisshorn p, Brunegg p, Turtmann p,
Scholli c, Stelli p
VS 26.08.15 1308201508261030 0.36 is
Bis p, Schali p, Hohlicht p, Brunegg p,
Abberg c, Scholli c, Stelli cVS 07.08.15 1308201508070930 0.34 is
Corbassiere p VS 21.09.15 col
Eiger p, Guggi p, Giesen p BE, VS 21.09.15 col
Findelen p VS 05.08.15 1308201508051110 0.27 is
Finsteraar p, Unteraar p, Lauteraar p BE 05.08.15 1308201508051010 0.27 is
Gauli p BE 05.08.15 1308201508050920 0.21 is
Gietro p VS 21.09.15 col
Gorner p VS 05.08.15 1308201508051100 0.26 is
Gries c, Corno p, Blinnen p VS 31.08.15 1308201508310860 0.28 is
Grosser Aletsch (Monch Sud) p, Unt.
Grindelwald p, Guggi p, Giesen pBE, VS 21.09.15 col
Grosser Aletsch p VS 26.08.15 1308201508261130 0.29 is
Gruben p, Mattwald c, Gamsa p VS 26.08.15 1308201508261120 0.18 is
Hohbarg p, Ried p VS 26.08.15 1308201508261050 0.31 is
Lauteraar c, Ob. Grindelwald p, Finster-
aar p, Unteraar pBE 05.08.15 1308201508050960 0.29 is
Ob. Grindelwald p, Lauteraar p BE 05.08.15 1308201508050950 0.34 is
Oberaar c, Finsteraar p, Fiescher p BE 26.08.15 1308201508261000 0.31 is
Plaine Morte c, Wildstrubel p,
Lammern p, Steghorn c, Talli c,
Schwarz p
BE, VS 05.08.15 1308201508051030 0.31 is
113

The Swiss Glaciers 2013/14 and 2014/15
Plaine Morte p, Ammerten c, Wild-
strubel c, Strubel c, Steghorn c, Talli cBE, VS 05.08.15 1308201508051020 0.31 is
Plaine Morte p, Lammern c, Schwarz p BE, VS 05.08.15 1308201508051040 0.32 is
Rhone p VS 05.08.15 1308201508050920 0.21 is
Ried p, Hohbarg p, Festi p, Kin p VS 05.08.15 1308201508051130 0.30 is
Ried p, Hohbarg p, Festi p, Kin p, Wein-
garten pVS 05.08.15 1308201508051120 0.31 is
Schwarzberg p VS 21.09.15 col
Seewjinen p, Schwarzberg p VS 21.09.15 col
Silvretta c, Verstancla c, Tiatscha c,
Plan Rai cGR 07.08.15 1308201508070760 0.37 is
Trift p BE 05.08.15 1308201508050930 0.21 is
Trift p, Rottal c, Weissmies p, Talli c VS 21.09.15 30030201509211000 0.56 is
Unt. Grindelwald p BE 05.08.15 1308201508050940 0.31 is
Unteraar c, Lauteraar p, Finsteraar p BE 05.08.15 1308201508050910 0.23 is
c Glacier shown completely Type of acquisition: col colourp Glacier shown partially is image stripe
114
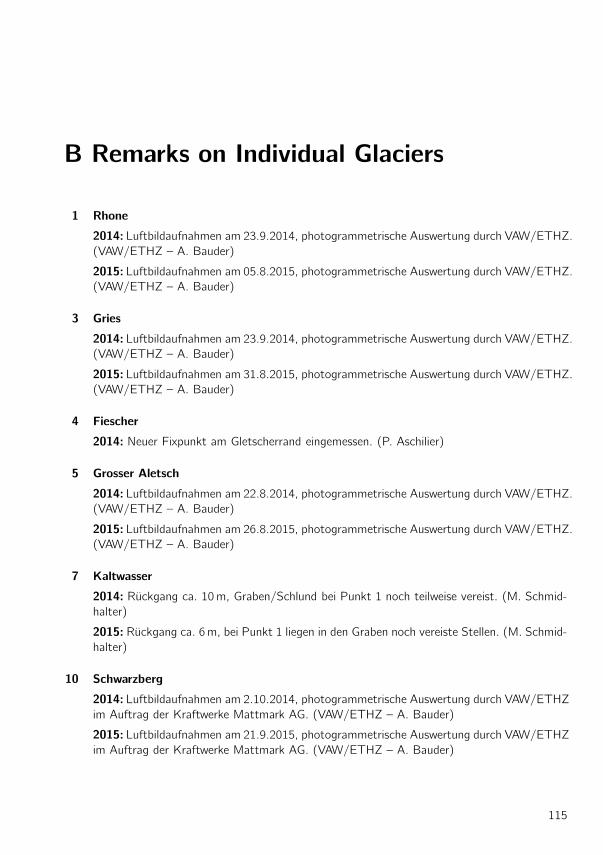
B Remarks on Individual Glaciers
1 Rhone
2014: Luftbildaufnahmen am 23.9.2014, photogrammetrische Auswertung durch VAW/ETHZ.
(VAW/ETHZ – A. Bauder)
2015: Luftbildaufnahmen am 05.8.2015, photogrammetrische Auswertung durch VAW/ETHZ.
(VAW/ETHZ – A. Bauder)
3 Gries
2014: Luftbildaufnahmen am 23.9.2014, photogrammetrische Auswertung durch VAW/ETHZ.
(VAW/ETHZ – A. Bauder)
2015: Luftbildaufnahmen am 31.8.2015, photogrammetrische Auswertung durch VAW/ETHZ.
(VAW/ETHZ – A. Bauder)
4 Fiescher
2014: Neuer Fixpunkt am Gletscherrand eingemessen. (P. Aschilier)
5 Grosser Aletsch
2014: Luftbildaufnahmen am 22.8.2014, photogrammetrische Auswertung durch VAW/ETHZ.
(VAW/ETHZ – A. Bauder)
2015: Luftbildaufnahmen am 26.8.2015, photogrammetrische Auswertung durch VAW/ETHZ.
(VAW/ETHZ – A. Bauder)
7 Kaltwasser
2014: Ruckgang ca. 10m, Graben/Schlund bei Punkt 1 noch teilweise vereist. (M. Schmid-
halter)
2015: Ruckgang ca. 6m, bei Punkt 1 liegen in den Graben noch vereiste Stellen. (M. Schmid-
halter)
10 Schwarzberg
2014: Luftbildaufnahmen am 2.10.2014, photogrammetrische Auswertung durch VAW/ETHZ
im Auftrag der Kraftwerke Mattmark AG. (VAW/ETHZ – A. Bauder)
2015: Luftbildaufnahmen am 21.9.2015, photogrammetrische Auswertung durch VAW/ETHZ
im Auftrag der Kraftwerke Mattmark AG. (VAW/ETHZ – A. Bauder)
115
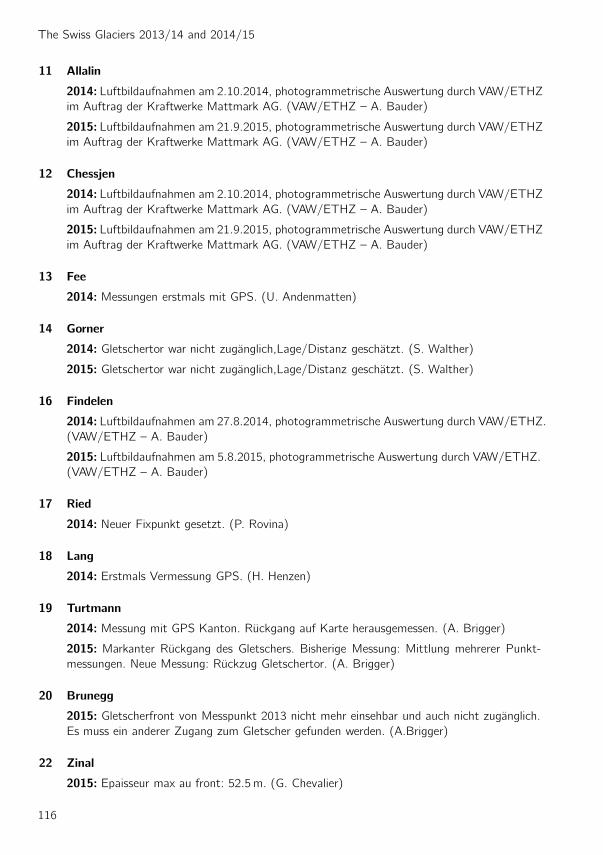
The Swiss Glaciers 2013/14 and 2014/15
11 Allalin
2014: Luftbildaufnahmen am 2.10.2014, photogrammetrische Auswertung durch VAW/ETHZ
im Auftrag der Kraftwerke Mattmark AG. (VAW/ETHZ – A. Bauder)
2015: Luftbildaufnahmen am 21.9.2015, photogrammetrische Auswertung durch VAW/ETHZ
im Auftrag der Kraftwerke Mattmark AG. (VAW/ETHZ – A. Bauder)
12 Chessjen
2014: Luftbildaufnahmen am 2.10.2014, photogrammetrische Auswertung durch VAW/ETHZ
im Auftrag der Kraftwerke Mattmark AG. (VAW/ETHZ – A. Bauder)
2015: Luftbildaufnahmen am 21.9.2015, photogrammetrische Auswertung durch VAW/ETHZ
im Auftrag der Kraftwerke Mattmark AG. (VAW/ETHZ – A. Bauder)
13 Fee
2014: Messungen erstmals mit GPS. (U. Andenmatten)
14 Gorner
2014: Gletschertor war nicht zuganglich,Lage/Distanz geschatzt. (S. Walther)
2015: Gletschertor war nicht zuganglich,Lage/Distanz geschatzt. (S. Walther)
16 Findelen
2014: Luftbildaufnahmen am 27.8.2014, photogrammetrische Auswertung durch VAW/ETHZ.
(VAW/ETHZ – A. Bauder)
2015: Luftbildaufnahmen am 5.8.2015, photogrammetrische Auswertung durch VAW/ETHZ.
(VAW/ETHZ – A. Bauder)
17 Ried
2014: Neuer Fixpunkt gesetzt. (P. Rovina)
18 Lang
2014: Erstmals Vermessung GPS. (H. Henzen)
19 Turtmann
2014: Messung mit GPS Kanton. Ruckgang auf Karte herausgemessen. (A. Brigger)
2015: Markanter Ruckgang des Gletschers. Bisherige Messung: Mittlung mehrerer Punkt-
messungen. Neue Messung: Ruckzug Gletschertor. (A. Brigger)
20 Brunegg
2015: Gletscherfront von Messpunkt 2013 nicht mehr einsehbar und auch nicht zuganglich.
Es muss ein anderer Zugang zum Gletscher gefunden werden. (A.Brigger)
22 Zinal
2015: Epaisseur max au front: 52.5m. (G. Chevalier)
116

B. Remarks on Individual Glaciers
23 Moming
2014: (P. Stoebener)
24 Moiry
2015: Epaisseur max au front: 7.4m. (G. Chevalier)
25 Ferpecle
2014: Altitude estimee (F. Fellay)
2015: A la sortie d’eau un pont de glace fait la jonction entre les langues laterales du glacier.
Derriere ce pont une ouverture de 10m x 30m s’est ouverte. (F. Fellay)
27 Arolla
2014: Glacier noir en bordure est et ouest. Recul calcule a la sortie d’eau. (F. Fellay)
2015: Recul calcule a la sortie d’eau. (F. Fellay)
28 Tsijdere Nouve
2014: Recul mesure sur 2 points, altitude estimee. (F. Fellay)
29 Cheillon
2015: Fort recul du point 1 consecutif a l’effondrement de cavernes glaciaires. (O. Bourdin)
30 En Darrey
2014: Le glacier se retire en rive droite. La separation s’accentue entre l’amont et l’aval. (O.
Bourdin)
31 Grand Desert
2014: Caverne s’est agrandie entre les points B et 3, hauteur env. 4m, largeur 15m, pro-
fondeur 6m. (F. Vouillamoz)
32 Mont-Fort
2014: Le neve en aval de l’eperon rocheux est encore present. (F. Vouillamoz)
2015: Entre les points 2-3 un petit lac en formation. (F. Vouillamoz)
33 Tsanfleuron
2014: Recul mesure sur une moyenne de 2 points. Altitude estimee. (F. Fellay)
2015: Recul calcule a la sortie d’eau. (F. Fellay)
34 Otemma
2014: Toujours des signes de tres grosses crues sur l’avant terrain. Le front du glacier est
encore plus plat et un torrent sort maintenant a l’extreme droite du glacier. La rive droite
117

The Swiss Glaciers 2013/14 and 2014/15
completement recouverte de rochers et gravats, se creuse tres fortement. En bref un tasse-
ment et recul prononce de tout le glacier. (J.-J. Chabloz)
2015: La couverture rocheuse des moraines gauche et droite en aval du glacier s’erode et
laisse voir la glace et des ruisselets devalent les pentes. Sur le glacier les torrents de surface
ont creuse de profonds sillons et le front s’affaisse completement. Les rives gauche et droite
presentent de nombreux trous et crevasses. (J.-J. Chabloz)
35 Mont Durand
2014: Portail rive droite inaccessible: d’un cote bedrock presque vertical, de l’autre pente de
glace du front raide et chutes de rochers et gravats constants. Rive gauche le glacier couvert
de debris rocheux s’est tasse et a avance. Le bedrock est apparu ce qui a permis de faire un
nouveau Pt 10/14 dans le meme axe de visee. En depit des chiffres, grosse decrue, surtout
visible a partir du trou bedrock central direction Tete Blanche. (J.-J. Chabloz)
2015: La rive gauche est percee de trous et crevasses. Juste au-dessus du front dans l’axe
de mesure un seuil de bedrock separe la langue du glacier en deux parties egalement couver-
tes de debris rocheux. Au plateau superieur rive droite, le bedrock est toujours plus visible et
un gros torrent le separe du glacier. Au pied de Tete Blanche bedrock partout. (J.-J. Chabloz)
36 Brenay
2014: Recul peu marque, mais la langue du glacier s’est completement affaissee, surtout la
rive gauche qui forme maintenant un vallon a l’extremite duquel se trouve un faux portail
desolidarise du front. La rive droite couverte de debris rocheux qui se prolonge en aval du
front se tasse fortement. Au niveau des seracs du Brenay, le bedrock rive gauche est bien
apparent. Ici aussi decrue marquee. Un gros bloc abandonne par la derniere crue exactemnt
dans l’axe principal a permis de marquer le Pt 23/15. (J.-J. Chabloz)
2015: Les rochers couvrants les moraines en aval du glacier se sont effondres sur le plateau
au devant du front. Le dernier Pt 23/15 se retrouve au milieu du torrent. Sur le glacier rive
droite de gros trous et crevasses. Un torrent sous glaciaire a l’extreme bord rive droite rejoint
le portail rive droite juste a la sortie du glacier et plusieurs petits bras de torrents sortent sous
la langue rive gauche parmi un capernaum de blocs, rochers et graviers. Au niveau des seracs
du Brenay l’oeil rocheux n’est plus un oeil et le bedrock est lie a la rive droite. (J.-J. Chabloz)
37 Gietro
2014: Luftbildaufnahmen am 2.10.2014, photogrammetrische Auswertung durch Flotron AG
im Auftrag der Forces Motrices de Mauvoisin SA. Bestimmung der Langenanderung durch
die VAW/ETHZ. (VAW/ETHZ – A. Bauder)
2015: Luftbildaufnahmen am 21.9.2015, photogrammetrische Auswertung durch Flotron AG
im Auftrag der Forces Motrices de Mauvoisin SA. Bestimmung der Langenanderung durch
die VAW/ETHZ. (VAW/ETHZ – A. Bauder)
38 Corbassiere
2014: Luftbildaufnahmen am 2.10.2014, photogrammetrische Auswertung durch VAW/ETHZ
im Auftrag der Forces Motrices de Mauvoisin SA. (VAW/ETHZ – A. Bauder)
118
B. Remarks on Individual Glaciers
2015: Luftbildaufnahmen am 21.9.2015, photogrammetrische Auswertung durch VAW/ETHZ
im Auftrag der Forces Motrices de Mauvoisin SA. (VAW/ETHZ – A. Bauder)
40 Tseudet
2014: Le bas du glacier est tres irregulier et est recouvert d’eboulis. Il est tres difficile de
determiner ou s’arrete vraiment le glacier (presence de langues glaciaires mais impossible de
dire si c’est un melange de blocs et de glace ou si c’est encore le glacier). (J. Medico)
2015: Situation gegenuber 2014 unverandert. (J. Medico)
43 Trient
2014: Une masse de glace s’est separee de l’extremite de la langue, mais est restee a pro-
ximite. La mesure de cette annee ne l’a donc pas pris en compte. La fonte de la langue se
poursuit, son epaisseur diminue. (J. Ehinger)
2015: La pointe de la langue est toujours engagee dans un sillon rocheux oriente approxima-
tivement SW-NE. La fonte de l’annee a ete importante, le glacier a perdu en epaisseur. Par
contre le recul de la langue a ete faible. (J. Ehinger)
44 Paneyrosse
2014: Refait peinture des points. (J.-Ph. Marletaz)
2015: La neige fraıche n’a pas toute fondu, malgre cela les mesures sont fiables. Refait la
peinture des points. (J.-Ph. Marletaz)
45 Grand Plan Neve
2014: Refait peinture des points 83 a 85. (J.-Ph. Marletaz)
2015: Les points 3,2,1,11 arrivent en fin de vie. Refait la peinture des points. (J.-Ph.
Marletaz)
47 Sex Rouge
2014: P1 a P3 ont ete rafraıchi. (J. Binggeli)
2015: Le glacier n’est plus decelable sur P1, P3 et P4. Nous avons a nouveau mesure P2
sans etre a nouveau certain du materiau nivologique apparent (neve persistant, glacier sous-
jacent, glace morte). (J. Binggeli)
48 Prapio
2014: L’ete froid et pourri a favorise la persistance d’un important neve compact, encore
arrime au glacier, obstruant la gorge en maints endroits. Ce phenomene est nettement plus
marque que l’annee derniere, tant en longueur qu’en epaisseur. On note a nouveau le depot
d’eboulis arraches aux pentes dominantes. On constate la formation de materiau glace a
l’avant du front sur une distance de 5 metres. (J. Binggeli)
2015: On note a nouveau le depot d’eboulis arraches aux pentes dominantes. (J. Binggeli)
119
The Swiss Glaciers 2013/14 and 2014/15
52 Gauli
2014: Eine kleine Zunge des Gletschers reicht noch bis zum See, diese wird im nachsten Jahr
vermutlich verschwinden. Am untersten Rand ist der Gletscher stark zerkluftet und noch ein-
mal sichtbar dunner geworden. (D. Rohrer)
2015: Der Gletscher hat vor allem stark an Machtigkeit verloren. (D. Rohrer)
53 Stein
2014: Der Gletscher ist wiederum stark zuruckgegangen und hat vor allem an Machtigkeit
verloren. (D. Rohrer)
2015: Starker Ruckgang auch in der Machtigkeit. (D. Rohrer)
54 Steinlimi
2014: Gletscher hat sich gegnuber dem Vorjahr nicht stark verandert, ist aber wieder um
mehr als 80m zuruckgegangen. (D. Rohrer)
55 Trift (Gadmen)
2014: Luftbildaufnahmen am 23.9.2014, photogrammetrische Auswertung durch VAW/ETHZ.
(VAW/ETHZ – A. Bauder)
2015: Luftbildaufnahmen am 5.8.2015, photogrammetrische Auswertung durch VAW/ETHZ.
(VAW/ETHZ – A. Bauder)
57 Oberer Grindelwald
2014: Luftbildaufnahmen am 23.9.2014, photogrammetrische Auswertung durch VAW/ETHZ.
(VAW/ETHZ – A. Bauder)
2015: Luftbildaufnahmen am 5.8.2015, photogrammetrische Auswertung durch VAW/ETHZ.
(VAW/ETHZ – A. Bauder)
58 Unterer Grindelwald
2014: Luftbildaufnahmen am 23.9.2014, photogrammetrische Auswertung durch VAW/ETHZ.
(VAW/ETHZ – A. Bauder)
2015: Luftbildaufnahmen am 5.8.2015, photogrammetrische Auswertung durch VAW/ETHZ.
(VAW/ETHZ – A. Bauder)
59 Eiger
2014: Der Ruckzug des Eigergletschers halt an, besonders am rechten (ostlichen) Rand und
in Gletschermitte, wo Locher zunehmen und die Eisdicke abnehmend aussieht. Eisablagerun-
gen von hohergelegenen Gletscherteilen unter dem Monch verursachten moglicherweise den
Vorstoss links. (R. Zumstein)
2015: Messung mit Theodolit. Beruhrungslos gemessen. (R. Schai)
120

B. Remarks on Individual Glaciers
60 Tschingel
2014:Weiteres starkes Zuruckweichen vor allem auf der sonnigen linken Seite (Warmeabstrahlung
von Fels/Morane); dort auch flacher geworden. Gletscherfront bei G neu gut sichtbar. Eis-
sporn zwischen den Punkten G und A, Kante zum hochsten Punkt des Gletschers. Wenig
Wasseraustritt beim Gletschertor. (R. Zumstein)
2015: Ruckgang besonders auf der sonnigen linken Seite. Leichter Vorstoss rechts bei Punkt
G’ konnte auch Moranenmaterial sein. Kein Gletschertor sichtbar. (R. Schai)
61 Gamchi
2014: Seitenarm bei E hat sich praktisch vom ubrigen Gletscher gelost, daher wurde der
Messpunkt ohne Berucksichtigung aufgegeben. Der Gletscher lost sich in seinem unteren Be-
reich vollig und schnell auf, die Machtigkeit betragt oft nur noch wenige Meter. (R. Descloux)
2015: Messpunkt b aufgegeben, da Gletscher keine Verbindung mehr zum Nahrgebiet hat.
Punkt a direkt auf die Gletscherzunge neu gesetzt. (R. Descloux)
62 Schwarz
2014: Mit GPS wurde die Positition des Gletscherendes gemass Triangulation von 2013
uberpruft. Die beiden so erfassten Punkte liegen nah beieinander. Daraus wurde die Langenveranderung
ab i0 ermittelt. (E. Coleman Brantschen)
2015: Der 2014 gemalte Punkt ist nun weit ausser Reichweite: das Eis ist um ca. 2m abge-
sackt. Das 2014 sichtbare Gletschertor ist weg, erkennbares Gletschertor ca. 100m aufwarts.
Auch oberhalb grossflachiges Auflosen des Gletschers. (E. Coleman Brantschen)
64 Blumlisalp
2014: Schmale Eiszunge in steilem Gelande - schwierige Messbedingungen (U. Burgener)
2015: Schwierige Messbedingungen. Einrichten neuer Basismesspunkte notig. (U. Burgener)
65 Plaine Morte
2014: Ausbruch vom Lac des Faverges mit 1 bis 1.5miom3 am 7.8.2014. Der ganze See hat
sich innerhalb von etwas mehr als einem Tag subglazial entleert und in der Lenk zu einem
Hochwasser ohne Schaden gefuhrt. (M. Huss)
66 Tiefen
2014: Das Mass des Ruckganges ist mit jenem des Vorjahres praktisch identisch. Im Vorfeld
der Gletscherzunge liegt ein untiefer See. Die mit Schutt bedeckte Eismasse am sudlichen
Rand taut sehr schnell. Der Bach durfte sich im Laufe der Zeit weiter in das Lockermaterial
im Gletschervorfeld abteufen. (L. Eggimann)
2015: Ruckgang ausgepragter als in den letzten Jahren. Den See im Vorfeld der Gletscher-
zunge gibt es nicht mehr. Die sudliche, weit vorragende Gletscherzunge durfte nachstens
vom Hauptgletscher abreissen. Die Messung von Pt. 8 wurde weggelassen, da das Messre-
sultat zu stark verfalscht worden ware. Neuer Messpunkt (Pt. 15) eingerichtet. (L. Eggimann)
121

The Swiss Glaciers 2013/14 and 2014/15
67 St. Anna
2014: Der Ruckgang liegt auch bei diesem Gletscher im Rahmen der letzten Jahre. Durch
den leichten Schneefall am Vortag der Begehung liess sich der Rand des Gletschers sehr gut
nachvollziehen. (L. Eggimann)
2015: Die Gletscherzunge ist gut 3m mehr abgeschmolzen als im Vorjahr. Der Massenverlust
durfte sich dagegen verlangsamt haben. (L. Eggimann)
68 Kehlen
2014: Der Ruckgang ist markant. Der Grund dafur liegt in einem Toteisfeld. 2013 war der
Gletscher noch uber eine dunne Eiszunge mit dem Eisfeld verbunden. Aber bereits damals
nahrte der Gletscher diese Eismasse nicht mehr. (M. Planzer)
2015:Markante Verminderung des Ruckgangs: die Gletscherzunge liegt momentan am vorde-
ren Rand eines grossen flachen Beckens. Bei mehreren Messpunkten war eine direkte Peilung
wegen fehlender Sicht zum Gletscher nicht moglich. Daher wurden vier neue Messpunkte
eingrichtet. (M. Planzer)
69 Rotfirn
2014: Die Messungen erfolgten wahrscheinlich an einer Toteismasse, welche von oben nicht
mehr genahrt wird. (M. Planzer)
2015: Dank der starken Schuttbedeckung hat sich der Ruckzug der Gletscherzunge gegenuber
dem Vorjahr verlangsamt. Die Verbindung des im Talboden liegenden Gletscherfeldes mit dem
Hauptgletscher ist nur noch schwach und durfte im nachsten Jahr abreissen. (M. Planzer)
70 Damma
2014: Ruckgang ist ahnlich gross wie im Vorjahr. Gletscherzunge ist unbegehbar und konnte
nicht mit dem GPS vermessen werden. (M. Planzer)
2015: Der Ruckgang hat sich in diesem Jahr stark beschleunigt. Auch die Machtigkeit des
Gletschers ist stark am Schrumpfen. Die nordwestlich liegende Gletscherzunge ist nur noch
durch ein schwaches Eisband mit dem Hauptgletscher verbunden. (M. Planzer)
71 Wallenbur
2014: Der Gletschertunnel auf der westlichen Seite ist eingebrochen und weggeschmolzen.
Dadurch wurde der vorgelagerte Eisblock zu Toteis, und der Gletscher ist auf dieser Zungen-
seite stark zuruckgegangen. (P. Klager)
2015: Die unter Schutt liegende Eismasse hat deutlich weniger stark abgenommen als im
Vorjahr. (P. Klager)
72 Brunnifirn
2014: Bei den angegebenen Werten handelt es sich um den Ruckgang in 5 Jahren. Der relativ
kleine Distanzverlust durfte darauf zuruckzufuhren sein, dass nachdem der Gletscher rasch
uber die steile Felsstufe weggeschmolzen ist er nun in flachem Gelande vorerst stark in seinem
Volumen (Hohe) abnimmt, bevor er weiter zuruckweicht. (M. Planzer)
122

B. Remarks on Individual Glaciers
2015: Der Ruckzug der Gletscherzunge ist trotz des heissen Sommers erstaunlich gering.
Da der Gletscher in einem flachen Becken liegt, erfolgt der Eisverlust ausschliesslich uber die
Hohe. (M. Planzer)
74 Griess
2014: Der ganze Zungenbereich liegt unter einer Schuttmasse aus Steinen und Blocken, und
der starke Zerfallsprozess schreitet weiter voran. Dauernde Eisabfalle in den Gletschersee.
(B. Annen)
2015: Der Ruckzug liegt leicht uber dem der Vorjahre. Es lasst sich ein eigentlicher Schrump-
fungsprozess beobachten. Der Zungenbereich halt sich dank Schuttauflage erstaunlich lang
am Leben. (B. Annen)
75 Firnalpeli
2014: Unterschied zwischen verfirntem Schnee und blankem alteren Gletschereis nicht fest-
stellbar. Deshalb ergibt sich hier ein ”Vorstoss”der Zunge, welcher sich aber mit dem zweijahrigen
liegen gebliebenen Schnee erklaren lasst. (M. Meier)
2015: Gletscherende weiterhin mit verfirntem Altschnee bedeckt. (M. Jaggi)
76 Griessen
2015: Gletscherende mit etwas Neuschnee bedeckt. (M. Jaggi)
77 Biferten
2014: Dieses Jahr war die Suche nach den Gehilfen fur einmal das kleinste Problem. Hatte
ich doch plotzlich Interessenten und Ehemalige die sich bereit erklarten mit mir den Bifer-
tengletscher zu vermessen. Da war in diesem Sommer und Herbst eher der Wettergott der
Spielverderber. Doch am Samstag 4. Oktober 2014 fand ich das ideale Wetterfenster um die
Messung zu starten. Ein kurzes Telefon im Vorfeld an Kurt Stussi, den Chef der Bautruppe
im KLL, um abzuklaren ob denn das Stativ wieder an seinem Startplatz deponiert war und wie
er den momentanen Stand so einschatze sind meine wesentlichsten Vorarbeiten. Alles andere
lauft beinahe wie von selbst, so kann ich zeitlich am Morgen meinen Gehilfen Hans-Rudolf
Hosli alt Metzgermeister Ennenda, in Netstal abholen. Er hat sich bereits im 2013 bereits
einmal mit mir an den Bifertengletscher gewagt, damals mit dem Resultat, dass wir ausser
einer ”Begehung” leider keine Messung heim brachten. Da war ja dann eine zweite Begehung
notig, dort aber mit Roman Muller, weil Hans-Rudolf ”Ferien halber” weg war. Bis Linthal
und ins Tierfehd sind die Strassen bestens fahrbar, ab Tierfehd bis hinauf nach Hintersand
bin ich dann um den Vermesserbus mit hohem Radstand und Allradantrieb froh. So kommen
wir ohne Probleme zu unserem Startpunkt, wo wir die Bergschuhe schnuren mussen, um
an unsere Messpunkte zu gelangen. Bei der Sandrisi begrusst uns diesmal mit einer kleinen
Wolkenfahne der hochste Glarner der Todi. Freudig ”grussen” wir zuruck und halten den tol-
len Blick fotografisch fest. Steil und ohne flaches einlaufen steigen wir dem Bifertengletscher
entgegen. Im Rucksack ausser dem Stativ, das ubliche Vermessungsmaterial und auch Kleider
zum Wechsel, nach dem schweisstreibenden Fussmarsch und etwas Proviant. Im Tentiwang
ist die erste Rampe bewaltigt und eine Ebene lasst uns etwas verschnaufen, bevor dann der
zweite Teil hinauf zur KLL Schutzhutte folgt, um dort das Stativ zu fassen und zum Aus-
gangspunkt 2003 anzusteigen. Uberall an den neuralgischen Punkten und Ausblicken werden
123
The Swiss Glaciers 2013/14 and 2014/15
Fotos geschossen um die Verhaltnisse im 2014 zu dokumentieren. Das Wetter spielt mit und
ebenfalls die Temperatur, die naturlich fur einen Gletscherzuwachs einmal mehr zu warm ist,
aber von uns Vermesser als sehr angenehm empfunden wird. Der obligate ”Znunihalt” bei der
Station 2003 und eine kurze Instruktion fur meinen Gehilfen und die Kartierung des Gletschers
kann beginnen. Nach der Orientierung auf der Station E begibt sich mein Gehilfe mit Sack
und Pack der Gletscherzunge entlang hinauf Richtung Sud um mir die einzelnen Eckpunkte
der Gletscherzunge zu ubermitteln. Dabei ist auch die Uberquerung des Gletscherbaches 1
kein grosses Problem. Da sich das Tor immer weiter nach oben zuruckzieht, ist der tiefste
Punkt auch der erste Punkt der Messung. Er hat sich trotz des recht flachen Vorgelandes
wiederum um 2.4m hinauf bewegt, ebenfalls ein Indiz, dass sich der Gletscher zuruck zieht.
Der Gletscherbach und sein Tor liegen bereits auf 1972.3m.u.M. dies ist ebenfalls 1 Me-
ter hoher als im Vorjahr. Wie immer ist die Erfassung im nordostlichen Teil des Gletscher
eine Herausforderung: Geroll wie in einem Steinbruch lassen die Zunge nur erahnen, doch
immer wieder kann man einzelne Kantenstucke erkennen und so den Verlauf in etwa fest-
legen. Mit 10 Mess-Punkten kann mir der Gehilfe dieses Teilstuck ubermitteln. Danach ist
der Operateur gefragt, indem er einen Standortwechsel vorzunehmen hat. Also, Instrument
einpacken, Stativ schultern und hinauf Richtung Station 20101 aufsteigen. Wahrend dieser
Zeit kann sich der Gehilfe etwas ausruhen, verpflegen und die Umgebung geniessen. Auf dem
Weg nach oben, komme ich der Gletscherzunge naturlich ebenfalls sehr nahe, dies muss dann
auch im Bild fixiert sein. So entsteht einmal mehr doch eine eindruckliche Dokumentation
des Zustandes von 2014. Sobald die Stationierung auf dem Fixpunkt 20101 erfolgt ist und
die Orientierung am Giebel der Grunhornhutte ausgefuhrt und mit dem Theodolit registriert
ist, kann die Messung fortgesetzt werden. Nach wenigen Punkten gelangt Hans-Rudolf Hosli
zum Gletschertor 2. Die Hohe dort betragt 1992.0m.u.M. ist insgesamt um 12m tiefer als im
Vorjahr, trotz des grossen Ruckzuges gerade auch in diesem Bereich. Der Hohenverlust ruhrt
wohl daher, dass der Gletscher in diesem Bereich eine Mulde hinterlasst, die vorher nicht ein-
sehbar war. Ab dem Gletschertor 2 wird eigentlich das Begehen des Gletschers erst so richtig
spannend, obwohl dies eigentlich mehr als Wange statt als Zunge des Gletschers bezeichnet
werden kann. Aber der Bifertengletscher wird mehr und mehr nur noch eine schlanke Figur
die immer weniger Breite hat. Mit 27 Messpunkten haben wir im 2014 den Gletscher kartiert.
Die Minusflache ist dieses Jahr riesig, sie betragt 37’744m2. Die gemessen Breite dazu ist
mit 763.4m doch recht lang. Trotzdem ergibt dies fur den Ruckgang des Gletschers eine
erschreckende Zahl, namlich -49.4m. Dieses Resultat ist mit Abstand der hochste Ruckzug
seit ich die Messungen ausfuhre. Im 1994 hatte ich mit -38.6m, dies aber uber 3 Jahre, einen
ahnlich hohen Schwund. Sicherlich hat sich im Bereich des Gletscherbaches 2 einiges getan,
dass dies aber derart frappant ist, hatte ich doch nicht gedacht. Wenn dies so weiter geht, so
bin ich dann bald unter dem Grunhorn und beobachte den Gletscher in diesem Bereich. Nach
getaner Arbeit am Gletscher, steigen wir, nachdem der Gehilfe zu mir zur Station stosst,
gemeinsam uber die immer wieder knifflig zu begehende Dr. Streiff-Becker Morane zur alten
Fridolinshutte auf, um dort unser Stativ zu deponieren. Dieses wird in verdankenswerter Wei-
se dann wieder von den KLL Mitarbeitern an den Startort bei der KLL Unterkunft befordert.
Leider ist die Fridolinshutte nicht mehr bewartet und so steigen wir ohne gross zu rasten und
ruhen, hinab ins Tal zu unserem Bus in Hintersand. Die Fahrt zuruck ins Tierfehd verlauft
ebenfalls ohne Probleme. Nach einem kurzen Umtrunk im Garten des Restaurant Rutihof
endet die Messung unfallfrei und erfolgreich. Fur Hans-Rudolf ein toller erster Messgehilfen-
Einsatz, ohne diese Mithilfe ware die beinahe ununterbrochene Messreihe kaum messbar,
danke. Im 2015 wird sich dann weisen, was sich da am Bifertengletscher weiter tut. Ich hoffe,
dass dies ein Ausreisser in Sachen Schwund ist, ansonsten ware ja meine Arbeit wohl bald
124

B. Remarks on Individual Glaciers
gefahrdet?! Sicherlich steige ich gespannt auch im nachsten Jahr wieder zum Bifertenglet-
scher hoch und beobachte ihn auf’s Genauste. (H. Klauser)
2015: Beinahe genau 1 Jahr nach der Messung 2014, namlich am 03.10.2015 machen wir uns
wieder auf den Weg zum Bifertengletscher, einmal mehr der treue und bereits versierte Ge-
hilfe Hansruedi Hosli alt Metzgermeister aus Ennenda und meine Wenigkeit. Die Verhaltnisse
fur die Messung lassen uns zuversichtlich Richtung Linthal, Hintersand fahren um schliesslich
zum Gletscher aufzusteigen. Der Wetterbericht verspricht mit etwas Fohn bis zum fruhen
Nachmittag trockene Verhaltnisse. Die Bewolkung, die nach kurzer Phase mit blauem Him-
mel, bereits am Morgen den Himmel bedeckt, ist fur unsere Arbeit nicht weiter tragisch,
da diese hoch an den Gipfeln hangt. Die warmen Temperaturen zeigen deutlich, der alteste
Glarner (Fohn) hat seine Hand im Spiel. Er vermag aber nicht ”z’Boda”, dies zu unserem
Gluck, sonst hatten wir mit starken und unangenehmen Windboen zu kampfen. Der Nebel
der uns beim Zuruckblicken im Tentiwang entgegenzungelt ware ein weiterer Spielverderber
bei der Messung, dies passiert dann nur kurz vor Ende der Messung auf der Station 20101,
er macht sich dann aber wieder aus dem Staub, vielmehr er wird durch den aufkommenden
Regen verdrangt. Die Messung konnten wir aber trocken uber die Runde bringen, schliesslich
mussten wir nur das ”ZMittag” an der ”Trochni” essen (in der alten Fridolinshutte, Winter-
raum, weil die Huttenwartin bereits eingewintert hat). Zum Abstieg hellte es dann nochmals
auf und so konnten wir auch den Abstieg trocken bewaltigen. Danach liess sich dann aber
der Regen nicht mehr aufhalten, alle Schleusen offneten sich. Es schien als sei dies der Welt-
untergang; dies konnte uns zweien aber egal sein, wir hatten ja die Messung im Trockenen.
Wahrend des Zustieg zum Gletscher gehoren wiederum diverse Fotohalte im Tentiwang und
kurz vor der Unterkunftshutte dazu, um der Nachwelt die Verhaltnisse an diesem Oktobertag
im 2015 zu dokumentieren. Die warmen Verhaltnisse und auch das bekannte Resultat am
Glarnischgletscher lassen auch fur den Bifertengletscher keine Euphorie in Sachen Wachstum
aufkommen, aber ...?! Wiederum hat der Bautrupp der KLL das Stativ von der Deponie al-
te Fridolinshutte hinunter zum Ausgangspunkt Unterkunftshutte KLL befordert, dies klappt
immer vorbildlich. Wir packen dieses noch zusatzlich zu unseren Lasten und steigen uber den
exponierten Weg hinauf zur Station 2003, wo wir wie gewohnt nach einem Znunihalt unsere
Messung beginnen. Der erste Punkt am Gletscher ist auch der tiefste Punkt des Gletschers,
1963.9m.u.M gegenuber dem Vorjahr 1965.5m.u.M, da bereits 1.6m tiefer, etwas unublich,
wenn sich der Gletscher ”aus dem Staub machen sollte”? Da in dieser Region aber immer
viel Geroll liegt und der Gletscher recht schwer auszumachen ist, konnte dies auch auf dies
zuruckzufuhren sei. Ein kleiner Gletscherbach auf der Hohe von 1969.1m.u.M bahnt sich
den Weg zum eigentlichen Gletscherbach, der wiederum nicht beim eigentlichen Gletschertor
(1973.7m.u.M) sondern etwas westlicher unter dem Gletscher hervortritt (1971.8m.u.M).
Der fur mich immer wieder interessante Messpunkt vom Austritt Gletscherbach hinunter bis
zur Fassung 2 betragt bereits 190.2m. 1977 nochmals zur Erinnerung musste ein Stollen in
den Gletscher gesprengt werden, damit das Wasser uberhaupt in die Fassung floss. In die-
sem Bereich ist der Gletscher weiter im Ruckzug. Im Bereich der Hohe 1984.0m.u.M ist die
Gletscherzunge derart schwierig auszumachen, dass da Schwankungen seitens der Messung
nicht auszuschliessen sind. Bis hinauf zur Hohe 2003.0m.u.M ist wieder klar Schwund auszu-
machen, was dann ab dieser Hohe die Messresultate hergeben, kann ich noch nicht schlussig
beurteilen, der Gletscher stosst hier doch betrachtlich vor. Die Messung dieses Bereiches
habe ich wiederum von der Station 20101 ausgefuhrt und auch nachtraglich im Buro noch
uberpruft. Das machtige Gletschertor mit seinem unterliegenden fjordahnlichen See liegt auf
einer Hohe von 2004.7m.u.M (12m hoher als im Vorjahr) In diesem Bereich muss ich mit-
125

The Swiss Glaciers 2013/14 and 2014/15
tels ”Vorstellen” die Umrisse des Gletschers erfassen, da der grosse See wohl nur mit einem
Boot zu befahren ware, umso an die Gletscherzunge zu gelangen. Danach steigt der Gehilfe
stetig bergan und schliesst auf 2043.5m.u.M die Messung 2015 ab. Bereits beim Ruckweg
zum Instrumentenstandort macht sich Petrus bemerkbar, indem er uns etwas Regen schickt.
Dieser hindert uns jedoch nicht, uber die Becker-Streiff Morane hinauszusteigen und schlies-
slich zur alten Fridolinshutte aufzusteigen. Nach der Deponie des Statives, das wie bereits
berichtet wieder von den treuen KLL Mitarbeitern zur Unterkunftshutte zurucktransportiert
wird, nehmen wir das wohlverdiente Mittagessen in der Hutte ein, weil die Schleusen nun
nochmals kraftig geoffnet werden. Der Regenbogen, den wir beim bereits wieder trockenen
Abstieg bildlich festgehalten haben zeugt von der grossen Feuchtigkeit, aber gleichzeitig auch
von der warmenden Sonne. So steigen wir den Huttenweg hinunter nach Hintersand, einmal
mehr mit der Gewissheit, dass die Messung gegluckt ist und dies wiederum unfallfrei. Dass
der Gletscher dieses Jahr um 17.6m gewachsen ist, verblufft mich und ich bin immer noch auf
der Suche nach einer plausiblen Erklarung. Diese werde ich wohl erst mit dem Vergleich der
Messung im kommenden Jahr bekommen oder werden wir noch weiter uberrascht? Bereits
bei der Fahrt von Hintersand hinunter ins Tierfehd und nach Linthal giesst es wie aus Kubeln,
zum Gluck sind wir an der ”Trochni” und bald zu Hause. Die Auswertung im Buro braucht
dieses Jahr viel mehr Zeit, da ich auf ein neues Vermessungsprogramm umsteigen muss und
da noch einige Einstellungen vornehmen muss. Schliesslich gluckt auch dies und so hoffe ich
in den kommenden Jahren wieder speditiv das Buro zu erledigen umso das Resultat auch
zeitig abliefern zu konnen. (H. Klauser)
78 Limmern
2014:Messrichtung nicht mehr parallel zur zentralen Fliessrichtung. Bei Punkt 5 besteht eine
Eisbrucke. (U. Steinegger)
2015: Gletscherrand bei den Punkten 1 bis 4 stark schuttbedeckt. Gletscher mit etwas Neu-
schneebedeckt. Kaum Firnrucklagen vom vergangenen Winter ubrig. (U. Steinegger)
79 Sulz
2014:Der Bereich des Gletschertores hat sich gegenuber 2013 deutlich verandert. Ein grosseres
Stuck der Gletscherzunge ist abgebrochen, liegt aber noch vor dem eigentlichen Gletscher.
Der Verlauf des Gletscherbaches wurde durch Geschiebeablagerungen um mehrere Meter
(ca. 20m) nach Westen verlegt. (S. Kamm)
2015: Der Bereich des Gletschertores hat sich gegenuber 2014 wiederum deutlich verandert.
(S. Kamm)
80 Glarnisch
2014: War es letztes Jahr noch August als ich mit meinen Gehilfen zusammen den Glet-
scher besuchte, so wird es dieses Jahr, Anfang September, namlich der Samstag 06.09.2014.
Dies ruhrt diesmal nicht daher, dass ich keinen Gehilfen fand, sondern vielmehr daran, dass
der ”flussige” (nasse, feuchte) Sommer uns kaum Wochenende bescherte die uns nur im
Geringsten eine Chance liessen den Gletscher zu vermessen. So machen wir uns an diesem
Samstag mit dem Glauben an den doch vielversprechenden Wetterbericht auf zum Gletscher.
(mindestens Trocken sollten wir uber die Runde kommen) Einmal mehr begleitet mich dabei
der bereits eingefleischte Gehilfe Roman Muller. Blauer Himmel und recht angenehme Tem-
peraturen sind am Startort in Warben unser ”Begrussungskommite”. Nach der Verteilung
126
B. Remarks on Individual Glaciers
der Lasten, nehmen wir den gut 1 1/2h Aufstieg in Angriff. Edelweissgruss und Kaffeehalt
naturlich inbegriffen (Danke dem Huttenwart-Team), kommen wir trotzdem zugig hinauf zum
Gletscher. Waschewechsel, damit der Operateur am Instrumentenstandort nicht friert, noch
kurz einen Schluck aus der Warmflasche und dann beginnt die Gletscher-Vermessung. Da be-
reits seit einigen Jahren die Messungen hin zum sudlichen Ende des Gletschers recht muhsam
von statten gehen, da sich der Gletscher hinter der Felsrippe in der Tiefe versteckt, entsch-
liesse ich mich, mit einer temporaren Hilfsstation (Nr. 15) auszuhelfen und somit besser und
einfacher den Sudteil des Gletschers zu erfassen. Nach kurzer Instruktion meines Gehilfen wie
wir da vorgehen, kraxelt Roman behande und gewandt hinunter zur Zunge des Gletschers.
Die Messung mit dem selbstspeichernden Theodoliten TCRM 1101 von Leica lasst uns rasch
und doch ausserst prazise die Gletscherzunge im Suden fur dieses Jahr erfassen. Sobald Ro-
man aus meinem Wirkungskreis enteilt, wechsle ich zuruck zur Station 14, von der aus der
restliche Bereich des Gletschers hin zum Nordende noch erfasst werden kann. Dabei kann ich
meinen Gehilfen immer bestens uberwachen, da die Station 14 beinahe wie ein Adlerhorst
hoch uber dem Gletscher thront. Dies vielmehr um allfallige Sturze oder Probleme fruhzeitig
zu erkennen als dass er sich etwa aus dem Staub machen wollte. Gletscher vermessen ist ja
nicht einfach ein Spaziergang, dies erfordert doch Trittsicherheit und uberlegtes Gehen im
Gelande. Einmal mehr meistert dies mein Gehilfe Roman bravouros und so konnen wir mit
gut 50 Messpunkten den Gletscher wiederum bestens reprasentieren. Unser Gefuhl, dass wohl
auch dieses Jahr kein Wachstum zu erwarten ist, bestatigt sich dann bei der Auswertung im
Buro. Einmal mehr zieht sich der Gletscher zuruck und dies etwa in den nun bald gewohnten
Grossenverhaltnissen namlich im Mittel um 7.4m. Wahrend der Messung ziehen Wolken auf,
zwischenzeitlich habe ich bald Angst, es konnte uns noch der Nebel einen Streich spielen
und auch ein nasser Abstieg konnte uns noch beschieden sein, doch dem ist nicht so, der
Nebel verkriecht sich in hohere Gefilde und auch die Nasse bleibt aus, so dass ich noch ohne
Probleme die Anschlussmessungen ausfuhren kann, die ich auf den Schluss hinausgeschoben
habe, damit der Gehilfe nicht zu viele Wege zurucklegen muss und so ein ”runder” Ablauf der
Messungen gewahrt ist. Der tiefste Punkt am Gletscher, der auch gleichzeitig der Austritt des
Gletscherbaches ist befindet sich nur gerade 0.4m hoher als letztes Jahr auf 2345.2m.u.M.
Die Ursache fur diesen geringen Ruckzug in der Hohe liegt darin, dass der Gletscher in die-
sem Bereich ein beinahe flaches Vorgelande ausweist. Ein zweiter Gletscherbach sucht sich
ebenfalls noch den Weg ins Tal. Dieser tritt auf 2353.4m.u.M an die ”frische Luft” aus dem
Schlund des Gletschers. Nach getaner kann sich der Gehilfe in der Nahe der Station 12 aus-
ruhen und sich verpflegen. Meine Wenigkeit baut die Station ab, verstaut das Instrument und
die restlichen Messutensilien im Rucksack um zu meinem Gehilfen zu gelangen. Dabei bewege
ich mich ebenfalls der Zunge entlang Richtung Nordende. Fotografisch halte ich da und dort
noch Einzelheiten fest um dies schliesslich als Dokument diesem Bericht beizulegen. Eine
kurze gemeinsame Rast am Ende der Mess-Strecke und dann nehmen wir den Abstieg ins Tal
unter die Fusse. Glucklich, dass bereits ein Gletscher ”im Kasten” ist, aber immer mit der
notigen Vorsicht, dass auch der Abstieg unfallfrei bewaltigt werden kann. Der Schnitz Wahe
und etwas Flussiges bei der Glarnischhutte ist ein kleiner Vorschuss-Lohn an den Gehilfen und
naturlich schmeckt der auch dem Operateur. Fachsimpeln vor der Hutte mit ankommenden
Alpinisten konnten wir wohl noch lange, doch wir wollen ja noch bei Tageslicht das Tal er-
reichen und so eilen wir gestarkt unserem Bus in Warben entgegen. Wohlbehalten erreichen
wir diesen und konnen die Messung 2014 von der Feldseite her, als erledigt abhaken. Be-
reits sinnieren wir bei der Hinausfahrt aus dem Rossmattertal, was uns denn nachstes Jahr
da oben wohl erwarten wird. Dass dabei ein muder Wandersmann unseren Taxidienst gerne
in Anspruch nimmt sei hier nur am Rande erwahnt. So schliesse ich diesen Bericht, danke
127

The Swiss Glaciers 2013/14 and 2014/15
aber meinem treuen Gehilfen Roman fur seine tolle Arbeit am Gletscher und hoffe, dass sich
im 2015 der Gletscher doch endlich einmal erholen kann und wir nicht immer hoher und
hoher steigen mussen. Dies ist aber wohl eher Wunschdenken, denn wenn da nicht die ganze
Welt mithilft, der Klimaerwarmung Einhalt zu bieten so wird sich da wohl in nachster Zeit
kaum etwas verandern, oder hat etwa die Natur noch einen Trumpf in der Hand?! (H. Klauser)
2015: Nach einem Jahr und 2 Wochen mache ich mich dieses Jahr auf, um den ersten Glet-
scher, den Glarnisch zu vermessen. Dabei begleiten mich erstmals am Glarnisch mein bereits
eingearbeiteter Gehilfe vom letzten Jahr beim Biferten, Hansruedi Hosli alt Metzgermeister
aus Ennenda und zusatzlich Brigitte Tiefenauer von der Sudostschweiz (Regionalzeitung)
als Reporterin um uber dieses doch immer mehr Aufmerksamkeit auf sich ziehende Thema
Gletscher haut nah zu berichten. Der bereits eine Woche fruhere Termin viel dem doch gar-
stigen Wetter zum Opfer. An diesem Samstag stimmt dann einfach alles, herrliches Wetter
und beste Stimmung im Team. Wie gewohnt, nach Aufnahme meiner Begleiter im Bus ab
Wohnort und Bahnhof (Brigitte), fahren wir holprig und geschuttelt hinauf nach Warben.
Bereits wahrend der Fahrt diskutieren wir eifrig uber den Zustand der Gletscher und die vor-
angegangenen Messungen: Was erwartet uns wohl dieses Jahr? Die Lasten werden aufgeteilt
und los geht die Exkursion Gletscher 2015. Nach kurzem Halt bei der Edelweissplatte (was
auch die Bilder belegen) streben wir der Hutte zu, wohl wissend, dass der Huttenwart be-
reits abgezogen ist und er die Hutte auf den Winter vorbereitet hat. Trotzdem eine kurze
Verschnaufpause an besagter Stelle, danach wollen wir endlich visuell wissen wie es denn
”unserem” Gletscher so geht. Trotz Schneebedeckung lasst es einem wiederum Boses ah-
nen, was sich dann schliesslich auch in Zahlen bewahrheitet. Einmal mehr kann ich mit dem
im letzten Jahr bestimmten HP 15 und der Station 14 die gesamte Gletscherzunge erfassen
und kartieren. Nach ”frischmachen” am Stationspunkt und einem kurzen ”Znunihalt” kann
ich Hansruedi los schicken um mir die Gletscherzunge von Sud nach Nord zu begehen und
mir die Eckpunkte am Gletscher mittels Reflektor zu ubermitteln. Gleichzeitig weihe ich auch
Brigitte Tiefenauer in die Geheimnisse der Vermessung und der Gletschermessung ein. Be-
eindruckt begleitet sie dann in der ersten Halfte vom sudlichen Ende bis zur Felsrippe auf der
ich mich installiert habe Hansruedi auf seinem Weg. Eindruckliches Bildmaterial und auch die
Reportage zeugen von einer wirklich beindruckten Reporterin, die mit Begeisterung und An-
erkennung fur unsere Arbeit unterwegs war. Einmal mehr benutze ich den selbstspeichernden
Theodoliten TCRM 1101 von Leica. Die Zielpunkte um das Azimut zu bestimmen sind eben-
falls wieder dieselben, namlich Punkt 12 und 13, die mein Gehilfe am Schluss der Messung
noch ubermittelt, da sie ja gegenuber von Punkt 14 und 15 liegen. Daher hangt anfanglich
alles am Gipfelkreuz, das ich als Fernziel immer mit messe. Mit gut 30 Messungen bestimmen
wir dieses Jahr die Zunge und mussen einmal mehr einen grossen Schwund ausweisen: dieser
betragt im Mittel 34.0m uber die gemessene Breite von 428.6m und einer ”Schwundflache”
von 14’594.8 m2. Die Hohenmessungen zeigen ebenfalls deutlich, dass sich der Gletscher
aus dem Staub macht, ist doch in einem doch recht sanft ansteigenden Vorgelande der Un-
terschied von genau 2.0m von 2345.2m.u.M vom Vorjahr auf 2347.2m.u.M ein deutliches
Resultat. Der tiefste Punkt ist auch gleichzeitig am Austritt des Gletscherbaches der sich
dann durch die Gletscherschliffe hinunter den Weg ins Tal sucht. Gut auszumachen sind auch
die beiden Kessel in denen die Zunge sich noch hineinzwangt, getrennt durch die Felsrippe mit
den Fixpunkten 14 und 15. Der Start im Norden (2396.0m.u.M) ist beinahe gleich hoch wie
der Punkt oben an der Felsrippe 2406.0m.u.M) Der gesamte Kessel ab der Felsrippe gegen
Norden ist dagegen allgemein tiefer gelegen. Bei der Hohe 2375.0m.u.M frisst sich ebenfalls
eine weitere Felsrippe ins Eis und tragt weiter zum Schmelzen mittels ”Bettflascheneffekt”
128
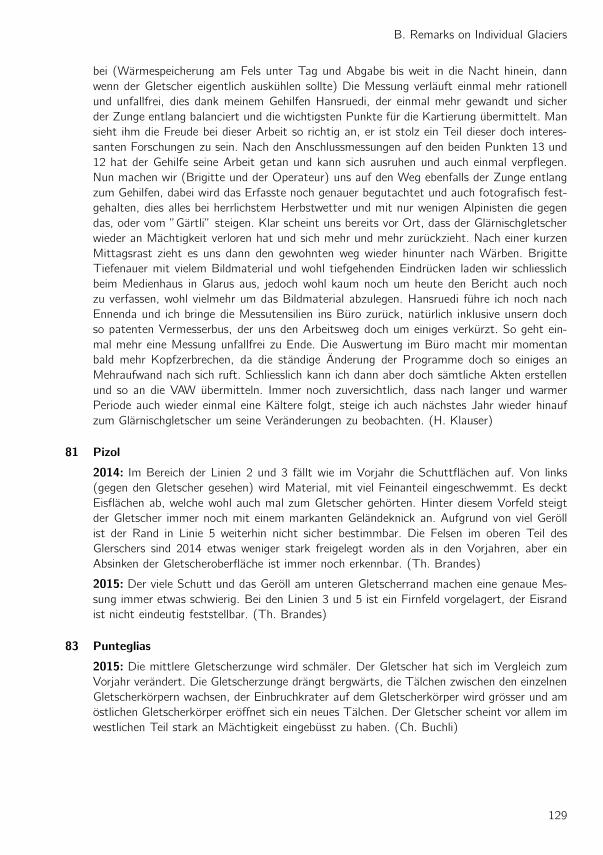
B. Remarks on Individual Glaciers
bei (Warmespeicherung am Fels unter Tag und Abgabe bis weit in die Nacht hinein, dann
wenn der Gletscher eigentlich auskuhlen sollte) Die Messung verlauft einmal mehr rationell
und unfallfrei, dies dank meinem Gehilfen Hansruedi, der einmal mehr gewandt und sicher
der Zunge entlang balanciert und die wichtigsten Punkte fur die Kartierung ubermittelt. Man
sieht ihm die Freude bei dieser Arbeit so richtig an, er ist stolz ein Teil dieser doch interes-
santen Forschungen zu sein. Nach den Anschlussmessungen auf den beiden Punkten 13 und
12 hat der Gehilfe seine Arbeit getan und kann sich ausruhen und auch einmal verpflegen.
Nun machen wir (Brigitte und der Operateur) uns auf den Weg ebenfalls der Zunge entlang
zum Gehilfen, dabei wird das Erfasste noch genauer begutachtet und auch fotografisch fest-
gehalten, dies alles bei herrlichstem Herbstwetter und mit nur wenigen Alpinisten die gegen
das, oder vom ”Gartli” steigen. Klar scheint uns bereits vor Ort, dass der Glarnischgletscher
wieder an Machtigkeit verloren hat und sich mehr und mehr zuruckzieht. Nach einer kurzen
Mittagsrast zieht es uns dann den gewohnten weg wieder hinunter nach Warben. Brigitte
Tiefenauer mit vielem Bildmaterial und wohl tiefgehenden Eindrucken laden wir schliesslich
beim Medienhaus in Glarus aus, jedoch wohl kaum noch um heute den Bericht auch noch
zu verfassen, wohl vielmehr um das Bildmaterial abzulegen. Hansruedi fuhre ich noch nach
Ennenda und ich bringe die Messutensilien ins Buro zuruck, naturlich inklusive unsern doch
so patenten Vermesserbus, der uns den Arbeitsweg doch um einiges verkurzt. So geht ein-
mal mehr eine Messung unfallfrei zu Ende. Die Auswertung im Buro macht mir momentan
bald mehr Kopfzerbrechen, da die standige Anderung der Programme doch so einiges an
Mehraufwand nach sich ruft. Schliesslich kann ich dann aber doch samtliche Akten erstellen
und so an die VAW ubermitteln. Immer noch zuversichtlich, dass nach langer und warmer
Periode auch wieder einmal eine Kaltere folgt, steige ich auch nachstes Jahr wieder hinauf
zum Glarnischgletscher um seine Veranderungen zu beobachten. (H. Klauser)
81 Pizol
2014: Im Bereich der Linien 2 und 3 fallt wie im Vorjahr die Schuttflachen auf. Von links
(gegen den Gletscher gesehen) wird Material, mit viel Feinanteil eingeschwemmt. Es deckt
Eisflachen ab, welche wohl auch mal zum Gletscher gehorten. Hinter diesem Vorfeld steigt
der Gletscher immer noch mit einem markanten Gelandeknick an. Aufgrund von viel Geroll
ist der Rand in Linie 5 weiterhin nicht sicher bestimmbar. Die Felsen im oberen Teil des
Glerschers sind 2014 etwas weniger stark freigelegt worden als in den Vorjahren, aber ein
Absinken der Gletscheroberflache ist immer noch erkennbar. (Th. Brandes)
2015: Der viele Schutt und das Geroll am unteren Gletscherrand machen eine genaue Mes-
sung immer etwas schwierig. Bei den Linien 3 und 5 ist ein Firnfeld vorgelagert, der Eisrand
ist nicht eindeutig feststellbar. (Th. Brandes)
83 Punteglias
2015: Die mittlere Gletscherzunge wird schmaler. Der Gletscher hat sich im Vergleich zum
Vorjahr verandert. Die Gletscherzunge drangt bergwarts, die Talchen zwischen den einzelnen
Gletscherkorpern wachsen, der Einbruchkrater auf dem Gletscherkorper wird grosser und am
ostlichen Gletscherkorper eroffnet sich ein neues Talchen. Der Gletscher scheint vor allem im
westlichen Teil stark an Machtigkeit eingebusst zu haben. (Ch. Buchli)
129
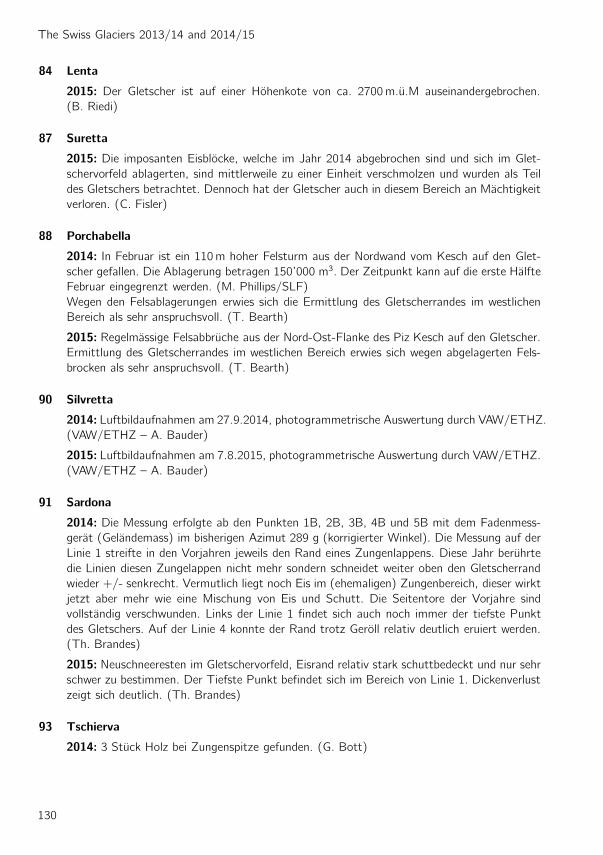
The Swiss Glaciers 2013/14 and 2014/15
84 Lenta
2015: Der Gletscher ist auf einer Hohenkote von ca. 2700m.u.M auseinandergebrochen.
(B. Riedi)
87 Suretta
2015: Die imposanten Eisblocke, welche im Jahr 2014 abgebrochen sind und sich im Glet-
schervorfeld ablagerten, sind mittlerweile zu einer Einheit verschmolzen und wurden als Teil
des Gletschers betrachtet. Dennoch hat der Gletscher auch in diesem Bereich an Machtigkeit
verloren. (C. Fisler)
88 Porchabella
2014: In Februar ist ein 110m hoher Felsturm aus der Nordwand vom Kesch auf den Glet-
scher gefallen. Die Ablagerung betragen 150’000 m3. Der Zeitpunkt kann auf die erste Halfte
Februar eingegrenzt werden. (M. Phillips/SLF)
Wegen den Felsablagerungen erwies sich die Ermittlung des Gletscherrandes im westlichen
Bereich als sehr anspruchsvoll. (T. Bearth)
2015: Regelmassige Felsabbruche aus der Nord-Ost-Flanke des Piz Kesch auf den Gletscher.
Ermittlung des Gletscherrandes im westlichen Bereich erwies sich wegen abgelagerten Fels-
brocken als sehr anspruchsvoll. (T. Bearth)
90 Silvretta
2014: Luftbildaufnahmen am 27.9.2014, photogrammetrische Auswertung durch VAW/ETHZ.
(VAW/ETHZ – A. Bauder)
2015: Luftbildaufnahmen am 7.8.2015, photogrammetrische Auswertung durch VAW/ETHZ.
(VAW/ETHZ – A. Bauder)
91 Sardona
2014: Die Messung erfolgte ab den Punkten 1B, 2B, 3B, 4B und 5B mit dem Fadenmess-
gerat (Gelandemass) im bisherigen Azimut 289 g (korrigierter Winkel). Die Messung auf der
Linie 1 streifte in den Vorjahren jeweils den Rand eines Zungenlappens. Diese Jahr beruhrte
die Linien diesen Zungelappen nicht mehr sondern schneidet weiter oben den Gletscherrand
wieder +/- senkrecht. Vermutlich liegt noch Eis im (ehemaligen) Zungenbereich, dieser wirkt
jetzt aber mehr wie eine Mischung von Eis und Schutt. Die Seitentore der Vorjahre sind
vollstandig verschwunden. Links der Linie 1 findet sich auch noch immer der tiefste Punkt
des Gletschers. Auf der Linie 4 konnte der Rand trotz Geroll relativ deutlich eruiert werden.
(Th. Brandes)
2015: Neuschneeresten im Gletschervorfeld, Eisrand relativ stark schuttbedeckt und nur sehr
schwer zu bestimmen. Der Tiefste Punkt befindet sich im Bereich von Linie 1. Dickenverlust
zeigt sich deutlich. (Th. Brandes)
93 Tschierva
2014: 3 Stuck Holz bei Zungenspitze gefunden. (G. Bott)
130

B. Remarks on Individual Glaciers
94 Morteratsch
2015: Fund Holzstuck (791’786/144’080). (G.-A. Godly)
95 Calderas
2014: Gwaschtenabbruch von 2010 inzwischen mit Schnee verfullt. Zunge wird immer dunner.
(G. Bott)
96 Tiatscha
2014: Luftbildaufnahmen am 27.9.2014, photogrammetrische Auswertung durch VAW/ETHZ.
(VAW/ETHZ – A. Bauder)
2015: Luftbildaufnahmen am 7.8.2015, photogrammetrische Auswertung durch VAW/ETHZ.
(VAW/ETHZ – A. Bauder)
97 Sesvenna
2015: Es hat sich eine grosse Hohle am ostlichen Rand gebildet. (G.-C. Feuerstein)
98 Lischana
2015: Neuer Felsriegel – der untere Teil ist nun grosstenteils vom Nahrgebiet abgetrennt.
(G.-C. Feuerstein)
100 Palu
2015: Gletscherende von See umgeben. (G. Bergier)
101 Paradisino
2014: Ghiacciaio in parte ricoperto da sassi caduti dalla parete del Corn da Camp (valutazione
difficile). (G. Bergier)
2015: Difficolta a definire il bordo del ghiacciaio sulla parte destra, tutta ricoperta da sassi e
blocchi di grande dimensione. (G. Bergier)
103 Bresciana
2014: Occorre segnalare che una superficie di 1.33 ha situata vicino a un affioramento roc-
cioso (vedi piano allegato) non e piu considerata collegata al resto del ghiacciaio (ghiaccio
morto), mentre lo era nel 2011. Sempre rispetto al 2011 si constata un arretramento medio
lungo tutto il fronte di ca. 30.7m. Se non si considera la superficie scomparsa, l’arretramento
medio corrisponde a 4.2m. L’arretramento piu importante si e verificato nella parte centrale
del fronte, quella piu ripida. (M. Soldati)
2015: Le nevicate di settembre hanno ricoperto il fronte e hanno impedito la misurazione del
2015. (M. Soldati)
131
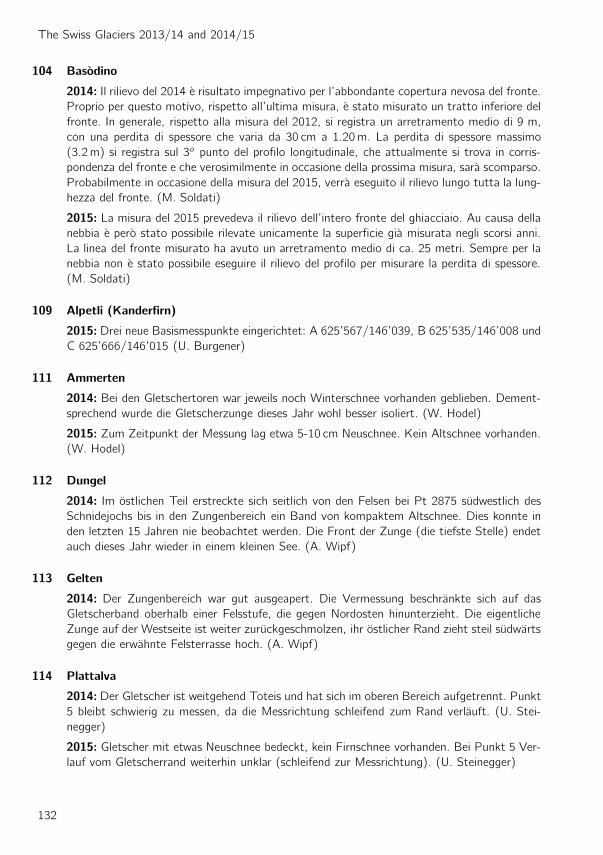
The Swiss Glaciers 2013/14 and 2014/15
104 Basodino
2014: Il rilievo del 2014 e risultato impegnativo per l’abbondante copertura nevosa del fronte.
Proprio per questo motivo, rispetto all’ultima misura, e stato misurato un tratto inferiore del
fronte. In generale, rispetto alla misura del 2012, si registra un arretramento medio di 9 m,
con una perdita di spessore che varia da 30 cm a 1.20m. La perdita di spessore massimo
(3.2m) si registra sul 3o punto del profilo longitudinale, che attualmente si trova in corris-
pondenza del fronte e che verosimilmente in occasione della prossima misura, sara scomparso.
Probabilmente in occasione della misura del 2015, verra eseguito il rilievo lungo tutta la lung-
hezza del fronte. (M. Soldati)
2015: La misura del 2015 prevedeva il rilievo dell’intero fronte del ghiacciaio. Au causa della
nebbia e pero stato possibile rilevate unicamente la superficie gia misurata negli scorsi anni.
La linea del fronte misurato ha avuto un arretramento medio di ca. 25 metri. Sempre per la
nebbia non e stato possibile eseguire il rilievo del profilo per misurare la perdita di spessore.
(M. Soldati)
109 Alpetli (Kanderfirn)
2015: Drei neue Basismesspunkte eingerichtet: A 625’567/146’039, B 625’535/146’008 und
C 625’666/146’015 (U. Burgener)
111 Ammerten
2014: Bei den Gletschertoren war jeweils noch Winterschnee vorhanden geblieben. Dement-
sprechend wurde die Gletscherzunge dieses Jahr wohl besser isoliert. (W. Hodel)
2015: Zum Zeitpunkt der Messung lag etwa 5-10 cm Neuschnee. Kein Altschnee vorhanden.
(W. Hodel)
112 Dungel
2014: Im ostlichen Teil erstreckte sich seitlich von den Felsen bei Pt 2875 sudwestlich des
Schnidejochs bis in den Zungenbereich ein Band von kompaktem Altschnee. Dies konnte in
den letzten 15 Jahren nie beobachtet werden. Die Front der Zunge (die tiefste Stelle) endet
auch dieses Jahr wieder in einem kleinen See. (A. Wipf)
113 Gelten
2014: Der Zungenbereich war gut ausgeapert. Die Vermessung beschrankte sich auf das
Gletscherband oberhalb einer Felsstufe, die gegen Nordosten hinunterzieht. Die eigentliche
Zunge auf der Westseite ist weiter zuruckgeschmolzen, ihr ostlicher Rand zieht steil sudwarts
gegen die erwahnte Felsterrasse hoch. (A. Wipf)
114 Plattalva
2014: Der Gletscher ist weitgehend Toteis und hat sich im oberen Bereich aufgetrennt. Punkt
5 bleibt schwierig zu messen, da die Messrichtung schleifend zum Rand verlauft. (U. Stei-
negger)
2015: Gletscher mit etwas Neuschnee bedeckt, kein Firnschnee vorhanden. Bei Punkt 5 Ver-
lauf vom Gletscherrand weiterhin unklar (schleifend zur Messrichtung). (U. Steinegger)
132
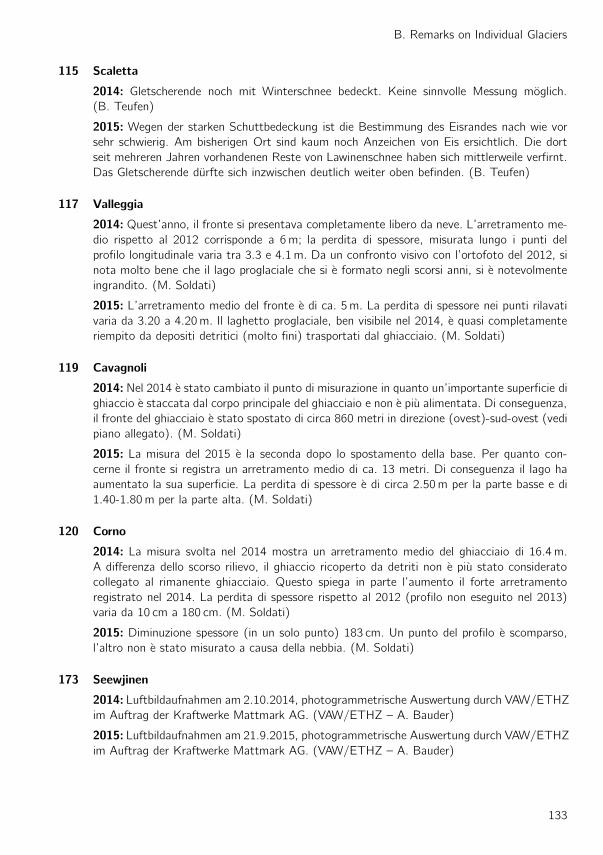
B. Remarks on Individual Glaciers
115 Scaletta
2014: Gletscherende noch mit Winterschnee bedeckt. Keine sinnvolle Messung moglich.
(B. Teufen)
2015: Wegen der starken Schuttbedeckung ist die Bestimmung des Eisrandes nach wie vor
sehr schwierig. Am bisherigen Ort sind kaum noch Anzeichen von Eis ersichtlich. Die dort
seit mehreren Jahren vorhandenen Reste von Lawinenschnee haben sich mittlerweile verfirnt.
Das Gletscherende durfte sich inzwischen deutlich weiter oben befinden. (B. Teufen)
117 Valleggia
2014: Quest’anno, il fronte si presentava completamente libero da neve. L’arretramento me-
dio rispetto al 2012 corrisponde a 6m; la perdita di spessore, misurata lungo i punti del
profilo longitudinale varia tra 3.3 e 4.1m. Da un confronto visivo con l’ortofoto del 2012, si
nota molto bene che il lago proglaciale che si e formato negli scorsi anni, si e notevolmente
ingrandito. (M. Soldati)
2015: L’arretramento medio del fronte e di ca. 5m. La perdita di spessore nei punti rilavati
varia da 3.20 a 4.20m. Il laghetto proglaciale, ben visibile nel 2014, e quasi completamente
riempito da depositi detritici (molto fini) trasportati dal ghiacciaio. (M. Soldati)
119 Cavagnoli
2014: Nel 2014 e stato cambiato il punto di misurazione in quanto un’importante superficie di
ghiaccio e staccata dal corpo principale del ghiacciaio e non e piu alimentata. Di conseguenza,
il fronte del ghiacciaio e stato spostato di circa 860 metri in direzione (ovest)-sud-ovest (vedi
piano allegato). (M. Soldati)
2015: La misura del 2015 e la seconda dopo lo spostamento della base. Per quanto con-
cerne il fronte si registra un arretramento medio di ca. 13 metri. Di conseguenza il lago ha
aumentato la sua superficie. La perdita di spessore e di circa 2.50m per la parte basse e di
1.40-1.80m per la parte alta. (M. Soldati)
120 Corno
2014: La misura svolta nel 2014 mostra un arretramento medio del ghiacciaio di 16.4m.
A differenza dello scorso rilievo, il ghiaccio ricoperto da detriti non e piu stato considerato
collegato al rimanente ghiacciaio. Questo spiega in parte l’aumento il forte arretramento
registrato nel 2014. La perdita di spessore rispetto al 2012 (profilo non eseguito nel 2013)
varia da 10 cm a 180 cm. (M. Soldati)
2015: Diminuzione spessore (in un solo punto) 183 cm. Un punto del profilo e scomparso,
l’altro non e stato misurato a causa della nebbia. (M. Soldati)
173 Seewjinen
2014: Luftbildaufnahmen am 2.10.2014, photogrammetrische Auswertung durch VAW/ETHZ
im Auftrag der Kraftwerke Mattmark AG. (VAW/ETHZ – A. Bauder)
2015: Luftbildaufnahmen am 21.9.2015, photogrammetrische Auswertung durch VAW/ETHZ
im Auftrag der Kraftwerke Mattmark AG. (VAW/ETHZ – A. Bauder)
133
The Swiss Glaciers 2013/14 and 2014/15
174 Hohlaub
2014: Luftbildaufnahmen am 2.10.2014, photogrammetrische Auswertung durch VAW/ETHZ
im Auftrag der Kraftwerke Mattmark AG. (VAW/ETHZ – A. Bauder)
2015: Luftbildaufnahmen am 21.9.2015, photogrammetrische Auswertung durch VAW/ETHZ
im Auftrag der Kraftwerke Mattmark AG. (VAW/ETHZ – A. Bauder)
352 Croslina
2014: Nel 2014 e stato cambiato il punto di misurazione in quanto un’importante superficie di
ghiaccio e staccata dal corpo principale del ghiacciaio e non e piu alimentata. Di conseguenza,
il fronte del ghiacciaio e stato spostato di circa 860 metri in direzione (ovest)-sud-ovest (vedi
piano allegato). (M. Soldati)
2015: Rispetto al 2014 perdita spessore ghiaccio compresa tra 210 e 295 cm. (M. Soldati)
134

C Investigators
C.1 Length Variation (2015)
Glacier No. Investigator
Albigna 116 AWN/GR, Martin Keiser
Allalin 11 VAW/ETHZ, Andreas Bauder
Alpetli (Kanderfirn) 109 KAWA/BE, Ueli Burgener
Ammerten 111 Walter Hodel
Arolla (Mont Collon) 27 DWL/VS, Francois Fellay
Basodino 104 SF/TI, Mattia Soldati
Bella Tola 21 currently not observed
Biferten 77 Hanspeter Klauser
Bluemlisalp 64 KAWA/BE, Ueli Burgener
Boveyre 41 DWL/VS, James Medico
Breney 36 Jean-Jacques Chabloz
Bresciana 103 SF/TI, Mattia Soldati
Brunegg (Turtmann) 20 DWL/VS, Alban Brigger
Brunni 72 AFJ/UR, Martin Planzer
Calderas 95 AWN/GR, Gian Andri Godly
Cambrena 99 AWN/GR, Gilbert Berchier
Cavagnoli 119 SF/TI, Mattia Soldati
Cheillon 29 DWL/VS, Olivier Bourdin
Corbassiere 38 VAW/ETHZ, Andreas Bauder
Corno 120 SF/TI, Mattia Soldati
Croslina 352 SF/TI, Mattia Soldati
Damma 70 AFJ/UR, Martin Planzer
Dungel 112 Andreas Wipf
Eiger 59 KAWA/BE, Ralf Schai
En Darrey 30 DWL/VS, Olivier Bourdin
Fee 13 DWL/VS, Urs Andenmatten
Ferpecle 25 DWL/VS, Francois Fellay
Fiescher 4 VAW/ETHZ, Andreas Bauder
Findelen 16 VAW/ETHZ, Andreas Bauder
Firnalpeli (Ost) 75 AWL/OW, Miriam Jaggi
Forno 102 AWN/GR, Martin Keiser
Gamchi 61 KAWA/BE, Roland Descloux
Gauli 52 KAWA/BE, Daniel Rohrer
Gelten 113 Andreas Wipf
135

The Swiss Glaciers 2013/14 and 2014/15
Glacier No. Investigator
Gietro 37 VAW/ETHZ, Andreas Bauder
Glarnisch 80 Hanspeter Klauser
Gorner 14 Stefan Walther
Grand Desert 31 DWL/VS, Francois Vouillamoz
Grand Plan Neve 45 FFN/VD, J.-Ph. Marletaz
Gries 3 VAW/ETHZ, Andreas Bauder
Griess 74 AFJ/UR, Beat Annen
Griessen 76 AWL/OW, Miriam Jaggi
Grosser Aletsch 5 VAW/ETHZ, Andreas Bauder
Hohlaub 174 VAW/ETHZ, Andreas Bauder
Hufi 73 currently not observed
Kaltwasser 7 DWL/VS, Martin Schmidhalter
Kehlen 68 AFJ/UR, Martin Planzer
Kessjen 12 VAW/ETHZ, Andreas Bauder
Lang 18 DWL/VS, Hans Henzen
Lavaz 82 AWN/GR, Renaldo Lutz
Lenta 84 AWN/GR, Bernard Riedi
Limmern 78 Urs Steinegger
Lischana 98 AWN/GR, G. C. Feuerstein
Lammern 63 KAWA/BE, Evelyn Coleman Brantschen
Mittelaletsch 106 currently not observed
Moiry 24 DWL/VS, Gabriel Chevalier
Moming 23 DWL/VS, Pascal Stoebener
Mont Durand 35 Jean-Jacques Chabloz
Mont Fort (Tortin) 32 DWL/VS, Francois Vouillamoz
Mont Mine 26 DWL/VS, Francois Fellay
Morteratsch 94 AWN/GR, Gian Andri Godly
Mutt 2 currently not observed
Oberaar 50 currently not observed
Oberaletsch 6 currently not observed
Oberer Grindelwald 57 VAW/ETHZ, Andreas Bauder
Otemma 34 Jean-Jacques Chabloz
Palu 100 AWN/GR, Gilbert Berchier
Paneyrosse 44 FFN/VD, J.-Ph. Marletaz
Paradies 86 AWN/GR, Cristina Fisler
Paradisino (Campo) 101 AWN/GR, Gilbert Berchier
Pizol 81 KFA/SG, Urban Kuhne
Plattalva 114 Urs Steinegger
Porchabella 88 AWN/GR, Thomas Bearth
Prapio 48 Jacques Binggeli
Punteglias 83 AWN/GR, Christian Buchli
Rhone 1 VAW/ETHZ, Andreas Bauder
Ried 17 DWL/VS, Peter Rovina
Roseg 92 AWN/GR, Gian Andri Godly
Rossboden 105 DWL/VS, Marco Gerold
Rotfirn (Nord) 69 AFJ/UR, Martin Planzer
136
C. Investigators
Glacier No. Investigator
Ratzli 65 VAW/ETHZ, Andreas Bauder
Saleina 42 DWL/VS, James Medico
Sankt Anna 67 AFJ/UR, Lukas Eggimann
Sardona 91 KFA/SG, Stefan Nigg
Scaletta 115 Bernardo Teufen
Schwarz 62 KAWA/BE, Evelyn Coleman Brantschen
Schwarzberg 10 VAW/ETHZ, Andreas Bauder
Seewjinen 173 VAW/ETHZ, Andreas Bauder
Sesvenna 97 AWN/GR, G. C. Feuerstein
Sex Rouge 47 Jacques Binggeli
Silvretta 90 VAW/ETHZ, Andreas Bauder
Stein 53 KAWA/BE, Daniel Rohrer
Steinlimi 54 KAWA/BE, Daniel Rohrer
Sulz 79 AW/GL, Stefan Kamm
Suretta 87 AWN/GR, Cristina Fisler
Tiatscha 96 VAW/ETHZ, Andreas Bauder
Tiefen 66 AFJ/UR, Lukas Eggimann
Trient 43 Jacques Ehinger
Trift (Gadmen) 55 VAW/ETHZ, Andreas Bauder
Tsanfleuron 33 DWL/VS, Francois Fellay
Tschierva 93 AWN/GR, Gian Andri Godly
Tschingel 60 KAWA/BE, Ralf Schai
Tseudet 40 DWL/VS, James Medico
Tsidjiore Nouve 28 DWL/VS, Francois Fellay
Turtmann 19 DWL/VS, Alban Brigger
Unteraar 51 currently not observed
Unterer Grindelwald 58 VAW/ETHZ, Andreas Bauder
Val Torta 118 currently not observed
Valleggia 117 SF/TI, Mattia Soldati
Valsorey 39 DWL/VS, James Medico
Verstankla 89 AWN/GR, Daniel Oertig
Vorab 85 AWN/GR, Matthias Kalberer
Wallenbur 71 AFJ/UR, Pius Klager
Zinal 22 DWL/VS, Gabriel Chevalier
Zmutt 15 currently not observed
AFJ/UR Amt fur Forst und Jagd, Uri
AWN/GR Amt fur Wald und Naturgefahren, Graubunden
AW/GL Abteilung Wald, Glarus
AWL/OW Amt fur Wald und Landschaft, Obwalden
DWL/VS Dienststelle fur Wald und Landschaft/Service des forets et du paysage,
Wallis/Valais
FFN/VD Service des forets, de la faune et de la nature, Vaud
KAWA/BE Amt fur Wald, Bern
KFA/SG Waldregion 3 Sargans, St. Gallen
SF/TI Sezione forestale, Ticino
VAW/ETHZ Versuchsanstalt fur Wasserbau, Hydrologie und Glaziologie, ETH Zurich
137
The Swiss Glaciers 2013/14 and 2014/15
C.2 Mass Balance and Velocity
Glacier No. Investigator
Allalin 11 VAW/ETHZ, Andreas Bauder
Basodino 104 Giovanni Kappenberger
Clariden 141 Giovanni Kappenberger, Urs Steinegger
Corbassiere 38 VAW/ETHZ, Andreas Bauder
Findelen 16 DGUF / GIUZ, Matthias Huss, Nadine Salz-
mann, Gwendolyn Leysinger-Vieli
Gietro 37 VAW/ETHZ, Andreas Bauder
Gries 3 VAW/ETHZ, Martin Funk
Grosser Aletsch 5 VAW/ETHZ, Andreas Bauder
Hohlaub 174 VAW/ETHZ, Andreas Bauder
Murtel 33 DGUF, Mauro Fischer
Pizol 81 VAW/ETHZ / DGUF, Matthias Huss
Plaine Morte 65 DGUF, Matthias Huss
Rhone 1 VAW/ETHZ, Andreas Bauder
Sankt Anna 67 DGUF, Mauro Fischer
Schwarzberg 10 VAW/ETHZ, Andreas Bauder
Silvretta 90 VAW/ETHZ, Andreas Bauder
Tsanfleuron 33 DGUF, Matthias Huss
C.3 Englacial Temperature
Site (Glacier) No. Investigator
Colle Gnifetti (Gorner) 14 DGUF, Martin Hoelzle
VAW/ETHZ Versuchsanstalt fur Wasserbau, Hydrologie und Glaziologie,
ETH Zurich
GIUZ Geographisches Institut, Universitat Zurich
DGUF Departement des Geosciences, Universite de Fribourg
138