the sustainable development goals in an arab …...sustainable development has generated great...
TRANSCRIPT

Economic and Social Commission for Western Asia
The Sustainable Development Goals in an Arab Region Affected by ConflictMonitoring the Sustainable Development Goals with Household Survey Microdata

E/ESCWA/ECRI/2017/3
Economic and Social Commission for Western Asia
The Sustainable Development Goals
in an Arab Region Affected by Conflict
Monitoring the Sustainable Development Goals
with Household Survey Microdata
United Nations
Beirut

© 2018 United Nations
All rights reserved worldwide
Photocopies and reproductions of excerpts are allowed with proper credits.
All queries on rights and licenses, including subsidiary rights, should be addressed to the United
Nations Economic and Social Commission for Western Asia (ESCWA), e-mail: publications-
The findings, interpretations and conclusions expressed in this publication are those of the authors
and do not necessarily reflect the views of the United Nations or its officials or Member States.
The designations employed and the presentation of material in this publication do not imply the
expression of any opinion whatsoever on the part of the United Nations concerning the legal status
of any country, territory, city or area or of its authorities, or concerning the delimitation of its
frontiers or boundaries.
Links contained in this publication are provided for the convenience of the reader and are correct at
the time of issue. The United Nations takes no responsibility for the continued accuracy of that
information or for the content of any external website.
References have, wherever possible, been verified.
Mention of commercial names and products does not imply the endorsement of the United Nations.
References to dollars ($) are to United States dollars, unless otherwise stated.
Symbols of United Nations documents are composed of capital letters combined with figures.
Mention of such a symbol indicates a reference to a United Nations document.
United Nations publication issued by ESCWA, United Nations House,
Riad El Solh Square, P.O. Box: 11-8575, Beirut, Lebanon.
Website: www.unescwa.org.
Photo credit:
Cover: © iStock.com

iii
Acknowledgments
The present study was written by Valentina
Calderón-Mejía and Fernando Cantú based on
recent household survey microdata for the Arab
region. The study was carried out under the
direction of Tarik Alami (Director, Emerging and
Conflict-related Issues Division) and Youssef
Chaitani (Chief, Conflict, Occupation and
Development Section), who provided critical
feedback at various stages of the research.
The team is also grateful for comments and
substantive inputs from Joaquín Salido-Marcos,
John Sloan, and George Willcoxon. Esteban
Arroba del Castillo, Belkacem Ayachi, Lubna
Ismail, Anastasia Janzer-Araji, Irina Levchenko
and Shogher Ohannessian provided
outstanding and tireless research assistance.


v
Executive Summary
The United Nations 2030 Agenda for
Sustainable Development has generated great
expectations for development progress. To
ensure that countries in the Arab region can
progress towards achieving the 17 Sustainable
Development Goals (SDGs) and their targets,
high-quality and disaggregated data are
required. They must be reliable and easy to use
for a large range of users, including decision
makers at all levels. Current data collection
efforts across the region fall short in terms of
tracking progress towards the Agenda. Better
data availability is crucial for designing public
policy across the Arab region, especially in
countries experiencing conflict and the
neighbouring countries affected.
While the infrastructure is in place to collect
microdata across the region, substantial efforts
are required to produce timelier and higher
quality data, including information on
populations touched by crises and conflicts.
Increased investment in data collection across
the region is required. The present report
provides guidance on how to leverage existing
data, so that it can be used better by
policymakers and academics. The regular
collection of micro-level data across countries is
possible because it is part of the existing
statistical infrastructure of most countries in the
region. The data are highly representative of
national populations; are collected at regular
intervals; and include measures of population
characteristics required for SDG indicator
disaggregation (Jeffers, 2018).
To illustrate the usefulness of those
surveys and their potential for SDG
monitoring and policy prioritisation in crisis-
and conflict-afflicted countries, the present
report presents extensive analyses of goals
and indicators at the subnational level
disaggregated by gender and urban/rural
area, which highlight priority areas for
interventions. The countries included in the
study were touched directly or indirectly by
conflict in recent years and face the most
pressing challenges for achieving the
SDGs. Indicators are calculated using data
from 2009 to 2014.
The authors of the present report advocate
continual collection of quality survey
data across the region, including conflict-
affected countries, as a tracking tool for
monitoring progress towards the 2030
Agenda. The report plays a key role in
identifying data gaps, because currently
available microdata have an abundance
of indicators for certain goals while offering
limited information for others. The present
report illustrates, in a concrete and informative
way, the importance of using microdata
for measuring and monitoring progress
towards achieving the goals and targets
of the 2030 Agenda.


vii
Contents
Page
Acknowledgments iii Executive Summary v Abbreviations and Acronyms xi Introduction 1
1. Measuring SDG Progress in Countries Experiencing Conflict (SDG 16) 11 A. Measuring violence 13 B. Peace and violence in the Arab region: baseline indicators 14 C. Conclusions 18
2. Measuring Poverty and Inequality in Crisis-afflicted Countries (SDG 1 and SDG 10) 19 A. Multidimensional poverty 21 B. Inequality and conflict 25 C. Conclusions 27
3. Measuring Nutrition and Health in Crisis-afflicted Countries (SDG 2 and SDG 3) 29 A. Measuring nutrition in crisis-afflicted countries (SDG 2) 31 B. Prevalence of undernourishment (underweight, wasting, stunting, and obesity) 32 C. Measuring health in crisis-afflicted countries (SDG 3) 37 D. Conclusions 45
4. Measuring Inclusive and Quality Education in Conflict Settings (SDG 4) 47 A. SDG 4 focuses on inclusive and quality education for all. It represents an improvement of the MDG on
education, which focused on increasing educational access, without including a measure of quality.
The SDGs represent the first attempt to focus on the quality of education worldwide 49 B. Ensure that all girls and boys have access to quality early childhood development, care
and pre-primary education so that they are ready for primary education 56 C. SDG 4: ensure equal access for all women and men to affordable and quality technical,
vocational and tertiary education, including university 58 D. SDG 4: ensure that all youth and a substantial proportion of adults, both men and women,
achieve literacy and numeracy 61 E. Conclusions 63
5. Living Standards and Conflict (SGD 6, SDG 7 and SDG 11) 65 A. SDG 6: ensure availability and sustainable management of water and sanitation for all 68 B. SDG7: ensure access to affordable, reliable, sustainable and modern energy for all 73 C. SDG 11: make cities and human settlements inclusive, safe, resilient and sustainable 77 D. SDG 9: promote inclusive and sustainable industrialisation and foster innovation 80 E. Conclusions 80

viii
6. Measuring Labour-Market Progress in Conflict Settings (SDG 8) 81 A. Introduction: the importance of employment for achieving SDG 8 83 B. Status of employment opportunities in Arab countries affected by conflict 84 C. Challenges and conclusions 91
7. Conclusion 93
Bibliography 97 Endnotes 103
List of Tables
Table 1. Tracking SDG progress with demographic surveys 5 Table 2. Tracking SDG progress with labour force surveys 6 Table 3. Summary of the SDG indicators‘ availability 8 Table 4. Severity of malnutrition by prevalence ranges in conflict-afflicted countries 34 Table 5. Labour indicators in urban and rural areas, for available countries and years 91 Table 6. Rank of labour indicators in largest city compared to the rest of the country 91
List of Figures
Figure 1. Arab countries affected by armed conflict, 2012 to 2016 (UCDP Georeferenced Event Dataset
(GED) Global version 18.1 (2017)) 15 Figure 2. Heatmap of conflict events in the Arab region, 2012-2016 (UCDP Georeferenced Event Dataset
(GED) Global version 18.1 (2017)) 16 Figure 3. Geographical distribution of conflict intensity by governorate in Iraq, Libya and Yemen, 2016
(UCDP Georeferenced Event Dataset) 17 Figure 4. Geographical distribution of conflict intensity by governorate in Iraq, 2016 (IBC) 18 Figure 5. Multidimensional poverty headcounts 22 Figure 6. Multidimensional poverty in Egypt (Cluster 1), Iraq (Cluster 2), and Yemen (Cluster 3) 23 Figure 7. Gini coefficient for Jordan and Yemen 26 Figure 8. Prevalence of underweight for children 0-59 months 32 Figure 9. Prevalence of wasting for children 0-59 months 33 Figure 10. Prevalence of stunting for children 0-59 months 34 Figure 11. Prevalence of stunting for children 0-59 months at the subnational level for Yemen and Egypt 35 Figure 12. Prevalence of obesity for children 0-59 months 37 Figure 13. Neonatal and child mortality 38 Figure 14. Proportion of births attended by skilled health personnel 40 Figure 15. Met need for family planning satisfied 41 Figure 16. Met need for family planning, across age groups 41 Figure 17. Female genital mutilation, by area and wealth quintile 42 Figure 18. Female genital mutilation across age groups 42 Figure 19. DTP3 vaccination coverage 43 Figure 20. Population under 15 years of age in conflict-affected countries 50 Figure 21. Population aged 15 and over without education, by area and gender 51 Figure 22. Youth aged 15 to 24 without education, by area and gender 51 Figure 23. Age enrolment profile for Yemen 53 Figure 24. Percentage of grade 2 students who could perform simple reading or math tasks in Iraq and Yemen 55 Figure 25. Gross enrolment rates in pre-primary—regional comparison, 2011 56

ix
Figure 26. Early childhood education attendance 57 Figure 27. Violent discipline 58 Figure 28. Women’s literacy rates 59 Figure 29. Women with tertiary education 60 Figure 30. Parity indices in primary and secondary school 60 Figure 31. PISA Score and Ranking 62 Figure 32. PISA Score and Ranking for Lebanon 2015 63 Figure 33. Access to improved sources of drinking water by wealth quintile 68 Figure 34. Access to improved sanitation and hand-wash facility with soap and water 71 Figure 35. Access to improved sanitation facilities in Yemen, by governorate and area of residence 71 Figure 36. Population with access to electricity and primary reliance on clean fuels 73 Figure 37. Access to electricity and primary reliance on clean fuels in the Sudan and Iraq 74 Figure 38. Access to electricity across governorates in the Sudan 75 Figure 39. Access to electricity across governorates in Tunisia 75 Figure 40. Access to electricity across governorates in the Sudan, by area of residence 76 Figure 41. Primary reliance on clean fuels across governorates in the Sudan, by area of residence 76 Figure 42. Primary reliance on clean fuels across governorates in Iraq 77 Figure 43. Population living with dirt floors and in overcrowded households 78 Figure 44. Households with dirt floors across Yemen’s governorates 79 Figure 45. Households covered by a mobile phone network 79 Figure 46. Unemployment, Employment-to-population ratio, and Labour force participation 85 Figure 47. Unemployment for the male population in Tunisia and Yemen 86 Figure 48. Female labour-force participation rates across governorates in Egypt and Iraq 87 Figure 49. Proportion of youth (15-24 years) not in education, employment or training 88 Figure 50. Public Sector employment in Arab States in conflict 89
List of Boxes
Box 1. Sudan: striking subnational disparities and the overlap of poverty and conflict 24 Box 2. Perceptions of inequality in Arab countries 27 Box 3. Stunting prevalence in Iraq 36 Box 4. Child mortality in Egypt 39 Box 5. Vaccination in Jordan 44 Box 6. School enrolment rates in the Syrian Arab Republic during the pre-conflict period 54 Box 7. Water accessibility in the State of Palestine 69 Box 8. Open defecation in the Sudan and Yemen 72


xi
Abbreviations and Acronyms
ERC Economic Research Forum
DHS demographic and health survey
DTP3 diphtheria-tetanus-pertussis (DTP3)
ESCWA Economic and Social Commission for Western Asia
GDP gross domestic product
GED UCDP Georeferenced Event Dataset
HHIES harmonized household income and expenditure surveys
IAEG-SDGs The Inter-Agency and Expert Group on Sustainable Development Goal Indicators
IBC Iraq Body Count project
IDPs internally displaced persons
IIASA International Institute for Applied Systems Analysis
ISIL/ISIS Islamic State of Iraq and the Levant/Islamic State of Iraq and Syria
LDC least developed country
MAR missing at random
MDGs Millennium Development Goals
MICS Multiple Cluster Indicator Survey
MENA Middle East and North Africa
PRIO Peace Research Institute Oslo
PTS Political Terror Scale
SDGs Sustainable Development Goals
UCDP Uppsala Conflict Data Program
UN United Nations
UNESCO United Nations Educational, Scientific and Cultural Organization
UNFPA United Nations Population Fund
UNICEF United Nations Children’s Fund

xii
UNDP United Nations Development Programme
UNHCR United Nations High Commissioner for Refugees
UNRWA United Nations Relief Works Agency for Palestine Refugees in the Near East
USAID United States Agency for International Development
VIP ventilated improved pit
WHO World Health Organization

Introduction


3
Introduction
The United Nations Sustainable Development
Goals (SDGs) were developed to promote
prosperity around the world, and to strengthen
universal peace and freedom. That ambitious
agenda for sustainable development comes at a
time when the Arab region is at a crossroads.
Conflict has been a major obstacle towards
development, and that fact should take centre stage
for the realisation of the 2030 Agenda for
Sustainable Development. Conflict and political
unrest have halted or reversed the development
progress made during previous decades in the
Arab region. The conflicts across the region have an
impact on all aspects of development: increasing
poverty, hunger and malnutrition; limiting access to
education and other basic services; and increasing
social discrimination and exclusion.
The 2030 Agenda stresses the importance of
quality, accessible, timely and reliable
disaggregated data to measure progress and to
ensure that no one is left behind. It also states
that data and information from existing reporting
mechanisms should be used wherever possible.
The purpose of the present report is to provide a
situational analysis and to highlight key facts and
messages that provide a fair synopsis of how
things stand today, at the beginning of the 15-
year agenda. In doing so, selected targets were
estimated using different sources of microdata
for countries across the region.
One of the flaws of the Millennium
Development Goals (MDGs) was a deficiency in
identifying important inequalities between and
within countries, which in turn failed to foresee
the socioeconomic pressures associated with
the Arab uprisings of 2011. The 2030 Agenda
emphasises the need to improve the indicators
and the quality of data and statistics required to
understand the challenges for development.
A dilemma exists concerning the fact that data
availability is usually weakest for the world’s
poorest countries, which need such data most in
the context of monitoring sustainable
development (UNCTAD, 2016a). That leads to a
second point. The cost of implementing the
2030 Agenda will be significant. To provide
policymakers around the region with the
information they need to inform their decisions,
a lot of investment is required in data collection
and processing. That investment in data
infrastructure would require additional
resources but would yield returns comprising a
broader knowledge base and, ultimately, more
efficient policymaking.
Therefore, reliable figures to evaluate how
conflict has affected prosperity goals should be
a priority for countries in the region. The
present report will serve as a road map for
monitoring progress towards peace and
development in the Arab region. The micro-level
indicators will ensure the accountability of
countries for achieving the SDGs. The report is
divided into six chapters, mapped to 12 of the
17 SDGs, presenting figures based on microdata

4
that could serve as the most relevant indicators
to measure progress towards the 2030 Agenda.
The point of departure for the indicators is the
Report of the Inter-Agency and Expert Group on
Sustainable Development Indicators, presented
at the 47th session of the Statistical Commission
(E/CN.3/2016/2/Rev.1). All indicators are
disaggregated by relevant descriptors. They
include, but are not limited to, gender,
children/young/adults, urban/rural, and
estimates at subnational levels or according to
other geographical divisions.
Monitoring the Sustainable Development Goals (SDGs) with household survey microdata
The 2030 Agenda proposed 17 goals and 169
targets that aim to improve and complete the
Millennium Development Goals (MDGs). While
the MDGs are narrow in focus, the SDGs tackle
a range of issues, from gender inequality to
climate change. The unifying thread throughout
the goals and targets is the commitment to
ending poverty. The preamble of the Agenda
document says: “Eradicating poverty in all its
forms and dimensions, including extreme
poverty, is the greatest global challenge and an
indispensable requirement for sustainable
development.” (A/RES/70/1). While the SDGs
propose a more ambitious agenda for
sustainable development, they imply a greater
need for disaggregated indicators that measure
progress among different demographic and
social groups at various levels of subnational
geography. The present report aims to produce
updated indicators at the subnational level
disaggregated by gender and urban/rural area
for countries directly and indirectly touched by
conflict across the Arab region.
Collecting better and more timely data for all
countries in the region will almost certainly be
necessary to monitor progress towards
sustainable development. The regular collection
of micro-level data across countries in the
region would be eased by the fact that such data
collection is part of the existing statistical
infrastructure of most countries in the region
already. Those data are highly representative of
national populations; are collected at regular
intervals; and include measures of the
population characteristics required for SDG
indicator disaggregation (Jeffers, 2018).
In the present study, we use Multiple Cluster
Indicator Survey (MICS), Demographic and
Health Survey (DHS), Pan Arab Project for Family
Health (PAPFAM), and national labour force
survey data to measure some of the SDG goals
and targets as defined by the United Nations, for
nine countries in the Arab region. The countries
included in the study have been touched directly
or indirectly by conflict in recent years and have
the most pressing challenges for achieving the
sustainable development agenda. Our analysis
shows that disaggregation of national trends
highlights disparities at the subnational level, a
situation that countries need to address to
promote sustainable and inclusive growth. MICS
and DHS data provide internationally
comparable, statistically rigorous data about
children and women. The data include variables
representing a broad range of population
characteristics, including fertility, nuptiality, life-
course transitions, migration, disability,
education, and household composition. Those
surveys are conducted at regular intervals,
commonly every five years or so, and are usually
available with reference to multiple years for
most countries in the Arab region.

5
Table 1. Tracking SDG progress with demographic surveys
Country Survey name
Start of
survey
End of
survey
Number of
households
Number of
individuals Agencies involved
Egypt Demographic &
Health Survey
(DHS)
Apr-14 Jun-
14
28,175 120,276 Ministry of Health and Population,
El-Zanaty and Associates, The
DHS Program, ICF International
Iraq Multiple
Indicator
Cluster Survey
(MICS)
Feb-11 May-
11
36,592 238,327 UNICEF, Central Organisation for
Statistics & Information
Technology, Kurdistan Regional
Statistics Office, Ministry of
Health
Jordan Demographic &
Health Survey
(DHS)
Jan-12 Dec-
12
15,190 80,822 Department of Statistics, ICF
International
State of
Palestine
Multiple
Indicator
Cluster Survey
(MICS)
Feb-14 Apr-14 11,125 56,197 UNICEF, Palestinian Central
Bureau of Statistics
Sudan Multiple
Indicator
Cluster Survey
(MICS)
Aug-14 Nov-
14
9,671 97,049 UNICEF, Central Bureau of
Statistics
Tunisia Multiple
Indicator
Cluster Survey
(MICS)
Dec-11 Apr-12 9,600 38,861 UNICEF, Ministère du
Développement et de la
Coopération internationale,
Institut National de la Statistique
Yemen Demographic &
Health Survey
(DHS)
Jan-13 Dec-
13
17,351 120,923 Central Statistical Organisation,
Ministry of Public Health &
Population
Syrian
Arab
Republic
Pan Arab
Project for
Family Health
(PAPFAM)
Nov-09 Apr-10 27,385 127,733 League of Arab States, AGFUND,
UNFPA, OPEC Fund for
International Development, WHO,
IOMS, UNICEF, IPPF, ESCWA and
UN Women
Libya Pan Arab
Project for
Family Health
(PAPFAM)
Jan-14 Mar-
14
21,297 101,872 League of Arab States, AGFUND,
UNFPA, OPEC Fund for
International Development, WHO,
IOMS, UNICEF, IPPF, ESCWA and
UN Women
Source: ICF. 2011-2014. Demographic and Health Surveys (DHS) [Datasets]. Funded by USAID. Rockville, Maryland: ICF. United Nations Children’s Fund (UNICEF). 2011-2014. Multiple Indicator Cluster Surveys (MICS) [Datasets], supported by national statistical offices. League of Arab States. 2009-2014.Dataset Records for Pan Arab Project for Family Health (PAPFAM) [Datasets], supported by UNFPA, WHO and UNICEF.

6
Table 2. Tracking SDG progress with labour force surveys
Country Survey Year
Number of
households
Number of
individuals Producers and funders
Egypt Labour Force
Survey (LFS)
2014 85,668 353,340 Central Agency for Public Mobilisation
and Statistics (CAPMAS), Economic
Research Forum (ERF)
Iraq Iraq Household
Socioeconomic
Survey (I-HSES)
2012-2013 25,488 176,042 Central Statistical Organisation (CSO),
Kurdistan Regional Statistics Office
(KRSO), Economic Research Forum (ERF),
World Bank (WB)
Jordan Employment and
Unemployment
Survey
2014 48,436 216,608 Department of Statistics, the Hashemite
Kingdom of Jordan, Economic Research
Forum (ERF)
State of
Palestine
Labour Force
Survey (LFS)
2014 25,735 100,745 Palestinian Central Bureau of Statistics
(PCBS), Palestinian National Authority,
Economic Research Forum (ERF)
Tunisia National Survey
on Population
and Employment
2013 120,339 472,233 National Institute of Statistics, Economic
Research Forum (ERF)
Yemen Labour Force
Survey (LFS)
2013-2014 12,663 85,850 Central Statistical Organization (CSO), ILO
Regional Office for Arab States and Social
Fund for Development (SFD), Ministry of
Social Affairs and Labour and Ministry of
Planning and International Cooperation.
Source: Data for all surveys were provided by the Economic Research Forum, 2016.
Access to the data is public, and is widely
available for policymakers, researchers and
students worldwide, free of charge, through an
online dissemination system. The principal
advantage of MICS and DHS surveys is the
reconciliation of methodologies across
countries. The Pan Arab Project for Family
Health (PAPFAM) embraces several cross-
country national studies in the Arab Region,
using, consistent survey methodologies and
interview schedule templates, and are
conducted with the support of UNFPA, WHO
and UNICEF. We present measures calculated
using data from 2009 to 2014 to illustrate the
usefulness of the surveys for tracking
development across countries in the region and
establishing baseline measures for monitoring
SDG progress at a subnational level, for nine
countries in the region.
The authors of the present report advocate the
continual collection of quality survey data
across the region as a tracking tool for
monitoring progress towards the 2030 Agenda,
especially for conflict-affected countries. We
add to our analysis with labour force survey
data from the region provided by the Economic
Research Forum (ERF) as Harmonized
Household Income and Expenditure Surveys
(HHIES). Those surveys are available for seven
out of the nine countries analysed in the
current report, from 2012 to 2014.

7
The enormous data demands arising from the
SDGs cannot be met using national aggregate
data alone. A large variety of data sources
must be used to compile a successful tracking
instrument for sustainable development in
countries afflicted by conflict in the Arab
region. Timely and representative microdata
are of the foremost importance in
understanding the challenges of the 2030
Agenda. While most countries collect such data
periodically, greater efforts are needed to
continue collecting good-quality data that
show how different populations are affected by
conflict. Those data provide benchmarks to
measure subsequent progress at different
levels of disaggregation that allow for
exploration of the links and interconnectedness
across goals and targets.
The present report tries to be as
comprehensive as possible, but the indicators
produced from microdata for the countries do
not represent the entirety of indicators. The
present report plays a key role in identifying
data gaps, because currently available
microdata have an abundance of indicators for
certain goals while offering only limited
information for others. Finally, the present
report demonstrates the importance of using
microdata for measuring and monitoring
progress towards the 2030 Agenda.
The selection of goals and indicators
discussed in the present report reflects the
availability of microdata for the selected group
of countries in the region. In the report, we
present indicators that can be produced using
existing surveys, tracking 12 of the 17 SDGs.
The report presents suggested use of
microdata from those surveys to produce
baselines to track progress towards the
Agenda. Given the richness of the data, the
present report is not exhaustive but, rather,
highlights important challenges and
interconnectedness across goals and
indicators for crisis-affected countries in the
region. The report discusses 47 indicators that
touch on 12 of the 17 SDGs. Those indicators
are further disaggregated subnationally by
gender and area.
The report is organized into six chapters.
Chapter 1 shows how we measure conflict in
different countries across the region, focusing
on indicators suggested by SDG 16. Chapter 2
sets the scene at the start of the 2030 Agenda
in relation to eradicating poverty and
promoting prosperity in the conflict context,
mapping SDG 1. Chapter 3 touches on some of
the aspects of SDG 2 and SDG 3, to end
hunger, improve nutrition, and promote better
health in conflict-affected countries. Chapter 4
shows how to use microdata to measure
inclusive and quality education for selected
countries, touching on SDG 4. Chapter 5
applies indicators related to living standards
and household characteristics, corresponding
with SDG 6, SDG 7 and SDG 11. Chapter 6
discusses labour markets for the selected
countries in the region, touching on SDG 8.
Throughout the report, conflict, gender and
inequality are treated as issues interconnected
to all other goals (SDG 5, SDG 10 and SDG 16).
The full list of goals, targets and surveys
presented in the present report is given below.
The baseline indicators provide an important
context for implementing the Agenda in
countries across the Arab region, particularly
those facing challenges associated with
political unrest and conflict.

8
Table 3. Summary of the SDG indicators‘ availability
Countries Egypt Iraq Jordan Libya
State of
Palestine
Syrian
Arab
Republic Sudan Tunisia Yemen
SDG Indicators
● Available
● Incomplete
● Not available Na
tio
na
l
Go
vern
ora
te
Na
tio
na
l
Go
vern
ora
te
Na
tio
na
l
Go
vern
ora
te
Na
tio
na
l
Go
vern
ora
te
Na
tio
na
l
Go
vern
ora
te
Na
tio
na
l
Go
vern
ora
te
Na
tio
na
l
Go
vern
ora
te
Na
tio
na
l
Go
vern
ora
te
Na
tio
na
l
Go
vern
ora
te
CHAPTER 2: POVERTY
Goal 1: No Poverty
MPI ● ● ● ● ● ● ● ● ● ● ● ● ● ● ● ● ● ●
CHAPTER 3: Health
Goal 2: Zero Hunger
Stunting prevalence ● ● ● ● ● ● ● ● ● ● ● ● ● ● ● ● ● ●
Severe stunting
prevalence
● ● ● ● ● ● ● ● ● ● ● ● ● ● ● ● ● ●
Wasting prevalence ● ● ● ● ● ● ● ● ● ● ● ● ● ● ● ● ● ●
Severe wasting
prevalence
● ● ● ● ● ● ● ● ● ● ● ● ● ● ● ● ● ●
Underweight
prevalence
● ● ● ● ● ● ● ● ● ● ● ● ● ● ● ● ● ●
Severe underweight
prevalence
● ● ● ● ● ● ● ● ● ● ● ● ● ● ● ● ● ●
Goal 3: Good Health and
well-being
Overweight
prevalence
● ● ● ● ● ● ● ● ● ● ● ● ● ● ● ● ● ●
Immunization ● ● ● ● ● ● ● ● ● ● ● ● ● ● ● ● ● ●
Under-five mortality
rate
● ● ● ● ● ● ● ● ● ● ● ● ● ● ● ● ● ●
Neonatal mortality
rate
● ● ● ● ● ● ● ● ● ● ● ● ● ● ● ● ● ●
Skilled attendant at
delivery
● ● ● ● ● ● ● ● ● ● ● ● ● ● ● ● ● ●
Met need ● ● ● ● ● ● ● ● ● ● ● ● ● ● ● ● ● ●
Female genital
mutilation
● ● ● ● ● ● ● ● ● ● ● ● ● ● ● ● ● ●
Violent discipline ● ● ● ● ● ● ● ● ● ● ● ● ● ● ● ● ● ●
Use of tobacco ● ● ● ● ● ● ● ● ● ● ● ● ● ● ● ● ● ●
Fertility (15-19 years) ● ● ● ● ● ● ● ● ● ● ● ● ● ● ● ● ● ●
Fertility (10-14 years) ● ● ● ● ● ● ● ● ● ● ● ● ● ● ● ● ● ●
Women and girls
(15 +) subjected to
physical, sexual or
psychological
violence
● ● ● ● ● ● ● ● ● ● ● ● ● ● ● ● ● ●
Sexual violence ● ● ● ● ● ● ● ● ● ● ● ● ● ● ● ● ● ●
Early marriage (before
age 15)
● ● ● ● ● ● ● ● ● ● ● ● ● ● ● ● ● ●
Early marriage
(before age 18)
● ● ● ● ● ● ● ● ● ● ● ● ● ● ● ● ● ●
CHAPTER 4: EDUCATION
Goal 4: Quality education

9
Countries Egypt Iraq Jordan Libya
State of
Palestine
Syrian
Arab
Republic Sudan Tunisia Yemen
SDG Indicators
● Available
● Incomplete
● Not available Na
tio
na
l
Go
vern
ora
te
Na
tio
na
l
Go
vern
ora
te
Na
tio
na
l
Go
vern
ora
te
Na
tio
na
l
Go
vern
ora
te
Na
tio
na
l
Go
vern
ora
te
Na
tio
na
l
Go
vern
ora
te
Na
tio
na
l
Go
vern
ora
te
Na
tio
na
l
Go
vern
ora
te
Na
tio
na
l
Go
vern
ora
te
Early child
development index
● ● ● ● ● ● ● ● ● ● ● ● ● ● ● ● ● ●
Attendance to early
childhood education
● ● ● ● ● ● ● ● ● ● ● ● ● ● ● ● ● ●
School enrolment
school aged children
0-17
● ● ● ● ● ● ● ● ● ● ● ● ● ● ● ● ● ●
Average years of
schooling population
25+
● ● ● ● ● ● ● ● ● ● ● ● ● ● ● ● ● ●
Women in tertiary
education
● ● ● ● ● ● ● ● ● ● ● ● ● ● ● ● ● ●
Parity indices
(female/male,
rural/urban,
bottom/top wealth
quintile)
● ● ● ● ● ● ● ● ● ● ● ● ● ● ● ● ● ●
Education parity
indices (Gender
Parity)
● ● ● ● ● ● ● ● ● ● ● ● ● ● ● ● ● ●
Population with
education (Total: 15+)
● ● ● ● ● ● ● ● ● ● ● ● ● ● ● ● ● ●
Youth with education
(aged 15-24)
● ● ● ● ● ● ● ● ● ● ● ● ● ● ● ● ● ●
Population without
education (Total: 15+)
● ● ● ● ● ● ● ● ● ● ● ● ● ● ● ● ● ●
Youth without
education
(aged 15-24)
● ● ● ● ● ● ● ● ● ● ● ● ● ● ● ● ● ●
Women's literacy
rates; Total (15+) &
youth (15-24)
● ● ● ● ● ● ● ● ● ● ● ● ● ● ● ● ● ●
CHAPTER 5:
HOUSEHOLD
CHARACTERISTICS
Goal 6: Clean water and
sanitation
Improved sources of
drinking water
● ● ● ● ● ● ● ● ● ● ● ● ● ● ● ● ● ●
Improved sanitation ● ● ● ● ● ● ● ● ● ● ● ● ● ● ● ● ● ●
Handwashing facility
with water and soap
● ● ● ● ● ● ● ● ● ● ● ● ● ● ● ● ● ●
Goal 7: Affordable and
clean energy
Access to electricity ● ● ● ● ● ● ● ● ● ● ● ● ● ● ● ● ● ●
Primary reliance on
clean fuels
● ● ● ● ● ● ● ● ● ● ● ● ● ● ● ● ● ●

10
Countries Egypt Iraq Jordan Libya
State of
Palestine
Syrian
Arab
Republic Sudan Tunisia Yemen
SDG Indicators
● Available
● Incomplete
● Not available Na
tio
na
l
Go
vern
ora
te
Na
tio
na
l
Go
vern
ora
te
Na
tio
na
l
Go
vern
ora
te
Na
tio
na
l
Go
vern
ora
te
Na
tio
na
l
Go
vern
ora
te
Na
tio
na
l
Go
vern
ora
te
Na
tio
na
l
Go
vern
ora
te
Na
tio
na
l
Go
vern
ora
te
Na
tio
na
l
Go
vern
ora
te
Goal 11: Sustainable
cities and communities
Proportions of urban
population
● ● ● ● ● ● ● ● ● ● ● ● ● ● ● ● ● ●
Population living in
inadequate housing
● ● ● ● ● ● ● ● ● ● ● ● ● ● ● ● ● ●
Access to internet ● ● ● ● ● ● ● ● ● ● ● ● ● ● ● ● ●
Mobile phone ● ● ● ● ● ● ● ● ● ● ● ● ● ● ● ● ● ●
CHAPTER 6:
PROSPERITYAND
LABOUR
Goal 8: Decent work and
clean energy
Child labour ● ● ● ● ● ● ● ● ● ● ● ● ● ● ● ● ● ●
The report is accompanied by two online
appendices. The first one is a compilation of
indicators in the table above at the national and
subnational levels, further disaggregated by
gender and area of residence. The second online
appendix presents a series of statistical codes
that could help replicate the estimates for each
indicator in each of the nine countries studied.

1. Measuring SDG Progress in Countries Experiencing Conflict (SDG 16)


13
1. Measuring SDG Progress in Countries
Experiencing Conflict (SDG 16)
A. Measuring violence
Violence is a negative shock that affects all
aspects of development. In addition to killing
and injuring people directly, it can, depending
on its type and intensity, severely damage social
and productive infrastructure; affect the
implementation of programmes and policy
interventions; divert resources into the security
sector; disrupt livelihoods; force people to flee
their homes; and create conditions that affect
public health, among many other detrimental
consequences. Beyond its short-term impact,
violence also harms human development and
skill accumulation, with detrimental long-term
consequences that are difficult to reverse
(ESCWA, 2018).
Because of its pervasive impact, violence should
be monitored, along with its effects on
sustainable development. Ideally, household
surveys and other statistical instruments should
be adapted to identify the victims of violence
and the aspects of their lives most affected.
Surveys should provide consistent and reliable
information to understand “how violence has
affected different people, communities and
population groups, the nature and intensity of
the effects, the channels through which violence
may affect welfare and behaviour, and how
violence transforms society socially and
politically” (Brück and others, 2013).
Unfortunately, that is frequently not the case;
surveys often miss that opportunity, even when
they are undertaken during or immediately after
a period of conflict or other forms of violence.1
Because of the data gap that results, most
indicators of violence are based on standard
measures at the macro level.
The monitoring of violence is complicated and
diverse by its very nature. It often encompasses
social tensions and lack of safety at
neighbourhood level, all the way to armed
internal conflict and wars between States. There
is no single measure that covers all the
dimensions of violence and absence of peace.
The indicators proposed by the Inter-Agency
and Expert Group on Sustainable Development
Goal Indicators (IAEG-SDGs) associated with
SDG 16 partially refer to the multidimensionality
of violence by including variables related to
crime, intensity of armed conflict, and
perception of security. However, those variables
do not cover the entire spectrum of violence.
We advocate additional sources of information
that could complement the original indicators
and provide a more comprehensive and
accurate overview of violence in the region.
Violence, when it originates from armed
conflict, is inevitably linked to the political and
security situation of countries. Data providers
must make decisions about the definition of

14
conflict, the actors involved, and the
measurement of intensity. Although those
factors could be controversial and give rise to
diverging opinions, the goal of the exercise is
neither to discuss the roots and dynamics of
conflicts nor their typology but, rather, to study
the effect of violence on human development.
Only well known, international databases of
conflict are used. Their inclusion in the present
report does not imply any endorsement by the
United Nations. The visualisations indicate the
sources and definitions of all indicators.
B. Peace and violence in the Arab region: baseline indicators
The present section illustrates the situation in
the Arab region according to several data
sources that measure different dimensions of
violence. It covers different assessments of
armed conflict, political violence, terrorism, and
violent crime. To have an overview of recent
events, while minimising short-term
fluctuations, all data presented are for the most
recent five-year period (2012 to 2016), unless
otherwise indicated.
Armed conflict
One of the most widely used definitions of
armed conflict comes from the Uppsala Conflict
Data Programme (UCDP) and the International
Peace Research Institute Oslo (PRIO).
According to that definition, armed conflict
is a “a contested incompatibility that concerns
government and/or territory where the use of
armed force between two parties, of which at
least one is the government of a state, results in
at least 25 battle-related deaths in a calendar
year.” (UCDP and PRIO, 2017) Armed conflicts
are subdivided by intensity: those that result in
at least 25 but fewer than 1,000 battle-related
deaths per calendar year are considered minor
conflicts; those conflicts with 1,000 or more
battle-related deaths per year are considered
major conflicts. The unit of observation,
according to that definition, is the actual armed
confrontation between two parties (plus other
secondary actors, if relevant) at a given location,
during a certain period.2 A country is considered
to be affected by conflict if at least one
incidence of conflict occurred inside its territory
during a given period. That process is applied in
a consistent and transparent manner for
countries worldwide.3
Applying the UCDP/PRIO definition of armed
conflict to the Arab region creates the map in
figure 1, which shows the countries of the
region according to the incidence of minor and
major conflict during the period 2012 to 2016.
Of the 22 Arab states, seven suffered at least
one episode of major conflict during that
period, while four additional countries
experienced conflicts of minor intensity. In
other words, half the countries of the Arab
region have been affected by conflict recently,
according to the UCDP/PRIO definition. It must
be noted that, in some cases, for example
Jordan and Lebanon, the conflicts are a direct
consequence of neighbouring violence or
terrorism. That demonstrates how armed
conflict can extend beyond national borders
and affect entire regions.

15
Figure 1. Arab countries affected by armed conflict, 2012 to 2016 (UCDP Georeferenced Event
Dataset (GED) Global version 18.1 (2017))
Source: ESCWA calculations based on data from UCDP georeferenced event Dataset (GED), Global version 18.1 (2017). Available at http://ucdp.uu.se/downloads (accessed on 10 June 2018).
Notes: The map shows the Arab countries according to the location (and not origin of the actors) of armed conflict during the years 2012 to 2016. The
source defines conflict as a contested incompatibility that concerns government and/or territory where the use of armed force between two parties results in a certain number of battle-related deaths during a calendar year. Minor conflict: at least one conflict with 25 to 999 battle-related deaths per year between 2012 and 2016. Major conflict: at least one conflict of 1,000 or more battle-related deaths per year between 2012 and 2016. The boundaries and names shown, and the designations used on the map, do not imply official endorsement or acceptance by the United Nations.
The cases of Jordan and Lebanon cited above
highlight one of the disadvantages of the UCDP-
PRIO Armed Conflict Dataset, which provides
information only at country level. Also, violence
might be concentrated in small areas while the
rest of the national territory remains unaffected.
To bridge that gap, the UCDP compiles another
dataset: The Georeferenced Event Dataset. In
that dataset, an event is defined as “an incident
where armed force is used by an organised
actor against another organised actor, or
against civilians, resulting in at least one direct
death at a specific location and a specific date”
(Croicu and Ralph, 2017). There are three main
differences from the previous database: First,
the definition of conflict is broader. It considers
16
all incompatibilities, irrespective of whether
or not a government is involved, and the
threshold is lowered to one battle-related
death.4 Second, the unit of observation is the
conflict event, although both datasets are
compatible. Third, the information is fully
geocoded at maximum spatial resolution,
not only at the country level. One important
disadvantage of that source for the Arab region,
however, is that it currently excludes the
Syrian Arab Republic because of consistency
and clarity issues.5 Future data releases might
close that gap.
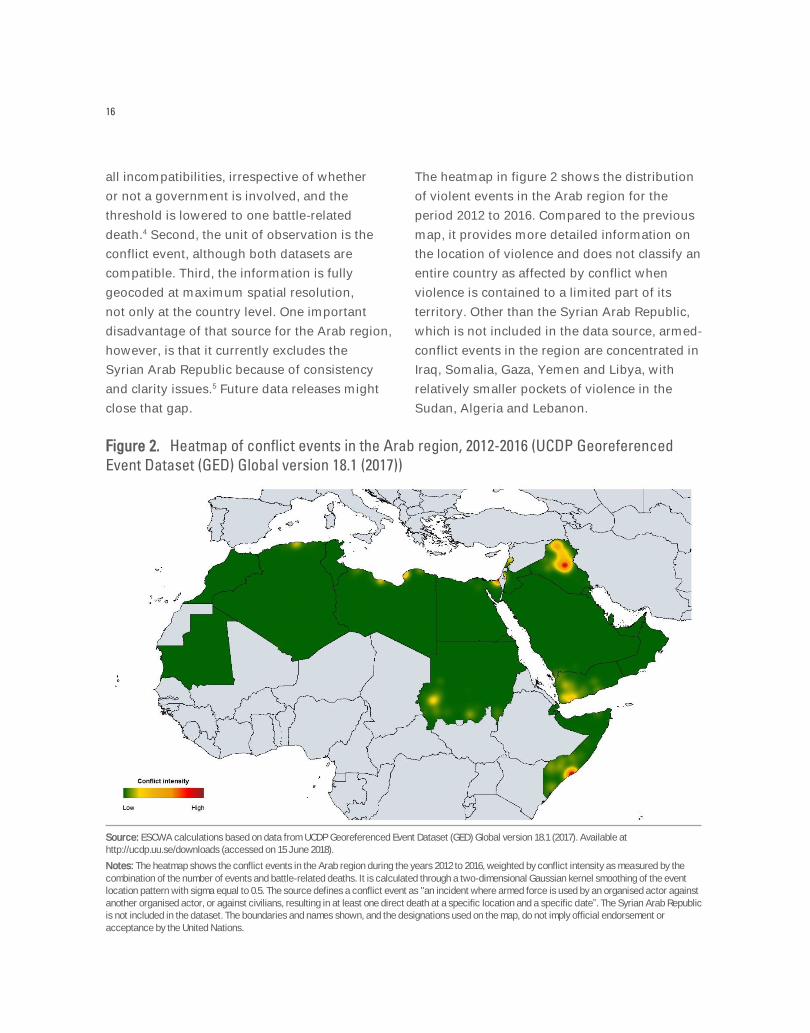
The heatmap in figure 2 shows the distribution
of violent events in the Arab region for the
period 2012 to 2016. Compared to the previous
map, it provides more detailed information on
the location of violence and does not classify an
entire country as affected by conflict when
violence is contained to a limited part of its
territory. Other than the Syrian Arab Republic,
which is not included in the data source, armed-
conflict events in the region are concentrated in
Iraq, Somalia, Gaza, Yemen and Libya, with
relatively smaller pockets of violence in the
Sudan, Algeria and Lebanon.
Figure 2. Heatmap of conflict events in the Arab region, 2012-2016 (UCDP Georeferenced
Event Dataset (GED) Global version 18.1 (2017))
Source: ESCWA calculations based on data from UCDP Georeferenced Event Dataset (GED) Global version 18.1 (2017). Available at http://ucdp.uu.se/downloads (accessed on 15 June 2018).
Notes: The heatmap shows the conflict events in the Arab region during the years 2012 to 2016, weighted by conflict intensity as measured by the
combination of the number of events and battle-related deaths. It is calculated through a two-dimensional Gaussian kernel smoothing of the event location pattern with sigma equal to 0.5. The source defines a conflict event as "an incident where armed force is used by an organised actor against another organised actor, or against civilians, resulting in at least one direct death at a specific location and a specific date”. The Syrian Arab Republic is not included in the dataset. The boundaries and names shown, and the designations used on the map, do not imply official endorsement or acceptance by the United Nations.

17
That database provides the precise geographical
coordinates of violent events. Therefore, it can
be used to estimate the intensity of conflict at
the subnational level, to the desired spatial
resolution. For example, the three panels of
figure 3 show the intensity of violence by
governorate in Libya, Iraq and Yemen for 2016.
We can easily appreciate the geographical
variability of violence inside each country, and
how most of the violence is concentrated in
some governorates. That type of data can be
correlated with other variables, including
sustainable development outcomes, and used to
identify the effects of armed conflict.
There are many other sources of quantitative
information related to armed conflict. For each
source, it is important to verify the exact
definition used, plus the type and extent of topic
coverage. Because one of the present report’s
objectives is to identify potential monitoring tools
for SDGs, it is also important to choose sources
likely to be continuously available and frequently
updated.6 It would also be relevant to verify
national-level sources that could complement
and fill the gaps existing in global or regional
data sources. To mention but one example, the
Iraq Body Count (IBC) Project has recorded, in a
systematic and consistent manner, the number of
civilian deaths in Iraq. It puts emphasis on each
deadly incident and the individuals killed by
registering as much information as possible
about the victims and the circumstances of their
deaths.7 The map in figure 4 graphs the
estimates of civilian battle-related deaths, a
measure of conflict intensity, for 2016. The
results are very similar to those of UCDP GED (as
shown in figure 3), clearly reflecting the shift in
violence to the governorates of Ninawa, Al-Anbar
and the capital, while the Kurdistan region and
the south-west of the country remained
relatively spared.
Figure 3. Geographical distribution of conflict intensity by governorate in Iraq, Libya and
Yemen, 2016 (UCDP Georeferenced Event Dataset)
Source: ESCWA calculations based on data from UCDP Georeferenced Event Dataset (GED) Global version 18.1 (2017). Available at
http://ucdp.uu.se/downloads (accessed on 15 June 2018). Notes: The maps show the conflict intensity during 2016 in three Arab countries affected by armed conflict, as measured by estimated battle-related deaths. The three maps follow a common logarithmic scale. The source defines a conflict event as "an incident where armed force is used by an organised actor against another organised actor, or against civilians, resulting in at least one direct death at a specific lThe boundaries and names shown, and the designations used on the maps, do not imply official endorsement or acceptance by the United Nations.
Iraq Libya Yemen

18
Figure 4. Geographical distribution of conflict intensity by governorate in Iraq, 2016 (IBC)
Source: ESCWA calculations based on data from Iraq Body Count (IBC) Project.
Notes: The maps show the conflict intensity during 2016 in Iraq, as measured by estimated civilian battle-related deaths. The map uses a logarithmic scale. The source systematically and consistently records deadly incidents involving civilians (i.e., strictly non-combatants) and the individuals killed. The boundaries and names shown, and the designations used on this map do not imply official endorsement or acceptance by the United Nations.
C. Conclusions
The present chapter provides a snapshot of the
situation in the Arab region with respect to
violence. As implied by the choice of indicators
proposed by the IAEG-SDGs, the topic requires a
diversity of indicators to describe its multiple
dimensions. We identified several potential
indicators to assess armed conflict, political
violence, violent social movements and
terrorism. Those variables as a group provide a
comprehensive appraisal of the state of peace
and security. Many of the indicators are fully
geocoded, which means that they can be
aggregated at the desired geographical
resolution. Table 3 summarises all the indicators
for the countries of the Arab region. It becomes
clear that violence, across one dimension or
several dimensions, is an important development
challenge that could delay progress or even
reverse advances already achieved. It is
necessary to study how violence correlates with
some of the outcomes of human development
included in the 2030 Agenda. The present report
suggests that combining geocoded indicators
with household survey microdata provides a
better understanding of the challenges posed by
violence across the region in terms of meeting
the goals of the 2030 Agenda.
One important aspect to highlight is that, due to
overlapping definitions, measurement
challenges, and the multidimensionality of the
subject itself, the different indicators are not
orthogonal. That means that some of the events
reported by one source—for example, regarding
terrorism—could also be reported by another
source on armed conflict or political violence. In
practical terms, that means that indicators
should not be used in isolation to monitor
specific types of violence but, rather, as a
collection of variables providing correlated
pieces of information that, together, monitor the
situation of violence and absence of peace.

2. Measuring Poverty and Inequality in Crisis-afflicted Countries (SDG 1 and SDG 10)


21
2. Measuring Poverty and Inequality
in Crisis-afflicted Countries
(SDG 1 and SDG 10)
Conflict has been a major obstacle towards
development. The attainment of durable peace
should take centre stage for the realisation of
the 2030 Agenda and its main goals, the SDGs.
Conflict affects all aspects of development. It
increases poverty and all its manifestations.
Armed conflict is a particularly intense type of
shock, causing many types of disruption and
destruction that unambiguously affect
individuals in all aspects of life (ESCWA, 2018).
Recent conflicts in the region have been
particularly destructive, displacing millions of
people, disrupting livelihoods, and destroying
infrastructure. Those conflicts have led to
famine and disease. They have halted the
provision of public services; in turn, adversely
affecting health outcomes, educational
trajectories, and labour market opportunities for
individuals of all ages across the region.
Those conflicts have had profound impacts on
poverty, inequality and access to services for
individuals across the region. While the definition
of poverty often refers to lack of income, people
themselves consider their experience of poverty
more broadly. A person who is poor can suffer
from multiple disadvantages at the same time.
For example, they might have poor health or
malnutrition, a lack of clean water or electricity,
poor quality of work or little schooling. In the
Arab region, conflicts inevitably have reduced
incomes and standards of living across countries
in substantial ways.
A. Multidimensional poverty
The present chapter concentrates on indicators
for multidimensional poverty, which follow the
data available in MICS and DHS surveys. Aside
from providing a headline measure of poverty,
multidimensional measures can be broken down
to reveal the poverty level in different areas of a
country, and among different population
subgroups. While acute multidimensional
poverty is prevalent only in the Least Developed
Countries (LDC) in the region, important
multidimensional poverty pockets remain across
and within Arab countries. Conflicts across the
region have increased the prospect of poverty for
large population segments within countries.
Countries in the region do not exhibit high
levels of multidimensional poverty except for
the LDCs of the Sudan and Yemen, where
multidimensional poverty accounts for about 50
per cent of the population. In such countries as
Jordan, which hosts a large number of refugees
from the Syrian Arab Republic, the prevalence
of poverty among those populations is likely to

22
have surged, while Tunisia and Egypt, which are
facing a severe economic downturn, are also
expected to experience higher poverty
headcounts and vulnerability to poverty.
Availability of surveys collecting information on
education, health and standards of living across
the region has enabled calculations of
multidimensional poverty for most countries in
the Arab region in recent years. SDG 1 aims to
reduce the proportion of men, women and
children of all ages living in poverty in all its
dimensions according to national definitions.
Those definitions include money-metric
measures as well as multidimensional poverty.
The nature of the surveys consulted for the
present report enables estimation of the latter. It
is important to emphasise that there is no
contradiction between money-metric and
multidimensional poverty measures. One is not
an alternative measure to the other. A lack of
monetary resources can result in non-monetary
deprivation, but that is not always the case.
Conversely, households considered non-poor in
money-metric terms could face non-material
deprivations. The two approaches are,
therefore, complementary and can be used
simultaneously (ESCWA and others, 2017).
For several countries across the region, there is
a large availability of DHS and MICS survey
data, which include all 12 indicators required to
calculate the multidimensional poverty index.
For the countries where data from MICS and
DHS are unavailable, the Arab Family Health
Project (PAPFAM) can be used.
Figure 5. Multidimensional poverty headcounts
Source: ESCWA calculations based on household survey microdata. Yemen (DHS 2013), Sudan (MICS 2014), Iraq (MICS 2011), Egypt (DHS 2014), State of Palestine (MICS 2014), Tunisia (MICS 2011-2012), and Jordan (DHS 2012).

23
At the regional level, acute household poverty
is relatively modest, but that assessment hides
more than it reveals (ESCWA and others, 2017).
The population-weighted acute poverty
Multidimensional Poverty Index (MPI) is 6.6 per
cent. The headcount of poverty, which includes
acute poverty, is much higher. The regional-
weighted poverty MPI is 20.6 per cent. Those
percentages are substantially smaller than
percentages produced by money-metric
measures. For the nine countries we
considered, we estimated poverty for three
clusters based on multidimensional poverty
rates. Cluster 1 includes countries with low
levels of both acute poverty and poverty—
Jordan, Tunisia and Egypt. Cluster 2 includes
Iraq, which has low levels of acute poverty but
medium levels of poverty. Cluster 3 comprises
the remaining LDCs—the Sudan and Yemen—
which have medium-to-high levels of acute
poverty, as well as poverty (ESCWA and
others, 2017).
Figure 6. Multidimensional poverty in Egypt (Cluster 1), Iraq (Cluster 2), and Yemen (Cluster 3)
Source: ESCWA calculations based on household surveys: Yemen (DHS 2013), Iraq (MICS 2011), and Egypt (DHS 2014).

24
1. Advancing SDGs in the LDCs of the
Arab region
Poverty is more acute in the LDCs of the region,
such as the Sudan and Yemen. However, there
are also pockets of poverty in non-LDC countries
across the region (ESCWA and others, 2017).
The adoption of the 2030 Agenda placed the
promise of leaving no-one behind at the centre
of the world’s efforts to address poverty, reduce
inequality, and build a prosperous future.
Fulfilling that driving principle requires
addressing the structural obstacles that hamper
advancement of SDGs in the region. The Sudan
and Yemen are clear examples of how conflict
can exacerbate subnational disparities in terms
of poverty distribution as well as conflict-caused
reversal of developmental achievements.
Box 1. Sudan: striking subnational disparities and the overlap of poverty and conflict
The Sudan still faces many conflict-related challenges, including issues of national unity, reintegration and
reconciliation. Severe regional disparities in multidimensional poverty persist, as well as in access to basic
services and opportunities. Multidimensional poverty in the Sudan is characterised by a large urban-rural gap.
According to the MPI 2017, 70 per cent of poverty is concentrated in rural areas, with urban areas accounting for
the remaining 30 per cent. There is also a substantial overlap between areas suffering from acute
multidimensional poverty rates and those experiencing ongoing conflict, as shown in figure below Central Darfur,
a territory suffering from recurring conflicts, is the poorest governorate in the Arab region.
Sudan: Incidence of poverty and conflict
Source: Authors of the present report, based on MPI 2017 for poverty, and the Global Terrorism database for conflict intensity.

25
2. Poverty vulnerability
and severity
Poverty vulnerability is the propensity to fall
into poverty because of a significant welfare
shock. A welfare shock commonly refers to a
change in consumption per capita or living
standards. Poverty vulnerability is
predominantly relevant, given the large number
of conflicts across the region. Such severe
welfare shocks are affecting living standards
and all other aspects of human development.
An important feature of multidimensional
poverty across countries in the Arab region is
that vulnerability to multidimensional poverty is
understandably high, principally in the LDC
countries of the Sudan and Yemen. A recent
report on multidimensional poverty in the Arab
region reveals that more than 25 per cent of the
regional population is vulnerable to
multidimensional poverty, and another 40 per
cent are considered multidimensionally poor,
implying that more than two-thirds of the Arab
population are either poor or vulnerable to
poverty (ESCWA and others, 2017). Furthermore,
the report suggests that the proportion of people
vulnerable to poverty substantially exceeds the
proportion that is currently poor. Vulnerability to
poverty is due either to low expected
consumption or high variability in consumption.
Risks associated with poverty, therefore, are
higher for a larger proportion of the population.
That, in turn makes addressing multidimensional
poverty more difficult. Overcoming poverty and
protecting against poverty vulnerability will
continue to be challenging for countries across
the Arab region, especially those suffering
conflict.
B. Inequality and conflict
SDG 10 calls for reducing inequalities in
income as well as inequalities based on sex,
age, disability, race, class, ethnicity, religion
and opportunity—both within and among
countries. While income inequality across the
Arab region is seemingly moderate, conflicts
have noticeably increased income and other
forms of inequalities across the region.
The study of inequality requires household
income and expenditure surveys. While such
surveys are extensively available for many
countries in the region, the measurement of
inequality is outside the scope of the present
report, because a consistent analysis of the
patterns of welfare distribution across
countries and over time depends on the
quality and comparability of the underlying
surveys. Such consistency is difficult to
achieve in the case of national household
surveys, where collection methods and data
quality vary within and among countries, and
it is a challenge to compile microdata to
common standards (Hassine, 2014).
The present authors advocate data collection
initiatives across the region to increase the
level of standardisation across countries to
generate consistent indicators for SDG 10.
As with poverty prevalence and vulnerability,
inequality has increased widely across the
region as a result of conflict. Only the most
recent labour force surveys for Yemen and
Jordan include standardised measures of
income that enable the estimation of income
inequality. Figure 7 shows income inequality
as measured by the Gini coefficient for
those countries.

26
While income inequality levels in Jordan
appear to be moderate at around 25 per cent,
inequality in Yemen is extremely high
throughout, with several governorates
exhibiting a Gini coefficient of more than
50 per cent.
Figure 7. Gini coefficient for Jordan and Yemen
Source: Survey data from the Economic Research Forum, 2016.

27
Box 2. Perceptions of inequality in Arab countries
Inequality is a multifaceted phenomenon, yet discussions about it are often restricted to income-wealth-
consumption metrics (Cuesta and Negre, 2016). However, subjective well-being has been gaining attention, as
lack of it is believed to be the cause of much social unrest. Inequality in the Arab region presents an illustrative
case of marked differences between subjective assessments and objective measures (Cuesta and Negre, 2016).
Systemic exclusions resulting in income and non-income inequalities continue to undermine development in the
region. During the past 20 years, the decline in the proportion of poverty was relatively small, despite reasonable
economic growth. In recent years, inequality of opportunity became increasingly important, as unemployment,
particularly for women and for young people, has been persistently high.
Despite rising levels of health and education, regional economic performance remained poor. Rising education
levels contributed positively to the economic performance of the region, but the impact could have been
overshadowed by the negative effects of other factors. The returns on human capital might be low in the Arab
region because of deficiencies in the quality and relevance of education or returns on education might be low
because of structural problems in the labour market. Those differences help explain the conditions leading to the
Arab Spring in early 2011, which traditional metrics of income and wealth inequality failed to predict.
C. Conclusions
Although existing surveys undertaken regularly
across countries in the Arab region include
estimates for multidimensional poverty,
national household and labour surveys need to
be standardised in order to produce consistent
and comparable money metric poverty figures.
The authors of the present report recommend
that regular surveys such as MICS and DHS
incorporate questions that identify populations
particularly vulnerable to conflict, such as
displaced populations previously ignored in
data collection. Conflict has transformed the
region during a relatively small period of time.
Survey microdata could play a critical role in
providing information on progress towards
sustainable development. For example, living
standards in many of the countries studied in
the present report have deteriorated since 2011.


3. Measuring Nutrition and Health in Crisis-afflicted Countries (SDG 2 and SDG 3)


31
3. Measuring Nutrition and Health
in Crisis-afflicted Countries
(SDG 2 and SDG 3)
A. Measuring nutrition in crisis-afflicted countries (SDG 2)
SDG 2 aims to end hunger and all forms of
malnutrition by 2030. It aims for universal access
to safe, nutritious and sufficient food throughout
the year. The fight against hunger has
progressed during the past 15 years. Globally,
the prevalence of hunger has declined, from 15
per cent according to figures for 2000-2002, to 11
per cent according to figures for 2014-2016.8
In Arab countries, principally those afflicted by
conflict, malnutrition is still prevalent. The
protracted crises across the region have
increased vulnerability and food insecurity,
affecting large parts of the population. The
persistence of hunger across the region
highlights the importance of collecting more and
better data on child anthropometrics and access
to food, to track progress and guide intervention
to fight food insecurity and malnutrition.
In crisis-afflicted countries across the region,
child malnutrition and food insecurity are highly
correlated.
The poorest countries in the region, such as the
Sudan and Yemen, are the most vulnerable to
food insecurity, putting children and mothers at
increasing risk of mortality and malnutrition. In
the present report, we calculate measures of
malnutrition for children in the nine crisis-
afflicted countries of the Arab region.
Malnourishment reduces growth in children;
increases the likelihood of disease; and could
increase the likelihood of early death.
Nutritional outcomes of children are measured
using several anthropometric indicators. The
most common measures are wasting (acute
malnutrition), stunting (chronic malnutrition),
and underweight (general malnutrition).
Of those measures, chronic malnutrition is the
most relevant, as it severely increases morbidity
and mortality; reduces physical, cognitive and
economic capacity; and elevates health risks in
adulthood (Case and Paxson, 2010). While
height is a marker for long-term nutritional
status, weight appears to be a proxy for short-
term nutritional status. Cognitive development
and height share common inputs early in life;
thus, height can be used as a proxy for cognitive
development (Currie and Vogl, 2013).
The most commonly used anthropometric
indices for assessing children’s growth status are
weight-for-height, height-for-age, and weight-for-
age. Childhood stunting is the best overall
indicator of children's well-being and long-term
development. It also accurately reflects social

32
inequalities among vulnerable populations. The
most important factors contributing to stunted
growth and development are poor maternal
health and nutrition during and after pregnancy,
inadequate child-feeding practices, and infection.
Economic growth has improved nutrition, but
disease and inadequate dietary intake still cause
under-nutrition in the region. Malnutrition
remains a major health problem for the region; it
is likely to worsen as conflicts escalate. Table 4
shows the severity of malnutrition by prevalence
ranges (percentage) for the countries affected by
conflict in the Arab region.
B. Prevalence of undernourishment (underweight, wasting, stunting, and obesity)
Underweight prevalence appears to be high in the
LDCs of the Sudan and Yemen. Other countries in
the region have made considerable progress
tackling malnutrition. Protracted conflicts and
crises are exacerbating existing malnutrition
problems, particularly in Iraq, the Sudan, and
Yemen. The prevalence of underweight in children
below five reflects child growth. It is measured as
the percentage of children under five whose
weight is more than two standard deviations
below the median of a standard population as
described in the National Centre for Health
Statistics/World Health Organization (NCHS/WHO)
table of child weights (World Health Organization,
Regional Office for South-East Asia, 2015).
Child malnutrition as reflected by body weight
increases a child’s risk of death; inhibits
cognitive development; and affects health status
in later life. Being underweight might also
reflect wasting (low weight-for-height ratio)
and/or stunting (low height-for-age ratio). The
prevalence of underweight in children under
five indicates child growth. It is measured as the
percentage of children below five whose weight
is more than two standard deviations below the
median of a standard population such as that of
the NCHS/WHO table of child weights. While
wasting is moderate in most countries studied
in the present report, levels of wasting are large
for the Sudan and Yemen.
Figure 8. Prevalence of underweight for children 0-59 months
Source: ESCWA calculations based on household surveys: Yemen (DHS 2013), Sudan (MICS 2014), Iraq (MICS 2011), Egypt (DHS 2014), State of Palestine (MICS 2014), Tunisia (MICS 2011-2012), and Jordan (DHS 2012).

33
Figure 9. Prevalence of wasting for children 0-59 months
Source: ESCWA calculations based on household surveys: Yemen (DHS 2013), Sudan (MICS 2014), Iraq (MICS 2011), Egypt (DHS 2014), State of Palestine (MICS 2014), Tunisia (MICS 2011-2012), and Jordan (DHS 2012).
Figure 10 shows the prevalence of stunting for
seven countries in the region, calculated using
the most up-to-date household-level microdata
available. The figure shows that stunting is
extremely high in the Sudan and Yemen,
probably having increased in recent years
because of famine and protracted crises. In
Egypt and Iraq, there are moderate to medium
levels of stunting, which would require large
efforts from governments to reduce.
Of the three measurements of
undernourishment used here, stunting is
particularly worrisome from a lifecycle
perspective (ESCWA, 2018). Childhood stunting
is the best overall indicator of damage to
children's well-being and long-term
development. It also accurately reflects social
inequalities among vulnerable populations.
The large prevalence of stunting in the countries
studied has devastating long-term
consequences. Table 4 shows the severity of
malnutrition for conflict-afflicted countries in the
region. In Iraq, Libya and the Syrian Arab
Republic pre-conflict, a fifth to a quarter of
children were stunted. In Yemen, the problem
was worse, with more than 50 per cent of
children stunted. According to the World Bank,
the problem was related to dietary quality and
public health rather than to household wealth
levels (El-Kogali and Krafft, 2015).

34
Figure 10. Prevalence of stunting for children 0-59 months
Source: ESCWA calculations based on household surveys: Yemen (DHS 2013), Sudan (MICS 2014), Iraq (MICS 2011), Egypt (DHS 2014), State of Palestine (MICS 2014), Tunisia (MICS 2011-2012), and Jordan (DHS 2012).
Table 4. Severity of malnutrition by prevalence ranges (%) in conflict-afflicted countries
Indicator
Severity of malnutrition by prevalence ranges (%)
Iraq
2006
Iraq
2011
Yemen
2006
Yemen
2013
Syrian Arab
Republic
2006
Syrian Arab
Republic
2009
Libya
2007
Libya
2014
Stunting Medium
(27.01)
Medium
(21.7)
Very High
(57.10)
Very High
(46.11)
Medium
(28.39)
Medium
(27.79)
Medium
(21.08) High
Underweight Low
(6.94)
Low
(6.89)
Very High
(36.94)
Very High
(39.70) Low Low Low Low
Wasting Medium
(5.83)
Medium
(6.41)
High
(13.74)
Very High
(16.64)
High
(10.34)
High
(11.57)
Medium
(6.54)
High
(10.39)
Source: ESCWA, 2018.

35
Figure 11. Prevalence of stunting for children 0-59 months at the subnational level for Yemen
and Egypt
Source: ESCWA calculations based on household surveys: Yemen (DHS 2013), and Egypt (DHS 2014).

36
Large subnational differences are observed in
the prevalence of stunting in Yemen and Egypt.
In Egypt, where national stunting figures are
moderate, the subnational disaggregation
shows large subnational disparities, with certain
regions exhibiting stunting rates similar to the
LDCs in the region.
Those large subnational disparities suggest that
children are more exposed to malnutrition in
certain areas, probably associated with larger
exposure to conflict. In Yemen, exposure to
conflict is likely to increase stunting. A recent
study by ESCWA shows that conflict
intensification in Yemen and Iraq is causing
a surge in stunting for children exposed to
conflict, leading to large regional inequalities
(ESCWA, 2018).
In addition to malnourishment, an increasing
number of children across countries in the Arab
region suffer from obesity. That trend also
presents long-term health challenges. Figure 12
shows the prevalence of obesity in seven
Arab countries, calculated from latest
available microdata.
Box 3. Stunting prevalence in Iraq
The nutritional well-being of children highly influences their cognitive and long-term skills development (Cunha,
Heckman and Schennach, 2010). Iraq has the third-highest stunting prevalence in our sample of countries, with 21.7
per cent of children under five stunted in 2011, and 8.87 per cent of them severely stunted. Those percentages
decreased after 2011 at the national level but remained moderately high in regions more exposed to violent events.
Iraq has experienced high intensity of violence during the past decade which, in addition to causing large
economic damage, has increased the likelihood of childhood stunting (ESCWA, 2018). The probability of being
stunted is associated with exposure to violence. The figure below shows the geographical distribution of violent
events and stunting rates. Governorates with the highest prevalence of stunting are also the ones with the highest
battle-related deaths since March 2003.
Stunting and conflict prevalence
Source: ESCWA calculations based on household surveys: Iraq (MICS, 2011).

37
Figure 12. Prevalence of obesity for children 0-59 months
Source: ESCWA calculations based on household surveys: Yemen (DHS 2013), Sudan (MICS 2014), Iraq (MICS 2011), Egypt (DHS 2014), State of Palestine (MICS 2014), Tunisia (MICS 2011-2012), and Jordan (DHS 2012).
Obesity has led to a dramatic increase in the
incidence of Type 2 diabetes in Arab countries
and has increased the risk of insulin resistance
for children across the region. Both
undernourishment and obesity are trends
directly affecting long-term health.
Nutrition data
Microdata gaps remain a significant road block
to assessing progress on nutrition across the
Arab region. The absence of such data is a
fundamental impediment to determining real
progress at the global and national levels,
hiding inequalities within countries, especially
those affected by conflict. As suggested in the
2016 Global Nutrition Report, surveys on rates
of under-five underweight, stunting, wasting,
and overweight, as well as exclusive
breastfeeding, should be conducted across the
region with greater precision (International Food
Policy Research Institute, 2016). Countries
afflicted by crises, with high malnutrition
burdens, and data more than five years old
should prioritise new data collection.
C. Measuring health in crisis-afflicted countries (SDG 3)
SDG 3 addresses major health priorities,
including reproductive, maternal and child
health; communicable, non-communicable and
environmental diseases; universal health
coverage; and access for all to safe, effective,
quality and affordable medicines and vaccines.
It also calls for more research and development,
increased health financing, and strengthened
capacity of all countries in health-risk reduction

38
and management. Since 2000, impressive
advancements have been made on many health
fronts across the Arab region, yet most of those
advances have been negatively affected by the
numerous protracted crises. To meet the SDG
health targets by 2030 across the region,
progress must be accelerated, in countries with
the highest intensity conflicts.
1. Reproductive, maternal, new-born and
child health
Infant and child mortality
Arab countries showed an impressive decline in
child mortality rates during the past few
decades. However, gaps in mortality by gender
and socioeconomic status persisted (Khawaja
and others). Large socioeconomic disparities in
child health are evident in almost every country
in the region. Disparities have most likely been
exacerbated by conflict.
Conflict and protracted crises appear to be
a critical factor affecting children’s health
and mortality. Food insecurity most affects
vulnerable populations, and lack of health
services is likely to affect maternal and child
well-being. Those crises are associated directly
and indirectly with infant, child and maternal
mortality. Indirect deaths are caused by
consequent disease, hunger or lack of care.
In Iraq, Yemen, Libya and the Syrian Arab
Republic, food insecurity has been particularly
damaging for vulnerable people and the
food insecure.
Countries in the Arab region have made
remarkable progress in reducing infant mortality
rates. However, protracted crises across the
region are undermining that progress. In the
crisis-ridden countries of the Arab region,
children are dying of preventable causes due to
the lack of adequate nutrition, water and
sanitation facilities, plus lack of access to basic
healthcare services.
Figure 13. Neonatal and child mortality
Source: ESCWA calculations based on household surveys: Yemen (DHS 2013), Sudan (MICS 2014), Iraq (MICS 2011), Egypt (DHS 2014), State of Palestine (MICS 2014), Tunisia (MICS 2011-2012), and Jordan (DHS 2012).
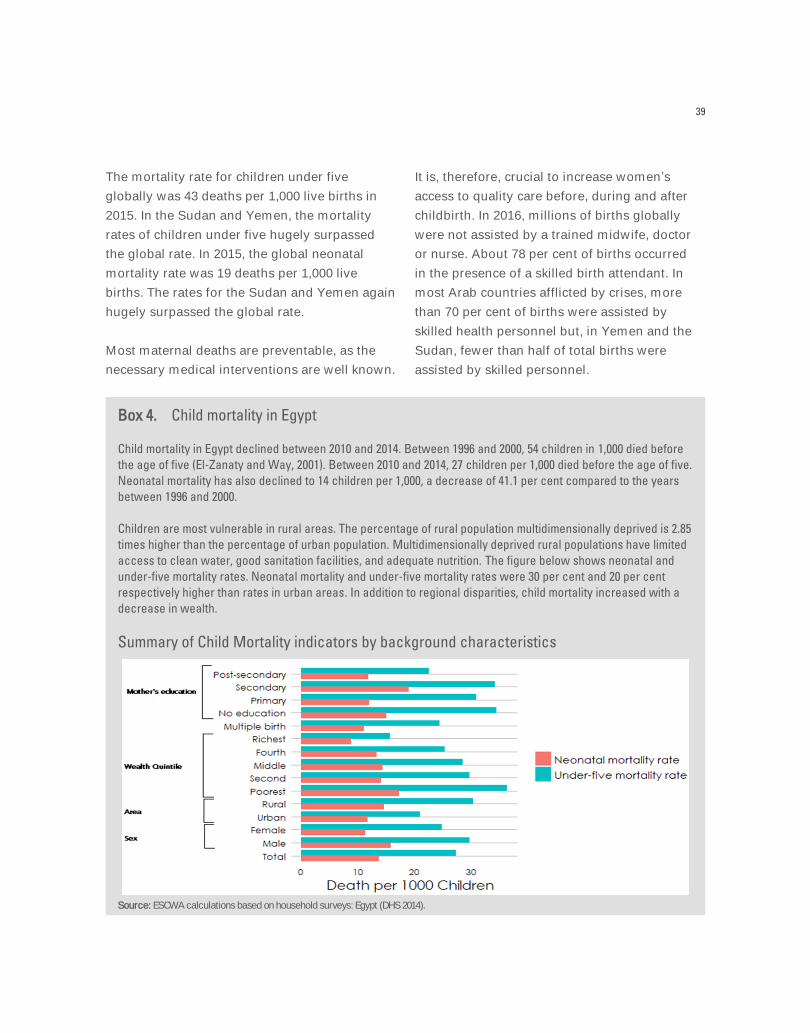
39
The mortality rate for children under five
globally was 43 deaths per 1,000 live births in
2015. In the Sudan and Yemen, the mortality
rates of children under five hugely surpassed
the global rate. In 2015, the global neonatal
mortality rate was 19 deaths per 1,000 live
births. The rates for the Sudan and Yemen again
hugely surpassed the global rate.
Most maternal deaths are preventable, as the
necessary medical interventions are well known.
It is, therefore, crucial to increase women’s
access to quality care before, during and after
childbirth. In 2016, millions of births globally
were not assisted by a trained midwife, doctor
or nurse. About 78 per cent of births occurred
in the presence of a skilled birth attendant. In
most Arab countries afflicted by crises, more
than 70 per cent of births were assisted by
skilled health personnel but, in Yemen and the
Sudan, fewer than half of total births were
assisted by skilled personnel.
Box 4. Child mortality in Egypt
Child mortality in Egypt declined between 2010 and 2014. Between 1996 and 2000, 54 children in 1,000 died before
the age of five (El-Zanaty and Way, 2001). Between 2010 and 2014, 27 children per 1,000 died before the age of five.
Neonatal mortality has also declined to 14 children per 1,000, a decrease of 41.1 per cent compared to the years
between 1996 and 2000.
Children are most vulnerable in rural areas. The percentage of rural population multidimensionally deprived is 2.85
times higher than the percentage of urban population. Multidimensionally deprived rural populations have limited
access to clean water, good sanitation facilities, and adequate nutrition. The figure below shows neonatal and
under-five mortality rates. Neonatal mortality and under-five mortality rates were 30 per cent and 20 per cent
respectively higher than rates in urban areas. In addition to regional disparities, child mortality increased with a
decrease in wealth.
Summary of Child Mortality indicators by background characteristics
Source: ESCWA calculations based on household surveys: Egypt (DHS 2014).

40
Figure 14. Proportion of births attended by skilled health personnel
Source: ESCWA calculations based on household surveys: Yemen (DHS 2013), Sudan (MICS 2014), Iraq (MICS 2011), Egypt (DHS 2014), Tunisia (MICS 2011-2012), and Jordan (DHS 2012).
2. Women’s reproductive health
In 2016, 77 per cent of women of reproductive
age worldwide who were married or in a
relationship had their family planning needs
met with a modern contraceptive method. In
crisis-ridden Arab countries, estimates are much
lower, with the highest percentage being for
Tunisia, with 62 per cent of married or
cohabitating women having their needs for
family planning met. Stark differences appear
both by area and wealth quintile, predominantly
in Iraq, the Sudan and Yemen.
A disturbing trend in family planning needs not
being met in Arab countries afflicted by crises
is that younger cohorts of women are less
likely to have their family planning needs met,
as shown in figure 16. The protracted conflicts
across the region have lowered the age of first
marriage (ESCWA and UNICEF MENARO,
2018). If younger women do not have access
to contraceptives, they will have a larger
number of children on average. Preventing
unintended pregnancies and reducing
adolescent childbearing through universal
access to sexual and reproductive healthcare
is crucial to the health and well-being of
women, children and adolescents. It is also
of the foremost importance in conflict-ridden
countries, where poverty conditions are
expected to deteriorate.

41
Figure 15. Met need for family planning satisfied
Source: ESCWA calculations based on household surveys: Sudan (MICS 2014), Iraq (MICS 2011), Egypt (DHS 2014), State of Palestine (MICS 2014),
Tunisia (MICS 2011-2012), and Jordan (DHS 2012).
Figure 16. Met need for family planning, across age groups
Source: ESCWA calculations based on household surveys: Yemen (DHS 2013), Sudan (MICS 2014), Iraq (MICS 2011), Tunisia (MICS 2011-2012), and State of Palestine (MICS 2014).
Female genital mutilation (FGM or cutting) is
still common in several Arab countries. Recent
survey data indicate that more than 9 in 10 girls
between the ages of 15 and 19 have undergone
the procedure in Egypt. In Sudan, the rate is
more than 8 in 10. In Yemen, the rate is nearly 2
in 10 girls. In Iraq, it is 1 in 10. The high
prevalence of FGM in Egypt and Sudan is
particularly disconcerting, as it changes little by
wealth quintile or area of residence.

42
In the short term, FGM can lead to infection and
death. In the longer term, it can lead to obstetric
and sexual difficulties, as well as mental health
problems. The fact that FGM is more prevalent
in countries with high population growth is even
more worrying, as it means that the number of
girls undergoing FGM will continue to increase
unless efforts to stop the practice are
significantly expanded and more successful
(United Nations News Centre, 2018).
Figure 17. Female genital mutilation, by area and wealth quintile
Source: ESCWA calculations based on household surveys: Yemen (DHS 2013), Sudan (MICS 2014), Iraq (MICS 2011), and Egypt (DHS 2014).
Figure 18. Female genital mutilation across age groups
Source: ESCWA calculations based on household surveys: Yemen (DHS 2013), Sudan (MICS 2014), Iraq (MICS 2011), and Egypt (DHS 2014).

43
3. Infectious diseases
Vaccines play a key role in global health and
development, but their broader value is still
highly underestimated. Increasing the
prevalence of vaccination is fundamental for
achieving the SDGs. Vaccination is the most
successful and cost-effective medical
intervention ever introduced, saving millions of
lives every year and preventing countless
illnesses. Vaccines have also significantly
contributed to the dramatic decline in mortality
rates witnessed during past decades around
the world. The value they currently provide is
still far behind the significantly greater
potential benefits they could offer. Even
today, the success of vaccination coverage
is measured using only statistics for the
DTP3 vaccine. Using indicators for all 11
vaccines recommended by WHO would
be more appropriate (Rappuoli, Breghi
and Timmis, 2015).
The United Nations Children’s Fund (UNICEF)
estimates that almost two-thirds of children
who have not been immunised with basic
vaccines live in countries that are either
partially or entirely affected by conflict. Of
countries in conflict, Sudan has the highest
percentage of non-immunised children, with 61
per cent not receiving the most basic childhood
vaccines, followed by the Syrian Arab
Republic, with 57 per cent (UNICEF, 2016a).
Conflict-afflicted countries are fertile
environments for disease outbreaks, which
expose children missing basic immunisations
to higher risks of disease. The major causes of
childhood illness and death include measles,
diarrhoea, respiratory infections and
malnutrition, which can worsen in crisis-
afflicted countries. For DTP3 vaccination, all
countries studied in the present report have
close to 100 per cent coverage, with the
exceptions of Yemen and Iraq, where DTP3
coverage is below 75 per cent.
Figure 19. DTP3 vaccination coverage
Source: UNICEF, Immunisation Data, surviving infants who received DPT3 vaccine in 2016.

44
Box 5. Vaccination in Jordan
In Jordan, more than 93 per cent of children have received all mandatory vaccines, including BCG, measles and
three doses each of DPT, plus the polio vaccine.
There is little variation in the vaccination rate at subnational levels. The highest rate is in Zarqa, where 98.8
per cent of children have received full vaccinations. Interestingly, there is little gap between the wealth quintiles,
as 90.14 per cent of children born to families in the lowest quintile are fully vaccinated, compared to 92.53 per cent
for children born into families in the richest quintile. However, the lowest percentage of vaccinated children is in
Ma'an, where 84.2 per cent of children are fully vaccinated. M’an is the governorate with the highest percentage
of women with no education or only primary school education. A mother’s education seems to be a leading factor
in terms of whether or not her children have been vaccinated. Only 77 per cent of children born into families
where the mother has no education or primary level schooling are fully vaccinated, compared to 94.4 per cent in
families where the mother has secondary level education.
Vaccination rate by background characteristics
Source: ESCWA calculations based on household surveys: Jordan (DHS 2012).
45
D. Conclusions
Data on household nutrition and health
dimensions are readily available from routine
household surveys conducted by international
agencies. The surveys include MICs and DHS,
plus others conducted by some national
statistical offices (including budget surveys,
income and expenditure surveys, living
standards measurement surveys, and integrated
household surveys). Those surveys serve
multiple sectors and could be generally used to
monitor progress towards SDG 2 and SDG 3, as
the surveys collect information not only on
nutrition and health outcomes but sometimes
also on health expenditures.
SDG 2 is a challenging goal because it looks at
agriculture, nutrition and food security in an
integrated manner. However, information on those
three metrics is rarely collected simultaneously in
household surveys. Food security modules are an
important part of integrated efforts and should be
added to surveys traditionally collected across the
region. Data on dietary quality is also absent from
most surveys. If added, it would also provide
relevant information for devising interventions
across countries in the region.


4. Measuring Inclusive and Quality Education in Conflict Settings (SDG 4)


49
4. Measuring Inclusive and Quality Education
in Conflict Settings (SDG 4)
A. SDG 4 focuses on inclusive and quality education for all. It represents an improvement of the MDG on education, which focused on increasing educational access, without including a measure of quality. The SDGs represent the first attempt to focus on the quality of education worldwide
Since the early 1990s, most countries in the
Arab region expanded access to education
dramatically. Almost all countries in the region
had achieved universal primary attainment by
the mid-2000s, including Yemen, one of the
LDCs of the world. Gender gaps across the
region were almost non-existent. Net enrolment
rates for children in primary school age rose
from 90 per cent to 95 per cent between 2000
and 2010 (UNICEF and UNESCO Institute for
Statistics, 2015). While there was also progress
in secondary school enrolment, it was not as
pervasive as in primary education. Net
enrolment rates for children of secondary
school age rose from 62 per cent to 70 per cent
during the same period. In recent years, the
protracted conflicts across the region reversed
those promising trends. Even in countries where
education had improved significantly, conflict
has exacerbated exclusions due to poverty,
gender, ethnicity, disability and location
(World Bank, 2018b).
Despite considerable gains in education
enrolment during the past 15 years, those
trends are reversing in crisis-affected countries
across the region. Quality of education is also
an issue. In recent decades, average years of
schooling attained by people 15 and over
increased from 4.68 in 1990 to 7.38 in 2010
(Barro-Lee, 2016). But many of those attending
school are not acquiring basic skills, because
the expansion in educational attendance has not
been met by an expansion in educational
quality. Even though more children are going to
school than before, many do not acquire basic
skills. A profound disconnection between the
skills demanded by the labour market and the
supply of those skills is evident from the
persistence of high youth and global
unemployment rates. Equality issues also
constitute a major challenge to education across
the region, those challenges having been
exacerbated by conflict. Conflicts
disproportionally affect the most vulnerable
populations and increase the skills gap between
those exposed to conflict relative to those with
means to protect against violent shocks.
The youth bulge is exacerbating the situation,
especially in crisis-affected countries, where
populations are predominantly young, with
children under 15 accounting for a third of the
population in the region. More than 40 per cent
of the population in Iraq and Yemen is
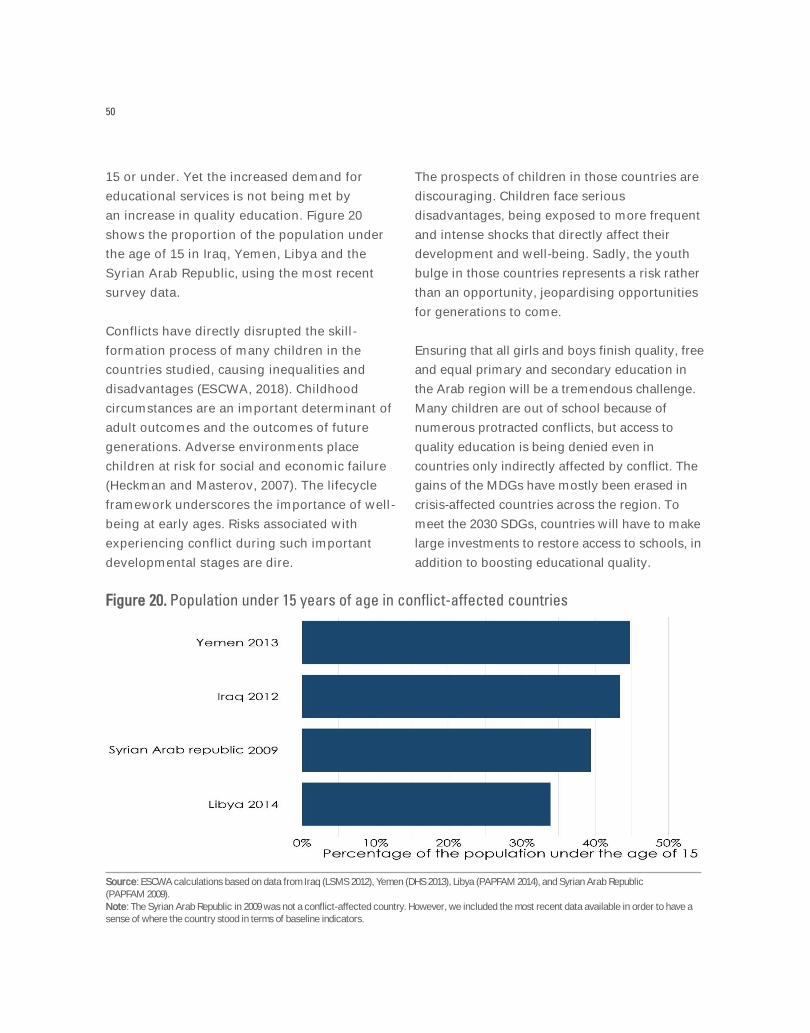
50
15 or under. Yet the increased demand for
educational services is not being met by
an increase in quality education. Figure 20
shows the proportion of the population under
the age of 15 in Iraq, Yemen, Libya and the
Syrian Arab Republic, using the most recent
survey data.
Conflicts have directly disrupted the skill-
formation process of many children in the
countries studied, causing inequalities and
disadvantages (ESCWA, 2018). Childhood
circumstances are an important determinant of
adult outcomes and the outcomes of future
generations. Adverse environments place
children at risk for social and economic failure
(Heckman and Masterov, 2007). The lifecycle
framework underscores the importance of well-
being at early ages. Risks associated with
experiencing conflict during such important
developmental stages are dire.
The prospects of children in those countries are
discouraging. Children face serious
disadvantages, being exposed to more frequent
and intense shocks that directly affect their
development and well-being. Sadly, the youth
bulge in those countries represents a risk rather
than an opportunity, jeopardising opportunities
for generations to come.
Ensuring that all girls and boys finish quality, free
and equal primary and secondary education in
the Arab region will be a tremendous challenge.
Many children are out of school because of
numerous protracted conflicts, but access to
quality education is being denied even in
countries only indirectly affected by conflict. The
gains of the MDGs have mostly been erased in
crisis-affected countries across the region. To
meet the 2030 SDGs, countries will have to make
large investments to restore access to schools, in
addition to boosting educational quality.
Figure 20. Population under 15 years of age in conflict-affected countries
Source: ESCWA calculations based on data from Iraq (LSMS 2012), Yemen (DHS 2013), Libya (PAPFAM 2014), and Syrian Arab Republic (PAPFAM 2009). Note: The Syrian Arab Republic in 2009 was not a conflict-affected country. However, we included the most recent data available in order to have a sense of where the country stood in terms of baseline indicators.

51
1. Access to education
Access to education involves large disparities
among different Arab countries. Despite general
outstanding progress in educational access
across the region, many countries still lag
behind and include large disparities along
gender and geographical lines. As shown in
figure 21, large percentages of the populations
of Iraq, Tunisia, Sudan and Yemen have no
education.
As shown in figure 22, the problem is not
confined to older generations. Large
proportions of youth in Iraq, Sudan and Yemen
have had no access to education.
Figure 21. Population aged 15 and over without education, by area and gender
Source: ESCWA calculations based on household surveys: Yemen (DHS 2013), Sudan (MICS 2014), Iraq (MICS 2011), State of Palestine (MICS 2014), Tunisia (MICS 2011-2012), and Jordan (DHS 2012).
Figure 22. Youth aged 15 to 24 without education, by area and gender
Source: ESCWA calculations based on household surveys: Yemen (DHS 2013), Sudan (MICS 2014), Iraq (MICS 2011), State of Palestine (MICS 2014), Tunisia (MICS 2011-2012) and Jordan (DHS 2012). Note: In 2009 was not a conflict-affected country. However, we included the most recent data available to have a sense of where the country stood in terms of baseline indicators.

52
For the countries studied, women in general and
people in rural areas are less likely to have
access to education. Female literacy rates have
increased across the region. For most of the
countries studied in the present report, such
access does not exceed 90 per cent, with lower
literacy rates for women in rural areas.
The recent expansion in education is impressive
by historical standards. All countries across the
region made great strides in expansion, mostly
in primary education. Many countries
experiencing conflict today were well on their
way to achieving universal primary net
enrolment rates and were making impressive
efforts to increase net enrolment in secondary
education. Sadly, conflict has reversed much of
the gains in educational expansion at all levels
in countries across the region.
2. Yemen: Conflict is delaying the prospects
for LDC status graduation and reversing
development accomplishments
In the last triennial review of the list of LDCs
conducted in 2015, the United Nations
Committee for Development acknowledged
that Yemen was approaching the threshold for
graduation from the LDC category. The country
met the Gross National Income (GNI) per capita
requirement and was nearing the threshold in
the Human Assets and Economic Vulnerability
Indexes (E/2015/33). However, in 2016, the
United Nations Conference on Trade and
Development (UNTACD) report on the LDCs
noted that the prospects for graduation of
Yemen, scheduled for the period 2021-2024,
had shrunk and would most likely be
delayed due to the security situation
(UNCTAD, 2016b).
The evidence of that downward trend can be
corroborated by analysing the level of
achievement of MDGs. In a context of low
general levels of achievement, for example, one
of the MDGs where Yemen experienced a
positive trend was the universal enrolment in
basic education, acknowledged by national
authorities and international partners as one of
the goals the country was likely to achieve
(UNDP and Yemen, Ministry of Planning and
International Cooperation, 2010; United Nations
and Government of Yemen, 2011). That positive
trend towards universal primary enrolment was
reversed by the instability and violence affecting
the country since the uprisings of 2011. The
situation has had a particularly detrimental effect
on already vulnerable groups, such as girls.
Figure 23 shows the difference in enrolment
rates by age in 2006 and 2013. In 2006, more
than 90 per cent of primary school-aged
children were enrolled in school, with virtually
no gender disparities until the age of 12. Yemen
was well on its way to ensuring that all boys
and girls completed full primary schooling.
However, the data for 2013 show a turn for the
worse. There was a substantial decline in overall
enrolment rates across periods for all children,
but especially for girls. Delayed entry and higher
rates of early dropout led to an ‘‘inverted-U’’
age-enrolment profile. That pattern is of concern
because evidence suggests that children who
enter school late are also more likely to exit
early, further reducing their human capital
accumulation and exposing them to other
negative outcomes.

53
An important caveat regarding the results for
Yemen is that the situation has changed
considerably in the country since the beginning
of the war in 2015. Recent reports by the United
Nations Office for the Coordination of
Humanitarian Affairs (OCHA, 2017) reveal that
education, health and food insecurity in Yemen
have deteriorated significantly, especially for
children, because of the conflict. The situation is
likely to get worse.
Yemen is experiencing a downward
spiral. Reversals could take decades to
overcome. Particularly alarming is the setback
in educational outcomes. Children not enrolled
in school today will face worse earning
prospects than children who completed their
education. The associated reduction in
earnings potential will have adverse
repercussions. Children who interrupt their
educational trajectories will be more likely to
rely on government assistance and have a
higher incidence of poverty. Similar downward
trends are evident for other developmental
factors, including nutrition and mortality.
Box 6 shows school enrolment rates for children
in the Syrian Arab Republic during 2006 and
2009, prior to the Syrian conflict. The impact of
conflict on educational outcomes for Syrian
children is likely to be devastating, with more
than 80 per cent of schools destroyed or not
functioning, and a similar percentage of children
not attending school.
Figure 23. Age enrolment profile for Yemen
Source: ESCWA, 2018.

54
Box 6. School enrolment rates in the Syrian Arab Republic during the pre-conflict period
School enrolment profiles in the Syrian Arab Republic, 2006 and 2009
Source: ESCWA calculations based on data from MICS 2006 and PAPFAM 2009 for Syrian Arab Republic.
In both 2006 and 2009, school enrolment rates were above 90 per cent until age 13, when they started to decline.
During those years, there were no statistical differences between enrolment rates of girls and boys, as observed
in other countries in the region. The country also showed one of the largest youth bulges of the region, with 46 per
cent of the population 18 years of age or younger in 2009.*
Since the war started in 2011, at least a quarter of schools in the Syrian Arab Republic have been closed,
destroyed, used as shelter by the internally displaced, or used as military bases. Save the Children (2015)
estimates that school enrolment rates have plummeted to less than 50 per cent at the national level for primary
education and are even lower where prolonged heavy fighting has taken place (Save the Children, 2015). UNICEF
estimates that at least 2.26 million children are out of school in the Syrian Arab Republic, and 7 out of 10 school-
age refugee children are not attending school outside the Syrian Arab Republic (UNICEF, 2013). More
dramatically, many Syrian children have never enrolled in school inside or outside the Syrian Arab Republic, and
many children are dropping out of schools and not returning, especially among displaced populations.
*.
3. Quality of education
While the expansion in educational attendance
has been remarkable for most countries across
the region, it has not been accompanied by
equal improvements in educational quality. As a
result, schooling does not necessarily translate
into learning. Children learn very little in many
education systems across the region. Even after
several years in school, millions of students lack

55
basic literacy and numeracy skills (World Bank,
2018b). As shown in figure 24, recent
assessments in Iraq and Yemen show that more
than 30 per cent of students at the end of grade
2 were unable to read a single familiar word;
and more than 60 per cent of children in Iraq
were unable to perform a two-digit subtraction.
Many educational systems across the Arab
region are failing to provide students with
meaningful skills. The numerous conflicts
across the region are also failing to provide the
same educational opportunities for all. The
conflicts exacerbate inequalities. Thus,
education systems are widening social gaps
rather than narrowing them.
Existing standard household survey data
collected across the region does not
systematically collect information on education
quality. The authors of the present report
suggest incorporating those measures in
standard household surveys for countries
across the region, as well as in international
competency tests used to collect data on
education quality.
Equality issues constitute a major challenge
in education for the region. However, in crisis-
affected regions, certain groups of children
are likely to be disproportionally disadvantaged.
Lack of access and/or poor-quality education,
manifested by the lack of trained teachers and
the poor condition of schools, are jeopardising
prospects for equal quality education for all.
Moreover, children are starting at a
disadvantage, and those shortcomings are
further intensified by conflict exposure. The
learning crisis is reinforcing inequality (World
Bank, 2018b). Conflict is amplifying it, with the
already most vulnerable populations
disproportionately affected.
Figure 24. Percentage of grade 2 students who could perform simple reading or math tasks in
Iraq and Yemen
Source: World Bank, 2018b.

56
B. Ensure that all girls and boys have access to quality early childhood development, care and pre-primary education so that they are ready for primary education
There is a growing body of evidence coming
from economics and psychology on the
importance of investments in early childhood
development (ECD). Promoting ECD will shape
not only the life course of young children, but
also the trajectories of countries’ development
(El-Kogali and Krafft, 2015). School success and
labour-market outcomes are grounded in those
early investments. Recent research establishes
the existence of critical and sensitive periods in
the formation of skills during the lifecycle
(ESCWA, 2018). Sensitive periods are those
periods where investment is especially
productive; critical periods are those periods
when investment is essential. All investments in
skills should target those periods.
Unfortunately, the Arab region still lags behind in
terms of early childhood development initiatives.
Pre-primary schooling rates are relatively low, as
shown in figure 25. Early childhood education
and early learning play an important role in
school success. However, the Arab region is
substantially under-investing in that important
stage of education (El-Kogali and Krafft, 2015).
Despite the mounting evidence that early
childhood development improves cognition and
socioemotional development, endowing lifetime
benefits, pre-primary gross enrolment across the
region is almost half that of the world average
(El-Kogali and Krafft, 2015). According to World
Bank estimates, early childhood education
attainment is lower than in every other region of
the world except Sub-Saharan Africa.
Figure 25. Gross enrolment rates in pre-primary—regional comparison, 2011
Source: El-Kogali and Krafft, 2015, chap. 2.
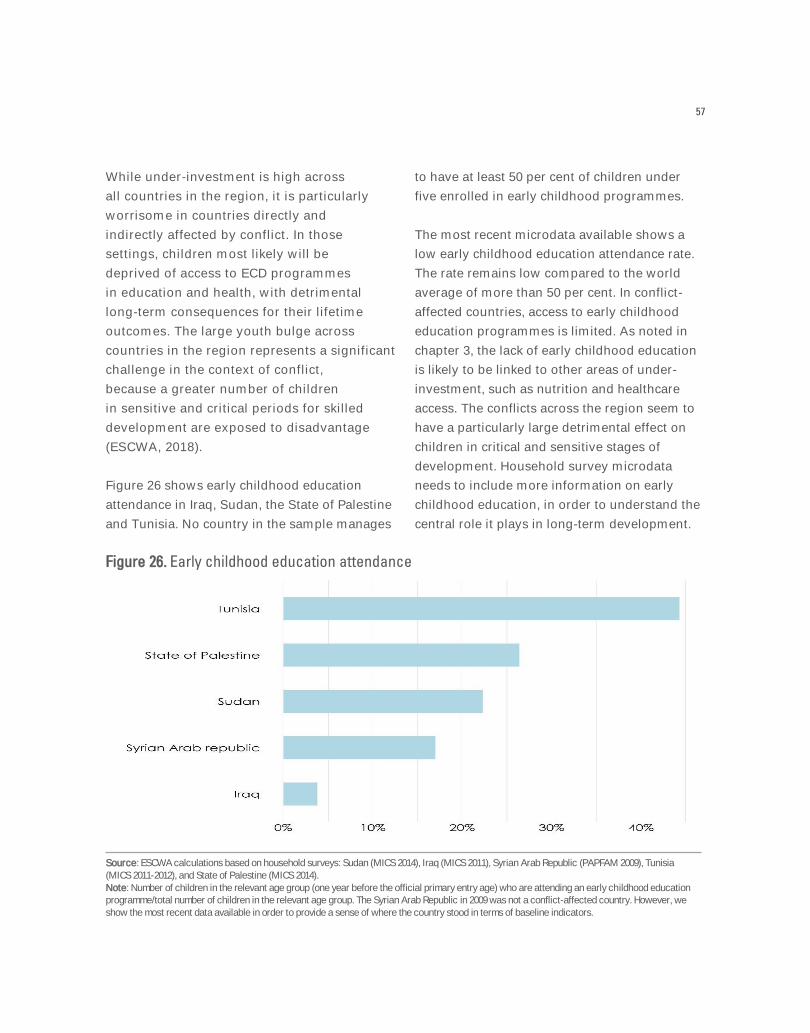
57
While under-investment is high across
all countries in the region, it is particularly
worrisome in countries directly and
indirectly affected by conflict. In those
settings, children most likely will be
deprived of access to ECD programmes
in education and health, with detrimental
long-term consequences for their lifetime
outcomes. The large youth bulge across
countries in the region represents a significant
challenge in the context of conflict,
because a greater number of children
in sensitive and critical periods for skilled
development are exposed to disadvantage
(ESCWA, 2018).
Figure 26 shows early childhood education
attendance in Iraq, Sudan, the State of Palestine
and Tunisia. No country in the sample manages
to have at least 50 per cent of children under
five enrolled in early childhood programmes.
The most recent microdata available shows a
low early childhood education attendance rate.
The rate remains low compared to the world
average of more than 50 per cent. In conflict-
affected countries, access to early childhood
education programmes is limited. As noted in
chapter 3, the lack of early childhood education
is likely to be linked to other areas of under-
investment, such as nutrition and healthcare
access. The conflicts across the region seem to
have a particularly large detrimental effect on
children in critical and sensitive stages of
development. Household survey microdata
needs to include more information on early
childhood education, in order to understand the
central role it plays in long-term development.
Figure 26. Early childhood education attendance
Source: ESCWA calculations based on household surveys: Sudan (MICS 2014), Iraq (MICS 2011), Syrian Arab Republic (PAPFAM 2009), Tunisia (MICS 2011-2012), and State of Palestine (MICS 2014). Note: Number of children in the relevant age group (one year before the official primary entry age) who are attending an early childhood education programme/total number of children in the relevant age group. The Syrian Arab Republic in 2009 was not a conflict-affected country. However, we show the most recent data available in order to provide a sense of where the country stood in terms of baseline indicators.

58
Figure 27. Violent discipline
Source: ESCWA calculations based on household surveys: Yemen (DHS 2013), Sudan (MICS 2014), Iraq (MICS 2011), State of Palestine (MICS 2014), Tunisia (MICS 2011-2012), and Jordan (DHS 2012). Note: Children between 2 and 14 subject to any form of psychological aggression or physical punishment by their caretakers or other household members. The Syrian Arab Republic in 2009 was not a conflict-affected country. However, we show the most recent data available in order to understand where the country stood in terms of baseline indicators.
The Arab region has the highest prevalence
of violent discipline among children aged
2 to 14 compared to other regions of the world
(UNICEF, 2017d). The prevalence is high for all
countries with recent household survey
microdata available. While it is widespread
practice for parents across the region to
discipline their children with physical and/or
psychological aggression, exposure to conflict
is directly associated with an increased
likelihood of violent discipline. Parents more
exposed to violence are more likely to take
out their stress on their children, critically
affecting their children’s well-being.
C. SDG 4: ensure equal access for all women and men to affordable and quality technical, vocational and tertiary education, including university
Figure 28 shows the discrepancy between
urban and rural literacy rates across the Arab
region for women. Worldwide, female literacy
rates lag behind those of males, but the global
average discrepancy is about 5 per cent for
youths and 9 per cent for adults (International
Literacy Data). Only half of the women aged 15
to 49 in Sudan and Yemen are able to read,
whereas about two-thirds of women are

59
literate in Iraq and Egypt. Yet increasing
literacy rates for the women between 15
and 24 reveals a positive development for
female youth. In every Middle Eastern nation
included in the present study, female literacy in
urban areas is significantly higher than
for rural areas. Egypt and the Syrian Arab
Republic will be examined more closely later
in the report.
Higher education is mentioned in target 4.3 of
SDG 4, which aims to ensure equal access for
all women and men to affordable and quality
technical, vocational and tertiary education by
2010. It is associated with other goals related
to the eradication of poverty (SDG1), gender
equality (SDG5), governance and economic
growth (SDG8). While Jordan and the State
of Palestine reach tertiary education rates
for women close to tertiary education averages
in industrialized countries such as the
Czech Republic (Organisation for Economic
Co-operation and Development, 2016), rates in
Tunisia and Iraq are below 20 per cent.
When assessing equal access to primary
schooling, the State of Palestine and Tunisia
perform well, as shown in figure 30. Their parity
indices for primary school range are close to 1
(depicting parity). Iraq exhibits much lower net
attendance ratios for women compared to men;
for rural populations compared to urban ones;
and for the poorest compared to the richest
wealth quintile. Those disparities become
dramatically large for secondary school
enrolment. The State of Palestine and Tunisia
are also not able to maintain equality in terms of
secondary enrolment rates. However, the
gender parity indices for secondary school
largely shift towards women.
Figure 28. Women’s literacy rates
Female literacy rates Female youth literacy rates
Source: ESCWA calculations based on household surveys: Yemen (DHS 2013), Sudan (MICS 2014), Iraq (MICS 2011), Egypt (DHS 2014), and Tunisia
(MICS 2011-2012). Note: Percentage of women aged 15 to 49 and 15 to 24 who are literate.

60
Figure 29. Women with tertiary education
Source: ESCWA calculations based on household surveys: Yemen (DHS 2013), Sudan (MICS 2014), Iraq (MICS 2011), State of Palestine (MICS 2014),
Tunisia (MICS 2011-2012), and Jordan (DHS 2012).
Figure 30. Parity indices in primary and secondary school
Source: ESCWA calculations based on household surveys: Iraq (MICS 2011), Tunisia (MICS 2011-2012), and State of Palestine (MICS 2014). Note: The gender parity index is calculated as the adjusted net attendance ratio (NAR) for girls divided by NAR for boys. Wealth Parity is calculated as adjusted NAR for the richest wealth quintile divided by NAR for the poorest wealth quintile. Area Parity is calculated as adjusted NAR for the rural area divided by NAR for the urban region.

61
D. SDG 4: ensure that all youth and a substantial proportion of adults, both men and women, achieve literacy and numeracy
Education in the Arab region – high enrolment
but low quality of learning
As previously noted in the present study, Arab
countries reached several of the education
targets of the MDGs and were on the way to
achieving the SDGs. By 2005, gross enrolment
rates in primary education reached 83 per cent
across the region, 54 per cent in secondary
education, and 21 per cent in tertiary education
(UNESCO, 2007). Yet that attainment did not
measure the quality of education provided, the
skills imparted, or the requirements necessary
to gain employment.
International policy analysis and advice have
shifted focus from school enrolment alone
to include education quality as well (World
Bank, 2011). Such analysis recognised that
progress towards MDG 2 of universal primary
education did not necessarily equate to
preparedness for higher education or the
workforce, and that quality of education
remained a significant challenge (ESCWA,
2012). Furthermore, enrolment in some cases
referred only to a few sporadic days of
counting pupils in attendance rather than
sustained daily attendance, and measurements
of literacy did not necessarily address
functional literacy. Therefore, quality measures
must accompany enrolment figures, including
but not limited to national and global
standardised tests, quality of teacher training
and regularity of teacher attendance, and
employability of graduates as rated by
employers. Although female enrolment in
school had improved, that did not necessarily
mean quality of education or preparedness for
opportunities after graduation had improved.
One measure of educational quality is the
Organisation for Economic Co-operation and
Development (OECD) Programme for
International Student Assessment (PISA), which
in 2015 tested more than half a million students
in 72 countries. Conducted every three years,
PISA assesses mathematics, science and
reading capabilities in a manner comparable
across countries. The tests are conducted in the
language of local instruction and are
implemented randomly within participating
schools. The Arab countries covered by PISA
testing have fared poorly when compared with
other countries. Scoring scales are based on an
average of 500 across OECD countries. Figure 31
indicates that scores have remained
significantly below that average for Jordan and
Tunisia, the two countries affected by conflict
with data available across time. The relative
ranking of these countries compared to others
involved in PISA is very low. Science was
generally the subject in which students
performed relatively better, and mathematics
the area with the lowest relative results,
although all three subject areas indicate that
significant improvement is needed.
Similarly, Lebanon, which has PISA data
available only for 2015, ranks very low on
reading and science, although less so in in
mathematics (as shown in figure 32). To
corroborate those findings, the global

62
assessments of student achievement in
mathematics and science (TIMSS) results for
2011 indicated that Tunisia ranked 47th and 48th
out of 50 countries in mathematics and sciences
respectively, and Yemen ranked 50th in both
categories. Results of those international
assessments drew attention to Arab
policymakers of the significant shortfall in
quality of education provided (Thacker and
Moreno, 2015).
The effect of poor quality in education, with a
population receiving many years of schooling
yet not necessarily having the skills to succeed,
has been evident in the high unemployment and
lack of opportunities for graduates, oft-cited
causes of the unrest leading to the “Arab
Spring”. High enrolment rates masked severe
shortfalls in the quality of education and
training provided. Those shortfalls remain a key
constraint across the region (UNESCO, 2014).
While analysis of that mismatch between years
of school and employment opportunities has
focused mainly on the lack of economic
opportunities for school graduates, due
attention should also be paid to whether those
graduates have the required cognitive
reasoning, skills and know-how to achieve
success as employees or entrepreneurs. That
mismatch continues to persist today, with no
evidence of improvement.
Given the persisting challenges of stagnation
and lack of opportunities, which led to recent
protests and unrest in Tunisia, the fact that
measures of educational quality have, in fact,
been decreasing does not bode well for future
graduate opportunities. In addition,
demographic trends mean that there will be
even more young Tunisians leaving school,
expecting their education to pay dividends.
Education reform must improve the quality of
education provided; invest more in teachers,
course materials and other factors for
educational attainment; and match instruction
with the abilities and skills needed to help
students succeed.
Figure 31. PISA Score and Ranking
Source: ESCWA calculations based on OECD, 2018. Note: Score (Y-axis) based on scale of OECD average of 500. Ranking (number above bar) reflects different survey sizes in different years.

63
Figure 32. PISA Score and Ranking
for Lebanon 2015
Source: ESCWA calculations based on OECD, 2018. Note: Score (Y-axis) based on scale of OECD average of 500. Ranking (number above bar) reflects different survey sizes in different years.
E. Conclusions
Several household survey programmes
collected across the Arab region by national
statistical offices and international organisations
include important education data that can be
used to produce key education statistics,
including those on educational attainment,
literacy rates, attendance rates, out-of-school
rates, dropout rates, average years of a
population’s schooling, and highest grades
attended. Several other regions and countries of
the world have household survey programmes
that collect data on reading and mathematics
skills. Such data have not been collected in
household surveys for Arab countries.
The new round of UNICEF’s MICs is set to
collect data assessing education quality.
Understanding the role of education quality is
critical for sustainable development. Inequalities
in the quality of education across and within
Arab countries have caused enormous
discontent among youth, which increasingly
face dire labour-market opportunities.
The present chapter combined education data
from micro-level surveys with administrative
data on quality provided by international tests
carried out in a subset of Arab countries. We
used those data to highlight two important
suggestions for micro-level data in the region.
First, we should encourage data collection
efforts on data quality to be added to existent
regularly collected surveys. Second, micro-level
data should be combined with other sources of
administrative data to provide a better tracking
mechanism for reaching SDGs.


5. Living Standards and Conflict (SGD 6, SDG 7 and SDG 11)


67
5. Living Standards and Conflict
(SGD 6, SDG 7 and SDG 11)
Access for all to clean water, adequate sanitation,
clean fuels and electricity is essential for
sustainable development. Such access has an
impact on many areas of development, including
agriculture, energy, disaster resilience, human
heath, the environment and, ultimately, economic
growth. Improved sanitation is an important
condition for reducing mortality and disease at
the household level. Deaths due to unsafe water
and sanitation in the Arab region are higher than
the global average and particularly high in crisis-
affected countries (World Bank, 2018). As a result,
improved sources of water and sanitation are
strongly linked to the achievement of the
sustainable development agenda by 2030,
including SDG 3 (good health and well-being),
SDG 11 (sustainable cities and communities), and
SDG 12 (sustainable consumption).
SDG 6 (clean water and sanitation) and SDG 7
(affordable and clean energy) recognise that
ensuring the availability and sustainable
management of water, as well as affordable and
clean energy, goes beyond mere access to
improved water, sanitation and energy. Water
and energy must meet quality standards. Their
supply must be reliable, affordable and
sustainable in terms of the country’s whole
population. Unsafe water can cause diarrhoea
and cholera, ultimately leading to malnutrition
and increased mortality risk. Diarrhoea is the
second-largest cause of under-five mortality
globally and is associated with a higher risk of
stunting (UNICEF, 2018b). UNICEF has
estimated that diarrhoea-related diseases, linked
to a lack of safe water, sanitation and basic
hygiene, kill approximately 1,400 children under
five every day (UNICEF, 2018b).
Most countries of the Arab region are extremely
water scarce. Protracted conflicts across the
region, coupled with other demographic factors
such as rapid population growth, are
challenging the achievement of sustainable
access to water and sanitation, and are putting
additional pressure on existing energy
infrastructure. Violent conflicts in the Arab
region pose a serious challenge to the progress
that has been achieved in increasing access to
improved water supply and sanitation since
1990. The conflicts have caused severe
destruction of water infrastructure and
institutions, and have halted the provision of
public services. Refugees and displaced persons
also increase pressure on the water, sanitation
and energy infrastructure in host communities
and neighbouring countries.
The World Bank estimates that the costs of
inadequate water supply and sanitation amount
to about 1 per cent of regional GDP annually. In
conflict-affected countries, the economic costs
increase to between 2 per cent and 4 per cent of
GDP annually (World Bank, 2018a). Refugees

68
and internally displaced populations who were
forced from their homes are more vulnerable to
water-related and sanitation-related health
threats (UNICEF, 2018a). In transit, safe drinking
water sources and sanitation facilities often are
not available, exposing people to high risks of
disease and malnutrition. Refugee communities
are increasing pressures on water usage in host
countries. In Jordan, for example, Syrian
refugees pose enormous challenges to water
sustainability. Groundwater depletion has
become a major concern because total water
extraction rates now exceed total renewable
water sources (Farishta, 2014).
Large-scale household surveys, such as DHS and
MICS, provide important and unique data required
to measure the progress towards achieving the
SDGs. The surveys comprise standardised and
comparable information on housing
characteristics across the Arab region critical for
measuring the current state of development in the
areas of water, sanitation, housing conditions and
hygiene. Based on data availability, the present
chapter discusses indicators on the accessibility of
improved water sources, sanitation and hand-
washing facilities, electricity, and clean cooking
fuels for countries in the region.
A. SDG 6: ensure availability and sustainable management of water and sanitation for all
1. Improving access to drinking water
Target 6.1 of the Agenda aims to achieve
universal and equitable access to safe and
affordable drinking water for all by 2030. Most
countries of the Arab region are extremely
water scarce. The region’s demographic,
pollution and environmental factors put
additional pressure on achieving universal
access to clean water and efficient water
management. Infrastructure and environmental
damages brought about by conflict have
strained the situation even further. Host
communities face exacerbated pressures on
limited water resources brought about by
increased water demands of refugees and
displaced persons.
Figure 33. Access to improved sources of drinking water by wealth quintile
Source: UNICEF and WHO, 2015.
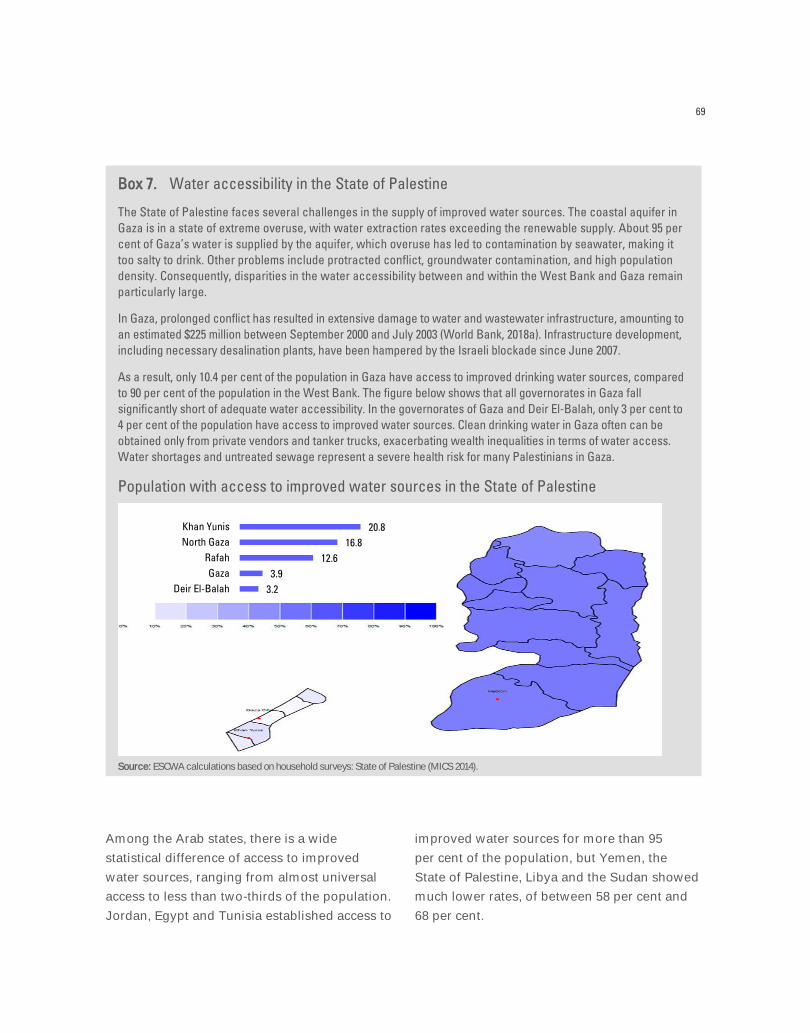
69
Box 7. Water accessibility in the State of Palestine
The State of Palestine faces several challenges in the supply of improved water sources. The coastal aquifer in
Gaza is in a state of extreme overuse, with water extraction rates exceeding the renewable supply. About 95 per
cent of Gaza’s water is supplied by the aquifer, which overuse has led to contamination by seawater, making it
too salty to drink. Other problems include protracted conflict, groundwater contamination, and high population
density. Consequently, disparities in the water accessibility between and within the West Bank and Gaza remain
particularly large.
In Gaza, prolonged conflict has resulted in extensive damage to water and wastewater infrastructure, amounting to
an estimated $225 million between September 2000 and July 2003 (World Bank, 2018a). Infrastructure development,
including necessary desalination plants, have been hampered by the Israeli blockade since June 2007.
As a result, only 10.4 per cent of the population in Gaza have access to improved drinking water sources, compared
to 90 per cent of the population in the West Bank. The figure below shows that all governorates in Gaza fall
significantly short of adequate water accessibility. In the governorates of Gaza and Deir El-Balah, only 3 per cent to
4 per cent of the population have access to improved water sources. Clean drinking water in Gaza often can be
obtained only from private vendors and tanker trucks, exacerbating wealth inequalities in terms of water access.
Water shortages and untreated sewage represent a severe health risk for many Palestinians in Gaza.
Population with access to improved water sources in the State of Palestine
Source: ESCWA calculations based on household surveys: State of Palestine (MICS 2014).
Among the Arab states, there is a wide
statistical difference of access to improved
water sources, ranging from almost universal
access to less than two-thirds of the population.
Jordan, Egypt and Tunisia established access to
improved water sources for more than 95
per cent of the population, but Yemen, the
State of Palestine, Libya and the Sudan showed
much lower rates, of between 58 per cent and
68 per cent.
20.8
16.8
12.6
3.9
3.2
Khan Yunis
North Gaza
Rafah
Gaza
Deir El-Balah

70
There are significant disparities between the
accessibility of improved water sources across
wealth quintiles and between urban and rural
areas. While the disparity between urban and rural
areas is sizeable about 13 per cent on average
the disparity between wealth quintiles is more
pronounced. Most notable is that countries with
restricted total accessibility have difficulties in
providing equal access to all citizens, across their
area of residence or income status.
Jordan and Egypt, for example, manage to
supply their citizens with almost equal access to
water in urban and rural areas. Wealth
endowment in those countries does not
significantly affect their population’s access to
improved water sources. On the other side of
the spectrum, Yemen, the Sudan and Iraq
supply water access to between 15 per cent and
26 per cent less of the population in rural areas
than to the population in urban areas. In the
Sudan and Yemen, the population with access
to improved water sources in the wealthiest
quintile is twice as large as that of the
population in the poorest quintile. The State of
Palestine represents an extreme case, where
only 2 per cent of the population in the poorest
wealth quintile has access to improved water,
while the richest wealth quintile reaches almost
100 per cent accessibility. The extreme disparity
originates from the fact that most of the
population in the poorest wealth quintile lives in
the Gaza strip, an area exposed to prolonged
crisis and a weak institutional capacity, as
discussed in box 7.
2. Improving access to sanitation facilities
Target 6.2 of the SDGs aims for access to
adequate, equitable sanitation and hygiene for
all by 2030. Sanitation facilities have a
significant impact on the transmission of
infectious diseases, the risk of illness and death
(WHO, 2015). Access to improved sanitation
facilities is crucial for achieving child health and
reducing malnutrition.
While most Arab states have succeeded in
providing access to improved sanitation
facilities for more than 90 per cent of their
populations, the LDCs of the Sudan and
Yemen have significantly lagged behind in
terms of adequate sanitation infrastructure. In
the Sudan, only 33 per cent of people have
access to improved sanitation, while 55 per
cent have access to a hand-washing facility
with soap and water. In the Sudan and Yemen,
there is a serious shortage of hygienic toilet
facilities in rural areas and for the poorest
population quintile.
In countries exposed to high-intensity
conflict, water networks have collapsed,
increasing the risks of cholera and acute
diarrhoea. In Yemen, violent conflict has
damaged water supply networks and cut off
about 15 million people from regular access to
water and sanitation. A major cholera outbreak
occurred in 2017. Between April and June
2017, 400,000 cases of suspected cholera and
almost 1,900 associated deaths were recorded
(UNICEF, 2017c).
Figure 35 shows the access to improved
sanitation facilities by governorates in Yemen
for 2013. Even before the outbreak of civil war,
a majority of the population lacked access to
improved water facilities. Rural households in
the eastern governorates were largely exposed
to bad sanitation conditions.
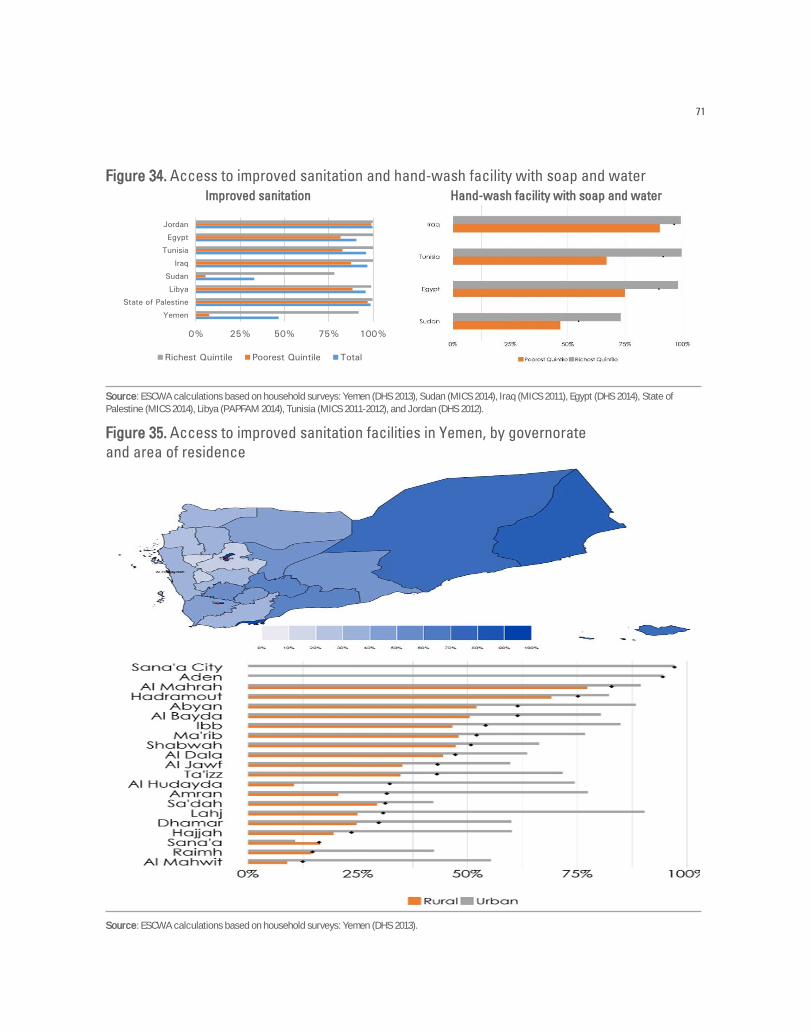
71
Figure 34. Access to improved sanitation and hand-wash facility with soap and water
Improved sanitation Hand-wash facility with soap and water
Source: ESCWA calculations based on household surveys: Yemen (DHS 2013), Sudan (MICS 2014), Iraq (MICS 2011), Egypt (DHS 2014), State of
Palestine (MICS 2014), Libya (PAPFAM 2014), Tunisia (MICS 2011-2012), and Jordan (DHS 2012).
Figure 35. Access to improved sanitation facilities in Yemen, by governorate
and area of residence
Source: ESCWA calculations based on household surveys: Yemen (DHS 2013).
0% 25% 50% 75% 100%
Yemen
State of Palestine
Libya
Sudan
Iraq
Tunisia
Egypt
Jordan
Richest Quintile Poorest Quintile Total
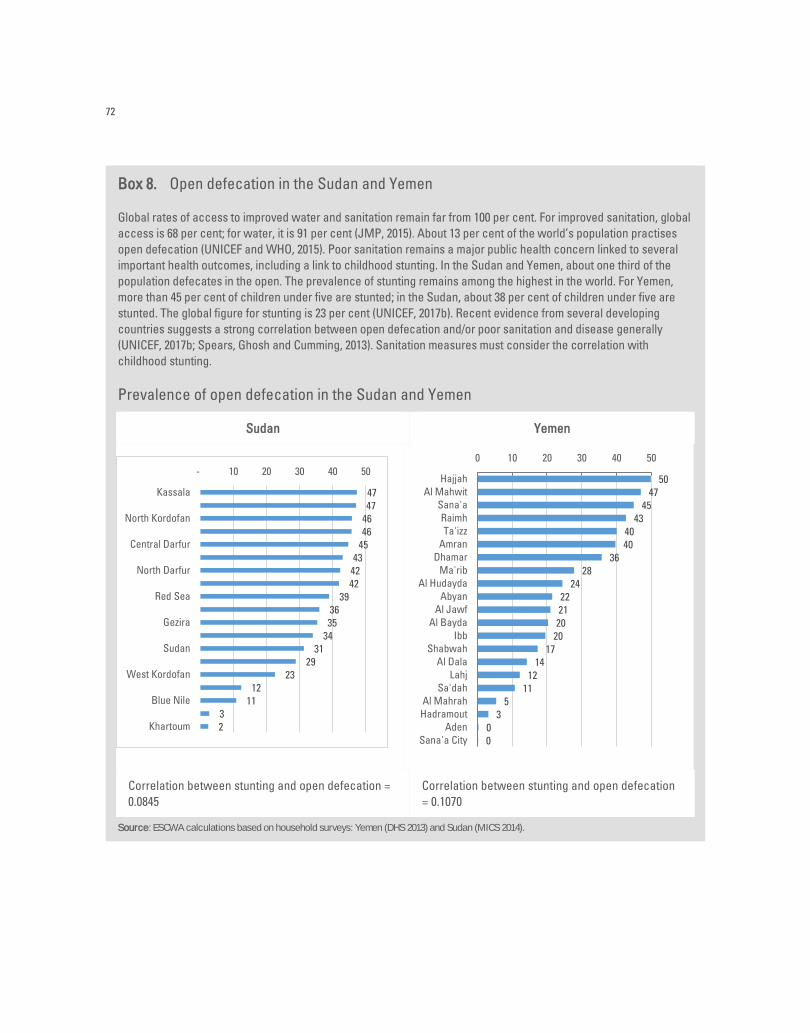
72
Box 8. Open defecation in the Sudan and Yemen
Global rates of access to improved water and sanitation remain far from 100 per cent. For improved sanitation, global
access is 68 per cent; for water, it is 91 per cent (JMP, 2015). About 13 per cent of the world’s population practises
open defecation (UNICEF and WHO, 2015). Poor sanitation remains a major public health concern linked to several
important health outcomes, including a link to childhood stunting. In the Sudan and Yemen, about one third of the
population defecates in the open. The prevalence of stunting remains among the highest in the world. For Yemen,
more than 45 per cent of children under five are stunted; in the Sudan, about 38 per cent of children under five are
stunted. The global figure for stunting is 23 per cent (UNICEF, 2017b). Recent evidence from several developing
countries suggests a strong correlation between open defecation and/or poor sanitation and disease generally
(UNICEF, 2017b; Spears, Ghosh and Cumming, 2013). Sanitation measures must consider the correlation with
childhood stunting.
Prevalence of open defecation in the Sudan and Yemen
Sudan Yemen
Correlation between stunting and open defecation =
0.0845
Correlation between stunting and open defecation
= 0.1070
Source: ESCWA calculations based on household surveys: Yemen (DHS 2013) and Sudan (MICS 2014).
0
0
3
5
11
12
14
17
20
20
21
22
24
28
36
40
40
43
45
47
50
0 10 20 30 40 50
Sana'a City
Aden
Hadramout
Al Mahrah
Sa'dah
Lahj
Al Dala
Shabwah
Ibb
Al Bayda
Al Jawf
Abyan
Al Hudayda
Ma'rib
Dhamar
Amran
Ta'izz
Raimh
Sana'a
Al Mahwit
Hajjah
2
3
11
12
23
29
31
34
35
36
39
42
42
43
45
46
46
47
47
- 10 20 30 40 50
Khartoum
Blue Nile
West Kordofan
Sudan
Gezira
Red Sea
North Darfur
Central Darfur
North Kordofan
Kassala

73
B. SDG7: ensure access to affordable, reliable, sustainable and modern energy for all
Target 7.1 of the SGDs aims to ensure universal
access to affordable, reliable and modern
energy services by 2030. Improving access to
clean and modern energy technologies in the
home will improve health and social well-being,
as well as contribute to long-term sustainability
goals. The inefficient combustion of solid fuels
and traditional biomass leads to household air
pollution and safety concerns. As women in the
region are traditionally responsible for
household chores, they are disproportionally
affected by the lack of clean energy. Research
on access to electricity and clean energy
stresses the adverse impact on socioeconomic
development (Aklin and others, 2017)
and gender equality (Halff, Sovacool
and Rozhon, 2014).
Most of the conflict-affected countries for which
survey data are available are performing well at
the country level in terms of providing access
for their citizens to electricity and clean fuels.
Jordan and the State of Palestine reach almost
100 per cent in terms of electricity coverage.
Iraq, Tunisia and Libya reach about 96 per cent
of electricity coverage. In Egypt, about 90 per
cent of households report electricity access and
the use of clean fuels for cooking. The Sudan
and Yemen lag significantly behind. In the
Sudan, less than 45 per cent of the population
can access electricity, and less than 42 per cent
of the population primarily rely on clean fuels.
Figure 36. Population with access to electricity and primary reliance on clean fuels
Access to electricity Primary reliance on clean fuels
Source: ESCWA calculations based on household surveys: Yemen (DHS 2013), Sudan (MICS 2014), Iraq (MICS 2011), Egypt (DHS 2014), State of Palestine (MICS 2014), Tunisia (MICS 2011-2012), and Jordan (DHS 2012).

74
In the Sudan and Yemen, low levels of electricity
access and clean fuel use are coupled with wide
inequality across income distributions and area of
residence. Breaking down access to electricity and
clean fuels by wealth indicator in the Sudan
shows that mainly the poor and the middle-
income quintile are affected by restricted
electricity and availability of clean fuels. Between
95 per cent and 100 per cent of the population in
the poorest and second-poorest wealth quintiles
still rely on traditional biofuels such as wood,
charcoal, crops or other agricultural waste and
dung. Rural and lower-income populations suffer
from the least access to electricity and clean fuels.
Further disparities become obvious when
looking at the regional breakdown of energy
usage in the Sudan. While the Nubia province
and Gezira governorate reach electricity and
clean energy coverage close to their regional
peers, the populations living in the Darfur and
Kordofan provinces in south-western Sudan
face substantial restrictions in access to energy
(figure 38). By contrast, Egypt, Iraq, Jordan, the
State of Palestine and Tunisia provide equal
access to electricity across their governorates,
as illustrated in figure 39 for Tunisia.
Looking at the electricity access across urban
and rural areas within the governorates of the
Sudan shows that mainly rural households are
affected by the lack of electricity infrastructure.
That disparity becomes even larger in
governorates with low electricity access. In the
Darfur and Kordofan provinces, only 5 per cent
of the rural population have access to electricity,
compared to up to 47 per cent in some rural
areas of the north-eastern provinces, although
access rates are diverse within rural
governorates (figure 40). Limitations in access
to electricity and clean fuels primarily affect
rural and lower-income populations.
Figure 37. Access to electricity and primary reliance on clean fuels in the Sudan and Iraq
Sudan Iraq
Source: ESCWA calculations based on household surveys: Sudan (MICS 2014), and Iraq (MICS 2011).

75
Figure 38. Access to electricity across governorates in the Sudan
Source: ESCWA calculations based on household surveys: Sudan (MICS 2014).
Figure 39. Access to electricity across governorates in Tunisia
Source: ESCWA calculations based on household surveys: Tunisia (MICS 2011-2012).

76
Figure 40. Access to electricity across governorates in the Sudan, by area of residence
Source: ESCWA calculations based on household surveys: Sudan (MICS 2014).
Figure 41. Primary reliance on clean fuels across governorates in the Sudan,
by area of residence
Source: ESCWA calculations based on household surveys: Sudan (MICS 2014).

77
Figure 42. Primary reliance on clean fuels across governorates in Iraq
Source: ESCWA calculations based on household surveys: Iraq (MICS 2011).
Examining the use of clean fuels across
governorates reveals a similar picture. While the
Sudan shows large differences in the use of clean
fuels, with populations in the south-eastern
provinces of Kordofan and Darfur primarily using
solid fuels, Iraq, the State of Palestine and
Tunisia have equality of access to clean fuels for
cooking. However, figure 42 shows that lower
rates of clean fuel use in governorates are driven
by lower access in rural areas.
C. SDG 11: make cities and human settlements inclusive, safe, resilient and sustainable
Target 11.1 of the SDGs seeks to ensure access
to adequate, safe and affordable housing and
basic services for all by 2030. Inadequate
housing is a determinant of poverty and has a
negative impact on children’s health and
people’s well-being. Impediments to child health
and the development of cognitive abilities
prevent social mobility; can consolidate
intergenerational poverty; and impede young
people’s opportunities. The people most
vulnerable to health problems are those who
spend the most time indoors: infants, children,
the elderly, and the ill. Refugees and internally
displaced persons are also among the most
vulnerable groups in terms of inadequate
housing, as they are forced to live in temporary
shelters with little space.
Research on housing conditions show that
several dimensions of children’s well-being

78
suffer when exposed to crowded living
conditions, including academic achievement,
behaviour, and health (Solari and Mare, 2012).
The World Bank examined health outcomes of
families which had their dirt floors replaced by
cement floors during a large-scale government
programme in Mexico (Cattaneo and others,
2007). The study found large health
improvements of programme participants, with
parasitic infestations falling by 78 per cent;
cases of diarrhoea decreasing by 49 percent;
and an improvement in cognitive development
of up to 96 per cent.
Households with dirt floors are widespread in
the Sudan and rural areas of Yemen. In Yemen,
the regional disparities are large and depend
mainly on the percentage of rural residential
areas in governorates (see figure 43).
Overcrowded housing, to a certain extent,
affects all countries experiencing conflict
across the Arab region. The Sudan and Yemen
have higher average overcrowding rates, with
21 per cent of overcrowded households in
Yemen and 14 per cent in the Sudan. Within
those countries, disparities do not seem to play
a major role. The remaining countries exhibit
lower overcrowding rates, but crowded
housing is a greater concern in Libya and Iraq.
Less than 2 per cent of households in the State
of Palestine, Jordan and Tunisia are
overcrowded. In Libya, 7 per cent of
households are overcrowded. In Iraq, 9
per cent of households are overcrowded.
Figure 43. Population living with dirt floors and in overcrowded households
Dirty floor Overcrowding
Source: ESCWA calculations based on household surveys: Yemen (DHS 2013), Sudan (MICS 2014), Iraq (MICS 2011), Egypt (DHS 2014), State of
Palestine (MICS 2014), Libya (PAPFAM 2014), Tunisia (MICS 2011-2012), and Jordan (DHS 2012).

79
Figure 44. Households with dirt floors across Yemen’s governorates
Source: ESCWA calculations based on household surveys: Yemen (DHS 2013).
Figure 45. Households covered by a mobile phone network
Source: ESCWA calculations based on household surveys: Yemen (DHS 2013), Sudan (MICS 2014), Iraq (MICS 2011), State of Palestine (MICS 2014),
Tunisia (MICS 2011-2012), and Jordan (DHS 2012). Note: Mobile phone network in the State of Palestine refers to individuals with smart mobile phones.

80
D. SDG 9: promote inclusive and sustainable industrialisation and foster innovation
One of the targets included in SDG 9 aims to
significantly increase access to information and
communications technology by 2030. The
proportion of population covered by a mobile
phone network is quite high in the Arab region,
although the State of Palestine, the Sudan and
Yemen significantly lag behind their regional
peers. However, data on the State of Palestine
are restricted to information on the availability
of smart mobile phones, which makes that data
less comparable with the rest of the region.
E. Conclusions
Living standards, including access to improved
water and sanitation, have steadily increased
across the region. Only the LDCs studied in the
present report are behind in terms of access to
improved water and sanitation. The
interconnectedness of those goals with good
health was described throughout the chapter.
Reaching the SDG target of universal access to
water and sanitation by 2030 will require
disproportionately higher efforts by the LDCs in
the region. Our indicators point to the
importance of narrowing the urban-rural divide.
While progress was made in most countries in
the region during previous decades, exposure to
conflict decelerated those trends and, in many
cases, wiped out the progress made. In the
State of Palestine during the 1990s, there was
universal improved water access. In recent
years, the provision of improved water sources
declined. In addition to the provision of water
and sanitation, the SDGs seek to ensure access
to adequate, safe and affordable housing and
basic services for all by 2030. Dirt floors and
overcrowding are prevalent in the Sudan and
Yemen. In the Sudan and Yemen, low levels of
electricity access and clean fuel use are coupled
with high inequality across income distributions
and the areas of residence.
While many indicators can be calculated from
standardised household surveys such as MICs
and DHS, there are limitations to the
information contained in such surveys. With
respect to SDG 6, we have little information on
several major issues. Those issues include
water use efficiency, water resources
management, plus quality and reliability of
water access. They also include environmental
considerations, such as pollution,
contamination, and untreated sewage. The data
on clean energy access cannot tell us whether a
household’s energy supply is affordable, reliable
and/or complies with modern standards. The
authors of the present report encourage the
collection of such information in surveys in
order to provide a greater source of information
from which to track progress towards
sustainable development.

6. Measuring Labour-Market Progress in Conflict Settings (SDG 8)


83
6. Measuring Labour-Market Progress
in Conflict Settings (SDG 8)
A. Introduction: the importance of employment for achieving SDG 8
SDG 8 is pivotal in addressing how people can
emerge from poverty and provide sustainable,
healthy lifestyles through productive
employment. Indeed, one of the key
implications of the 2030 Agenda is clear in SDG
8 — that long-term socioeconomic progress
will be reached and financed through
sustainable economic opportunities, plus
employment and earnings, rather than through
reliance on aid or assistance programmes. It
also emphasises the importance of mutually
reinforcing relationships among citizens, job
seekers, the state, the private sector and
society in general.
Given the importance of gainful employment,
and the severity of unemployment, in the Arab
region, especially among youth, the following
analysis focuses on job prospects for citizens,
particularly women and youth, in countries
affected by conflict. Poor and unequally
distributed economic opportunities are one of
the most oft-cited causes of the anger and
despair among Arab populations at the time of
the Arab uprisings in 2011 (ESCWA, 2016).
Economies ravaged by conflict, or suffering
from uncertainty, offer even fewer
opportunities for employment. Shops, factories
and offices have been destroyed. Trade routes
for agricultural and manufactured products
have been blocked. Demand for services has
fallen. All those factors perpetuated and
exacerbated the already existing problem of
access to work and economic opportunities in
the region.
Labour indicators are also a key measure of
the link between economic activity and
socioeconomic development, through the
welfare of individual wage earners and the
households that depend on them. Other
economic indicators, such as growth or
income per capita, can in isolation be
superficial and ignore the gap in opportunities
or poor distribution of earning potential. High
per capita incomes based on resource exports
indicate nothing of the often low propensity
of such resource sectors to generate jobs
(ECA, 2017). Growth is also misleading in that
a post-conflict rebound might look impressive
in aggregate figures yet might merely reflect
the return to production that had faltered
during the period of conflict. Other indicators,
including those of productivity and
diversification, are difficult to measure
in conflict-affected countries. Also, they
do not prioritise job creation to meet a
growing population’s demand. The large
and growing proportion of young people
in the Arab region has been presented
as both a possible opportunity for productive

84
dividend and a potential liability
for unemployment and discontent
(World Economic Forum, 2014).
B. Status of employment opportunities in Arab countries affected by conflict
Data from available national labour force
surveys conducted in Arab countries
experiencing conflict, or affected by conflict
in neighbouring countries, indicate the status of
employment opportunities in those countries.
Sampling methodologies consider regional and
country context specificities. Households are
sampled to match characteristics of the
subnational and national population. The main
indicators calculated from the surveys include:
• The unemployment rate, which is the rate of
unemployed persons available and seeking
work (that is, active in the labour force);
• The employment rate, which is the rate of
employed persons in the working age
population (persons above 15 years old);
• The labour-force participation rate,
calculated as the ratio of the labour force to
the working age population (persons above
15 years old).
All three indicators are disaggregated by gender
and for youth (aged 15 to 24).
The availability of finance and expertise to
conduct household surveys is limited at the
best of times but, in conflict- and crisis-prone
countries, it is especially difficult. Survey
results are available for only some years and
some crisis-affected countries in the region.
The countries and years for which data are
available are presented below. The results for
each indicator are compared with the
corresponding average across States, in each
country’s sub-region for the year in question,
based on International Labour Organization
Stat-modelled outcomes.9 Those modelled
outcomes closely resemble the results of
national labour force surveys, with the notable
exception of Yemen, highlighting the impact
that crises can have on previous estimates and
the resulting need to collect microdata in areas
of conflict and crisis.
1. Unemployment
A general trend in unemployment across the
countries discussed is clear, with rates for
countries in and affected by conflict at the
same level or higher than subregional
averages, regarding total unemployment,
youth unemployment, and employment for
men and women measured separately. Iraq is
the only outlier in which survey data reveals
unemployment rates lower than the regional
average. Not surprisingly, in general, youth
unemployment is higher than for the other
groups measured, followed closely by
unemployment of women, with male and total
and unemployment considerably lower.
However, in Yemen, unemployment of women
is the highest category, followed by youth
unemployment. Those findings confirm
observations of the limited economic
opportunities and severe difficulties in
finding work across the region, particularly
in countries in crisis and particularly for
the young.

85
Figure 46. Unemployment, Employment-to-population ratio, and Labour force participation
Source: ESCWA calculations for all histograms based on national labour force surveys, ILO, 2018.
0%
10%
20%
30%
40%
50%
60%
70%
Egypt 2014 Iraq 2012 Jordan 2014 State of
Palestine 2014
Tunisia 2013 Yemen 2013
Un
em
plo
yme
nt
Countries
Men
Total
Women
Youth
0%
10%
20%
30%
40%
50%
60%
70%
80%
Egypt 2014 Iraq 2012 Jordan 2014 State of
Palestine 2014
Tunisia 2013 Yemen 2013
Em
plo
yme
nt-
to-p
op
ula
tio
n r
ati
o
Countries
Men
Total
Women
Youth
0%
10%
20%
30%
40%
50%
60%
70%
80%
Egypt 2014 Iraq 2012 Jordan 2014 State of
Palestine 2014
Tunisia 2013 Yemen 2013
Lab
ou
r fo
rce
pa
rtic
ipa
tio
n
Countries
Men
Total
Women
Youth

86
Figure 47. Unemployment for the male population in Tunisia and Yemen
Source: ESCWA calculations based on Labour Force Surveys for Tunisia (2013) and Yemen (2013).
2. Labour-force participation
Like the case of unemployment, although to a
lesser degree, labour-force participation (LFP) in
conflict-affected countries reflects a more
negative picture than in the Arab region in
general. Some countries have a higher LFP than
the regional average for certain groups
measured. For all countries, LFP for women is
the lowest of all groups measured, with no
country having more than 30 per cent of women
of working age in the labour force. LFP becomes
progressively higher, although still low, for
youth, then total LFP, and finally for men.

87
Figure 48. Female labour-force participation rates across governorates in Egypt and Iraq
Source: ESCWA calculations based on Labour Force Surveys for Egypt (2014) and Iraq (2012).
3. Employment
The employment-to-population ratio for the
countries studied is, with very few exceptions,
significantly lower than subregional averages.
As with LFP, this ratio is lowest for women,
followed by youth, total employed, and highest
for men. The fact that employment and LFP
rates are relatively worse for women than
unemployment rates are reveals that the
situation for women looking for work is
particularly bleak, across the region in general
but more acutely in conflict-affected countries.
4. Proportion of youth not in education,
employment or training
A final indicator that illustrates the severity
of lack of opportunities is the proportion
of youth not in education, employment
or training. Based on labour force surveys,
that proportion is nearly one-third of
all youth in the countries for which data
is available, apart from Yemen, in which
nearly half of all youth fitted into that
category. The proportion for women was
considerably higher.

88
Figure 49. Proportion of youth (15-24 years) not in education, employment or training
Source: ESCWA calculations based on ILO, 2018.
5. Informality
Labour markets in Arab States are widely
characterised by predominantly public sector
employment and a weak private sector coupled
with a large informal economy. The countries
studied in the present report exhibit overall
high public sector employment levels, ranging
from 23 per cent to 34 per cent of total
employment, exceeding the OECD average of
21 per cent (see figure 50) (OECD, 2015).
Moreover, most economies in Arab States
suffer from structural rigidities in labour
markets that have limited job-creation
possibilities in the private sector (Yousef,
2004). As a result, labour markets in the Middle
East and North Africa are among the most
informal economies in the world (Angel-
Urdinola and Tanabe, 2012). Informal
economies offer employment opportunities
outside the often heavily regulated and
bureaucratic private sector. Among other
consequences, income from informal
employment is not taxed.
Yet informal employment is vulnerable in
nature, associated with low wages; high
insecurity; difficult working conditions; no
access to health insurance or social protection,
such as pensions or income security.
Therefore, it ultimately conflicts with achieving
decent work conditions as stipulated by SDG 8.
Given the Arab youth bulge and associated
youth unemployment ranging from 18 per cent
in Iraq to 42 per cent in Yemen, the informal
economy offers the only income prospect for
many young people during their transition
to adulthood.

89
Figure 50. Public Sector employment in Arab States in conflict
Source: Labour Force Surveys and Living Standards Measurement Studies.
In the absence of sufficient employment
opportunities in the public and private sectors,
particularly for youth, the informal economy has
provided a source of income for a large
proportion of the population in Arab States. The
informal sector also represents the main
employment market for refugees, because
refugees often face onerous restrictions in the
formal labour markets of their host
communities. The current conflict and terrorism
in the region, with the associated forced
migration and internal displacement, have
exacerbated the prevalence of unemployment
and informal employment.
Reliable data on informal labour are available for
even fewer countries and years than the other
indicators assessed above. By their nature, jobs
that are not formally registered with authorities
for tax and census purposes are difficult to
measure and count formally. In the absence of tax
information or formal registration in the informal
economy, household surveys provide useful
information capturing informal and precarious
employment data. The definition of informal jobs
of employees from microdata surveys is
employment where employees do not have an
employment contract, or where employees are
not entitled to paid annual leave, sick leave or
social security registration (ILO, 2013).
Available data on the informal sector reveal
that, in 2009, 51.2 per cent of employment was
in the informal sector in Egypt. In the State of
Palestine, the proportion increased from 57.2
per cent in 2010 to 62 per cent in 2016 (ILO,

90
2018). Four North African countries for which
data was available reveal informal employment
accounting for between 40 per cent and 80 per
cent of non-agricultural employment (ILO,
2009).10 Data from the Labour Force Survey for
Yemen reveals that 73 per cent of employed
persons worked in the informal sector in 2013.
The proportion was slightly higher for men than
for women and particularly high for persons
between 15 and 24, with the percentage of
youth working in the informal sector accounting
for up to 83 per cent (ILO, 2015). In the State of
Palestine, about 80 per cent of waged
employees in the private sector have no benefits
in terms of contributions to a pension fund, paid
annual leave or sick leave. About 73 per cent
have no written work contract (State of
Palestine, Central Bureau of Statistics, 2015).
6. Subnational results
The labour surveys used for the analysis above
also provide data at subnational levels,
disaggregated by governorate and urban
compared to rural areas. With regard to the
urban-rural divide, labour indicator outcomes
are slightly better in rural areas, with
unemployment lower for three of the five
countries.11 LFP is higher or at the same level for
four of the five countries, and employment is
higher for three of the five countries. Jordan
and Yemen have slightly better labour
outcomes for urban areas.
The differing results reflect differing mobility of
workers and labour markets in urban and rural
areas. Workers often move from rural areas,
which have relatively high levels of employment
in agriculture but lower incomes and standards
of living, to urban areas in search of higher
wages and better opportunities. On the one
hand, those opportunities are difficult to secure
in what is a more competitive labour market.
Movement of people in search of better
economic opportunities and safer areas to live
and work reduce the labour-to-employment
ratio in cities dependent on industry services,
trade and exports, especially in conflict-affected
countries. On the other hand, there are more
opportunities for employment in a diverse range
of service and industry sectors in urban rather
than rural areas, as well as better infrastructure
and other services, which can lead to better
labour outcomes in urban centres (Boughzala
and Hamdi, 2014).
To assess regional disparities further, given the
protests during the Arab Spring that economic
opportunities did not extend beyond well-
connected elites in Arab capitals and major
cities, we compared labour indicators for those
capitals and the rest of the country. Table 6
shows the rank of each capital or largest city
compared to other regions of comparison in
each country. With some exceptions, capital
cities rank roughly in the middle of regional
performance on labour indicators. Therefore,
political and economic centres do not
outperform the rest of the country or reveal a
favourable bias in economic opportunities,
depending on the country in question, as far as
the general measures of unemployment,
employment and LFP are concerned.

91
Table 5. Labour indicators in urban and rural areas, for available countries and years
Unemployment Labour Force Participation Employment
urban rural urban rural urban rural
Egypt, 2014 15.6 10.9 45.8 49.9 38.7 44.5
Iraq, 2012 11 6.3 43 45.1 37.3 40.6
Jordan, 2014 11.5 12.9 37.6 37 33.3 32.2
State of Palestine, 2014 24.7 17.9 43.6 47.5 32.8 39
Yemen, 2013 20.1 26.3 43 43 34.3 31.7
Source: ESCWA calculations based on National Labour Surveys.
Table 6. Rank of labour indicators in largest city compared to the rest of the country
Unemployment LFP Employment
Cairo, Egypt, 2014 24th/27 23rd/27 24th/27
Baghdad, Iraq, 2012 16th/18 6th/18 11th/18
Amman, Jordan, 2014 2nd/12 6th/12 5th/12
Tunis, Tunisia, 2013 12th/24 10th/24 10th/24
Sana'a, Yemen, 2013 6th/21 15th/21 11th/21
Source: ESCWA calculations based on National Labour Surveys.
C. Challenges and conclusions
Research findings illustrate several challenges
facing labour and employment across the Arab
region, which was a key issue contributing to
the 2011 Arab uprisings, and was exacerbated
by a series of crises that escalated into conflict
and spread across borders. Progress in terms of
achieving SDG 8 was compromised, one of
many factors in which negative trends both
contributed to, and exacerbated, crises, in a
destructive cycle. Unemployment, poor access
to economic opportunities, low participation of
women, and limited prospects for the young
were all issues before the crises, despite some
progress, especially female empowerment and
economic participation in terms of the SDGs
(ESCWA, 2017a). Even in the case of de-
escalation of some violent conflicts, Arab
countries could continue to face the pressures
that caused the crises in 2011. There are clear
long-term implications of extended periods of
unemployment and failure to secure job
opportunities, with job seekers – particularly the
young – discouraged and exiting the formal
labour market (ILO, 2012).
Several systemic challenges also affect job
prospects in the region. There has been an
overall lack of diversification into new job-

92
creating sectors, with continued dependence on
oil and gas sectors in many countries. Those
sectors have fewer job-creating multipliers and
externalities than industry and services. Most of
the structural changes achieved have not
yielded enough formal, high-paying jobs
(ESCWA, 2017b). The slump in oil prices, and
the poor outlook for global oil demand, have
exerted negative pressure on jobs created by
the sector directly and indirectly. The large
proportion of public sector employment, and
the domination of well-connected university
graduates in the limited opportunities offered by
the formal private sector, have reduced the
attractiveness of the formal private sector to
those not part of the elite, leading to reduced
competition within the formal private sector
(World Economic Forum, 2014).
Low investments in education outcomes and
limited focus on the quality of learning have led
to a mismatch between skills demanded by the
private sector and skills attained by graduates
(as was pointed out in Chapter 3). Arab
countries suffer from overall lack of incentives
to change that structure. Economic rents accrue
from resource exports regardless of job
creation, and the systemic issues and economic
structures in place would require concerted
efforts to transform them.

7. Conclusion


95
7. Conclusion
The United Nations 2030 Agenda for Sustainable
Development has generated great expectations
for development progress. To ensure that
countries in the Arab region can progress
towards achieving the 17 Sustainable
Development Goals (SDGs) and their targets,
high-quality and disaggregated data are required.
They must be reliable and easy to use for a large
range of users, including decision makers at all
levels. Current data collection efforts across the
region fall short in terms of tracking progress
towards the Agenda. Better data availability is
crucial for designing public policy across the
Arab region, especially in countries experiencing
conflict and the neighbouring countries affected.
While the infrastructure is in place to collect
microdata across the region, substantial efforts
are required to produce more timely and better
quality data, including information on populations
touched by crises and conflicts. Increased
investment in data collection across the region is
required. The present report provides guidance
on how to leverage existing data, so that it can be
used better by policymakers and academics. The
regular collection of micro-level data across
countries is possible because it is part of the
existing statistical infrastructure of most countries
in the region. The data are highly representative
of national populations; are collected at regular
intervals; and include measures of population
characteristics required for SDG indicator
disaggregation.
Capacity building is required to improve the
availability and quality of data on sustainable
development. High-quality and sustainably
produced statistics are essential, both for setting
targets and for monitoring progress. With the
data already collected across countries in the
region, we can set baselines for tracking and
monitoring SDG progress in crisis-affected
countries. Measuring progress requires
comprehensive monitoring and a robust
accountability mechanism. Further investment
in national statistical systems and capacity
development are needed for national data
collection, data processing and analysis,
and the extraction of high-quality, further
disaggregated data.
We have summarized a set of SDGs and the
corresponding indicators that can be produced
from existing microdata collected across the
region Those indicators will need to be
complemented by other sources of aggregated
and administrative data but represent an
opportunity for the region as a whole, and for
conflict-affected countries in particular, to
establish baselines and tracking mechanisms
that can be further improved over time. The
indicators produced in the present report are
meant to present complex data and trends in
simplified form for policymakers, so that policy
formulation can be based on information that is
evidence based and transparent.


97
Bibliography
Aklin, Michaël, and others (2017). Does basic energy access generate socioeconomic benefits? A field experiment with off-grid solar
power in India. Science Advances, vol. 3, No. 5 (May).
Angel-Urdinola, Diego F., and Kimie Tanabe (2012). Micro determinants of informal employment in the Middle East and North Africa
region. Social Protection and Labor Discussion Paper, No. 1201 (January). Washington, D.C.: World Bank. Available at
http://siteresources.worldbank.org/SOCIALPROTECTION/Resources/SP-Discussion-papers/Labor-Market-DP/1201.pdf.
Barro-Lee (2016). Education Attainment for Population Aged 15 and Over Dataset. Available at www.barrolee.com/. Accessed on 12
June 2018.
Boughzala, Mongi, and Mohamed Tlili Hamdi (2014). Promoting inclusive growth in Arab countries: rural and regional development
and inequality in Tunisia. Global Economy and Development Working Paper, No. 71 (February). Massachusetts: The Brookings
Institute.
Brück, Tilman, and others (2013). Measuring conflict exposure in micro-level surveys. Living Standards Measurement Study-
Integrated Surveys on Agriculture, Discussion Paper, August. Washington, D.C.: World Bank. Available at
http://siteresources.worldbank.org/INTSURAGRI/Resources/7420178-
1294259038276/Measuring_Conflict_in_Micro_Level_Surveys.pdf.
Case, Anne, and Christina Paxson (2010). Causes and consequences of early life health. NBER Working Paper Series, No. 15637.
Massachusetts: National Bureau of Economic Research.
Cattaneo, Matias D., and others (2007). Housing, health and happiness. Policy Research Working Paper, No. 4214. Washington, D.C.:
World Bank.
Chen, Martha, and Jenna Harvey (2017). The informal economy in Arab nations: a comparative perspective. Paper for Arab Watch
Report on Informal Employment in MENA Region. Manchester: Women in Informal Employment: Globalizing and Organizing.
Available at http://www.wiego.org/sites/default/files/resources/files/Informal-Economy-Arab-Countries-2017.pdf.
Croicu, Mihai, and Ralph Sundberg (2017). UCDP Georeferenced Event Dataset Codebook Version 18.1. Stockholm: Uppsala
University, Department of Peace and Conflict Research. Available at http://ucdp.uu.se/downloads/ged/ged181.pdf.
Cuesta, José, and Mario Negre (2016). Poverty and Shared Prosperity 2016: Taking on Inequality. Washington, D.C.: World Bank.
Available at http://documents.worldbank.org/curated/en/242251476706821424/Poverty-and-shared-prosperity-2016-taking-on-
inequality.
Cunha, Flavio, James Heckman, and Susanne Schennach (2010). Estimating the technology of cognitive and noncognitive skill
formation. Econometrica, vol. 78, No. 3.
Currie, Janet, and Tom Vogl (2013). Early-life health and adult circumstance in Developing countries. Annual Review of Economics,
vol. 5.
Economic Research Forum (2016). Harmonized Household Income and Expenditure Surveys. Available at http://erf.org.eg/data-portal.
Version 2.0 of licensed data files.
Farishta, Aleena (2014). The impact of Syrian refugees on Jordan’s water resources and water management planning. A Thesis
Presented to the Faculty of Architecture and Planning and Preservation. Columbia University, October. Available at
https://academiccommons.columbia.edu/catalog/ac:175300.
98
Gleditsch, Nils Petter, and others (2002). Armed conflict 1946-2001: a new dataset. Journal of Peace Research, vol. 39, No. 5.
Halff, Antoine, Benjamin K. Sovacool, and Jon Rozhon (2014). Energy Poverty: Global Challenges and Local Solutions. Oxford: Oxford
University Press.
Haughton, Jonathan, and Shahidur R. Khandker (2009). Handbook on Poverty and Inequality. Washington, D.C.: World Bank.
Hassine, Nadia Belhaj (2014). Economic inequality in the Arab region. Policy Research Working Paper, No. 6911. Washington, D.C.:
World Bank.
Heckman, James J., and Dimitry V. Masterov (2007). The productivity argument for investing in young children. NBER Working Paper
Series, No. 13016. Massachusetts: National Bureau of Economic Research.
International Disability Alliance, and International Disability and Development Consortium (2016). Persons with disabilities in the SDG
indicator framework: monitoring the implementation of the sustainable development goals by disaggregation of data by
disability status. Geneva; Belgium. Available at www.disabilityrightsfund.org/wp-content/uploads/2016/01/SDG-
Disaggregationfinal.pdf.
International Food Policy Research Institute (2016). Global Nutrition Report 2016: From Promise to Impact - Ending Global Malnutrition
by 2030. Washington, D.C. Available at www.ifpri.org/publication/global-nutrition-report-2016-promise-impact-ending-
malnutrition-2030.
__________ (2017). Global Nutrition Report 2017: Nourishing the SDGs. Washington, D.C. Available at
http://globalnutritionreport.org/the-report.
International Labour Organization (2009). Growth, employment and decent work in the Arab region: key policy issues. Thematic
Paper, Arab Employment Forum, Beirut, Lebanon 19-21 October 2009. Available at http://www.ilo.org/wcmsp5/groups/public/---
arabstates/---ro-beirut/documents/meetingdocument/wcms_208697.pdf.
__________ (2012). The Youth Employment Crisis: Time for Action, Report V, International Labour Conference, 101st Session, 2012.
Geneva. Available at http://adapt.it/adapt-indice-a-z/wp-content/uploads/2013/08/ILO_The-youth-employment-crisis.pdf.
__________ (2013). Measuring informality: A statistical Manual on the Informal Sector and Informal Employment. Geneva. Available
at www.ilo.org/wcmsp5/groups/public/---dgreports/---dcomm/---publ/documents/publication/wcms_222979.pdf.
__________ (2015). Yemen Labour Force Survey 2013-14. Beirut: ILO Regional Office for Arab State. Available at
http://www.ilo.org/wcmsp5/groups/public/---arabstates/---ro-beirut/documents/publication/wcms_419016.pdf.
__________ (2018). ILOSTAT Database. Available at https://bit.ly/2JqMC2P. Accessed on 18 February 2018.
Jeffers, Kristen (2018). Contributions of the international metropolis project to the global discussions on the relations between
migration and development. Sixteenth Coordination Meeting on International Migration, 15-16 February 2018, UN/POP/MIG-
16CM/2018/11. New York: United Nations Department of Economic and Social Affairs.
Khawaja, Marwan, and others (2008). Disparities in child health in the Arab region during the 1990s. International Journal for Equity
in Health, vol. 7, No. 24.
El-Kogali, Safaa, and Caroline Krafft (2015). Expanding opportunities for the next generation: early childhood development in the
Middle East and North Africa. Directions in Development Series: Human Development, No. 93713. Washington, D.C.: World
Bank.
Korenromp, Eline (2015). Nutrition targets and indicators for the post-2015 sustainable development goals accountability for the
measurement of results in nutrition. Technical Note, February. Available at
www.unscn.org/files/Publications/Post_2015_Nutrition_Targets_and_Indicators_final_March_2015_website_.pdf.
La Mattina, Giulia, and Olga N. Shemyakina (2017). Domestic violence and childhood exposure to armed conflict: attitudes and
experiences. Available at http://sites.tufts.edu/neudc2017/files/2017/10/paper_31.pdf.

99
National Labour Force Surveys (various years and various countries).
Organisation for Economic Co-operation and Development (OECD) (2015). Government at a Glance 2015. Paris.
__________ (2016). OECD Data, Population with tertiary education. Available at https://data.oecd.org/eduatt/population-with-
tertiary-education.htm. Accessed on 17 July 2018.
__________ (2018). PISA Data. Available at http://www.oecd.org/pisa/data/. Accessed on 26 January 2018.
Ostrosky, Christine M. (2015). Women’s access to education in the Middle East. Undergraduate Summer Scholars Cumulative
Research Project. Oxford: Miami University. Available at http://public.wartburg.edu/mpsurc/images/ostrosky.pdf.
State of Palestine, Central Bureau of Statistics (2015). Labour Force Survey (October – December, 2014) Round (Q4/2014): Press
Report on the Labour Force Survey Results. Ramallah. Available at
www.pcbs.gov.ps/portals/_pcbs/PressRelease/Press_En_LFS-Q4-2014-e.pdf.
Rappuoli, Rino, Gianluca Breghi, and James Kenneth Timmis (2015). Maximizing the contribution of vaccination to the SDGs and the
grand convergence - integrating multi criteria decision analysis with the broader benefits of vaccination to align on
sustainable immunization strategies. Paper presented at the International Conference on Sustainable Development, New York.
Available at http://ic-sd.org/wp-
content/uploads/sites/4/2016/06/Contribution_of_vaccines_to_SDGs_and_Grand_Convergence.pdf.
Save the Children (2015). Education Under Attack in Syria. Available at https://reliefweb.int/report/syrian-arab-republic/education-
under-attack-syria.
Sightsavers (2015). Disability and the SDGs: from words to action, September. Available at
www.sightsavers.org/news/2015/09/disability-sdgs-words-action.
Solari, Claudia D., and Robert D. Mare (2012). Housing crowding effects on children’s well-being. Social Science Research, vol. 41,
No. 2, pp. 464–476.
Spear, Dean, Arabinda Ghosh, and Oliover Cumming (2013). Open defecation and childhood stunting in India: An Ecological Analysis
of New Data from 112 Districts. PLOS ONE, vol. 8, No. 9 (September).
Sundberg, Ralph, and Erik Melander (2013). Introducing the UCDP georeferenced event dataset. Journal of Peace Research, vol.50,
No.4, pp. 523-532.
Thacker, Simon, and Juan Manuel Moreno (2015). Regional collaboration on education: an ARAIEQ innovation. MENA Knowledge
and Learning, Quick Notes Series, No. 144. Washington, D.C.: World Bank.
United Nations Children’s Fund (UNICEF) (2013). A lost generation? a strategy for children affected by the Syria crisis. October.
Available at https://www.unicef.org/appeals/files/Lost_Generation_-
_Final_Draft_for_distribution_to_participants_09Oct2013.pdf.
__________ (2016a). Two thirds of unimmunized children live in conflict-affected countries – UNICEF, 22 April. Available at
https://news.un.org/en/story/2016/04/527422-two-thirds-unimmunized-children-live-conflict-affected-countries-unicef.
__________ (2016b). UNICEF Data, millions of children are still not reached by potentially life-saving vaccines. Available at
https://data.unicef.org/topic/child-health/immunization/. Accessed on 11 July 2018.
__________ (2017a). Education: South Sudan. Briefing note, No. 4 (October). Available at
www.unicef.org/southsudan/4._Education_brief_October_2017.pdf.
___________ (2017b). Progress for Children with Equity in the Middle East and North Africa. Amman.

100
___________ (2017c). Statement by UNICEF Executive Director, Anthony Lake, WFP Executive Director, David Beasley, and WHO
Director-General, Dr. Tedros Adhanom Ghebreyesus, following their joint visit to Yemen, 26 July. Available at
www.unicef.org/yemen/media_12124.html.
___________ (2017d). UNICEF Data, violent discipline, percentage of children 2-14 years old who experience any violent discipline
(psychological aggression and/or physical punishment). Available at https://data.unicef.org/topic/child-
protection/violence/violent-discipline/#. Accessed on 18 July 2018.
__________ (2018a). Four things you need to know about water and famine, 23 January. Available at
www.unicef.org/wash/3942_100695.html.
__________ (2018b). Water, Sanitation and Hygiene (WASH). Available at www.unicef.org/media/media_45481.html.
United Nations Children’s Fund (UNICEF), and UNESCO Institute for Statistics (2015). Regional Report on Out-of-School Children,
Middle East and North Africa Out-of-School Children Initiative, October 2014. Amman: UNICEF Middle East and North Africa
Regional Office. Available at http://uis.unesco.org/sites/default/files/documents/regional-report-on-out-of-school-children-
middle-east-and-north-africa-2015-en.pdf.
United Nations Children's Fund, and World Health Organization (2015). Progress on Sanitation and Drinking Water: 2015 Update and
MDG Assessment. Geneva. Available at
http://files.unicef.org/publications/files/Progress_on_Sanitation_and_Drinking_Water_2015_Update_.pdf.
United Nations Conference on Trade and Development (UNCTAD) (2016a). Development and Globalization Facts and Figures 2016.
Geneva.
__________ (2016b). The Least Developed Countries Report 2016: The Path to Graduation and Beyond - Making the Most of the
Process. UNCTAD/LDC/2016, New York; Geneva.
United Nations Department of Economic and Social Affairs, Statistics division (2016). United Nations Sustainable Development Goals
overview: Goal 10: reduce inequality within and among countries. Available at https://unstats.un.org/sdgs/report/2016/goal-10.
United Nations Development Programme (UNDP) (2016). Arab Human Development Report 2016: Enabling Youth to Shape their Own
Future Key to Progress on Development and Stability in the Arab Region. New York.
United Nations Development Programme (UNDP), and Yemen, Ministry of Planning and International Cooperation (2010). Yemen: The
Second National Millennium Development Goals Report 2010. Sana’a.
United Nations Economic Commission for Africa (ECA) (2017). Assessment of Mineral Regimes in the East African Community:
Aligning Frameworks with the African Mining Vision. Addis Ababa. Available at
www.uneca.org/sites/default/files/PublicationFiles/assessment_of_mining_policies_in_east_africa_0.pdf.
United Nations Economic and Social Commission for Western Asia (ESCWA) (2012). Arab Millennium Development Goals Report
2011: An Inclusive Approach to Development in a Time of Transition. E/ESCWA/EDGD/2011/7, Beirut.
____________ (2016). Survey of Economic and Social Developments in the Arab region 2015-2016. E/ESCWA/EDID/2016/1, Beirut.
____________ (2017a). Policy brief on Arab women’s economic empowerment. E/ESCWA/ECW/2017/Technical Paper.6, Beirut.
____________ (2017b). Rethinking Fiscal Policy for the Arab region. E/ESCWA/EDID/2017/4, Beirut.
____________ (2018). The Impact of Conflict on Human Development from Childhood to Adulthood Evidence for the Arab Region .
Trends and Impacts, Issue No. 5. E/ESCWA/ECRI/2017/2, Beirut.
United Nations Economic and Social Commission for Western Asia, and others (2017). Arab Multidimensional Poverty Report.
E/ESCWA/EDID/2017/2, Beirut.

101
United Nations Economic and Social Commission for Western Asia (ESCWA), and UNICEF Middle East and North Africa Regional
Office (MENARO) (2018). Exposure to Conflict and Child Well-Being in Iraq (forthcoming).
United Nations Economic and Social Council (2015). Official Records of the Economic and Social Council, Committee for
Development Policy: Report on the Seventeenth Session, Supplement No. 13. E/2015/33.
United Nations Educational, Scientific and Cultural Organization (UNESCO) (2007). Regional overview: Arab states. In Education for
all Global Monitoring Report 2008. Paris: United Nations Educational, Scientific and Cultural Organization; United Kingdom:
Oxford University Press. Available at https://en.unesco.org/gem-report/sites/gem-report/files/157267E.pdf.
__________ (2014). Education for All: Regional Report 2014 for the Arab States, Global Education for All Meeting, Oman, 12-14 May.
Beirut. Available at www.unesco.org/new/fileadmin/MULTIMEDIA/HQ/ED/ED_new/pdf/ARAB-REGION_EN.pdf.
__________ (2015). Regional Overview: Arab States. In Education for all 2000-2015: Achievements and Challenges, EFA Global
Monitoring Report 2015. Paris. Available at https://en.unesco.org/gem-report/sites/gem-
report/files/regional_overview_AS_en.pdf.
__________ (2017). Unpacking Sustainable Development Goal 4: education 2030 - guide. Paris. Available at
http://unesdoc.unesco.org/images/0024/002463/246300E.pdf.
United Nations, and Government of Yemen (2011). Development Assistance Framework, Republic of Yemen (UNDAF) 2012-2015.
Sana’a. Available at http://www.ye.undp.org/content/yemen/en/home/library/general/unit-ed-nations-development-
assistance-framework-2012---2015.html.
United Nations News Centre (2018). Female genital mutilation ‘not acceptable’ in the 21st century – UN envoy on youth, 5 February.
Available at https://www.un.org/sustainabledevelopment/blog/2018/02/female-genital-mutilation-not-acceptable-21st-century-
un-envoy-youth/.
United Nations Office for the Coordination of Humanitarian Affairs (OCHA) (2017). Yemen: 2018 Humanitarian Needs Overview.
Sanaa’.
United Nations Sustainable Development Solutions Network (2015). Indicators and a Monitoring Framework for the Sustainable
Development Goals: Launching a Data Revolution for the SDGs - a Report to the Secretary-General of the United Nations. Paris.
Available at http://unsdsn.org/wp-content/uploads/2015/05/FINAL-SDSN-Indicator-Report-WEB.pdf.
United Nations World Water Assessment Programme (2015). The United Nations World Water Development Report 2015: Water for a
Sustainable World. Paris: UNESCO.
Uppsala Conflict Data Program (UCDP) (2017). Uppsala Conflict Data Program, Department of Peace and Conflict Research. Available
at http://ucdp.uu.se/. Accessed on 20 June 2018.
Uppsala Conflict Data Program (UCDP), and International Peace Research Institute Oslo (PRIO) (2017). UCDP/PRIO Armed Conflict
Dataset Codebook, Version 17.1. Available at http://ucdp.uu.se/downloads/ucdpprio/ucdp-prio-acd-171.pdf.
World Health Organization (2015). Global Health Observatory Data, use of improved sanitation facilities. Available at
http://www.who.int/gho/mdg/environmental_sustainability/sanitation_text/en/. Accessed on 20 March 2018.
___________ (2017). Status of the two health-related SDGs. In World Health Statistics 2017: Monitoring Health for the SDGs. Geneva.
Available at http://www.who.int/gho/publications/world_health_statistics/2017/EN_WHS2017_Part2.pdf.
World Health Organization, Regional Office for South-East Asia (2015). Health Situation and Trend Assessment, underweight in
children. Available at http://www.searo.who.int/entity/health_situation_trends/data/Underweight_text/en/. Accessed on 10
March 2018.
World Bank (2005). World Development Report 2006: Equity and development. Washington, D.C.: World Bank; New York: Oxford
University Press.
102
__________ (2011). Learning for All Investing in People’s Knowledge and Skills to Promote Development, World Bank Group
Education Strategy 2020. Washington, D.C.
__________ (2018a). Beyond Scarcity: Water Security in the Middle East and North Africa. MENA Development Report. Washington,
D.C.
__________ (2018b). World Development Report 2018. Learning to Realise Education's Promise. Washington, D.C.
World Economic Forum (2014). Rethinking Arab Employment: A Systemic Approach for Resource-Endowed Economies - Part of the
New Vision for Arab Employment Initiative of the World Economic Forum. Geneva.
Yousef, Tarik M. (2004). Development, Growth and Policy Reform in the Middle East and North Africa since 1950. The Journal of
Economic Perspectives, vol. 18, No. 3, pp. 91-115.
El-Zanaty, and Ann A. Way (2001). Egypt Demographic and Health Survey 2000 (EDHS). Cairo: Ministry of Health and Population;
Calverton, Maryland: National Population Council; ORC Macro.

103
Endnotes
1. Two recent exceptions in the Arab region are the Iraq Household Socioeconomic Survey (2012), part of the Living Standards
Measurement Study (LSMS) developed by the World Bank, which includes questions on the impact of armed conflict on living
conditions and internal displacement, and the 2014 Survey on Socioeconomic Conditions for Palestinian Households (2014),
which examines the impact that the 2014 armed conflict with Israel had on households in Gaza.
2. We assign conflict by location and not by the origin of the warring parties. That means that, if country A is involved in an armed
conflict in which the fighting takes place entirely inside the territory of country B, the conflict will be assigned to country B. We
follow that convention because we are interested in studying the impact of armed conflict on the development of the
population directly hit by the violence, rather than by the conflict’s political and/or other consequences.
3. In its current (18.1) version, the UCDP/PRIO Armed Conflict Dataset provides information on armed conflicts across the world
between 1946 and 2016. The data are available from http://ucdp.uu.se/downloads.
4. An incident/event is included if the incident/event contains one battle death. However, the definition of a conflict remains 25
or more battle deaths. Therefore, unless an incident/event can be clearly tied to an identified conflict, the incident/event is not
recorded in the dataset. The threshold for the definition of a conflict is unchanged. Much anonymous or disorganized violence
(for example, much terrorist activity) is excluded from the dataset.
5. In its current (18.1) version, the UCDP Georeferenced Event Dataset provides information on conflict event for all countries of
the world, except the Syrian Arab Republic, from 1989 to 2016. The data can be downloaded from http://ucdp.uu.se/downloads.
6. The main dataset of the Correlates of War project (www.correlatesofwar.org), the COW War Data, was for a long time one of
the main sources of armed conflict used in political science. However, it has not been updated beyond v.4.0 (which covers the
period 1816 to 2007). Other databases relating to the project have had more recent updates.
7. The IBC database provides monthly information of the number of civilians killed since 2003. The minimum geographical
precision is at governorate level. Details are available from www.iraqbodycount.org/about.
8. https://sustainabledevelopment.un.org/sdg2.
9. The regional averages are for North Africa, and for the Arab region excluding North Africa. Thus, Egypt and Tunisia are
compared with the former; Iraq, Jordan, the State of Palestine and Yemen are compared with the latter.
10. The countries are Algeria, Morocco, Tunisia, and Egypt.
11. Rural-urban disaggregated data is not available for Tunisia.

18-0
0070
The 2030 Agenda for Sustainable Development stresses the importance of quality, accessible, timely and reliable disaggregated data to measure progress and to ensure that no one is left behind. Current data collection efforts across the Arab region fall short in terms of tracking progress towards the Agenda. Better data availability is crucial for designing public policy concerning poverty, hunger and malnutrition; access to education and other basic services; and social discrimination and exclusion, especially in countries experiencing conflict and in conflict-affected neighbouring countries.
Reliable figures to evaluate how conflict has affected prosperity goals should be a priority in the region. Major investment is required in data collection and processing to provide policymakers around the region with the information they need to inform their decisions. Mapping 12 of the 17 SDGs and presenting figures based on microdata that could serve as the most relevant to the sustainable development indicators, this report identifies data gaps and demonstrates the importance of using microdata for measuring and monitoring progress towards achieving the goals and targets of the 2030 Agenda.