the superluminous transient asassn-15lh as a tidal disruption
TRANSCRIPT

The Superluminous Transient ASASSN-15lh as a TidalDisruption Event from a Kerr Black Hole
G. Leloudas1,2, M. Fraser3, N. C. Stone4, S. van Velzen5, P. G. Jonker6,7, I. Arcavi8,9, C. Fremling10,
J. R. Maund11, S. J. Smartt12, T. Kruhler13, J. C. A. Miller-Jones14, P. M. Vreeswijk1, A. Gal-Yam1,
P. A. Mazzali15,16, A. De Cia17, D. A. Howell8,18, C. Inserra12, F. Patat17, A. de Ugarte Postigo19,2,
O. Yaron1, C. Ashall15, I. Bar1, H. Campbell3,20, T.-W. Chen13, M. Childress21, N. Elias-Rosa22,
J. Harmanen23, G. Hosseinzadeh8,18, J. Johansson1, T. Kangas23, E. Kankare12, S. Kim24, H.
Kuncarayakti25,26, J. Lyman27, M. R. Magee12, K. Maguire12, D. Malesani2, S. Mattila23,28,3, C. V.
McCully8,18, M. Nicholl29, S. Prentice15, C. Romero-Canizales24,25, S. Schulze24,25, K. W. Smith12,
J. Sollerman10, M. Sullivan21, B. E. Tucker30,31, S. Valenti32, J. C. Wheeler33, D. R. Young12
1Department of Particle Physics and Astrophysics, Weizmann Institute of Science, Rehovot
7610001, Israel
2Dark Cosmology Centre, Niels Bohr Institute, University of Copenhagen, Juliane Maries vej 30,
2100 Copenhagen, Denmark
3Institute of Astronomy, University of Cambridge, Madingley Road, Cambridge CB3 0HA, UK
4Columbia Astrophysics Laboratory, Columbia University, New York, NY, 10027, USA
5Department of Physics and Astronomy, The Johns Hopkins University, Baltimore, MD, 21218,
USA
6SRON, Netherlands Institute for Space Research, Sorbonnelaan 2, 3584 CA, Utrecht, The Nether-
lands
7Department of Astrophysics/IMAPP, Radboud University Nijmegen, P.O. Box 9010, 6500 GL
1
arX
iv:1
609.
0292
7v1
[as
tro-
ph.H
E]
9 S
ep 2
016
Nijmegen, The Netherlands
8Las Cumbres Observatory Global Telescope Network, 6740 Cortona Dr., Suite 102 Goleta, CA
93117, USA
9Kavli Institute for Theoretical Physics, University of California, Santa Barbara, CA 93106, USA
10Department of Astronomy, The Oskar Klein Center, Stockholm University, AlbaNova, 10691,
Stockholm, Sweden
11Department of Physics and Astronomy, The University of Sheffield, Hicks Building, Hounsfield
Road, Sheffield, S3 7RH, UK
12Astrophysics Research Centre, School of Mathematics and Physics, Queen’s University Belfast,
Belfast BT7 1NN, UK
13Max-Planck-Institut fur extraterrestrische Physik, Giessenbachstraße, 85748 Garching, Germany
14International Centre for Radio Astronomy Research, Curtin University, GPO Box U1987, Perth,
WA 6845, Australia
15Astrophysics Research Institute, Liverpool John Moores University, IC2, Liverpool Science Park,
146 Brownlow Hill, Liverpool L3 5RF, UK
16Max-Planck Institut fur Astrophysik, Karl-Schwarzschild-Str. 1, 85748 Garching b. Munchen,
Germany
17European Southern Observatory, Karl-Schwarzschild-Strasse 2, 85748 Garching, Germany
18Department of Physics, University of California Santa Barbara, Santa Barbara, CA 93117, USA
19Instituto de Astrofısica de Andalucıa (IAA-CSIC), Glorieta de la Astronomıa s/n, E-18008,
Granada, Spain
2
20Department of Physics, University of Surrey, Guildford, GU2 7XH, Surrey, UK
21Department of Physics & Astronomy, University of Southampton, Southampton, Hampshire,
SO17 1BJ, UK
22INAF - Osservatorio Astronomico di Padova, Vicolo dellOsservatorio 5, 35122 Padova, Italy
23Tuorla Observatory, Department of Physics and Astronomy, University of Turku, Vaisalantie 20,
FI-21500 Piikkio, Finland
24Instituto de Astrofısica, Facultad de Fısica, Pontificia Universidad Catolica de Chile, Vicuna
Mackenna 4860, 7820436 Macul, Santiago, Chile
25Millennium Institute of Astrophysics, Santiago, Chile
26Departamento de Astronomıa, Universidad de Chile, Casilla 36-D, Santiago, Chile
27Department of Physics, University of Warwick, Coventry CV4 7AL, UK
28Finnish Centre for Astronomy with ESO (FINCA), University of Turku, Vaisalantie 20, FI-21500
Piikkio, Finland
29Harvard-Smithsonian Center for Astrophysics, 60 Garden Street, Cambridge, Massachusetts
02138, USA
30The Research School of Astronomy and Astrophysics, Mount Stromlo Observatory, Australian
National University, Canberra, ACT 2611, Australia.
31ARC Centre of Excellence for All-sky Astrophysics (CAASTRO), Australia
32Department of Physics, University of California, Davis, CA 95616, USA
33Department of Astronomy, University of Texas at Austin, Austin, TX 78712, USA
3

When a star passes within the tidal radius of a supermassive black hole, it will be torn apart1.
For a star with the mass of the Sun and a non-spinning black hole with a mass < 108M, the
tidal radius lies outside the black hole event horizon2 and the disruption results in a luminous
flare3, 4, 5, 6. Here we report observations over a period of 10 months of a transient hitherto
interpreted7 as a super-luminous supernova8. Our data show that the transient re-brightened
significantly in the UV and that the spectrum went through three different spectroscopic
phases without ever becoming nebular. Our observations are more consistent with a tidal
disruption event than a super-luminous supernova because of the temperature evolution6,
the presence of highly ionised CNO gas at the line of sight9 and our improved localisation of
the transient at the nucleus of a passive galaxy, where the presence of massive stars is highly
unlikely10, 11. While the supermassive black hole has a mass > 108M12, 13, a solar-mass star
could be disrupted outside the event horizon if the black hole were spinning rapidly14. The
rapid spin and high black hole mass can explain the high luminosity of this event.
ASASSN-15lh was discovered by the All-Sky Automated Survey for SuperNovae (ASAS-
SN) on 2015 June 14 at a redshift of z = 0.2326. Its light curve peaked at V ∼ 17 mag implying
an absolute magnitude of M = −23.5 mag, more than twice as luminous as any known supernova
(SN)7.
Our long-term spectroscopic follow-up reveals that ASASSN-15lh went through three dif-
ferent spectroscopic phases (Figure 1). During the first phase7, the spectra were dominated by two
broad absorption features. While these features appear similar to those observed in super-luminous
4

supernovae (SLSNe; Supplementary Figure 1), their physical origin is different. The features in
SLSNe are due to O II8, 15 but this would produce an additional strong feature at∼4400 A (Supple-
mentary Figure 2) . The feature at∼4100 A cannot be easily identified in the tidal disruption event
(TDE) framework either. Two possibilities are that it could be due to Mg II or high-velocity He II
absorption16. After the initial broad absorption features disappeared, the spectra of ASASSN-15lh
were dominated by two emission features. A possible identification for these features is He II
λλ3202 and 4686 A both consistently blueshifted by ∼15,000 km s−1 (Supplementary Figure 3).
He II emission is commonly seen in optically discovered TDEs4, 5 at different blueshifts, albeit typ-
ically at lower velocities, but it has not been seen in H-poor SLSNe. These features disappeared
after day +75 (measured in rest frame from peak) and the later spectra are mostly featureless, with
the exception of two emission features at ∼4000 and 5200 A. The spectra remain much bluer than
those of SLSNe17 during many months after peak and never reveal nebular features, even up to day
+256.
A UV spectrum obtained with HST at day +168 does not show any broad features18. At the
redshift of the host, we identify weak Ly-α absorption and disproportionally strong high-ionisation
lines (N V, O VI, C IV). Combined with the weakness (or absence) of common19 low-ionisation
absorption lines (Fe II, Si II, Mg II), this aspect appears similar to what was observed in ASASN-
14li, the only available UV spectrum of a TDE9 (Methods and Supplementary Figure 4). The
highly-ionised gas appears at slightly different velocities, suggesting that it could be due to material
in the vicinity of the TDE and ionised by its radiation. A difference with the case of ASASSN-
14li9 is that we do not observe any broad features in the UV, but the optical spectrum is also mostly
5

featureless at these phases.
In addition, we detect the presence of hydrogen in ASASSN-15lh. A weak Hα emission line
is unambiguously detected in our highest signal-to-noise spectra (Figure 1) and in more spectra at
lower significance (Supplementary Figure 3). Its presence cannot be excluded in any spectrum and
its strength (EW ∼4-8 A) is consistent with no evolution. The velocity of the Hα line (FWHM
∼ 2, 500 km s−1) is different than those of other features, implying that it is formed in a different
emitting region.
The light curve evolution of ASASSN-15lh is shown in Figure 2. After the initial peak and
decline, around September 10 (day +60), the UV started re-brightening, an effect that was more
prominent in the far-UV bands20, 21, 18. The dense photometric follow-up with Swift and LCOGT
reveals that ASASSN-15lh reached a secondary UV maximum at around +110 days, followed
by another decline. Interestingly, after day +100, the colours of ASASSN-15lh have remained
almost constant for over 120 rest-frame days (Supplementary Figure 5). By fitting a black body
to the multi-wavelength photometry of ASASSN-15lh, we are able to estimate the temperature
evolution, black-body radius and bolometric luminosity (Figure 3). While the UV rebrightens
and the spectrum changes, the blackbody radius decreases and the temperature increases again,
stabilising at ∼ 16, 000 K. This is neither expected from a SN photosphere, nor observed for
SLSNe22, 23, 24. However, the TDE candidate ASASSN-14ae6 showed a very similar temperature
evolution as ASASSN-15lh. Even if this happened at faster timescales, the qualitative similarity
between the evolution of the two events suggests that they might be due to the same mechanism.
6

On the other hand, the radius of ASASSN-15lh is larger by a factor of ∼7, and ASASSN-14ae
has a much stronger Hα line (Figure 1). By integrating the bolometric luminosity, we estimate
that ASASSN-15lh has radiated a total of 2.93 ± 0.23 × 1052 erg (depending on the assumed
bolometric correction) until 2016 May 25 (day +288). Including kinetic energy, which can reach
an additional 1052 erg for SLSNe15, 25, the total energy budget approaches the theoretical limit of
what SN explosions models can accommodate26, 27. It is possible that UV re-brightening could
occur in a SLSN, due to either strong circumstellar interaction or the ionization breakout powered
by a central magnetar. However, the observed Hα line is much weaker than in SLSNe that have
shown signs of late interaction28 (Supplementary Figure 1) and there are no features indicative of
interaction in the UV spectrum. In addition, predictions for ionisation breakout suggest that the
spectrum should turn nebular26, although this might apply better to an X-ray rather than a UV
breakout. Nevertheless, it is true that no detailed model has yet been calculated that can naturally
explain the entire spectroscopic and photometric properties observed, neither in the SN nor in the
TDE scenario. A single epoch of imaging polarimetry with HST shows low levels of polarisation18,
similar to what was obtained for a SLSN29, and suggesting an only mildly asymmetric geometry
(in projection). Polarisation measurements and predictions for optical TDEs are still lacking.
Strong evidence for ASASSN-15lh being a TDE comes from its environment. H-poor SLSNe
are found in blue, metal-poor, dwarf galaxies with average masses log10M? = 8.24 ± 0.58 M,
and none so far exceeding 9.60 at z < 1 10, 11. These galaxies typically have strong emission lines,
pointing to active ongoing star formation and young progenitor ages not exceeding a few Myr11.
In contrast, the host of ASASSN-15lh is a massive and passive red galaxy. By fitting the available
7

photometry (see Methods) we estimate that the mass of the host is log10M? = 10.95+0.15−0.11 M,
with a dominant stellar population of 3.9+3.2−1.3 Gyr. The spectral energy distribution fit provides
a star formation rate (SFR) of 0.05+0.15−0.05 M yr−1, consistent with the improved limit on SFR
< 0.02 M yr−1 that we obtain from our highest signal-to-noise spectrum. The derived specific
star formation rate of log sSFR < −12.5 yr−1 is thus three orders of magnitude lower than in any
H-poor SLSN host (Supplementary Figure 7). Furthermore, the transient is positionally coincident
with the nucleus of its host. By aligning post-discovery HST+ACS images with a pre-discovery
image taken with the CTIO 4m+DECam (Supplementary Figure 8), we are able to improve the
positional accuracy7 of ASASSN-15lh by a factor of ∼4, corresponding to a projected nuclear
offset of 131± 192 pc.
It has been argued that the large host galaxy mass may imply the presence of a SMBH
too large to disrupt stars outside its horizon7. Because the tidal radius scales as Rt ∝ M1/3•
while the gravitational radius Rg ∝ M•, stars can only be disrupted outside an SMBH hori-
zon if the black hole is below a certain size, the Hills mass2. Larger SMBHs swallow stars
whole. For a non-spinning, Schwarzschild SMBH, the Hills mass is MH ≈ 9× 10⁷Mr3/2? m
−1/2? ,
where m? ≡ M?/M and r? ≡ R?/R (see Methods). Using an empirical relation between
SMBH mass and total stellar mass for ellipticals and S/S0 galaxies with classical bulges12, we find
log10M• = 8.88 ± 0.60 M, far above the Schwarzschild Hills mass for solar-mass stars. Using
an M• − L relation for early-type galaxies13 we obtain log10M• = 8.50 ± 0.52 M. However,
MH increases by almost an order of magnitude for rapidly spinning Kerr SMBHs and favorable
orbital orientations14. For an optimal (prograde equatorial) orbit and our range of SMBH mass
8

estimates, we find that a solar-mass star can be disrupted by a SMBH with dimensionless spin
parameter a• = 0.68 (a• = 1) if log10M• = 8.28 M (log10M• = 8.86 M). We show the
exact, relativistic MH(a•) in Figure 4. For stars less massive than the Sun, the spin is constrained
to even higher values. ASASSN-15lh could be compatible with a TDE by a Schwarzschild SMBH
provided M? & 3M. However, the typical tidally-disrupted star comes from the lower end of
the stellar mass function and this hypothesis is further disfavored by the old age of the galaxy’s
stellar population30, 31. Observations of active galactic nuclei suggest that rapid SMBH spins are
common32; TDEs present a method to probe the SMBH spins of quiescent galaxies. Given the
inferred rapid spin of the SMBH, our radio non-detection implies that black hole spin alone is not
sufficient for launching powerful jets (see Methods).
The luminosity and energetics of ASASSN-15lh are also explained by a very massive SMBH.
The expected radiative efficiency of accretion increases from η ≈ 0.05 (for a Schwarzschild
SMBH) to η ≈ 0.42 for a rapidly spinning SMBH disrupting stars on prograde, near-equatorial
orbits. A massive SMBH is further biased towards disrupting the most massive stars near the main
sequence turn-off mass, increasing accretion rates and total energy release. Finally, it is well known
that most TDEs only release a small fraction of ηM?c2 in accretion power (the so-called “missing
energy problem” 30, 33); one compelling explanation for this is that circularization of debris and
formation of the accretion disk is mediated by relativistic apsidal precession, and that the majority
of TDEs circularize inefficiently due to weak apsidal precession34. For a fast-spinning massive
SMBH, efficient circularization is favoured because Rt ∼ Rg, ensuring large per-orbit precession.
The peculiar light curve may also be a natural consequence of tidal disruption by extremely mas-
9

sive black holes. In Methods we combine two competing models (the “circularization”33 and the
“accretion/reprocessing” 35 paradigms) for optical emission in TDEs and show that the most mas-
sive SMBHs produce an unusual hierarchy of tidal disruption timescales. Because the viscous time
in the accretion disk is much longer than the debris fallback time when M• & few×107M, TDEs
around the most massive SMBHs can display an early peak in the light curve from circularization
luminosity, and a second peak from reprocessed accretion luminosity.
10

1. Rees, M. J. Tidal disruption of stars by black holes of 10 to the 6th-10 to the 8th solar masses
in nearby galaxies. Nature 333, 523–528 (1988).
2. Hills, J. G. Possible power source of Seyfert galaxies and QSOs. Nature 254, 295–298 (1975).
3. van Velzen, S. et al. Optical Discovery of Probable Stellar Tidal Disruption Flares. Astrophys.
J. 741, 73 (2011). 1009.1627.
4. Gezari, S. et al. An ultraviolet-optical flare from the tidal disruption of a helium-rich stellar
core. Nature 485, 217–220 (2012). 1205.0252.
5. Arcavi, I. et al. A Continuum of H- to He-rich Tidal Disruption Candidates With a Preference
for E+A Galaxies. Astrophys. J. 793, 38 (2014). 1405.1415.
6. Holoien, T. W.-S. et al. ASASSN-14ae: a tidal disruption event at 200 Mpc. Mon. Not. R.
Astron. Soc. 445, 3263–3277 (2014). 1405.1417.
7. Dong, S. et al. ASASSN-15lh: A highly super-luminous supernova. Science 351, 257–260
(2016). 1507.03010.
8. Quimby, R. M. et al. Hydrogen-poor superluminous stellar explosions. Nature 474, 487–489
(2011). 0910.0059.
9. Cenko, S. B. et al. An Ultraviolet Spectrum of the Tidal Disruption Flare ASASSN-14li.
Astrophys. J. Letters 818, L32 (2016). 1601.03331.
10. Lunnan, R. et al. Hydrogen-poor Superluminous Supernovae and Long-duration Gamma-Ray
Bursts Have Similar Host Galaxies. Astrophys. J. 787, 138 (2014). 1311.0026.
11

11. Leloudas, G. et al. Spectroscopy of superluminous supernova host galaxies. A preference
of hydrogen-poor events for extreme emission line galaxies. Mon. Not. R. Astron. Soc. 449,
917–932 (2015). 1409.8331.
12. Reines, A. E. & Volonteri, M. Relations between Central Black Hole Mass and Total Galaxy
Stellar Mass in the Local Universe. Astrophys. J. 813, 82 (2015). 1508.06274.
13. McConnell, N. J. & Ma, C.-P. Revisiting the Scaling Relations of Black Hole Masses and
Host Galaxy Properties. Astrophys. J. 764, 184 (2013). 1211.2816.
14. Kesden, M. Tidal-disruption rate of stars by spinning supermassive black holes. Phys.R. D
85, 024037 (2012). 1109.6329.
15. Mazzali, P. A., Sullivan, M., Pian, E., Greiner, J. & Kann, D. A. Spectrum formation in
superluminous supernovae (Type I). Mon. Not. R. Astron. Soc. 458, 3455–3465 (2016). 1603.
00388.
16. Strubbe, L. E. & Quataert, E. Spectroscopic signatures of the tidal disruption of stars by
massive black holes. Mon. Not. R. Astron. Soc. 415, 168–180 (2011). 1008.4131.
17. Pastorello, A. et al. Ultra-bright Optical Transients are Linked with Type Ic Supernovae.
Astrophys. J. Letters 724, L16–L21 (2010). 1008.2674.
18. Brown, P. J. et al. ASASSN-15lh: A Superluminous Ultraviolet Rebrightening Observed by
Swift and Hubble. ArXiv e-prints (2016). 1605.03951.
12

19. de Ugarte Postigo, A. et al. The distribution of equivalent widths in long GRB afterglow
spectra. Astron. Astrophys. 548, A11 (2012). 1209.0891.
20. Brown, P. J. Ultraviolet Rebrightening of Superluminous Supernova ASASSN-15lh. The
Astronomer’s Telegram 8086 (2015).
21. Godoy-Rivera, D. et al. The Unexpected, Long-Lasting, UV Rebrightening of the Super-
Luminous Supernova ASASSN-15lh. ArXiv e-prints (2016). 1605.00645.
22. Inserra, C. et al. Super-luminous Type Ic Supernovae: Catching a Magnetar by the Tail.
Astrophys. J. 770, 128 (2013). 1304.3320.
23. Nicholl, M. et al. Superluminous supernovae from PESSTO. Mon. Not. R. Astron. Soc. 444,
2096–2113 (2014). 1405.1325.
24. Chen, T.-W. et al. The host galaxy and late-time evolution of the superluminous supernova
PTF12dam. Mon. Not. R. Astron. Soc. 452, 1567–1586 (2015). 1409.7728.
25. Howell, D. A. et al. Two Superluminous Supernovae from the Early Universe Discovered by
the Supernova Legacy Survey. Astrophys. J. 779, 98 (2013). 1310.0470.
26. Metzger, B. D., Margalit, B., Kasen, D. & Quataert, E. The diversity of transients from
magnetar birth in core collapse supernovae. Mon. Not. R. Astron. Soc. 454, 3311–3316 (2015).
1508.02712.
27. Sukhbold, T. & Woosley, S. E. The Most Luminous Supernovae. Astrophys. J. Letters 820,
L38 (2016). 1602.04865.
13

28. Yan, L. et al. Detection of Broad Hα Emission Lines in the Late-time Spectra of a Hydrogen-
poor Superluminous Supernova. Astrophys. J. 814, 108 (2015). 1508.04420.
29. Leloudas, G. et al. Polarimetry of the Superluminous Supernova LSQ14mo: No Evidence
for Significant Deviations from Spherical Symmetry. Astrophys. J. Letters 815, L10 (2015).
1511.04522.
30. Stone, N. C. & Metzger, B. D. Rates of stellar tidal disruption as probes of the supermassive
black hole mass function. Mon. Not. R. Astron. Soc. 455, 859–883 (2016). 1410.7772.
31. Kochanek, C. S. Tidal Disruption Event (TDE) Demographics. Mon. Not. R. Astron. Soc.
(2016). 1601.06787.
32. Reynolds, C. S. Measuring Black Hole Spin Using X-Ray Reflection Spectroscopy. Space
Science Reviews 183, 277–294 (2014). 1302.3260.
33. Piran, T., Svirski, G., Krolik, J., Cheng, R. M. & Shiokawa, H. Disk Formation Versus Disk
Accretion - What Powers Tidal Disruption Events? Astrophys. J. 806, 164 (2015). 1502.
05792.
34. Dai, L., McKinney, J. C. & Miller, M. C. Soft X-Ray Temperature Tidal Disruption Events
from Stars on Deep Plunging Orbits. Astrophys. J. Letters 812, L39 (2015). 1507.04333.
35. Guillochon, J., Manukian, H. & Ramirez-Ruiz, E. PS1-10jh: The Disruption of a Main-
sequence Star of Near-solar Composition. Astrophys. J. 783, 23 (2014). 1304.6397.
14

Correspondence Correspondence and requests for materials should be addressed to Giorgos Leloudas. (email:
Acknowledgements We acknowledge support from the European Union FP7 programme through the
following ERC grants: 320360 (MF, HC), 647208 (PGJ), 291222 (SJS), 615929 (MS). In addition: Ein-
stein Postdoctoral Fellowship PF5-160145 (NCS), Hubble Postdoctoral Fellowship HST-HF2-51350 (SvV),
STFC grants ST/I001123/1 ST/L000709/1 (SJS) and ST/L000679/1 (MS), Australian Research Council Fu-
ture Fellowship FT140101082 (JCAMJ), a Royal Society University Research Fellowship (JRM), a Sofja
Kovalevskaja Award to P. Schady (TKr, TWC), a Ramon y Cajal fellowship and the Spanish research project
AYA 2014-58381 (AdUP), CONICYT-Chile FONDECYT grants 3130488 (SK), 3140534 (SS), 3140563
(HK), 3150238 (CRC), a PRIN-INAF 2014 project (NER), support from IDA (DM), an Ernest Rutherford
Fellowship (KM), CAASTRO project number CE110001020 (BET), NSF Grant AST 11-09881 and NASA
Grant HST-AR-13726.02 (JCW). This work makes use of observations from the Las Cumbres Observatory
Global Telescope Network and is based upon work supported by the NSF Grant No. 1313484. The Aus-
tralia Telescope Compact Array is part of the Australia Telescope National Facility which is funded by the
Australian Government for operation as a National Facility managed by CSIRO. Based partially on obser-
vations collected as part of PESSTO (the Public ESO Spectroscopic Survey for Transient Objects Survey)
under ESO programs188.D-3003, 191.D-0935 and on observations made with ESO Telescopes at the La
Silla Paranal Observatory under programme ID 095.D-0633. We thank Massimo Della Valle for comments.
Author Contributions GL coordinated the PESSTO observations, was PI of the FORS2 program, anal-
ysed the data and wrote the paper. MF provided the astrometric localisation and reduced the PESSTO
spectra. NCS calculated the relation between the BH spin and the Hills mass and edited the manuscript.
SvV made the Swift photometry. PGJ analysed XMM data and helped coordinating the project. IA is the
15

PESSTO PI for TDEs and provided LCOGT data. CF made the LCOGT photometry. JRM reduced the
FORS2 spectra. SJS is the PI of PESSTO and helped coordinating the project. TKr provided the SED fit
of the host galaxy. JCAMJ provided the radio observations. PMV helped with the analysis of the spectra.
GL, MF, NCS, SvV, PGJ, IA, SJS, JCAMJ, AG-Y and PAM contributed to the discussions. AdUP and ADC
worked on the UV spectrum. DAH is the PI of the LCOGT observations. CI and OY are PESSTO builders
and helped with the analysis. FP, DM, JS and JCW provided FORS2 data and analysis. MC and BET pro-
vided the WIFES spectra. SS and SK provided the Magellan spectrum. GH, CMcC and SV obtained and
reduced LCOGT data. EK, KM, KWS, MS, and DRY are PESSTO builders and CA, JH, SM, TWC, TKa,
SP, CRC, HK, MN, JL, NER, HC, IB, JJ, MRM contributed with PESSTO observations or data reductions.
Many authors provided comments on the manuscript.
Competing Interests The authors declare that they have no competing financial interests.
16

3000 4000 5000 6000 7000Rest-frame Wavelength ( )
10-17
10-16
10-15
logFλ +
con
st.
a
+14+16+21+27+37+45+57+75+89+91+104+126+134+157+248+256
⊕
⊕-8 -4 0 4 8
v (103 km s−1 )
Fλ (n
orm
.)
⊕
Hα
+37
+91
b
Figure 1 | Spectral sequence of ASASSN-15lh showing three spectroscopic phases.
The main features during the different phases have been highlighted with different colours.
The last two spectra appear redder due to the increased host contamination. Rest-frame
phases are indicated, the spectra have been offset for clarity and the earth symbol marks
17

the strongest telluric features. Panel b shows a detection of Hα (FWHM ∼ 2, 500 km s−1)
in a telluric-free region of our best spectra. The magenta line is a telluric spectrum.
18

50 0 50 100 150 200 250 300Rest-frame days
16
17
18
19
20
21
22
23
AB
mag
nitu
de
i - 1.4r - 0.7VV (ASASSN)g + 0.5B + 1.2U + 1.9UVW1 + 1.9UVM2 + 2.3UVW2 + 2.6
Figure 2 | The light curve evolution of ASASSN-15lh in the rest frame. The data
is from LCOGT (gri) and Swift, supplemented by the ASASSN V -band data7. We have
adopted a peak time at 2015 June 5 (MJD 57178.5)7. The light curves are shifted for
clarity as indicated. Errorbars are 1σ uncertainties. The optical bands show a monotonic
decline, but the UV bands show a re-brightening after 60 rest-frame days. A significant
secondary dip is also observed in the bluest bands around 120 days. The photometry
19

has been corrected for foreground extinction and the host contribution has been removed
(see Methods).
20

51015202530
T (1
03 K
) ASASSN-15lh ASASSN-14ae (TDE)PTF12dam (SLSN R)
SLSNe I
a
2468
R (1
015
cm
) 4× ASASSN-14aePTF12dam
SLSNe I
b
30 0 30 60 90 120 150 180 210 240 270 300Rest-frame days
44
45
46
log
L (e
rg/s
) 20× ASASSN-14ae20× PTF12dam20× SN 2010gx
c
Figure 3 | The evolution of the temperature, radius and luminosity of ASASSN-
15lh, compared to TDEs6 and SLSNe17, 22, 23, 24. The coloured areas correspond to the
different spectroscopic phases in Figure 1. For ASASSN-15lh, open symbols show fits
based on less than 5 filters. In particular, empty hexagons show early data, based only on
V band and derived with a temperature prior7. Errorbars are 1σ uncertainties. The curves
21

are shown with respect to peak time and some comparison objects have been scaled as
indicated in the legend. The temperature (a) and radius (b) evolution of ASASSN-15lh
is qualitatively similar to those of the TDE ASASSN-14ae, although this is happening in
longer timescales and larger radii. All types of SLSNe cool down with time. The bolometric
luminosity (c) of ASASSN-15lh shows an extended plateau between 70-160 days.
22

⊙
⊙
⊙
⊙
0.0 0.2 0.4 0.6 0.8 1.01×10⁷
5×10⁷
1×10⁸
5×10⁸
1×10⁹
•
[
⊙]
Figure 4 | The Hills mass MH plotted as a function of SMBH spin a• for main
sequence stars of different masses. The SMBH mass estimate12 for the host of
ASASSN-15lh, and the corresponding 1σ uncertainty region, are marked in dashed lines
and grey shading. The plot shows that a 0.1M star cannot be disrupted by the SMBH,
as the Hills mass is always below the mass of the SMBH. 0.3M and 1M stars can be
disrupted by rotating Kerr BH of different spins. Only 3M stars lie in the allowed region for
TDEs from a non-rotating Schwarzschild BH, but TDEs from such stars are unlikely30, 31.
23

Methods
This section describes the data, methods and theoretical calculations used in the main paper. We
provide details on the localisation of ASASSN-15lh and on the host galaxy properties. We present
the different data used, we describe the reductions and comment on the implications. Finally, we
demonstrate that a TDE can easily accommodate the luminosity and energetics of ASASSN-15lh,
we show that combining two luminosity mechanisms for TDEs can result in light curves with two
different timescales, and we present our derivation of the relativistic Hills mass as a function of the
SMBH spin. We assume a Planck cosmology36.
Astrometric localisation of ASASSN-15lh HST observations of ASASSN-15lh were obtained
under programme 14348 (PI: Yang) with ACS and a broad-band polarimetry filter (POL0V) and
F606W. All analysis was performed on the reduced drizzled image obtained from the MAST
archive. The image was taken on 2015 August 3, and the total exposure time for this frame was
366 s. The DECam image was a 90 s image taken on 2014 October 22 using an r-band filter. The
DECam data were reduced using the DES Data Management Pipeline and made available online37.
The measured FWHM is 0.8′′.
Eight sources common to both the DECam and ACS images were used to derive a geomet-
ric transformation (allowing for rotation, translation and a single scaling factor) between the two
frames. Of these sources, five were unresolved in the ACS image, while the remaining three had a
FWHM of .2 times that of the point sources. The rms error in the transformation was 0.19 DE-
Cam pixels, or 52 mas. To measure the position of the host galaxy in the DECam frame, we fitted
24

a model galaxy profile using the GALFIT code; uncertainties in the galaxy centroid were estimated
to be only a few ×0.01 pixels from Monte Carlo tests. The position of ASASSN-15lh on the ACS
image yields an accuracy of 0.05 pixels (or 3 mas) using three different centering algorithms within
the IRAF PHOT package.
The host galaxy To derive physical properties of the host galaxy of ASASSN-15lh through mod-
eling of its spectral energy distribution (SED), we use grizY 37, J and Ks38, as well as 3.4µm and
4.6µm WISE photometry. We also performed aperture photometry on GALEX images yielding no
significant detections.
We fit the Galactic extinction-corrected39 photometry of the host with stellar population syn-
thesis models40 using Le Phare41, 42. Our galaxy templates are based on a Chabrier initial mass
function43, and span different stellar metallicities, e-folding timescales τ (0.1 to 30 Gyr), stellar
population ages (0.01 to 10 Gyr) and dust attenuations44. The galaxy stellar mass and SFR are
log10M? = 10.95+0.15−0.11 M and 0.05+0.15
−0.05 M yr−1, respectively. Physical parameters are given
as the median of the probability distribution of all templates, with error-bars containing the 1σ
probability interval. The best fit model is shown in Supplementary Figure 6 and it has a low
E(B − V )host = 0.02 mag. Throughout the paper we assume that the extinction at the host is
negligible.
We also constrain the recent star formation in the host by placing limits on the flux of [O II]
and (narrow) Hα. Using the FORS2 spectra (S/N> 200) we obtain flux limits of< 1.8×10⁻¹⁶ erg
s−1 cm−2 A−1 for [O II] and < 2.9× 10⁻¹⁷ erg s−1 cm−2 A−1 for Hα (2σ). These limits constrain
25

the SFR to< 0.25 and< 0.02 M yr−1 respectively45, 43, a factor of 10 improvement over previous
estimates7.
HST UV spectroscopy A UV spectrum of ASASSN-15lh was obtained at day +168 with HST
under program 14450 (PI: Brown). We downloaded the reduced COS and STIS spectra from
the MAST archive. The spectrum does not display any broad emission or absorption features
(at similar phases the optical spectrum is also mostly featureless; Figure 1). We identify both
geocoronal and absorption lines at z = 0 and a number of narrow (FWHM ∼ 200 − 400 km
s−1) absorption features at the redshift of ASASSN-15lh. Supplementary Figure 4 shows the COS
spectrum (the STIS spectrum is more noisy and less interesting). Table 1 contains the EWs and
kinematical offsets (measured relative to Ly-α) for lines that are detected, as well as selected limits.
Low-ionisation features, such as Fe II and Si II, which are common in the star-forming sight-
lines of SLSNe46 or GRBs47, 19 are weak or absent in ASASSN-15lh. In contrast, absorption from
high ionisation lines from N V and O VI is remarkably strong, especially relatively to the (weak)
Ly-α. In particular, the ratio of N V to Ly-α is ∼4, while it is >1000 lower in GRBs. The
same is true for column densities: by Voigt-profile modelling, we derive N(HI) = 14.73 ± 0.12,
N(OVI) = 15.58± 0.03, N(NV) = 15.42± 0.06 and N(CIV) = 14.60± 0.27, resulting in ratios
that are highly unusual for GRB or Quasar DLAs48, 49, even if those values are lower limits due to
saturation. The ratio of N V to Ly-α was also observed to be of the order unity in the spectrum of
ASASSN-14li, the only UV spectrum of a TDE9. By complementing our measurements with those
from optical spectra7, we find that the Mg II absorption is weak, below the value for GRBs47, 19 and
SLSNe46.
26
We therefore suggest that the absorbing gas can be separated in 2 components: i) a tenuous
mildly-ionised medium (Ly-α, Mg II, Si III at velocities 0 to +44 km s−1), which is very unusual
for the lack of Fe II and Si II; ii) a highly-ionised medium (N V, O VI and C IV) at negative
velocity offsets −80 to −120 km s−1. We suggest that the latter is consistent with material from a
disrupted low-mass star50, 9 and that it is ionised by the TDE. Despite the absence of broad features,
the phenomenological similarity with the UV spectrum of ASASSN-14li strongly favours a TDE
origin for ASASSN-15lh. A highly-ionised outflow was detected for ASASSN-14li also in the
X-rays51.
Optical spectroscopy Spectra were obtained with the instruments and set-ups listed in Table 2.
The FLOYDS, WiFeS and EFOSC2 data were reduced using dedicated instrument pipelines 52, 53, 54.
The VLT+FORS2 and Magellan+IMACS spectra were reduced in standard fashion using IRAF.
The FORS2 spectrum was obtained in spectropolarimetric mode, but the ordinary and extraordi-
nary rays were combined to make an intensity spectrum.
Imaging and removal of the host contribution The LCOGT gri images were pre-processed
using the Observatory Reduction and Acquisition Control Data Reduction pipeline55. To remove
the host contribution we performed image subtraction using the pre-discovery DECam gri images
as templates. The Swift UVOT observations were reduced following the standard procedures and
software (UVOTSOURCE). To extract the photometry, we used a 4′′ aperture and a curve of growth
aperture correction. For the Swift filters we do not have pre-discovery observations, and hence
use the model galaxy spectrum from the SED fit (Supplementary Figure 6) to generate synthetic
magnitudes at these wavelengths. For the B and V filters, where host contamination is a concern,
27

we estimate the host uncertainty to be < 0.05 mag, increasing to 0.1 mag for the U band. The host
uncertainties in the UV filters are more significant, however, at these wavelengths the host is many
orders of magnitude below the transient luminosity. In the AB system we obtain host magnitudes of
V = 18.98, B = 20.43, U = 21.95, UV W1 = 23.21, UVM2 = 23.65 and UVW2 = 23.62 mag,
which we subtract from the Swift measurements in order to obtain the transient photometry. Two
UVOT filters suffer from a red leak but this does not affect blue sources as ASASSN-15lh to the
same degree as e.g. SNe Ia56. Based on synthetic photometry of black-body spectra, we estimate
that the photometry is affected by < 2% for a black body with T = 15, 000 K. As this precision
is significantly lower than our photometric accuracy, we did not attempt to correct for this effect.
(Another study gives higher values - but still low - for this maximum contamination18).
Radio and X-ray observations We observed ASASSN-15lh from 0500–1400 UT on 2015 De-
cember 9, using the Australia Telescope Compact Array in 750C configuration, under project code
CX340. We observed in two frequency bands of width 2.048 GHz, centered at 5.5 and 9.0 GHz.
We used B1934-638 as both our flux and bandpass calibrator, and B2205-636 as our phase calibra-
tor. We reduced the data following standard procedures in Miriad57, and carried out the imaging
and self-calibration using the Common Astronomy Software Application58.
The field was dominated by PKS J2203-6130, a 9-mJy source (prior to primary beam correc-
tion) located 15 arcmin away from the target. We performed self-calibration, initially in phase only
(down to a timescale of 2 min), and eventually in amplitude and phase, on a timescale of 10 min.
Given the non-uniform uv-coverage, we tested a variety of image weighting schemes, finding the
optimum to be a Briggs robust weighting of 0.5. ASASSN-15lh was not detected down to 3σ upper
28

limits of 25 and 23µJy beam−1 at 5.5 and 9.0 GHz, respectively, consistent with a reported upper
limit from three weeks earlier59. Stacking our two frequency bands gave us a slightly deeper 3σ
radio upper limit of 17µJy beam−1.
The XMM–Newton satellite observed ASASSN–15lh as part of a Directors Discretionary
Time proposal on November 18, 2015. The on–source time is 11.9 ks, and after filtering epochs
of high background, 9 ks of MOS2, and 4 ks of PN data can be used. Given the lower background
and the longer net exposure, we used the MOS2 detector for estimating the upper limit on the
source flux. In an aperture of radius 32” centred on ASASSN-15lh we derive a 95% confidence
upper limit60, 61 of 11 source counts in the 0.3–1 keV band. To convert this to a limit on the flux,
we use the temperature of 70 eV found for ASASSN–14li as input, which taking into account that
the MBH in ASASSN–15lh is close to 8×10⁸ M, and that of ASASSN–14li is closer to 2×10⁶
M, implies a blackbody temperature of 18 eV (as T ∝ M−0.25). With this and NH=3×20 cm−2
W3PIMMS provides a 95% upper limit to the 0.3–1 keV X–ray flux of 2×10⁻¹⁶ erg cm−2 s−1,
yielding an upper limit to the source luminosity of 3×1040 erg s−1. This is significantly lower
than the individual or stacked limits from the continuous Swift XRT observations18, but refers to a
single epoch.
If TDEs do in fact all produce radio jets, as suggested by the recent detection of ASASSN-
14li62, then applying the same model with appropriate scalings would predict a radio flux of 10µJy
at the time of the observations. Our non-detection therefore remains consistent with a TDE origin
for ASASSN-15lh, and implies that the jet power of ASASSN-15lh is νLν . 1038 erg s−1, at least
2-3 orders of magnitude lower than that of the relativistic TDE Swift J1644+5763. This difference
29

is likely caused by a combination of misalignment of the jet axis and our line of sight (consistent
with our X-ray non-detection) and differences in accretion flow geometry, ISM density or magnetic
field strength64. If black hole spin were the dominant factor in setting jet power, we would have
expected ASASSIN-15lh to host a jet at least comparable in strength to ASASSN-14li (as we have
inferred a high black hole spin for ASASSN-15lh). Given that our upper limit is close to the
ASASSN-14li model prediction, this jet should have been detectable unless the spin of ASASSN-
15lh is significantly less than we have inferred, the ISM density is extremely low, or the SMBH in
ASASSN-14li is also rapidly spinning.
Tidal Disruption Luminosities and Energetics In Newtonian theory, a star with mass M? ≡
m?M and radius R? ≡ r?R will be tidally disrupted when it approaches an SMBH of mass
M• ≡M8108M within a distance
Rt = R?
(M•M?
)1/3
. (1)
Stars passing within this tidal radius can create a luminous electromagnetic flare provided Rt &
RIBCO, the location of the innermost bound circular orbit (IBCO) for the SMBH. This occurs for
SMBHs smaller than the Hills mass 2,
MH ≡ 9× 10⁷Mr3/2? m−1/2
? . (2)
Once the star has been disrupted, half of its gas is unbound from the SMBH; the other half remains
bound with a characteristic spread in specific orbital energy 65, 66
∆ε =GM•R?
R2t
. (3)
30

If we assume a top-hat distribution of debris energy, then the fallback time for the most tightly
bound debris is
tf = 3.5× 10⁷ M1/28 m−1
? r3/2? sec (4)
which gives a peak fallback rate
Mp
MEdd
= 0.13η−1M−3/28 m2
?r−3/2? , (5)
where η = 0.1η−1 is the radiative efficiency of accretion used to calculate the Eddington-limited
mass inflow rate MEdd. The peak bolometric luminosity is
Lp = 1.9× 1045η−1M−1/28 m2
?r−3/2? erg s−1, (6)
which is easily compatible with our observations for m? = 1 and η = 0.42, appropriate for Kerr
black holes. The radiated bolometric energy is
Erad = 8.9× 1052 η−1m? erg. (7)
ASASSN-15lh, although extreme as a SN 26, 27, 67, 68, 69, does not strain the theoretical luminosity
or energy budgets of TDEs.
Tidal Disruption Flare Timescales Existing observations do not yet distinguish between two
competing theories for producing TDE optical emission. In the accretion/reprocessing paradigm,
the bolometric luminosity of a compact (∼ 10Rg), efficiently circularized accretion disk is inter-
cepted by an optically thick screen of gas at larger scales (∼ 103Rg). This reprocessing layer
may be a slow outflow from the disk 70, or a more hydrostatic configuration 71, 35, 72. Regard-
less, it absorbs and re-emits a large fraction of the disk bolometric luminosity at longer wave-
lengths. Both cases predict a larger reprocessing layer for larger SMBHs: outflow velocities
31

vw ∼√GM•/Rt ∝ M
1/3• , or, if we assume that a hydrostatic reprocessing layer exists at scales
comparable to the semimajor axis of the most tightly bound material, its size ∝ M2/3• . Alterna-
tively, in the circularization paradigm, observed optical emission arises from shocks between de-
bris streams 33, which thermalize and radiate stream kinetic energy at the (generally large) stream
self-intersection radius.
The efficiency of circularization (and therefore Mp) depends sensitively on the dimensionless
orbital pericenter Rp/Rg: small decreases in Rp quickly move the self-intersection point inward,
increasing circularization efficiency 73, 74. The low luminosities seen in many optically-selected
TDEs may reflect that most TDEs have sub-relativistic pericenters and circularize inefficiently, so
that their peak luminosity is ηMpc2 34.
For an extremely massive SMBH with M• ≈MH, all TDE pericenters are highly relativistic
and circularization is maximally efficient (with a possible caveat if the SMBH spin is rapid and
strongly misaligned75, 76). Stream self-intersection points will be ∼ Rp, near the IBCO 34, so
the circularization and accretion power will be comparable. It is therefore natural to expect that
TDEs from the most massive SMBHs will be brighter and able to attain their theoretical Lp, while
smaller SMBHs will often produce TDEs that (due to inefficient circularization) have luminosities
well below Lp.
We propose that the two peaks in the ASASSN-15lh light curve correspond to two different
energy sources: first, the circularization luminosity, and second, the accretion luminosity. The
32

former evolves on the fallback timescale tf while the latter evolves on a viscous timescale,
tv =
√8R3
p
GM•α−1
[H(2Rp)
2Rp
]−2
, (8)
where we have assumed that the disk outer edge is 2Rp, α < 1 is the usual Shakura-Sunyaev
viscosity parameter, and H/R is the disk aspect ratio. For standard TDEs, these two sources of
luminosity are difficult to disentangle, because tv tf77, 78: as soon as matter circularizes into a
disk, it drains rapidly into the SMBH, and the two sources of luminosity rise and fall together.
However, for very massive SMBHs, Mp < MEdd and the accretion disk will be geometri-
cally thin, dramatically increasing tv and producing an inverted timescale hierarchy: tv & tf . The
circularization luminosity can be released promptly, but accretion luminosity will be bottlenecked
by the long tv. The range of inferred SMBH masses for ASASSN-15lh yield Mp . MEdd (un-
like for most other TDE hosts), so it is natural to expect two power sources - circularization and
accretion - to have two different peaks.
The characteristic decay time of the first peak will be ∼ tf , while that of the second will be
tv, which is a sensitive function of α and H/R. Plausible parameter choices (e.g. M• = 108M,
α = 0.1, H/R = 0.03) give tv ∼ 6 months, in agreement with the observed second component
of the light curve. However, the first component of the light curve decays on a ∼ 1 − 2 month
timescale, unlike the Newtonian estimate of Eq. 4: tf ≈ 1 yr. In the following subsection, we
argue that GR effects can increase ∆ε in TDEs with extremely relativistic pericenters, substantially
reducing tf for this subset of TDEs.
33

Relativistic Alterations to the Fallback Time Highly relativistic tidal disruption will alter the
Newtonian ∆ε. The frozen-in energy spread ∆ε can increase by a factor up to√
2 79, decreasing
tf and increasing Mp modestly. However, ∆ε may increase further by modest spin-orbit mis-
alignments in a TDE for sufficiently relativistic pericenters 66. Here, we argue that this effect can
strongly reduce the fallback time from the Newtonian estimate of Eq. 4.
The extremity of a TDE is quantified not just by B ≡ Rp/Rg, but also by the penetration
factor β ≡ Rt/Rp. Large β TDEs will strongly compress the star orthogonal to the orbital plane,
causing a vertical collapse with velocity vz ≈ β√GM?/R?. The collapse is reversed near peri-
center, once internal pressure in the disrupted star builds up to the point where it “bounces” along
this vertical axis 80, receiving an almost impulsive hydrodynamic kick ≈ vz along the direction
of collapse. The bounce typically has little effect on the energy spread of the debris 65, 73, despite
the fact that Vpvz & ∆ε for large β or small B (here Vp is the orbital velocity at pericenter). One
could define a hydrodynamic component of the energy spread, ∆εh ≡ ~Vp · ~vz = Vpvz cos θ, but in
standard TDEs the misalignment angle θ = π/2.
However, for very low B, modest spin-orbit misalignment will precess the orbital plane as
the star passes through the tidal sphere, partially aligning the axis of vertical collapse with the
orbital velocity vector. The per-orbit precession in the line of ascending nodes for a parabolic orbit
is 81
δΩ =√
2πa•
(Rg
Rp
)3/2
, (9)
at leading post-Newtonian order. Since most of this shift occurs near pericenter, we approximate
the rotation in the line of ascending nodes between Rt and the bounce (near Rp) as δΩ/2. The
34

misalignment angle cos θ ≈ δΩ2
sin I , where I is the misalignment between spin and orbital angular
momentum. Defining a total energy spread ∆εtot ≡ ∆ε+∆εh, we find (Stone, Kennon, & Metzger
in prep.)
∆εtot = ∆ε(1 + a•β3/2B−3/2 sin I). (10)
The above arguments are approximate, as the post-Newtonian approximation begins to break down
for Rp ∼ Rg, and we have treated the bounce hydrodynamics impulsively. A detailed examination
of this spin-orbit coupling is beyond the scope of this paper, but order unity increases in ∆ε and
decreases in tf ∝ ∆ε3/2 are expected for TDEs around SMBHs with a• ≈ 1 and B ∼ 1.
Relativistic Calculation of the Hills Mass Some of the previous Newtonian estimates break down
when the star’s orbital pericenter Rp ∼ Rg. In this regime, general relativistic effects are crucial
for proper modelling of the Hills mass82, 14. The increased MH arises from two different effects:
first, a large a• will lower the IBCO radius significantly. Second, the Kerr tidal field is somewhat
stronger than the Schwarzschild equivalent.
To calculate MH(a•), we employ Fermi Normal Coordinates to write a local, fully general
relativistic tidal tensor83. We then employ the formalism of Ref. 14 to estimate relativistic Hills
masses. Results are shown for equatorial orbits (which maximize MH) in Figure 4, where we see
that the relativistic Kerr Hills mass can be almost an order of magnitude greater than the Newtonian
(or Schwarzschild) equivalent.
Data Availability Statement The photometry and spectra of ASASSN-15lh supporting the find-
ings of this study are available from WISeREP84:
35

36. Planck Collaboration XVI. Planck 2013 results. XVI. Cosmological parameters. Astron.
Astrophys. 571, A16 (2014). 1303.5076.
37. Melchior, P. et al. Optical broad-band photometry and reference image for APMUKS(BJ)
B215839.70-615403.9 / ASASSN-15lh from the Dark Energy Survey. The Astronomer’s Tele-
gram 7843 (2015).
38. Prieto, J. L. et al. APMUKS(BJ) B215839.70-615403.9: The massive host galaxy candidate
of ASASSN-15lh. The Astronomer’s Telegram 7776 (2015).
39. Schlafly, E. F. & Finkbeiner, D. P. Measuring Reddening with Sloan Digital Sky Survey Stellar
Spectra and Recalibrating SFD. Astrophys. J. 737, 103 (2011). 1012.4804.
40. Bruzual, G. & Charlot, S. Stellar population synthesis at the resolution of 2003. Mon. Not. R.
Astron. Soc. 344, 1000–1028 (2003). astro-ph/0309134.
41. Arnouts, S. et al. Measuring and modelling the redshift evolution of clustering: the Hubble
Deep Field North. Mon. Not. R. Astron. Soc. 310, 540–556 (1999). astro-ph/9902290.
42. Ilbert, O. et al. Accurate photometric redshifts for the CFHT legacy survey calibrated using the
VIMOS VLT deep survey. Astron. Astrophys. 457, 841–856 (2006). astro-ph/0603217.
43. Chabrier, G. Galactic Stellar and Substellar Initial Mass Function. Publications of the Astro-
nomical Society of the Pacific 115, 763–795 (2003). astro-ph/0304382.
44. Calzetti, D. et al. The Dust Content and Opacity of Actively Star-forming Galaxies. Astrophys.
J. 533, 682–695 (2000). astro-ph/9911459.
36

45. Kennicutt, R. C., Jr. Star Formation in Galaxies Along the Hubble Sequence. Ann. Rev. Astron.
Astrophys. 36, 189–232 (1998). astro-ph/9807187.
46. Vreeswijk, P. M. et al. The Hydrogen-poor Superluminous Supernova iPTF 13ajg and its Host
Galaxy in Absorption and Emission. Astrophys. J. 797, 24 (2014). 1409.8287.
47. Christensen, L. et al. A High Signal-to-noise Ratio Composite Spectrum of Gamma-ray Burst
Afterglows. Astrophys. J. 727, 73 (2011). 1011.0734.
48. Fox, A. J., Petitjean, P., Ledoux, C. & Srianand, R. Hot halos around high redshift proto-
galaxies. Observations of O VI and N V absorption in damped Lyman-α systems. Astron.
Astrophys. 465, 171–184 (2007). astro-ph/0701392.
49. Fox, A. J., Ledoux, C., Vreeswijk, P. M., Smette, A. & Jaunsen, A. O. High-ion absorption
in seven GRB host galaxies at z = 2-4. Evidence for both circumburst plasma and outflowing
interstellar gas. Astron. Astrophys. 491, 189–207 (2008). 0809.3247.
50. Kochanek, C. S. Abundance anomalies in tidal disruption events. Mon. Not. R. Astron. Soc.
458, 127–134 (2016). 1512.03065.
51. Miller, J. M. et al. Flows of X-ray gas reveal the disruption of a star by a massive black hole.
Nature 526, 542–545 (2015). 1510.06348.
52. Dopita, M. et al. The Wide Field Spectrograph (WiFeS). Ap&SS 310, 255–268 (2007).
0705.0287.
37

53. Dopita, M. et al. The Wide Field Spectrograph (WiFeS): performance and data reduction.
Ap&SS 327, 245–257 (2010). 1002.4472.
54. Smartt, S. J. et al. PESSTO: survey description and products from the first data release by the
Public ESO Spectroscopic Survey of Transient Objects. Astron. Astrophys. 579, A40 (2015).
1411.0299.
55. Jenness, T. & Economou, F. ORAC-DR: A generic data reduction pipeline infrastructure.
Astronomy and Computing 9, 40–48 (2015). 1410.7509.
56. Brown, P. J. et al. The Absolute Magnitudes of Type Ia Supernovae in the Ultraviolet. Astro-
phys. J. 721, 1608–1626 (2010). 1007.4842.
57. Sault, R. J., Teuben, P. J. & Wright, M. C. H. A Retrospective View of MIRIAD. In Shaw,
R. A., Payne, H. E. & Hayes, J. J. E. (eds.) Astronomical Data Analysis Software and Systems
IV, vol. 77 of Astronomical Society of the Pacific Conference Series, 433 (1995). astro-ph/
0612759.
58. McMullin, J. P., Waters, B., Schiebel, D., Young, W. & Golap, K. CASA Architecture and
Applications. In Shaw, R. A., Hill, F. & Bell, D. J. (eds.) Astronomical Data Analysis Soft-
ware and Systems XVI, vol. 376 of Astronomical Society of the Pacific Conference Series, 127
(2007).
59. Kool, E. C. et al. Radio Non-Detection of ASASSN-15lh = SN2015L. The Astronomer’s
Telegram 8388 (2015).
38

60. Kraft, R. P., Burrows, D. N. & Nousek, J. A. Determination of confidence limits for experi-
ments with low numbers of counts. Astrophys. J. 374, 344–355 (1991).
61. Helene, O. Errors in experiments with small numbers of events. Nuclear Instruments and
Methods in Physics Research A 228, 120–128 (1984).
62. van Velzen, S. et al. A radio jet from the optical and x-ray bright stellar tidal disruption flare
ASASSN-14li. Science 351, 62–65 (2016). 1511.08803.
63. Levan, A. J. et al. An Extremely Luminous Panchromatic Outburst from the Nucleus of a
Distant Galaxy. Science 333, 199 (2011). 1104.3356.
64. Tchekhovskoy, A., Metzger, B. D., Giannios, D. & Kelley, L. Z. Swift J1644+57 gone MAD:
the case for dynamically important magnetic flux threading the black hole in a jetted tidal
disruption event. Mon. Not. R. Astron. Soc. 437, 2744–2760 (2014). 1301.1982.
65. Guillochon, J. & Ramirez-Ruiz, E. Hydrodynamical Simulations to Determine the Feeding
Rate of Black Holes by the Tidal Disruption of Stars: The Importance of the Impact Parameter
and Stellar Structure. Astrophys. J. 767, 25 (2013). 1206.2350.
66. Stone, N., Sari, R. & Loeb, A. Consequences of strong compression in tidal disruption events.
Mon. Not. R. Astron. Soc. 435, 1809–1824 (2013). 1210.3374.
67. Bersten, M. C., Benvenuto, O. G., Orellana, M. & Nomoto, K. The Unusual Super-luminous
Supernovae SN 2011kl and ASASSN-15lh. Astrophys. J. Letters 817, L8 (2016). 1601.
01021.
39

68. Kozyreva, A., Hirschi, R., Blinnikov, S. & den Hartogh, J. How much radioactive nickel does
ASASSN-15lh require? Mon. Not. R. Astron. Soc. (2016). 1603.00335.
69. Chatzopoulos, E. et al. Extreme Supernova Models for the Superluminous Transient
ASASSN-15lh. ArXiv e-prints (2016). 1603.06926.
70. Metzger, B. D. & Stone, N. C. A Bright Year for Tidal Disruptions? ArXiv e-prints (2015).
1506.03453.
71. Coughlin, E. R. & Begelman, M. C. Hyperaccretion during Tidal Disruption Events: Weakly
Bound Debris Envelopes and Jets. Astrophys. J. 781, 82 (2014). 1312.5314.
72. Roth, N., Kasen, D., Guillochon, J. & Ramirez-Ruiz, E. The X-ray through Optical Fluxes
and Line Strengths of Tidal Disruption Events. ArXiv e-prints (2015). 1510.08454.
73. Hayasaki, K., Stone, N. & Loeb, A. Finite, intense accretion bursts from tidal disruption of
stars on bound orbits. Mon. Not. R. Astron. Soc. 434, 909–924 (2013). 1210.1333.
74. Shiokawa, H., Krolik, J. H., Cheng, R. M., Piran, T. & Noble, S. C. General Relativistic
Hydrodynamic Simulation of Accretion Flow from a Stellar Tidal Disruption. Astrophys. J.
804, 85 (2015). 1501.04365.
75. Hayasaki, K., Stone, N. C. & Loeb, A. Circularization of Tidally Disrupted Stars around
Spinning Supermassive Black Holes. ArXiv e-prints (2015). 1501.05207.
76. Guillochon, J. & Ramirez-Ruiz, E. A Dark Year for Tidal Disruption Events. Astrophys. J.
809, 166 (2015). 1501.05306.
40

77. Ulmer, A. Flares from the Tidal Disruption of Stars by Massive Black Holes. Astrophys. J.
514, 180–187 (1999).
78. Strubbe, L. E. & Quataert, E. Optical flares from the tidal disruption of stars by massive black
holes. Mon. Not. R. Astron. Soc. 400, 2070–2084 (2009). 0905.3735.
79. Kesden, M. Black-hole spin dependence in the light curves of tidal disruption events. Phys.R.
D 86, 064026 (2012). 1207.6401.
80. Carter, B. & Luminet, J.-P. Tidal compression of a star by a large black hole. I Mechani-
cal evolution and nuclear energy release by proton capture. Astron. Astrophys. 121, 97–113
(1983).
81. Merritt, D., Alexander, T., Mikkola, S. & Will, C. M. Testing properties of the Galactic center
black hole using stellar orbits. Phys.R. D 81, 062002 (2010). 0911.4718.
82. Beloborodov, A. M., Illarionov, A. F., Ivanov, P. B. & Polnarev, A. G. Angular momentum
of a supermassive black hole in a dense star cluster. Mon. Not. R. Astron. Soc. 259, 209–217
(1992).
83. Marck, J.-A. Solution to the Equations of Parallel Transport in Kerr Geometry; Tidal Tensor.
Proceedings of the Royal Society of London Series A 385, 431–438 (1983).
84. Yaron, O. & Gal-Yam, A. WISeREP - An Interactive Supernova Data Repository. Publications
of the Astronomical Society of the Pacific 124, 668–681 (2012). 1204.1891.
41

85. Nicholl, M. et al. Slowly fading super-luminous supernovae that are not pair-instability explo-
sions. Nature 502, 346–349 (2013). 1310.4446.
86. Holoien, T. W.-S. et al. ASASSN-15oi: A Rapidly Evolving, Luminous Tidal Disruption
Event at 216 Mpc. ArXiv e-prints (2016). 1602.01088.
87. Hatano, K., Branch, D., Fisher, A., Millard, J. & Baron, E. Ion Signatures in Supernova
Spectra. Astrophys. J. Supplements 121, 233–246 (1999). astro-ph/9809236.
88. Chornock, R. et al. The Ultraviolet-bright, Slowly Declining Transient PS1-11af as a Partial
Tidal Disruption Event. Astrophys. J. 780, 44 (2014). 1309.3009.
89. Holoien, T. W.-S. et al. Six months of multiwavelength follow-up of the tidal disruption
candidate ASASSN-14li and implied TDE rates from ASAS-SN. Mon. Not. R. Astron. Soc.
455, 2918–2935 (2016). 1507.01598.
42
Supplementary Information
2
4
6
8
+14 -4
-15
ASASSN-15lh PTF12damSN 2010gxPTF13ehe
a
3
6
9
12
Fλ (s
cale
d)
+57+55
+30
b
3000 4000 5000 6000 70001
3
5
7+257
+171
+251
c
2
4
6
8ASASSN-14ae
PTF09geASASSN-15oi
d
+14
+4
3
6
9
12
He II
He II
Hα+57 +30
e
3000 4000 5000 6000 7000Rest-frame Wavelength ( )
1
3
5
7
+257
+132f
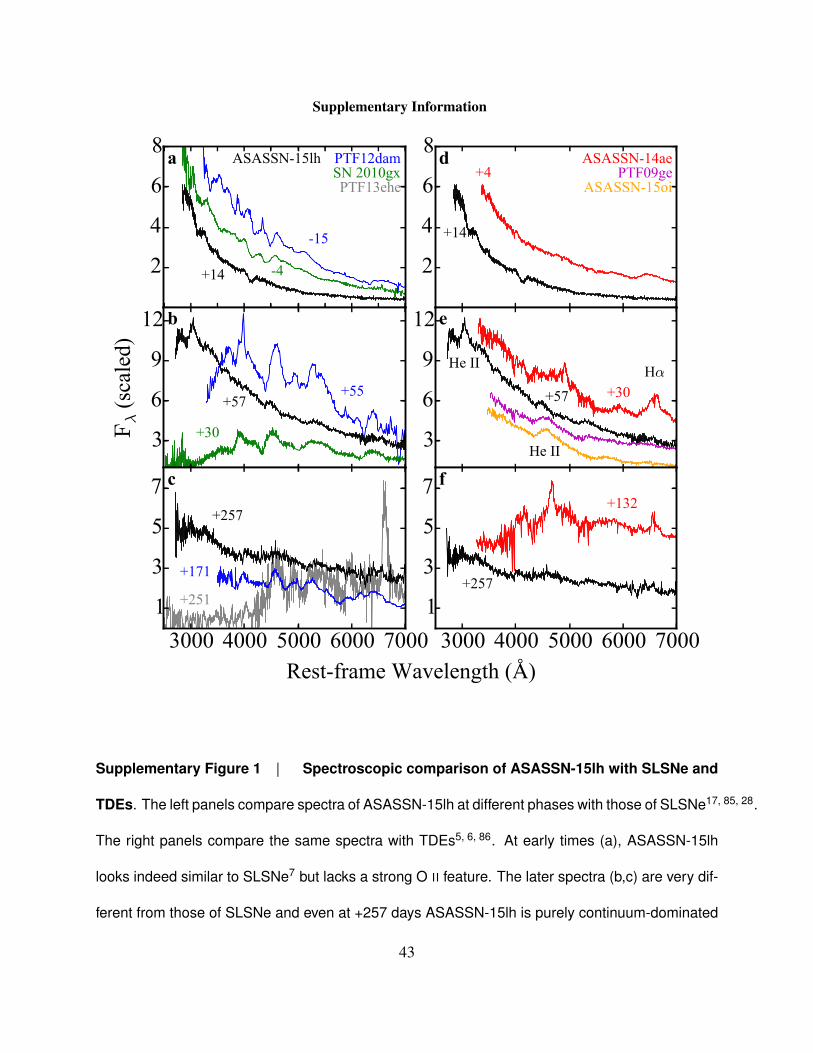
Supplementary Figure 1 | Spectroscopic comparison of ASASSN-15lh with SLSNe and
TDEs. The left panels compare spectra of ASASSN-15lh at different phases with those of SLSNe17, 85, 28.
The right panels compare the same spectra with TDEs5, 6, 86. At early times (a), ASASSN-15lh
looks indeed similar to SLSNe7 but lacks a strong O II feature. The later spectra (b,c) are very dif-
ferent from those of SLSNe and even at +257 days ASASSN-15lh is purely continuum-dominated
43
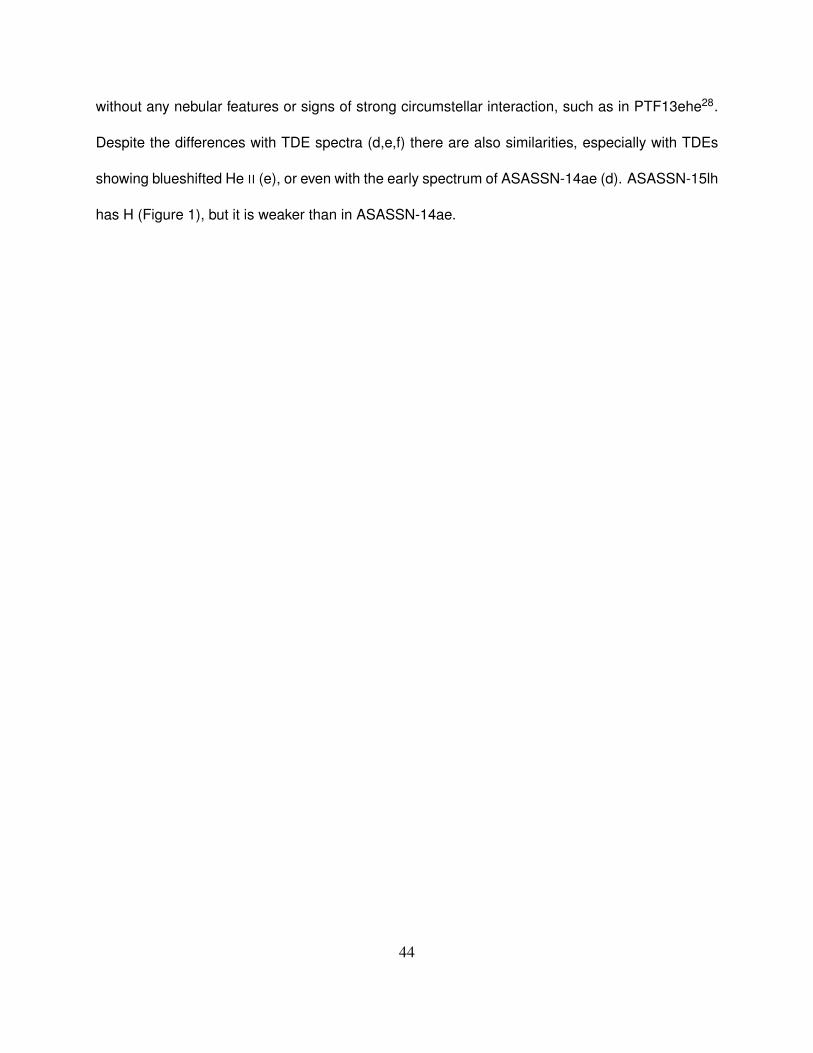
without any nebular features or signs of strong circumstellar interaction, such as in PTF13ehe28.
Despite the differences with TDE spectra (d,e,f) there are also similarities, especially with TDEs
showing blueshifted He II (e), or even with the early spectrum of ASASSN-14ae (d). ASASSN-15lh
has H (Figure 1), but it is weaker than in ASASSN-14ae.
44

2500 3000 3500 4000 4500 5000 5500 6000Rest-frame Wavelength ( )
1
3
5
7Fλ
O II modelMg II model
a
10 15 20 25 30 35 40Rest-frame days
15182124
v (1
03
km
s−1
)
b
Supplementary Figure 2 | The early phases of ASASSN-15lh. (a) Modelling the spectra
with SYNOW87 and O II as in SLSNe8, 15 is not possible as a strong feature at ∼4400 A is in-
evitable. A tentative identification of the strongest feature at ∼4100 A is Mg II, which however
produces additional strong features in the UV. Such features (transient in nature) have been ob-
served in a TDE candidate88 and cannot be ruled out for the early phases of ASASSN-15lh, based
on the available spectra. The use of SYNOW in this case is purely illustrative, as this code has not
been made to model TDEs. (b) Velocity evolution of the absorption at ∼4100 A assuming it is Mg
II. Another possibility for this feature is that it might be due to high-velocity He II16. In this case,
the velocities are larger by ∼12,000 km s−1.
45

-6 -4 -2 0 2 4 60.95
1.00
1.05
1.10+57
Hαa
-4 -2 0 2 4 6
+91
-4 -2 0 2 4 6
+126
-4 -2 0 2 4 6
+248
-20 -15-10 -5 0 +5+100.95
1.00
1.05
1.10
1.15
1.20
Nor
mal
ised
Flu
x
He
II 3
205
He
II 3
205
+57
+75
b
-20 -15-10 -5 0 +5+10+15v (103 km s−1 )
He
II 4
686
Supplementary Figure 3 | Detection of H and possible detection of transient He in the
spectra of ASASSN-15lh. (a) Hα at representative epochs. The line is weak and the detection
significance varies with S/N (see also Figure 1). However, there is no measurable evolution in its
46
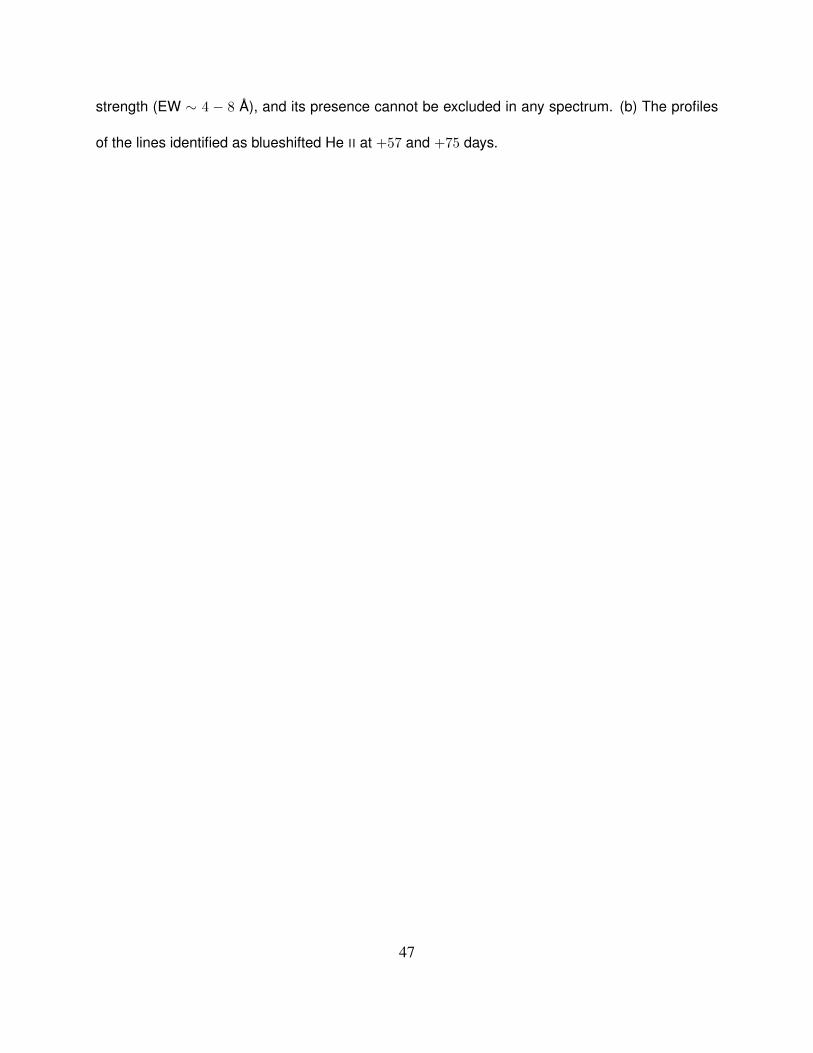
strength (EW ∼ 4 − 8 A), and its presence cannot be excluded in any spectrum. (b) The profiles
of the lines identified as blueshifted He II at +57 and +75 days.
47

Supplementary Figure 4 | An ultraviolet spectrum of ASASSN-15lh obtained with HST +COS
at 168 rest-frame days past maximum. We identify both local geocoronal lines (marked with
green) and narrow absorption features associated with ASASSN-15lh at z = 0.2326 (red). Detec-
tions (marked with red solid lines), include Ly-α, Ly-β, Si III, C IV, and, notably, N V and O VI. The
most prominent lines that are not detected are marked with a red dashed line.
48

1.00.80.60.40.20.0
g - rg - i
a
1.51.00.50.00.51.01.5
Col
or (
AB
mag
)
UVM2 - UUVW1 - U
U - BU - g
U - rU - i
b
0 50 100 150 200 250 300Rest-frame days
0.00.51.01.52.02.5 UVW2 - UVM2
UVW2 - UVW1UVW2 - UUVW2 - B
c
Supplementary Figure 5 | The colour evolution of ASASSN-15lh. We use as reference
the UVW2 filter for the UV colours (c), the g filter for the optical colours (a) and the U filter for
additional UV and UV−optical colours (b). Errorbars are 1σ uncertainties. Most colours show a
significant evolution to the red, peaking at 60 days past-maximum and corresponding to the UV
49

minimum in Figure 2. Subsequently, the UV colours get bluer again. All colours remain fairly
constant after day +100 and for a period of over 120 days.
50

1000 3000 6000 104 3 · 104 6 · 104
Observedwavelength (Å)
1
10
100
1000Fν(µ
Jy)
1000 3000 6000 104 3 · 104 6 · 104
17
18
19
20
21
22
23
24
25
Bri
ghtn
ess(m
agA
B)
Supplementary Figure 6 | SED fit for the host galaxy of ASASSN-15lh. To perform the
fit we are using the code Le Phare and photometric data all the way from the far-UV (GALEX)
to the mid-IR (WISE). Shown is the best-fitting template (reduced χ2 = 0.998). The GALEX non-
detections are shown here with the nominal SExtractor photometry errors.
51

6 7 8 9 10 11 12log M /M¯
3
2
1
0
1
2lo
gSFR
[M¯
yr−
1]
UltraVISTA z < 0.4H-poor SLSNe z < 0.4Optical/UV TDEsASASSN-15lh
10−8
10−9
10−1
0
10−1
1
10−1
2
10−1
3
Supplementary Figure 7 | The properties of the host galaxy of ASASSN-15lh compared
to those of SLSNe10, 11 and TDEs5, 6, 89, 86. For comparison, we show the general galaxy popu-
lation at z < 0.4 from UltraVISTA and we have drawn lines of equal specific SFR. The location of
ASASSN-15lh clearly stands out from those of SLSNe that are found in dwarf star-forming galax-
ies on or above the main sequence of star formation. The separation of ASASSN-15lh is 3 orders
of magnitude in terms of specific SFR. At the same time, the host is significantly more massive
from those of most optical TDEs, suggesting a large SMBH mass.
52

Supplementary Figure 8 | The localisation of ASASSN-15lh in the nucleus of its host
galaxy. On the left is an HST image of ASASSN-15lh obtained at day +47. On the right is a
DECam image from October 2014, several months before the transient appeared. The sources
used to derive the geometric transformation between the frames are marked with blue squares.
The inset shows a zoom in to the host together with a GALFIT model and the residual from the
model fit. ASASSN-15lh has an offset of 36 ± 53 mas from the nucleus and it is thus consistent
with the location of the central SMBH.
53

Line λobs (A) offset (km/s) a EW (A) EWGRBb (A) EWSLSN (A)
O VI 1031 1271.57 −80 ± 12 1.97 ± 0.26 – –
O VI 1037 1278.55 −80 ± 12 1.57 ± 0.24 – –
S III 1206 1487.26 +44 ± 22 0.79 ± 0.26 – –
Ly-α 1498.26 0± 12 1.15 ± 0.32 73.0 –
N V 1238 1526.50 −117 ± 12 1.97 ± 0.41 0.14 –
N V 1242 1531.26 −117 ± 12 2.07 ± 0.43 0.07 –
Si II 1259 – – < 1.73 1.26 –
Si II 1304 – – < 2.21 2.29 –
C II 1334 – – < 2.56 1.73 –
Si IV 1393 – – < 2.75 0.95 –
Si II 1527 – – < 6.7 0.93 –
C IV/C IV 1548 – −204 ± 92 3.08 ± 2.35 2.18 –
Fe II 1608 – – < 24.0 0.85 –
Fe II 2382 – – < 1.31 1.65 0.35 ±0.03 c
Fe II 2600 – – < 3.65 1.85 0.29 ±0.03 c
Mg II 2796 3445.67 +8 ± 8 0.50 ± 0.05 1.71 2.6± 1.2 d
Mg II 2803 3454.46 +14 ±10 0.38 ± 0.05 1.47 – d
Table 1: Absorption lines in the spectrum of ASASSN-15lh. Upper limits are 3σ. EWs are in rest-frame.
Notes: a The reference velocity was set to Ly-alpha (z = 0.23253). b Based on a high S/N composite GRB
afterglow spectrum47. Typical error for weak lines is 0.02 A. c Based only on PTF13ajg46. d Total value for
the doublet, based on a sample of 13 events46. 54

Date (UT) Phase Telescope+Instrument Grism Range (nm)
2015-06-22.7 +14.0 FTS+FLOYDS 325 - 930
2015-06-24.7 +15.6 ANU 2.3m+WiFeS B3000+R3000 350 - 956
2015-07-01.6 +21.2 ANU 2.3m+WiFeS B3000+R3000 350 - 956
2015-07-08.7 +26.9 ANU 2.3m+WiFeS B3000+R3000 350 - 956
2015-07-21.3 +37.1 VLT+FORS2 300V 445 - 865
2015-07-31.5 +45.4 ANU 2.3m+WiFeS B3000+R3000 350 - 956
2015-08-14.3 +56.6 NTT+EFOSC2 GR#11+16 334 - 999
2015-09-06.0 +75.0 NTT+EFOSC2 GR#11+16 334 - 999
2015-09-16.1 +83.2 NTT+EFOSC2 a GR#11+16 334 - 999
2015-09-23.2 +89.0 NTT+EFOSC2 GR#11+16 334 - 999
2015-09-25.1 +90.6 VLT+FORS2 300V 445 - 865
2015-10-11.1 +103.6 NTT+EFOSC2 b GR#11 334 - 745
2015-10-13.2 +105.2 NTT+EFOSC2 b GR#16 599 - 999
2015-11-08.0 +126.2 Magellan+IMACS Gri-300-17.5 400-999
2015-11-18.1 +134.3 NTT+EFOSC2 GR#13 365 - 924
2015-12-16.0 +157.0 NTT+EFOSC2 GR#11+16 334 - 999
2016-04-06.3 +248.1 NTT+EFOSC2 GR#11+16 334 - 999
2016-04-15.3 +256.2 NTT+EFOSC2 GR#11+16 334 - 999
Table 2: Log of Spectra. Notes: a Low S/N; not used. b Combined to a single spectrum.
55