the subscription economy index - zuora · s&p 500 sales and us retail sales. overall, the...
TRANSCRIPT

THE SUBSCRIPTION ECONOMY INDEX ™
2nd Edition | June 2017

T H E S U B S C R I P T I O N E C O N O M Y I N D E X
INTRODUCTION
The Subscription Economy Index™ (SEI) is based on anonymized, aggregated, system-generated
activity on the Zuora service, a comprehensive billing and finance platform for subscription-based busi-
nesses. It reflects the growth metrics of hundreds of companies around the world, and spans a number
of industries including SaaS, media, telecommunications and corporate services.
The breadth and depth of the billing reflected in this study speak to the rapid ascent of the
Subscription Economy. Gartner predicts that by 2020, more than 80% of software providers will have
shifted to subscription-based business models. In addition, IDC predicts that by 2020 50% of the world’s
largest enterprises will see the majority of their business depend on their ability to create digitally
enhanced products, services and experiences.
Recurring revenue-based business models are not new, but they have exploded in recent years
owing to cloud-enabled, pay-as-you-go services. As globalization has placed increasing margin strains
on manufacturing and product sales, subscription-based businesses have benefited from stable and pre-
dictable revenue projections, data-driven insights from direct consumer relationships, and large econo-
mies of scale owing to relatively small fixed costs.
This study was conducted by Zuora Chief Data Scientist Carl Gold.

T H E S U B S C R I P T I O N E C O N O M Y I N D E X
C H A P T E R 1
THE SUBSCRIPTION ECONOMY INDEX VERSUS S&P 500 SALES GROWTH
Subscription business sales have grown substantially faster than two key public benchmarks --
S&P 500 sales and US retail sales. Overall, the Subscription Economy Index (SEI) reveals that subscription
businesses grew revenues about 8 times faster than S&P 500 company revenues (15.2% versus 2.0%)
and about 5 times faster than U.S retail sales (15.2% versus 3.4%) from January 1, 2012 to March 30, 2017.
The slowest period of growth for the SEI, in late 2012 and 2013, aligns with a similarly challeng-
ing time for the American economy during the gradual but tepid recovery from the Great Recession of
2008. According to the Federal Reserve Bank of St. Louis, growth in non-residential fixed investment
suffered a discrete deceleration from $2,016 billion in Q2 of 2012 to $2,011 billion in Q3 of 2012.
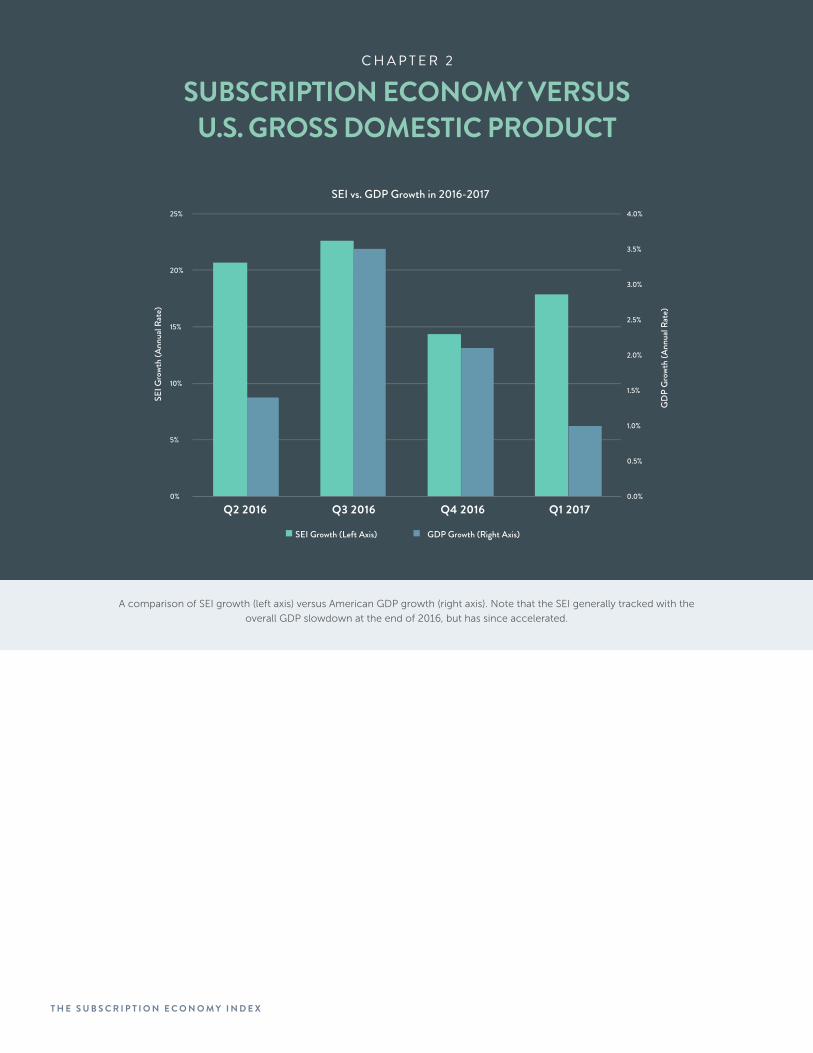
More recently, the U.S. GDP peaked in Q3 2016 at 3.5% and then sank to just 0.7% in Q1 of 2017. At the
same time, the SEI growth rate also peaked in Q3 2016, and in the last 6 months the SEI has cooled
slightly to an average annual growth rate of 16.1% from a breakneck pace of 21.6% in the previous six
months. The SEI is still growing at around 80% of its peak growth rate of 21.6% in Q3 2016, while the
GDP is now growing at just around 30% of that Q3 2016 peak of 3.5%.
Caption 1: Quarterly levels of the Subscription Economy Index (SEI), in comparison to indices of the S&P 500 Sales per Share and US Retail
Sales. All indices take a base value of 100 on January 1st 2012, and grow in proportion to the quarterly increase in the one year trailing to-
tal sales that they measure. Over a period of just over 6 years (January 1, 2012 to March 30, 2017), the SEI grows at an average annual rate
of 15.2%. The S&P 500 Sales grows at an average annual rate of 2.0%, while US retail sales grew at an average annual rate of 3.4%.
Analysis
100
120
140
160
180
200
220SEI compared to S&P 500 Growth
SEI S&P 500 Sales Index US Retail Sales Index
1/1/2
012
Q1 2
012
Q2 2012
Q3 2012
Q4 2012
Q1 2
013
Q2 2013
Q3 2013
Q4 2013
Q1 2
014
Q2 2014
Q3 2014
Q4 2014
Q1 2
015
Q2 2015
Q3 2015
Q4 2015
Q1 2
016
Q2 2016
Q3 2016
Q4 2016
Q1
2017
T H E S U B S C R I P T I O N E C O N O M Y I N D E X
C H A P T E R 2
SUBSCRIPTION ECONOMY VERSUS U.S. GROSS DOMESTIC PRODUCT
A comparison of SEI growth (left axis) versus American GDP growth (right axis). Note that the SEI generally tracked with the
overall GDP slowdown at the end of 2016, but has since accelerated.
4.0%
3.5%
3.0%
2.5%
2.0%
1.5%
1.0%
0.5%
0.0%
25%
20%
15%
10%
5%
0%
GD
P G
rowt
h (A
nnua
l Rat
e)
GDP Growth (Right Axis)SEI Growth (Left Axis)
SEI G
rowt
h (A
nnua
l Rat
e)
Q2 2016 Q3 2016 Q4 2016 Q1 2017

T H E S U B S C R I P T I O N E C O N O M Y I N D E X
C H A P T E R 3
TWO SUBSCRIPTION ECONOMY GROWTH LEVERS: ARPA AND NET ACCOUNTS
This figure demonstrates the two primary levers of growth in the Subscription Economy -- Aver-
age Revenue Per Account (ARPA) and net account growth. If the total billings number of a company goes
up, that means at least one of two things must have happened -- either the number of accounts being
billed went up, or the amount each account was billed went up.
Note that while the SEI has grown more or less continuously over the last five years, there have
been periods when ARPA growth has slowed, and even reversed. There were two discrete periods when
companies prioritized net account growth ahead of ARPA growth: 2012-2013, and late 2014 to mid-2015.
At these times the total number of accounts grew rapidly, but revenue per account stagnated or sank.
Recurring revenue grows through either charging subscribers more (Average Revenue Per Account (ARPA)) or charging more
subscribers (Accounts). The teal line and the left axis show cumulative growth of the SEI in percentage terms. The red and blue
lines shows the cumulative percentage changes in ARPA and Accounts respectively, both scaled on the right axis. Accounts
have grown more or less continuously over the measurement period, while there have been times when ARPA growth slowed
and even reversed.
0%
10%
20%
30%
40%
50%
60%
70%
0%
20%
40%
60%
80%
100%
120%
140%
1/1/12
Q1 2012
Q2 2012
Q3 2012
Q4 2012
Q1 2013
Q2 2013
Q3 2013
Q4 2013
Q1 2014
Q2 2014
Q3 2014
Q4 2014
Q1 2015
Q2 2015
Q3 2015
Q4 2015
Q1 2016
Q2 2016
Q3 2016
Q4 2016
Q1 2017
ARPA
& A
ccou
nt G
rowt
h
SEI T
otal
Rev
enue
Gro
wth
Overall SEI Growth compared to ARPA and Account Growth
SEI Growth ARPA Growth Account Growth

T H E S U B S C R I P T I O N E C O N O M Y I N D E X
C H A P T E R 3
Each of those periods was followed by a correctional phase when the net new accounts
decreased, but but the average revenue per account increased. Pricing in the Subscription Economy is a
flexible, iterative process. Companies frequently experiment with a combination of set fees and usage-
based models as they seek to “land and expand.” Strategies prioritizing net new account growth will fre-
quently drive growth with competitive pricing, and then later “switch levers” and attempt to drive ARPA
by with usage-based billing and up-selling into larger accounts.
Note that the most recent two years, 2015-2017, appear to represent a “Goldilocks” period of
both high net account growth and solid ARPA growth.

T H E S U B S C R I P T I O N E C O N O M Y I N D E X
C H A P T E R 4
SUBSCRIPTION REVENUE GROWTH BY BUSINESS MODEL
This figure shows the relative growth of B2B, B2C and B2A (Any) business model sub-indices.
Each sub-index “branches” from the primary SEI as it achieves statistical significance relative to the over-
all data set, which we define as a minimum of 25 constituents. By starting each new sub-index branch
with the value of the base index, they become easier to compare.
Much like basic cohort analysis, this is an effort to display how the past effects the present. For
SEI sub-indices for business models B2B, B2C, and B2A (Any). B2A companies offer subscriptions to both individuals and businesses.
Each sub-index is launched starting from the value of the main SEI when 25 constituents are available. B2B slumped shortly after
inception in 2012-2013, but has been the fastest growing sub-index in the most recent quarters. B2C was the fastest in 2015, but
slowed in 2016. B2A companies generally tracked the main (average) index until the last 6 months when they surprisingly slowed - it is
too early to tell if this is the beginning of new trend or a temporary fluctuation.
example, while the B2B sub-index has experienced the sharpest growth trajectory in recent quarters, it
is still clearly recovering from the trough period of 2012-2013. Both ARPA and net new accounts were
depressed for B2B companies during this period of corporate retrenchment.
90
100
110
120
130
140
150
160
170
180
190
200
210
220
230
Q1 2
012
Q2
2012
Q3
2012
Q4
2012
Q1 2
013
Q2
2013
Q3
2013
Q4
2013
Q1 2
014
Q2
2014
Q3
2014
Q4
2014
Q1 2
015
Q2
2015
Q3
2015
Q4
2015
Q1 2
016
Q2
2016
Q3
2016
Q4
2016
Q1 2
017
B2C
B2B
B2Any
SEI Main

T H E S U B S C R I P T I O N E C O N O M Y I N D E X
C H A P T E R 4
For B2B companies, growth rate is the leading indicator of a company’s success. In the soft-
ware sector, for example, a company that grows less than 20% annually has a 92% chance of failure
(McKinsey). Successful B2B companies must scale sales teams, add new product editions and upsell
paths, pursue international markets and larger enterprise accounts, and optimize their business models
by taking on usage-based pricing. Their biggest challenges include systems constraints and conflicting
systems of record.
For B2C companies, net user growth is the key metric. Successful B2C companies increase
subscriber acquisition rates with rapid pricing experimentation, increase retention and ARPA by tailoring
offerings based on behavioral insights and willingness to pay, and increase capture rates by taming the
complexity of electronic payments. Their challenges include relatively high churn rates owing to poor
pricing and packaging decisions, fickle consumer behavior and/or lost revenue owing to poor payment
and acquisition systems. The B2C companies in our study had the fastest growth rate in 2015, but have
tapered more recently.
Over the past year (ending in March 2017), B2B and B2C com-
panies in the SEI have growth rates of 20% and 9% respectively (this is
a slight cooldown for B2C companies over the previous year). Growth
in the B2A space, which in this index comprises many companies in the
media and telecommunication industries, is currently at 14%.
GROWTH RATES: (L AST 12 MONTHS)
B2B growth: 20%B2C growth: 9%B2A growth: 14%
T H E S U B S C R I P T I O N E C O N O M Y I N D E X
C H A P T E R 5
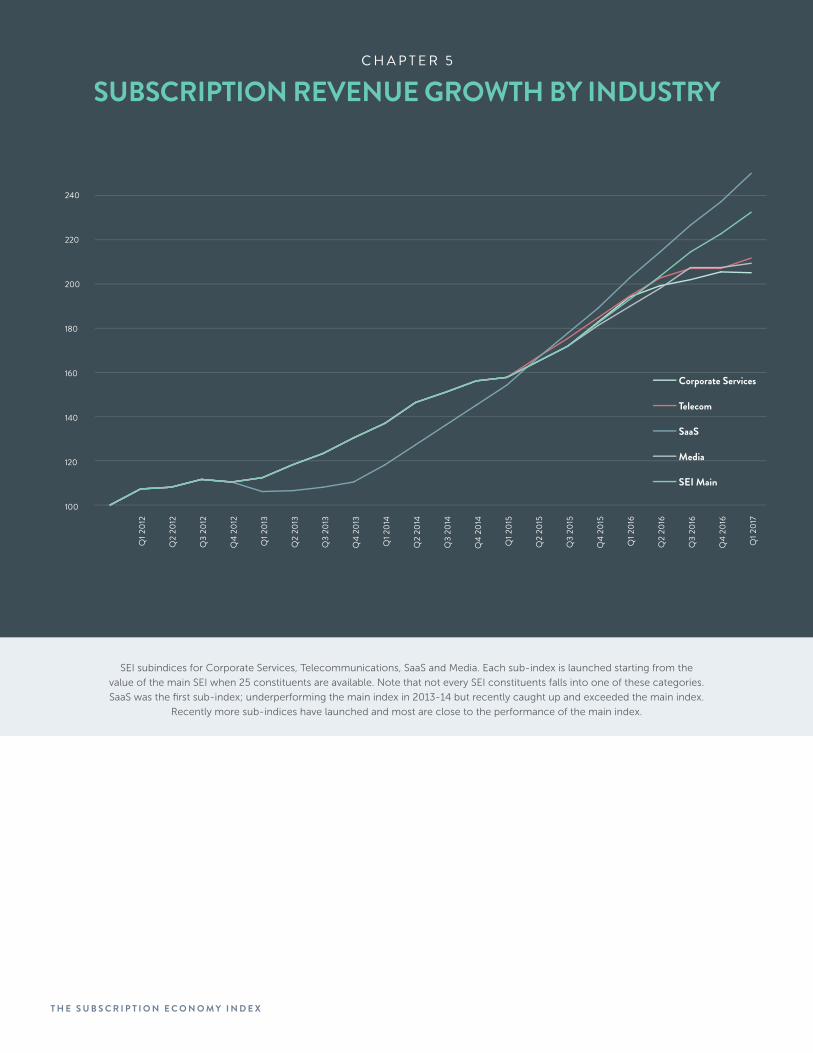
SUBSCRIPTION REVENUE GROWTH BY INDUSTRY
SEI subindices for Corporate Services, Telecommunications, SaaS and Media. Each sub-index is launched starting from the
value of the main SEI when 25 constituents are available. Note that not every SEI constituents falls into one of these categories.
SaaS was the first sub-index; underperforming the main index in 2013-14 but recently caught up and exceeded the main index.
Recently more sub-indices have launched and most are close to the performance of the main index.
100
120
140
160
180
200
220
240
Q1 2
012
Q2
2012
Q3
2012
Q4
2012
Q1 2
013
Q2
2013
Q3
2013
Q4
2013
Q1 2
014
Q2
2014
Q3
2014
Q4
2014
Q1 2
015
Q2
2015
Q3
2015
Q4
2015
Q1 2
016
Q2
2016
Q3
2016
Q4
2016
Q1 2
017
Corporate Services
Telecom
SaaS
Media
SEI Main
T H E S U B S C R I P T I O N E C O N O M Y I N D E X
Which industries are thriving in the Subscription Economy? As a subscription billing and finance
SaaS company based in Silicon Valley, Zuora has a significant customer base of other software vendors
-- both SaaS natives and on-premise vendors switching to recurring revenue models. As a result, SaaS
was the first sub-index -- which underperformed the main index in 2013-14, but recently caught up
and exceeded the main index. In the last 6 months (ending in March 2017), SaaS companies have been
relatively unaffected by the slowdown in US GDP, while media and telecommunication companies have
slowed slightly along with the broader market.
C H A P T E R 5
GROWTH RATES: (L AST 12 MONTHS)
SaaS growth: 23%Telecommunications growth: 9%Media growth: 10%Corporate Services growth: 5%
As Zuora’s client base has expanded and diversified, more
sub-indices have launched. Most of these new sub-indices per-
form close to the performance of the main index. Early evidence
suggests that corporate services are underperforming against the
median growth rate, but later editions of this study will confirm this.

T H E S U B S C R I P T I O N E C O N O M Y I N D E X
C H A P T E R 6
SUBSCRIPTION REVENUE GROWTH BY REVENUE BAND
Size matters in the Subscription Economy. The sub-index made up of $100M+ constituents has
been the highest performing since its inception in 2014. In contrast to start-ups, these larger companies
have more resources, more distribution, more new acquisitions, more channels to grow. As a result, they
benefit from the network effects mentioned earlier in this study.
For start-ups, the real challenges appear to lie after the initial sub-million dollar “honeymoon”
growth period. As seen in the figure, the $1M to $20M revenue band has the most challenging growth
rate. After the first product has been defined and initial funding has been
received, this is a time when most companies are defining the actual size of
their market, which can vary widely. According to McKinsey, only 28 per-
cent of Internet-services companies reach $100 million in revenue.
Over the last 6 months, the largest companies grew at an acceler-
ated rate compared to the prior 6 months, while smaller companies all saw
their growth rates decline slightly.
SEI sub-indices for company size, as given by Revenue Band. Each sub-index is launched starting from the value of the main SEI when
25 constituents are available. Note that the revenue band refers to the overall revenue of the constituent company, and not to the
specific products hosted on the Zuora platform. The sub-index made up of $100M+ constituents has been the highest performing
since its inception in 2014.
AVERAGE ANNUAL GROWTH: (L AST 12 MONTHS)
< $1M: 18%$1M-$20M: 18%$20M-$100M: 14%$100M+: 28%
100
120
140
160
180
200
220
240
260
280
300
Q1 2
012
Q2
2012
Q3
2012
Q4
2012
Q1 2
013
Q2
2013
Q3
2013
Q4
2013
Q1 2
014
Q2
2014
Q3
2014
Q4
2014
Q1 2
015
Q2
2015
Q3
2015
Q4
2015
Q1 2
016
Q2
2016
Q3
2016
Q4
2016
Q1 2
017
<$1M $1M-$20M $20M-$100M
$100+M SEI Main

T H E S U B S C R I P T I O N E C O N O M Y I N D E X
C H A P T E R 7
SUBSCRIPTION CHURN RATES BY BUSINESS MODEL AND INDUSTRY
At its most basic level, churn refers to the proportion of total subscribers who leave during
a given time period. Churn can result from any number of reasons: weak customer service, a poorly
upgraded product, a better offer from the competition, business failure, etc.
Comparison of average annualized churn rates from the SEI subindices for 2015-2017. A: Business Model Sub-Index. B: Industries Sub-
Index. C. Revenue Band Sub-Index. D. Region Sub-Index. Among the churns in each category, it is highest for B2C, media, $1M-$20M,
and EMEA. Churn has risen in most segments over the last 6 months, though it is only a return to historically normal levels from
unusually low churn in Q2-Q3 2016.
20%
22%
24%
26%
28%
30%
32%
34%
36%
38%
SEI Overall B2C B2B B2Any
A. Average Annual Churn Rates: Business Model
Overall Average Since Jan 2015 Q2-Q3 2016 Q4 2016-Q1 2017
20%
22%
24%
26%
28%
30%
32%
34%
36%
38%
40%
SEI Overall Corp. Services Telco SaaS Media
B. Average Annual Churn Rates: Industries
Overall Average Since Jan 2015 Q2-Q3 2016 Q4 2016-Q1 2017
20%
22%
24%
26%
28%
30%
32%
SEI Overall <$01M $1M-$20M $20M-$100M $100M+
C. Average Annual Churn Rates: Revenue Band
Overall Average Since Jan 2015 Q2-Q3 2016 Q4 2016-Q1 2017
20%
22%
24%
26%
28%
30%
32%
34%
36%
38%
SEI Overall EMEA NoAm
D. Average Annual Churn Rates: Region
Overall Average Since Jan 2015 Q2-Q3 2016 Q4 2016-Q1 2017

T H E S U B S C R I P T I O N E C O N O M Y I N D E X
C H A P T E R 7
In order for revenue to recur, customers must renew at a rate that outpaces churn, which can
effectively determine the size of a company. Therefore, reducing churn by investing in high-quality ser-
vices, sticky features, and customer success is fundamental to every subscription-based business strategy.
In addition, reducing churn rates is an imperative not only because of the initial lost revenue, but
because of cohort opportunity costs -- successful accounts grow larger over time. Unsurprisingly, churn
rates are higher for B2C and lower for B2B. Digital B2C companies (including media) have large numbers
of individual users who frequently churn due to payment challenges, credit card issues, lapsed interest or
competition. B2B companies (which in the SEI is weighted more heavily towards software) benefit as their
solutions become more embedded into stable, growing corporate accounts.
Average annual churn rates in the SEI are gen-
erally between 20 and 30 percent. Among the business
models, churn is highest for B2C and lowest for B2B
companies. For industries, churn is highest in media
and lowest in SaaS. Over the past six months, B2C
churn rates have lowered, while other verticals have
seen their churn rates edge up slightly.
CHURN RATES:(L AST 12 MONTHS)
B2B: 26%B2C: 35%B2A: 27%Corporate Services: 35%Telecommunications: 29%SaaS: 25%Media: 36%

T H E S U B S C R I P T I O N E C O N O M Y I N D E X
The Subscription Economy Index now includes EMEA and North America specific sub-indexes,
beginning in Q1 of 2017 with one year of history dating back to Q1 2016. In the last year EMEA and
North America indices grew almost exactly the same amount: around 22%. However, in North America
growth was faster in the first six months and cooled somewhat in the second 6 months. In EMEA, the
first 6 months were extremely slow, followed by a much faster period in which it caught up with North
America.
This acceleration in growth corresponded with generally higher growth rates across the Euro
zone, as evidenced by a rise in Euro area GDP growth rate over the same period.
The figure shows the relative growth in recurring revenue for the EMEA Sub-Index of the SEI (Blue) and the North America Sub-
index of the SEI (Orange), starting from a base value of 100 at the end of Q1 2016. In each quarter the index is increased by the same
percentage as the percentage growth in each region. North American growth started high and slowed somewhat over the course of
the year, while EMEA growth was initially slow but completely closed the gap in the second part of the year.
100
105
110
115
120
125
Q1 2016 Q2 2016 Q3 2016 Q4 2016 Q1 2017
Rel
ativ
e G
rowt
h In
dex
EMEA vs. NoAm, Last 12 Months
EMEA NoAm
C H A P T E R 8
GROWTH BY REGION: EMEA AND NORTH AMERICA

T H E S U B S C R I P T I O N E C O N O M Y I N D E X
C H A P T E R 9
EMEA SEI SUB-INDEX AND EURO AREA GDP GROWTH
In short, the Subscription Economy in Europe is clearly on the ascent. Over the past six months,
European subscription companies (a new SEI category) have caught up to their American counterparts’
growth rate of 22%. This is remarkable because European economic growth rates overall have lagged US
growth rates for much of the past decade.
Quarterly growth in the EMEA SEI Sub-Index (Blue Bars and left axis) and the Euro Area GDP (Gray Bars and Right Axis.) GDP Growth
was slow in early 2016 and accelerated in 2017, as did the growth in the EMEA SEI Sub-Index.
0.0%
0.5%
1.0%
1.5%
2.0%
2.5%
0%
10%
20%
30%
40%
50%
60%
Q2 2016 Q3 2016 Q4 2016 Q1 2017
EMEA SEI Sub-Index Growth and Euro Area GDP Growth
EMEA SEI Index Growth at Annualized Rate Euro Area GDP Growth Rate

T H E S U B S C R I P T I O N E C O N O M Y I N D E X
CONCLUSION
Recurring revenue-based businesses in the Subscription Economy are not guaranteed suc-
cess, but if they focus relentlessly on extending average customer lifetimes by maximize ARPA and net
account growth, while minimizing churn rates, they are more likely to achieve the same or faster growth
rates covered in this study. Future studies in this series will consider best practices in three core sub-
groups: B2B, B2C, and large enterprises undergoing digital transformation.
F O O T N O T E / S O U R C E S
S&P Dow Jones Indices
http://us.spindices.com/indices/equity/sp-500
Quarterly private nonresidential fixed investment (FRED)
https://fred.stlouisfed.org/series/PNFI
US Census Bureau, “Monthly Retail Trade and Food Services”
https://www.census.gov/econ/currentdata/dbsearch?program=MRTS&startYear=1992&end-
Year=2016&categories=44000&dataType=SM&geoLevel=US&adjusted=1¬Adjusted=1&sub-
mit=GET+DATA&releaseScheduleId=
McKinsey, “Grow Fast or Die Slow”
http://www.mckinsey.com/industries/high-tech/our-insights/grow-fast-or-die-slow
US GDP Growth
https://www.bea.gov/newsreleases/national/gdp/gdpnewsrelease.htm
Europe GDP Growth
http://www.tradingeconomics.com/euro-area/gdp-growth
The Subscription Economy Index (SEI) tracks the organic growth of subscription businesses by re-
flecting aggregated, anonymized, system-generated activity on the Zuora subscription management
service between January 1, 2012 and March 30, 2017. To measure average organic recurring revenue
growth, Zuora used a weighted average of system activity of over 365 constituents who had been live
on the Zuora platform for at least two years. Because the SEI growth rate is computed as a weighted
average, it reflects the typical growth rate of Zuora’s customers’ revenue, not the rate at which Zuo-
ra’s customer base is growing. Sub-indices of the SEI follow the same exclusions and must include a
minimum of 25 constituents.
© 2017 Zuora, Inc. All Rights Reserved. Zuora, Subscription Economy and Subscription Economy Index
are trademarks of Zuora, Inc. Third party trademarks mentioned above are owned by their respective
companies. Nothing in this report should be construed to the contrary, or as an approval, endorse-
ment or sponsorship by any third parties of Zuora or any aspect of this report. To learn more about
Zuora, please visit www.zuora.com.
Subscription Economy Index Methodology

T H E S U B S C R I P T I O N E C O N O M Y I N D E X
SUBSCRIPTION ECONOMY INDEX METHODOLOGY
IntroductionThe Subscription Economy Index (SEI) measures the growth
in the volume of business for subscription based products
and services. The SEI is based on anonymized, aggregated,
system-generated activity on the Zuora billing service,and is
intended to be indicative of the direction of the subscription
economy as a whole. The SEI includes not only the main index
but also set of explanatory metrics that provide insight into the
sources of growth (Growth Factors), as well as specialized indi-
ces focusing on particular business segments (Sub-Indices).
The index itself is an indicator that increases (or decreases) at
the same percentage rate as the average volume of activity
observed in tenants on the Zuora service. Such tenants are
known as constituents of the index, for reasons that will be
made clear below. Like many financial and economic indica-
tors, the precise value of the index is nominal and defined by
convention. In particular, the SEI is defined to have a value of
100 on the historical date January 1st, 2012. After that time,
each percentage change in the index corresponds to the same
percentage change in the activity volume of an average con-
stituent. So when the index climbed from 100 to 105, it means
that on average the constituents of the SEI had increased their
activity volume by 5% over that time. When the index later
climbs from 110 to 115, that corresponds to only 115/110 = 4.5%
growth.
The SEI as a Measure of Organic Growth
As will be described in detail below, the SEI is designed so
that it measures the organic growth of the constituents in the
index and not the growth in the number of constituents. At its
simplest, that means that the addition of constituents to the
SEI does not make it go up, in and of itself. Because the index
grows at a rate that is the weighted average of the growth rates
of the constituents, adding constituents to the SEI only dilutes
the weight assigned to all the other constituents. For that rea-
son, adding constituents only makes the index go up if the new
constituents growth rates are higher than the average growth
rate of the pre existing cohort. Similarly, when constituents
leave the SEI that does not necessarily cause the index to go
down. A constituents leaving the pool may be associated with
contraction in that constituent prior to departure if the tenant
leaves the Zuora service due to business failure at the owner
company, but that is not necessarily the case.
The SEI also removes the impact of non-organic growth in
the system activity. Non-organic growth, for these purposes,
means any increase in the activity in the Zuora service that is
not reflective of the changes in the underlying fundamentals
of the company owning the tenant in question. The most
common cases of non-organic changes in activity are account
migration from another billing system to the Zuora service and
voluntary decommisioning of a tenant by a company that was
using the billing service. In contrast, declines in activity result-
ing from business failure remain part of the index calculation.
These issues will be described in more detail below.
Criteria for Index Constituents Borrowing a term from stock market indices, a tenant on the
Zuora service that produces activity used for calculating the SEI
is referred to as an index constituent. Not every tenant on the
Zuora billing system will be an index constituent at any given
time. The criteria for inclusion is simply a minimum length
of time that a tenant must have been live on the Zuora billing
system: The main purpose of this minimum is removing the
effect of non-organic activity growth from the index calcula-
tion, as described above. Other considerations are removal
of seasonality, and ignoring high rates of activity growth from
insignificant base values. As described below, most companies
using the Zuora billing service become index constituents after
approximately two years live on the system. A total of 353
constituents met the criteria and were used to calculate the SEI
when it was first released in 2016.
Burn-In Period
In order to remove the effect of account migration from
other billing systems, a minimum burn in period of one year
is applied to every tenant on the Zuora billing system. That
means that the first year of system activity for a constituent is
simply ignored and never used as part of any calculation. The
one year burn-in period also removes whatever growth comes
immediately after a new company launch, when Zuora is the
original billing system for a new product. This is sensible
because high growth rates measuring growth from an insig-
nificant base level are usually not sustainable in the long run.
The burn-in period for a constituent may be longer than one
year whenever there is known or suspected to be significant
account migration from other systems even after this time.
Note however that Zuora does not have perfect information
about these events, and some migration of accounts from
another billing platform may not be excluded (however, any
extreme outliers will be removed as an outlier, as described
below.)

T H E S U B S C R I P T I O N E C O N O M Y I N D E X
Calculation Period
As will be described in more detail below, revenue for the SEI
is measured in a one year rolling window. The purpose of the
one year window is to remove the impact of seasonality. After
the burn-in period, the next year of system activity for a con-
stituent is used to establish the baseline for the measurement
of future growth. As a result, a typical tenant using the Zuora
service is first used as an index constituent when their one
quarter growth is calculated one year and 5 quarters after they
went live on Zuora system.
Removal of Index Constituents
Decommissioning of tenants and the causes are tracked in the
Zuora CRM system. System activity for a tenant is suspended
from the SEI calculation beginning in whatever quarter their
decommissioning is noted, and whenever the reason is other
than business failure. Business failure decommissionings are
allowed to remain in the SEI throughout the decommissioning
as this reflects organic contraction on the tenant activity, while
voluntarily decommissioning tenants are removed as that is a
case of non-organic change in the activity. Note that this may
fail to exclude migration of accounts from the Zuora system
that preceded the acknowledgement of decommissioning;
such migration off the Zuora system would appear as negative
growth and may influence the SEI calculation (however, any
extreme points will be removed as an outlier, as described
below.)
Post-Live Invoice Conversion
Usually the migration of accounts and invoices from another
billing system to Zuora occurs before or immediately after a
tenant goes live on the platform. Occasionally a company
converts accounts and invoices to the system at a later date.
Whenever such a conversion is known to occur, the corre-
sponding quarter(s) of system activity will be removed from
the SEI calculation for those companies. The data points for
those companies will be filled as necessary with the average
of the quarters before and after the conversion. Note that
Zuora does not always have complete information about these
events and it possible that some post-live revenue conversion
may go into the index calculation and would appear as growth
(however, any extreme points will be removed as an outlier, as
described below.)
Multi-Tenant and Multi-Entity
In cases where a single parent company operates either
multiple entities or multiple tenants in the Zuora system, the
system activity for each entity or tenant is treated as if it were a
separate constituent for purposes of SEI calculations includ-
ing burn-in, calculation and churn. A separate tenant is the
specific case of multiple entities operating with fully separate
product catalogues, databases etc. The base date for begin-
ning the burn in period on a tenant or child entity is the later
of the customer go-live date and the earliest date for which
system activity for the tenant or entity is first processed.
Calculating Constituent Growth Once a tenant on the Zuora service becomes an index con-
stituent its activity is calculated every quarter with a one year
rolling window. Many subscription businesses’ activity are sub-
ject to seasonality, although the precise nature of the seasonal
effect varies significantly. Using a one year window for SEI
calculations removes the effect of seasonality. This means that
if the SEI increases (or decreases) over any quarter it is because
that quarter was better (or worse) than the same quarter one
year prior; not the quarter immediately preceding it.
The activity measure for SEI calculation is the one year prior
total of Invoice Item amounts generated from recurring and
usage Rate Plan Charge objects in the Zuora object model
database . One time charges are excluded from the calcula-
tion, as the SEI is intended to reflect the growth in recurring
activity. Whether Invoice Items are for recurring, usage or one
time activity is given by the Rate Plan Charge object linked to
the Invoice Items in the model. Note also that any activity a
constituent makes that is outside the Zuora system is ignored
by the SEI calculation. A consequence of this is that in cases
where a division of a large corporation uses Zuora for a single
product line then that constituent is treated as if it were a small
company, independent of the larger organization.
Once the activity of a tenant in the SEI has been calculated,
the growth calculation for the SEI is the quarterly change in
the one year trailing activity expressed as a percentage. That
is, the quarterly growth for a constituent is calculated as:
where AQ represents the one year trailing activity ending with
the quarter denoted Q and, and AQ-1 is the same but for the
year ending with the prior quarter.
S U B S C R I P T I O N E C O N O M Y I N D E X M E T H O D O L O G Y
1 See https: //www.zuora.com/wp-content/uploads/2016/10/ZuoraERD-compressor-1.jpeg

T H E S U B S C R I P T I O N E C O N O M Y I N D E X
S U B S C R I P T I O N E C O N O M Y I N D E X M E T H O D O L O G Y
Average Growth and Updating the IndexThe increase/decrease of the SEI over any period in time is the
average of the growth in activity for constituents who make up
the SEI at that time. However, the average growth used is not
the simple average (or mean) – rather it is amount weighted
average, subject to certain constraints.
Outlier RemovalThe first step taken in calculating the average is to remove
outliers, those constituents in the SEI having the largest
increases or decreases in activity for each quarter. Outliers
are defined as the top and bottom 5% of companies in the SEI.
The actual number to remove is rounded up to the nearest
whole number, so for example if there were 100 constitu-
ents in the index then the top and bottom 5 companies are
removed, but if there are 101 in the index then the top and
bottom 6 companies would be removed. Removing outliers
serves two purposes: First, the movement of the SEI is meant
to represent what happens to typical constituents in the SEI.
However, averages can be unduly influenced by the presence
of very large values. Also, as noted above, the SEI calcula-
tion does not contain perfect information about non-organic
changes in activity (e.g. conversions, decommissioning of ten-
ants, etc.) Removing outliers helps to insure that even if such
companies’ system activity remains in the SEI and do in fact
do have extreme changes in their activity, then those changes
will not influence the index.
Weighting by Volume of ActivityIn addition to reflecting what happens to a “typical” constit-
uent, the SEI is meant to reflect the amount of growth in the
overall Subscription Economy outside of the Zuora service and
the opportunities that are available to creators of and inves-
tors in Subscription Economy companies. For this reason,
the weighted average used in the SEI growth calculation is
weighted by the total amount of activity each tenant has, so
that companies with higher activity take more weight in the
average. (Note the weighting is by the baseline amount of
activity for each constituent, but not the growth in activity that
is being averaged.) This is similar to the way that stock market
indices are weighted by the market capitalization of their
constituents and for the same reason: the indices are meant
to represent the overall size of the market and the opportunity
available to investors, so it is weighted more towards larger
entities.
However, complete reliance on amount weighting may fail to
reflect what is typical if a few very large constituents dominate
the activity measured by the SEI. For this reason the weight of
any single constituent in the weighted average is limited to 5%
of the total. In case any constituent would take more than 5%
of the average weight in the SEI (or an SEI sub-index) based on
their total amount of activity, then that weight is capped at 5%
and the remaining weight is distributed proportionally to the
other constituents in the pool; the process is iterated until all
constituent weights are at or below 5%.
Minimum Number of ConstituentsTaken together, the outlier removal and weighting method
determine the minimum number of constituents for calcu-
lating the SEI or any sub-index of the SEI (for which the same
rules apply.) Capping weights at 5% implies there must be no
less than twenty constituents. However, the twenty con-
stituents must be available after outlier rejection, described
above. The number of constituents to remove for the top
and bottom 5 percentiles is rounded up to the nearest whole
number, so that for more than twenty constituents the two
highest and two lowest activity growth numbers are removed
from the average. This means the minimum possible number
of constituents to calculate the SEI or one of its sub-indices
according to these rules is twenty four, and the SEI uses a
minimum of twenty five for simplicity.
Index UpdateGiven the growth of all constituents over the prior quarter and
the weights to use in the average, the average growth is simply
the sum of all the constituents’ growth rates multiplied by their
weight (note that all the weights add up to one, so this is a
proper weighted average.) One plus the average growth rate
is then multiplied by the prior index level to arrive at the new
index level. That is,
SEIQ = SEIQ-1 × (1+ GQ )
where SEIQ is the new index level, SEIQ-1 is the index level
after the last quarterly update, and GQ is the average constitu-
ent growth over the most recent quarter.
Growth FactorsThe SEI measures the amount of growth in the Subscription
Economy, but a single indicator does not give insight into
what is driving it. A related set of metrics help to explain the
sources of that growth. These metrics are called the Growth
Factors of the SEI. Like the percentage change in activity used
in the SEI calculation, the Growth Factors are averages of per-
centage changes in other activity based measurements. Unlike
the SEI, the Growth Factors are not used to update an index
– they are simply provided as explanatory information each
quarter. The growth factors use a simple two step decompo-
sition to explain why the SEI went up (or down) in any given
quarter.

T H E S U B S C R I P T I O N E C O N O M Y I N D E X
S U B S C R I P T I O N E C O N O M Y I N D E X M E T H O D O L O G Y
ARPA and Net Account Growth
If the total amount of a company’s activity go up that means
at least one of two things must have happened: Either the
number of accounts generating the activity went up, or the
amount of activity for existing accounts went up. The total of
Invoice Item amounts is analogous to the accounting measure
of revenue, so it is referred to using the accounting term
Average Revenue Per Account or ARPA. This is the first level of
the SEI Growth Factor decomposition: overall activity growth
is decomposed into growth in ARPA and growth in the number
of accounts. The latter is referred to as Net Account Growth,
to distinguish it from specifically new (added) accounts.
Changes in ARPA are closely related to upsells and downsells:
If ARPA is growing, then upsells and price increase must be
outweighing downsells and discounts.
To calculate the growth factors for ARPA and Net Account
growth, the number of accounts with activity in the past year
is measured on each quarter end date for all the constituents.
ARPA is calculated simply as annual activity divided by the
number of accounts. Next, the quarterly percent changes in
ARPA and the number of accounts is calculated for all constit-
uents (similar to the calculation for quarterly percent change in
overall annual activity, described above.) Finally, the averages
of ARPA growth and Net Account Growth are calculated using
the same weights as the SEI (overall activity weighting, subject
to constraint.) These averages are the Growth Factors for
ARPA and Net Account Growth. When combined with the SEI
change for any time period, these show whether SEI growth
(or declines) was driven by increases/decreases in activity
on existing accounts or by changes in the overall number of
accounts, or both.
Note that for a single tenant in the SEI the following relation-
ship holds exactly:
(1 + GQ)=(1+GQARPA)×(1+GQ
#of Accounts)
where G indicates the percentage growth of the measurement
indicated for some quarter. Also, for low levels of growth it is
approximately true that:
G Q≈G QARPA++G Q
#of Accoun t s
Meaning, when the growth is small the total growth is close
to the sum of the two components. However, the SEI growth
factors are averages over many constituents and the multi-
plicative relationship shown above will only be approximately
correct. This is because an average of a product of two sets of
measurements is not the same as the product of the averages
of the same two sets of measurements – the relationship is
nonlinear. The additive relationship is even less accurate for
the Growth Factors, as it involves one more level of approxi-
mation. So the growth of the SEI is not simply the sum of the
ARPA and Net Account Growth Factors, though it will often be
close. And comparing these two Growth Factors still gives a
powerful explanation into what caused the SEI to grow in any
given quarter.
Account Growth and Churn
The net change in the number of accounts can be further
decomposed into two components: addition of new accounts,
and loss or churn of existing accounts. These additional
growth factors provide insight into what is driving net changes
in the number of accounts. This extra level of decomposition is
important because new account additions and losses to churn
are driven by two different processes: New additions are the
result of marketing and sales efforts; while churns are driven
by satisfaction/dissatisfaction of the existing customer base.
Companies calculate growth and churn of accounts in many
different ways. The SEI growth factors use a simple calculation
that makes results comparable across the wide variety of com-
panies in the SEI, and is consistent with the calculation of the
SEI main index and the other Growth Factors. The definition
are as follows:
1. New account additions are defined as any account that
had activity in the last quarter, but had no activity the prior
year (the prior four quarters.)
2. The Account Growth rate is defined as the number of
new accounts added in a quarter divided by the number
of accounts at the start of the quarter.
3. Churns are defined as an account that has had no activity
in the last year (4 quarters), but last had activity in the
quarter prior to that. To explain churn another way,
suppose an account had activity in Q2 some year; if Q2 of
the next year passes and the account has not had activity
again at all in that year, then the account is considered a
churn at in Q3 (up to one year and one quarter after the
last activity.)
4. The churn rate is defined as the number of churns in a
quarter divided by the number of accounts at the start of
the quarter.
Many companies use different definitions for these met-
rics, and those choices are often made based on the typical
customer lifespan, re-signup behavior etc. Naturally, any
definition applied to a diverse pool of companies will not be
perfectly suited to every type of tenant in the zuora service.
The SEI definitions were chosen to remove the effects of sea-
sonality and for consistency with the annual activity calcula-
tions used by the SEI.

T H E S U B S C R I P T I O N E C O N O M Y I N D E X
S U B S C R I P T I O N E C O N O M Y I N D E X M E T H O D O L O G Y
Relationship to Revenue based Retention Many subscription companies report revenue based retention
and churn, and it is also common to include the impact of
upsells in this metric. This is useful because this one metric
captures much about the health of the existing customer base.
To calculate an amount that is analogous to revenue based
retention including upsells from the SEI Growth Factors start
by noting that account based retention is simply 100% minus
account based churn. So the SEI analog to revenue based
retention including upsells is calculated by multiplying the
account based retention by one plus ARPA growth. That is:
R= (1 .0-C ) x (1+G ARPA)
where C is the churn rate and G ARPA is the ARPA growth rate
as described above.
Sub-Indices
In addition to providing insight about the direction of the
Subscription Economy overall, it is useful to know about the
differences between various categories of companies. To
support this, the SEI method is also applied to specific subsets
of the constituents l. Borrowing terminology from stock
market indices these constituent groups and their associated
measurements are known as sub-indices. Once the classifying
criteria for a sub-index are defined, the same methodology is
applied to that pool of constituents as is used for the main SEI.
The only requirement for creating an SEI sub-index is that the
category must have to the minimum number of 25 constitu-
ents, as described above.
A variety of classifications are used to define sub-indices.
Examples include the Business Model, Industry, Vertical, and
Revenue Band. Additional classifications may be applied in the
future, or combinations of classifications. These classifications
are provided by the data vendor Inside View and applied to the
billings system measurements via Zuora’s CRM system.