the study of an assessment of land use security in mining area——a case study of wu’an in china
TRANSCRIPT
Procedia Engineering 26 (2011) 311 – 320
1877-7058 © 2011 Published by Elsevier Ltd.doi:10.1016/j.proeng.2011.11.2173
Available online at www.sciencedirect.com
Procedia Engineering
Procedia Engineering 00 (2011) 000–000
www.elsevier.com/locate/procedia
First International Symposium on Mine Safety Science and Engineering
The Study of An Assessment of Land Use Security in Mining Area——A case study of Wu’an in China
Zeng Leia, Zeng Huib, aaManagement College of Hebei University, Baoding,Hebei, 071002, China
*
bBeijing China Women's University,Beijing, 1001011, China
Abstract
On the basis of identifying the components which affected the security pattern in mining area, this study developed a conceptual framework of assessment index system of land use security pattern in mining area, “pressure - state -response” model (PSR). This article constructed an assessment index system which including the target layer, the system layer, the factors layer, and the index layer. A scientific assessment of the land use security status in mining area of Wu’an was made by selecting Wu'an of Hebei province as example in order to provide proof for the optimization, restoration and conformity of land use pattern.© 2011 Published by Elsevier Ltd. Selection and/or peer-review under responsibility of China Academy of Safety Science and Technology, China University of Mining and Technology(Beijing), McGill University and University of Wollongong.Keywords: Mining area; Assessment of land use security; Index system; Wu’An in China
1. Introduction
The ecological security of the mining area is the cornerstone of national security; and an important guarantee for the whole country as well as the people's livelihood. Generally, in a certain land use security in mining area means that in a certain period and space scale, the ecosystem which combines nature, economy and society, in the provision of providing energy and power, the land resource also maintain its organizational structure, it is still able to achieve its normal service function and its function as carrier. At the same time, it can achieve self-recovery under certain threat and pressure from a variety of human social and economic activities. The scientific assessment of the security status for land use in mining area is the premise and foundation for the optimization of land use pattern in mining area. This studydeveloped the conceptual framework of assessment index system, and then constructed the security
* Zeng lei. Tel.: 15831209898; fax: 0312-3108856.E-mail address: [email protected]
312 Zeng Lei and Zeng Hui / Procedia Engineering 26 (2011) 311 – 3202 Zeng Lei,Zeng hui/Procedia Engineering 00 (2011) 000–000
assessment index system of land use security in mining area, this research made an empirical study by selecting Wu'an, a mining city of Hebei Province as example.
2. Construction of Assessment Index System of Land Use Security in Mining Area
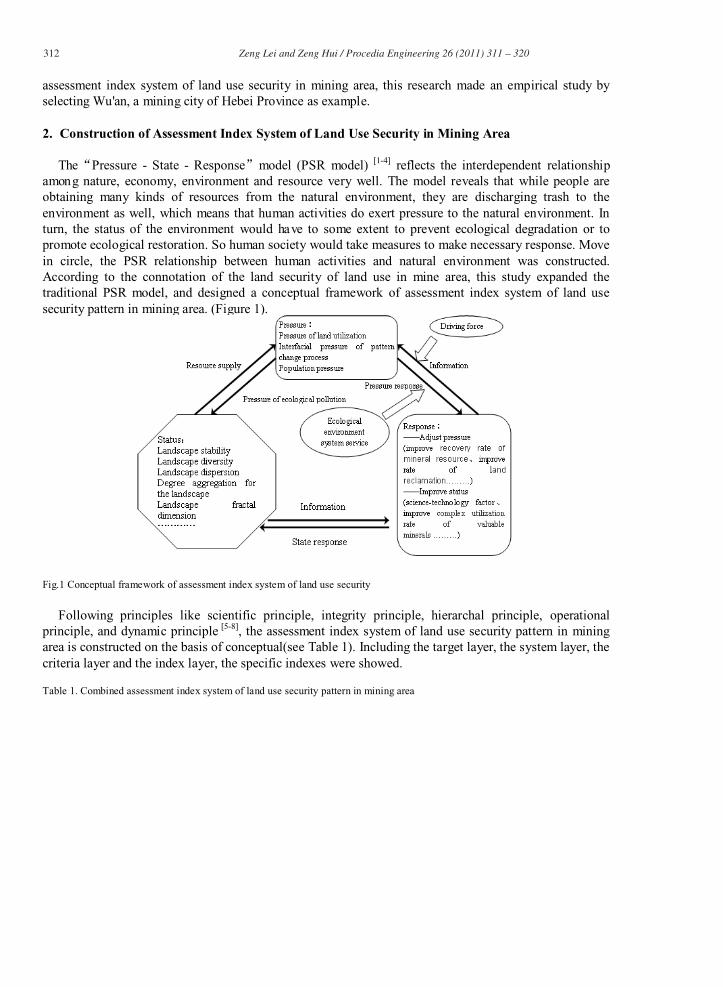
The“Pressure - State - Response”model (PSR model) [1-4] reflects the interdependent relationship among nature, economy, environment and resource very well. The model reveals that while people are obtaining many kinds of resources from the natural environment, they are discharging trash to the environment as well, which means that human activities do exert pressure to the natural environment. In turn, the status of the environment would have to some extent to prevent ecological degradation or to promote ecological restoration. So human society would take measures to make necessary response. Move in circle, the PSR relationship between human activities and natural environment was constructed.According to the connotation of the land security of land use in mine area, this study expanded the traditional PSR model, and designed a conceptual framework of assessment index system of land use security pattern in mining area. (Figure 1).
Fig.1 Conceptual framework of assessment index system of land use security
Following principles like scientific principle, integrity principle, hierarchal principle, operational principle, and dynamic principle [5-8], the assessment index system of land use security pattern in mining area is constructed on the basis of conceptual(see Table 1). Including the target layer, the system layer, the criteria layer and the index layer, the specific indexes were showed.
Table 1. Combined assessment index system of land use security pattern in mining area
313Zeng Lei and Zeng Hui / Procedia Engineering 26 (2011) 311 – 320Zeng Lei,Zeng hui / Procedia Engineering 00 (2011) 000–000 3
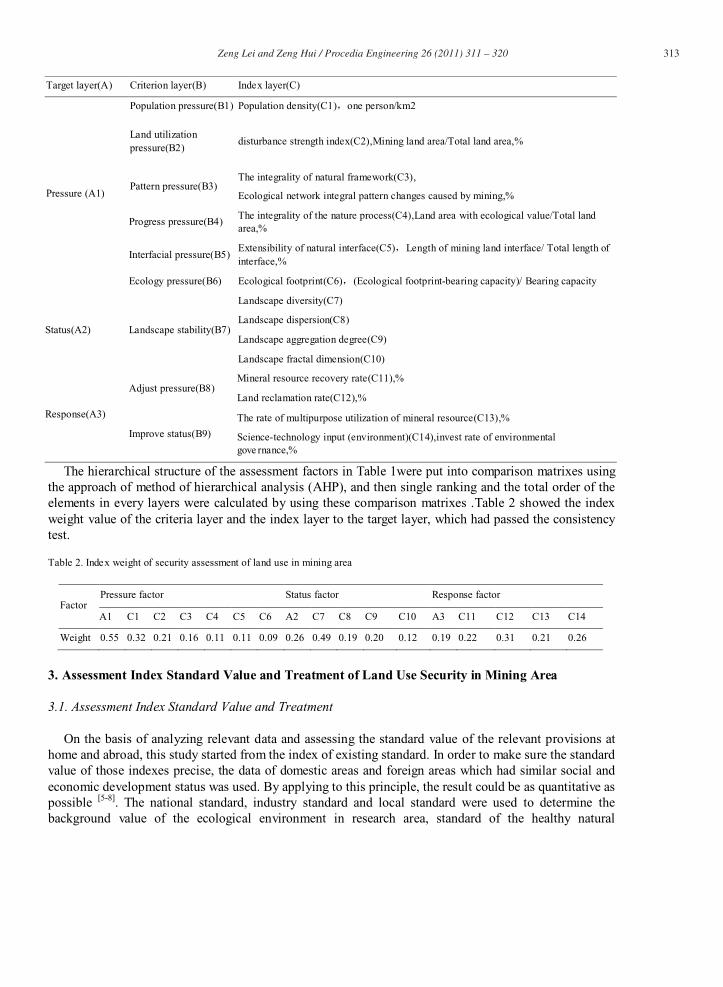
Target layer(A) Criterion layer(B) Index layer(C)
Pressure (A1)
Population pressure(B1) Population density(C1),one person/km2
Land utilization pressure(B2)
disturbance strength index(C2),Mining land area/Total land area,%
Pattern pressure(B3)The integrality of natural framework(C3),
Ecological network integral pattern changes caused by mining,%
Progress pressure(B4)The integrality of the nature process(C4),Land area with ecological value/Total land area,%
Interfacial pressure(B5)Extensibility of natural interface(C5),Length of mining land interface/ Total length of interface,%
Ecology pressure(B6) Ecological footprint(C6),(Ecological footprint-bearing capacity)/ Bearing capacity
Status(A2) Landscape stability(B7)
Landscape diversity(C7)
Landscape dispersion(C8)
Landscape aggregation degree(C9)
Landscape fractal dimension(C10)
Response(A3)
Adjust pressure(B8)Mineral resource recovery rate(C11),%
Land reclamation rate(C12),%
Improve status(B9)
The rate of multipurpose utilization of mineral resource(C13),%
Science-technology input (environment)(C14),invest rate of environmental gove rnance,%
The hierarchical structure of the assessment factors in Table 1were put into comparison matrixes using the approach of method of hierarchical analysis (AHP), and then single ranking and the total order of the elements in every layers were calculated by using these comparison matrixes .Table 2 showed the index weight value of the criteria layer and the index layer to the target layer, which had passed the consistency test.
Table 2. Index weight of security assessment of land use in mining area
FactorPressure factor Status factor Response factor
A1 C1 C2 C3 C4 C5 C6 A2 C7 C8 C9 C10 A3 C11 C12 C13 C14
Weight 0.55 0.32 0.21 0.16 0.11 0.11 0.09 0.26 0.49 0.19 0.20 0.12 0.19 0.22 0.31 0.21 0.26
3. Assessment Index Standard Value and Treatment of Land Use Security in Mining Area
3.1. Assessment Index Standard Value and Treatment
On the basis of analyzing relevant data and assessing the standard value of the relevant provisions at home and abroad, this study started from the index of existing standard. In order to make sure the standard value of those indexes precise, the data of domestic areas and foreign areas which had similar social and economic development status was used. By applying to this principle, the result could be as quantitative as possible [5-8]. The national standard, industry standard and local standard were used to determine the background value of the ecological environment in research area, standard of the healthy natural
314 Zeng Lei and Zeng Hui / Procedia Engineering 26 (2011) 311 – 3204 Zeng Lei,Zeng hui/Procedia Engineering 00 (2011) 000–000
ecosystem under similar natural conditions, and standard of ecological security according to scientific research under similar conditions.
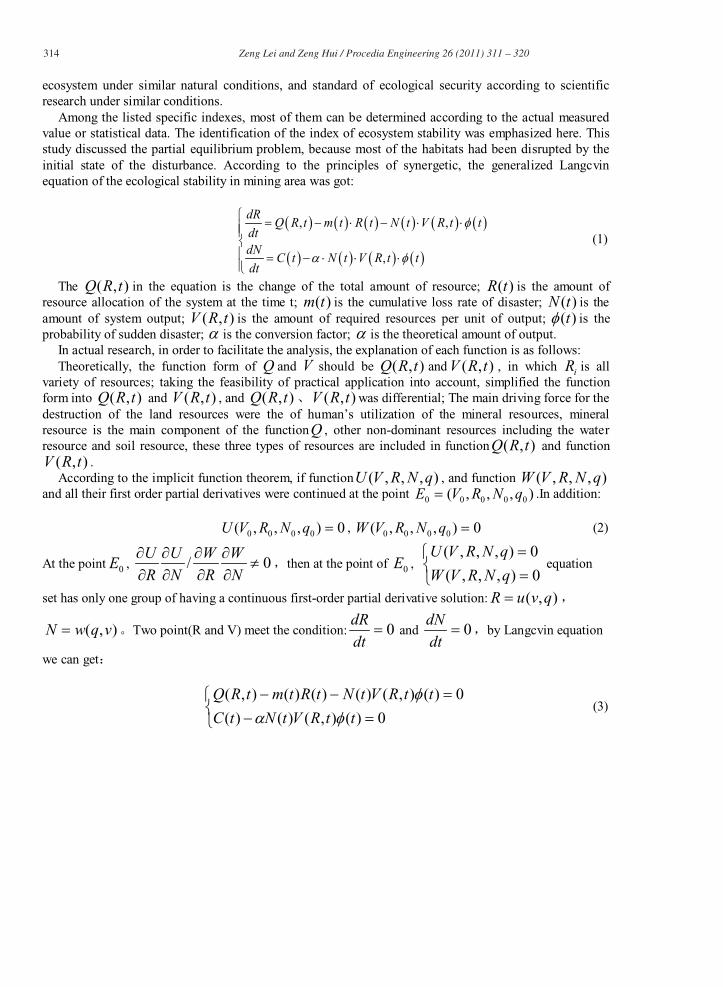
Among the listed specific indexes, most of them can be determined according to the actual measured value or statistical data. The identification of the index of ecosystem stability was emphasized here. This study discussed the partial equilibrium problem, because most of the habitats had been disrupted by the initial state of the disturbance. According to the principles of synergetic, the generalized Langcvin equation of the ecological stability in mining area was got:
( ) ( ) ( ) ( ) ( ) ( )
( ) ( ) ( ) ( )
, ,
,
dRQ R t m t R t N t V R t t
dtdN
C t N t V R t tdt
φ
α φ
= − ⋅ − ⋅ ⋅ = − ⋅ ⋅ ⋅
(1)
The ),( tRQ in the equation is the change of the total amount of resource; )(tR is the amount of resource allocation of the system at the time t; )(tm is the cumulative loss rate of disaster; )(tN is theamount of system output; ),( tRV is the amount of required resources per unit of output; )(tφ is theprobability of sudden disaster; α is the conversion factor; α is the theoretical amount of output.
In actual research, in order to facilitate the analysis, the explanation of each function is as follows:Theoretically, the function form of Q and V should be ),( tRQ and ),( tRV , in which iR is all
variety of resources; taking the feasibility of practical application into account, simplified the function form into ),( tRQ and ),( tRV , and ),( tRQ 、 ),( tRV was differential; The main driving force for the destruction of the land resources were the of human’s utilization of the mineral resources, mineral resource is the main component of the functionQ , other non-dominant resources including the water resource and soil resource, these three types of resources are included in function ),( tRQ and function
),( tRV .According to the implicit function theorem, if function ),,,( qNRVU , and function ),,,( qNRVW
and all their first order partial derivatives were continued at the point ),,,( 00000 qNRVE = .In addition:
0),,,( 0000 =qNRVU , 0),,,( 0000 =qNRVW (2)
At the point 0E , 0/ ≠∂∂
∂∂
∂∂
∂∂
NW
RW
NU
RU
,then at the point of 0E ,
==
0),,,(
0),,,(
qNRVW
qNRVUequation
set has only one group of having a continuous first-order partial derivative solution: ),( qvuR = ,
),( vqwN = 。Two point(R and V) meet the condition: 0=dtdR
and 0=dtdN
,by Langcvin equation
we can get:
=−=−−
0)(),()()(
0)(),()()()(),(
ttRVtNtC
ttRVtNtRtmtRQ
φαφ
(3)
315Zeng Lei and Zeng Hui / Procedia Engineering 26 (2011) 311 – 320Zeng Lei,Zeng hui / Procedia Engineering 00 (2011) 000–000 5
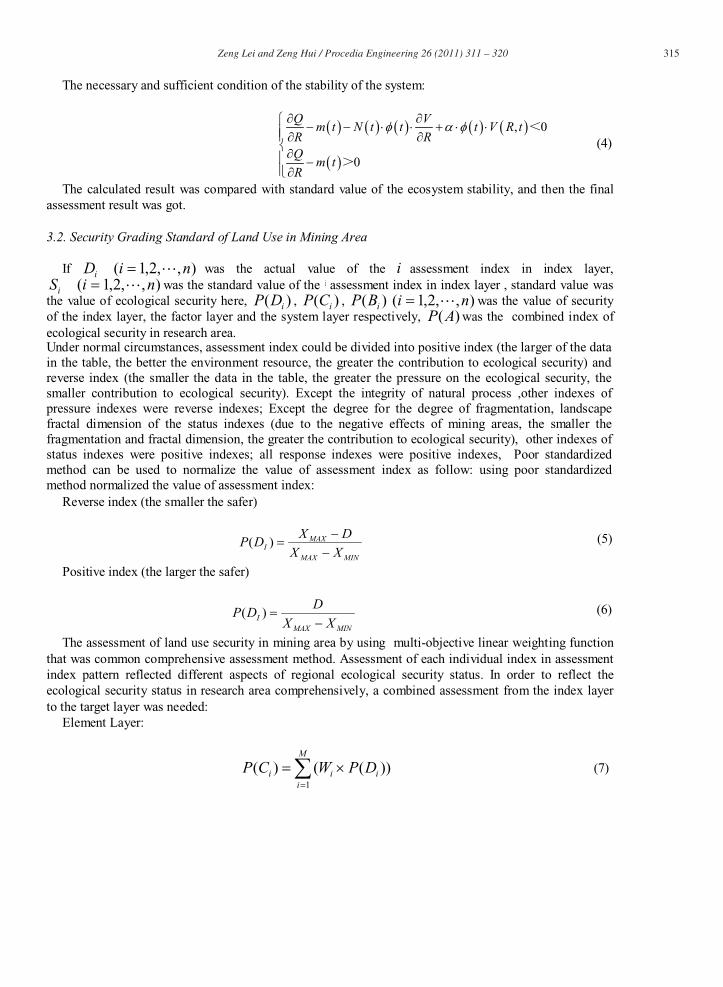
The necessary and sufficient condition of the stability of the system:
( ) ( ) ( ) ( ) ( )
( )
, 0
0
Q Vm t N t t t V R t
R RQ
m tR
φ α φ∂ ∂ − − ⋅ ⋅ + ⋅ ⋅ ∂ ∂∂ −∂
<
>
(4)
The calculated result was compared with standard value of the ecosystem stability, and then the final assessment result was got.
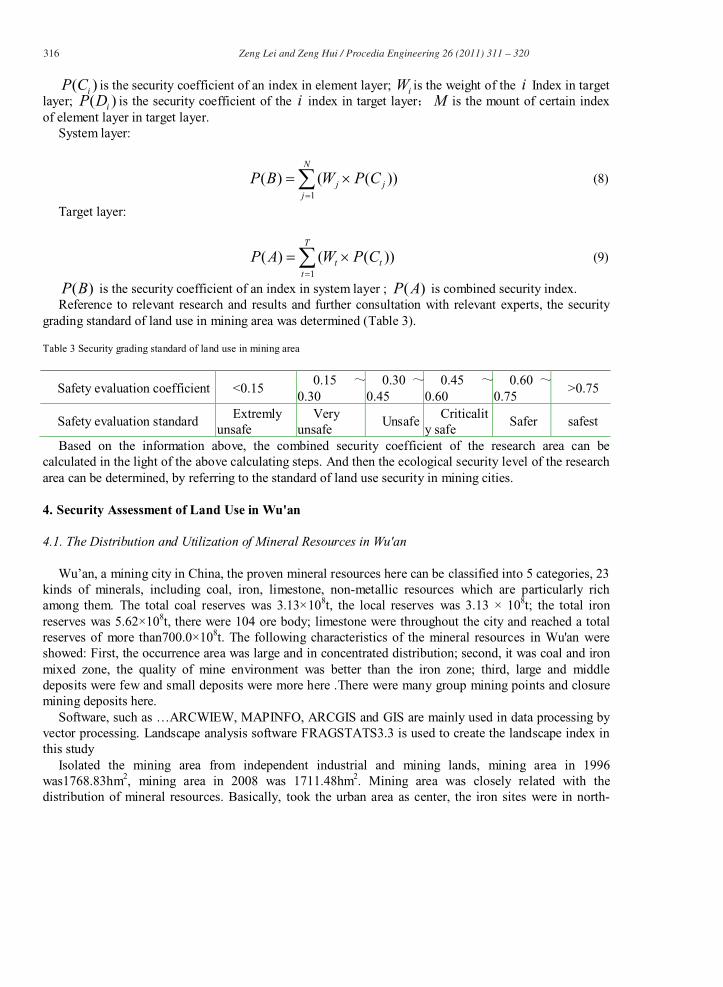
3.2. Security Grading Standard of Land Use in Mining Area
If ),,2,1( niDi = was the actual value of the i assessment index in index layer, ),,2,1( niSi = was the standard value of the i assessment index in index layer , standard value was
the value of ecological security here, )( iDP , )( iCP , )( iBP ),,2,1( ni = was the value of security of the index layer, the factor layer and the system layer respectively, )(AP was the combined index of ecological security in research area.Under normal circumstances, assessment index could be divided into positive index (the larger of the data in the table, the better the environment resource, the greater the contribution to ecological security) and reverse index (the smaller the data in the table, the greater the pressure on the ecological security, the smaller contribution to ecological security). Except the integrity of natural process ,other indexes of pressure indexes were reverse indexes; Except the degree for the degree of fragmentation, landscape fractal dimension of the status indexes (due to the negative effects of mining areas, the smaller the fragmentation and fractal dimension, the greater the contribution to ecological security), other indexes of status indexes were positive indexes; all response indexes were positive indexes, Poor standardized method can be used to normalize the value of assessment index as follow: using poor standardized method normalized the value of assessment index:
Reverse index (the smaller the safer)
MINMAX
MAXI XX
DXDP
−−
=)( (5)
Positive index (the larger the safer)
MINMAX
I XX
DDP
−=)( (6)
The assessment of land use security in mining area by using multi-objective linear weighting function that was common comprehensive assessment method. Assessment of each individual index in assessment index pattern reflected different aspects of regional ecological security status. In order to reflect the ecological security status in research area comprehensively, a combined assessment from the index layer to the target layer was needed:
Element Layer:
∑=
×=M
iiii DPWCP
1
))(()( (7)
316 Zeng Lei and Zeng Hui / Procedia Engineering 26 (2011) 311 – 3206 Zeng Lei,Zeng hui/Procedia Engineering 00 (2011) 000–000
)( iCP is the security coefficient of an index in element layer; iW is the weight of the i Index in target layer; )( iDP is the security coefficient of the i index in target layer; M is the mount of certain index of element layer in target layer.
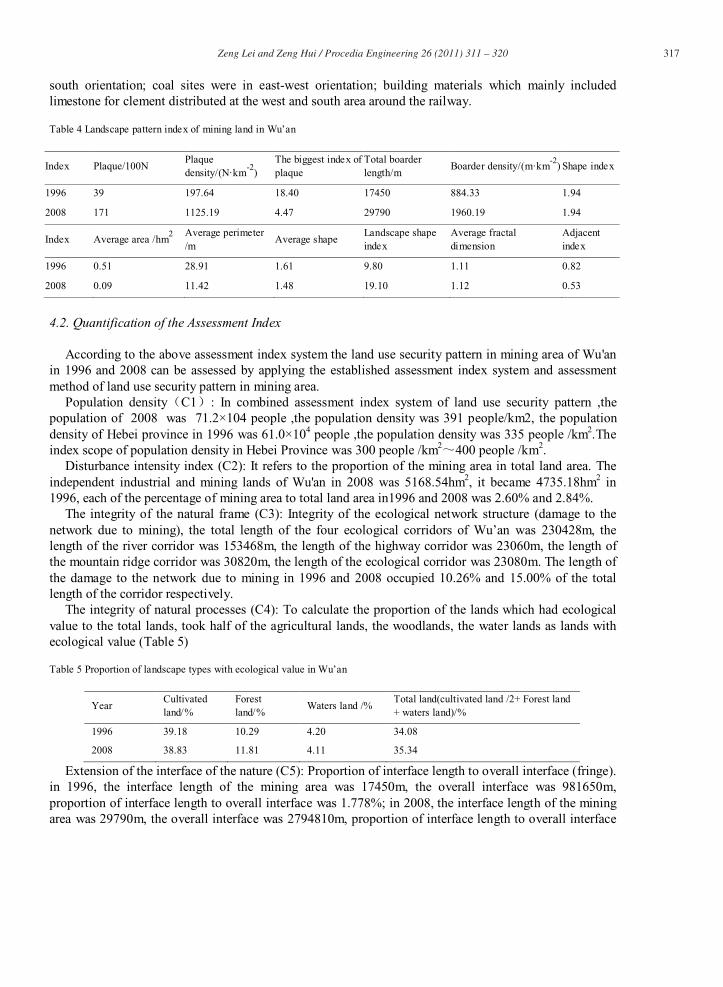
System layer:
∑=
×=N
jjj CPWBP
1
))(()( (8)
Target layer:
∑=
×=T
ttt CPWAP
1
))(()( (9)
)(BP is the security coefficient of an index in system layer ; )(AP is combined security index.Reference to relevant research and results and further consultation with relevant experts, the security
grading standard of land use in mining area was determined (Table 3).
Table 3 Security grading standard of land use in mining area
Safety evaluation coefficient <0.150.15 ~
0.300.30 ~
0.450.45 ~
0.600.60 ~
0.75>0.75
Safety evaluation standardExtremly
unsafeVery
unsafeUnsafe
Criticality safe
Safer safest
Based on the information above, the combined security coefficient of the research area can be calculated in the light of the above calculating steps. And then the ecological security level of the research area can be determined, by referring to the standard of land use security in mining cities.
4. Security Assessment of Land Use in Wu'an
4.1. The Distribution and Utilization of Mineral Resources in Wu'an
Wu’an, a mining city in China, the proven mineral resources here can be classified into 5 categories, 23 kinds of minerals, including coal, iron, limestone, non-metallic resources which are particularly rich among them. The total coal reserves was 3.13×10⁸t, the local reserves was 3.13 × 10⁸t; the total iron reserves was 5.62×10⁸t, there were 104 ore body; limestone were throughout the city and reached a total reserves of more than700.0×108t. The following characteristics of the mineral resources in Wu'an were showed: First, the occurrence area was large and in concentrated distribution; second, it was coal and iron mixed zone, the quality of mine environment was better than the iron zone; third, large and middle deposits were few and small deposits were more here .There were many group mining points and closure mining deposits here.
Software, such as …ARCWIEW, MAPINFO, ARCGIS and GIS are mainly used in data processing byvector processing. Landscape analysis software FRAGSTATS3.3 is used to create the landscape index in this study
Isolated the mining area from independent industrial and mining lands, mining area in 1996 was1768.83hm2, mining area in 2008 was 1711.48hm2. Mining area was closely related with the distribution of mineral resources. Basically, took the urban area as center, the iron sites were in north-
317Zeng Lei and Zeng Hui / Procedia Engineering 26 (2011) 311 – 320Zeng Lei,Zeng hui / Procedia Engineering 00 (2011) 000–000 7
south orientation; coal sites were in east-west orientation; building materials which mainly included limestone for clement distributed at the west and south area around the railway.
Table 4 Landscape pattern index of mining land in Wu’an
Index Plaque/100NPlaque density/(N·km
-2)
The biggest index of plaque
Total boarder length/m
Boarder density/(m·km-2
) Shape index
1996 39 197.64 18.40 17450 884.33 1.94
2008 171 1125.19 4.47 29790 1960.19 1.94
Index Average area /hm2 Average perimeter
/mAverage shape
Landscape shape index
Average fractal dimension
Adjacent index
1996 0.51 28.91 1.61 9.80 1.11 0.82
2008 0.09 11.42 1.48 19.10 1.12 0.53
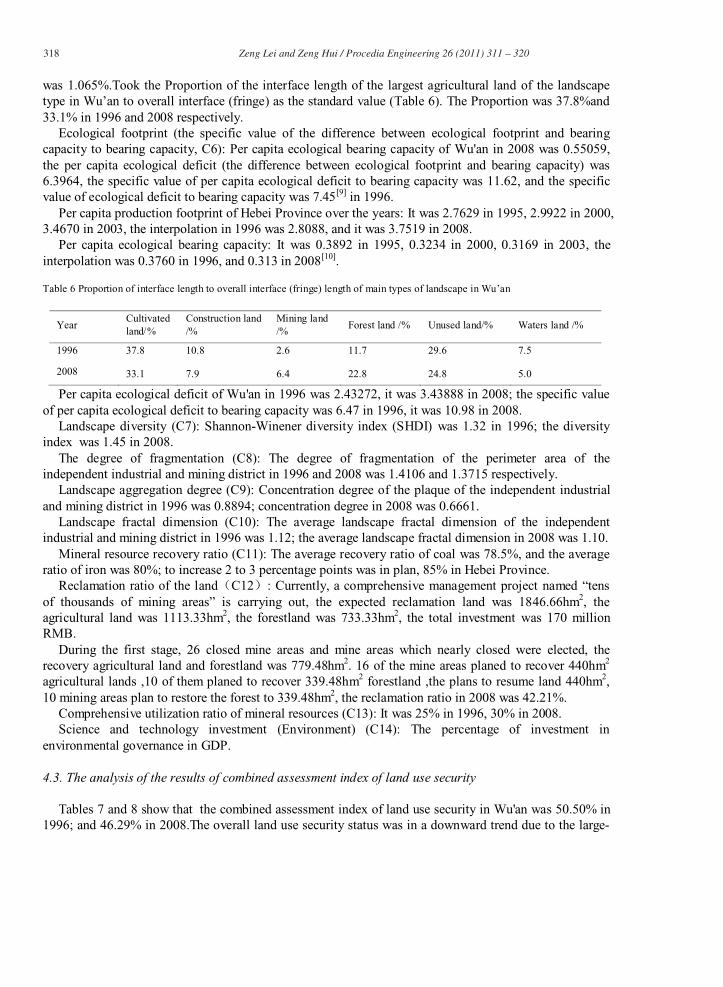
4.2. Quantification of the Assessment Index
According to the above assessment index system the land use security pattern in mining area of Wu'an in 1996 and 2008 can be assessed by applying the established assessment index system and assessment method of land use security pattern in mining area.
Population density(C1): In combined assessment index system of land use security pattern ,the population of 2008 was 71.2×10⁴ people ,the population density was 391 people/km2, the population density of Hebei province in 1996 was 61.0×10⁴ people ,the population density was 335 people /km2.Theindex scope of population density in Hebei Province was 300 people /km2~400 people /km2.
Disturbance intensity index (C2): It refers to the proportion of the mining area in total land area. The independent industrial and mining lands of Wu'an in 2008 was 5168.54hm2, it became 4735.18hm2 in 1996, each of the percentage of mining area to total land area in1996 and 2008 was 2.60% and 2.84%.
The integrity of the natural frame (C3): Integrity of the ecological network structure (damage to the network due to mining), the total length of the four ecological corridors of Wu’an was 230428m, the length of the river corridor was 153468m, the length of the highway corridor was 23060m, the length of the mountain ridge corridor was 30820m, the length of the ecological corridor was 23080m. The length of the damage to the network due to mining in 1996 and 2008 occupied 10.26% and 15.00% of the total length of the corridor respectively.
The integrity of natural processes (C4): To calculate the proportion of the lands which had ecological value to the total lands, took half of the agricultural lands, the woodlands, the water lands as lands with ecological value (Table 5)
Table 5 Proportion of landscape types with ecological value in Wu’an
YearCultivated land/%
Forest land/%
Waters land /%Total land(cultivated land /2+ Forest land + waters land)/%
1996 39.18 10.29 4.20 34.08
2008 38.83 11.81 4.11 35.34
Extension of the interface of the nature (C5): Proportion of interface length to overall interface (fringe). in 1996, the interface length of the mining area was 17450m, the overall interface was 981650m, proportion of interface length to overall interface was 1.778%; in 2008, the interface length of the mining area was 29790m, the overall interface was 2794810m, proportion of interface length to overall interface
318 Zeng Lei and Zeng Hui / Procedia Engineering 26 (2011) 311 – 3208 Zeng Lei,Zeng hui/Procedia Engineering 00 (2011) 000–000
was 1.065%.Took the Proportion of the interface length of the largest agricultural land of the landscape type in Wu’an to overall interface (fringe) as the standard value (Table 6). The Proportion was 37.8%and 33.1% in 1996 and 2008 respectively.
Ecological footprint (the specific value of the difference between ecological footprint and bearing capacity to bearing capacity, C6): Per capita ecological bearing capacity of Wu'an in 2008 was 0.55059, the per capita ecological deficit (the difference between ecological footprint and bearing capacity) was 6.3964, the specific value of per capita ecological deficit to bearing capacity was 11.62, and the specific value of ecological deficit to bearing capacity was 7.45[9] in 1996.
Per capita production footprint of Hebei Province over the years: It was 2.7629 in 1995, 2.9922 in 2000, 3.4670 in 2003, the interpolation in 1996 was 2.8088, and it was 3.7519 in 2008.
Per capita ecological bearing capacity: It was 0.3892 in 1995, 0.3234 in 2000, 0.3169 in 2003, the interpolation was 0.3760 in 1996, and 0.313 in 2008[10].
Table 6 Proportion of interface length to overall interface (fringe) length of main types of landscape in Wu’an
YearCultivated land/%
Construction land /%
Mining land /%
Forest land /% Unused land/% Waters land /%
1996 37.8 10.8 2.6 11.7 29.6 7.5
2008 33.1 7.9 6.4 22.8 24.8 5.0
Per capita ecological deficit of Wu'an in 1996 was 2.43272, it was 3.43888 in 2008; the specific value of per capita ecological deficit to bearing capacity was 6.47 in 1996, it was 10.98 in 2008.
Landscape diversity (C7): Shannon-Winener diversity index (SHDI) was 1.32 in 1996; the diversity index was 1.45 in 2008.
The degree of fragmentation (C8): The degree of fragmentation of the perimeter area of the independent industrial and mining district in 1996 and 2008 was 1.4106 and 1.3715 respectively.
Landscape aggregation degree (C9): Concentration degree of the plaque of the independent industrial and mining district in 1996 was 0.8894; concentration degree in 2008 was 0.6661.
Landscape fractal dimension (C10): The average landscape fractal dimension of the independent industrial and mining district in 1996 was 1.12; the average landscape fractal dimension in 2008 was 1.10.
Mineral resource recovery ratio (C11): The average recovery ratio of coal was 78.5%, and the average ratio of iron was 80%; to increase 2 to 3 percentage points was in plan, 85% in Hebei Province.
Reclamation ratio of the land(C12): Currently, a comprehensive management project named “tensof thousands of mining areas” is carrying out, the expected reclamation land was 1846.66hm2, the agricultural land was 1113.33hm2, the forestland was 733.33hm2, the total investment was 170 million RMB.
During the first stage, 26 closed mine areas and mine areas which nearly closed were elected, the recovery agricultural land and forestland was 779.48hm2. 16 of the mine areas planed to recover 440hm2
agricultural lands ,10 of them planed to recover 339.48hm2 forestland ,the plans to resume land 440hm2,10 mining areas plan to restore the forest to 339.48hm2, the reclamation ratio in 2008 was 42.21%.
Comprehensive utilization ratio of mineral resources (C13): It was 25% in 1996, 30% in 2008. Science and technology investment (Environment) (C14): The percentage of investment in
environmental governance in GDP.
4.3. The analysis of the results of combined assessment index of land use security
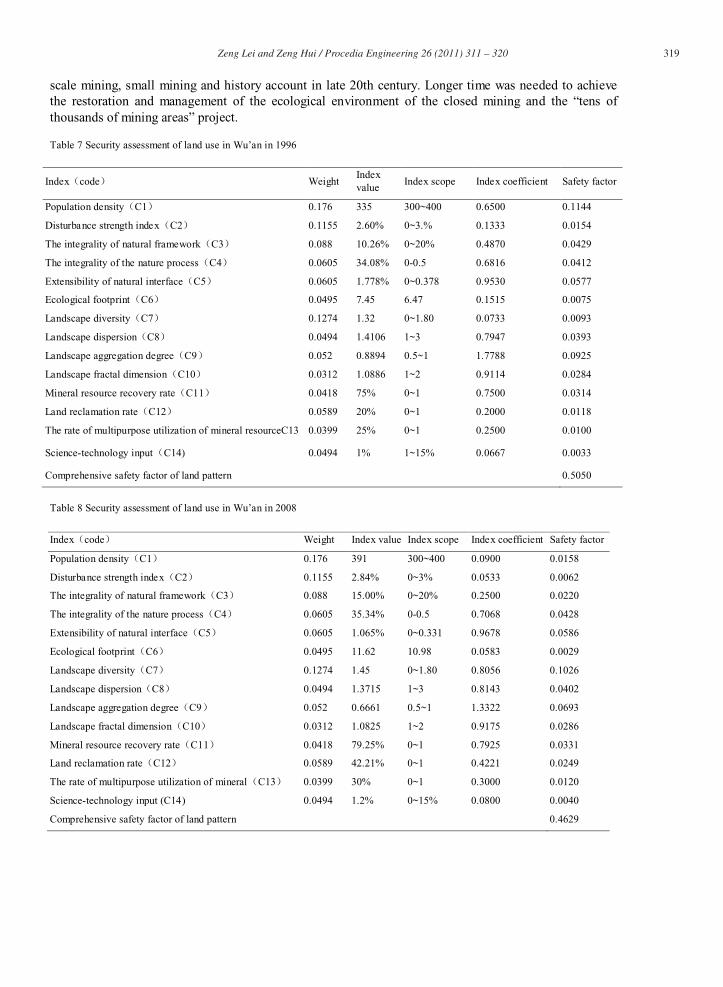
Tables 7 and 8 show that the combined assessment index of land use security in Wu'an was 50.50% in 1996; and 46.29% in 2008.The overall land use security status was in a downward trend due to the large-
319Zeng Lei and Zeng Hui / Procedia Engineering 26 (2011) 311 – 320Zeng Lei,Zeng hui / Procedia Engineering 00 (2011) 000–000 9
scale mining, small mining and history account in late 20th century. Longer time was needed to achieve the restoration and management of the ecological environment of the closed mining and the “tens ofthousands of mining areas” project.
Table 7 Security assessment of land use in Wu’an in 1996
Index(code) WeightIndex value
Index scope Index coefficient Safety factor
Population density(C1) 0.176 335 300~400 0.6500 0.1144
Disturbance strength index(C2) 0.1155 2.60% 0~3.% 0.1333 0.0154
The integrality of natural framework(C3) 0.088 10.26% 0~20% 0.4870 0.0429
The integrality of the nature process(C4) 0.0605 34.08% 0-0.5 0.6816 0.0412
Extensibility of natural interface(C5) 0.0605 1.778% 0~0.378 0.9530 0.0577
Ecological footprint(C6) 0.0495 7.45 6.47 0.1515 0.0075
Landscape diversity(C7) 0.1274 1.32 0~1.80 0.0733 0.0093
Landscape dispersion(C8) 0.0494 1.4106 1~3 0.7947 0.0393
Landscape aggregation degree(C9) 0.052 0.8894 0.5~1 1.7788 0.0925
Landscape fractal dimension(C10) 0.0312 1.0886 1~2 0.9114 0.0284
Mineral resource recovery rate(C11) 0.0418 75% 0~1 0.7500 0.0314
Land reclamation rate(C12) 0.0589 20% 0~1 0.2000 0.0118
The rate of multipurpose utilization of mineral resourceC13 0.0399 25% 0~1 0.2500 0.0100
Science-technology input(C14) 0.0494 1% 1~15% 0.0667 0.0033
Comprehensive safety factor of land pattern 0.5050
Table 8 Security assessment of land use in Wu’an in 2008
Index(code) Weight Index value Index scope Index coefficient Safety factor
Population density(C1) 0.176 391 300~400 0.0900 0.0158
Disturbance strength index(C2) 0.1155 2.84% 0~3% 0.0533 0.0062
The integrality of natural framework(C3) 0.088 15.00% 0~20% 0.2500 0.0220
The integrality of the nature process(C4) 0.0605 35.34% 0-0.5 0.7068 0.0428
Extensibility of natural interface(C5) 0.0605 1.065% 0~0.331 0.9678 0.0586
Ecological footprint(C6) 0.0495 11.62 10.98 0.0583 0.0029
Landscape diversity(C7) 0.1274 1.45 0~1.80 0.8056 0.1026
Landscape dispersion(C8) 0.0494 1.3715 1~3 0.8143 0.0402
Landscape aggregation degree(C9) 0.052 0.6661 0.5~1 1.3322 0.0693
Landscape fractal dimension(C10) 0.0312 1.0825 1~2 0.9175 0.0286
Mineral resource recovery rate(C11) 0.0418 79.25% 0~1 0.7925 0.0331
Land reclamation rate(C12) 0.0589 42.21% 0~1 0.4221 0.0249
The rate of multipurpose utilization of mineral(C13) 0.0399 30% 0~1 0.3000 0.0120
Science-technology input (C14) 0.0494 1.2% 0~15% 0.0800 0.0040
Comprehensive safety factor of land pattern 0.4629
320 Zeng Lei and Zeng Hui / Procedia Engineering 26 (2011) 311 – 32010 Zeng Lei,Zeng hui/Procedia Engineering 00 (2011) 000–000
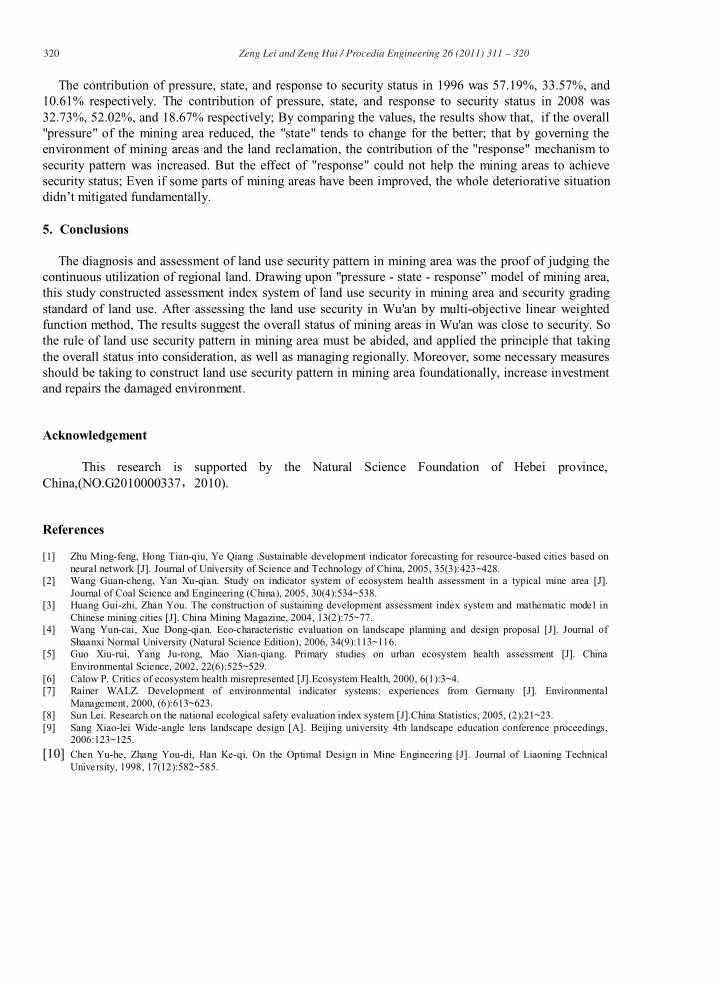
The contribution of pressure, state, and response to security status in 1996 was 57.19%, 33.57%, and 10.61% respectively. The contribution of pressure, state, and response to security status in 2008 was 32.73%, 52.02%, and 18.67% respectively; By comparing the values, the results show that, if the overall "pressure" of the mining area reduced, the "state" tends to change for the better; that by governing the environment of mining areas and the land reclamation, the contribution of the "response" mechanism to security pattern was increased. But the effect of "response" could not help the mining areas to achieve security status; Even if some parts of mining areas have been improved, the whole deteriorative situation didn’t mitigated fundamentally.
5. Conclusions
The diagnosis and assessment of land use security pattern in mining area was the proof of judging the continuous utilization of regional land. Drawing upon "pressure - state - response” model of mining area,this study constructed assessment index system of land use security in mining area and security grading standard of land use. After assessing the land use security in Wu'an by multi-objective linear weighted function method, The results suggest the overall status of mining areas in Wu'an was close to security. Sothe rule of land use security pattern in mining area must be abided, and applied the principle that taking the overall status into consideration, as well as managing regionally. Moreover, some necessary measures should be taking to construct land use security pattern in mining area foundationally, increase investment and repairs the damaged environment.
Acknowledgement
This research is supported by the Natural Science Foundation of Hebei province, China,(NO.G2010000337,2010).
References
[1] Zhu Ming-feng, Hong Tian-qiu, Ye Qiang .Sustainable development indicator forecasting for resource-based cities based on neural network [J]. Journal of University of Science and Technology of China, 2005, 35(3):423~428.
[2] Wang Guan-cheng, Yan Xu-qian. Study on indicator system of ecosystem health assessment in a typical mine area [J]. Journal of Coal Science and Engineering (China), 2005, 30(4):534~538.
[3] Huang Gui-zhi, Zhan You. The construction of sustaining development assessment index system and mathematic model in Chinese mining cities [J]. China Mining Magazine, 2004, 13(2):75~77.
[4] Wang Yun-cai, Xue Dong-qian. Eco-characteristic evaluation on landscape planning and design proposal [J]. Journal of Shaanxi Normal University (Natural Science Edition), 2006, 34(9):113~116.
[5] Guo Xiu-rui, Yang Ju-rong, Mao Xian-qiang. Primary studies on urban ecosystem health assessment [J]. China Environmental Science, 2002, 22(6):525~529.
[6] Calow P. Critics of ecosystem health misrepresented [J].Ecosystem Health, 2000, 6(1):3~4.[7] Rainer WALZ. Development of environmental indicator systems: experiences from Germany [J]. Environmental
Management, 2000, (6):613~623.[8] Sun Lei. Research on the national ecological safety evaluation index system [J].China Statistics, 2005, (2):21~23.[9] Sang Xiao-lei Wide-angle lens landscape design [A]. Beijing university 4th landscape education conference proceedings,
2006:123~125.
[10] Chen Yu-he, Zhang You-di, Han Ke-qi. On the Optimal Design in Mine Engineering [J]. Journal of Liaoning Technical University, 1998, 17(12):582~585.