the strengths of using multiple audit methodologies case ... · pdf filethe strengths of using...
TRANSCRIPT

The Strengths of Using Multiple Audit Methodologies Case Study of Washington State Ferries
Vessel Construction Program
Pacific Northwest Intergovernmental Audit Forum March 7, 2013
Steve Harkreader, Ph.D., Performance Audit Methodologist
Susan Hoffman, Principal Performance Auditor

2
Why we audited WSF’s Vessel Construction Program

How do construction costs for WSF’s vessels compare to other purchasers?
What factors affect construction cost and total construction spending?
Does WSF follow leading practices to design and construct its ferries?
3
What we did
Our audit questions:
• It costs more to build a ferry when WSF is the purchaser.
• Two regulatory requirements limit competition and increase construction costs.
• Build in Washington laws
• Apprenticeship Act requirements
• Vessel construction costs could be reduced through better use of leading practices.
4
What we found

• Identified all US-built ferries through a review of national databases complied by US Army Corps of Engineers and the US Department of Transportation
• Selected ferry purchasers for our audit based on three criteria:
• They had purchased a ferry since 1991
• Had built at least one ferry over 100 gross tons
• Had built a ferry in Washington state
• Eight ferry purchasers were included in our analysis.
5
Data collection methods

6
Ferry purchasers we visited
Alaska Marine Highway System Staten Island Ferries
North Carolina Department of Transportation
Texas Department of Transportation
Pierce County Public Works and Utilities
Woods Hole, Martha’s Vineyard & Nantucket Steamship Authority
San Francisco Water Emergency Transportation Authority
Washington State Ferries
These purchasers provided data on the 39 ferries in our analysis.
We also visited British Columbia Ferry Services (BC Ferries). While they shared information on their new ferry construction program, we did not include their vessels in our analysis.

7
WSF Vessels included in our analysis
Class – Passenger/vehicle capacity Vessel name, year built
Jumbo Mark II – 2,500 / 202
Tacoma, 1997
Wenatchee, 1998
Puyallup, 1999
Kwa-di Tabil – 750 / 64
Chetzemoka, 2010
Salish, 2011
Kennewick, 2012

• We developed and used a structured interview tool to collection information at each of the eight purchasers we visited related to each of our audit questions:
• Cost and descriptive information for ferries they purchased since 1991
• What factors they believe impact ferry construction cost
• Rules and regulations that govern how they design and purchase their ferries
• Practices used to design and construct their ferries, including those they view as effective
8
Data collection at ferry purchasers

9
Methods used to address audit questions
Audit questions Methods
How do construction costs for WSF’s vessels compare to other purchasers?
Statistical analysis
Case studies
Expert panel
What factors affect construction costs?
Does WSF follow leading practices to design and construct its ferries?
Gap analysis to assess WSF use of leading practices

$-
$20.0
$40.0
$60.0
$80.0
$100.0
$120.0
$140.0
$160.0
$180.0
$200.0
$220.0
1985 1990 1995 2000 2005 2010 2015
Tacoma Wenatchee
Puyallup Chetzemoka
Salish Kennewick
Washington ferries are among the most expensive built in last 20 years
Cost of construction
(millions)
How do the cost of WSF ferries compare?

$-
$20.0
$40.0
$60.0
$80.0
$100.0
$120.0
$140.0
$160.0
$180.0
$200.0
$220.0
1985 1990 1995 2000 2005 2010 2015
Tacoma
Wenatchee Puyallup
Chetzemoka
Salish Kennewick
Costs adjusted to 2011 dollars
Cost of construction
(millions)
How do the cost of WSF ferries compare?

Costs adjusted for weight of ferry
Cost per pound
(2011 dollars)
How do the cost of WSF ferries compare?
$-
$10.00
$20.00
$30.00
$40.00
$50.00
$60.00
$70.00
$80.00
1985 1990 1995 2000 2005 2010 2015
Chetzemoka
Salish
Kennewick
Tacoma Wenatchee
Puyallup

Vessel characteristics Operating environment Purchasing characteristics
Lightship weight Ocean Purchaser
Passenger capacity Lakes, bays, or sound Location of shipyard
Vehicle capacity River Number of vessels in contract
Hull material Route time Days to delivery
Double-ended Federal funding received
Horsepower Amount of change orders
Passenger amenities Any owner furnished equipment
Food service amenities Number of bids received
Anticipated service life Outsourced project management
Safety requirements
13
Primary cost drivers

$0
$25
$50
$75
$100
$125
$150
$175
$200
$225
0 1 2 3 4 5 6 7 8 9 10 11 12 13 14 15
Kennwick
Construction costs
(2011 dollars, millions)
Lightship weight (millions of pounds)
Larger ferries cost more to build $ = 1.7 + 14.7 (LSW pounds)
Tacoma
Wenatchee Puyallup
Chetzemoka Salish
Effect
Residual
Analytical Methods – Regression Model

Vessel characteristics Operating environment Purchasing characteristics
Lightship weight Ocean Purchaser
Passenger capacity Lakes, bays, or sound Location of shipyard
Vehicle capacity River Number of vessels in contract
Hull material Route time Days to delivery
Double-ended Federal funding received
Horsepower Amount of change orders
Passenger amenities Any owner furnished equipment
Food service amenities Number of bids received
Anticipated service life Outsourced project management
Safety requirements
15
Primary cost drivers used in the regression

16
Costs when controlling for differences in design characteristics
• Conclusions are drawn from identifying patterns across multiple ferry construction projects.
We make the case that the expensive WSF projects of the past are not isolated incidences, but have systemic causes.
• We were able to control for multiple factors that drive ferry construction costs while comparing WSF to other purchasers
• We are able to estimate how much WSF has “overpaid” in the past. Is it a big deal?
We estimate that WSF paid between $7.5 million and $42.2 million more per ferry.
17
Strengths of our statistical analysis

• Our statistical analysis can not tell us why WSF paid more for ferries in the past.
• Our conclusions are only relevant if the patterns of the past are the same today.
• Our conclusions are only as good as the data are reliable and our assumptions are valid.
• Statistical analysis is a “black box” to most policy makers and program managers. If the results don’t make intuitive sense it is easy to dismiss them.
18
Limitations of our statistical analysis

GAO defines a case study as:
“…a method for learning about a complex instance, based on a comprehensive understanding of that instance obtained by extensive description and analysis of that instance taken as a whole and in its context.”
19
Analytical Methods – Case Studies

• To better understand the results of our regression model, which showed that WSF vessels cost most
• To understand the impact of the regulatory requirements we identified that are placed on WSF, but not other purchasers that built their ferries in Washington
• To understand improvements WSF had made in its vessel construction program
• To inform the development and our understanding of design and construction leading practices by learning about the practices of one of the most respected ferry operations in the world
20
Case Studies – Why did we use them?

• Chetzemoka/Island Home construction cost comparison
• Ferries cost more when WSF is the purchaser
• Regulatory requirements placed on WSF limit competition and increase costs
• Impact following construction and design leading practices has on cost
• Experience of Pierce County building the Steilcoom II in Washington
• Ferries built in Washington, not by WSF do not cost more
• Regulatory requirements placed on WSF limit competition and increase costs
• Improvements made in WSF practices between construction of Jumbo Mark II and Kwa-di Tabil class ferries
• Impact following construction and design leading practices has on cost
• Design and construction practices at BC Ferries
• Impact following construction and design leading practices has on cost
21
Our case studies helped answer our audit questions

22
Chetzemoka/Island Home Case Study
The Island Home – Total cost $48 million (2011 dollars)
The Chetzemoka – Total cost $87 million (2011 dollars)
To illustrate the impact of open competition on price:
• Pierce County in Washington state builds and operates ferries, but is not subject to the Build in Washington law or the state’s Apprenticeship Act
• The County issued a RFP to build a new ferry, but only received one bid from a local shipyard. The county cancelled the procurement because the bid was higher than their project estimate.
• After actively soliciting interest from other shipyards, the new procurement brought interest from nine shipyards, five of which bid on the project
• The winning shipyard, located in Washington, provided a bid that was 13% below the earlier bid
23
Pierce County Case Study

What makes BC Ferries successful?
• Established vessel replacement criteria.
• Adopted a ‘functional specification’ approach to vessel design.
• Opened procurements to shipyards outside BC.
• Used fixed price contracts.
• Required shipyard to assume all responsibility for design and construction of new vessel.
• Made changes to construction contracts by using:
• Design-build contracts
• Price de-escalation clauses
• Performance guarantees
• Warranties
• Right of refusal on final delivery
24
BC Ferries Case Study

• Strengths
• Case studies use multiple methodologies
• Allows development of a complete understanding of what happened in a particular case
• Provides an illustration of audit findings established through other methods
• Limitations
• Selection is subjective
• Generalization of results is limited
• Successful use of case studies depend on:
• Ensuring the case study type and content is relevant to the audit question
• Using a selection process that is credible and defendable
25
Case Studies – Strengths and Limitations

We developed a list of 15 leading practices for ferry design and construction contracting which we used to evaluate WSF’s performance.
26
Analytical Methods - Leading practices

• Best practices – A best practice is a practice that is viewed as the most efficient and effective way of accomplishing a task, based on repeatable procedures that have proven themselves over time for large numbers of people
• Leading practices - A leading practice is a practice that is more efficient and effective for delivering a particular outcome, are dependent on the organization they are being applied to, and can change over time
27
Best Practices vs Leading Practices – What’s the difference?

• We developed leading practices for ferry design and construction based on:
• Review of industry literature
• Interviews with WSF
• Interviews with eight ferry purchasers we visited
• BC Ferries Case Study
• Interviews with shipyards in and out of Washington state
• Input from our technical panel of maritime experts
28
Developing leading practices

• We assessed WSF performance against the leading practices by interviewing WSF executives and program managers; and reviewing WSF financial reports, contracts, and project management reports
• We reviewed the results of our assessment with our technical panel who provided their recommendations on how WSF could enhance the effectiveness of WSF’s vessel construction program
29
Leading Practices
• Strengths
• Developing leading practices specific to the audit allowed us to evaluate WSF performance against the leading practices of their peers
• Assessing performance against leading practices allowed us to identify areas where WSF could improve their performance
• Limitations
• Creating situation specific leading practices for an audit can leave others to question their credibility
• Leading practices are not evidence-based, but based on the expertise of knowledgeable parties
30
Leading Practices – Strengths and Limitations
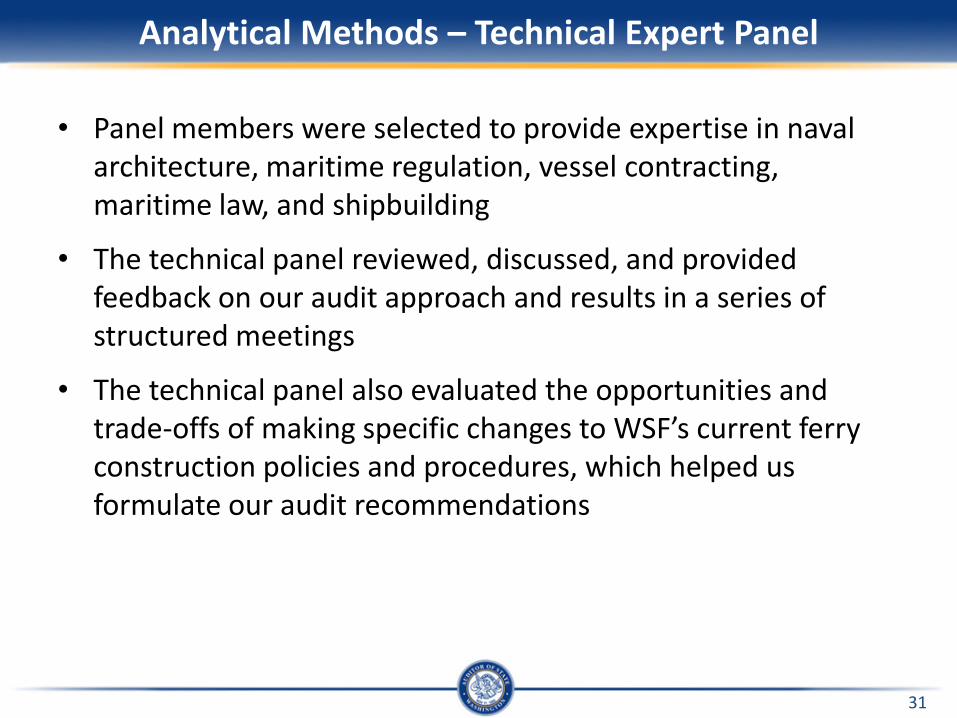
• Panel members were selected to provide expertise in naval architecture, maritime regulation, vessel contracting, maritime law, and shipbuilding
• The technical panel reviewed, discussed, and provided feedback on our audit approach and results in a series of structured meetings
• The technical panel also evaluated the opportunities and trade-offs of making specific changes to WSF’s current ferry construction policies and procedures, which helped us formulate our audit recommendations
31
Analytical Methods – Technical Expert Panel

To estimate the economic impact of Build in Washington, we used the following assumptions:
• Build two ferries
• Costing $75 million each
• During fiscal years 2013 and 2014.
The results:
• An average of 322 jobs and $28 million in wages in the shipbuilding industry in each fiscal year.
• An average of 1,335 jobs and $90 million in wages across all sectors of the economy in each fiscal year.
Our thanks to OFM for using their Input-Output model to produce these estimates for our audit.
32
Analytical Methods - Economic impact analysis
33
Contacts
Susan Hoffman Principal Performance Auditor
(360) 725-9719 [email protected]
Steve Harkreader Performance Audit Methodologist
(360) 725-9732 [email protected]
Website: www.sao.wa.gov Twitter: www.twitter.com/WAStateAuditor