the stellar populations of de galaxies in nearby groups stellar populations of de galaxies in nearby...
TRANSCRIPT

1
The Stellar Populations of dE galaxiesin nearby Groups
Gary Da Costa
Mt Stromlo Observatory
Research School of Astronomy & Astrophysics
The Australian National University(on sabbatical at Gemini South Operations Center)

2
We have known for some time nowthat the dwarf Ellipticals (includesdwarf Spheroidals) of the LocalGroup show a variety of star-formation histories.
• For the Milky Way companionsthese range from basically single oldstellar populations (Ursa Minor)through to systems like Carina,Fornax and Leo I which have hadcomplex star formation histories, andcontain stars as young as ~1 Gyr (oreven less in the case of Fornax).
• Extended star formation is alsoevident in the M31 dE and dSphcompanions.
Carina data from Smecker-Hane et al. (1998) showingmultiple episodes of starformation.
Background
3
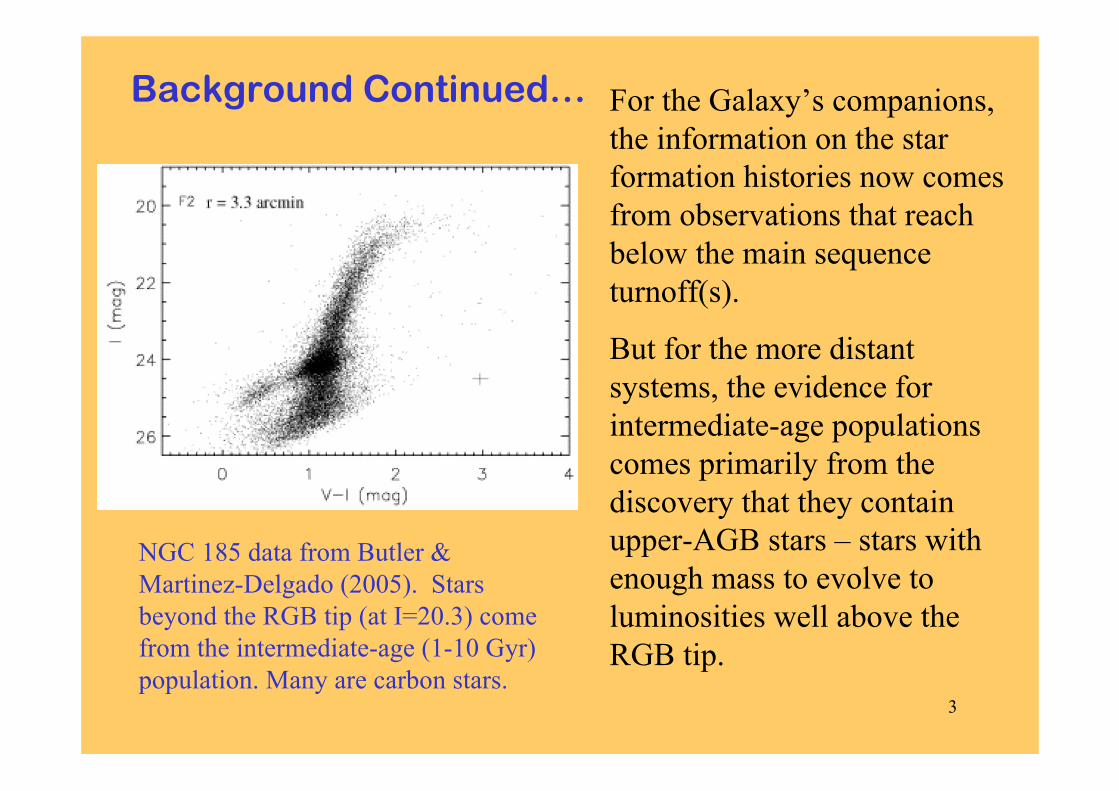
Background Continued… For the Galaxy’s companions,the information on the starformation histories now comesfrom observations that reachbelow the main sequenceturnoff(s).
But for the more distantsystems, the evidence forintermediate-age populationscomes primarily from thediscovery that they containupper-AGB stars – stars withenough mass to evolve toluminosities well above theRGB tip.
NGC 185 data from Butler &Martinez-Delgado (2005). Starsbeyond the RGB tip (at I=20.3) comefrom the intermediate-age (1-10 Gyr)population. Many are carbon stars.

4
Background Continued…Provided the mean metallicity ofthe dE is below [Fe/H] ≈ −1.0,
• The luminosity of the brightestupper-AGB stars gives anindication of the epoch of the lastepisode of significant starformation, and
• The number of upper-AGB starsrelative to the number of redgiants gives a (first order)indication of the relativeimportance of the intermediate-age population.
Fornax near-IR CMD from Saviane.Upper-AGB stars clearly visibleabove RGB tip at K=14.6

5
Background Continued…
• For the MWG dSphcompanions, the ages inferredfrom the AGB-tip are consistentwith the main sequence data.
For example, for Leo IMbol(AGB) ≈ -5.1 is consistentwith a 1-2 Gyr age for lastsubstantial star formation.
(AGB-tip, age) relations fromRejkuba et al. (2006).

6
Do we understand what causes the variety of starformation histories seen among Local Group dEs?
In general, no (!) but environment, as represented by, forexample, proximity to a luminous galaxy, and the type of thatgalaxy, most likely plays a role in influencing the star formationhistory of these low-luminosity systems.
• There is the well known morphology-density relation in whichthe majority (but not all !) of the isolated dwarf galaxies in theLocal Group are (star-forming, gas-rich) dIrrs, not dEs.
• Similarly, for the Milky Way (and maybe M31?), generally themore distant dE/dSph companions have more prominentintermediate-age populations.
Clearly, if we want to understand the role of environment then thenext step is to study the stellar populations of dEs in groupsbeyond the Local Group.

7
Fortunately the nearest groups provide a variety ofdifferent environments…
Sculptor Group – This is a loose aggregation of galaxies rangingin distance from ~1.5 to ~4 Mpc. It contains a half dozen or solow luminosity early-type systems.
M81 and Cen A groups – These are denser, more compact groupsat distances of ~3.5 to 4 Mpc. Both groups contain a dozen ormore low luminosity early-type systems.
The dSph systems in these groups cover a range of internal(absolute magnitude, size, etc) and external (distance fromnearest large galaxy, local galaxy density) properties.

8
We are carrying out a program to study in detail thestellar populations of the dE galaxies in these groupsusing:
• HST ACS/WFC and existing ‘snapshot’ data for distances andmetal abundances, • Gemini-N NIRI and ESO VLT ISAAC data for upper-AGBpopulations, • ATCA and Parkes observations (Sculptor, Cen A only) forneutral hydrogen detections or limits.
Collaborators:M81 – Armandroff (NOAO), Caldwell (CfA), Coleman(RSAA/Heidelberg) and Prior (RSAA student)Scl and Cen A – Binggeli (Basel), Jerjen (RSAA), Rejkuba (ESO),Zoccali (PUC) and Bouchard (RSAA student).

9
Concentrate today on the M81 group:(Marina Rejkuba will discuss the Cen A group tomorrow)
M81 group known to have had a number of relatively recent interactions.~20 galaxies within 200kpc projected radius of M81 (cf. ~4 for the MilkyWay). dEs, dIrrs, peculiar galaxies (M82, 3077) and small spirals all found.

10
Specifically discuss new ACS/WFC data for 5 M81 groupdEs together with older WFPC2 data (Caldwell et al.1998) for 2 more:
Kar 61 (KDG 61, [KK98] 081) MV = -13.5 30kpc
F6D1 ([FM2000] 1) MV = -11.7 60kpc
Kar 64 (UGC05442, KDG 64, [KK98] 085) MV = -13.6 100kpc
F12D1 ([KK98] 077) MV = -13.7 105kpc
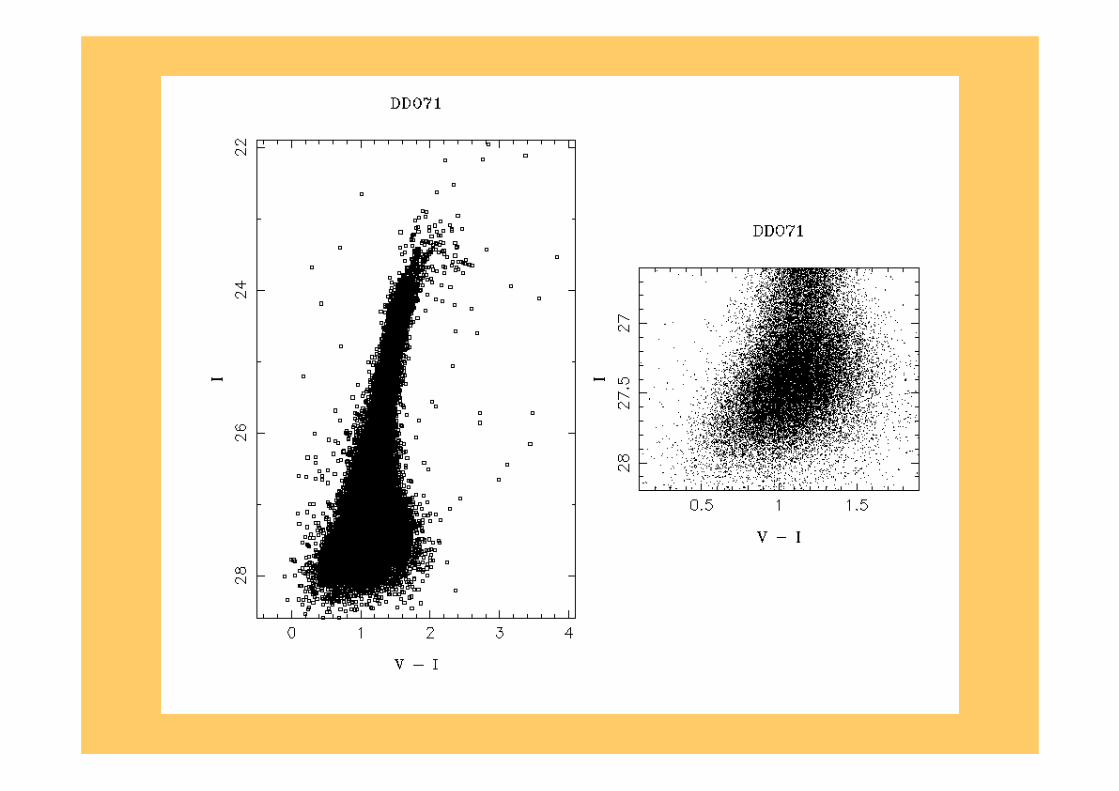
DDO71 (UGC05428, KDG 63, [KK98] 083) MV = -13.4 170kpc
The ACS/WFC data for each dE consists of a total of 17200s with the F606Wfilter (wide-V) and 9000s with the F841W filter (wide-I). The long totalintegration times were possible because of the location of the M81 group in thecontinuous viewing zone (~x2 increase in efficiency).
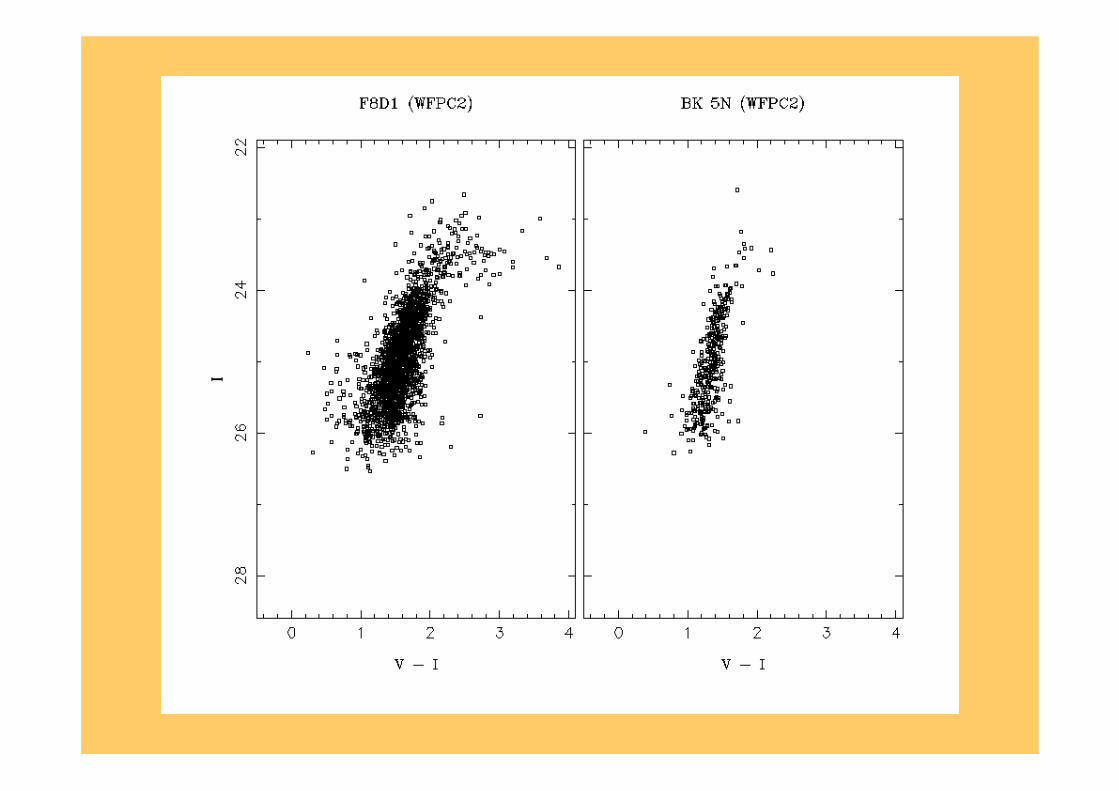
The Caldwell et al. (1998) data are for F8D1 (-14.2, 120kpc) and BK 5N(-11.3, 75kpc).
11

12

13
14

15
ACS dataIn all five galaxies we are clearly seeing a red clump populationnear the limit of the data at I ≈ 27.5 (MI ≈ -0.3). Given the lowmetallicities of the dEs, this may indicate a substantial populationof stars somewhat younger than the Galactic globular clusters.
• However, to understand the implications we need to dopopulation modelling of the colour-magnitude diagrams (CMDs),and to do that we need to establish completeness corrections anderrors as a function of magnitude and location. This requires a lotof artificial star tests which we have not completed yet.
• Concentrate on the upper part of the CMDs where the errors aresmall and the completeness corrections negligible: determinedistances, metallicity estimates and the upper-AGB populations.

16
Distances
• Using the I magnitudes of the tip of the red giant branches, themean distance for all 7 dEs is 3.70 Mpc, with a 1σ dispersion ofonly ±140 kpc, consistent with that expected just from the errors.
• The difference in modulus between the ‘nearest’ and ‘farthest’galaxies is only 0.24 ± 0.12 mag, so it is only at the 2σ level thatrule out all galaxies being at the same distance!
• Clearly all 7 dEs are within the ‘core’ of the group.

17
Abundances
Once the distances areknown, mean abundanceestimates can be derivedfrom the mean colour ofthe RGB compared to thecolours of standardGalactic globular clustergiant branches.
This estimate is strictly alower limit as the RGB ofa younger population isbluer at fixed abundance.
Giant branches shown are for M15 ([Fe/H] =-2.17, NGC 1851 (-1.36) and 47 Tuc (-0.71).

18
Abundances• In general the M81 dEsfall-in with the LocalGroup objects in themetallicity - absolutemagnitude diagram.
• Not really too surprisingsince the existence of amass-metallicity relationfor dEs seems to be auniversal phenomenon(equivalent to the colour-magnitude relation forluminous early-typegalaxies).
Star symbols are M81 group objects, circlesare MWG companions, triangles are M31companions.

19
Upper-AGB populations
First properties to look atare simple quantities suchas: (a) the number of upper-AGB stars relative to thenumber of red giants nearthe tip, and (b) the mean luminosityof the 3 brighest upper-AGB stars.(c) the bolometricluminosity functions.
Upper-AGB box based on the populationseen in F8D1 (-4.15 > MI > -5.5 and1.5 < (V-I)0 < 3.5). RGB box is 0.3mag wide in I.
20
Upper-AGB populations
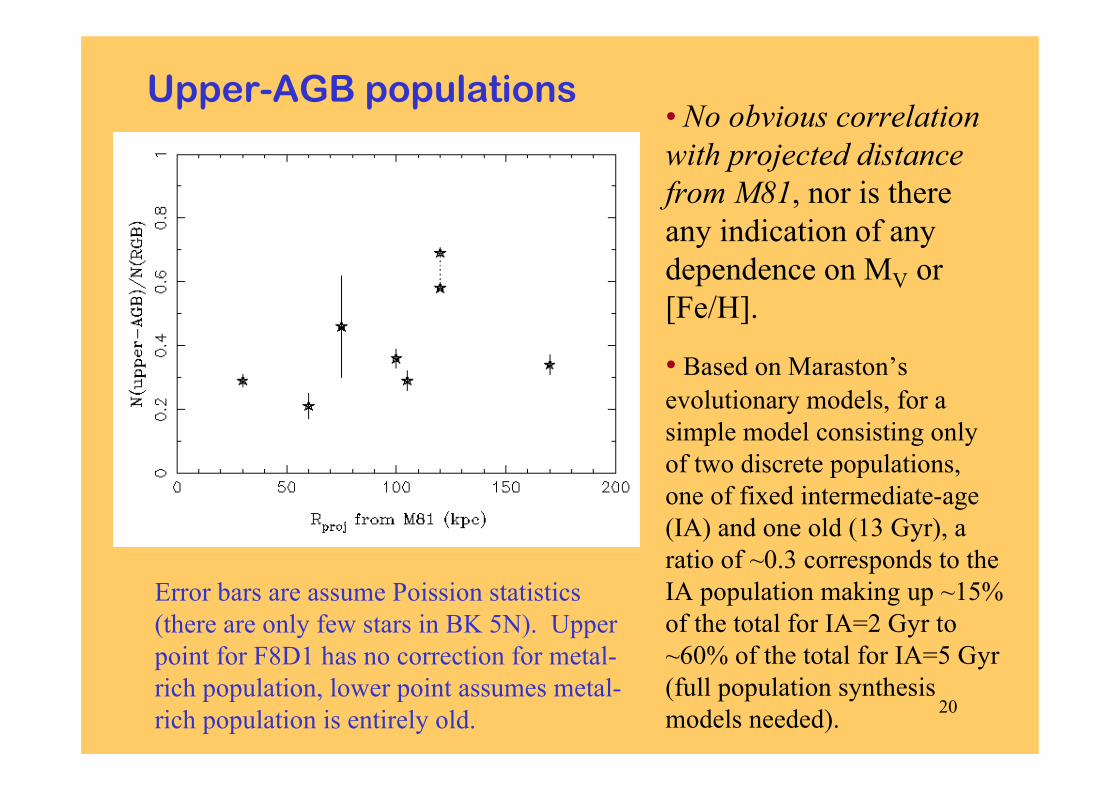
Error bars are assume Poission statistics(there are only few stars in BK 5N). Upperpoint for F8D1 has no correction for metal-rich population, lower point assumes metal-rich population is entirely old.
• No obvious correlationwith projected distancefrom M81, nor is thereany indication of anydependence on MV or[Fe/H].
• Based on Maraston’sevolutionary models, for asimple model consisting onlyof two discrete populations,one of fixed intermediate-age(IA) and one old (13 Gyr), aratio of ~0.3 corresponds to theIA population making up ~15%of the total for IA=2 Gyr to~60% of the total for IA=5 Gyr(full population synthesismodels needed).

21
Upper-AGB populations
Vertical lines show brightest and thirdbrightest Mbol values. Once again note thereare only few stars in BK 5N, which gives alarge uncertainty.
• No obvious correlationwith projected distancefrom M81, nor is there anyindication of anydependence on MV or[Fe/H].
• Inferred epochs of lastsignificant star formation:F8D1 2.5 GyrDDO71 3.5 GyrKar 61 4 GyrKar 64 4 GyrF12D1 6.5 Gyr BK5N 7? Gyr F6D1 8 Gyr
The diversity in these values issimilar to what is seen in theLocal Group.

22
Upper-AGB populationsOne further question is whether there is any obvious structure inthe upper-AGB bolometric LFs. For most of the sample, theanswer is ‘no’. The possible exception is Kar 64 which has a‘feature’ at Mbol ≈ -4.6.
AGB numbers havebeen normalized toN(RGB)[tip, tip+0.3]= 500. Kar 64 is thedashed line, F8D1 isthe solid line

23
Upper-AGB populations
Solid line correspondsto Mbol = -4.6
This ‘feature’, which nominally would correspond to enhancedstar formation about ~6 Gyr, is also evident in the c-m diagram….

24
Conclusions (1)
• Like the Local Group dEs and dSphs, the M81 group dEs apparently show avariety of star formation histories (SFH).
• Although the sample of M81 group dEs studied is not complete, none of the7 objects studied so far show similarities to Local Group dEs like Ursa Minorand Tucana, which have dominant old (age > 10 Gyr) populations. “Classic”dEs (meaning objects consisting of a single old stellar population, cf: BaadePop II) are apparently rare objects.
• There are no clear dependencies of SFH/intermediate-age pops on distancefrom M81 (cf. the Milky Way dSphs). This is perhaps not surprising given thelevel of interactions in the core of the M81 group.
• Stay tuned for full population synthesis models of the ACS data…