the status of lean implementation with south …
TRANSCRIPT

1
THE STATUS OF LEAN IMPLEMENTATION WITHIN SOUTH AFRICAN
AIRCRAFT MAINTENANCE ORGANISATIONS
Sean Murphy
A research report submitted to the Faculty of Engineering and the Built
Environment, University of the Witwatersrand, Johannesburg, in partial
fulfilment of the requirements for the degree of the Master of Science in
Engineering.
Johannesburg, 2011

2
DECLARATION
I declare that this research report is my own unaided work. It is being submitted
to the Master of Science to the University of the Witwatersrand, Johannesburg. It
has not been submitted before for any degree or examination to any other
university.
……………………………………
1st day of June 2011
(day) (month) (year)

3
ABSTRACT
Globally the implementation of Lean techniques has proven to be successful in
improving quality while reducing turn around times and costs within aircraft
maintenance facilities, including those companies that are of a competitive threat
to South African companies.
The purpose of this study is to determine the level of Lean implementation within
South African aircraft maintenance facilities, due to the lack of current data or
research regarding this subject. Quantitative and qualitative data was derived
from interviews conducted with senior management of a sample of Gauteng
based facilities and the results where triangulated and interpreted to determine
both their understanding and the status of Lean within their facilities.
Lean implementation was not evident in the maintenance facilities surveyed. The
majority of persons interviewed showed a lack of understanding of Lean. There
was no evidence of any discernable methodology, such as Six Sigma or the
Theory of Constraints, being in place. The results of the study will benchmark
South African aircraft maintenance organisations against their global competition
and will determine what actions should be undertaken, if any, with respect to
Lean, so as to ensure they retain or improve their share of the expanding global
and African aviation maintenance market.

4
Dedicated to my partner Christa Kapp.
She gave me the time and support necessary to complete this research report.

5
ACKNOWLEDGEMENTS
I wish to thank the following:
• Bernadette Sunjka, my research supervisor, for the assistance and
guidance provided.
• All the respondents to my research questions who gave freely of
their time. The majority of whom wish to remain anonymous,
therefore all shall.
• My employer Eurocopter Southern Africa (Pty) Ltd. for financial
assistance provided.
• All those with whom I have the pleasure of working with in the
aircraft maintenance industry, who toil behind the scenes, to ensure
safe flight. “The more perfect machines become, the more they are
invisible behind their function. Once we were in contact with a
complex workshop. Today we forget the revolving engine. It is at
last fulfilling its function, which is to revolve just as a heart goes on
beating, and we pay no attention to our heart. The tool no longer
absorbs our attention” (Saint-Exupery, cited by Pascoe, 2003).
DISCLAIMER
All statements, comment or opinions expressed in this research report are
solely those of the author and do not necessarily represent the opinions or
reflect the official position of my current or previous employers. The
information contained herein is for the sole purpose of information and
education.

6
CONTENTS
DECLARATION .................................................................................................... 2 ABSTRACT ........................................................................................................... 3 ACKNOWLEDGEMENTS ................................................................................... 5 DISCLAIMER ........................................................................................................ 5 LIST OF FIGURES ................................................................................................ 9 LIST OF TABLES ............................................................................................... 10 LIST OF ACRONYMS ........................................................................................ 11 1 INTRODUCTION TO RESEARCH PROBLEM ........................................ 13
1.1 Aircraft operators and maintenance ...................................................... 13 1.2 Global maintenance market .................................................................. 14 1.3 African maintenance market ................................................................. 15 1.4 Maintenance and Lean .......................................................................... 16 1.5 South Africa’s maintenance market ..................................................... 17 1.6 Motivation for research ........................................................................ 18 1.7 Research report question ...................................................................... 19 1.6 Research report aim .............................................................................. 19 1.8 Research report methodology ............................................................... 20 1.9 Research report structure ...................................................................... 20
2 LITERATURE REVIEW ............................................................................. 21 2.1 History of Lean ..................................................................................... 21
2.1.1 Introduction .................................................................................. 21 2.1.2 Industrial processes prior to Ford ................................................. 21 2.1.3 Ford’s processes ........................................................................... 22 2.1.4 Ford, Toyota and the emergence of Lean ..................................... 23 2.1.5 Lean’s introduction to the world .................................................. 25 2.1.6 Lean and the Toyota recall of 2010 .............................................. 27 2.1.7 Summary ....................................................................................... 28
2.2 Lean theory ........................................................................................... 29 2.2.1 Introduction .................................................................................. 29 2.2.2 Overview of Lean ......................................................................... 29 2.2.3 The five Lean principles ............................................................... 31 2.2.4 Six Sigma and the Theory of Constraints ..................................... 49 2.2.5 Summary ....................................................................................... 53
2.3 Aircraft maintenance ............................................................................ 55 2.3.1 Introduction .................................................................................. 55 2.3.2 Overview of aircraft maintenance ................................................ 55 2.3.3 History of aircraft maintenance .................................................... 56 2.3.4 Creation and approval of a maintenance schedule ....................... 58 2.3.5 Maintenance schedules ................................................................. 58 2.3.6 Calculating cost of maintenance and Lean ................................... 60 2.3.7 South African AMO regulatory oversight .................................... 63 2.3.8 SACAA AMO approvals .............................................................. 65 2.3.9 Summary ....................................................................................... 65
2.4 Aviation and Lean implementation experience .................................... 67 2.4.1 Introduction .................................................................................. 67
7
2.4.2 Lean beyond the automotive sector .............................................. 67 2.4.3 Aviation’s introduction to Lean .................................................... 68 2.4.4 Lean and military aircraft ............................................................. 69 2.4.5 Lean and civil aircraft ................................................................... 72 2.4.6 Comment on AMO Lean implementation .................................... 75 2.4.7 AMO industry’s future challenges and the status of Lean ........... 79 2.4.8 Summary ....................................................................................... 83
3 RESEARCH METHODOLOGY ................................................................. 84 3.1 Introduction .......................................................................................... 84 3.2 Population selection criteria ................................................................. 85 3.3 Data collection technique ..................................................................... 88 3.4 Questionnaire design ............................................................................ 90 3.5 Pilot study ............................................................................................. 90 3.6 Amendments to questionnaire during survey ....................................... 91 3.7 Amendments to population after survey ............................................... 92 3.8 Questionnaire format ............................................................................ 92 3.9 Data presentation and analysis ............................................................. 93 3.10 Research limitations and comments ..................................................... 94
4 RESULTS ..................................................................................................... 96 4.1 Introduction .......................................................................................... 96 4.2 Interviewees’ information .................................................................... 96 4.3 Interviewees’ profile ............................................................................. 97 4.4 Interviewees’ company details ............................................................. 97 4.5 Current implementation status of each of the five Lean principles .... 100
4.5.1 Value ........................................................................................... 100 4.5.2 Value Stream .............................................................................. 103 4.5.3 Flow & Pull ................................................................................ 104 4.5.4 Perfection .................................................................................... 107
4.6 Knowledge of Lean terminology ........................................................ 108 4.7 Current status of Lean implementation .............................................. 109 4.8 Current status of Six Sigma & TOC implementation ......................... 109 4.9 Conclusion .......................................................................................... 110
5 DISCUSSION OF RESULTS .................................................................... 111 5.1 Introduction ........................................................................................ 111 5.2 Overall analysis of the AMOs surveyed ............................................. 111
5.2.1 AMO personnel interviewed ...................................................... 111 5.2.2 AMOs years in business and physical characteristics ................ 111 5.2.3 AMOs staff number, business model and approvals held .......... 112 5.2.4 Summary ..................................................................................... 113
5.3 Current implementation status of each of the five Lean principles .... 114 5.3.1 Lean Principle 1: Value ............................................................. 114 5.3.2 Lean Principle 2: Value Stream ................................................. 119 5.3.3 Lean Principles 3 & 4: Flow & Pull ........................................... 122 5.3.4 Lean Principle 5: Perfection ...................................................... 126 5.3.5 AMOs Knowledge of Lean ........................................................ 128 5.3.6 Lean implementation & experience ............................................ 131 5.3.7 Six Sigma and TOC implementation status ................................ 132 5.3.8 Conclusion .................................................................................. 133

8
6 CONCLUSIONS AND RECOMMENDATIONS ..................................... 134 6.1 Introduction ........................................................................................ 134 6.2 Conclusions ........................................................................................ 134
6.2.1 Lean and AMOs internationally ................................................. 134 6.2.2 Lean and South African AMOs .................................................. 135
6.3 Recommendations .............................................................................. 137 REFERENCES ................................................................................................... 138 APPENDIX A – Survey format ......................................................................... 151 APPENDIX B – Survey Question Paper ............................................................ 166 APPENDIX C – Interviewees’ responses to survey questions .......................... 176

9
LIST OF FIGURES
Figure 1.1 Maintenance outsourcing 2007 to 2017 .............................................. 14 Figure 1.2 Regional AMOs, global market share (2009) ..................................... 15 Figure 2.1 Comparison of Toyota and GM revenue 1980 to 2009 ...................... 25 Figure 2.2 Comparison of Toyota and GM net income/revenue 1980 to 2009 .... 26 Figure 2.3 Evolution of dominant production strategies ...................................... 30 Figure 2.4 B-2 Bomber stealth materials handling during production ................. 34 Figure 2.5 The 3Ms: Muda, Muri, Mura .............................................................. 35 Figure 2.6 Simple value stream pictogram ........................................................... 37 Figure 2.7 Aspen Pharmacare VSM of current processes .................................... 39 Figure 2.8 Aspen Pharmacare VSM of proposed processes ................................. 40 Figure 2.9 Airbus Deutschland aft fuselage flow assembly line .......................... 42 Figure 2.10 Takt Time .......................................................................................... 42 Figure 2.11 Eurocopter main gear box U cell assembly line ............................... 43 Figure 2.12 Push & Pull visual comparison ......................................................... 46 Figure 2.13 Lean, Six Sigma, TOC comparison graph ........................................ 51 Figure 2.14 Lean, Six Sigma methodology overlap ............................................. 52 Figure 2.15 The Lean enterprise philosophy ........................................................ 54 Figure 2.16 Increase in aircraft productivity 1900 to present day ........................ 61 Figure 2.17 Passenger and freight growth 2008 to 2010 ...................................... 79 Figure 4.1Location of AMOs interviewed ........................................................... 97 Figure 4.2 AMO facility status ............................................................................. 99 Figure 4.3 CAA approvals and standards held ..................................................... 99 Figure 4.4 Maintenance specialties performed by the AMOs ............................ 100 Figure 4.5 Knowledge of cost of production ...................................................... 103 Figure 4.6 Process recording and mapping ........................................................ 104 Figure 4.7 AMO computer software ................................................................. 105 Figure 4.8 Process standardisation ..................................................................... 106 Figure 4.9 Inventory control ............................................................................... 107 Figure 4.10 Continuous improvement and benchmarking ................................. 108 Figure 4.11 Knowledge of Lean terminology .................................................... 108 Figure 4.12 Percentage of AMOs implementing Lean ....................................... 109 Figure 4.13 Six sigma and TOC knowledge ...................................................... 109

10
LIST OF TABLES
Table 1.1 AMO companies, global market share ................................................. 14 Table 1.2 Global AMO markets, market share and growth 2010 to 2020 ........... 16 Table 2.1 Comparison of GM mass production Vs Toyota Lean production
figures .................................................................................................... 26 Table 2.2 Seven Muda types ................................................................................ 34 Table 2.3 The 5Ss ................................................................................................. 45 Table 2.4 Comparison table of Six Sigma, Lean and TOC improvement
programs ................................................................................................ 52 Table 2.5 Five principles of Lean framework for research report survey ............ 53 Table 2.6 Aircraft letter check tasks overview ..................................................... 59 Table 2.7 Typical aircraft maintenance check intervals ....................................... 59 Table 2.8 A330/340 Check interval increase under MSG-3 ................................ 60 Table 2.9 Allocation of aircraft costs ................................................................... 62 Table 2.10 SACAA AMO approvals categories and groups ................................ 65 Table 2.11 Comparison aircraft and automobile deliveries 2010 ......................... 69 Table 2.12 USAF maintenance facilities Lean implementation results ............... 70 Table 2.13 US Military OEM Lean implementation results ................................ 71 Table 2.14 RAF Lean implementation results ...................................................... 71 Table 2.15 Global Military Fleet 2010 ................................................................. 72 Table 2.16 Civilian OEM Lean implementation results ....................................... 73 Table 2.17 Civilian AMO Lean implementation results ...................................... 74 Table 2.18 Component shop Lean implementation results .................................. 75 Table 2.19 IATA Airline industry fact sheet 2001-2011F ................................... 79 Table 2.20 In service and stored aircraft 2009 ..................................................... 80 Table 2.21 World economy forecast summary 2006 to 2015 .............................. 81 Table 3.1 South African provinces and number of AMOs ................................... 85 Table 3.2 Provincial location number of large turbine fixed wing commercial
aircraft AMOs ........................................................................................ 87 Table 3.3 Comparison of main structured techniques for data collection ............ 88 Table 4.1 Managerial position of interviewees .................................................... 97 Table 4.2 Overview of the nine AMOs that participated in the survey ................ 98 Table 4.3 Understanding of customer and product/service being supplied ........ 100 Table 4.4 Communication with customer .......................................................... 101 Table 4.5 Determining customer needs .............................................................. 101 Table 4.6 Determining customer satisfaction ..................................................... 101 Table 4.7 Determining customer satisfaction against set service standards ....... 102 Table 4.8 KPIs .................................................................................................... 102 Table 4.9 Communication with customer .......................................................... 102 Table 4.10 Price determination ........................................................................... 103 Table 4.11 Process creation, review and presentation ........................................ 104 Table 4.12 Process creation, review ................................................................... 105 Table 4.13 Visual controls .................................................................................. 106 Table 4.14 Inventory ordering ............................................................................ 107

11
LIST OF ACRONYMS
AC Advisory Circular
AD Airworthiness Directive
AFSO Air Force Smart Operations
AIC Aeronautical Information Circular
AME Aircraft Maintenance Engineer
AMO Approved Maintenance Organisation.
ATA Air Transport Association
CAA Civil Aviation Authority
CAGR Compound Annual Growth Rate
DOC Direct Operating Cost
DTI Department of Trade and Industry (South Africa)
EADS European Aeronautic Defence and Space Company
EASA European Aviation Safety Agency
FAA Federal Aviation Authority (USA)
FIFO First In First Out
GM General Motors
HP Horse Power
IATA International Air Transport Association
ICAO International Civil Aviation Organisation
IMVP International Motor Vehicle Programme
IOSA IATA Operational Safety Audit
ISC Industry Steering Committee
JIT Just In Time
KPI Key Performance Indicator
LAI Lean Advancement Initiative
LEI Lean Enterprise Institute
MIT Massachusetts Institute of Technology
MOP Manual of Procedures
MPD Maintenance Planning Data
MRBR Maintenance Review Board Report

12
MRO Maintenance Repair Organisation
Maintenance, Repair, Overhaul
Maintenance, Repair and Operations
MSG Maintenance Steering Group
NDT Non Destructive Test
NGO Non Governmental Organisation
OEM Original Equipment Manufacturer
OTD On Time Delivery
PAX Passenger
PMA Part Manufacture Approval
R&D Research and Development
RAF Royal Air Force
RCM Reliability Centred Maintenance
RPK Revenue Per Kilometre
RSA Republic of South Africa
SACAA South African Civil Aviation Authority
SADC Southern African Development Community
TAT Turn Around Time
TOC Theory Of Constraints
TPS Toyota Production System
UKLAI United Kingdom Lean Aerospace Initiative
USAF United States Air Force
US DoD United States Department of Defence
VSM Value Stream Mapping
WIP Work In Progress
Note:
AMO is a South African Civil Aviation Authority (SACAA) abbreviation for
Approved Maintenance Organisation (SACAA ACT 1997, Part 1).
Internationally the abbreviation MRO, Maintenance Repair organisation, is used.
As this research report conducted a survey of SACAA AMOs, the abbreviation
AMO is used throughout the report.

13
1 INTRODUCTION TO RESEARCH PROBLEM
1.1 Aircraft operators and maintenance
Aircraft operators compete in an increasing competitive market place. According
to the International Civil Aviation Organisation (ICAO) the airline industry has
undergone major structural transformation within the last decade and continues to
adjust to a dynamic market place. The full service network model of traditional
state owned legacy airlines has come under increased competition due to the
success of low-cost carriers. The adoption of liberalisation programmes,
measures by States to open up the air transport sector and the ease of internet fare
comparison have transformed the operating environment for airlines and their
service providers (ICAO, 2009).
Globally 26 airlines ceased operations in 2009 (Holland and Gubish, 2010).
According to Doan (2010), the entire airline industry since 2001 has cumulated
losses of $56.8 Billion, with only one year of profitability, and therefore the
airlines unrelenting focus on cost continues to drive change. Ecorys (2009, p.30)
argues that “the growing competition in the air transport market will induce a
reduction in margins and a structural change in years to come. Shrinking
profitably from a level, not satisfying to investors seeking a risk premium, in an
environment of more risk adverse players in the financial markets can lead to a
financial crunch (for operators)”.
Against this background, airline operators increasingly perceive aircraft
maintenance as a non core activity. Aircraft maintenance, once normally held in-
house by legacy carriers, is either seen now as a potential profit centre or an
activity to be outsourced to a third party supplier. It is estimated that 54% of
global airframe heavy maintenance, 78% of engine maintenance and 16% of line
maintenance is outsourced (Frost and Sullivan, 2010, cited in Smith, 2010) to
approved maintenance organisations (AMOs). Not just the physical maintenance
is being outsourced to AMOs, but also ancillary services such as planning, record

14
keeping and maintenance accounts. The percentage of outsourced maintenance is
predicted to further increase between now and 2017. Refer Figure 1.1.
Figure 1.1 Maintenance outsourcing 2007 to 2017
(Airline Fleet Management, 2009)
Internationally AMOs are referred to as Maintenance, Repair and Overhaul
organisations (MRO). This research report, however, will use the term AMO as it
is the terminology most commonly used in South Africa.
1.2 Global maintenance market
The total size of the global civil aviation maintenance market in 2010 is estimated
to have been about USD$45bn (Holland, 2011). While there are no accurate
figures available for the number of AMOs in the world, no one company holds a
major share of the global AMO market. Refer Table 1.1.
Table 1.1 AMO companies, global market share
(Smith, 2009)

15
The AMO industry is calculated to have experienced virtually no growth over the
period 2001-2010 due to the effects of global events such as 9/11, both Iraq wars,
fluctuating oil prices and world wide recessions (Holland, 2011). By 2018,
however, the global AMO market is predicted to reach $57 billion, with global
compound annual growth rate (CAGR) of 2.3% from 2009-2014. The period of
2009-2011 being relatively flat with growth thereafter estimated at between 2.9%
and 4.2% (Holland and Gubish, 2010; Holland, 2011).
1.3 African maintenance market
Currently, the African continent’s AMO industry represents 4% of the total
global AMO market (Bekele, 2009). Refer Figure 1.2.
Figure 1.2 Regional AMOs, global market share (2009)
(Frost & Sullivan, cited by Holland and Gubish, 2010)
An increase in African maintenance support requirements is predicated due to an
increase in air travel and resultant demand for aircraft. ICAO reports that African
passenger traffic has grown at 6% per year, for the past three years (Bekele,
2009) and is expected to grow at 7.7% until 2014, the second highest regional
global growth rate after the Middle East’s 9.4% (IATA, 2011). The future
African demand of large aircraft is calculated by Boeing (2010) to rise to 1,130
by 2029 from a figure of 660 in 2009.

16
In addition to new aircraft entering Africa, there are requirements for maintaining
the region’s aging fleet, of which 50% are over 18 years old, but will keep flying
for the foreseeable future (Bekele, 2009). Increased maintenance oversight of this
aging fleet is required to improve flight safety and decrease the current relatively
high African accident rate. African carriers are 2% of global traffic but they
represent 26% of global western-built jet hull losses. While safety in Africa had
been improving, International Air Transport Association (IATA, 2010) figures
show that Africa had an accident rate of 9.94 (measured in hull losses per million
flights of Western-built jet aircraft) in 2009, significantly higher than the 2008
rate of 2.12.
In the short term, Africa is expected to be the world’s second largest growing
region for maintenance expenditure, at 4.2%, after the Middle East, at 6.6%
(Bekele, 2009). Long term, the total AMO market for Africa is set to increase in
monetary terms but its share of the global market is predicated to decline to 3%,
in response to increased competition. Refer Table 1.2.
Table 1.2 Global AMO markets, market share and growth 2010 to 2020
(Doan, 2010)
1.4 Maintenance and Lean
The most important factors in an airline’s selection of an AMO are quality,
turnaround time (TAT) and price, in that order (Canaday, 2010). To satisfy such
requirements many AMOs globally have concentrated on process management to
achieve improvements in terms of operational efficiency through the
implementation of Lean. According to Bozdogan (2010, p.3) Lean comes closest

17
to providing a holistic view of company management systems by embodying a
tightly knit set of mutually supportive precepts and practices driving its central
value creating operations. By comparison Six Sigma, Theory of Constraints
(TOC) and other approaches generally lack such a broad, internally consistent,
holistic conceptual orientation. The trend at many AMOs and as institutionalised
at many US Air Force (USAF) depots is to apply Lean first and then monitor with
Six Sigma when flow is stabilized (Canaday, 2004). According to Arehart (cited
by Holland 2011, p.18) during 2009 and 2010 AMOs were forced to adopt
survival strategies, due to the global recession. “The strong survivors in the
industry made significant cost cutting investments during the downturn cycle.
Process improvement programme like Lean and Six Sigma have helped many
companies compensate for not being able to pass on cost increases to their
customers”.
Womack and Jones (2003, p.15) argue that “Lean provides a way to do more with
less and less – less human effort, less equipment, less time and less space – while
coming closer and closer to providing the customer with exactly what they want”,
while eliminating waste. Such waste reduction not only increases the profitability
of an AMO but also supplies the customer with maintenance of high quality, on
time. A study of the results of Lean implementation in the aerospace industry
found rework and defect reduction of between 20% and 80%, productivity
improvements of 27% to 100% and cost improvements of 11% to 50% (MIT,
cited by Mathaisel, 2005). Lean is recognised by most AMOs globally as
offering competitive advantage in competing for aircraft operator’s maintenance
business.
1.5 South Africa’s maintenance market
South Africa is increasingly becoming important as a regional hub for
maintenance of operators flying in sub-Saharan Africa (Ecorys, 2009). Since
1993 the number of international airlines flying into South Africa has increased
from 12 to more than 70 (Philbin, 2009). South Africa is home to more than 70%
of aviation activities in the Southern African Development Community (SADC)

18
region and its share of the region’s aircraft has grown from 68% to 80%, in the
period 1997 to 2007 (IATA, 2011).
South African AMOs, however, are faced with increasing competition from the
Middle East, Far East and from within Africa. Examples include Ethiopian
Airlines which is currently in the process of expanding its hangar space which it
intends to offer for third party work by 2014 (Bekele, 2011). HNA, the forth
largest Chinese airline group, bought a controlling stake in MyTechnic Turkey,
an AMO developed from the ground-up as a Lean facility. According to Moody
(2010) HNA together with MyTechnic “want to replicate the Lean, Greenfield
model in other world regions, such as Russia, Southeast Asia or Africa.” In their
opinion Africa has no major third-party AMO company and as such it “is a
fantastic market”.
The South African AMOs face competition for African and global airline
maintenance not only from outside the continent but also, possibly in the future,
from within the continent.
1.6 Motivation for research
The current South African Industrial Policy Action Plan (DTI, 2010) has
identified the aerospace industry as a whole (of which AMOs are a part) as a
sector with potential for the development of long-term advanced capabilities.
It is in the commercial interest of South African AMOs to build on their existing
aircraft maintenance infrastructure to maintain and capture a larger share of the
expanding African and global AMO market, in the face of increasing global
competition. In response to increased competition AMOs, in regions such as
Europe, have identified the use of Lean principles from the management level to
the shop floor in a concerted effort to remain competitive in a changing
marketplace (Avitrader, 2010).

19
1.7 Research report question
There appears to be very little publicly available current research regarding Lean
understanding, implementation and experience, within the South African AMO
industry. AMOs globally have recognised Lean implementation as a necessity to
remain competitive. This needs to be investigated and leads to the question of
what is the status of Lean implementation in South African AMOs.
1.6 Research report aim
This research report seeks to determine the status of Lean implementation by
interviewing management personnel of South African AMOs. The interviews are
based on the principles of Lean as described by Womack and Jones in their work
Lean Thinking (2003), first published in 1996 and still a bestseller (Amazon,
2011). It was selected as a basis for this research paper as it provides a concise
overview of the tenets of Lean using five basic principles. According to:
• Lean Flight Initiative (2011), Lean Thinking provides a “good overview
of Lean from an enterprise point of view”.
• The Lean Enterprise Academy UK (2011) the “book is the essential first
step for all those embarking on the Lean path”.
This research report will aim to;
• demonstrate that Lean implementation is possible in AMOs, while
meeting the stringent requirements of original equipment manufacturers
(OEMs) and regulatory authorities, via a literature review,
• show the extent of Lean implementation in AMOs internationally and the
results, via a literature review,
• determine the status and results of Lean implementation in South African
AMOs, via a developed survey,
• determine the understanding of the basic principles of Lean amongst
management of South African AMOs, via a developed survey,
• determine whether any other techniques, have been implemented in
conjunction with or instead of Lean, in South African AMOs and the
reasons why, via a developed survey.

20
1.8 Research report methodology
This research report will use a survey of South African AMOs’ management
personnel, supported by a literature review, to determine the status of Lean
implementation within their facilities. The framework for the literature review
and survey is based on the five principles of Lean as described by Womack and
Jones (2003).
1.9 Research report structure
Chapter 2 reviews literature with regard to:
• industrial theory leading to the formation of Lean by Toyota and its
dissemination globally,
• the principles of Lean, as described by Womack and Jones (2003) with
emphasis on those portions of the principles that are relevant to the AMO
industry,
• aircraft maintenance requirements,
• the history of Lean implementation in AMOs internationally.
Chapter 3 outlines the research methodology and criteria that were adapted for
the selection of the population and sample, covers the collection of the data and
discusses the analysis approach of the data.
Chapter 4 presents the data collected. The data is presented in a categorized
consolidated format based on the themes that formed the research questions that
where presented during the structured interviews that were conducted.
Chapter 5 provides the results of the research as it related to the research
questions and to the literature reviewed.
Chapter 6 articulates the merits of this research and suggests recommendations

21
2 LITERATURE REVIEW
2.1 History of Lean
2.1.1 Introduction
The basic concepts of Lean have a long history throughout the industrial age.
This chapter will explore the evolution of industrial thinking that lead to the
emergence of Lean in Japan and its subsequent introduction to the world.
2.1.2 Industrial processes prior to Ford
Over the long timescale of the development of industrialism, production
processes have developed through a series of stages. Each stage represents
increasing efforts to mechanise and to control more closely the nature and speed
of work (Dicken, 1998). Efficiencies within production can be traced back to the
beginning of the Industrial Revolution, such as Eli Whitney’s manufacture and
design of a rifle with interchangeable parts in 1798 (Bellows, 2009). For the next
100 years manufacturers concentrated on improving individual technologies.
Products moved from one discreet process to the next but the system as a whole
was not scientifically considered.
In the late 1890s the concept of Scientific Management began with the works of
industrial engineers such as Frederick Taylor. At the concept’s core was the
organised study of work, the analysis of work into its simplest elements and the
systematic improvement of the worker’s performance of each of these elements
(Drucker, 1989). Taylor argued against the waste of human effort. He sought to
gather in the great mass of traditional knowledge, which in the past has been in
the heads of the workmen, and reduce it to laws, rules and formulae so as to
produce more work of better quality (Wickens, 1995). Two separate but related
fields of study subsequently emerged, method study and work measurement.
Method study is determining the methods and activities which should be included
22
in tasks. Work measurement is concerned with measuring the time that should be
taken for performing tasks (Slack and Johnston, 2001).
2.1.3 Ford’s processes
From these concepts Henry Ford created the first comprehensive manufacturing
strategy. He combined scientific management, people, machines and tooling by
arranging them in a continuous system. The idea of the assembly line was
suggested to Ford by his production chief Charles Sorensen. Ford hired Detroit
University teacher Clarence Avery, in 1912, to design and perfect the idea, using
the then recently developed principles of Taylor (Harris, 1984). Ford moved
away from the traditional batch, or batch and queue system. In the traditional
system specific tasks are grouped together before going to another queue and
waiting for the next phase of work to be completed. Ford instead focused on the
actual flow of the activities associated with the assembly of motor cars and
introduced the moving assembly line in 1913 (Wickens, 1995). During the first
year of introduction, annual production increased from 120,000 to 130,000 cars,
with price per car decreasing from $850 to $350 (Altfeld, 2010). The
combination of Taylor’s division of labour, the insistence on using the “best
way”, the separation of planning from doing and the moving assembly line
(Wickens,1995) enabled Ford to dominate the automobile market, with a two
thirds market share by the early 1920s (Drucker, 1995).
In the 1890s the bicycle industry had pioneered many of the steel stamping
techniques and dedicated machine tools Ford later used. The transcontinental
railroads had developed many of the organisational mechanisms for managing
large firms. But Ford was the first to perfect the entire system-plant operations,
supplier coordination, management of the entire company, and couple it to a new
conception of the market and a new distribution system (Womack et al., 2007).
Ford not only perfected the interchangeable part, but he also perfected the
interchangeable worker (Womack et al., 2007). The Fordist system was
characterized by very large-scale production units using assembly-line
manufacturing techniques and producing large volumes of standardized products

23
for mass market consumption (Dicken, 1998). The Ford company applied its
assembly line technique to aviation during the second world war and by 1944, on
a 1 ½ mile long assembly line near Detroit, produced 650 B-24 bombers a month
(Harris, 1984).
A central element of the Japanese manufacturing success is built on emulating
Taylor’s and Ford’s control of the process (Wickens, 1995). Taiichi Ohno, the
recognized father of Toyota Production System (TPS) (Sato, 2008)
acknowledged his debt to Henry Ford. But, he argued, Ford’s successors failed to
fine-tune the system and did not adapt properly to changing times (Wickens,
1995).
2.1.4 Ford, Toyota and the emergence of Lean
Toyota originated from the Toyoda Automatic Loom Works, founded by the
inventor Sakichi Toyoda, in 1926. During the global financial crisis of the 1930s
Toyoda produced commercially successful automatic looms. Sakichi’s son,
Kiichiro, however realised that to stay competitive their manufacturing
techniques needed to improve. Kiichiro did away with small lot production. He
developed a production system to “make the right parts at the right time and in
the right amount every day” (Sato, 2008, p.66) and called the system Just In Time
(JIT). Unfortunately JIT’s first introduction was not entirely successful, due to
parts supply problems as a result of the Chinese war in the Pacific.
Kiichiro foresaw the future global mass appeal of the automobile during a trip to
New York. He also realised that the production techniques of looms, parts and
machinery for the textile industry could be applied to producing automobile
engines. During 1931 he began experimental production of a 4hp engine. By
1933 an automobile division, within Toyoda Automatic Loom works, was created
and in 1937 Toyota was established. By 1939 Toyota was discussing joint
production of trucks with Ford but World War II stopped further discussion.

24
Following the war Toyota independently developed a compact car in 1947 but it
was not a commercial success. Kiichiro realised it would be hopeless to try to
make world-class vehicles at Japan’s then current level of technology and by
1949 Toyota was in financial difficulties. Toyota re-entered negotiations with
Ford and contracts where approaching closure when war broke out in Korea. As a
result of the Korean War the US government passed legislation prohibiting direct
investment by US companies in foreign countries and imposed a ban on essential
technical experts from travelling abroad from the USA. Ford, however, agreed to
a portion of the negotiations that included “Ford shall accept two engineers from
Toyota for training” (Sato, 2008, p.55). Toyota choose to send Kiichiro’s cousin
Eiji Toyoda and a graduate, Shoichi Saito, to Ford.
Upon returning to Japan the two implemented what they had learned at Ford. Eiji
created an in-house “Creative Ideas Committee” to ensure that Ford’s suggestion
system became firmly entrenched as part of Toyota’s own system. According to
Sato (2008) all the prototypical components of TPS, including quality control and
a suggestion system, originated from Ford. In this sense Ford was undeniable
Toyota’s mentor.
Toyota launched a five year modernisation plan in 1951 amounting to $12.78
million. The banks, however, preferred to lend to the Toyoda Automatic Loom
Works, as opposed to the Toyota automobile division. Thereafter Toyota’s
monetary philosophy was to continuously improve the company’s financial
standing by striving to accumulate wealth, while skimping by on a bare minimum
of resources. This was despite an increase in orders for trucks by the American
military and improved cash flow, as a result of the Korean War. Thus the
philosophy of waste reduction was set, which continues to survive at Toyota
today (Sato, 2008).
The JIT system, first introduced at the pre war loom works, was revived by plant
manager, Taichi Ohni, when a class mate of his returned from the USA and
described the successful introduction of supermarkets in the USA. Ohni realised

25
that the production system should be reversed from the conventional approach of
supply of materials to downstream processes, to that where the downstream
process would pull the parts at the right time and in the right amount, such as a
shopper would do. Seen in this way, the natural thing would be for the upstream
process to make only what is pulled by downstream processes. One could then
use an order slip, indicating how much of what was needed, as a means for
linking multiple processes together. This slip became known as the “Kanban”.
This system originally was called the Ohno System but once supermarkets came
to Japan, it became to be known as the Supermarket system. The name was then
changed to the Toyota system in the 1960s, and subsequently changed again to
the TPS after the first oil crisis (Sato, 2008).
2.1.5 Lean’s introduction to the world
The success of TPS is evident when comparing it against General Motors (GM).
After nearly 100 years of dominance of market share GM was overtaken by
Toyota in the early 2000s. Piepenbrock (2009) shows that quantitatively over the
long term (1980-2010) Toyota’s revenue CAGR is 10% compared to GM’s
revenue CAGR of 4%. Toyota’s average profitability is 5%, against GM’s -1%.
Refer Figures 2.1 and 2.2.
Figure 2.1 Comparison of Toyota and GM revenue 1980 to 2009
(Piepenbrock, 2009)

26
Figure 2.2 Comparison of Toyota and GM net income/revenue 1980 to 2009
(Piepenbrock, 2009)
Globally such success by Toyota was noted, in addition to the increasing market
dominance of Japanese firms in the 1980s of other sectors, such as electronics. In
response, the International Motor Vehicle Programme (IMVP) was founded at
Massachusetts Institute of Technology (MIT) in 1985. According to Womack et
al. (2007) it was created to explore creative mechanisms for industry-
government-university interaction on an international basis in order to understand
the fundamental forces of industrial change.
The IMVP provided a wealth of benchmarking data to show there is a better way
to organize and manage customer relations, the supply chain, product
development and production operations using methods pioneered by Toyota
(Womack and Jones, 2003). Comparison of GM’s mass production techniques
versus Toyota’s TPS in the assembly of motor cars demonstrated the competitive
advantage of Toyota, as shown in Table 2.1.
Table 2.1 Comparison of GM mass production Vs Toyota Lean production figures
(IMVP cited by Agripino et al. 2002)

27
Based on IMVP’s findings, in 1990, a comprehensive study of the world’s car
manufacturers entitled The Machine that Changed the World (1990) by James
Womack, Dan Jones and Daniel Roos, was published. The book popularised the
term Lean globally, to highlight the elimination of waste in Japanese companies
(Wickens, 1995). The term Lean was coined by IMVP researcher and factory
specialist John Krafcik, the first American engineer hired for a Toyota-General
Motors joint venture.
Readers of The Machine that Changed the World (Womack et al., 1990) wanted
to implement Lean production techniques and the authors perceived the existence
of a need to set out the key principles of Lean to guide their actions during
implementation. This resulted in the 1996 publication of Lean Thinking (1996) by
James Womack and Daniel Jones which detailed the principles of Lean.
2.1.6 Lean and the Toyota recall of 2010
Toyota in early 2010 was involved in a global mass recall of its vehicles. This
was due to perceived unintended accelerations because of design faults in the
electronics system (NASA, 2011). Investigations have found that driver error and
“pedal entrapment by a floor mat” (NTSB 2011, p.ix) where the primary cause of
the unintended accelerations. During the investigations some questioned whether
the entire Toyota associated Lean philosophy was at fault. According to an
Economist article (2010), however, there is a widespread belief within the
automotive industry that Toyota itself was the author of its own misfortunes.
During Mr. Toyoda’s 2010 testimony, to the US House oversight committee, he
acknowledged that in Toyota’s pursuit of growth his firm stretched its Lean
philosophy close to breaking point. Toyota became “confused” about some of the
principles that first made Toyota great: its focus on putting customer satisfaction
above all else and its ability “to stop, think and make improvements”. Womack,
in the same article, dates the origin of the crisis to 2002. He believes that when
Toyota set the goal of raising its market share from 11% to 15%, the target was
“totally irrelevant to any customer” and was “just driven by ego”. By the middle
of the decade recalls of Toyota’s vehicles were increasing at such a sufficiently

28
alarming rate that Mr. Toyoda’s predecessor demanded a renewed emphasis on
quality control. He was, however, ignored in pursuit of the undeclared goal of
overtaking GM, so as to become the world’s largest car maker.
The result is that until recently Toyota was a peerless exemplar but for now is
seen as a warning to deviating from the core Lean philosophy of supplying value
to the customer.
2.1.7 Summary
The Economist (2010) identified Lean as a managerial paradigm originating in
Japan in the 1960s, preceded by the rise of mass production in American in the
1900s. Kiichiro’s JIT, along with the logical layout of machinery, which Eiji had
observed at Ford and the increased efficiency of material handling, as conceived
by Saito, came to form the basis of TPS (Sato, 2008). This methodology was
thereafter termed “Lean”, following the publication of The Machine that changed
the World (Womack et al., 2007) with the principles of Lean being set out in the
ensuing work “Lean Thinking” (Womack and Jones, 1996).
This research report will use the principles of Lean, as set out in “Lean Thinking”
(Womack and Jones, 1996), as a framework to:
• explain Lean,
• demonstrate the results and extent of Lean implementation in AMOs
globally,
• assess South African AMOs understanding of Lean,
• determine the implementation status of Lean within South African AMOs.

29
2.2 Lean theory
2.2.1 Introduction
Lean thinking is a highly evolved method of managing an organisation to
improve the productivity, efficiency and quality of its product or services.
Companies implementing Lean report significant productivity gains and overall
effectiveness with their specific entities (ITC, 2004, P.1) and it’s implementation
has also been recognised by many AMO’s as being necessary to remain
competitive (Holland and Gubish, 2010).
This chapter will explore the literature available on Lean, based on the principles
of Lean as detailed by Womack and Jones (2003). These principles will provide a
framework for the survey to be conducted to determine the status of Lean
implementation within South African AMOs. This research report is not intended
to be a complete analysis of Lean, a literature review of all aspects of Lean or a
guide on how to implement Lean within AMOs. As each company is unique, it
will invariably implement Lean techniques as it sees fit and applicable.
This chapter will conclude with a comparison between Lean, Six Sigma and the
Theory of Constraints. The survey will question the interviewees on their basic
understanding or implementation of these techniques, so as to determine if and
why these techniques where implemented instead of or in conjunction with Lean.
2.2.2 Overview of Lean
At the heart of Lean is the determination of value. Value is defined as form,
feature or function for which a customer is willing to pay, and any processes that
do not add value are deemed as waste (Kang, 2007). The basic philosophy of
Lean is to eliminate waste and add value to the customer. Some may say this is
common sense, however according to Goldratt (1992, p. vi) “the phenomena we
see daily in our plants (factories) is so flawless that you call it common sense.
Incidentally common sense is not so common and is the highest price we give to
a chain of logical conclusions. What is needed is just the courage to face

30
inconsistencies and to avoid running away from them just because “that’s the
way it was always done”. Lean is a means to face these inconsistencies.
Womack et al. (2007, p.11) state that “Lean combines the advantages of craft and
mass production, while avoiding the high cost of the former and the rigidity of
the latter. The craft producer uses highly skilled workers and simple but flexible
tools to make exactly what the customer asks for, one item at a time, with the
result being generally expensive goods. The mass producer uses narrowly skilled
professionals to design products made by unskilled or semiskilled workers
tending expensive, single purpose machines. These churn out standardized
products in very high volume, the result being lower costs but at the expense of
variety”. Lean combines the best features of both productions methods with
nothing being sent to the next step until it is needed. Things are pulled, not
pushed, through the process, with the customer being the ultimate puller
(Laurenzo, 2005).
Figure 2.3 Evolution of dominant production strategies
(Piepenbrock, 2009, p.536)
The Lean philosophy is about delivering the right value, at the right time and at
the right place. Value is delivered continuously, with customers pulling value as
they require. A Lean company is flexible and responsive to changing customer
needs. Never satisfied with the current state, the Lean company is continuously
improving, always striving for perfection (Jobo, 2003). To be Lean requires,
according to Liker (2004, p.7);
• a way of thinking that focuses on making the product flow through value
adding processes without interruption,

31
• a “pull” system that cascades back from customer demand by replenishing
only that which the next operation takes away at short intervals,
• a culture in which everyone is striving continuously to improve.
The book “Lean Thinking”, (Womack and Jones, 2003), which forms the
framework of this research report and survey, further details Lean according to
five principles.
2.2.3 The five Lean principles
The five Lean principles, as set out by Womack and Jones (2003) and explained
by Hines and Taylor (2000) are;
• Principle 1 Value – Specify what does and does not create value from the
customer’s perspective and not from the perspective of
individual firms, functions and departments,
• Principle 2 Value Stream –Identify all the steps necessary to design, order
and produce the product across the whole value stream to
highlight non value adding waste,
• Principle 3 Flow – Make those actions that create value flow without
interruption, detours, backflows, waiting or scrap,
• Principle 4 Pull – Only make what is pulled by the customer,
• Principle 5 Perfection – Strive for perfection by continually removing
successive layers of waste as they are uncovered.
Only those portions of the Lean principles, which an understanding of which are
required for comprehending the research report’s survey questions, are explained
in this Chapter. The description of each Lean principle will conclude with an
outline of what the survey of this research report will seek to determine regarding
that principle, within the South African AMOs surveyed.
Principle 1: Value
The critical starting point for Lean thinking is that of Value. Value can only be
defined by the ultimate customer and it’s only meaningful when expressed in

32
terms of a specific product. Value is created by the producer (Womack and Jones,
2003) and needs to be defined in terms of the customer expectations of the
product. These expectations can be broken down in different ways, but almost
always include as a minimum; product quality, delivery schedule, performance
and target costs (LAI, 2010). Specifying value accurately is the critical first step
in Lean thing (Womack and Jones, 2003, p.19) using the concepts of;
• target cost,
• ultimate customer and
• Muda.
Target Cost. According to Womack and Jones (2003, p.35) the target cost is
based on the amount of resources and effort required to make a product of given
specification and capabilities if all the visible waste is removed from the process.
The process is a series of activity steps that move inventory from one step to the
next, to transform it into the intended output. The output could be physical item
or a service (Sondalini, 2009). A process is made Lean by re-engineering it to
eliminate steps that add no value to the end product or by combining steps to save
time (Lopez, 2006).
Ultimate Customer. A prerequisite of correctly defining which operations are
value-adding, and which are not, is a clear definition of who the ultimate
customer is (Crabill et al., 2000). There may not only be one ultimate customer
but several, therefore it is necessary to consider their collective value system
(Liker, 2004, p.279). For an AMO the ultimate customers could be considered as
the aircraft operator who wishes the maintenance to be done on time and within
budget. The pilot who requires that all the equipment operates within
specification at all times. The passenger who requires the aircraft to depart on
time and that the entertainment system operates. The airworthiness authorities
and OEMs, which have standards to be adhered to.
A company that is Lean knows what the ultimate customer requires, verifies that
the customer receives what was requested and thereafter aligns the company

33
performance targets against that which the customer perceives as value, not what
the company perceives as value. Continuous communication with the customer
regarding their needs is therefore required. Drucker states (1989, p.53) “what the
customer considers value is so complicated that it can only be answered by the
customer himself. Management should not even try to guess at it – it should
always go to the customer in a systematic quest for the answer”.
Muda and the 3Ms. Muda is the Japanese word for waste and is central to
understanding value. There are three different types of value activity within an
organisation (Hines and Taylor, 2000, p.10);
• value adding activity - those activities that, in the eyes of the final
customer, make a product or service more valuable,
• necessary non value adding - those activities that, in the eyes of the
customer, do not make a product or service more valuable but are
necessary or mandated by law,
• non value adding activity - those activities that, in the eyes of the
customer, do not make a product or service more valuable and are not
necessary. Lean is the removal of these non value adding activities.
Improved productivity leads to a leaner operation, which in turn helps to expose
further Muda. Waste enters the system when requirements of internal or
intermediate customers are mistakenly taken for that of the ultimate user (Hines
and Taylor, 2000, p.10). These wastes are normally categorized into the Seven
Mudas, as identified by Shigeo Shingo, as part of TPS.

34
Table 2.2 Seven Muda types
Muda Type Description
Muda of Inventory Carrying more materials, parts or information necessary at any given time
Muda of Motion Any extra human movement in production that adds no value to the
product
Muda of Over Production Making or processing more, earlier, or faster than is required for the next
stage in the production process
Muda of Waiting Idle time where a worker is awaiting for other items, tasks to be performed
before proceeding
Muda in Processing Any work or process that does not add customer value to the product
Muda of Correction Quality issues or incorrect/incomplete information that results in re work,
repair or scrapping of items/processes
Muda of Transportation Excess or unnecessary movement of parts/information
(Hines and Taylor, 2000, p.9)
An example of Muda within the aviation industry was that as shown in an
analysis of the processes used in applying the surface finish to ensure the stealth
capability of the B-2 bomber. The processes required the use of consumables,
such as cut tape and adhesives. To obtain these items the operators had to walk
excessive distances (Muda of Transportation, Muda of Motion) to obtain each
individual item stored far from location of work (Muda of Processing) and then
wait for the material handler to deliver the consumables (Muda of Waiting).
Following a Lean initiative, kits of the consumables were pre-created and placed
at the workstations. The operators then called for the prepared kits ahead of time,
so orders could be placed for exact amounts at the required time. The result was
the elimination of the Mudas of Over Production and Inventory by logistics and
the reduction of the Mudas of Transportation and Motions by the operators
(Dobbs, n.d.).
Figure 2.4 B-2 Bomber stealth materials handling during production
(Dobbs, n.d.)

35
Liker (2004, p.114) argues that exclusively focusing on the seven wastes of muda
can actually hurt the productivity of people and the production system. When
considering Muda, the concepts of Muri, Mura need to be also taken into account,
which are defined as by Liker (2004) as;
• Muri - overburdening people or equipment. Overburdening people results
on safety and quality problems. Overburdening equipment causes
breakdowns and defects,
• Mura – Unevenness. Eliminating unevenness (Mura) in production levels
due to production schedules or production volumes creates a balances
Lean flow of work.
Collectively Muda, Muri and Mura are referred to as the 3Ms.
Figure 2.5 The 3Ms: Muda, Muri, Mura
(Liker, 2004, p.115)
Some production managers are able to lower the cost, raise the quality and
improve the delivery of their products all at the same time, even while increasing
the flexibility of their production processes. The reason is that these firms
understand that high cost, low quality, poor delivery and limited flexibility are
really a single problem, not four separate ones. They are all manifestations of
waste. If waste, is eliminated in an appropriate way, then all four criteria will be
improved simultaneously (Robinson, 1993, p.3-4.1).
Determining Value, with regard to AMOs encompasses Target Costs, Ultimate
Customer and the 3Ms. The survey in this research report will determine the
understanding of South African AMOs with regard to;
• who their ultimate customer is,

36
• how they determine their customer’s needs and expectations,
• how they align their performance to that of delivering value to the
customer,
• how they determine their target costs and thereafter prices charged to
customers,
• their understanding of Muda.
Principle 2: Value Stream
The value stream is the entire set of processes or activities performed to
transform the products and services into whatever is required by the customer
(Malik, 2009). These processes are a limited number of key activities, not
everything a company does, but those that are the core activities it undertakes and
which it therefore must get right (Hines and Taylor, 2000), in order to provide
value to the ultimate customer.
The value stream is the process involved in producing a product or service. It is
the set of all the specific actions required to bring a specific product (whether a
good, a service or increasingly, a combination of the two) through the three
critical management tasks of any business. These being, according to Womack
and Jones (2003, p.19);
• the problem solving task running from concept through detailed design
and engineering to production launch,
• the information management task running from order taking through
detailed scheduling to delivery,
• the physical transformation task preceding from raw material to a finished
product in the hands of the customer.
Identifying the entire value stream exposes Muda. Processes in Lean are thought
of as value streams (Kang, 2007). All business processes have a series of inputs
and outputs and a number of steps, tasks or activities that convert these inputs
into a number of outputs. They typically run across several departments in a
business (Hines and Taylor, 2000). A simple value stream is shown in Figure 2.6.

37
Figure 2.6 Simple value stream pictogram
All participants in a value stream must be able to see clearly whether their
collective efforts are adding value (Womack and Jones, 2003). To achieve this, a
technique called Value Stream Mapping (VSM) is employed.
Value Stream Mapping. According to (Spear, 2009) the common problem for
companies is that they produce complex products or provide complex services,
requiring many varied forms of skill and expertise. The more numerous and
varied the people, machines and material involved, the more ways they can
interact with each other, often with unanticipated results. It is in designing and
operating the complex work that determines the value stream.
The creation of a visual icon generated value stream map or chart serves to
identify when and where value is being added and where waste is occurring along
the entire path of the product (Crabill et al., 2000). Many companies just manage
individual functions and specialities (Spear, 2009), not the entire process. VSM is
an overarching tool resulting in a picture of the entire process, including both
value and non value adding activities. It is therefore a visual representation of all
steps, tasks or activities in a process and documents their sequence from start to
finish. Mapping helps in the understanding of the sources of waste within the
value stream, so that the right Lean techniques are implemented at the right
places for bigger and more sustainable impact. Mapping enables visualization of
38
improvements to the overall process, instead of spot improvements to single
processes. It also assists in gaining a better understanding of the linkages between
material and information flow. It creates the basis for effective Lean
implementation plan by designing how material and information flow should
work (Rother and Shook, 2003).
A flow diagram showing the process is drawn to reflect the current state of the
operation. The process is analysed for opportunities to drastically reduce and
simplify it to the fewest possible actions necessary. By reducing wastefulness the
proportion of value adding time in the whole process rises and the process speed
is increased. This makes the process more effective (the right things are being
done) and more efficient (needing fewer resources) (Sondalini, 2009).
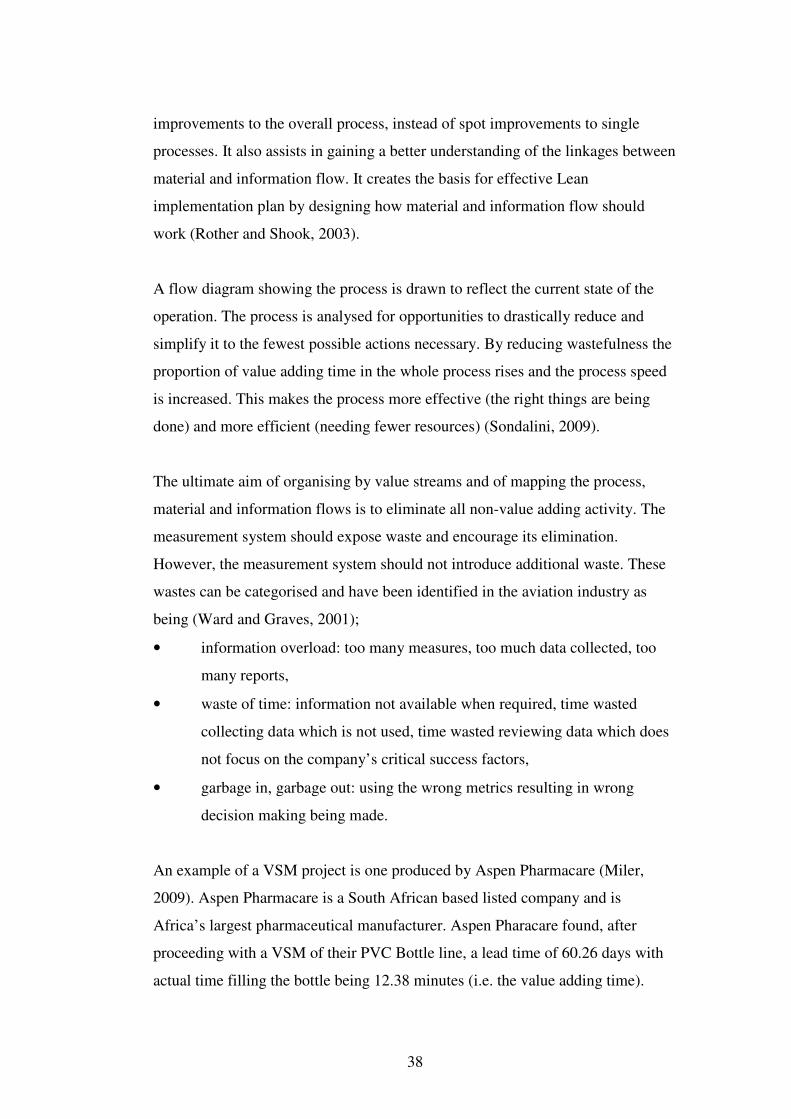
The ultimate aim of organising by value streams and of mapping the process,
material and information flows is to eliminate all non-value adding activity. The
measurement system should expose waste and encourage its elimination.
However, the measurement system should not introduce additional waste. These
wastes can be categorised and have been identified in the aviation industry as
being (Ward and Graves, 2001);
• information overload: too many measures, too much data collected, too
many reports,
• waste of time: information not available when required, time wasted
collecting data which is not used, time wasted reviewing data which does
not focus on the company’s critical success factors,
• garbage in, garbage out: using the wrong metrics resulting in wrong
decision making being made.
An example of a VSM project is one produced by Aspen Pharmacare (Miler,
2009). Aspen Pharmacare is a South African based listed company and is
Africa’s largest pharmaceutical manufacturer. Aspen Pharacare found, after
proceeding with a VSM of their PVC Bottle line, a lead time of 60.26 days with
actual time filling the bottle being 12.38 minutes (i.e. the value adding time).

39
VSM revealed Muda along each step of the process, as shown in Figure 2.7.
Their aim is to achieve a lead time of 5.9 days
Figure 2.7 Aspen Pharmacare VSM of current processes
(Miler, 2009)
Once value has been precisely specified, the value stream for a specific product
fully mapped and obviously wasteful steps eliminated, the aim is to make the
remaining value creating steps flow (Womack and Jones, 2003). VSM does not
equal “flow analysis” or the process of designing and creating optimum product
flows but is a simple tool to help understand how flow currently operates. VSM
also helps guide through the process of analysis to improve those existing flows
and design better ones in future. VSM is just a tool to help people look at value
streams rather than discrete operations (Shook, n.d.). This can be seen in a rough
sketch plan, shown in Figure 2.8, created by Aspen Pharmacare to achieve their
aim of a 5.9 day lead time.
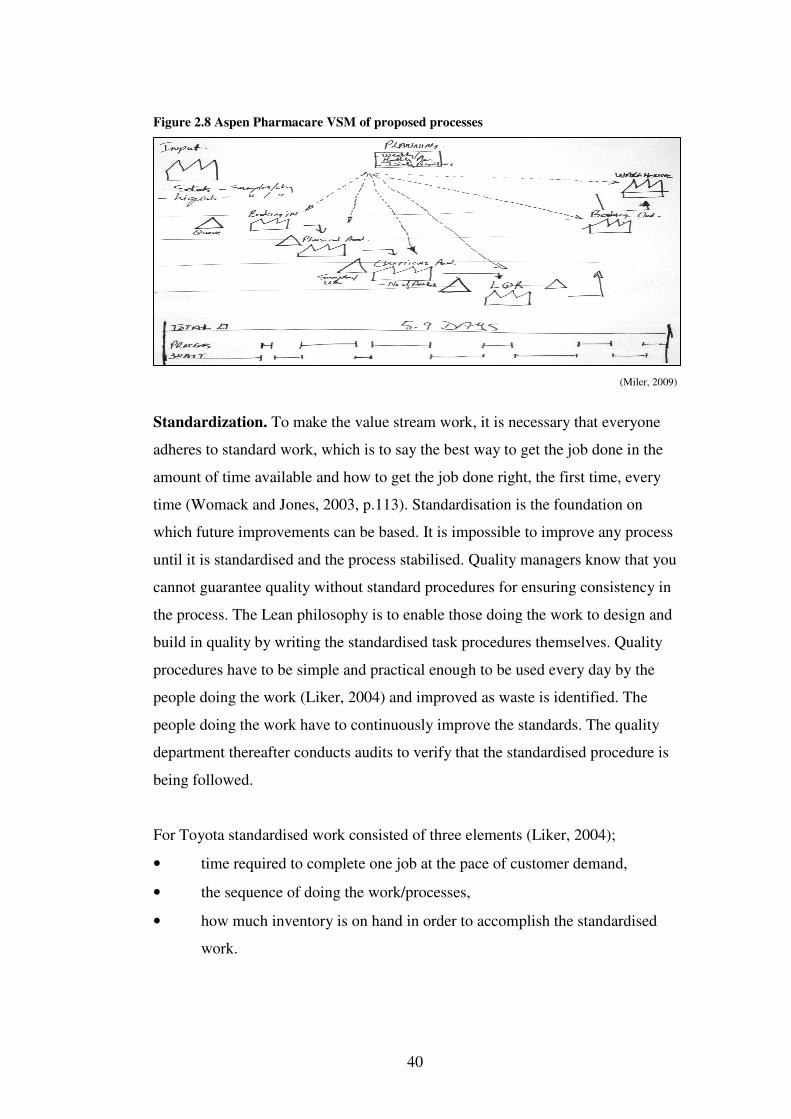
40
Figure 2.8 Aspen Pharmacare VSM of proposed processes
(Miler, 2009)
Standardization. To make the value stream work, it is necessary that everyone
adheres to standard work, which is to say the best way to get the job done in the
amount of time available and how to get the job done right, the first time, every
time (Womack and Jones, 2003, p.113). Standardisation is the foundation on
which future improvements can be based. It is impossible to improve any process
until it is standardised and the process stabilised. Quality managers know that you
cannot guarantee quality without standard procedures for ensuring consistency in
the process. The Lean philosophy is to enable those doing the work to design and
build in quality by writing the standardised task procedures themselves. Quality
procedures have to be simple and practical enough to be used every day by the
people doing the work (Liker, 2004) and improved as waste is identified. The
people doing the work have to continuously improve the standards. The quality
department thereafter conducts audits to verify that the standardised procedure is
being followed.
For Toyota standardised work consisted of three elements (Liker, 2004);
• time required to complete one job at the pace of customer demand,
• the sequence of doing the work/processes,
• how much inventory is on hand in order to accomplish the standardised
work.

41
Within AMOs standardisation of the complete maintenance check, is often
referred to as pulse maintenance. An example being that in the first maintenance
bay (pulse one) parts are removed from an aircraft and sent to work shops for
repair. The aircraft is then moved to maintenance bay two (pulse two) for
modifications to be done by another crew according to the customer requirement.
In the third bay (pulse three) the removed and repaired parts are reassembled and
reinstalled by the crew who originally removed them. Pulse four is aircraft
painting and pulse five, is final testing of the aircraft (Malarvozhi, 2009).
The survey of this research report will determine the understanding of South
African AMOs with regard to;
• the extent of value stream mapping performed,
• implementation of processes standardisation.
Standardisation and VSM form the basis of the third and fourth Lean principles;
flow and pull.
Principle 3: Flow
Batch and queue is the mass production technique of making large lots of a part
and then sending the batch to wait in the queue before the next operation in the
production process. Flow is the progressive achievement of tasks along the value
stream so that a product proceeds from design to launch, order to delivery, and
raw materials to delivery into the hands of the customer with no stoppages, scrap
or backflows (Womack and Jones, 2003, p.347). Thereby flow is the continuous
movement of inventory from step to step in a smooth, steady pattern and level
rate. Toyota says that when the process is right, production “flows like water”
(Sondalini, 2009).
The flow concept has been employed in the construction of the Airbus
Deutschland, Hamburg facility. According to Altfeld (2010, p.19), “the flow
assembly leads to structured and transparent processes and therefore increases
quality of today’s and future products”.

42
Figure 2.9 Airbus Deutschland aft fuselage flow assembly line
(Altfeld, 2010)
To further understand Flow, an understanding of the following concepts is
necessary;
• takt time,
• standard work,
• visual control.
All together Takt time, standard work and visual control give an immediate sense
of how the work is flowing (Womack and Jones, 2003).
Takt Time
A key technique in implementing flow is the concept of Takt time, which
precisely synchronizes the rate of production to the rate of demand by the
customer. Takt time is the available production time divided by the rate of
customer demand and sets the pace of production to match the rate of customer
demand. For example if the customer demands 240 widgets per day and the
factory operates 480 minutes per day, Takt time is two minutes (Womack and
Jones , 2003).
Figure 2.10 Takt Time
(Menschner, 2008)

43
The purpose of Takt time is to serve as a management tool to indicate at a glance
whether production is ahead or behind. It also serves as an alignment tool,
aligning proceeding with subsequent processes, aligning resource requirements
with demand, aligning corporate functions with real time production needs
(Shook, n.d.).
It has been shown, in the aviation industry, that the best way to eliminate waste is
to achieve the Lean principle of continuous flow. Flow is created at the cell level
by using One Piece Flow Techniques. This means each person or process works
on one piece at a time before it is pulled downstream. Flow is continued at the
value stream level by connecting processes or cells with first in, first out (FIFO)
systems (McAuliffe, 2007).
A proper cell layout is critical in attaining flexibility in the number of workers
within a workshop to adapt to demand changes. The recommended format of a
cell is the “U-turn” layout (Crabill et al., 2000). This has been achieved on the
Eurocopter AS350 & AS355 helicopter main gearbox assembly line, as shown in
Figure 2.11. The result is a reduction of Takt time of 33% and an increase in
annual unit production of 42% (Doulle, 2008).
Figure 2.11 Eurocopter main gear box U cell assembly line
Position of the main gear box on
AS350/355 helicopter
U shaped counter clockwise cell, AS350/355 main
gearbox assembly
(Doulle, 2008)
In the Lean company, the production slots created by the Takt time calculations
are clearly posted, so everyone can see where production stands at every moment
(Womack and Jones, 2003). This is normally referred to as visual control and is

44
essential to show what has been achieved, how to improve, how work should be
done and whether it is deviating from the standard (Howard, 2009; Liker, 2004).
Visual Controls. Visual controls are simple, clear and concise indicators which
show at a glance the status of a machine, a work order, a tool, a bin, personnel
resources or an entire plant in connection with a plan or defined objective. It
might show where items belong, how many items belong there, what the standard
procedures for doing something are, the status of work in process and many other
types of information critical to the flow of work activities (Liker, 2004). Visual
storeroom controls use containers that hold known quantities. Tool shadow
boards indicate tool availability. Schedule boards, show the type of work required
for a particular machine, due date and who is responsible (Finigan and
Humphries, 2006). These combined practices create a better and easier working
environment with a logical order that is maintained on a daily basis (Haque,
2001).
5Ss. Visual controls include the “5Ss”. The concept of 5S is to organize and clean
the workspace in order to improve safety, efficiency and effectiveness, as well as
to eliminate waste. The 5Ss are sorting, sweeping, standardizing, simplifying and
self-disciple. According to Boeing (Sabbagh, 1996, p.23) “it’s everything from
what you have on your desk, how clean the office is, how clean the workstation is
and so on, and it’s a matter of “let’s just discipline ourselves in everything we
do””.
Originally the 5Ss of good housekeeping are derived from five Japanese words
which have been given English counterparts as shown in Table 2.3. Some
aviation facilities, such as Pratt & Whitney, have added a sixth S, that of Safety
(Moorman, 2006).

45
Table 2.3 The 5Ss
S Type Description
Seiri, (Sort)
Refers to sorting through all the tools, materials etc in the work area and keeping
only essential items. This leads to fewer hazards and less clutter to interfere with
productive work.
Seiton, (Straighten)
Focuses on the need for an orderly workplace. Tools, equipment and materials
must be systematically arranged for easiest and most efficient access. There must
be a place for everything and everything must be in its place.
Sesiso, (Scrub) Indicates the need to keep the workplace clean as well as neat. At the end of
every shift the work area is cleaned up and everything is restored in its place.
Mu Seiketsu, (Systematize)
This allows for control and consistency, basic housekeeping standards apply
everywhere in the facility. Everybody knows exactly what his or her
responsibilities are. Housekeeping duties are part of regular work routines.
Shitsuke, (Standardise) Refers to maintaining standards and keeping the facility in safe and efficient
orders day after day, year after year.
(Haque, 2001)
Combined together; Takt time, standard work and visual control, give an
immediate sense of how the work is preceding (Womack and Jones, 2003). The
UK Lean Aerospace Initiative (Haque, 2001), identified a common weakness in
companies. They do not measure flow but focus instead on functional measures.
As a result they fail to integrate processes along the supply chain in the
measurement system. Time reductions must be continually monitored as
improvement will indicate improved process flow.
The survey of this research report will determine the understanding of South
African AMOs with regard to;
• Takt time,
• their use of standardised procedures,
• their use of visual controls.
Principle 4: Pull
As flow is introduced, the customers pull value from the next upstream activity.
When a process is capable, adequate and available with good flow, it is possible
to move to a system that is pulled by demand, rather than pushed (Howard,
2009). “Pull” in simplest terms means that no one stream should produce a good
or service until the customer downstream asks for it (Womack and Jones, 2003).

46
In a production system, therefore, a pull system is a method of managing work-
in-progress (WIP).
Figure 2.12 Push & Pull visual comparison
(Menschner, 2008)
A pull system only releases raw materials or WIP once the preceding process step
completes the WIP it is currently working on. This method of WIP management
is also called Kanban (Rouke, 2005, p.13).
Kanban. Kanban is a Japanese term meaning “card” or a visible signal. It is an
inventory replenishment system associated with JIT, which was developed by
Toyota (Crabill, et al., 2000). The system triggers a visual demand signal to pull
raw material or work in process inventory forward, into the next phase. Kanban
can also be extended to external suppliers. Kanban automation connects the
system so that an update in one place is an update across the system. Ideally this
ensures a manufacturing cell is never unnecessarily experiencing downtime
(Viswanathan and Littlefield, 2009).
Kanban control does not mean that forecasting is not applicable. Research by the
Aberdeen Group (Viswanathan and Littlefield, 2009) has shown that best in class
companies are differentiating themselves by being demand driven but also by
predicting demand based on such factors as promotions, seasonality and other
events. With information on the next few months, best in class companies are
able to take corrective action on supply and planned production. Forecasts are
sometimes thought of as a “push” activity but without a good forecast that
incorporates forward looking events, operations are blind to the supply, labour
and up-time requirements that lie around the bend. “Pull” manufacturing

47
execution requires certain triggers that are both plant floor and supplier based.
Demand volatility becomes a major concern for suppliers unless customer
demand is accurately considered while creating replenishment signals to
customers.
Aircraft maintenance tasks and operation allow prediction of AMO demand.
AMO’s maintenance tasks are scheduled based on the aircraft operating hours,
landings and time in service according to a civil aviation authority (CAA)
approved maintenance schedule. The aircraft operations are dependant on flight
schedules which vary according to estimated customer demand. This will be
further detailed in chapter 2.3.
The survey of this research report will determine the understanding of South
African AMOs with regard to;
• how they forecast maintenance check requirements,
• how they determine adequate parts requirements to perform such
maintenance,
• how they determine their inventory levels and demand,
• how and how often they review their WIP.
Principle 5: Perfection
At every Lean principle it has been necessary to see the value stream, to see the
flow of value, to see value being pulled by the customer. The final form of seeing
is to bring perfection into clear view so the objective of improvement is visible
and real to the whole company (Womack and Jones, 2003).
Lean thinking is concerned with the application of perfection in every aspect of
each value stream (Ward and Graves, 2001). Perfection is the complete
elimination of Muda so that all activities along the value stream create value
(Womack and Jones, 2003, p.350). Companies should compete against
perfection, not just their current competitors, so they need to be able to gauge the
gap from current reality to perfection (Womack and Jones, 2003, p.94). The

48
pursuit of perfection is best summed up by Menschner (2008) as, “better than
yesterday, worse than tomorrow”.
To achieve such perfection a company needs to set goals and communicate those
goals throughout the company. The biggest problem with communication is the
illusion that it has occurred. According to Boeing management, “we think when
we express ourselves that, because we generally understand what we think, the
person we’re expressing it to understands it in the same way. When you’re
creating something, you have to recognize that it’s the interaction that will allow
everybody to come to a fundamental understanding of what it’s supposed to do,
how it’s going to be made” (Sabbagh, 1996, p.24).
Using Lean terminology the pursuit of perfection can be divided into two actions;
Relentless Reflection (Hansei) and Continuous Improvement (Kaizen).
Hansei. One of the techniques of Hansei is the 5 Why’s. Taiichi Ohno’s practice
of asking “why” five times is a common technique whenever a problem is
encountered, in order to identify the root cause of the problem so that effective
countermeasures could be developed and implemented (Womack and Jones,
2003). At Toyota teamwork never overshadows individual accountability.
Individual accountability is not about blame and punishment but about learning
and growing. Even if you do a good job, there is a Hansei (Liker, 2004).
Kaizen. There are two levels of kaizen;
• system or flow kaizen focuses on the overall value stream,
• process kaizen focuses on individual processes.
A Kaizen workshop is a group activity in which a team identifies and implements
significant improvements in a process to eliminate Muda. Front line workers
make the improvements to their own jobs and their supervisors provide direction
and assistance as teachers (Spear and Bowen, 1999, p.104). After improvements,
the process is standardised. The underlying assumption is that small

49
improvements, continuously made to a process, will lead to significant positive
change over time (Crabill et al., 2000).
Benchmarking. In the pursuit of perfection many companies benchmark
themselves against one another. According to Womack and Jones (2003),
however, Lean bench markers who discover their performance is superior to their
competitors have a natural tendency to relax. They therefore advise that Lean
firms should only complete against perfection by identifying all activities that are
Muda and eliminating them. Womack and Jones (2003) believe that
benchmarking is thus a waste of time for managers that understand Lean
thinking.
The survey of this research report will determine with regard of South African
AMOs;
• how they communicate company goals and track progress towards those
goals,
• do they have a process for continuous improvement?
• do they benchmark themselves against other companies?
2.2.4 Six Sigma and the Theory of Constraints
This research report is on the status of Lean implementation within South African
AMOs. However, Lean is not the only technique that can be implemented within
AMOs to improve productivity. According to Weigel (2000) “other
manufacturing management concepts that received attention over the past few
decades are not incongruent with Lean principles, and many fit nicely on the
framework of Lean thinking and complement it”. Lean is often incorporated with
Six Sigma and the Theory of Constraints (TOC). Therefore this research report
survey will question the interviewees on their understanding and implementation
status of Six Sigma and TOC. Further questioning will determine if Six Sigma
and TOC are implemented in conjunction with or instead of Lean and why such
techniques where selected instead of or in conjunction with Lean. In order to

50
understand the Six Sigma and TOC questions within the survey a brief overview
of the techniques and their comparison with Lean, is necessary.
Six Sigma
Six Sigma places emphasis on the reduction of variation and is problem focused
through a rigid and structured investigation methodology. The theory is that the
outcome of the entire process will be improved by reducing the variation of
multiple elements. Six Sigma utilizes trained and dedicated persons to facilitate
improvement across organisation in a project environment on a process.
Six Sigma was pioneered by Bill Smith at Motorola, and popularized in
manufacturing environments by General Electric’s former CEO, Jack Welch. It
also evolved from Shewhart, Deming and Juran’s statistical quality control and
total quality management focus upon satisfying expectations across multiple
sectors (US DoD, 2006).
TOC
TOC focuses on system improvement and concentrates on the process that slows
the speed of product through the system. The theory is based on management of
constraints, as the assumption is the performance of the entire chain is limited by
the strength of the weakest link. TOC was initiated by Dr Eliyahu Goldratt
through his work “The Goal” (1992).
Comparison of Lean, Six Sigma and TOC
The reality is that today’s businesses have conflicting goals. Companies are
trying to decrease inventory and meet volatile customer demands or reduce total
setup investments while striving for smaller lots. The Lean principles need to be
looked at in tandem with industry best practices in supply chain, such as
intelligent inventory management, response management and demand
management, in order to create the ideal Lean company (Viswanathan and
Littlefield, 2009).

51
The selection of which process improvement methodology to use is dependant on
the culture of the organisation. The general consensus is that if the organisation
values analytical studies, then Six Sigma is of interest. If the organisation,
however, values a systems approach where total participation is not desired and
desires separation between worker and management, TOC is a starting point. If
the organisation values visual change and right now time, then Lean thinking is
applicable.
Lean looks at pro-active long term sustained improvements for maximizing the
efficiencies of an organisation. Six Sigma is very much a reactive approach,
focusing on a step-by-step method for solving a particular problem (Martyn,
2010). According to Canaday (2004), the US Defence policy assigns priority to
Lean to eliminate waste, and then moves to TOC and finally Six Sigma.
Figure 2.13 Lean, Six Sigma, TOC comparison graph
(Malik, 2009; Miler, 2009)
Between Lean and Six Sigma there are many areas of commonality and the term
Lean Six Sigma is used to describe the implementation of both philosophies at
the same time (Malik, 2009). The hybrid model of Lean Six Sigma, according to
Seelinger (205, p.6), is a technique to manage the variability and variation of an
AMO environment by integrating Lean with Six Sigma. This approach supports

52
continuous improvement through the use of the DMAIC (Define, Measure,
Analyze, Improve, and Control) model and related tools such as process analysis,
and standardisation”.
Figure 2.14 Lean, Six Sigma methodology overlap
(Malik, 2009)
Malik (2009) argues that once you get to the secondary and tertiary effects of
each methodology the results appear to be the same.
Table 2.4 Comparison table of Six Sigma, Lean and TOC improvement programs
(Miler, 2009)
According to Miler (2009) there is probably is no correct sequence to follow, as
all facilities have to deal with capability and defect issues (Six Sigma), with
availability issues (TOC), whilst removing wasteful practices (Lean). Since this

53
research report concerns the aerospace industry, the US Defence policy sequence
of priorities is adhered to; Lean, then Six Sigma followed by TOC. This is due to
its experience resulting from its management of the world largest aerospace fleet
(Hoyle, 2010), as further detailed in chapter 2.4.3.
2.2.5 Summary
This research reports survey of AMOs has the five Lean principles, set out by
Womack and Jones (2003), as its framework. These five principles and applicable
terminology are summerised in Table 2.5.
Table 2.5 Five principles of Lean framework for research report survey
Five Lean Principles Terminology within the Principle
that will be surveyed Description
Value
Target Cost Amount of resources and effort required to make a product
if all waste removed from process
Ultimate Customer The user of the product of which there might be several
Muda Japanese word for waste
Value Stream
Value Stream mapping A visual representation of all the activities of a process
Standardisation Best way to get the work done in the time available
correctly every time
Flow
Takt Time Production time divided by client demand
Visual Controls Simple, clear, concise indicators or process status
5S Sort, Straighten, Scrub, Systematize, Standardise
Pull Kanban Inventory replenishment system to pull inventory/work in
process
Perfection
Hansei Individual responsibility
Kaizen Group continuous improvement process
Benchmarking Comparison with others
Although the techniques may differ and total Lean implementation as
implemented at Toyota, may not be possible or even entirely desirable, Lean’s
basic principles of waste elimination and value improvement cannot be ignored.
The principles of Lean include teamwork, communication, efficient use of
resources and continuous improvement (Ahrens, 2006). Lean as a management

54
philosophy, is also very focused on creating a better workplace, (Grainger, 2008),
to achieve a Lean enterprise philosophy.
Figure 2.15 The Lean enterprise philosophy
(Grainger, 2008)
According to Best (2006, p.47) “every managerial system offers the prospect of
progress; it proposes to make things better by solving some problems that
bedevils the people involved in an institution. Every business has its problems: it
can always hope to improve, to become more profitable. In large enterprises, the
process of management poses constant headaches, so there are always intractable
problems in need of solutions”. According to Rother (2010, p.6), “the competitive
advantage of an organisation lies not so much in the solution themselves- whether
lean techniques, today’s profitable product, or any other- but in the ability of the
organisation to understand conditions and create fitting, smart solutions”. Lean is
one of many tools that can be applied.
The longer an innovation, such as Lean, has been around, the more evidence
ought to be available regarding its effectiveness. If Lean implementation is a
successful philosophy then practical examples of Lean successes should be
evident, particularly within the global AMO industry. It would be against this
background of industry specific evidence of Lean implementation success that
the desirability of Lean implementation in the South African AMO industry
should be based. Chapter 2.4 will provide practical examples of Lean
implementation success within AMOs globally.

55
2.3 Aircraft maintenance
2.3.1 Introduction
Ensuring flight safety is the primary function of all aircraft maintenance facilities.
Aviation is a highly regulated industry with internationally set safety standards.
An understanding of the basics of aircraft maintenance is necessary;
• so as to appreciate the regulatory environment within which AMOs
operate,
• to understand the survey questions and responses that are unique to the
AMO industry,
• the possible constraints to Lean implementation due to regulatory and
OEM requirements.
This chapter will focus on four areas:
• history of aircraft maintenance and how maintenance intervals are
calculated,
• aircraft maintenance schedules and,
• costing aircraft maintenance,
• regulatory oversight of AMOs.
2.3.2 Overview of aircraft maintenance
It has been proven that regularly scheduled inspections and preventative
maintenance ensure aircraft airworthiness. Aircraft maintenance is a generic term
that encapsulates inspections and checks to determine the condition of an aircraft
and its attached components. Aircraft maintenance can range from a short pre-
flight check to a detailed inspection involving complete disassembly of the
aircraft and its components with the use of complex inspection aids. In addition,
various components have life limits, which require that they are replaced with
new/overhauled components prior to reaching their life limits (Riley et al., 2008).
A repetitive maintenance schedule is recommended by the aircraft manufacturer
and approved by the aircraft state of manufacturer and thereafter the Civil
56
Aviation Authority (CAA) of the country where the aircraft is registered. The
maintenance schedule is designed to ensure the continual airworthiness of the
aircraft.
All actions carried out on aircraft, with regard to aircraft operation and
maintenance, are performed in accordance with procedures as stipulated by the
OEM. Any deviation to that which is less than the basic standard as set out by the
OEM or change to the aircraft as manufactured, must be approved by the CAA.
The CAA and/or aircraft operator may add additional tasks or reduce the
inspection interval as set out by the OEM, in response to the aircraft’s operating
conditions and operator’s experience.
2.3.3 History of aircraft maintenance
Prior to the 1960s, maintenance programmes where developed by mechanics and
the operator and where not based on any analytical basis. The underlying concept
was to overhaul every component at set intervals (McLoughlin, 2006). In 1968, a
USA industry team, the Maintenance Steering Group 1st task force (MSG-1),
developed a maintenance requirements decision and analysis logic. It was
implemented, using “on condition” maintenance techniques, when the B747
started flying.
In the 1970s, using the B747 experience, MSG-2 was developed. It is process
orientated and analyzed failure modes from the part level up. The theory of
MSG-2 is that all aircraft and their components reach a period when they should
be overhauled, replaced and restored to new condition. MSG-2 was, however,
primarily concerned with establishing a maintenance program prior to the
operation of a new aircraft. It did not use actual data obtained from aircraft
operations to determine task intervals, applicability or necessity.
In the mid 1970s the US Department of Defence commissioned United Airlines
to investigate maintenance for operating aircraft. The resultant report was entitled
Reliability Centred Maintenance (RCM) (Nowlan and Heap, 1978). The report

57
was subsequently used as the basis for MSG-3, which was promulgated in 1980
with two subsequent revisions in 1988 and 1993 (FAA, 1997). Nowlan states
(1978, p. vii) RCM “provides…. a logical discipline for the development of
scheduled maintenance programs. The objective of such programs is to realise the
inherent reliability capabilities of the equipment for which they are designed and
to do so at minimum cost. Each scheduled maintenance task in an RCM program
is generated for an identifiable and explicit reason. The consequences of each
failure possibility are evaluated and the failures are then classified according to
the severity of their consequences. Then all significant items – those whose
failure involves operating safety or has major economic consequences – proposed
tasks are evaluated according to specific criteria of applicability and
effectiveness. The resulting scheduled maintenance program thus includes all the
tasks necessary to protect safety and operating reliability and only the tasks that
will accomplish this objective”. RCM methodology has a task oriented approach
to maintenance that analyses system failure mode from a system level, or top
down. Maintenance tasks are performed for safety, operational or economic
reasons and they involve both preventative maintenance and failure finding tasks
(McLoughlin, 2006).
Aircraft operators in the past adhered to rigid, uniform work programmes for
comprehensive checks. As a result of MSG-3 they can now group the single tasks
into different work packages for each individual maintenance event in a manner
that is most efficient to them (Aircraft Technology, 2010). The savings in
maintenance man-hours under MSG-3 maintenance are between 10 and 30
percent depending on the effectiveness of the base program (Lacey and Stein,
2003). Not all aircraft operating at present, however, are on MSG-3. This is due
to a variety of reasons such as;
• original design or introduction into service was conducted prior to MSG-3
implementation in the 1980s,
• the operator has not the means or experience to create a schedule and
operate according to MSG-3 principles.

58
2.3.4 Creation and approval of a maintenance schedule
The MSG-3 process is laid out by the USA’s Federal Aviation Authority (FAA)
(AC 121-22B, 2010). An industry steering committee (ISC) is set up and, using
in service data collection, performs analysis of each maintenance task. The ISC
comprises operators, manufacturers and regulators who follow process to develop
a schedule maintenance programme for an airplane model. The resulting
maintenance review board report (MRBR) is submitted to the regulatory
authorities, normally the FAA and EASA, for approval. The approved MRBR is
then incorporated into the Maintenance Planning Data (MPD) document which is
issued to the operator. The MRBR for a specific aircraft type may meet often to
extend or reduce maintenance intervals, based on operators’ experiences and
feedback.
Using the MPD the operator creates a maintenance schedule which is submitted
to their CAA for approval (McLoughlin, 2006). Operators are not bound by
manufacturer’s maintenance schedules, and some have justified higher intervals
to their CAAs (Goold, 2010). In South Africa, a maintenance schedule must be
approved for each aircraft serial number, where the aircraft’s empty weight is
above 5700Kg (SACAA ACT 1997, 43.02.8).
2.3.5 Maintenance schedules
Traditionally maintenance checks are broken up into progressively more
intensive regular inspections, referred to as A, B, C and D checks, known
collectively as letter checks. In addition to requirements to the tasks be performed
during each of the checks, additional tasks may be mandated by CAAs, through
the issuance of Airworthiness Directives (ADs). These are normally created in
response to incident/accident investigation findings. Other tasks which may be
planned in advance of an aircraft maintenance check are product reliability
improvements and upgrades to aircraft interior and exterior. Letter check task
summary is shown in Table 2.7. Common letter check intervals are shown in
Table 2.7.

59
Table 2.6 Aircraft letter check tasks overview
Check Description
Pre-flight Visual inspection exterior fuselage, check and refill of fluid levels, operational check of primary
equipment.
A Routine light maintenance; engine inspection. Mainly a visual inspection of structure with opening of
few panels. Operational check of equipment.
B More intensive A check with opening of more panels in specific area where access can easily be
obtained. Limited non destructive testing (NDT) inspections may be carried out.
C Structural inspection of airframe not just using visual means but also NDT with removal of structural
items to enable inspection. Functional check of equipment. Overhaul of certain equipment.
D
Major structural inspection, normally involves removing the complete passenger and cargo interior.
Overhaul of major components. Implementation of mandatory major modifications. Normally aircraft
is paint stripped and repainted to aid inspection.
(Transport Studies Group, 2008)
Table 2.7 Typical aircraft maintenance check intervals
FH = Flight Hour FC = Flight Cycle (i.e. a flight)
(Transport Studies Group, 2008)
MSG-3 allows operators to group the required tasks into phases, in a manner that
allows the continued operation of the aircraft, according to the operator’s
requirements. The maintenance industry still tends to refer to letter checks for
ease of communications. For example, D check is shorthand for a very large
maintenance event. Aircraft maintained under MSG-3 programs do not see
overhaul facilities as often as aircraft on traditional B, C, D letter check
programs. Basically, there is one major structural inspection program that looks
for both fatigue and corrosion (Lacey and Stein, 2003). The MSG-3 check
intervals are subject to change. Following 100,000 maintenance task feedback
reports to the MRBR, the A330/340 C check interval has been extended from 15

60
months on aircraft entry into service to the current 18 months. The A330/A340 is
currently on MRBR Rev 11 (Goold, 2010).
Table 2.8 A330/340 Check interval increase under MSG-3
Check Interval Increase Over Time
Check Type Year of Entry Into Service 2007 2010
A check 400 Flight hours 600 Flight hours 800 Flight hours
C check 15 months 18 months 18 months
Heavy Maintenance/
D Check 10 years 10 years 12 years
(Airbus, cited by Goold, 2010)
According to Aircraft Technology (July, 2010) aircraft reliability has improved
with the movement from the traditional letter checks to task based maintenance
under the MSG-3 philosophy. Newer generation aircraft are less labour-intensive
when performing certain airframe related tasks. The aircraft is seen in scheduled
maintenance more often, albeit for a shorter duration. MSG-3 has saved costs for
the operator but has also created a more regulated work flow and greater
efficiency for AMO providers. This enables the Lean principle of pull, Muri,
mural to be implemented in AMOs. MSG-3 pulls the required tasks to be
performed by the AMO, according to the aircraft operation utilised and
anticipated hours, cycles and time. Muri, overburdening people or equipment and
Mura, unevenness of production, (Liker, 2004) are reduced as the tasks can be
planned in advanced and group together according to the AMOs available
capacity. Operators in the past had to adhere to rigid uniform work maintenance
programmes for comprehensive letter checks, now single tasks are grouped into
different packages for each individual maintenance event.
2.3.6 Calculating cost of maintenance and Lean
A question posed by Womack and Jones (2003, p. 262) is “what kind of
management accounting system would cause our (employees) to do the right
(Lean) thing?” According to the Society of British Aerospace Companies (Ward
et al., 2003) despite the major drive for cost reduction within the aerospace
sector, there have been difficulties in identifying how cost management and

61
accounting practices can support the Lean company. The concern is that
traditional costing and accounting systems are not necessarily appropriate to
support efforts to apply Lean principles throughout the aerospace supply chain.
The belief being that cost systems have been designed primarily to satisfy the
financial accounting requirements for inventory evaluation, thus ignoring the
information required to promote operating efficiencies. The objective of Lean is
to add value to the customer so as to reduce the aircraft operators direct operating
cost (DOC).
Commercial aircraft have seemingly reached a plateau as regards productivity.
Due to no recent major technological innovation, such as was experienced with
the introduction of the jet engine in the 1960s, aircraft operator profits are only
possible by reducing DOC (Piepenbrock, 2009).
Figure 2.16 Increase in aircraft productivity 1900 to present day
(Piepenbrock, 2009, p.95)
The gathering, analysing and reporting of operating expenses are not just a
business tool for each operator. They also guide aircraft manufactures in
developing each successive generation of aircraft and have been used to measure
the impact of technology or processes in reducing operating expenses. But
simplistic maintenance cost per hour figures hide the fact that the cost of
maintenance is not known, but is based on estimates.

62
In 1944 the Air Transport Association of America (ATA) published the first
universally recognized system for estimating DOCs. It has been updated
throughout the years with inputs from ATA member airlines and airframe and
engine manufacturers. Maintenance cost includes the cost of direct maintenance
labour and maintenance material. The DOC elements for aircraft are as shown in
Table 2.9.
Table 2.9 Allocation of aircraft costs
Cash Costs Ownership Costs
Flight Crew Landing Fees Maintenance
Airframe Fuel Insurance Interest
Cabin Crew Navigation
Fees
Maintenance
Engine Depreciation - Aircraft and spares
(Liebeck et al., 1995)
Transport Studies Group (2004, p.45) stated that “there is no practical way to
resolve pure utilisation-based costs from the general maintenance costs and this
situation seems likely to become more common as outsourced maintenance
agreements (with AMOs) become more widespread”. Aircraft manufactures, such
as Boeing, have admitted that the actual cost of maintenance is little understood
and in still in the process of being defined. In 2005 Boeing began researching
ways to help airlines understand their maintenance costs. At that time Boeing
admitted that there was no industry standard for tracking and reporting airplane
maintenance costs. Operators therefore find it difficult to calculate if their
maintenance costs are in line with the rest of the industry (Buyers, 2010). In the
last half of this decade Boeing has started to gather data for its fleet through
airline working groups but the issue appears to be generic across all
manufacturers.
While the actual cost of maintenance is open to debate, the cost of the non
availability of the asset while it is undergoing maintenance can be estimated. A
basic costing estimate is that each extra day of maintenance downtime is
equivalent to the daily cost of leasing the asset undergoing maintenance. Aviation
leasing cost daily is approximately 0.03% of the asset’s purchase price, which for

63
a $40 million jet is $84,000 a day (Canaday, 2011). The justification for Lean,
therefore, is the reduction in turn around time (TAT) that results from its
implementation. While the advantage of Lean may not directly reflect in the
financials of the AMO, it is of benefit to the customer due to reduce lead time,
thereby offering the AMO competitive advantage to retain and increase business.
2.3.7 South African AMO regulatory oversight
The South African Civil Aviation Authority (SACAA) approves and regularly
audits AMOs, that maintain South African registered aircraft. According to the
SACAA (2010, p.31) “this is to ensure that aircraft maintenance engineers
perform their tasks in line with the approved standards, procedures best
international practice. Industry adherence to safety standards is ensured through
the implementation of a programme of scheduled and ad-hoc inspections”.
SACAA audits of an AMO enable it to hold a license to conduct business,
referred to as the AMO Certificate. The AMO certificate is supported by a
SACAA approved Manual of Procedures (MOP). The MOP contains the
facility’s procedures to show compliance with South African Aviation regulations
and OEM requirements.
Should a South African AMO wish to perform maintenance on an aircraft, or part
thereof, bearing the registration of another country, its must apply to that
country’s CAA for permission to perform maintenance. The AMO amends its
MOP, taking into account any variations in aviation regulations between that
country and South African legislation. The AMO then undergoes an inspection
by the country’s CAA. Should that CAA find discrepancies with its regulations
regarding procedures, personnel, training, equipment it will specify to the AMO
corrective actions it deems necessary to obtain approval. It is the AMO’s decision
weather to implement such actions in order to obtain approval to perform
maintenance on that country’s registered aircraft. Thereafter the AMO is subject
to regular recurrent audits by all the aviation authorities for which it holds
approval.

64
According to Saull (cited in Friend, 1992, p.ix), “regulations and requirements
only form the basis for safety management in which maintenance is a major
element; they do not, in themselves, achieve it. The regulatory rules are the
source of minimum standards”. Aircraft safety is the responsibility of the
operator and persons working on the aircraft. All persons physically working on
an aircraft hold company approval stating their scope of work allowed, which is
related to licenses, if any, they hold as issued by an aviation authority. These
licenses are based on the person’s training and practical experience. Each person,
following completion of any task on an aircraft records the task, signs the
relevant document and applies a personal stamp (SACAA ACT 1997, 43.0.2.2).
The CAA specifies a minimum storage period for documentation but normally it
is kept for the duration of the operational life of the aircraft. This documentation
may be used by the CAA, at a later date, should an incident or accident occur, in
order to determine cause and preventative action which could be taken to avoid a
recurrence.
All completed documents are considered legal documents. They may be produced
in a court of law as evidence in a criminal investigation of negligence or
manslaughter, should the aircraft be involved in an incident/accident. The use of
maintenance records in such cases, however, is subject to debate. France is one of
a handful of countries that routinely seek criminal indictments in transportation
accidents, regardless of whether there is clear evidence of criminal intent or
negligence. According to Clarke (2010) the decision to proceed with criminal
charges in the Paris Concorde crash case alarmed airlines and aviation safety
experts worldwide. They contended that the threat of prosecution could dissuade
some witnesses from cooperating in crash investigations. Voss, president of the
non-profit Flight Safety Foundation, states that “verdicts like this (Concorde)
tend to drive safety underground. Accident investigations depend on information
from professionals who can admit mistakes when they happen. The threat of
criminal conviction generates a climate where people are unlikely to do that”
(Clarke, 2010).

65
2.3.8 SACAA AMO approvals
AMOs are granted approval by the CAA to perform specific tasks on specific
aircraft and parts (SACAA, ACT 1997, Part 145.01.9 (1)), hence the term
Approved Maintenance Organisation. The SACAA further segments AMO
approvals according to aircraft, engines, parts and processes into various
categories and groups (SACAA ACT 1997, Part 145.01.7). This research report is
concerned with AMOs maintaining those categories and groups defined as large
fixed wing pressurized metal aircraft powered by turbine engine. Large aircraft
are those above 5700 Kg.
Table 2.10 SACAA AMO approvals categories and groups
Category Group Description
A and C 8 Pressurised aeroplanes of all metal construction, with a maximum certified mass
exceeding 5700Kg
C and D 5 Turbine jet engines
(SACAA ACT 1997, Part 145.01.7)
AMOs are grouped by the SACAA according to the type of aircraft operation
they support. Aircraft operators are classified according to particular Parts of the
SACAA regulations. Part 121 operate large aeroplanes, engaged in commercial
air transport operations. Part 127 operate helicopters. Part 135 and 91 are general
aircraft operations (SACAA ACT 1997, 121.01.1(1) (a)). This research report is
concerned with AMOs supporting Part 121 operators (i.e. commercial air
transport operations utilizing large aircraft).
2.3.9 Summary
Lean implementation must take into account and adapt to the stringent
requirements stipulated by the OEMs and CAAs under which aircraft are
maintained. Contravention of such requirement may result in;
• an aircraft accident and possible loss of life,
• an AMO and/or an aircraft operator not being allowed to conduct business
by an aviation authority,
• an aircraft incident and damage to an aircraft and operators reputation.

66
According to Martyn (2010) however, whilst working within the regulations, the
Lean philosophy can provide new efficient ways of doing the work, without
compromising safety. Maintenance performed in accordance with MSG-3
principles requires less maintenance than MSG-2, thus benefiting the operators at
the expense of AMOs. While newer generation aircraft are less labour-intensive,
when performing certain airframe related tasks they require capital intensive and
very specialised equipment. Lower labour cost is not an advantage in such a
market. To compete successfully, AMOs need to provide shorter turnaround
times with higher quality and lower total costs (Seeliger, 2005). It is the
management of the process, not low labour costs that will enable AMOs to retain
and gain market share. Lean is the elimination of waste in such processes.
Using reduction in maintenance costs to justify or otherwise Lean
implementation is fruitless; as such costs are largely unknown to aircraft
operators. Time is the benchmark, as the shorter the time an aircraft is
undergoing maintenance; the sooner it is available to produce revenue for the
operator.
Chapter 2.4 of this research report shall use examples of decreased downtime and
increased turnaround, following Lean implementation, to demonstrate Lean’s
relevance to the AMO industry.

67
2.4 Aviation and Lean implementation experience
2.4.1 Introduction
Lean began in the automotive industry where its implementation has proven
successful. This chapter will conduct a literature review of the success of Lean
implementation outside the automotive sector, with emphasis on the aviation
industry.
2.4.2 Lean beyond the automotive sector
Boston (2009) argues that Lean not only applies to the production environment, it
also embraces process management and information-flow management. It’s about
having a cross-functional thought process; viewing the business as a system and
understanding how things need to be connected. Lean is a strategic philosophy
which connects every aspect of a business. It is the strength of these connections
which will determine what level of operational excellence the business can
achieve, especially in the known and unknown problems that it will undoubtedly
face (Vixama, 2009).
According to a study of over 300 manufacturing and service industry
professionals, by the research company Aberdeen Group (Littlefield, 2008), the
longer an company implements Lean, the more successful it becomes. Where
Lean is embedded it resulted in 7% more on time deliveries, 11% higher
performance in overall equipment effectiveness and 64% lower inventory costs as
a share of revenue, compared to industry average firms within the survey. Lean
companies achieve 97% on time delivery, 93% overall equipment effectiveness
and 5% inventory costs as a share of revenue. When the length of Lean
deployment is considered, it turns out that companies having focused on Lean for
one year or less are 35% more likely to be laggards to the industry average.
Companies having focused on Lean for one to five years are 21% more likely to
be industry average. Companies having focused on Lean for more than five years
are 187% more likely to be best in class and are more likely to deploy Lean

68
across multiple functional groups. The longer an company implements Lean, the
more efficient it becomes compared to its competition.
2.4.3 Aviation’s introduction to Lean
The aviation industry, in the early 1990s, suffered from the combined effects of a
reduction of defence budgets, following the end of the cold war, and a decline in
passenger demand after the first Gulf War. The result was huge financial pressure
being experienced by both military and commercial operators. Aerospace
manufacturers turned to the automotive industry for inspiration and so began their
introduction to the principles of Lean (Lean Flight Initiative, 2010).
According to Kearney (2003) the automotive and aviation industries have a lot in
common. Their commonalities are;
• their products are both highly complex and require significant
engineering, manufacturing and supply chain management capabilities,
• both products can be broken down fairly easily into major modules and
systems,
• both industries have a small number of manufacturers that rely on a broad
spectrum of suppliers in several tiers, from parts manufacturers and sub
assembly suppliers to system integrators.
Their main differences are;
• cycles times in aviation are longer than in the automotive industry.
Aircraft still operate profitably after 25 years,
• an automobile consists of approximately 7,000 parts. Aircraft can consist
of up to six million parts,
• the automobile industry has far greater production volumes than aviation,
as shown in Table 2.11.

69
Table 2.11 Comparison aircraft and automobile deliveries 2010
Product Deliveries Aircraft Vs. Car Sales 2010
Top 3 Selling Boeings Globally & Total
Boeing B737 376
Boeing B777 74
Boeing B767 12
Total Boeing commercial aircraft deliveries 2010 462
Top 3 Selling Vehicles USA Market & Total
Ford F Series 528,349
Chevrolet Silverado 370,135
Toyota Camry 327,804
Total cars sold USA 2010 5,770,041
(Boeing, 2011, Wall Street Journal, 2011 )
2.4.4 Lean and military aircraft
In response to the challenges of the early 1990s, the United States Department of
Defence (US DoD) convened a maintenance management task force. The task
force was mandated to look at “approaches to improve the overall efficiency of
maintenance in organic and private industrial facilities, including strategies with
the greatest potential for achieving significant improvements through new
technology applications, process improvements, modern business practices,
reliability improvements and other appropriate means” (Parker, 1994, p.1). In
1994 seven recommendations where presented to the US Congress. Lean is the
only specifically mentioned management method. The other recommendations
are generalities, such as upgrading computer systems. Lean is specifically
identified due to a previous report, by the Defence Science Board task force of
1993, which identified Lean as being a proven singularly successful method in
both government and industry.
The 1993 report, addressing defence acquisition and manufacturing,
demonstrated how Lean changes enabled continuous improvement in costs,
quality, cycle time, production flexibility and performance. The US DoD
therefore formulated Lean introduction as part of the Continuous Process
Improvement Transformation Guidebook which forms the core of the current US
Air Force (USAF) Smart Ops for the 21st Century philosophy (AFSO 21, 2007).
According to Whitaker (2006) "the key thing for all our airmen to remember is

70
that AFSO 21 encourages and enables us to find ways to improve our processes
so that we eliminate waste and needless duplication." Lean introduction has since
proven successful within the USAF, particularly with regard to TAT, as shown in
Table 2.12.
Table 2.12 USAF maintenance facilities Lean implementation results
Location Aircraft Type Lean implementation result
Robins Air Force Base
Georgia
USA
C5 Galaxy
Lean began 2001. In 2001 12 out of a total of 17 aircraft where
delivered late, with TAT for aircraft being 340 days against a
contracted 180 days.
By 2004:
• TAT had decreased to 229 days, while aircraft demand had
increased 35%, with 100% On Time Delivery
• TAT landing gear reduced from 14 to 11 days
• TAT pylons reduced from 23 to 14 days
• output per manday increased by nearly 35% with manpower
remaining fairly stable
(Barrett and Fraile, 2005)
Fort Rucker
Alabama
USA
UH-60 helicopter
The first helicopter inducted into the Lean process returned to
flying status in 18 days in comparison to the previous average time
of more than 50 days.
(Hill, n.d.)
Whidbey Island
Washington
USA
J-52
engine
Repair TAT reduced from 468 hours to 233 hours.
(Jafar, 2006)
Corpus Christi
Texas
USA
T700/CTC
engine
Overhaul TAT reduced from 261 to 93 days.
(Moorman, 2008)
Successful implementation of Lean is not limited to the US DoD. Its suppliers of
aircraft, equipment and maintenance have also successfully implemented Lean, as
shown in Table 2.13.

71
Table 2.13 US Military OEM Lean implementation results
Location Aircraft Type Lean implementation result
Northrop Grumman
J52 Engine Repair
Shop
TAT reduced from 63 to 45 days. Northrop Grumman achieved from
its Lean introduction in 1998 to 2003 a 40% reduction in
manufacturing costs and a 60% reduction in cycle times.
(Cool, 2004)
Lockheed Martin F-22
production line
Rework, reduced 100%. Number of people involved, reduced by 43%.
(Stanley and Handell, 2003)
Boeing
F-16
production line
50% reduction in WIP.
58% reduction in inventory, approximately $350 million annually.
Implementing standard work procedures and electronic work
instructions in the production line reduced cycle time by 30-35%.
(Ferdowsi and Stanke, 2002)
Boeing Mesa
Arizona
Apache production
line
54% reduction in build hours.
218% increase in build rate.
(Jenkins, 2002)
Boeing
San Antonio KC-135
Overhaul time reduced to 153 days from 200 days.
(Warick, 2007)
Raytheon Global Hawk
production line
Increased production capacity from 3 per year to 6 per year.
(Riel, 2003)
Sikorsky
Connecticut Black Hawk
Spindle box production line lead time reduced 73%.
(LEI, 2010)
The success of Lean implementation is not just restricted to the USAF. Having
studied the USAF the UK Defence Logistics Organisation and the Royal Air
Force (RAF) introduced Lean with success, as shown in Table 2.15.
Table 2.14 RAF Lean implementation results
RAF Base/Lean Introduction Date Lean implementation result
RAF Marham , Lean introduced 2003
Tornado flight guidance system repair line
• Maintenance cycle time improved by 18.4%.
• Reduced space required by 75%.
RAF Marham
Tornado practice bomb repair line
• Maintenance cycle time improved by 12%.
• Reduced space required by 57%.
RAF Marham
Tornado Armaments repair line
• Reduced space requirements by 50%.
RAF Cottesmore, Lean introduced 2001
Harrier Pegasus engine modules
• Maintenance cycle time improved by 75%, with a 43% .decrease in
actual hand-on repair activity.
RAF Cottesmore
Harrier supply line
• Reduced space requirements by 20,000 square feet and freed up
four buildings for other uses.
RAF Wattisham, Lean introduced 2004
Apache maintenance facility
• Planned maintenance hours reduced by 30%. Overhaul now takes
42 working days, a saving of 13 days.
• Maintenance time per main rotor head reduced by 60% due to
implementation of a dedicated mini pulse line.
(Bourn, 2007; Hoyes, 2006)

72
Flight International (December 2010) lists the US DoD, as the largest single
aviation operator, with an active aircraft fleet of 13,345 aircraft. This is 25% of
the global military fleet. Refer Table 2.14.
Table 2.15 Global Military Fleet 2010
(Hoyle, 2010)
By comparison, one of the world’s largest civilian airlines, Delta, contains 821
aircraft (Delta, 2010). In addition USAF maintenance and repair budget is
$14billion per year, involving 46,000 workers and occupying more than 500
facilities (Deloitte, 2010). Research and findings carried out by the US DoD on
Lean are therefore based on a large sample. Evidence of Leans successful
implementation within the USAF was observed and subsequently spread to the
civilian aircraft industry.
2.4.5 Lean and civil aircraft
It may be argued that the military complex was able to achieve such
improvements as it had built up large inefficiencies during the cold war as a
result of practically unlimited budgets in response to the then perceived Eastern
Bloc’s conventional armed forces threat. The military is not generally known for
efficient practices, as it does not normally operate for profit, but conversely
commercial operations do not have to deal with the unpredictable maintenance
demands of an active service aircraft operating in a war zone subject to
performance requirements, operational manoeuvres and damage that rarely
feature in civil aviation.

73
Boeing realised in the 1990s that the commercial airline market had begun to
focus on increased profitability and that it needed to become leaner in order to
offer its customers airplanes at reduced rates and improved quality (Jenkins,
2002). In response, they approached ex Toyota executives for assistance in
implementing Lean. Other OEMs, in response to the same commercial pressures
also began to implement Lean successfully, as shown in Table 2.16.
Table 2.16 Civilian OEM Lean implementation results
Location Lean implementation result
Boeing
Renton, Washington
USA
Assembly time for a B737 airliner from 28 days in 1999 down to 11, rework, scrap and
waste caused by mistakes has also gone down by 61%.
(Laurenzo, 2005)
737 flow time reduced by 30%, cranes moves reduced by 39%, inventory levels lowered
by 42%, required floor space reduced by 216,000 square feet
(Jenkins, 2002)
Airbus
Broughton
Wales
Late 1990s delivery of wings to Airbus’s final assembly plant in Toulouse, France, took
place on schedule only 18% of the time. On time delivery is now 100%.
Quality defects have been reduced by 62%.
(Laurenzo, 2005)
Eurocopter
Marignane
France
Assembly time for a helicopter reduced from 16 weeks in 2007 to about 8 weeks 2010.
(Marchand, 2010)
Embraer
Sao Paulo State
Brazil
Phenom 100/300 production line, 20% cycle reduction time
Composite shop lay ups increased from less than 100 a day to over 200 a day following
implementation of work cells and visual controls.
(Coutinho, 2007)
According to Laurent Vautherin, Eurocopter director light helicopter programme
“faster production times allow us to reduce inventories and works in progress,
putting less strain on cash flow. Lean manufacturing also makes it much easier to
quickly detect and correct quality related problems”, (Marchand, 2010).
Civilian AMOs introduction of Lean has also proven to be successful. David
Doll, former maintenance executive of United Airlines, (Moorman, 2006) argues
that “maintenance in general needs the discipline of manufacturing as well as the
flexibility to deal with the unpredictability of the business. The basic problem for
maintainers is that an AMO shop can’t control its flow of raw materials. It’s all
about material management; typically mechanics spend 80-90% of their time

74
waiting for parts and 10-20% installing them. Adopting material management and
Lean like programs, as well as reducing inventory to only what is needed, will go
far towards lowering costs and improving TAT”. Commenting on reduced TAT,
Martin Kaiser, chief executive of the AMO Shannon Aerospace, stated “our
achievement in relation to Croatia Airlines’ programme demonstrates that we, as
an organisation, have the capability to implement and sustain change while
underlining the role of Lean in delivering real benefits and value to our
customers” (Shepard, 2009).
Table 2.17 Civilian AMO Lean implementation results
Location Lean implementation result
FedEx Express
Group, Globally
$18million savings during 2009 as a result of Lean improvements.
(Bartholomew, 2009)
FedEx Express
Los Angles
USA
Lean implementation initiative began in December 2007 when the facility performed 14
C checks rising to 30 by 2009, with same size staff, equipment and floor space.
Lean implementation has resulted in time to perform a C check decreasing from
32,173Mhrs to 21,535Mhrs, translating into a saving of $2million, excluding parts
Cargo loading system maintenance has been reduced from about 30 days in 2007 to 18-
20 days in 2009.
(Bartholomew, 2009)
FedEx Express
Indianapolis
USA
B check reduced from 60 elapsed hours to 30 hours
(Bartholomew, 2009)
Goodrich Aviation
USA
D checks on B737 reduced from 32-35 days to high 20s.
(Canaday, 2004)
Delta Airlines
USA
Productivity in early 2004 rose by nearly 22%
Electro-pneumatic shop has reduced TAT for starters from 50 to 5 days
Repair of air cycle machines has been cut from 31 days to 9
(Canaday, 2004)
ST Aerospace
Singapore
Kaizen driven projects have resulted in estimated savings of around $14.5 million
system wide with average TAT having been cut by between 20% to 30%.
(Canaday, 2004)
KLM Engineering &
Maintenance
Netherlands
30% reduction in TAT, in five years for D-check on 747-400s. Now TAT is four weeks,
or 3.5 weeks without exterior painting.
(Canaday, 2009)

75
The AMO supply chain of component shops, have also implemented Lean with
successful results as shown in Table 2.18.
Table 2.18 Component shop Lean implementation results
Location Lean implementation result
United Services, USA
Lean solutions in late 2004 and TAT for landing gear went from 70 days to 35 days
(Moorman, 2008)
Standard Aero
Maryville Tennessee,USA
TAT on the AE3007 powerplant, for the Embraer family of regional jets, reduced from
15 days to 30 days.
(Moorman, 2006)
American Airlines
Tulsa, USA
TAT reduced by 50% for the P&W JT8D-200s and GE CF6-80C2B6s engines
(Moorman, 2006)
GE Aviation
Cincinnati, USA
TAT reduced by 20% on CFM56-5s & -7s, since 2007
(Canaday, 2011)
P&W
Connecticut, USA
TAT on engine overhaul reduced on average by 25%.
(Womack and Jones, 2003)
The AMO facilities in Table 2.17 deal primarily with scheduled maintenance. It
could be argued that due to the size of aircraft fleets they support, Lean
implementation is therefore practical as they support a “production line” of
aircraft requiring maintenance. Lean, however, has also been implemented in
business jet interiors, which is the most specialised maintenance and modification
work possible within civilian aviation. In March 2010, the Lufthansa Technik
Hamburg facility delivered an A319 CJ for the German federal Ministry of
Defence, featuring a VIP area with 12 seats and a delegation area for 22 to 32
people, in a record seven months. Company CEO Wilhelm Henningsen is quoted
as saying “the large number of Lean activities helped us increase the efficiency of
our production in all operating facilities” (Huber, 2010).
2.4.6 Comment on AMO Lean implementation
The selection of the aforementioned successful Lean implementation projects
globally have shown that the Lean philosophy can be and has been successfully
implemented within the AMO industry, despite stringent regulations. Building on
the success of Lean, to further advance Lean implementation and research and to

76
support and maintain their aviation industries competitiveness, various bodies
have been created, including;
• LAI, at MIT, USA, established in 1993. Membership includes military,
academia, organized labour, government and industry (Crabill et al.
2000).
• UK Lean Aerospace Initiative established in 1998.
• Lean Flight initiative, established in 2005, by a grouping of European
aircraft operators and AMOs (Harbison, 2009).
This research report’s intention is not to deal with Lean implementation itself, but
to show its prominence and implementation status internationally amongst AMOs
globally therefore enabling benchmarking of the status of Lean implementation
within South African AMOs against their competition. That is not to deny the
fact that the implementation of Lean within AMOs, or any other company, has
not been easy. Many companies try to replicate Toyota’s performance through
the use of Lean, even other Japanese companies and fail to achieve their
objectives. The problem is that many embrace lean tools but do not understand
what makes them work together in a system, they confuse the tools and practices
they see at Toyota with the system itself (Spear and Bowen, 1999; Liker, 2004).
Aircraft maintenance involves small batch production and high variation in the
actual work package performed on each aircraft. This depends on “wear and
tear”, which can be planned based on the maintenance planning document and
scheduled task requirements. However some problems, such as corrosion, only
become apparent once the aircraft has been taken apart. This variability makes it
harder to keep a smooth flow across work cells (Barrett and Fraile, 2005).
Defence personnel have commented, “as we move closer to a foxhole from a
factory, the overall magnitude of uncertainty in demand, supply and environment
increase significantly” (Kang, 2007) and “Lean itself is not always desirable in
military operations due to built in variability, yet the Lean (removing waste and
non value added activities) concepts help improve readiness and reduce costs”
(Jafar et al., 2006).

77
The AMO industry is conservative in nature. According to Taylor and
Christensen (1998, p.164) “old habits of mind and action stand in the way. The
culture resists fundamental change. It’s cautious, conservative. By its very nature,
it’s slow to apply lessons learned in other industries, even in other airlines. The
maintenance culture rests on a proud tradition that has now become its worst
enemy. One ideal has defined and sustained the maintenance culture since its
inception, serving as its central organizing principle, that of the self sufficient,
rugged individual. This idea has made maintenance what it is. But what led to so
much success for so long is now responsible for the industry’s failure to adapt as
well as it might. The world has made the lone gun obsolete. But maintenance still
acts as if it had not. Maintenance has not yet internalised the full meaning of this
wide angle systems view. The machine model still prevails: one part, one person,
one time. Maintenance culture takes on one symptom at a time quite well, but it is
simply not hardwired to handle the larger system issues that continue to produce
all kinds of new symptoms, endlessly”.
A study of a C-130 maintenance facility (Dickmann, 2005, p.8) following the
successful implementation of Lean, commented that “productivity gains did not
come easily or without challenge. The existing maintenance model gave them a
sense of “tail number ownership” and accomplishment once the aircraft was
completed. Lean took away this sense of ownership, which is a strong intangible
job satisfier. This negative effect diffused over time as the Lean process
introduced more predictability to the daily work routine. Old forms of job
satisfaction gave way to new ones such as lower uncertainty and visible
measurement of progress”.
The problem, however, is not unique to the AMO industry but to any other where
highly trained and skilled technical personnel are employed. Womack and Jones
(2003, p.216) recognized the issue in the German automobile industry “because
skill levels were so high on the plant floor it was possible to fix each problem as
it arose rather than fix the system which created the problems in the first place”.
Boston (2009, p.7) encountered the same issue in the health care environment

78
stating, “health-care professionals are so dedicated and professional. They are
well educated and by nature focused on doing the best at all times. If they
encounter a problem they quickly try to come up with a solution. But they are not
system thinkers”.
According to Womack and Jones (2003, p.264), “it has become conventional
wisdom from higher levels of management that they should learn to listen to the
primary work team, since they know the most about how to get the job done.
Unfortunately, this bit of common sense is only half right. The primary
workforce probably does know the most about the hard technical aspects of
getting isolated jobs done but what primary workers and front line managers
typically do not understand is how to think horizontally about the total flow of
value and how to pull it. Nor do they typically understand the methods of root
cause analysis to eliminate the need for fire fighting. Some front line workers
prefer fire fighting as it provides opportunities for overtime or opportunity to
show ones skills in the face of a problem”. Spear (2009) argues that “most
organisations assume that the best operations they can devise will have a certain
amount of unavoidable noise or chatter and that a certain amount of effort will
always be siphoned off into fire fighting: that’s just the way life is”.
Where Lean is implemented, the complete process, or what Taylor and
Christensen (1998) refer to as the “wide angle systems view”, is being
considered. The result is improved quality, reduced TATs and less waste. Where
implemented, Lean has proved successful in OEMs, AMOs and supporting
component shops. Lean has worked for civil and military aircraft, fixed wing and
rotary, normal passenger configuration, cargo and business jet interiors. Lean
now forms a core philosophy of the US DoD as set out in its Continuous Process
Improvement Transformation Guidebook. These successes have been noticed by
the AMO industry globally and Lean is now part of the lexicon of the global
AMO industry.

79
2.4.7 AMO industry’s future challenges and the status of Lean
The present global economic downturn of 2009 has been the most severe on the
airline industry; post the terrorists attacks of September 11th 2001. Passenger and
freight volumes experienced negative in 2008/09 Refer Table 2.19 and Figure
2.17. Decreases in volumes and profitability experienced globally resulting in 26
airlines ceasing operations in 2009 alone (Holland and Gubish, 2010). The AMO
industry has been affected due to airlines deferring maintenance through reducing
utilization of aircraft.
Table 2.19 IATA Airline industry fact sheet 2001-2011F
(IATA, 2010)
Figure 2.17 Passenger and freight growth 2008 to 2010
(IATA, 2010)

80
Older aircraft, which usually require heavy maintenance checks, are being put in
storage thereby reducing the available AMO work, refer Table 2.20. According
to Aero Strategy (cited Aircraft Technology, 2010) a four percent reduction in an
airlines capacity will lead to a 12 percent reduction in AMO spending.
Table 2.20 In service and stored aircraft 2009
(Sheridon, 2010)
Airlines are putting a premium on not doing maintenance by deferring or
completely eliminating it on a large portion of their fleet. The airlines are taking
aircraft out of maintenance cycles and completely disrupting and breaking
maintenance lines for months (Smith 2010). The result has been competitive
manhour rate pressures in response to operators having less money, with the
market being a “buyers” market and the AMO experiencing reduced revenues in
return.
The recent global downturns uniquely affected all regions of the world but the
recovery rate will vary regionally with emerging markets, including sub-Saharan
Africa, predicted to be growth leaders, though off a low base, as shown in Table
2.21.
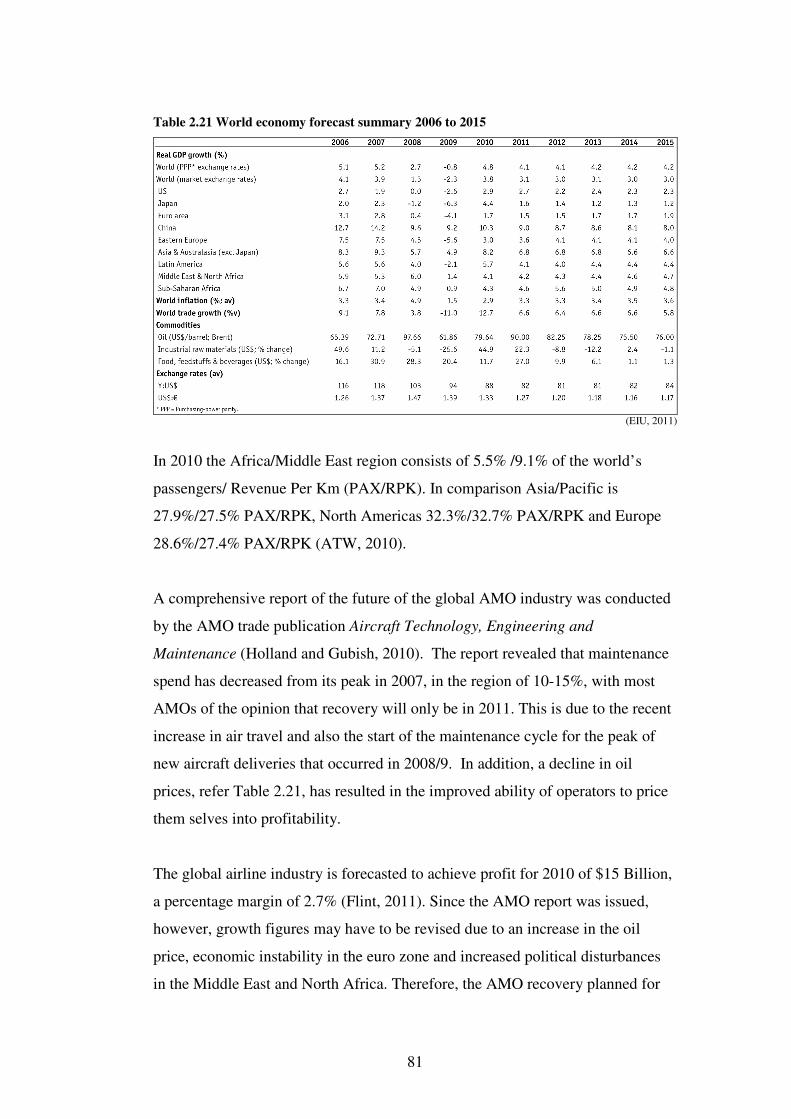
81
Table 2.21 World economy forecast summary 2006 to 2015
(EIU, 2011)
In 2010 the Africa/Middle East region consists of 5.5% /9.1% of the world’s
passengers/ Revenue Per Km (PAX/RPK). In comparison Asia/Pacific is
27.9%/27.5% PAX/RPK, North Americas 32.3%/32.7% PAX/RPK and Europe
28.6%/27.4% PAX/RPK (ATW, 2010).
A comprehensive report of the future of the global AMO industry was conducted
by the AMO trade publication Aircraft Technology, Engineering and
Maintenance (Holland and Gubish, 2010). The report revealed that maintenance
spend has decreased from its peak in 2007, in the region of 10-15%, with most
AMOs of the opinion that recovery will only be in 2011. This is due to the recent
increase in air travel and also the start of the maintenance cycle for the peak of
new aircraft deliveries that occurred in 2008/9. In addition, a decline in oil
prices, refer Table 2.21, has resulted in the improved ability of operators to price
them selves into profitability.
The global airline industry is forecasted to achieve profit for 2010 of $15 Billion,
a percentage margin of 2.7% (Flint, 2011). Since the AMO report was issued,
however, growth figures may have to be revised due to an increase in the oil
price, economic instability in the euro zone and increased political disturbances
in the Middle East and North Africa. Therefore, the AMO recovery planned for

82
2011 may prove to be optimistic but global GDP is still expected to grow at 3.6%
in 2011 (EIU, 2010). Against this background AMOs will compete
internationally to obtain business, including from Africa.
The Aircraft Technology, Engineering and Maintenance (Holland and Gubish,
2010) report surveyed AMOs on their opinions regarding the future of the AMO
business. Close analysis of the report revealed the continued use of Lean
practices as a technique mentioned that will enable AMOs to survive the current
market downturn. The word Lean was specifically mentioned in the report, by
such major AMOs as;
• Aviation Technical Services, Everett Washington. Over 1,500 technicians
at the third largest AMO single site facility in the USA,
• Lufthansa Technik. Over 19,000 employees globally, with revenues in
excess of 3 Billion Euros,
• Singapore Airlines, SIA Engineering. Over 5,500 employed in nearly
50,000 sq meters of aircraft hangars,
• AMECO Beijing. Over 5,000 employees,
• AARCorp. Over 6000 people in 13 countries and is the second largest
independent supplier of AMO services in North America.
AARCorp. stated “continuous improvement and Lean implementation are two
areas we have invested significant dollars and talent. These investments have
served us well in the downturn and will provide even greater results in the market
upturn”. In response to decreased workload in future due to retirement of old
aircraft, Andreas Meisel, General Manager of Ameco Beijing replied “the
implementation of Lean manufacturing principles, in order to use the company’s
existing facilities and resources more efficiently and improve yields, is a top
priority for Ameco” (Holland and Gubish, 2010). Dr Fuat Okay, Turkish Technic
stated “we focus day and night on Lean techniques – there’s no AMO in the
world that’s not doing that. The cost cutting pressures on the airlines are immense
and they’re passing that over onto all of us” (Avitrader, p.13, 2010). AMO
Greenfield facilities currently being constructed are taking Lean into account.

83
Examples include Silk Way Technics, Azerbaijani, which is planning to build a
two wide body aircraft facility with an “analysis on optimizing the hangar layout
in terms of Lean production” (Holland, 2010). Globally AMOs have identified
Lean as a philosophy that will enable them to survive and prosper beyond the
current global economic downturn.
2.4.8 Summary
Lean, in aviation, has been around since the mid 1990s. It cannot therefore be
seen as a short term trend. While individual AMOs are implementing different
variants of Lean, that suit their means and requirements, they have however
subscribed to the basic principles of Lean. Lean has proven to be successful in
decreasing TAT, while increasing quality.
This literature review demonstrated that Lean implementation is possible within
the aerospace industry. Therefore counteracting any claims that Lean is only
applicable to a mass production environment and not to the low volumes, high
specialisation, highly regulated, high value industry of aerospace. Lean is being
successfully implemented internationally and is seen as being necessary to
maintain AMOs competitiveness. According to Moorman (2006) “factors helping
to reduce ….. maintenance costs and move hardware back on line faster include
greater use of PMA (i.e. non OEM) parts and ….. approved repairs, long term
OEM provided fleet and material management programs, predicative
maintenance solutions, partnerships and joint ventures and arguable the most
important, the adoption of Lean and Six Sigma”.
While several reports, articles and research studies are cited in the literature
review regarding Lean implementation in AMOs internationally, minimal
research has been done to determine the extent of Lean within South African
AMOs. This research report intends to address that gap.

84
3 RESEARCH METHODOLOGY
3.1 Introduction
This research report aims to determine the status of Lean implementation within
South African AMOs. This chapter of the research report covers the methodology
that was used to conduct the research.
The five principles of Lean, detailed in the book Lean Thinking (Womack and
Jones, 2003), form the basis of the structure of this research report. The principles
are;
• value,
• value stream,
• flow,
• pull,
• perfection.
The literature review supported the process and was undertaken to determine;
• if Lean implementation is possible in the aviation maintenance industry,
considering the stringent requirements as set out by CAAs,
• the status of Lean implementation in AMOs internationally,
• the success or otherwise of Lean in AMOs internationally.
A questionnaire, Appendix B, based on the five Lean principles, was used in face
to face interviews of senior South African AMO management personnel. The
resultant data is presented in Chapter 4, based on the responses shown in
Appendix C. A qualitative approach is used to analysis the open ended questions
responses, so as to determine:
• the extent of Lean implementation with South African AMOs,
• the understanding of Lean terminology by South African AMO
management,

85
• where Lean is found to be implemented, has it proven to be successful or
otherwise,
• whether Six Sigma and/or TOC have been implemented instead of Lean.
The qualitative approach is taken as the data obtained is in the forms of words,
gathered by the author, using the interviewees’ interpretation, knowledge and
observations (Yin, 2003). Also the author is subjectively immersed in the subject
matter, due to being employed in the AMO industry, as opposed to remaining
objectively separated, as would be required for quantitative analysis (Yin, 2003).
3.2 Population selection criteria
To ensure the validity of the research a population selection was made of South
African based AMOs.
The SACAA lists aircraft AMOs according to province and type of aircraft
operations supported. Refer Table 3.1.
Table 3.1 South African provinces and number of AMOs
Province AMOs
Large Commercial Aircraft Operations
AMOs
Helicopter Operations
AMOs
General Aircraft Operations
Limpopo 0 0 1
Mpumalanga 2 1 6
KZN 0 6 10
North West 2 0 0
Free State 1 1 6
Northern Cape 0 0 0
Gauteng 24 15 55
Eastern Cape 0 1 10
Western Cape 1 8 6
Total 30 32 64
(SACAA, 2010)
According to the South African fleet data register (Avdex, 2010) there are 13260
South African registered aircraft. 7266 aircraft hold valid certificates of
airworthiness. The fleet consists of fixed wing, rotorcraft and lighter than air
86
aircraft. 7.6% of the airworthy fleet is defined as large aircraft i.e. greater than
5700Kg.
This research report is with regard to AMOs that maintain large fixed wing
turbine powered aircraft engaged in commercial air transport operations. South
African AMOs that maintain these aircraft where chosen to form the population
because;
• they hold the approval necessary to engage in the maintenance of aircraft
of a size and range that can be flown internationally between competing
AMOs,
• unlike engine or component AMOs, where cost is related to spare parts,
more than two thirds of airframe maintenance is related to labour (Airline
Fleet Management (2009). Consequently airframe heavy maintenance is
outsourced to regions with lower labour rates combined with the
efficiencies that Lean can offer,
• small aircraft, due to their limited flight range, are mainly serviced within
their home country, thereby international AMO competition for business
is very limited. AMOs serving small aircraft are spread throughout South
Africa and surveying them is beyond the finances and time available to
the author,
• maintenance of large piston aircraft e.g. DC3/DC6 is a declining niche
market due to the retirement of these aircraft, as a result of their age and
high operational costs. These aircraft are now flown primarily as classic
aircraft for their historic value by aviation enthusiasts,
• 80% of these AMOs are located within Gauteng province, conveniently
within range of the author to conduct research,
• according to Remenyi and Money (2006), it is seldom easy to collect
suitable evidence for research and some organisations are not prepared to
give time to researchers or are suspicious of them and thus do not allow
access to staff. The author has 15 years experience working within large
fixed wing aircraft South African privately owned AMOs and was

87
therefore able to used this network to access one member of managerial
staff,
• research of rotorcraft AMOs was not conducted as it may be perceived as
a form of industrial espionage which could effect the reputation of the
author’s employer; a helicopter AMO and OEM.
Further analysis of the list of South African AMOs released by the SACAA
revealed that 24 AMOs are applicable to this research paper.
Table 3.2 Provincial location number of large turbine fixed wing commercial aircraft AMOs
Province AMOs Large Commercial
Aircraft Operations
AMOs applicable to this
research report Comment
Mpumalanga 2 2
North West 2 1 One AMO ceased trading
Free State 1 0 AMO maintains turboprop
aircraft
Gauteng 24 20
Two AMOs listed by the
SACAA have merged
Merged company surveyed
Three maintain large piston
classic historic aircraft only
Western Cape 1 1
Total 30 24
Nine AMOs where selected for interviews, as according to Eisenhardt (1989,
p.545) a number of cases between four and ten usually works well. Fewer than
four and empirical grounding is likely to be unconvincing and if there are more
than ten cases, it quickly becomes difficult to cope with the complexity and
volume of the data. Of the nine AMOs interviewed, eight AMOs hold SACAA
approval for large aircraft. The sample size of eight AMOs represents one third of
the population of South African AMOs, that maintain large fixed wing jet
powered aircraft, engaged in commercial air transport operations.
The persons interviewed where selected using non-probability purposive key
informant sampling technique (Jankowicz, 1995). The interviewees’ occupied
managerial positions. According to Ahrens (2006) and Achanga (2006), if Lean
implementation is not fully integrated in a company’s management system, it is

88
very often not successful. One of the critical factors for Lean implementation is
top management commitment and support because if employees do not see, feel
and believe in a real commitment from upper management, nothing much will
happen. This involvement and support should not only be verbal but also factual,
with managers participating in shop floor activities and continuous improvement
events. Therefore, the respondents’ knowledge of Lean would reflect it chances
of successful implementation.
The interviewee is a purposive key informant, chosen on the basis of their
idiosyncratic specialised knowledge, rather than being chosen randomly
(Jankowicz, 1995). That is not to say that small scale Lean techniques have not
been implemented by personnel within the company, unbeknown to senior
management. Such implementation is not Lean as it is just contained within an
individual process and it does not consider the company holistically with regard
to the principles of Lean.
3.3 Data collection technique
Various forms of data collection where considered, as described in Table 3.3,
prior to conducting the research.
Table 3.3 Comparison of main structured techniques for data collection
Technique Disadvantages Advantages
Email/Postal
High refusal rate
High possibility the answers are given by somebody other than
the intended
Low success rate with boring but necessary questions
Medium success in avoiding missed questions
High chance of avoiding
“interviewer” bias
Telephonic Medium control over inclusion of all population in sample
Medium acceptability of longer list of questions
High chance of controlling bias due to
selective non response
Face to face
Low chance of avoiding interviewer “bias”
Low chance of avoiding bias due to social desirability of
answers
Likely acceptability of longer list of
questions
High chance of control over inclusion
of all population in sample
High chance of controlling bias due to
selective non response
(Extracts from Jankowicz, 1996)

89
According to Jankowicz (1996) there is no single best method of data collection.
The face to face interview technique was selected by the author because;
• of the ability to amplify the meaning of items within the research,
• of the ability to explain the intentions behind the research,
• of the number of questions required to conduct the research.
The verbal face to face interview was guided by a set of structured questions. The
structured interview technique was selected as it promotes standardization of both
the asking of questions and the recording of answers. The aim is for all
respondents to be given exactly the same interview stimulus as any other. The
goal of this style of interviewing is to ensure those respondents’ replies can be
aggregated and this can only be achieved reliably if those replies are in response
to identical clues (Bryman, 2001). As per Bryman (2001), the questions were
read out exactly and in the same order as they where printed on the schedule. All
interviews where conducted by the author of this report to eliminate interviewer
variability.
Prior to the interview the interviewees where not informed that the research was
regarding Lean. Each respondent was contacted telephonically and asked to
participate in research regarding AMO procedures. The interviews where
approximately 70 minutes in duration during which the interviewees where asked
44 primary questions. 92 applicable sub questions where asked, based on
responses to the primary questions.
Where possible interviews where conducted at the interviewees’ place of work.
Interviews of interviewees at Olivier Thambo International Airport where
conducted off site, due to security access requirements. One Rand airport
interviewee agreed to be interviewed at the author’s office, due to scheduling
difficulties.
Remenyi and Money (2006) state that questions should be accompanied by
observations. Hand written field notes where taken by the author on the

90
questionnaire during the questioning sessions to record impressions as they
occurred, in addition to the responses to the set questions. According to
Eisenhardt (1989), during interviews it is better to react rather than shift out what
may seem important, because it is often difficult to know what will and will not
be useful in the future. The hand written notes where typed into electronic format,
within 48 hours of the interviews, and any additional impressions recorded.
In order to gain access to management personnel, confidentiality was offered to
all interviewees. Two interviewees, belonging to the smallest companies, agreed
to release their name and company details. Because such a large percentage of the
AMOs requested anonymity, it was decided to assign Company ID letters to all
the companies. Should the author wish to continue research, following this
research report, demonstration of such confidentially within the industry is vital
for future access to participants or other persons and/or companies they may
recommend.
3.4 Questionnaire design
According to Remenyi and Money (2006) it is important to create a set of
questions to support the actual evidence collection processes. The questions are
set for the interviewer and not for the respondent and are in reality reminder or
prompts to the interviewer concerning the information which is to be collected.
Appendix A contains the reminder prompts for the interviewer and details
regarding the information to be collected. The questionnaire design was based on
the five Lean principles (Womak and Jones, 2003). These principles form the
propositions, which besides reflecting important theoretical issues; also begin to
tell where to look for the relevant evidence (Yin, 2003).
3.5 Pilot study
A pilot study is necessary as it helps in understanding if the approach being
proposed will be effective and also helps develop more relevant lines of
questioning (Remenyi and Money, 2006). A pilot was first tested on a person

91
working in the aviation industry and thereafter opinions sought from the research
report supervisor. It was found that the pilot questionnaire was too detailed and
would involve an interview session in excess of two hours, which would be too
long to occupy the time of a manager.
The questionnaire was changed so that questions where grouped into sections
since this allows a better flow, rather than skipping from one topic to another.
Within each group of questions, general questions preceded specific ones
(Bryman, 2001), with questions regarding Flow and Pull being combined so that
the questionnaire followed a logical sequence. Deliberate bias in the questions
was avoided. According to Foddy (1993 cited in Bryman, 2001, p.117),”the
second question is always open ended, so that the respondents’ frames of
reference can be established with respect to the topic at hand”. It has been argued
that when a specific question comes before a general one, the aspect of the
general question that is covered by the specific one is discounted in the minds of
respondents because they feel they have already covered it.
3.6 Amendments to questionnaire during survey
Three amendments to the questionnaire occurred while conducting the survey:
• A section of the questionnaire asked for staff numbers per company
department, aircraft trade and qualifications held. Several respondents
could not give accurate figures. For companies that are involved in AMO
activities and aircraft operations, this portion of the questionnaire was
changed to enquire about how many people worked in each division.
• A section of the questionnaire included an inspection of the AMOs so as
to observe if the principle of 5S and visual controls are being
implemented. Due to respondent time constraints and access/security
issues to the majority of facilities, this proved not to be possible except
for one AMO. The results of this portion of the questionnaire was
therefore removed from the survey results.
• A section of the questionnaire required the obtaining of a copy of the
company SACAA capabilities listing and the company organogram but

92
questioning proved sufficient to obtain this data. The organogram at the
majority of the AMOs contain person’s names and as the majority of
AMOs requested confidentiality this portion of the questionnaire was
omitted.
3.7 Amendments to population after survey
Nine AMOs where surveyed, however during analysis of data one AMO was
found not to hold SACAA approval on large fixed wing turbine powered aircraft,
engaged in commercial air transport operations. It held SACAA approval only on
engines. However it holds other African state approval on large fixed wing
turbine powered aircraft. The author decided to keep the AMO as it is a South
African AMO but due to its international business model does not have the
requirement to obtain SACAA approval for aircraft.
3.8 Questionnaire format
The questionnaire is contained in Appendix B. The questionnaire is divided into
five sections, these being:
• Section 1, questions regarding company details such as size and approvals
held.
• Section 2, questions based on the five principles of Lean regarding current
processes being employed at the AMOs.
• Section 3, questions regarding Lean terminology.
• Section 4, questions regarding AMO’s Lean implementation status.
• Section 5, questions regarding knowledge and AMO’s implementation
status of Six Sigma and Theory of Constraints.
The first two sections of the questionnaire intentionally do not use any
terminology specific to Lean. Only in the remaining sections of the survey is the
term Lean and its specific terminology used, because the respondent/company
may already be implementing Lean and;

93
• do not know specific Lean terminology and/or understand it under a
different name,
• use of the specific Lean terminology, if known by the respondent, may
sub consciously direct their answers to satisfy what the respondent wishes
the interviewer to hear and therefore submits the survey to bias,
• as per Bryman (2001), potentially embarrassing questions or ones that
may be a source of anxiety should be left till later. In fact research should
be designed to ensure that as far as possible respondents are not
discomforted and the respondent’s acknowledgement of lack of
knowledge of Lean may cause such discomfort, even though elements of
Lean may be implemented.
3.9 Data presentation and analysis
Thematic Content analysis is employed for analysis. Per Dooley (2002), this is to
determine whether a particular theme observed in one case was also present in
other cases using structured analysis for the purposes of identifying patterns. No
quantitative data is requested from the respondent. The data is presented per the
sections of the questionnaire, these being;
• Section 1, which records company details such as size, approval held,
• Section 2, displaying the data from individual cases according to the five
Lean principles thereby determining the current status of Lean within
South African AMOs. This worktable will display whether the principle
has been implemented or not, by looking for similarities coupled with
differences (Eisenhardt, 1989),
• Section 3, displaying a positive or negative understanding of Lean
terminology,
• Section 4 of the questionnaire, status and experiences of Lean
implementation,
• Section 5 of the questionnaire, knowledge and implementation status of
Six Sigma and Theory of Constraints.

94
The results of the survey are subject to qualitative content analysis to analyze the
processes currently being used within the AMO, so as to determine;
• if Lean is being implemented,
• the respondents knowledge of Lean,
• the extent Six Sigma and the Theory of Constraints knowledge and
implementation as an alternative to Lean.
Based on the data analysis a conclusion on the current knowledge and status of
Lean implementation with South African AMOs should be reached.
3.10 Research limitations and comments
Numerous limitations where identified during the creation of this research report,
these being;
• the research report survey is based on the presumption that the interviewer
and respondent share the same meaning of terms with regard to the core
subject at hand. This is known as the problem of meaning, in this case the
South African aircraft maintenance industry. Whilst the problem of
meaning according to Bryman (2001) is resolved by ignoring it, this
survey was conducted by an aviation professional with other aviation
professional of a similar management position, working in the same
industry and province, therefore the problem of meaning, as set out by
Bryman (2001), should be reduced substantially,
• due to time and budgetary constraints, the survey was conducted with
only one person within each facility chosen using purposive sampling.
According to Jankowicz (1996), however, this has no particular
significance other than being more manageable in the time available in
creating a research report,
• the individuals who were interviewed are known to the interviewer from
having being co-workers, ex-managers, ex-employees or having
conducted business with the author. This could be perceived as
influencing the responses given to the questionnaire. These relationships,

95
however, allowed the interviewer access to persons that would otherwise
not have been possible,
• during the interview, the interviewer wrote down the survey responses.
According to Bryman (2001) there is the probability that the author may
not have written down all that was said, may embellish what was said, or
may misinterpret what was said,
• a simple random sample of the population was not undertaken which is
the principle way to guarantee the sample data represents a larger
population (Utts and Heckard, 2007). However, access to purposive key
informants would not have been possible without the author’s use of
personal contacts within the industry, thereby making a random sample
difficult in the time available,
• unintentional bias in the questions may have resulted in the way questions
where worded so that the meaning was misinterpreted (Utts and Heckard,
2007),
• qualitative data poses an obstacle to validity. If the researcher knows a lot
about the subject, personal biases might interfere (Krippendorff et al,
1980 cited in Kristen et al, 2002),
• only private sector AMOs where interviewed. Despite various efforts by
the author and persons known by the author, no access to management
personnel of the parastatal SAA technical was possible. This was due to
the fact that during the period of this research the facility was undergoing
a consultancy audit. According to Creamer (2010), SAA has appointed
aviation consultants SH&E to study the restructuring options for SAA
Technical. SH&E consulting services has Lean continuous process
improvement implementation, listed as one of its services (Berger, 2010).
This research report is therefore lacking data from state and parastatal
Companies.

96
4 RESULTS
4.1 Introduction
This portion of the research report presents the data that was collected and further
outlines the process that was utilized to extract the data from the interviewees.
The final results are also detailed herein. Refer to Appendix C for each
interviewees responses to the questions posed.
The research survey was structured into five main sections, with section 2 being
subdivided according to the five Lean principles of Womack and Jones (2003):
• Section 1: Interviewee information,
• Section 2: Current implementation status of each of the five Lean
principles,
o Value
o Value Stream
o Flow
o Pull
o Perfection
• Section 3: Knowledge of Lean terminology,
• Section 4: Current Status and experience of Lean Implementation,
• Section 5: Alternative production techniques understanding and their
implementation status.
Section 1 used close ended questions, with remaining sections using open-ended
questions to extract information to answer the research questions.
4.2 Interviewees’ information
Senior management from nine large fixed wing AMOs at four airports within
Gauteng province, South Africa, were interviewed. Each AMO is assigned a
letter, as the majority of persons interviewed requested anonymity.

97
Figure 4.1Location of AMOs interviewed
South Africa’s nine provinces Gauteng province with AMO airport locations shown
4.3 Interviewees’ profile
The managerial positions of the interviewees of the nine AMOs are illustrated in
Table 4.1 below. The Accountable Manager is a SACAA mandated position and
refers to the person who is responsible to ensure that the AMO operates in
accordance with SACAA legislation.
Table 4.1 Managerial position of interviewees
ID Managerial Position
A Executive Manager Engineering
B Administration Manager Technical Department
C Accountable Manager
D Accountable Manager and General Manager
E Quality Assurance Manager
F Engineering Manager
G Flight Line Manager
H Accountable Manager
I Executive Director Maintenance
4.4 Interviewees’ company details
This section of the questionnaire captured the information relating to the AMOs
themselves in terms of their size, business model and years in operation.

98
Table 4.2 below presents the AMOs details. Where a company is both an AMO
and an aircraft operator, the total staff includes technical staff and those involved
in aircraft operating such as pilots, baggage handlers, check in staff etc. Technical
staff are those working in the AMO itself including AMO support staff. Staff
numbers in facilities larger than 100 persons are rounded estimates by the
respondent. Third party work percentage illustrates how much work is from
external customer. 100% = all work is from external customers. 0% = only
company aircraft are maintained by the AMO.
Table 4.2 Overview of the nine AMOs that participated in the survey
AMO
ID
Years in
Business
Years in Current
Facility
Size of
Facility Activities
Company
Staff
AMO
Staff
% Third Party
Work
A 1 >10 4 acres AMO 700 700 100
B 12 >10 4000m2 AMO &
Operator 220 30 0
C 1.5 1.5 No accurate figure
AMO 37 37 100
D 12 >10 3900m2 AMO &
Operator 8 6 75
E 15 8 16000m2 AMO &
Operator 180 60 100
F 17 2 6000m2 AMO &
Operator 110 37 60
G 15 Currently moving Currently moving
AMO &
Operator 800 150 0
H 1.5 1.5 2100m2 AMO 6 4 100
I 11 8 2200m2 AMO &
Operator 160 60 20
Figure 4.2 illustrates ownership and geographical spread of the physical AMOs
facilities. According to Womack and Jones (2003) centralised facilities enable
flow and allow employees immediate knowledge of whether the job has been
done right and the status of the entire system. In a continuous flow layout the
production steps are arranged in a sequence and this is easier to achieve if the
facility is built as a Greenfield facility by the user or can be modified by the user
if they own the physical facility. Greenfield is defined as a facility that the current
AMO occupying it designed and built it according to their specifications.

99
Figure 4.2 AMO facility status
0%
10%
20%
30%
40%
50%
60%
70%
80%
90%
100%
Company processes in one
building
Leased Facility Own facility "Greenfield" facility
NO
YES
Figure 4.3 illustrates the CAA approvals held by the AMOs for maintenance on
large turbine powered fixed wing civil aircraft. SACAA = South African
approval, FAA= USA approval, EASA =European approval, African CAAs =
approval from African CAA other than the South African SACAA, IOSA =
IATA operational safety audit standard for aircraft operators, ISO 9000 = ISO
9000 family of standards.
Figure 4.3 CAA approvals and standards held
0
2
4
6
8
10
SACAA FAA EASA African CAAs IOSA ISO 9000
CAA Approvals and standards Held
No. of C
om
pan
ies
Figure 4.4 illustrates which maintenance actions the AMOs have the capability
and CAA approval to perform. Light checks = checks from line maintenance up
to and including B checks. Heavy checks = checks larger than B checks. Paint =
full fuselage paint strip and repaint. Modifications = implementation of
modifications that are pre approved by the OEM with no specialised

100
design/calculations performed by the AMO. Manufacture = holding approval by
CAA to manufacture parts that can be installed on aircraft.
Figure 4.4 Maintenance specialties performed by the AMOs
0
2
4
6
8
10
Light
Che
cks
Hea
vy C
heck
s
Avi
onics R
epai
r
Shee
tmetal
Rep
air
Com
posite R
epair
Engin
e Bor
osco
pe
Engin
e Ove
rhau
l
Uph
olste
ry
Pain
ting
ND
T
Spec
ializ
ed P
roce
sses
e.g. P
latin
g
Mod
ifica
tions
Man
ufac
turin
g
Prop
eller O
verh
aul
Train
ing
Process for which CAA approval held
No. o
f C
om
apan
ies
NDT = Non Destructive Test
4.5 Current implementation status of each of the five Lean principles
This section of the questionnaire was split according to the five principles of
Lean as described in Lean Thinking (Womack and Jones, 2003), which formed
the basis of the questions posed.
4.5.1 Value
This section of the questionnaire intended to capture the AMOs’ implementation
status of the first principle of Lean; Value. Table 4.3 illustrates the interviewees’
response to questions regarding their customers and the service they provide to
their customer. Operator type is a description of the user/owner of an aircraft
such as military operators, AMOs that lease out aircraft, business jet operators
etc.
Table 4.3 Understanding of customer and product/service being supplied
No of Responses Operator
Type
Specific Customer
Name
Specific
Aircraft Type
AMO
Services
Mentioned
service/customer other
than an aircraft operator
In one sentence who are
your customers? 6 3 0 0 0
In one sentence, what
product/service is your
business supplying the
customer?
5 2 1 4 0

101
Table 4.4 below illustrates the results from the respondents when they were asked
which department or positions communicate with the customer regarding their
needs prior to aircraft being received by an AMO.
Table 4.4 Communication with customer
No of Responses Operations
Dept
Senior
Management
Engineering
Manager
Marketing/Customer
Relations Department
Department/person
communicating with
customer
2 3 2 2
Table 4.5 below illustrates the outcome when the interviewees where asked how
they determine customers needs, how often and by what means they interact with
their customers.
Table 4.5 Determining customer needs
No of Responses Yes No Customer supplies
maintenance requirements
AMO advises customer on
maintenance requirement
Formal method exists for
determining the customer’s needs 4 5 6 1
Further questions where posed regarding whether a formal method existed to
determine customer satisfaction following work completion, what method is used
and how soon after delivery of the aircraft to the customer.
Table 4.6 Determining customer satisfaction
No of Responses Yes No Currently
Implementing
Meth
od
Verbal Electronic Paper Not Done
Formal method
exists to determine
customer
satisfaction
following delivery
5 2 2
4 2 1 4
Within 1 Day < 1 week
1-2
Weeks
No Time
set
2 1 2 4
Note: Verbal includes telephone. Several communication methods may be implemented by an AMO.
The interviewees where asked whether they record their customer satisfaction
against set service standards, such as on time delivery (OTD) and defects.

102
Interviewee where asked about AMOs OTD where 100% = all aircraft delivered
on time to customer, OTD 0% = no aircraft delivered on time to customer.
Table 4.7 Determining customer satisfaction against set service standards
No of Responses Yes No 90-100%
OTD
80-89%
OTD
70-79%
OTD
Unknown
OTD Formal method exists to determine customer
satisfaction following work completion against
set service standards.
5 4 4 1 2 2
The interviewees where then asked if the AMO had key performance indicators
(KPIs) standardised across the company.
Table 4.8 KPIs
No of Responses Yes No Currently Implementing
KPIs standardised across the company 0 7 2
Table 4.9 below illustrates the results when the interviewee where asked
questions regarding how often the AMO interacted with the customer and who
initiates the visits. The customer being potential customers, historic customers
and existing customers. Communications with the customer while aircraft is
undergoing maintenance or communications regarding financial issues, such as
invoices, are excluded.
Table 4.9 Communication with customer
No of Responses Company Visits
Customer
Customer Visits/
Resides at Company
Both Options No Visits
Form of visits between
customer and AMO 0 2 6 1
Regularity of visits
between AMO and
customer
Daily/Once a Month
or less
Between Once a Month &
Once a year
Once a Year No Set
Interval
3 2 1 3
The second set of questions regarding Value implementation intended to
determine the AMOs pricing methods in order to determine if target costing is
implemented in the AMOs. Figure 4.5 illustrates the outcome when the
interviewees where asked if they know their cost of production.

103
Figure 4.5 Knowledge of cost of production
0
1
2
3
4
5
6
7
Yes No
Response
No o
f C
om
pan
ies
Table 4.10 below illustrates how the price of the product provided to the
customer is calculated, how often it is reviewed, by what means and by whom.
Table 4.10 Price determination
No of Responses Compare to Competitors Customer negotiated Not Known
How is the price of your
product calculated 4 3 2
How often is price
reviewed
Before each contract Bi-annual Annually
4 1 4
Who determines price to
charge customer
Marketing Department Senior
Management
Financial
Manager
Not clearly
defined
1 4 1 3
4.5.2 Value Stream
This section of the questionnaire intended to capture the AMOs implementation
of the second principle of Lean; Value Stream. Figure 4.6 illustrates the outcome
when interviewees where asked questions regarding whether they had procedures
in place for all processes, not just those procedures that required recording to
show compliance with aviation legislation in order to obtain approval to operate
from a civil aviation authority. In addition, the interviewees where asked if they
believed documenting the process added value to the operation of the company,
whether they believed the documented processes reflect reality and whether the
staff knew the recorded processes. The interviewees where also asked if they have
considered and subsequently mapped the complete process from its beginning to
the end product.

104
Figure 4.6 Process recording and mapping
0%
10%
20%
30%
40%
50%
60%
70%
80%
90%
100%
Formal procedures in
place, not just for CAA
Documented processes
reflect actual processes
Believe staff know the
written processes
Documented processes
add value
Mapped out the
processes
Res
po
nse
Yes No Not sure/In process
Table 4.11 illustrates the outcome when interviewees where asked questions
regarding who creates and reviews the written processes, how often the processes
are reviewed and in what format the processes are presented to staff.
Table 4.11 Process creation, review and presentation
No of Responses Each Department
Manager
Quality
Department
Senior
Manager
Group of all
department heads
External
Contractor
Who writes the
original Process? 2 2 3 1 1
Who reviews the
process? 0 2 5 1 1
Presentation Format
of Processes
Text Flow Chart Combination
4 0 5
How often are
processes reviewed?
More than Once a Year Annually No set period
3 3 3
4.5.3 Flow & Pull
This section of the questionnaire intended to capture the AMOs implementation
of the third and fourth principles of Lean; Flow and Pull. To avoid duplication of
questions and to ensure the interview flowed logically, questions regarding Flow
and Pull where combined in one section.

105
The first set of questions regarding flow and pull intended to determine the AMOs
methods of work scheduling. Figure 4.7 below illustrates the response to
questions regarding whether the AMOs have AMO industry specific computer
software. Do they track work in progress (WIP)? Is the company software
integrated across all departments such as stores, finance etc.?
Figure 4.7 AMO computer software
0%
10%
20%
30%
40%
50%
60%
70%
80%
90%
100%
Maintenance tracking/WIP
software system in place
Software is AMO specific Capabilty to track defects and
WIP
All AMO software functions
integrated
Res
po
nse
NO
YES
Table 4.12 below illustrates the source of the AMOs specific software utilised by
the AMOs
Table 4.12 Process creation, review
No of Responses Foreign South African Company Developed
AMO specific software source 6 2 1
The second set of questions regarding flow and pull where intended to determine
the extent to which AMOs have implemented standardised work practices. Figure
4.8 illustrates the extent to which processes are standardised within the AMOs,
with further questions intending to determine if standardisation extends to the
sequence of tasks within a major task. The interviewees where also asked to
specify if the AMO support staff are arranged per project or according to their job
function.

106
Figure 4.8 Process standardisation
0%
10%
20%
30%
40%
50%
60%
70%
80%
90%
100%
Standardised workcards
in place
Work sequence of a
maintenance check
standardised
Standard production
times for each task
Specific manhours
assigned to each stage
of the individual tasks
AMO support staff
arranged per project
Res
po
nse
No
Yes
The third set of questions regarding flow and pull intended to determine the
extent to which AMOs have implemented takt time. Table 4.13 below illustrates
the extent to which AMOs have implemented visual controls, their accessibility,
format and who is responsible for updating the data contain therein.
Table 4.13 Visual controls
No of Responses Yes No
Visual controls in place 4 5
The Format project
status is displayed
Computer Screen Display Board Paper in File N/A
2 3 1 3
Person who updates
project status
Data Capturer Crew Chief N/A Update
period
Continuously Daily N/A
3 3 4 2 2 5
Persons with access to
project information
Confidential, access controlled On general display Crew Chief N/A
1 3 1 4
The forth set of questions regarding flow and pull intended to determine how
AMOs managed their inventory. Figure 4.9 illustrates the outcome when
interviewees where asked questions regarding inventory kept, inventory costing
and whether there was standardised inventory lists for routine schedule work and
that required to rectify common defects found during maintenance.

107
Figure 4.9 Inventory control
0%
10%
20%
30%
40%
50%
60%
70%
80%
90%
100%
Inventory kept Inventory turnover
known
Cost of storing
inventory considered
Standardised inventory
lists for maintenance
checks
Standardised nventory
lists for common defects
Res
po
nse
No
Yes
Table 4.14 below illustrates means of determination what inventory is to be kept
in stock and where such inventory is primarily sourced from.
Table 4.14 Inventory ordering
No of Responses Basic Average Usage
Calculation
Statistical
Analysis
Guess
work
Spares Ordered
as required
Consignment
Stock
Method for determining
inventory 3 0 3 2 1
Responsible for compiling
standard maintenance
check inventory list
Store /Logistic
Department
Supplied by
Operator
Senior Technical
Person
Senior
Management
5 1 2 1
Aircraft inventory received
from country
USA UK France Other EU
7 3 2 2
4.5.4 Perfection
This section of the questionnaire intended to capture the AMOs implementation
of the fifth principle of Lean; Perfection. The survey sought to determine the
company’s status as regards the pursuit of perfection by questioning the AMOs on
their strategic goals, continuous improvement programmes and benchmarking
exercises.
Figure 4.10 illustrates the responses to questions regarding the existence of AMO
strategic goals, continuous improvement programmes and benchmarking.

108
Figure 4.10 Continuous improvement and benchmarking
0%
10%
20%
30%
40%
50%
60%
70%
80%
90%
100%
Strategic goals set for company Formal method of continuous
improvement in place
Benchmarking against other companies
performed
Res
po
nse
No
Yes
4.6 Knowledge of Lean terminology
This section took the form of closed questions and consisted of questioning the
interviewee on their knowledge of the most commonly used Lean terms. If the
interviewee claimed they knew the term they where asked to further explain their
understanding of the term. Figure 4.11 below illustrates how many interviewees
have heard of the Lean term and on further questioning whether they understood
the term correctly.
Figure 4.11 Knowledge of Lean terminology
0
1
2
3
4
5
6
7
8
9
Lean Muda Value Stream Target Cost Ultimate
Customer
Takt Time Kaizen 5s JIT
Lean Terminology
No
of
Res
po
nse
s
Term has been heard of. Accurate description of term received.

109
4.7 Current status of Lean implementation
This section took the form of open questions and consisted of questioning the
interviewee on whether they are implementing or have tried to implement Lean.
Figure 4.12 below illustrates the responses to the question.
Figure 4.12 Percentage of AMOs implementing Lean
4.8 Current status of Six Sigma & TOC implementation
This section consists of questioning the interviewees on their implementation
status of two other common philosophies; Six Sigma and Theory of Constraints
(TOC). The interviewees where asked if the knew the terms Six Sigma and TOC,
whether they have been implemented or intend to in the near future. Figure 4.13
illustrates how many respondents have heard of the terms Six Sigma and TOC
and on further questioning whether they understood the term correctly.
Figure 4.13 Six sigma and TOC knowledge
0
1
2
3
4
5
Six Sigma Theory of Constraints
Term has been heard of Accurate description of term

110
4.9 Conclusion
All the results presented in Chapter 4 above are analyzed and discussed in
Chapter 5 where the results above are categorised by the research questions posed
and are then addressed with reference to the literature review of Chapter 2.

111
5 DISCUSSION OF RESULTS
5.1 Introduction
This chapter analyses the interviewees, their AMOs and the data as presented in
Chapter 4, in conjunction with the literature reviewed in Chapter 2. The analysis
is presented in the sequence of the research questionnaire sections, as stated in
Chapter 4.
5.2 Overall analysis of the AMOs surveyed
Management of nine privately owned Gauteng based civilian commercial fixed
wing turbine aircraft AMOs where interviewed, according to the research report
methodology of Chapter 3. These AMOs represent 37.5% of a population size of
24. The AMOs are located as shown in Figure 4.1 and are diverse in size, number
of employees, business model and years in business, as shown in Table 4.2. The
expectation is to see if these factors influence the status of Lean implementation
within the AMOs.
5.2.1 AMO personnel interviewed
Nine technical managers where interviewed, as shown in Table 4.1. As discussed
in the research methodology of this research report, Chapter 3, according to
Ahrens (2006) and Achanga (2006), if Lean implementation is not fully
integrated in a company’s management system, it is very often not successful.
5.2.2 AMOs years in business and physical characteristics
The status of Lean implementation is dependant on the length of Lean
deployment and those companies implementing Lean for more than five years are
more likely to have extended Lean to all levels, all facilities and multiple
functional groups across the organisation (Littlefield, 2008). Therefore the years
the company has been in business and occupying its facility affects the success or
otherwise of Lean.

112
Over two thirds of the AMOs sampled have been in business in excess of 10
years, the remainder being “start ups” within the last 2 years. Five of the AMOs
have been in their current facility in excess of five years. Refer Table 4.2.
According to Womack and Jones (2003) having processes in one physical
location enables pull and flow, however leasing of buildings restricts capability to
physically alter the building to achieve efficiencies. The company’s physical size,
Table 4.2, facility ownership and whether all AMO processes are in one building
is shown in Figure 4.2. AMO facilities range in size from less than 4000m2 to
about 4 acres with one third of the AMOs occupying their current facility in
excess of ten years. All the AMOs, except one, occupies one site. Those AMOs
which are part of an aircraft operator occupy more than one facility, with aircraft
operations being a separate facility. This diversity may show a relationship with
Lean implementation according to years in business, or facility build and
occupation.
Figure 4.2 illustrates how many of the AMOs occupy purpose build “greenfield”
facilities, which may influence the implementation of Lean push/pull/flow
techniques. However, according to Wickens (1995, p.297) there are many
examples where there is no requirement to have a Greenfield site to make major
changes, arguing that “the key to success is not a greenfield site but a greenfield
mind”.
5.2.3 AMOs staff number, business model and approvals held
Company size demands different behaviour and attitudes but while relevant the
number of employees is not by itself decisive. A large force of employees may
well be a fairly small business in every other respect, especially in structure and
behaviour (Drucker, 1989, p. 225-226). The AMOs’ sampled have staff numbers
ranging from 6 to 700 staff, Table 4.2.

113
The AMOs sampled operate according to four AMO business models:
1) Three AMOs are solely AMO businesses and do not have aircraft
operations. Two of these AMOs in the past where part of an aircraft
operation but have been now set up as independent companies.
2) Two AMOs are part of an aircraft operation which is its sole customer.
3) Three AMOs are part of an aircraft operation but also provide AMOs
services to other customers.
4) One AMO is part of an aircraft operation but does not own the aircraft.
Instead it operates them for the owners. It supplies maintenance services
to these aircraft and other customers.
The AMOs hold approval not just from the SACAA. Refer Figure 4.3. Two of the
AMOs holding EASA approval also hold FAA approval. One third of the
facilities are therefore exposed and complying with best international CAA
standards. One third of the AMOs hold standard other than those required by
CAAs.
Figure 4.4 shows the capabilities of the AMOs. All the AMOs are involved in
heavy aircraft maintenance checks, with the majority also engaged in light checks
and the implementation of modifications, which are pre-approved by the OEM.
The literature review of Chapter 2 contains several examples of successful
implementation of Lean amongst AMO internationally performing the self-same
tasks. The majority of AMOs questioned outsource their avionics/electrical work
and engine overhauls. No AMO sampled performs manufacturing/design,
painting (except for paint touch ups) or specialised processes, such as
electroplating. Two thirds of the AMOs have a training function for in house
staff, recognised by the CAA. These are for apprentices, cabin staff etc. therefore
possessing formal methods of dissipating knowledge to their staff.
5.2.4 Summary
The population sampled are all engaged in the same primary activity of heavy
maintenance of heavy turbine powered fixed wing aircraft. Therefore it is

114
possible to compare the responses to the questionnaire due to the commonality of
the basic product supplied despite the variation in staff and physical sizes, years
in business and business models used. The accuracy of the results depends on the
variety of different groups in the population rather than on the size (Jankowicz,
1995, p.165).
The author is expecting to see variation in the survey results dependant on
company’s years in business, physical size, layout and source of CAA approval
held. There should not be a variation in Lean implementation status according to
staff numbers. The larger staffed AMOs, however, are closely involved directly
in aircraft operation and this may be found to effect Lean implementation status.
5.3 Current implementation status of each of the five Lean principles
The second section of the questionnaire attempted to determine the
implementation status of Lean within the nine AMOs and was split according to
the five Lean principles, as described in Chapter 2.2.3.
5.3.1 Lean Principle 1: Value
According to Womack and Jones (2003) the critical starting point for Lean is
value. Value is only meaningful when expressed in terms of a specific product
which meets the customer’s needs at a specific price at a specific time. The
questionnaire queried the interviewees on;
• who they believed their customers are,
• what they perceived to be the service they provided to their customers,
• who and how often the AMO communicates with the customers regarding
their needs (what the customer values),
• how they determined what to charge their customers.
Specific data regarding financials figures, aircraft maintenance check duration
times offered to customers and customer satisfaction was not requested from
interviewees. It is AMO common practise that such sensitive commercial data is
not made public knowledge, therefore interviewees would not be allowed to
divulge such data.

115
Customer and service provided
Value is created by the producer but can only be defined by the ultimate customer
and is only meaningful when expressed in terms of a specific product that meets
the customer’s needs at a specific price at a specific time. In addition Liker (2004,
p.279) explains that there may not only be one ultimate customer but several,
therefore you have to consider their collective value system.
In the companies surveyed it was found that in response to who they perceive as
their customers, Table 4.3, two thirds of the respondents mentioned a specific
operator type as their customer such as business jet aircraft, a leasing company or
an airline. The remaining AMOs specified a particular customer name. Only one
customer was mentioned by any of the respondents and all those customers were
external to the AMO. The respondents did not appear to understand the meaning
of internal customer when questioned on who they perceived to be their internal
customer. Those AMOs that are part of an aircraft operating company mentioned
the operations portion of the company as a customer but did not classify them as
either an external or internal customer.
In response to questions regarding product/service being supplied, all respondents
stated maintenance services as their product. Five AMOs specified AMO services
for a particular operator type, one AMO for a particular aircraft type and two
AMOs for a specific customer name, as 100% of their business is with that
customer.
The next set of questions sought to establish how the AMOs communicates with
their customer to determine their needs and what the customer values. There is a
difference between needs and expectations. Customers expect AMOs to supply
aircraft maintenance but to identify the customer’s needs; one has to
communicate with the customer (Wickens, 1995).

116
Customer communication
Liker (2004, p.278) states that a company should “identify the customer needs
and the processes that support or add value to deliver those needs” by using
systematic methods (Drucker, 1995). Wickens (1995, p.182) argues that the most
successful companies have the most demanding customers but it means
developing the relationship so that it becomes one of partnership. “This means,
for example, ensuring that the technical staff meet with your customers to ensure
that you have a precise understanding of their needs and use of your product….
that you know the quality of service provided and how they perceive your
product in relation to your competitors”. Communication with customer also
allow the AMO to plan future maintenance requirements, in accordance with the
customers’ maintenance schedule so as to therefore enable work to be scheduled
in order that Muri and Mura issues are eliminated or reduced.
Within the AMOs surveyed, those who communicate with the customer regarding
their needs varied from senior management to the marketing department. Two
AMOs have the engineering/technical department communicating with the
customer. Refer Table 4.4.
The regularity of the communication with the customer, Table 4.5, revealed that
whilst specific communication intervals where given by certain AMOs, the
impression received was that some intervals may be an aim that is not necessarily
being achieved. Three AMOs have no set interval for communications with
customers and two AMOs meet customers between once a month and once a
year. No AMO depended solely on visiting the customer, with two thirds of the
AMOs visiting and receiving visits from the customer. Three AMOs involved in
line maintenance had contact more than once a month, often daily. This is due to
the operational nature of line maintenance as all maintenance is perceived as
urgent in order to keep aircraft serviceable. This communication would be of a
technical nature related to a specific problem. Two AMOs had customer
representatives on site full time.

117
Knowing the frequency of visits, further questions where asked to determine how
customer requirements were determined. Refer Table 4.5. Two AMOs had a
formal method of determining customer needs, two AMOs had a process but it
was difficult to determine if it was being followed, the remaining five AMOs had
no formal method of determining customer needs. The AMOs operating a fleet of
aircraft depended on their own in house planning department to supply details on
their customer needs.
Having determined if the customer needs where formally assessed the AMOs
were asked how they determined if the customer was satisfied. The two KPIs
mentioned by all respondents where aircraft serviceability and on time dispatch.
No other KPIs where mentioned by any of the respondents.
Five AMOs tracked customer satisfaction. Of the four AMOs that do not do so,
two are in the process of implementing a customer satisfaction tracking system,
but currently track on time deliveries only. One AMO mentioned that they are
very transparent with the customer regarding all costing, man-hours and mark-
ups and this is how they gauge customer satisfaction. Of the AMOs that have a
follow up process in place, it is mainly via verbal communication within 2 weeks
of delivery. Of those AMOs that have no standard customer follow up process in
place, one admitted they follow up intermittently, and have requested their
quality department to perform follow up inspections on their fleet following
delivery. Two of the largest AMO facilities had no formal follow up process
regarding customer satisfaction. One small AMO facility mentioned that if the
customer had a problem they would get a call of complaint very quickly. It
should be noted that some of the AMOs with the highest on time delivery rates of
the sample group, according to their own measurement systems, do not have a
formal process to determine if the customer was satisfied following delivery.
Further questioning regarding KPIs being set for each individual working within
the AMO revealed that none of the AMOs sampled had such a process, however
two AMOs are in the process of implementing KPIs against each job description.

118
Target Cost
The most important task in specifying value, once the product is defined, is to
determine a target cost based on the amount of resources and effort required to
make a product of given specification and capabilities if all the current visible
muda were removed from the process (Womack and Jones, 2003).
The majority of AMOs did not know their cost of production. Refer Figure 4.5.
One respondent, with decades of experience, employed by a large AMO stated
that he “doubts anybody in any AMO industry really knows their true costs”.
This lack of knowledge regarding target costs reflects the maintenance industry’s
lack of knowledge regarding the true cost of maintenance as detailed in this
research report’s literature review, Chapter 2.3.8. Aircraft operators find it
difficult to benchmark their cost of operation. Boeing has admitted that the actual
cost of maintenance is little understood and in still in the process of being defined
(Buyers, 2010).
The calculation of the price to charge the customer, Table 4.10, is performed by
senior management in four AMOs. Three AMOs have a process that is not clearly
defined, according to the interviewees. Four AMOs based their price on
comparison with the competitor’s manhour rate, three AMOs negotiate the rate
for each contract with the customer prior to work commencement. Two
respondents did not know how the rate they charge the customer is calculated as
they are not privy to such information. Four AMOs review their rates annually
and one AMO bi-annually. One respondent replied that they vary their rates
depending on their workload i.e. reducing the manhour rate if they foresee empty
slots in their hangar.
None of the respondents mentioned fixed price or power by the hour as a method
used to charge their customers. According to Broadhurst (2010), however,
internationally “maintainers used to charge by the hour for the necessary work to
maintain aircraft, this developed into fixed pricing and then to concepts such as
power-by-the-hour”. South African maintenance providers base their rates

119
primarily on the prevailing local AMO market rates, which are primarily
technician manhour rates plus mark-up on spares supplied.
Summary
It can be concluded that AMOs provide the customer with what they perceive as
being what the customer expects. The AMOs believe their customers, aircraft
operators, expect airworthy aircraft delivered on time following completion of
maintenance. Communication with the customer regarding their needs is very
limited and not conducted in a systemic manner. The pricing of maintenance is
based on the prevailing AMO manhour rate because AMOs technical
management do not know their cost of production or target cost.
5.3.2 Lean Principle 2: Value Stream
The second principle of Lean is value stream. The questionnaire queried the
interviewees on the;
• existence of formal procedures within the AMO, other than those legally
required by the CAA,
• whether such processes where mapped, so as to create a value stream.
In order to go Lean, there is a need to understand customers and what they value.
To get the company focused on these needs, value streams must be defined
(Hines and Taylor, 2000). According to Womack and Jones (2003) what really is
needed is to manage whole value streams for specific goods and services required
by the customer. Also once the target cost is set; it becomes the lens for
examining every step in the value stream. The preceding questions regarding
Value are intended to determine the AMOs’ relationship with their customer
values and their knowledge of their target cost. However the responses to the
Value questions influences the responses to the value stream questions, as
determination of customer needs and knowledge of target costs are limited
amongst those interviewed.

120
Processes
Literature review, Chapter 2.3.2, discussed the requirement that AMOs
demonstrate to the CAA their adherence to legislation so as to hold a license to
operate. Therefore procedures must be in place to show such compliance in the
form of a Manual of Procedures (MOP). Since all the AMOs hold CAA
approvals, such procedures were taken as being in place. The AMOs were asked
if they have formal procedures in place for all their processes not just those as
required by the CAA, Figure 4.6. Two thirds of the respondents said they had
recorded such procedures.
One respondent stated they had added procedures with regard to BEE compliance
and in response to labour law issues experienced in the past during staff
disciplinary actions. Three AMOs put in place processes, as they are operators
subject to IATA Operational Safety Audit (IOSA) requirements, in order to
ensure the continued operation of their aircraft under IATA approval. One
respondent was subject to an intensive audit by one of their primary customers,
an international NGO, and in response recorded all their processes, in order to
maintain the contract. Therefore it is evident that these additional processes are
recorded so as to comply with legal requirements, not for the reason of increasing
efficiencies.
20% of respondents believe that their documented processes reflected actual
processes. Refer Figure 4.6. The majority of the respondents stated that their staff
knows the written processes, which is a CAA requirement, and two thirds of the
respondents believe written processes add value to the company. Therefore, while
the respondents believe written processes improve business efficiency, the
majority of recorded processes, which the staff is taught, do not in fact reflect
reality. It can be assumed that recording such processes and teaching of such is
undertaken as an exercise simply to ensure compliance with legislative issues, not
to improve the business as would be the case when implementing Lean.

121
Processes are currently recorded in segments, with each processes being a unique
section within the AMO’s MOP. The processes are primarily recorded in a text,
flow chart combination. Refer Table 4.11. One AMO utilises a flow chart format.
While most AMOs presented the procedures in written format many respondents
commented on their desire to present the procedures only in flow chart format but
time availability is an issue.
To further understand how the processes where created, questions where asked
on who created the processes and how often they where reviewed. Refer Table
4.11. Processes are written by individual departmental managers or senior
management in five of the AMOs, with two AMOs delegating the task to their
quality department. Review of the processes is performed by senior management
in two thirds of the AMOs. Annual reviews occur at three AMOs. Three other
AMOs review procedure more than once a year, normally to coincide with
scheduled CAA inspections or in response to audit findings by external
inspectors. The remaining AMOs have no set review period.
Further questioning of the respondents revealed that persons actually performing
the processes are consulted in an informal manner with regard to recording the
process. One respondent revealed that they created and reviewed processes by
gathering all the heads of departments in one place, at set intervals; a technique
started within the last year. The respondent in this case admitted they did it in
response to major findings from an audit by a customer that constituted the
majority of their business. A contract they could not afford to loose. The group
review proved very beneficial in the opinion of the respondent. He is now very
strict in applying and following up compliance with the procedure and believes
the written procedures add great value to their AMO. As a result the AMO is now
starting to perform limited mapping of their processes, but is a work in progress.
Further questioning revealed that no AMOs have mapped processes from
beginning to end as a single value stream. Refer Figure 4.6. One AMO, however,
is in the process of such mapping.

122
Summary
Womack and Jones (2003, p.37) argue that “just as activities that cannot be
measured cannot be properly managed, the activities necessary to create, order
and produce a specific product which cannot be precisely identified, analysed and
linked together cannot be challenged, improved (or eliminated altogether) and
eventually perfected”. Overall the findings of this research report show that value
stream mapping does not occur. South African AMOs mainly record their
processes in order to show compliance to an externally auditor and not in an
effort to increase productivity, improve quality and reduce waste. The majority of
the AMOs admit that the recorded processes do not reflect reality. Process
recording is perceived, by the majority of AMOs, as an additional CAA
administrative burden, in order to maintain their approval to conduct business.
5.3.3 Lean Principles 3 & 4: Flow & Pull
The third and forth principle of Lean are Flow and Pull respectfully. According to
Liker (2004, p.88 & 105) “flow is at the heart of the Lean message. Shortening
the elapsed time from raw materials to finished goods, or services, will lead to the
best quality, lowest cost and the shortest delivery time. Pull means giving the
customer what he or she wants, when he or she wants it, and in the amount he or
she wants”. Once value has been precisely specified and the value stream for a
specific product fully mapped, then the remaining value creating process should
flow by letting the customer pull the product (Womack and Jones, 2003).
The questionnaire queried the interviewees on:
• work scheduling and computer software used,
• standardised work procedures and use of visual controls,
• inventory management.
The responses to the questions in this section are influenced by the fact that none
of the AMOs have accurately recorded their processes or performed value stream
mapping (VSM).

123
Work scheduling and computer software
Work scheduling allows for the elimination or reduction of Muri and Mura, while
providing the customer with their requirements. Focusing exclusively on muda
can actually hurt the productivity of people and the production system (Liker,
2004). All the AMOs surveyed had specialised AMO software packages in place
at their facilities which tracked inventory, scheduled work and work in progress
(WIP), such as defects. Refer Figure 4.7. One third of the AMOs have integrated
software. At those AMOs without integrated software it is the finance department
that uses different software.
The majority of the AMOs software is sourced internationally. Refer Table 4.8.
One AMO creates software in-house. The majority of AMOs are therefore
exposed to international best practices in AMO software.
While all the software systems tracked defects and WIP, the review of such data
via a formal method by management ranged from daily to no set schedule. AMOs
involved in the operation of aircraft tended to have daily meetings, which are for
reviewing defects to ensure aircraft availability and serviceability to operator.
Where the software formed part of an integrated system, access to the data was
limited, in order to prevent persons accessing confidential data, such as
financials. Refer Table 4.13.
Standardised work and visual controls
Work should be standardised “so that a team follows the same approach every
time. Because if every team in a firm also follows the standardised work, it is
possible to accurately measure throughput time and to continually improve the
design methodology itself” (Womack and Jones, 2003, p.54). This technique
needs to be coupled with visual controls ranging from 5S to status indicators and
key measurable, as “everyone involved must be able to see and understand every
aspect of the operation and its status at all times” (Womack and Jones, 2003,
p.61).

124
All the respondents replied that their AMO have standardised workcards in place
with man-hours being assigned to the main tasks. Refer Figure 4.8. The man-
hours not split up per subsection of the main task. AMOs are supplied jobcards or
maintenance manual extracts by the OEMs that list the actions to be
accomplished and in which order, in order to perform a particular action e.g.
install an engine. Each of those tasks within the jobcard is signed off by a person
holding suitable CAA approval to demonstrate compliance with the actions as
mandated by the OEM. The majority of respondents replied that the jobcard
sequence completion was at the discretion of the crew chief and they only tracked
total man-hours consumed and major milestones and/or final delivery date
compliance. One respondent replied that it standardised how the sequence of
workcards are carried out. But this was only when it came to grouping the
workcards per major aircraft subsections such as empennage and wing, and not
the sequence of tasks within the subsection.
Visual controls existed at four of the AMOs, in the form of white boards, updated
by persons working on the aircraft using a non permanent marker. The aircraft
crew chief is responsible for updating and distributing the information to those
working on the aircraft, with what appears to be no set standard for visual
controls. Each aircraft crew chief recorded the information on the visual control
as he/she saw fit. It appears the most common visual control recorded is that of
major defects found.
Project staff organisation
All replied that AMO support staff is arranged per department not per project,
Figure 4.8, with persons physically working on the aircraft being assigned per
project. Womack and Jones (2003) believes the Lean approach is to create truly
dedicated product teams with all the skills needed to conduct value specification,
general design, detailed engineering, purchasing, tooling and production planning
in one room in a short period of time. This team approach is not evident in the
AMOs surveyed.

125
Inventory
According to Womack and Jones (2003) the worst features of the warehouse
systems were size of bins, inefficient use of storage space, and the size of the
batches ordered as replenishments.
As South Africa does not contain a large OEM industry for civil aircraft, parts are
primarily obtained from foreign countries: mainly the USA and Europe, Table
4.14. The spares normally arrive within 48 to 72 hours if express shipped. Some
respondents preferred shipping consignment stock in order to save on the
additional charges for express shipping.
The majority of respondents did not know their inventory turnover or take into
consideration the cost of storing inventory. Refer Figure 4.9. Two respondents
replied that they do not keep inventory, one of which has a large consignment
stock on site controlled by the consignor, with the other orders all parts when
required. Those respondents are the largest and smallest, according to staff and
physical size, AMOs surveyed respectfully.
While most AMOs have standardised inventory lists for scheduled maintenance
checks, the majority did not have standardised inventory listings for common
defects, Figure 4.9. The method for determining inventory is mainly that of using
basic averaging techniques of historic part usages with the addition of an
arbitrary margin for error. Refer Table 4.14. No respondent mentioned that they
use any recognisable statistical methods to determine stock to be held. Most
AMOs delegate inventory determination to their stores/logistics department.
Summary
The AMOs surveyed do not appear to operate according to push/pull principles.
Staff is arranged departmentally. The use of visual controls is limited. The
majority of AMOs are dependent on the information recorded on their software
systems.
While the customer supplies a listing of maintenance check requirements, which
are according to OEM requirements that do not vary vastly between aircraft of

126
the same type, the maintenance checks are not formally standardised using
experience from previous checks in order to improve the process. The
maintenance check task implementation order is at the discretion of the aircraft
crew chiefs. Most respondents are of the belief that you cannot standardise the
maintenance check due to defects that will be discovered during performance of
such maintenance. This concentration on the defects appears to have distracted
the AMOs from concentrating on the scheduled work which forms the majority
of man-hours utilized to perform a routine maintenance check. There appears to
be limited pre planning with regards to those defects that are most common, with
most AMOs ordering spares as and when defects are discovered, believing this to
be a JIT system.
No evidence regarding the use of pulse maintenance, refer chapter 2.2.5, a form
of maintenance task standardisation which is becoming more common within the
global AMO industry, was apparent during interviews with the respondents.
5.3.4 Lean Principle 5: Perfection
The fifth Lean principle is perfection. According to Womack and Jones (2003)
facilities should compete against perfection. High achievers set specific
timetables to accomplish seemingly impossible tasks and then routinely meet or
exceed them. The questionnaire queried the interviewees on their;
• strategic goals,
• continuous improvement programmes,
• benchmarking.
According to Womack and Jones (2003) spending significant amounts of capital
to improve specific activities is pursuing perfection the wrong way, as most value
streams can only be radically improved as a whole. As the concepts of value
stream and its related techniques of flow and pull are not fully implemented in
any of the AMOs surveyed, perfection of the entire process would not be possible
as per Womack and Jones requirements.

127
Strategic goals
Figure 4.10 shows that approximately half the respondents stated that their
AMOs have strategic goals, which are mainly set by the board/chairman. Further
questioning regarding communications and tracking compliance with those
strategic goals appears to show that none of the AMOs have a formal method of
communicating those goals to staff members. The most common technique for
communication of AMO goals was that of a staff meeting or an informal staff
group event, such as a braai. There was no evidence presented of a formal
tracking measurement of goal achievement or progress towards the goals set out.
One respondent however mentioned that his AMO is at present starting to distil
each of the strategic goals into employee’s KPIs.
Continuous improvement
According to Womack and Jones (2003) continuous improvement is necessary as
no matter how many times a given activity is improved there is always more
ways to remove muda, such as by eliminating effort, time, space and errors. One
respondent stated they had a form of continuous improvement. However, the
programme is not of a formal/structured nature with no set time lines, budgets or
scheduled meetings. According to Womack and Jones (2003) the greatest
difference between those organisations that have done a lot and those that have
accomplished little or nothing is that the high achievers set specific timetables to
accomplish seemingly impossible tasks and then routinely met or exceed them.
Further questioning of the respondents revealed that the improvement
programmes that do exist are as a result of findings by external auditors/quality
inspectors of customers or as a result of reoccurring problems that need
immediate rectification. All AMOs are subject to audits by CAAs, and their
customers, mainly aircraft operators. The results of such audits are communicated
to the Accountable Manager or Quality manager with a deadline for audit finding
rectification so that the AMO may retain its license to operate from a CAA, or
retain a contract from a customer. The response to such findings is seen by
respondents as an improvement programme, however, the findings are normally

128
with regard to very specific issues, such as compliance with a specific piece of
legislation.
Benchmarking
Womack and Jones (2003) advocate that a company should compete against
perfection, not just their current competitors. But in order to be able to gauge the
gap from current reality to perfection, the respondents were asked if they
benchmarked themselves against any other company and what they used as a
benchmark.
The most common bench marks, where they existed, are;
• aircraft dispatch reliability. AMOs which formed part of an aircraft
operator mainly used against published data of US operators of the same
aircraft type,
• charged manhour rates for AMOs
The respondents admitted that they found it difficult to benchmark themselves
and comments received included;
• “we found it difficult to benchmark against other South African AMOs,
due to lack of data and would love the results of this research report, so
we could benchmark ourselves”
• “which AMO would we look at? Where would I get the data?”
Summary
With regard to perfection, the nine AMOs appear to have no general strategic
goals formally communicated to staff. Continuous improvement in the pursuit of
perfection was not found to be evident at any of the AMOs surveyed. The
respondents have a desire to measure their performance against other AMOs but
do not know how to proceed in obtaining such data.
5.3.5 AMOs Knowledge of Lean
The third section of the questionnaire attempted to determine knowledge of Lean
and its terminology amongst senior management of AMOs, whether obtained
through implementation of Lean, formal Lean training or any other method such

129
as reading trade publications or attending conferences. Prior to this section of the
questionnaire the respondents where not exposed to any Lean terminology in the
proceeding questions.
Each of the respondents was asked if they heard of a specific Lean term. If they
responded positively, they were further questioned on their knowledge of the
term. A concise definition of the term was not sought but a general understanding
of the term was recorded as a positive understanding. Results are as illustrated in
Figure 4.11. The responses to each of the terms are as follows:
Lean
Four respondents professed knowledge of the term Lean with one respondent
admitting having heard of the term but did not know its meaning. One respondent
said the AMO was very Lean, as they “where not making money yet, as they are
a recent start up”.
On further questioning three respondents were accurate in their description of
Lean and on further investigation it became evident that two of the respondents
where exposed to Lean via a presentation that Embraer aircraft had given their
AMOs. The other respondent had read about Lean in a magazine article.
Muda
The term Muda was not known by any of the respondents.
Value Stream
Two respondents replied that they had heard of the term value stream. On further
questioning one respondent accurately described value stream. He was an
attendee of the Embraer presentation. The other respondent could not give an
accurate description of Value Stream.
Target Costs
The term Target Costs, while receiving the second greatest number of
positive responses with regard to identification of the term was however

130
subject to mainly educated guesswork regarding its meaning. All responses
were a variation of a theme on “cost to aim for”, but no respondent
mentioned specifications or waste removal as being a part of Target Costs.
Ultimate customer
Ultimate Customer was a term acknowledged by four respondents who all stated,
in various forms, that in their opinion the ultimate customer was the entity that
pays the invoice. No respondent mentioned the ultimate customer as being the
final recipient of a product/service, as per Womack and Jones (2003).
Takt Time
Two respondents heard of the term Takt Time. One respondent correctly
described Takt Time, and on further questioning revealed that Takt Time formed
part of his part time engineering studies. The other respondent had heard of the
term at an Embraer course but admitted he could not remember its exact
definition.
Kaizen
One of the respondents who attended an Embraer course identified and correctly
defined the term Kaizen.
5s
Two respondents acknowledged knowledge of the term 5Ss. One respondent,
who had attended the Embraer course, remembered one of the Ss, that of Shine.
The other respondent could not remember any of the five Ss.
JIT
Eight respondents correctly stated that JIT is an abbreviation of Just in Time.
Further questioning regarding the JIT philosophy varied widely and included
such statements as:
• “most of our stuff is JIT, its called, make a plan”
• “it’s called pull finger”

131
One respondent identified it as a Toyota methodology, while another recognized
knowledge of the supply chain was critical for JIT to be implemented. One
respondent of a large AMO stated:
• “Just In Time is not really applicable to an AMO as it’s an
automotive thing. I cannot see it working in aviation, maybe a
production line like Boeing. It’s not that simple to implement”.
JIT is understood by the respondents of having parts delivered to the
AMO “just in time” to meet an erratic schedule. JIT, however, is a
technique for facilitating smooth flow where downstream production
steps practice level scheduling to smooth out day to day order flow,
unrelated to actual customer demand (Womack and Jones 2003).
Summary
This research report shows that knowledge of Lean terminology is very
limited amongst the management staff of the nine AMOs surveyed. Two
AMOs, which are part of a company operating Embraer aircraft, have a
limited knowledge of Lean. Embraer have introduced the concepts of
Lean by means of presentations to these companies but they are yet to be
fully implemented.
5.3.6 Lean implementation & experience
The purpose of this section of the questionnaire was where Lean is found to have
been implemented, to question the respondent if implementation had proven
successful in increasing quality and productivity while reducing costs. This
questioning was intended to have taken the form of open ended questions, but
Lean was found not to have been implemented at any of the AMOs questioned, as
shown in Figure 4.12.
One facility, however, after attending an Embraer course had recently
implemented a small project on one aircraft required for maintenance check
completion prior to the 2010 FIFA World Cup. They compared it to another
aircraft of similar check size. The control maintenance check overran its end

132
target date by 2 weeks, with the Lean maintenance check achieved output 5 days
prior to its scheduled output date. As the questionnaire was conducted during the
World Cup month of June 2010, the respondent could not comment on further
Lean implementation intentions, as the maintenance check was still being
reviewed.
5.3.7 Six Sigma and TOC implementation status
This purpose of this section of the questionnaire was to determine the
respondents’ knowledge of the two production philosophies that are normally
associated with Lean, mainly Six Sigma and Theory of Constraints (TOC).
The trend in AMOs internationally and as institutionalised at many USAF depots,
Canaday (2004) is to apply Lean first and then monitor with Six Sigma when
flow is stabilized. Thereafter use TOC principles to highlight bottlenecks,
enabling ways to look for root causes and applying Lean to remove or reduce
them.
The respondents were first asked if they knew of the terms Six Sigma and TOC
and if they respondent positively they where then asked question regarding their
understanding of the terms. Refer Figure 4.13.
Six Sigma
Four respondents had heard of the term Six Sigma, but two respondents admitted
they did not know what it meant. One respondent stated that Six Sigma applied to
the automotive industry but did not know the concept. The remaining two
respondents knew the basic philosophy of Six Sigma, with one having learnt the
term during his current part time engineering studies and the other during a
presentation by Embraer.

133
Theory of Constraints
Two respondents heard of the term TOC but one of the respondents admitted to
only having heard of the term but did not know what it is. The other respondent
provided an accurate description of TOC
Summary
The intention of the questionnaire, where Six Sigma or TOC was found to have
been implemented, was to discover why they where implemented instead of Lean
and whether their implementation had improved the operations of the AMO.
Such questioning, however, proved to be unnecessary. This research report shows
that knowledge of Six Sigma and TOC is very limited amongst the nine AMOs
surveyed and that they have not been implemented. Neither was it perceived that
there is any intention for their implementation.
5.3.8 Conclusion
Lean implementation is not evident in any of the AMOs surveyed.
Knowledge of Lean, TOC and Six Sigma is very limited amongst the
management personnel surveyed. There is not much variation between
the management philosophies adopted by the AMOs surveyed according
to their size, business model or length of time in business. The only
variation observed is related to aircraft type maintained. Two AMOs,
which are divisions of companies operating Embraer aircraft, have a
limited knowledge of Lean. Embraer have hosted a Lean information
session in South African for their operators, however, the AMOs have not
yet implemented Lean.
The only criteria motivating the management of the South African AMOs
surveyed appears to be ensuring compliance with CAA regulations and
OEM instructions. The international discussion regarding Lean
implementation in AMOs and the associated philosophies of TOC and Six
Sigma appear to have not been acknowledged or recognized by South
African AMOs.

134
6 CONCLUSIONS AND RECOMMENDATIONS
6.1 Introduction
This research report was conducted using the framework of the five principles of
Lean of Womack and Jones (2003) to;
• demonstrate that Lean can be implemented in AMOs, while meeting the
stringent requirements of OEMs and regulatory authorities,
• show the international extent of Lean implementation in AMOs and the
results,
• determine the status and results of Lean implementation in South African
AMOs,
• determine weather Six Sigma and/or TOC have been implemented in
conjunction with or instead of Lean, the reasons why and the results.
This research report has determined that South African AMOs have not
implemented Lean and that they have a lack knowledge regarding the principles
of Lean. This section outlines the key conclusions from the report and makes
recommendations for future research.
6.2 Conclusions
6.2.1 Lean and AMOs internationally
The literature review of this research report demonstrated that, despite stringent
OEM and regulatory requirements to ensure flight safety, Lean has been
successfully implemented in AMOs and OEMs internationally. Lean
methodology is being used on civil and military, fixed wing and rotary,
passenger, cargo and business jet aircraft. Lean is now part of the lexicon of the
global AMO industry and is identified, by many AMOs, as being necessary to
compete in the global AMO market place. Globally AMOs are embracing the
concepts of Lean.

135
6.2.2 Lean and South African AMOs
Management personnel, at nine Gauteng based AMOs, where subject to face to
face interviews to determine the status of implementation of the five principles of
Lean within their AMOs. At present Lean, in any form, is not being embodied at
any of the surveyed South African AMOs., apart from one limited test
implementation.
Knowledge of Lean and its terminology is very limited amongst the persons
surveyed. Lack of knowledge of Six Sigma and TOC was on par with that of
Lean. No AMO was implementing, or intended to implement, these principles
instead of or in conjunction with Lean.
There appears to be no recognisable production philosophy in place at any of the
AMOs surveyed. The only principle that appears to be in existence is that of
compliance with CAA regulations and on time aircraft departure.
South African AMOs are of the belief that aircraft maintenance, by its nature, is
unpredictable due to the defects that may be found during performance of a
maintenance check. Efforts to control this unpredictability seem not to have been
considered in depth. There will always be some level of task uncertainty within
AMOs due to aircraft defects. But the use of Lean to reduce unscheduled
maintenance events and the time it takes to respond to them can have a huge
impact on an AMOs productivity and profit.
This lack of any production philosophy, be it Lean, Six Sigma, TOC or another,
may be detrimental to the future competitiveness of the South African AMO
industry. The South African AMO industry, the author believes, is where the
USA industry was in the 1990s, as summarized by Taylor and Christensen (1998,
p.164), “the culture resists fundamental change. It’s cautious, conservative. By its
very nature, it’s slow to apply lessons learned in other industries, even in other
airlines. The maintenance culture rests on a proud tradition that has now become
its worst enemy. One ideal has defined and sustained the maintenance culture
136
since its inception, serving as its central organising principle, that of the self
sufficient, rugged individual. This idea has made maintenance what it is. But
what led to so much success for so long is now responsible for the industry’s
failure to adapt as well as it might. The world has made the lone gun obsolete.
But maintenance still acts as if it had not. Maintenance has not yet internalised
the full meaning of this wide angle systems view. The machine model still
prevails: one part, one person, one time. Maintenance culture takes on one
symptom at a time quite well, but it is simply not hardwired to handle the larger
system issues that continue to produce all kinds of new symptoms, endlessly”.
While this research report was conducted to determine the status of Lean
implementation in South African AMOs, it is apparent that privately owned
South African AMOs are not implementing any modern industrial management
techniques whatsoever. There therefore exists a requirement to expose and assist
privately owned South African AMOs in understanding and implementing
modern AMO management techniques, such as Lean, to ensure their future
viability in the face of increasing global competition.
At present South African government and support structures appeared to be
primarily aimed towards OEMs, parastatals or spin off from such parastatals.
Organisations, such as AeroAfrica –EU (Louw, 2010) and the Aerospace
Industry Support Initiative (AAD, 2010) make no specific mention of support to
the South African AMO industry. Their emphasis to support aerospace R&D and
OEM manufacturing in South Africa is admirable. But other nations, however,
have identified the maintenance of such systems as being an employment creator
and a valuable contributor to the creation of a sustainable and competitive
aerospace sector.
Limitations
This research report was limited to one senior management person in nine
privately owned, Gauteng based, AMOs maintaining large turbine powered fixed
wing aircraft. The reasons are time constraints, budgetary constraints, lack of

137
access to parastatal AMOs and the author’s employment in the rotorcraft
industry.
6.3 Recommendations
As mentioned in the introduction, South Africa is faced with increased
competition from Middle East, Far East and possibly Chinese AMOs based on
the African continent. Considering this increasing global competition, the
conclusion and limitations listed above, recommendations for future research are;
• an enlarged survey population to include all South Africa’s large aircraft
AMOs, including rotorcraft, interviewing persons at various positions
within each AMO. The interviewees mentioned that they have never been
interviewed before regarding their industry. They expressed a desire to
obtain benchmarking data and further information on current trends
within the South African AMO industry,
• to analyze the Lean implementation experiment conducted by one of the
AMOs surveyed. This would be performed so as to determine how
implementation was performed and any issues arising, which may be of
interest to other AMOs seeking to implement Lean in South Africa,
• determine how initiatives such as AeroAfrica-EU and/or Aerospace
Industry Support Initiative could assist privately owned South African
AMOs to be globally competitive.

138
REFERENCES
AAD, 2010. Aerospace Industry Support Initiative Brochure. In: Africa Aerospace and Defence Exposition, Cape Town, 21 - 25 September 2010. Available at < http://www.aisi.co.za/uploads/AAD_Brochure.pdf> [Accessed 15 December 2010]. AC., 1997. Advisory Circular AC 121-22B [pdf]. US Department of Transportation Federal Aviation Authority. Available at < http://www.faa.gov/documentLibrary/media/Advisory_Circular/AC%20121-22B.pdf> [Accessed 12 November 2010]. Achanga, P., 2006. “Critical success factors for Lean implementation within SMEs”. Journal of Manufacturing Technology Management, Vol 17, Issue 4, Page 460-471. AFSO 21, 2007. AFSO 21 Concepts and Playbook. US Airforce [online]. Available at < www.af.mil/shared/media/document/AFD-070205-088.pdf> [Accessed 14 January 2010]. Agripion, M., Cathcart, T., Mathaisel, D., 2002. A Lean sustainment enterprise model for military systems. Acquisition Review Quarterly, Fall 2002, pp275-296. Ahrens, T., 2006. Lean Production: Successful implementation of organizational change in operations instead of short term cost reductions. Lean Alliance [online]. Available at < www.lean-alliance.com/en/images/pdf/la_lean_survey.pdf> [Accessed 14 January 2011]. Aircraft Technology, 2010. MRO Focus: South east Asia. Aircraft Technology Magazine, Issue 103, Dec-Jan 2010, pp12-16. Airline Fleet Management. 2009. MRO World Forecast Report. Airline Fleet Management, Issue 64, Nov-Dec 2009, pp38-48. Amazon, 2011. Amazon.co.uk Best Sellers Rank [online]. Available at <www.amazon.co.uk/Lean-Thinking-Banish-Create-Corporation/dp/0743231643/ref=sr_1_1?ie=UTF8&qid=1305451630&sr=8-1> [Accessed 15 May 2011] Amazon.com Best Seller Rank [online]. Available at <www.amazon.com/Lean-Thinking-Corporation-Revised-Updated/dp/0743249275/ref=sr_1_1?ie=UTF8&qid=1305451918&sr=8-1> [Accessed 15 May 2011] Altfeld, HH., 2010. Lean Manufacturing in the Aircraft Industry. In: Royal Aeronautical Society presentation Toulouse France, 16th March, 2010. ATW, 2010. 2010 World Airline Report. Air Transport World, July 2010, pp52-84.

139
Avdex, www.avdex.co.za. South African Aircraft registry [online]. Available at < www.avdex.co.za> [Accessed 20 November, 2010]. Avitrader, 2010. The European MRO industry: The east steps it up and the west fights back. Avitrader, October 2010, pp 6-13. Barrett, B. and Fraile. L., 2005. Lean at the C-5 Galaxy Depot: Essential Elements of Lean. Massachusetts. MIT Lean Advancement Initiative [online]. Available at < http://web.mit.edu/ctpid/lara/pdfs/c-5.pdf> [Accessed 14 January 2011]. Bartholomew, D., 2009. Lean Thinking in Aircraft Repair and Maintenance Takes wing at FedEx Express. Lean Enterprise Institute [online]. Available at < http://www.lean.org/admin/km/documents/561AA639-B109-4AE6-B986-42CF19E3AF76-Fedexgolean1_final.pdf> [Accessed 14 January 2011]. Bekele, K., 2009. African MRO Market: Challenges and opportunities. Airline Fleet Magazine, Issue 63, Sept-Oct 2009, pp58-68. Bekele, K., 2011. Ethiopian Airline’s CEO retires leaving a legacy of massive development. World Airnews, February 2011, pp58-59. Bellows, B., 2009. “Reflections on the Fabric of the Toyota Production System”. Lean Management Journal. Nov/Dec pp 7-11. Berger, JM., 2010. MRO Trends. Global Update. In: Aircraft Maintenance Conference USA, Florida November 10, 2010. SH&E [online]. Available at < http://www.sh-e.com/presentations/berger_10-Nov-2010.pdf> [Accessed 14 January 2011]. Best, J., 2006. Flavour of the Month. Why smart people fall for fads. Berkley. University of California Press. Boeing, 2010. Current Market Outlook 2010-2029. Boeing [online]. Available at < www.boeing.com/.../Boeing_Current_Market_Outlook_2010_to_2029.pdf> [Accessed 15 November 2010]. Boeing, 2011. Company delivers 462 airplanes. [Press release] 6th January 2011. Boston Consulting group, 2009. Rethinking Lean: Beyond the shop floor. Wharton University of Pennsylvania [online]. Available at < http://knowledge.wharton.upenn.edu/papers/download/101109_SS_Rethinking_Lean.pdf> [Accessed 14 January 2011]. Bourn, J., 2007. Transforming logistics support for fast jets. London. UK National Audit Office. Report.
140
Bozdogan, K., 2010. Towards an integration of the lean enterprise system, total
quality management system, six sigma and related enterprise process improvement
methods. Massachusetts, MIT. Bryman, A., 2001. Social Research Methods. Oxford. Oxford University Press. Buyers, T., 2010. Optimizing Airplane Maintenance Economics. Boeing Aeromagazine, QTR_01, pp5-9. Canaday, H., 2004. Hunting for productivity gains. Overhaul & Maintenance, [online]. Available at <http://www.aviationweek.com/aw/generic/story_generic.jsp?channel=om&id=news/om904cvr.xml> [Accessed 14 January 2011]. Canaday, H., 2009. MROs Race to Speed TAT. Aviation Week [online]. Available at<http://www.aviationweek.com/aw/jsp_includes/articlePrint.jsp?storyID=news/om1209tat.xml&headLine=null> [Accessed 25 March 2010]. Canaday, H., 2011, Faster from shop to skies, Air Transport World, January 2011, pp55-57. Canaday, H., 2010, MROs race to Speed TAT, Aviation Week [online], 3 January 2010. Available at <www.avaiationweek.com/aw/generic/stort.jsp?id=news/om/2009/12/01/om_12_01_2009_p25-180265.xml&channel=mro> [Accessed 8 May 2011] Clark, N., 2010. French court convicts Continental in Concorde disaster. New York Times [online] 6 December. Available at < http://www.nytimes.com/2010/12/07/world/europe/07concorde.html?_r=1&src=me> [Accessed 14 December 2010]. Cool, C., 2004. Our Lean Journey and Evolution 1997-2004. MIT [online]. Available at < http://lean.mit.edu/component/docman/doc_download/34-the-northrop-grumman-lean-journey> [Accessed 10 March 2010]. Coutinho, A., 2007. Industrial Operations Overview. Embraer [online]. Available at < ri.embraer.com.br/Embraer/Download.aspx?id=9530> [Accessed 25 July 2010]. Crabill, J., et al., 2000. Production Operations Level, Transition to Lean Roadmap. Massachusetts. Lean Advancement Initiative, Massachusetts Institute of Technology, [online]. Available at < http://lean.mit.edu/component/docman/doc_download/77-production-operations-level-transition-to-lean-description-manual> [Accessed 14 January 2011].

141
Creamer, T., 2010. Consultant appointed to advise SAA on technical unit, no sale planned. Engineering news, [online] 18th August 2010. Available at < http://www.engineeringnews.co.za/article/consultant-appointed-to-advise-saa-on-technical-unit-no-sale-planned-2010-08-18> [Accessed 12 October 2010]. Deloitte, 2010. Increasing MRO efficiency Ways to better manage repair capability and capacity [Online]. Available at <www.deloitte.com/assets/Dcom-UnitedStates/Local%20Assets/Documents/us_ad_Increasing%20 MRO%20Efficiency_041510.pdf> [Accesses 15 May 2011]. Delta, 2010. Delta aircraft Fleet. Delta [online]. Available at <http://www.delta.com/about_delta/corporate_information/delta_stats_facts/aircraft_fleet/> [Accessed 10 January 2011]. Dicken, P., 1998. Global Shift. 3rd ed. London. PCP. Dickman, J., 2005. Lean Change at a crossroads: C-130 Depot maintenance at Warner Robins. Cambridge. LAI /MIT. Doan, C., 2010. The Global MRO Forecast 2010 – 2020. Team SAI Consulting Services [online]. Available at < http://www.teamsai.com/media/content/2010_teamsai_global_mro_forecast_100418-pm-final.pdf> [Accessed 15 November 2010]. Dobbs, D., n.d.. Experience in Lean Implementation: B-2 case Study. Defence Acquisition University [online]. Available at < https://acc.dau.mil/adl/en-US/18244/file/668/B-2_Case.doc> [Accessed 14 January 2011]. Dooley, LM., 2002. Case Study research and theory building. Sage Publications, Advances in developing Human Resources, Vol. 4 No.3, pp335-354 [online]. Available at < https://webdisk.ucalgary.ca/~nmstuewe/public_html/CaseStudy/pdf/CStheorybuilding.pdf> [Accessed 20 February 2010]. Doulle, E., 2008. Improvement of the Ecureuil main gear box assembly line. In: Black Belt Panel Assessment. Ottobrunn Germany, 6th February 2008, Germany, EADS. Broadhurst, M., 2010. Nature and importance of Aviation support Services and MRO. In: Aerospace and Defence Industries Association of Europe (ASD) Annual Convention, 7th October 2010, Montreaux, Switzerland. [online] Available at http://www.asd.europe.org/site/fileadmin/user_update/Convention_2010/Reports/Minutes_of_Workshop_1_-_FP8.pdf> [Accessed 10 January 2011] Drucker, P.F., 1989. The Practice of Management. 17th ed. Oxford. Heinemann Professional Publishing.

142
DTI, 2010. Industrial Policy Action Plan (IPAP 2) 2010/11 – 2012/13. Pretoria. South African Department of Trade and Industry. Economist, 2010. The Machine that ran too hot. The Economist, 27 Feb 2010. p.65. Economist, 2010. The World turned upside down. A special report on innovation in emerging markets. The Economist, 17 April 2010. pp 1-16. ECORYS, 2009. FWC Sector Competitiveness Studies – Competitiveness of the EU Aerospace Industry with focus on Aeronautics industry. Final Report. Rotterdam. ECORYS Research and Consulting. Eisenhardt, KM., 1989. Building Theories from Case Study Research. Academy of Management Review. Vol 14 No.4 P 532-550 [online]. Available at <http://pages.cpsc.ucalgary.ca/~sillito/cpsc-601.23/readings/eisenhardt-1989.pdf> [Accessed 15 February 2010]. EIU, 2011. Global outlook summary, Forecast closing date: February 11th, 2011. Economist Intelligence Unit, [online]. Available at< www.gfs.eiu.com> [Accessed 13th February 2011]. Ferdowsi, B., and Stanke, S., 2002. F-16 case study report. Massachusetts. Centre for Technology, Policy and Industrial Development, MIT. Case Study. Finigan, T. and Humphries, J., 2006. “Maintenance gets Lean: Synergies for step change”. Journal of Institute of Industrial Engineers. 38(10), pp. 27-31. Friend, C.H., 1992. Aircraft Maintenance Management. Singapore. Longman. Flint, P., 2011. An era of good fortune, Air Transport World, January 2011, pp26-31. Goldratt, E., 1992. The Goal. 2nd ed. Revised. Pretoria. Creda Press. Goold, I., 2010. Move on Up. MRO Management, Issue 4, December 2010, pp8-14. Grainger, 2008. Lean opportunities on MRO Procurement: Improved productivity and reduced waste. Grainger Consulting Services [online]. Available at < http://www.grainger.com/images/lean_mro.pdf> [Accessed 14 January 2011]. Haque, B., 2001. Case Studies in Lean Product Introduction. Warwick. UK Lean Aerospace Initiative report, University of Warwick. Harbison, I., 2009. Lean and Leaner. MRO Management Magazine June 2010. Harris, JL., 1984. Henry Ford. New York. Franklin Watts.

143
Hill, R., n.d.. Helicopter maintenance simplified to reduce time. Fort Rucker, Alabama. Hines, P. and Taylor D., 2000. Going Lean. Cardiff. Lean Enterprise Research Centre, Cardiff Business School. Holland, D., 2011. MRO global outlook 2011:An industry on the rebound. Aircraft Technology Engineering & Maintenance, April-May 2011, Issue 111, pp14-37. Holland, D., 2010. Creating space for MRO business. Aircraft Technology Engineering & Maintenance, December-January 2011, Issue 109, pp26-35. Holland, J. and Gubish, M., 2010. Global MRO market outlook 2010. Aircraft Technology Engineering & Maintenance, April-May, Issue 105, pp16-29. Howard, D., 2009. “Gold standard healthcare the Lean way”. Lean Management Journal. Nov/Dec pp 14-17. Hoyes, E., 2006. Wattisham Airfield has its finger on the Pulse. Defence Logistics Organisation. UK Ministry Of Defence [online]. Available at < http://www.mod.uk/NR/rdonlyres/6692EA31-9C5C-4911-A65A-EF0984EC283F/0/200609DrivingChangeU.pdf > [Accessed 14 January 2011]. Hoyle, C., 2010. World Air Forces. Flight International [online]. Available at < http://www.flightglobal.com/airspace/media/reports_pdf/world-air-forces-2010-78877.aspx> [Accessed 14 January 2010]. Huber, M., 2010. Rick pickings. The good times continue to roll at the VIP wide-body completion centres. Business Jet Interiors International, July 2010, pp18-25. IATA, 2011. Industry expects 800 million more travellers by 2014. [Press release]. IATA [online]. Available at <http://www.iata.org/pressroom/pr/Pages/2011-02-14-02.aspx> [Accessed 15 February 2011] IATA, 2010. Improving Safety Oversight. IATA [online]. Available at < http://www.iata.org/pressroom/airlines-international/april-2010/Pages/09d.aspx> [Accessed 15 December 2010]. IATA, 2010. IATA Fact Sheet Industry Statistics. IATA [online]. Available at < http://www.iata.org/pressroom/facts_figures/fact_sheets/Documents/industry-facts-december-10.pdf> [Accessed 10 January 2011]. ICAO, 2009. Overview of trends and developments in international air transport. ICAO [online]. Available at <http://www.icao.int/icao/en/atb/eap/OverviewTrends.pdf> [Accessed 12 November 2010]

144
ITC, 2004. National Research Council Canada. Principles of Lean Thinking [online]. Available at <www.itc.mb.ca/downloads/resources_by_topic/princ_lean%20thinking/PrinciplesofLeanThinkingRevD2004.pdf> [Accessed 15 May 2011] Jafar E., Mejos, T. and Yang, C., 2006. Lean Implementation Airspeed at J52 Engine Repair shop. In: Excerpts from Proceedings of the 4th annual acquisition research symposium. Naval Postgraduate School, Monterey, CA, USA. Jankowicz, AD., 1995. Business Research Projects. 2nd ed. London. International Thomson Business Press. Jenkins, M., 2002. Getting Lean. Boeing Frontiers [online]. Available at <http://www.boeing.com/news/frontiers/archive/2002/august/cover.html> [Accessed 13th March 2010]. Jobo, RS., 2003. Applying the lessons of ‘Lean Now” To Transform the US Aerospace Enterprise. Massachusetts. USAF-MIT Lean Advancement Initiative [online]. Available at < http://dspace.mit.edu/bitstream/handle/1721.1/7524/Applying+the+Lessons+of+?sequence=1> [Accessed 14 January 2011]. Kang, K., 2007. Lean Six Sigma Implementation for Military Logistics to Improve Readiness. In: Proceedings of the 4th annual acquisition research symposium of the Naval Postgraduate School, Monterey, California, USA May 16-17, 2007. Kearney, AT., 2003. Restructuring the Global Aerospace Industry. A.T. Kearney an EDS Company [online]. Available at < http://www.seaonline.org/docs/Restruct_aerospa-B5929.pdf> [Accessed 14 January 2011]. Kristen M., Jackson, KM. and Trochim, WK., 2002. Concept mapping as an alternative approach for the analysis of open-ended survey responses. Sage Publications, Organizational Research methods, Vol.5 No.4 [online]. Available at <http://www.socialresearchmethods.net/research/Concept%20Mapping%20as%20an%20Alternative%20Approach%20for%20the%20Analysis%20of%20Open-Ended%20Survey%20Responses.pdf> [Accessed 14 January 2011]. Lacey, LN. and Stein, A., 2003. Airline maintenance programs. A challenge for the appraiser. Morten Beyer & Agnew Inc. [online]. Available at < http://www.mba.aero/presentations/Airline%20Maintenance%20Programs%20_Parts%201%20and%202_.pdf> [Accessed 14 January 2011]. Lean Flight Initiative, 2010. [online] . Available at <leanflightinitiative.com/site/faq.asp> [Accessed 15 February 2010]. Laurenzo, R., 2005. Leaning on Lean solutions. Aerospace America.

145
Lean Flight Initiative, 2011.Available at <http://ww.leanflightinitiative.com/home.html> [Accessed 7 May 2011} LEI, 2010. The backbone of Lean in the back Shop. Lean Enterprise Institute [online]. Available at < http://www.lean.org/admin/km/documents/bddc0e3d-8ad5-41ca-b93d-074716b55436-sikorsky%20sucess%20story%20w.doc> [Accessed 15 March 2010]. Liebeck, RH., et al. , 1995. Advanced Subsonic Airplane Design & Economic Studies. NASA [online]. Available at <http://ntrs.nasa.gov/archive/nasa/casi.ntrs.nasa.gov/19950017884_1995117884.pdf> [Accessed 14 January 2011]. Liker, JK., 2004. The Toyota Way. New York. McGraw Hill. Littlefield, M., 2008. Extending the Lean Enterprise. Aberdeen Group Survey. Lopez, T., 2006. Air Force improving production with Smart Operations 21. US Airforce Print News, [online]. Available at < http://www.af.mil/news/story.asp?id=123013978> [Accessed 14 January 2011]. Louw, R., 2010. South African Priorities in Aerospace Technologies. In: AeroAfrica-EU Aerospace Roundtable, Cranfield Management and Development Centre (CMDC),, England 19, July 2010 . Available at < www.aeroafrica-eu.org/download/present_cran_01_jul2010.pdf> [Accessed 15 December 2011]. Malarvozhi, G., 2009. Irish MRO’s Lean maintenance. Articlesbase [online]. Available at< http://www.articlesbase.com/management-articles/irish-mros-lean-maintenance-798543.html> [Accessed 12 December 2010]. Malik, S., 2009. Lean Six Sigma: A High Tech Approach. In: ItWeb, Lean Six Sigma. Sandton, RSA, 10-11 June 2009. Johannesburg, ITweb. Marchand, A., 2010. Light Helicopters: Even Shorter Cycles. RotorIn, No 62. June/July 2010, p.17. Martyn, A., 2010. Lean in the MRO industry- time to earn its wings? MRO Yearbook 2011, pp82-86. Mathaisel, D.F.X., 2005. A lean architecture for transforming the aerospace maintenance, repair and overhaul enterprise. International Journal of Productivity and Performance Management [Online]. Available at <http://web.mit.edu/dfxm/www/Pubs/Lean%20Enterprise%20Architecture%20IJPPM%20Jan%202005.pdf> [Accessed 14 May 2011]

146
McAuliffe, G., 2007. Aftermarket: the Ascendancy of Lean in MRO. Aviation Today, [online]. Available at < http://www.lean.org/Library/Shook_on_VSM_Misunderstandings.pdf> [Accessed 14 January 2011]. McLoughlin, B., 2006. Maintenance Program Enhancements. Boeing AeroMagazine Article, QTR_04, pp24-28. Menschner, J., 2008. Improvement of the Production Process of EC 145 Main Rotor blade. In: Black Belt Panel Assessment. Ottobrunn Germany, 6th February 2008, Germany, EADS. Miler, GW., 2009. Effectively Integrating a Lean Six Sigma Philosophy into Organizational Culture/Revising a Flagging or Stalled Continuous Improvement Project. In: ItWeb, Lean Six Sigma. Sandton, RSA, 10-11 June 2009. Johannesburg, ITweb. Moody, E., 2010. Hong Kong Investor Builds MRO Portfolio. Aviation Week [online]. Available at < http://www.aviationweek.com/aw/generic/story_channel.jsp?channel=mro&id=news/awx/2010/11/17/awx_11_17_2010_p0-270510.xml> [Accessed 15 December 2010]. Moorman, RW., 2006. The cost of Power. Air Transport World [online]. Available at < http://atwonline.com/print/132944> [Accessed 14 January 2011]. Moorman, RW., 2008. Overhaul & Maintenance. Duggan Associates [online]. Available at < http://www.dugganinc.com/cms/index.php?aid=125&print=1> [Accessed 14 January 2011]. NASA, 2011, National Highway traffic safety Administration Toyota Unintended Acceleration Investigation. NHTSA [online]. Available at <http://www.nhtsa.gov/staticfiles/nvs/pdf/NASA_report_execsum.pdf> [Accessed 18 February, 2011]. Nowlan, FS. and Heap, FH., 1978. Reliability Centred Maintenance. Dolby Access Press. NTSB, 2011, Technical Assessment of Toyota Electronic Throttle Control (ETC) Systems, NHTSA [online]. Available at <http://www.nhtsa.gov/staticgiles/nvs/pdf/NHTSA_report_execsum.pdf> [Accessed 18 February, 2011]. The Lean Enterprise Academy, 2011. [online] Available at <http://www.leanuk.org/pages/lean_store_book_lean_thinking.aspx> [Accessed 6 May 2011].

147
Parker, RN., 1994. Addendum to the Report of the Defence Science Board Task Force on Depot Maintenance Management. 28 September 1994. Washington. Office of the Under secretary of Defence for acquisition & technology. Pascoe, D., 2003. Aircraft. London. Reaktion Books. Philbin, A., 2009. ICAO Regional Report. Africa/Indian Ocean Regional Report. International Civil Aviation Organisation, 2009, p9. Piepenbrock, TF., 2009. Toward a Theory of the Evolution of Business Ecosystems. Ph.D.. Massachusetts Institute of Technology. Remenyi, D. and Money, A., 2006. Research Supervision for supervisors and their
Students. 2nd printing. Kidmore End. Academic Conferences Limited. Riel, D. 2003. Global Hawk Lean Now Initiative. In: Status briefing to the LAI Plenary Conference by US Airforce. 26 March 2003. Riley, A. et al. , 2008. Aviation Maintenance Technician Handbook. Oklahoma. U.S. Department of Transportation. Federal Aviation Administration. Robinson, AG., 1993. Simultaneous Improvements in Cost, quality, delivery and flexibility. In: Thor, C., and Christopher, W., ed. 1993. Handbook for Productivity
Measurement and Improvement. Portland. Productivity Press. Rother, M., 2010. Toyota Kata. Managing people for improvement, adaptiveness
and superior results. New York, McGraw Hill. Rother, M., and Shook, J., 2003. Learning to See. 1.3 Version. Massachusetts. Lean Enterprise Institute. Rouke.PM., 2005. A Multiple case analysis of Lean six sigma deployment and implementation strategies. US Airforce Institute of technology, [online]. Available at <http://www.dtic.mil/cgi-bin/gettrdoc?location=u2&doc=GetTrDoc.pdf&AD=ADA437541> [Accessed 14 January 2011]. Sabbagh, K., 1996. 21
st Century Jet. The making of the Boeing 777. 2nd ed..
London. Pan. SACAA, 1997. Legislation [online]. Available at www.caa.co.za [Accessed 20th November, 2010]. SACAA, 2010. South African Civil Aviation Authority annual report 2009/2010. Midrand. Sato, M., 2008. The Toyota Leaders, An Executive Guide. New York. Vertical Inc.

148
Seeliger, J., 2005. Lean MRO. How domestic MROs can sustain their competitive position. Mercer management Consulting commentary [online]. Available at < http://www.oliverwyman.com/ow/pdf_files/AAD05LeanMRO-CompPosition.pdf> [Accessed 14 January 2011]. Shepard, 2009. Shannon Aerospace 'Lean' practice achieving faster turnarounds. Shepard Publications [online]. Available at < http://www.shephard.co.uk/news/2036/shannon-aerospace-lean-practice-achieving-faster-turnarounds/> [Accessed January 14 2011]. Sheridan, P., 2010. Navigating the aircraft value cycle. Ascend aviation insight consultancy [online]. Available at < ww.ascendworldwide.com/.../AFJ%20Paul%20Sheridan%20Nov%2010.pdf> [Accessed 12 December 2010]. Shook, J., n.d.., Misunderstandings about Value Stream Mapping, Flow analysis and Takt Time. Lean Enterprise Institute [online]. Available at <http://www.lean.org/Library/Shook_on_VSM_Misunderstandings.pdf> [Accessed 14 January 2011]. Slack, N. Chambers, S., and Johnston R., 2001. Operations Management, 3rd ed. Harlow. Financial Times Prentice Hall. Smith, N., 2010. Outlining the Current Sate of the MRO Industry in the Americas. Airline Fleet Management, March-April, Issue 66, pp42-49. Smith, N., 2009. MRO Global Outlook. Frost & Sullivan [online]. Available at >http://www.frost.com/prod/servlet/cpo/168894081> [Accessed 13 December 2010]. Sondalini, M., 2009. How to Value Stream Mapping. Lifetime Reliability Solutions [online]. Available at < http://www.lifetime-reliability.com/free-articles/lean-management-methods/How_to_do_Value_Stream_Mapping.pdf.> [Accessed 14 January 2011]. Spear, S., 2009. Chasing the Rabbit. ebook, McGraw Hill. Spear, S. and Bowen, HK., 1999. Decoding the DNA of the Toyota Production System. Harvard Business Review, September-October 1999. Stanley, G. and Handell, D., 2003. F/A-22 Lean Now. In: USAF Status briefing to the LAI Plenary Conference, 26 March 2003, MIT. Taylor, JC. and Christensen, TD., 1998. Airline Maintenance Resource
Management . Warrendale. Society of Automotive Engineers, Inc.

149
Transport Studies Group, 2004. Evaluating the true cost to airlines or one minute of airborne or ground delay. Final Report. London. University of Westminster. Transport Studies Group, 2008. Dynamic Cost Indexing Aircraft Maintenance – margin delay costs. Technical Discussion Document 9.0. London. University of Westminster. United States of America Department of Defense (USDoD), 2006. Continuous process improvement transformation guidebook. DoD [online]. Available at <https://acc.dau.mil/CommunityBrowser.aspx?id=32364 > [Accessed 12 December 2010]. Utts, JM., and Heckard, RF., 2007. Mind on Statistics. 3rd ed.. Belmont. Thomson Brooks/Cole. Viswanathan, N. and Littlefield, M., April 2009. Lean Manufacturing. Aberdeen Group Survey. Vixama, WR., 2009. Application of 21st century Lean approaches to large government programs. 2008-2009 US Air Force Lean Fellowship Program. Case studies [online]. Available at < http://lean.mit.edu/downloads/doc_details/2538-2008-2009-us-air-force-lean-fellowship-program-case-studies-application-of-21st-century-lean-approaches-to-large-government-programs> [Accessed 20 April 2010]. Wall Street Journal, 2011. US Auto Sales. Wall Street Journal, [online] 4th January 2011. Available at <http://online.wsj.com/mdc/public/page/2_3022-autosales.html#autosalesC> [Accessed 10 January 2011]. Ward, Y. and Graves, A., 2001. Lean Performance Measurement for Aerospace. Bath. School of Management, University of Bath. Research report. Ward, Y., et al., 2003. Cost management and accounting for Lean aerospace enterprises. University of Bath [online]. Available at < http://www.bath.ac.uk/management/aerospace/pdf/Lean_Measurement.pdf> [Accessed 14 Jan 2011]. Warwick, G., 2007. War in Waste: Maintenance. Flight International [online]. Available at < http://www.flightglobal.com/articles/2007/02/20/212116/war-on-waste-maintenance.html> [Accessed 14 January 2011]. Weigel, A., 2000. A Book Review: Lean Thinking by Womack and Jones [online]. Available at < web.mit.edu/esd.83/www/notebook/Womack.Jones.PDF> [Accessed 7 May 2011] Whitaker, J., 2006. Smart Ops 21: Improving the Air Force one process at a time. US Airforce [online]. Available at < https://acc.dau.mil/adl/en-US/109984/file/24198/AFSO21ImprovingAFpdf> [Accessed 14 January 2011].

150
Wickens, PD., 1995. The Ascendant Organisation. London. Macmillan Business. Womack, JP., Jones, DT. and Roos D., 2007. The Machine that changed the
world. 2nd ed. New York. Free Press. Womack, J.P. and Jones, D.T., 2003. Lean Thinking. 2nd ed. London. Simon & Schuster. Yin, R.K., 2003. Case Study Research, Design and Methods. 3rd ed. Thousand Oaks. Sage.

Appendix A
151
APPENDIX A – Survey format
Introduction
Data was collected by conducting one on one opened ended interviews, guided by
a set of structured questions. This appendix shows the format of the survey used,
the sources used, reasoning for each question asked and notes for the interviewer.
The survey consists of five sections, these being:
• Section 1, questions regarding company details such as size and CAA
approvals held.
• Section 2, questions based on the five principles of Lean regarding current
processes being employed at the AMOs surveyed.
• Section 3, questions regarding Lean terminology.
• Section 4, questions regarding AMO’s surveyed Lean implementation
status.
• Section 5, questions regarding knowledge and AMO’s surveyed
implementation status of Six Sigma and Theory of Constraints.
The Survey questions are divided into 7 parts:
• Part 1: Company Details
• Part 2: Aviation Approvals Held
• Part 3: Value
• Part 4: Value Stream
• Part 5: Flow & Pull
• Part 6: Perfection
• Part 7: General Company Knowledge & Training
• Part 8: Lean Implementation
• Part 9: Other Philosophies
• Part 10: Confidentiality
The format of the survey shown in Appendix A and B is that used after the pilot
study, referred to in Chapter 3.5, was concluded. Chapter 3.6 lists amendments
made to the questionnaire shown, during the survey.

Appendix A
152
Survey format
The separate parts of the survey are shown against a dark grey background.
e.g. 3 . V a l u e
Extracts from “Lean Thinking” (Womack and Jones, 2003) that formed the basis
of the questions being presented are shown against a light grey background.
e.g. To get manufactured goods to flow the Lean enterprise….logical conclusion by putting products into
continuous flow wherever possible
(Womack and Jones, p.59)
Primary Questions that lead onto sub questions as a result of the response are
indicated by a thick border, with the sub questions being to the right, with thin
borders and denoted by primary question number followed by a sequential letter
series.
e.g. 3.4 Does your company visit your customer or does the customer visit you? (Excluding when work is in progress for the customer).
3.4a Is it on a regular basis? 3.4b If yes, how often
The survey questions
Here follows a listing of all the questions included in the survey. The numbers
refer to the question numbers within the survey with an explanation of the
reasons why such a question is included in the survey, with interviewer’s notes.
Part 1: Company Details
1 . C o m p a n y D e t a i l s
1.1 Company Name: 1.2 Address:
1.3 Years in business:
1.4 Main Contact person Name & Title:
1.5 Total No of full time employees:
1.7 No of AMEs: All: …A:.. B:… C:… W:…X:…
1.8 No of technicians: Mechanical:… Avionics:… Other:…
1.9 No of apprentices: Mechanical:… Avionics:…… Other:……….
1.10 No holding third level Qualifications. Type of qualifications.
1.6 No of employees technical department:
1.11 No of admin staff: Planners: …………. Engineering:………. Finance:………………… Stores:……………Other:……………..
To get manufactured goods to flow the Lean enterprise….logical conclusion by putting products into continuous flow
wherever possible (Womack and Jones, 2003, P.59)
1.12 How long have you been in the current facility?
1.13 Did you build it or obtained as is.
1.14 Is the building leased or owned
1.15 How old is the facility?
1.16 How big is the facility?
1.17 How many facilities do you have? i.e. buildings
1.18 Are all company functions relating to production in one building?
1.19 If not, which functions are separate and why and where?
1.20 Do you intend to move/upgrade the current facility soon?

Appendix A
153
Part 1 asks the interviewee questions regarding the company’s location, physical
makeup, size and staff details.
1.1 Company trading name
1.2 Physical address of the facility. Should there be two different facilities on
different airports/industrial estate; the address of the AMO is recorded.
1.3 Number of years the company is trading, in order to compare the status of
Lean implementation according to how many years the company is in
business.
1.4 Name and title of main contact person within the company, for this survey. If
different persons responded to different portions of the survey, record the
person’s name in the applicable survey Part.
1.5 Total number of full time employees.
1.6 Number of employees within the technical sections of the company. This
question is applicable primarily to companies that may have an aircraft
operating section. The aim is to exclude pilots, cabin crew and operations
staff from the survey, in order to compare AMOs according to technical staff
size.
1.7 Number of persons holding SACAA AME (Aircraft Maintenance Engineer)
licenses. A company may only release aircraft/parts into service when it
employees persons holding suitable licenses. South African licenses are
issued according to the following aviation trades;
A = Airframe, C = Engine, W = Electrics/Avionics, X = Electrical/Avionics
Overhaul.
1.8 Number of technicians. A technician is a person who has passed their
government trade test and is getting on the job training and experience in
order to apply to the CAA for an AME license. This is normally for a period
of 2 years. The number of technicians is split according to their trade. Some
companies use different terms for technicians, such as mechanic. Avionics is
a general term that also includes electricians.
1.9 Number of apprentices. An apprentice is a person who is completing training
in order to be eligible to write their government trade papers.

Appendix A
154
1.10 Number of persons holding third level education (above and including
degree) within the company, regardless of their position.
1.11a Planners: Person who is employed to process, create, organize, archive and
control airworthiness data such as maintenance schedules and logbooks, as
required by CAA regulations.
1.11b Engineering: Person who creates technical documentation, engineering
drawings, supplies technical assistance to AMEs, customers etc and liaises
directly with the OEM (Original Equipment Manufacturer).
1.11c Finance: Person involved in paying suppliers, invoices customers etc.
1.11d Stores: Person who buys, sells, controls, distributes aircraft parts, spares,
and consumables.
1.11e Other: Person employed in any major function within the company e.g.
human resource, sales, arms control agreements, contracts. State function in
comments section.
1.12 thru 1.20 These questions are asked so as to compare companies that built
their own facilities and those that leased existing facilities and the size of the
facilities. These factors may influence Lean implementation. Functions split
amongst several building may influence communication and would physically
prevent smooth/flow production techniques (Womack and Jones, 2003). In
addition old building may not be physically able to accommodate such flow
due to their architecture and physical make up. An occupant is also restricted
on what changes can be made to a building that is leased, as opposed to
owned. Where a company is upgrading, moving to new premises, this usually
offers the opportunity to implement procedures on a “greenfield” site

Appendix A
155
Part 2: Aviation Approvals held
2 . A v i a t i o n A p p r o v a l s H e l d 2.1 CAA Country
approvals held for: South Africa and
2.2 Any other non CAA approvals/qualifications held and which?
2.3 Countries within which and with which business within last 2 years:
2.4 Business Split In-house work only (Y/N).. Third party work only (Y/N).... Both in-house & third work (Y/N)…….. % split in-house/third party…
2.5 CAA approvals held (Y/N):
2.5a AMO
2.5b Operations
2.5c Process 2.5d Manufacture 2.5e Design
2.6 Aircraft Light Checks
2.7 Airframe Heavy Maintenance
2.8 Workshop Avionics/elec components repair
2.9 Sheet metal repair
2.10 Composite repairs
2.11 Engine Hot Section/Boroscope
2.12 Engine Overhaul 2.13 Upholstery
2.14 Paint 2.15 NDT 2.16 Plating 2.17 Modifications implementation
2.18 Propeller 2.19 Training
Part 2 questions are asked so that companies could be compared according to the
aviation service supplied and weather particular types of service tend to follow
Lean philosophy.
2.1 A company may hold approvals for more than one country.
2.2 Companies may hold other organisational approvals such as ISO 9000,
military approvals etc. and these approvals may affect the organisational
processes. The numbers of approvals and/or their type may effect Lean
implementation.
2.3 Countries where the company operates. An aircraft may have South African
registration and be based in another country. Companies that operate
internationally may have additional exposure to Lean.
2.4 Determination of split of the business. In house work is whereby work is
supplied solely to the company’s own fleet of aircraft. Third party work is the
work performed for external customers. The status of Lean implementation
may differ according to weather the work is for own fleet and/or has external
customers as well.
2.5a Obtain copies of CAA approvals held, which includes list of capabilities
which the CAA allows the company to perform.
2.5b CAA requires a company organigram (which also relates to Part 1 of this
survey).
2.6 Yes/No check list of primary functions the company is allowed to perform
according to CAA approvals held. AMO is an aircraft maintenance

Appendix A
156
organisation. Operations are that of providing aerial transport services to the
public. Process is a specific trade, such as NDT, electroplating, upholstery.
Manufacture is that of manufacturing parts/components/systems to be used on
aircraft. Design is design and certification of aircraft
parts/components/systems. A company may hold approval to perform a
variety of these functions.
Part 3: Value
3 . V a l u e
Value: -The critical starting point for Lean thinking is value. Value can only be defined by the ultimate customer. And it’s
only meaningful when expressed in terms of a specific product which meets the customer’s needs at a specific price at a
specific time (Womack and Jones, 2003, p.16)
3.1 In one sentence who are your customers? 3.1a External Customer
3.1b Internal Customer
3.2 In one sentence, what product/service is your business supplying the customer?
3.2a External Customer
3.2b Internal Customer
3.3 Who/which department/person communicates with the customer regarding their needs?
3.4 Does your company visit your customer or does the customer visit you? (Excluding when work is in progress for the customer).
3.4a Is it on a regular basis? 3.4b If yes, how often
3.5 Do you have a formal method for determining the customer’s needs?
3.5a Who/which department/person determines what your customer wants?
3.5b What method is used? 3.5c To who are the results distributed?
3.6 Do you know your customer satisfaction following work completion against set service standards (KPIs) e.g. online delivery target, zero defects etc
3.6a If yes, to whom is this data communicated?
3.6c What is you On Time Delivery % success rate?
3.6b Do you have KPIs standardized across the company?
3.7e If yes, what are your KPIs?
3.7 Do you determine if the customer is satisfied following delivery?
3.7a By what means? 3.7b How soon after delivery?
3.7c Do you know your quality defect rate and in what form? E.g. %, cost
3.7d Do you distribute to staff the cost of the quality defect rate?
General cost questions. Target cost is based on the amount of resources and effort required to make a product of given
specification and capabilities if all the current visible muda were removed from the process (Womack and Jones, 2003, p.35) Note: Will not deal with specific prices/costs in interview due commercial reasons.
3.8 Do you know your cost of production? 3.9 How and who determines the price to charge the customer?
3.10 How often is the price reviewed?
The first principle of Lean is value. Value is “the critical starting point for Lean
thinking is value. Value can only be defined by the ultimate customer. And it’s
only meaningful when expressed in terms of a specific product which meets the
customer’s needs at a specific price at a specific time” (Womack and Jones, 2003,
p.16).
3.1 A major portion of value is that of identifying the customer. The interviewer
shall not lead the interviewee into providing an end customer (such as an
airline passenger) unless one is immediately given by the interviewee. This

Appendix A
157
would show a high level of understanding of what the ultimate customer is.
The question is sub divided into external and internal customers, should the
interviewee answer by specifying different customer types within the
company and outside the company.
3.2 A summary of the company’s business as determined by the interviewee. The
question is sub divided into external and internal customers should the
interviewee have answered by specifying different customer types within the
company and outside the company.
3.3 An investigation of whom within the company and how the company
determines the customer’s needs (i.e. what value they perceive the customer
requires).
3.4 & 3.5 Questions to determine the interviewee’s source of information
regarding the customer’s needs and is there a formal method to collecting and
assessing these needs. Also the questions are to determine if there is
continuous engagement with the customer regarding their needs. When work
is in progress there is contact with the customer, so this is disregarded.
3.6 & 3.7 Question to determine if there is a formal system in place to record,
determine, track the customers needs, excluding when set work is in progress.
Determination of who within the company is informed of the customers needs.
This question is to determine if the company has such standards as KPIs to
measure customer satisfaction. Determination of who consults with customer
regarding their satisfaction following delivery of the product and how
customer satisfaction determination is performed. ). The survey, however,
does not require the interviewee to divulge specific aircraft maintenance check
duration periods offered to customers, due to the commercially sensitive
nature of these details.
“Target cost is based on the amount of resources and effort required to make a
product of given specification and capabilities if all the current visible muda were
removed from the process” (Womack and Jones, 2003, p.35). The survey,
Appendix A
158
however, does not require the interviewee to divulge specific prices/costs due to
the commercially sensitive nature of these details.
3.8 This is a general question, as it is not expected that a company will reveal its
exact cost of production, as this is commercially sensitive information.
3.9 Is the costing to customer based on such systems as; cost plus, what the
market will bear, comparison with other companied, escalate prices every
year by inflation rate etc.
3.10 Determination if the interviewee/company is knowledgeable about target
cost and if so, how is it calculated and is it realistic. Do not wish to use the
term Target Cost at this stage of the interview but will ask of knowledge of
the term at end of survey.
Part 4: Value Stream
4 . V a l u e S t r e a m
What really needed is to manage whole value streams for specific goods and services. (Womack and Jones, 2003, p.37)
4.1 Have you formal procedures in place for ALL your processes, not just those required by CAA regulations?
4.1a Who writes the original processes (title of position or group)?
4.1b Who reviews and approves the original processes (title of position)?
4.1c How often are the processes reviewed and by whom?
4.1d How are the processes presented? Word/Descriptive Format
Flow Chart Format
Combination of both
4.1e Do you believe your written processes reflect exactly what your staff perform?
4.1f Do you believe your staff know the written processes?
4.1g Do you believe your written processes add value to your company or where just created to satisfy regulatory/company polices?
4.2 Have you mapped out all the processes in your organisation to show how they are inter related?
4.2a Which person/department performs the process mapping and do you believe it is accurate?
4.2b If only some processes mapped, specify which processes and why chosen?
4.3c If processes mapped, have external supplies been considered?
4.3d If yes, which suppliers and why chosen?
The second principle of Lean is value stream. “What really needed is to manage
whole value streams for specific goods and services” (Womack and Jones, 2003,
p.37).
4.1 Determination if ALL the processes are standardized, not just those required
and checked by the CAA, as contained in the Manual of Procedure. CAA
regulations are not concerned with such tasks as invoicing customers,
methods of determining stock levels etc.
4.1a Determination of who writes the procedure. Womack and Jones (2003),
encourage the end user of the procedure to write it.

Appendix A
159
4.1b & c Determination if processes are formally reviewed and how often. Is staff
involved in such reviews?
4.1d Question to be able to determine the most common way
procedures/processes are presented. Descriptive being just words and flow
chart having YES/NO gates etc.
4.2 These questions are to determine if the company has looked at its value
stream and if so, who perform it. Do not wish to use the term Value Stream
at this stage of the interview but will ask for knowledge of the term at end of
survey.

Appendix A
160
Part 5: Flow & Pull
5 . F l o w & P u l l
Work scheduling MRP, keeping track of inventory, ordering materials, sending instruction to each department on what to make next (Womack and Jones, 2003, p.57)
5.1 Do you have maintenance tracking/WIP software system?
5.1a Is it an AMO specific software and what is its name?
5.1b What other information does it control, such as inventory?
5.2c Does it track defects and work in progress (WIP)?
5.1d Are all you software systems integrated?
5.2 How often do you review upcoming maintenance?
5.2a Who determines which work to be carried out during maintenance check?
5.2c Do you review defects and WIP regularly?
5.3 Are staff organized per project or departmentally?
5.3a Production Staff organisation 5.3b Support Staff organisation
Standardized work, so that a team follows the same approach every time (Womack and Jones, 2003, p.54) Takt time, which precisely synchronizes the rate of production to the rate of sales to customers (Womack and Jones, 2003, p.55)
5.4 Do you have standardised workcards/procedures in place?
5.4a Who/where do you obtain the workcards?
5.4b Is the work sequence of a maintenance check standardized?
5.4c Who/How is the sequence determined?
5.5 Do you have standard production times for each task?
5.5a Are specific Man Hours (Mhrs) assigned to each stage of the individual tasks or is it a total Mhrs for the task?
5.5b Who determines the production time for task?
5.5c How is this data communicated to production staff?
5.6 Do you have visual controls in place to show production status?
5.6a What production information/WIP status displayed and in what format?
5.6b Who updates the visual controls and how often?
5.6c Who has access to view the visual controls?
Worst features of the warehouse system…where size of bins, inefficient use of storage space and the size of the batches
ordered as replenishments(Womack and Jones, 2003, p.75)
5.7 Where is your inventory primarily obtained from (country)?
5.7aWhat is the average lead time for inventory from placing order?
5.7b What is your inventory turnover? i.e. Cost good sold/average value inventory
5.7c Is the cost of storing inventory taken into consideration? If yes, explain
5.8 Do you have a standardised inventory list for maintenance checks?
5.8a Who put the inventory list together
5.8b Is this inventory just for scheduled maintenance or include common defects?
5.9 Do you have a formal method to determine what inventory is to be held in stock? E.g. analysis of past usage using SD
5.9a What method is used to determine inventory items and quantity?
5.9b Who is responsible for determining inventory items and quantities?
5.9c Is inventory subject to regular review and by whom?
5.9d How do you determine when to re-ordering inventory? E.g. Kanban, min/max on computer system
5.9e What is your target % availability
5.9f What is your actual % availability
5.9g Is all inventory in one location or subdivided amongst the various production areas?
5.9h Is the inventory issue controlled or “free access” to staff when required?
The third and forth principle of Lean are Flow and Pull. The survey questions
intend to determine if the company is implementing the basic concepts of Flow
and Pull. Flow and Pull with regard to performing the survey are closely related.
To avoid duplication of questions and to ensure interview is conducted logically,
questions are combined in one Part. “Work scheduling. MRP, keeping track of
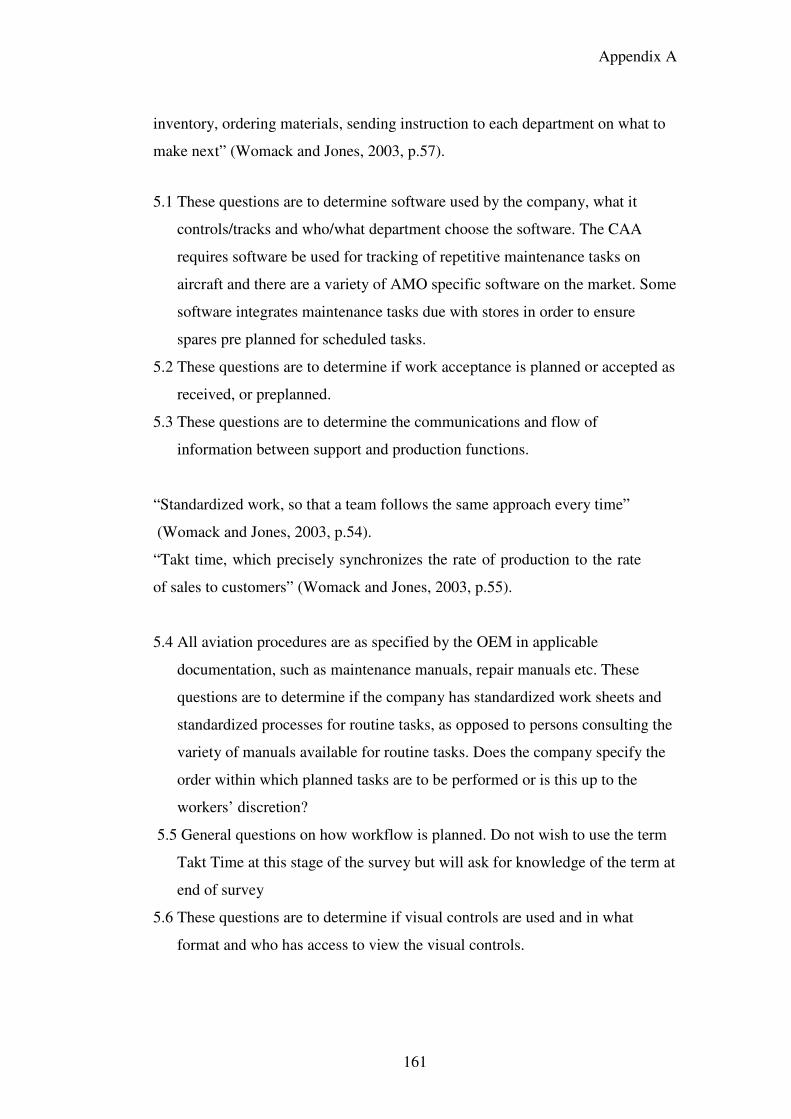
Appendix A
161
inventory, ordering materials, sending instruction to each department on what to
make next” (Womack and Jones, 2003, p.57).
5.1 These questions are to determine software used by the company, what it
controls/tracks and who/what department choose the software. The CAA
requires software be used for tracking of repetitive maintenance tasks on
aircraft and there are a variety of AMO specific software on the market. Some
software integrates maintenance tasks due with stores in order to ensure
spares pre planned for scheduled tasks.
5.2 These questions are to determine if work acceptance is planned or accepted as
received, or preplanned.
5.3 These questions are to determine the communications and flow of
information between support and production functions.
“Standardized work, so that a team follows the same approach every time”
(Womack and Jones, 2003, p.54).
“Takt time, which precisely synchronizes the rate of production to the rate
of sales to customers” (Womack and Jones, 2003, p.55).
5.4 All aviation procedures are as specified by the OEM in applicable
documentation, such as maintenance manuals, repair manuals etc. These
questions are to determine if the company has standardized work sheets and
standardized processes for routine tasks, as opposed to persons consulting the
variety of manuals available for routine tasks. Does the company specify the
order within which planned tasks are to be performed or is this up to the
workers’ discretion?
5.5 General questions on how workflow is planned. Do not wish to use the term
Takt Time at this stage of the survey but will ask for knowledge of the term at
end of survey
5.6 These questions are to determine if visual controls are used and in what
format and who has access to view the visual controls.

Appendix A
162
“Worst features of the warehouse system…where size of bins, inefficient
use of storage space and the size of the batches ordered as replenishments
“(Womack and Jones, 2003, p.75).
5.7 Aviation inventory may only be bought if it is accompanied by
documentation as stipulated by the CAA. This documentation shows that the
item was manufactured at an approved aviation facility. As there are
practically no South African aviation manufacturing facilities for the parts
required on the aircraft types maintained in South Africa (e.g. Boeing, Airbus,
Cessna, etc.) the majority of aviation parts/consumable etc. are imported. This
may affect inventory levels held.
5.8 Questions determining how inventory levels are determined.
5.9 a thru f These questions are to determine how and when an item is reordered.
What is the item availability the company is seeking to achieve and has the
technique chosen been successful in achieving that availability. E.g. 95%
availability. It could be visual form of reordering used such as Kanban or
computerized or a combination of both.
5.9g & h How inventory is stored determines the logic and efficiency of use of
the stores area, such as placing commonly used items nearer to dispatch
counter.
5.10 Observation by interviewer of facility and its compliance with the 5Ss. Do
not wish to use the term 5Ss at this stage of the survey but will ask for
knowledge of the term at end of survey
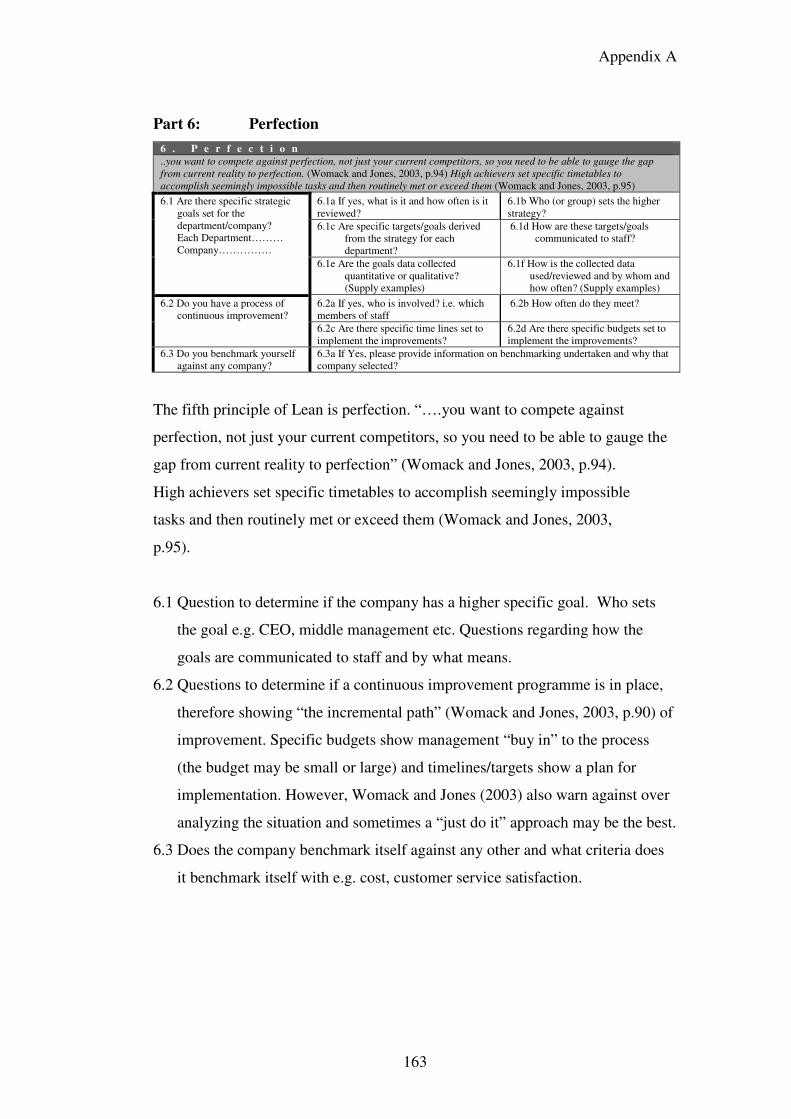
Appendix A
163
Part 6: Perfection
6 . P e r f e c t i o n
..you want to compete against perfection, not just your current competitors, so you need to be able to gauge the gap
from current reality to perfection. (Womack and Jones, 2003, p.94) High achievers set specific timetables to
accomplish seemingly impossible tasks and then routinely met or exceed them (Womack and Jones, 2003, p.95)
6.1 Are there specific strategic goals set for the department/company? Each Department……… Company……………
6.1a If yes, what is it and how often is it reviewed?
6.1b Who (or group) sets the higher strategy?
6.1c Are specific targets/goals derived from the strategy for each department?
6.1d How are these targets/goals communicated to staff?
6.1e Are the goals data collected quantitative or qualitative? (Supply examples)
6.1f How is the collected data used/reviewed and by whom and how often? (Supply examples)
6.2 Do you have a process of continuous improvement?
6.2a If yes, who is involved? i.e. which members of staff
6.2b How often do they meet?
6.2c Are there specific time lines set to implement the improvements?
6.2d Are there specific budgets set to implement the improvements?
6.3 Do you benchmark yourself against any company?
6.3a If Yes, please provide information on benchmarking undertaken and why that company selected?
The fifth principle of Lean is perfection. “….you want to compete against
perfection, not just your current competitors, so you need to be able to gauge the
gap from current reality to perfection” (Womack and Jones, 2003, p.94).
High achievers set specific timetables to accomplish seemingly impossible
tasks and then routinely met or exceed them (Womack and Jones, 2003,
p.95).
6.1 Question to determine if the company has a higher specific goal. Who sets
the goal e.g. CEO, middle management etc. Questions regarding how the
goals are communicated to staff and by what means.
6.2 Questions to determine if a continuous improvement programme is in place,
therefore showing “the incremental path” (Womack and Jones, 2003, p.90) of
improvement. Specific budgets show management “buy in” to the process
(the budget may be small or large) and timelines/targets show a plan for
implementation. However, Womack and Jones (2003) also warn against over
analyzing the situation and sometimes a “just do it” approach may be the best.
6.3 Does the company benchmark itself against any other and what criteria does
it benchmark itself with e.g. cost, customer service satisfaction.

Appendix A
164
Part 7: General Knowledge of Lean
7 . G e n e r a l C o m p a n y K n o w l e d g e & E x p e r i e n c e o f
L e a n
7.1 Have you heard of the term Lean Manufacture/maintenance/technique?
7.1a If yes, please explain
7.2 Do you know the term Muda? 7.2a If yes, please explain
7.3 Do you know the term Value Stream? 7.3a If yes, please explain
7.4 Do you know the term Target Cost? 7.4a If yes, please explain.
7.5 Do you know the term Ultimate customer? 7.5a If yes, please explain and who is your ultimate customer?
7.6 Do you know the term Takt time, which precisely synchronizes the rate of production to the rate of sales to customers?
7.6a If yes, please explain
7.7 Do you know the term Kaizen? 7.7a If yes, please explain
7.8 Do you know the term 5s? 7.8a If yes, please explain
7.9 Do you know the term JIT? 7.9a If yes, please explain
Part 7 deals with companies understanding of modern production/management
techniques.
7.1 thru 7.9 Questions regarding knowledge of Lean and terms used. When an
interviewee says they recognized a term, then an explanation of the term is
sought to verify of that interviewee in fact understands the term correctly.
Part 8: Status of Lean Implementation
8 . L e a n I m p l e m e n t a t i o n
8.1 Have you Implemented Lean philosophy? If Yes continue with questions from 8.2 If No Proceed to Question 10
8.3 Is the Lean implementation across the company or certain departments, clarify?
8.4 When did you start to implement Lean and where did you start?
8.5 Why did you implement Lean?
8.6 In your opinion has its implementation been worthwhile?
8.7 Since implementation, has quality improved? If data available, ask if can be supplied
8.8 Since implementation, has turn around time improved?
If data available, ask if can be supplied
8.9 Since implementation, have costs decreased? If data available, ask if can be supplied
8.10 Has somebody received formal training in Lean Thinking implementation and where?
8.1 thru 8.9 Questions regarding the company’s implementation status of Lean
and has it been successful or not.

Appendix A
165
Part 9: General Knowledge of Six Sigma & Theory Of Constraints 9 . O t h e r P h i l o s o p h i e s
9.1 Do you intend to implement Lean? 9.1a If Yes; When and Why? If No, Why Not?
9.2 Have you heard of the term Six Sigma? 9.2a If yes, please explain:
9.2b Have you implemented Six Sigma (wholly or partially)?
9.2c When did you start implementation?
9.2d Did you consider Lean prior to Six Sigma?
9.2e If YES, why was Lean not considered?
9.2e Do you intend to implement Six Sigma?
9.2f If Yes When? If No, why not?
9.3 Have you heard of the term Theory of Constraints (TOC)?
9.3a If yes, please explain:
9.3b Have you implemented TOC (wholly or partially)?
9.3c When did you start implementation?
9.3d Did you consider Lean prior to TOC?
9.3e If YES, why was Lean not considered?
9.3f Do you intend to implement TOC?
9.3g If Yes When? If No, why not?
9.1 Does the company intend to implement Lean?
9.2 What is the company’s knowledge on Six Sigma? Has it implemented Six
Sigma or intend to and if yes, was Lean considered as an alternative?
9.3 What is the company’s knowledge on Theory Of Constraints? Has it
implemented Theory of Constraints or intend to and if yes, was Lean
considered as an alternative?
Part 10: Confidentiality
1 0 . C o n f i d e n t i a l i t y
Do you wish you or your company name to be referenced directly with regard to any statement made or answers to any specific question in the survey?
Question to interviewee if they wish their name and/or there employer’s name to
be kept confidential.

Appendix B
166
APPENDIX B – Survey Question Paper
1 . C o m p a n y D e t a i l s 1.1 Company Name: 1.2 Address:
1.3 Years in business:
1.4 Main Contact person Name & Title:
1.5 Total No of full time employees:
1.7 No of AMEs: All: ……………A:………. B:………. C:………. W:………. X:……….
1.8 No of technicians: Mechanical:………. Avionics:………. Other:……….
1.9 No of apprentices: Mechanical:………. Avionics:………. Other:……….
1.10 No holding third level Qualifications:
Type of qualifications: 1.6 No of employees technical department:
1.11 No. of admin staff: Planners: ……………………. Engineering:………………………. Finance:………………………… Stores:……………………… Other:………………………..
To get manufactured goods to flow the Lean enterprise….logical conclusion by putting products into continuous flow wherever possible (Womack and Jones, 2003, p.59)
1.12 How long have you been in the current facility?
1.13 Did you build it or obtained as is? 1.14 Is the building leased or owned?
1.15 How old is the facility? 1.16 How big is the facility?
2.22 How many facilities do you have? i.e. buildings
1.18 Are all company functions relating to production in one building?
1.19 If not, which functions are separate, why and where?
1.20 Do you intend to move/upgrade the current facility soon?

Appendix B
167
2 . A v i a t i o n A p p r o v a l s H e l d Name & Title person answering questions:
2.1 CAA Country approvals held for: South Africa and
2.2 Any other non CAA approvals/qualifications held and detail?
2.3 Countries within which and with which business conducted within last 2 years:
2.4 Business Split In-house work only (Y/N)…………. Third party work only (Y/N)……….... Both in-house & third work (Y/N)……….. % split in-house/third party………
2.5 Obtain copy of: 2.5a CAA approvals including list of capabilities 2.5b Company organigram as contained with MOP
2.6 CAA approvals held (YES/NO): 2.6a AMO
2.6b Operations 2.6c Process 2.6d Manufacture 2.6e Design
2.7 Aircraft Light Checks
2.8 Airframe Heavy Maintenance
2.9 Workshop Avionics/elec components repair
2.10 Sheetmetal repair
2.11 Composite repairs
2.12 Engine Hot Section/Boroscope 2.13 Engine Overhaul
2.14 Upholstery
2.15 Paint
2.16 NDT
2.17 Plating 2.18 Modifications implementation
2.19 Design
2.20 Propeller
2.21 Manufacture 2.22 Training

Appendix B
168
3 . V a l u e Name & Title person answering questions:
Value: -The critical starting point for Lean thinking is value. Value can only be defined by the ultimate customer. And it’s only meaningful when expressed in terms of a specific product which meets the customer’s needs
at a specific price at a specific time (Womack and Jones, 2003, p.16)
3.1 In one sentence who are your customers?
3.1a External Customer
3.1b Internal Customer
3.2 In one sentence, what product/service is your business supplying the customer?
3.2a External Customer
3.2b Internal Customer
3.3 Who/which department/person communicates with the customer regarding their needs?
3.4 Does your company visit your customer or does the customer visit you? (Excluding when work is in progress for the customer).
3.4a Is it on a regular basis? 3.4b If yes, how often
3.5 Do you have a formal method for determining the customer’s needs?
3.5a Who/which department/person determines what your customer wants?
3.5b What method is used?
3.5c To who are the results distributed?
3.6 Do you know your customer satisfaction following work completion against set service standards (KPIs) e.g. online delivery target, zero defects etc
3.6a If yes, to whom is this data communicated?
3.6b What is you On Time Delivery % success rate?
3.6c Do you have KPIs standardized across the company per department? 3.6d If yes, what are the KPIs?
3.7 Do you determine if the customer is satisfied following delivery?
3.7a By what means?
3.7b How soon after delivery?
3.7c Do you know your quality defect rate and in what form? E.g. %, cost
3.7d Do you distribute to staff the cost of the quality defect rate?
General cost questions. Target cost is based on the amount of resources and effort required to make a product of given specification and capabilities if all the current visible muda were removed from the process (Womack and Jones, 2003, p.35)Note: Will not deal with specific prices/costs in interview due commercial reasons.
3.8 Do you know your cost of production? 3.9 How and who determines the price to charge the customer? 3.10 How often is the price reviewed?

Appendix B
169
4 . V a l u e S t r e a m Name & Title person answering questions:
What really needed is to manage whole value streams for specific goods and services. (Womack and Jones, 2003, p.37)
4.1 Have you formal procedures in place for ALL your processes, not just those required by CAA regulations?
4.1a Who writes the original processes (title of position or group)?
4.1b Who reviews and approves the original processes (title of position)?
4.1c How often are the processes reviewed and by whom?
4.1d How are the processes presented? Word/Descriptive Format
Flow Chart Format
Combination of both
4.1e Do you believe your written processes reflect exactly what your staff perform?
4.1f Do you believe your staff know the written processes?
4.1g Do you believe your written processes add value to your company or where just created to satisfy regulatory/company polices?
4.2 Have you mapped out all the processes in your organisation to show how they are inter related?
4.2a Which person/department performs the process mapping and do you believe it is accurate?
4.2b If only some processes mapped, specify which processes and why chosen?
4.2c If processes mapped, have external supplies been considered?
4.2d If yes, which suppliers and why chosen?

Appendix B
170
5 . F l o w & P u l l Name & Title person answering questions:
Work scheduling MRP, keeping track of inventory, ordering materials, sending instruction to each department on what to make next (Womack and Jones, 2003, p.57)
5.1 Do you have maintenance tracking/WIP software system?
5.1a Is it an AMO specific software and what is its name?
5.1b What other information does it control, such as inventory?
5.1c Does it track defects and work in progress (WIP)? 5.1d Are all you software systems integrated?
5.2 How often do you review upcoming maintenance?
5.2a Who determines which work to be carried out during maintenance check?
5.2b Do you review defects and WIP regularly?
5.3 Are staff organized per project or departmentally?
5.3a Production Staff organisation 5.3b Support Staff organisation
Standardized work, so that a team follows the same approach every time (Womack and Jones, 2003, p.54) Takt time, which precisely synchronizes the rate of production to the rate of sales to customers (Womack and Jones, 2003, p.55)
5.4 Do you have standardised workcards/procedures in place?
5.4a Who/where do you obtain the workcards?
5.4b Is the work sequence of a maintenance check standardized?
5.4c Who/How is the sequence determined?
5.5 Do you have standard production times for each task?
5.5a Are specific Man Hours (Mhrs) assigned to each stage of the individual tasks or is it a total Mhrs for the task?
5.5b Who determines the production time for task?
5.5c How is this data communicated to production staff?
5.6 Do you have visual controls in place to show production status?
5.6a What production information/WIP status displayed and in what format?
5.6b Who updates the visual controls and how often?
5.6c Who has access to view the visual controls?

Appendix B
171
Worst features of the warehouse system…where size of bins, inefficient use of storage space and the size of the batches ordered as replenishments(Womack and Jones, 2003, p.75)
5.7 Where is your inventory primarily obtained from (country)?
5.7aWhat is the average lead time for inventory from placing order?
5.7b What is your inventory turnover? i.e. Cost good sold/average value inventory
5.7c Is the cost of storing inventory taken into consideration? If yes, explain
5.8 Do you have a standardised inventory list for maintenance checks?
5.8a Who constructed the inventory list and based on which data?
5.8b Is this inventory just for scheduled maintenance or include common defects?
5.9 Do you have a formal method to determine what inventory is to be held in stock? E.g. analysis of past usage using SD
5.9a What method is used to determine inventory and quantity?
5.9b Who is responsible for determining inventory and quantities?
5.9c Is inventory subject to regular review and by whom?
5.9d How do you determine when to re-ordering inventory? E.g. Kanban, min/max on computer system
5.9e What is your target % availability
5.9f What is your actual % availability
5.9g Is all inventory in one location or subdivided amongst the various production areas?
5.9h Is the inventory issue controlled or “free access” to staff when required?
5Ss. Implementation of the following to be noticed during walk through production area
5.10a Sort:
5.10b Straighten:
5.10c Scrub/Shine 5.10d Standardise 5.10e Is facility laid out in a logical manner?

Appendix B
172
6 . P e r f e c t i o n Name & Title person answering questions:
..you want to compete against perfection, not just your current competitors, so you need to be able to gauge the gap from current reality to perfection. (Womack and Jones, 2003, p.94) High achievers set specific timetables to accomplish seemingly impossible tasks and then routinely met or exceed them (Womack and Jones, 2003, p.95)
6.1 Are there specific strategic goals set for the department/company?
Each Department……… Company……………
6.1a If yes, what are they and how often are they reviewed?
6.1b Who (or group) sets the company strategy?
6.1c Are specific targets/goals derived from the company strategy for each department?
6.1d How are these targets/goals communicated to staff?
6.1e Are the goals data collected quantitative or qualitative? (Supply examples)
6.1f How is the collected data used/reviewed and by whom and how often? (Supply examples)
6.2 Do you have a process of continuous improvement?
6.2a If yes, who is involved? i.e. which members of staff
6.2b How often do they meet?
6.2c Are there specific time lines set to implement the improvements?
6.2d Are there specific budgets set to implement the improvements?
6.3 Do you benchmark yourself against any company?
6.3a If Yes, please provide information on benchmarking undertaken and why that company was selected?

Appendix B
173
7 . G e n e r a l C o m p a n y K n o w l e d g e & E x p e r i e n c e o f L e a n Name & Title person answering questions:
7.1 Have you heard of the term Lean Manufacture/maintenance/
technique?
7.1a If yes, please explain
7.2 Do you know the term Muda? 7.2a If yes, please explain
7.3 Do you know the term Value Stream? 7.3a If yes, please explain
7.4 Do you know the term Target Cost? 7.4a If yes, please explain.
7.5 Do you know the term Ultimate customer? 7.5a If yes, please explain and who is your ultimate customer?
7.6 Do you know the term Takt time, which precisely synchronizes the rate of production to the rate of sales to customers?
7.6a If yes, please explain
7.7 Do you know the term Kaizen? 7.7a If yes, please explain
7.8 Do you know the term 5s?
7.8a If yes, please explain
7.9 Do you know the term JIT?
7.9a If yes, please explain

Appendix B
174
8 . L e a n I m p l e m e n t a t i o n Name & Title person answering questions:
8.1 Have you Implemented Lean philosophy?
If Yes continue with questions from 8.2 If No Proceed to Question 9
8.2 Is the Lean implementation across the company or certain departments, clarify?
8.3 When did you start to implement Lean and where did you start?
8.4 Why did you implement Lean?
8.5 In your opinion has its implementation been worthwhile?
8.6 Since implementation, has quality improved?
If data available, ask if can be supplied
8.7 Since implementation, has turn around time improved?
If data available, ask if can be supplied
8.8 Since implementation, have costs decreased?
If data available, ask if can be supplied
8.9 Has somebody received formal training in Lean Thinking implementation and where?

Appendix B
175
9 . O t h e r P h i l o s o p h i e s Name & Title person answering questions:
9.1 Do you intend to implement Lean?
9.1a If Yes; When and Why? If No, Why Not?
9.2 Have you heard of the term Six Sigma? 9.2a If yes, please explain:
9.2b Have you implemented Six Sigma (wholly or partially)?
9.2c When did you start implementation?
9.2d Did you consider Lean prior to Six Sigma?
9.2e If YES, why was Lean not considered?
9.2f Do you intend to implement Six Sigma?
9.2g If Yes When? If No, why not?
9.3 Have you heard of the term Theory of Constraints (TOC)
9.3a If yes, please explain:
9.3b Have you implemented TOC (wholly or partially)?
9.3c When did you start implementation?
9.3d Did you consider Lean prior to TOC?
9.3e If YES, why was Lean not considered?
9.3f Do you intend to implement TOC?
9.3g If Yes When? If No, why not?
1 0 . C o n f i d e n t i a l i t y Name & Title person answering questions:
Do you wish you or your company name to be referenced directly with regard to any statement made or answers to any specific question in the survey?
Note: The questionnaire shown in this research report varies from the exact questionnaire used by the interviewee. The differences are:
• The spaces allocated for responses are larger on the questionnaire used. The spaces have been amended so that the question can fit on this
research report page size.
• The Harvard referencing style used on the questionnaire was in error. It read (Womack et al., P.X). It has been adjusted on this research
report, to the correct format (Womack and Jones, 2003, p.X).

Appendix C
176
APPENDIX C – Interviewees’ responses to survey questions
Due to confidentially requirements;
• responses to questions of part 1 and 2 of the questionnaire are not shown, as it would be possible to match company ID letter to company
surveyed by size, staff numbers, approvals held etc.
• names of computer systems used and AMO customers have been omitted

Appendix C
177
3.1 In one sentence who are your
customers? 3.2 In one sentence, what product/service is
your business supplying the customer? 3.3 Who/which department/person
communicates with the customer regarding their needs?
3.4 Does your company visit your customer or does the customer visit you?
3.4a Is it on a regular basis? 3.4b If Yes, how often?
A
Scheduled/unscheduled airlines. AMO services. Technical services department have customer care officers. Single point of contact.
80% of the time customer comes to them.
2 major customers have reps practically full time in hangar. For aircraft in hangar daily meetings with customer.
B
A lot of aviation companies. As the respondent stated they are an ACMI.
Aircraft charters. Marketing department.
Both options. Not regularly set intervals, at start of contract there is a lot of communications but thereafter both sides know what’s happening.
C Scheduled charter operators. Line maintenance and field support Accountable manager. Both options. One customer visits every 2 weeks.
Another customer has staff on site.
D
Regional & personnel military transport aircraft.
Service & AMO powerplant/propellers spares, equipment, materials, chemicals, Aircraft General Spares
General manager. Both options. Company tries to visit customer, not on a regular basis, ad-hoc subject to request but they try at least once a year just to say “hello” and investigate possibility of extra business.
E
Whoever brings in an aircraft. Maintenance Different departments contact customer, such as airframe GM, maintenance director, planning but all information will feed back to planning.
50/50 Not really. At the start of a check they will talk, otherwise telephone. Physical contact at start and end of check. In between it is telephone & email.
F Mentioned specific African Airlines ACI (aircraft, insurance, and crew) mentioned three African airlines.
Two specific aircraft types mentioned Eng manager talks to customer on behalf of AMO. Accountable manager talks to ACI customers.
Customer visits the respondent’s company.
Customer visits are fairly regularly, every 2 to 3 months.
G
Mentioned the name of the company’s airline name.
At the moments separating maintenance planning and AMO. Creating aircraft responsible person position
Operations department will set the requirements for maintenance to perform.
Bit of both options. Yes. Weekly.
H Anybody with a VIP business jet. Maintenance to business jets, mainly
airframe/avionics work and a little engine work.
Engineering department. Interviewee mentioned they are not making money yet, so they are very “Lean”.
No visits.
I
Mentioned two major NGO names. Transport to two major NGOs by supplying ACMI.
Operations department. Both options. Operations department visits customer about once or twice a year. Customer visits AMO for audits. Audits are about yearly and in the past AMO was driven by fear of audits (i.e. will we keep their license) Now company is more pro-active.
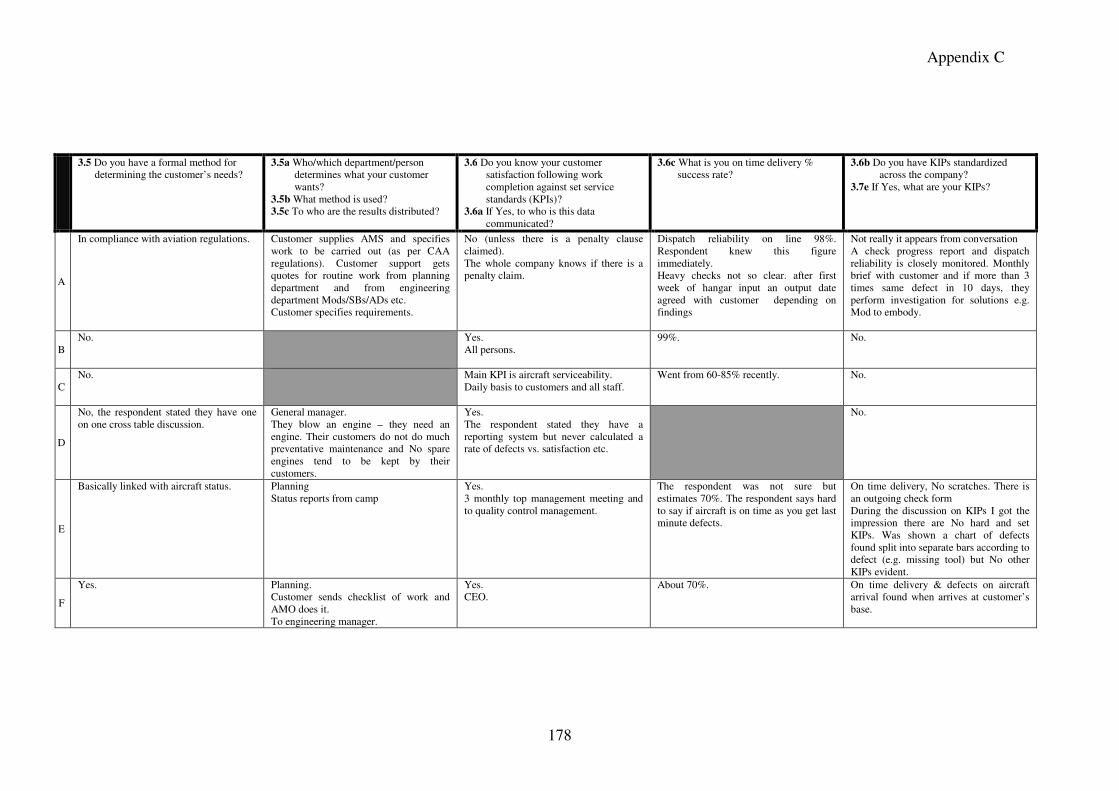
Appendix C
178
3.5 Do you have a formal method for determining the customer’s needs?
3.5a Who/which department/person determines what your customer wants?
3.5b What method is used? 3.5c To who are the results distributed?
3.6 Do you know your customer satisfaction following work completion against set service standards (KPIs)?
3.6a If Yes, to who is this data communicated?
3.6c What is you on time delivery % success rate?
3.6b Do you have KIPs standardized across the company?
3.7e If Yes, what are your KIPs?
A
In compliance with aviation regulations. Customer supplies AMS and specifies work to be carried out (as per CAA regulations). Customer support gets quotes for routine work from planning department and from engineering department Mods/SBs/ADs etc. Customer specifies requirements.
No (unless there is a penalty clause claimed). The whole company knows if there is a penalty claim.
Dispatch reliability on line 98%. Respondent knew this figure immediately. Heavy checks not so clear. after first week of hangar input an output date agreed with customer depending on findings
Not really it appears from conversation A check progress report and dispatch reliability is closely monitored. Monthly brief with customer and if more than 3 times same defect in 10 days, they perform investigation for solutions e.g. Mod to embody.
B No. Yes.
All persons.
99%.
No.
C No. Main KPI is aircraft serviceability.
Daily basis to customers and all staff.
Went from 60-85% recently.
No.
D
No, the respondent stated they have one on one cross table discussion.
General manager. They blow an engine – they need an engine. Their customers do not do much preventative maintenance and No spare engines tend to be kept by their customers.
Yes. The respondent stated they have a reporting system but never calculated a rate of defects vs. satisfaction etc.
No.
E
Basically linked with aircraft status. Planning Status reports from camp
Yes. 3 monthly top management meeting and to quality control management.
The respondent was not sure but estimates 70%. The respondent says hard to say if aircraft is on time as you get last minute defects.
On time delivery, No scratches. There is an outgoing check form During the discussion on KIPs I got the impression there are No hard and set KIPs. Was shown a chart of defects found split into separate bars according to defect (e.g. missing tool) but No other KIPs evident.
F
Yes. Planning. Customer sends checklist of work and AMO does it. To engineering manager.
Yes. CEO.
About 70%.
On time delivery & defects on aircraft arrival found when arrives at customer’s base.

Appendix C
179
3.5 Do you have a formal method for determining the customer’s needs?
3.5a Who/which department/person determines what your customer wants?
3.5b What method is used? 3.5c To who are the results distributed?
3.6 Do you know your customer satisfaction following work completion against set service standards (KPIs)?
3.6a If Yes, to who is this data communicated?
3.6c What is you on time delivery % success rate?
3.6b Do you have KIPs standardized across the company?
3.7e If Yes, what are your KIPs?
G
Yes. Maintenance planning department of customer.
Yes and now busy implementing it. The respondent stated they have on time delivery and dispatch reliability. Internally distributed to maintenance department and exec management of operator.
High 97%
No. Starting to develop KIPs for each staff position but not implemented yet.
H
Yes. But on further questioning it seems to be ad-hoc.
The respondent stated they know the aircraft and customer supplies the respondents company their maintenance requirements, their planning tools. Accountable manager & customers.
No. On answering this question respondent stated they are very transparent to the customer. The respondent showed interviewer a listing of tasks (seems to have been excel generated) and spares supplied to the customer with mark-up shown and man-hours used against quoted man-hours. Therefore the respondent stated their main deliverable is transparency to customer.
They have a quote and constant communication on work in progress, with emails to customer or in person if customer in hangar. But evident that the company has No defined KIPs.
I
Not really. Operations Responds to tenders issued
The customer audits them Operations department sends info to AMO after sensitive commercial data extracted. Tech data forwarded.
95%.
Mid phase at moment. Was shown a job description with a KPI. It is a work in progress, so KIPs not in place at present.

Appendix C
180
3.7 Do you determine if the customer is satisfied following delivery?
3.7a By what means? 3.7b How soon after delivery?
3.7c Do you know your quality defect rate and in what form?
3.7d Do you distribute to staff the cost of the quality defect rate?
3.8 Do you know your cost of production?
3.9 How and who determines the price to charge the customer?
3.10 How often is the price reviewed?
A
No.
No Customer support determines price and it is (a) market related (b) based on historic data (c) slot availability high/low season, AMO reduces prices to fill slot. Prior each contract and it depends on the customer.
B
Yes. Verbal communications. Continuously.
No. Unknown cost.
No Marketing department. With new customers AMO negotiates price. Each customer is unique Price is not regularly reviewed.
C
Daily.
Email and verbal communications. 90% was by email. Daily as supplying line support.
60-85%. Yes, the cost of everything. Aircraft are on fixed contracts. Customer paid a fixed management fee for costs. Labour charged to customer at cost. Spares paid for by customer and handling fee paid on sliding scale.
D
Yes. Follow up on a regular basis. About 1-2 weeks after delivery.
No. Verbal communication to staff.
No. General manager using historic data and market related prices. Annually, after monitoring the market, AMO adjusts prices so that they are below market prices in order to remain competitive.
E
Starting process. Customer survey on paper. No set time. The process has just been implemented.
Track with hazard reports. Defect rate not communicated to staff but to top management & quality department. Every 3 months meeting by accountable manager with staff but No actual figures given and it’s seems to be part of a larger discussion with staff.
The respondent stated does not know if anybody knows.
Top management. Once a year.
F
Yes. Telephone and email. On aircraft arrival at customer base after check after check and then 1 week later.
No. Respondent says he tells staff the defects but they have No need to know the costs and the respondent make them aware not to do it again but trained manpower is an issue.
No. Accounts department know, if the respondent requires the data the respondent asks for it.
CEO. Every contract is reviewed.

Appendix C
181
3.7 Do you determine if the customer is satisfied following delivery?
3.7a By what means? 3.7b How soon after delivery?
3.7c Do you know your quality defect rate and in what form?
3.7d Do you distribute to staff the cost of the quality defect rate?
3.8 Do you know your cost of production?
3.9 How and who determines the price to charge the customer?
3.10 How often is the price reviewed?
G
Theoretically Yes. Practiced some of the time.
Intention is for quality department to do specific audits following delivery but not implemented as of now. They track reliability for 14 days following delivery i.e. for defects etc.
Not sure. It’s an unknown cost.
Yes. Bench marked against budgeted figures from manufacturers/OEMs and then additional charges added for local factors so as inflation. Once a year.
H
Yes.
On further questioning respondent stated customer satisfaction is by default. If customer unhappy they will get a quick call. If they get No call customer is happy. The respondent stated, “it is not like I ring the customer for a follow up call” “when aircraft leave hangar customer is happy”.
No. Respondent stated they have No quality defects since opening up a year ago.
Differs job to job on labour rate.
Managing Director and Accountable Manager. The respondent stated they know their overheads and bench mark against competitors. The respondent stated they mark up spares Once a year.
I
Not really. Yes, respondent stated the direct overhead costs of the company.
Operation & finance department. Finance director has last say. Every 6 months. Every 12 months if tender was for such a period. Mentioned short tenders not really profitable, so they prefer long duration tenders.

Appendix C
182
4.1 have you formal procedures in place for all your processes, not just those required by CAA regulations?
4.1a Who writes the original processes (title of position or group)?
4.1b Who reviews and approves the original processes (title of position)?
4.1c How often are the processes reviewed and by whom?
4.1d How are the processes presented?
4.1e Do you believe your written processes reflect exactly what your staff perform?
4.1f Do you believe your staff knows the written processes?
4.1g Do you believe your written processes add value to your company or where just created to satisfy regulatory/company polices
4.2 Have you mapped out all the processes in your organisation to show how they are inter related?
4.2a Which person/department performs the process mapping and do you believe it is accurate?
4.2b If only some processes mapped, specify which processes and why chosen?
4.3c If processes mapped, have external supplies been considered?
4.3d If Yes, which suppliers and why chosen?
A
No Departmental manager writes process Quality department. No formal schedule. Review as required historically was pure text, now moving to combination of text and flow chart
No No. in years past process was written by persons not involved on job and group working on job follow different process on their own Historically was done to satisfy CAA. now drive to make process be practical and of use
50% there. But not in great detail
Originally QA department, now inter departmental Detail was not available and process done to satisfy CAA requirements External suppliers mentioned but not by name, as forms part of MOP and should supplier change need to revise MOP
B
Yes 7 departments and each do their own manual. Chairman not reviewed, only when faults found by the authorizes during audits word only
follow IOSA so pretty much followed Yes The respondent stated they have training on manual Lot of value added. it is the basis of how each department is run
The respondent stated they have for ms and follow the forms (I think mis understanding of what mapping is caused this answer, but looks like No mapping per Lean meaning of it)
Monitor all by forms. Each department does it to suit their requirements. only QA can override it
C
No accountable manager initially accountable manager every 4 months by qc word
No Yes because The respondent stated they kept it simple procedures written for SACAA regulations and procedure for hr for bee requirements and the respondent stated they had detailed personnel duties and responsibilities
No
D
Yes jointly by general manager & independent quality inspector & labour consultant (inions are on the airfield) gm & quality inspector annually by gm & quality inspector word
No try to convey to them by notices that are applicable and some training Keeping on the right side of the line to satisfy the regulators requirements. That’s their bench mark. You can go overboard with process. the respondent stated they don’t have ra ra sessions, vision statements, chairman’s prayer etc
No detailed chart.
The respondent stated they are a jobbing shop; tasks are not really production line work. a few basic things the respondent stated they do follow as per manual of procedure, regulations and Rolls Royce and Dowty processes

Appendix C
183
4.1 have you formal procedures in place for all your processes, not just those required by CAA regulations?
4.1a Who writes the original processes (title of position or group)?
4.1b Who reviews and approves the original processes (title of position)?
4.1c How often are the processes reviewed and by whom?
4.1d How are the processes presented?
4.1e Do you believe your written processes reflect exactly what your staff perform?
4.1f Do you believe your staff know the written processes?
4.1g Do you believe your written processes add value to your company or where just created to satisfy regulatory/company polices
4.2 Have you mapped out all the processes in your organisation to show how they are inter related?
4.2a Which person/department performs the process mapping and do you believe it is accurate?
4.2b If only some processes mapped, specify which processes and why chosen?
4.3c If processes mapped, have external supplies been considered?
4.3d If Yes, which suppliers and why chosen?
E
Yes quality assurance approved by maintenance director yearly internally by quality audits 90% word, 10% flowcharts. would love to do all flow charts but No time
“I think so very much” Yes, fairly good. Last year started doing written exams on procedures and mop. 75% is the pass mark Yes
procedures are segmented, there are No flow charts
F
Yes the respondent stated they have procedures for receiving a/c, releasing and dispatching a/c etc
engineering manager CEO never, The respondent just signs combo of both
50% of the time Yes Yes they add value
No
G
Yes to date quality department do it but moving to each accountable manager doing them accountable manager & subject to quality
department audit specified every 6 months but in practice only happens every 1-2 years tend to have match with a flow chart
No Yes training given in processes Gosh – done a lot of work. most are value adding but room for improvement
has been worked on- some mapping done but incomplete so work to do
It is not a specific person. being lead by flight line manager, input from chief inspector, stores, logistics manager supply chain has been looked at due to a specific problem the respondent stated they had robbing/transposing process had been mapped due to gaps found in records No
H
No in The respondent’s words, No document to say how the respondent stated they run the business the respondent stated they have an external quality guy who drew up manual once a ¼ The respondent suppose to do it, but according to The respondent The respondent is late word
don’t know the respondent stated they have mop to follow just satisfy CAA requirements
No

Appendix C
184
4.1 have you formal procedures in place for all your processes, not just those required by CAA regulations?
4.1a Who writes the original processes (title of position or group)?
4.1b Who reviews and approves the original processes (title of position)?
4.1c How often are the processes reviewed and by whom?
4.1d How are the processes presented?
4.1e Do you believe your written processes reflect exactly what your staff performs?
4.1f Do you believe your staff know the written processes?
4.1g Do you believe your written processes add value to your company or where just created to satisfy regulatory/company polices
4.2 Have you mapped out all the processes in your organisation to show how they are inter related?
4.2a Which person/department performs the process mapping and do you believe it is accurate?
4.2b If only some processes mapped, specify which processes and why chosen?
4.3c If processes mapped, have external supplies been considered?
4.3d If Yes, which suppliers and why chosen?
I
Yes Before they gave out paper copies for comment but not responses received. So following several audits decided to get all managers in a room with overhead projector, so as to correct procedure on the spot. Several 2 hour meetings and they rewrote procedure. Further queries with mike reveals that procedure written by manager, No formal input from floor staff (apart from seeking comments but seem to be No formal procedure for this) written warnings given out for not following procedure and has been deemed to be more successful than friendly chat. As interviewee commented the respondent is now a “sergeant major” and ruins like the military. Company underwent a change of ownership with last few years. The person who set the company up was not procedure driven (was a pilot/entrepreneur) everything was seat of the pants. Company expanded rapidly in five years but support never caught up. Emphasis was on fleet expansion. 2009 was a stop to expansion and concentrated on support and procedures. was hard for mike at first to adapt as well as the respondent is used to managing many things at once but the respondent says new school needs to be consulted and guided, but now with procedures for everything and all trained, things run more smoothly but all must follow procedure. Before person could say No procedure in place to follow and lead to hr issues.
Everybody involved. Senior managers gathered in board room, 2 hours every week and reviewed all process. heads of departments, logistics, ops etc the group in boardroom Intention is every 6 months. combine training with review (unless something shows up in error and will be immediate fix) both
about 95% of the time 70% are quiet familiar .1e {NGO name} audit in past was wake up call. People where doing right thing but No process was in place. So now practical done first, tested, if works procedure written up. 2008 {NGO name} “pulled them apart” 2010 audit still issues but very successful so format of procedures will be changed to un procedure format so understood by auditors 4.1f when engineer comes back from outstation the respondent writes and exam as not much to do at outstation (but must be there if a defect occurs, {NGO name} demands it etc) so the respondent has time to study procedure
Written not mapped out. after asking question the respondent stated it is something they should do

Appendix C
185
5.1 do you have maintenance tracking/WIP software system?
5.1a is it an AMO specific software and what is its name? 5.1b what other information does it control, such as inventory? 5.2c does it track defects and work in progress (WIP)? 5.1d are all you software systems integrated?
5.2 How often do you review upcoming maintenance?
5.2a who determines which work to be carried out during maintenance check? 5.2c do you review defects and WIP regularly?
5.3 are staff organized per project or departmentally?
5.4 do you have standardised workcards/procedures in place?
5.4a who/where do you obtain the workcards? 5.4b is the work sequence of a maintenance check standardized? 5.4c who/how is the sequence
determined?
A
Yes {computer programme name} get info on {computer programme name}, they use all packages Tracks jobcards closed, pireps coded per ATA chapter. cost/mhrs per day Internal programmer has built modules into {computer programme name} as required. Microsoft access used in conjunction with system
bi-weekly internal scheduler works with customer support once a day with customer delay meetings for line once a day with customer on heavy checks
departmentally Yes Internal planning department takes all the data from OEM documentation and creates company workcards. only in phases e.g. access, inspection but not in any more detail than that ‘hard and fast” planning dept deal with routine tasks, engineer deal with SBs mods, ADs etc
B
Yes in house developed programmes stores is separate and maintenance is separate Yes all traceable No
seems No set interval planning forward it directly to technician Yes as required
departmentally Yes interair the respondent stated they open/inspect/close area immediately of each zone Crew chief gets a package and decides. the workpack is in packages per work area/zone e.g. wings etc
C
Yes {computer programme name} (had {computer programme name} first & switched)
loves {computer programme name} system stores, planning, work orders Yes No invoicing is separate
daily planning defects daily – line does not have much WIP (had 16 a/c in {place name})
departmentally Yes – loaded on {computer programme name} {computer programme name} supplied them Yes determined through {computer programme name} & manufacturer
D
Yes the respondent stated they use AMO maintenance and inventory – not financials defects No financials separate
customer provides work scope the respondent stated they will assess and advise as necessary any additional work repairs etc, at the end of the day up to customer to decide inspector tracks it, once every few weeks the respondent stated they review but No set schedule
departmentally Yes from the OEM by the OEM, follow the process. fields had written up an acceptance check list and chain of events such as tear down, assessment in standard times head of the department decides

Appendix C
186
5.1 do you have maintenance tracking/WIP software system?
5.1a is it an AMO specific software and what is its name? 5.1b what other information does it control, such as inventory? 5.2c does it track defects and work in progress (WIP)? 5.1d are all you software systems integrated?
5.2 How often do you review upcoming maintenance?
5.2a who determines which work to be carried out during maintenance check? 5.2c do you review defects and WIP regularly?
5.3 are staff organized per project or departmentally?
5.4 do you have standardised workcards/procedures in place?
5.4a who/where do you obtain the workcards? 5.4b is the work sequence of a maintenance check standardized? 5.4c who/how is the sequence
determined?
E
Yes {computer programme name} everything, “it’s like saps but cheaper” Yes using crystal reports Yes, all the way from ordering a part to invoicing
Not regularly. planning will inform of checks via email and when something coming in and line managers jump planning Yes, there is a Tuesday and Thursday meeting
departmentally Yes quantum/travels supervisors makes a call on work to do the team leader decides what they need and do
F
Yes {computer programme name} everything, now it invoices, new modules installed recently Yes Yes
every day planning gives due list and chief engineer decides what checks are to be done Yes every day, the supervisors of the hangar and outstation review defects and report to engineering manager
departmentally Yes created in house using OEM documents No up to crew chief to give a list of what daily the respondent will perform then at end of day reports what has been done to engineering manager
G
Yes {computer programme name} inventory, reliability, grd support equip, planning Yes finance uses {computer programme name} operations uses {computer programme name}
once every 2 months heavy checks every 7 days line checks planning manager & maintenance controller Yes. During checks daily prod meeting. on line daily review of tech logs
departmentally Yes internally per fleet maybe but not across a/c fleet Chief inspector determines during heavy
checks. standard lay out of pack per zone
H
Yes {computer programme name} does billing Yes No
on going basis senior engineer No
departmentally Yes own design just follow the cards, so sequence is not standardised as had to explain to The respondent the concept
I
Yes {computer programme name} Everything. It controls the AMO Yes Yes
on emb120, 100hrs prior to 500hr check incl logistics, contractors , planners, ames planning Yes
departmentally Yes planning office Yes by planning & chief engineer

Appendix C
187
5.5 Do you have standard production times for each task?
5.5a Are specific Man Hours (Mhrs) assigned to each stage of the individual tasks or is it a total Mhrs for the task? 5.5b Who determines the production time for task? 5.5c How is this data communicated to production staff?
5.6 Do you have visual controls in place to show production status?
5.6a What production information/WIP status displayed and in what format? 5.6b Who updates the visual controls and how often? 5.6c Who has access to view the visual controls?
A
Yes Yes, man-hours are broken up by the planning dept when creating the workcards planning based on historic data and Boeing data printed on jobcard
this caused confusion
{computer programme name} is updated continually and the bay controller has access to a screen showing % cards closed, mhrs/costs etc. shows red when preset limits exceed there is No visual controls, all electronic only bay controller as confidential information on computer system such as costs
B
No No the respondent stated they do not keep track as move people around a lot
Yes The respondent stated they have a board where open defects are shown. supervisor writes up the defects, major jobs to be done, component issue, repairs senior engineer as required Everybody. public board of major issues
C
No {computer programme name} had an excel programme for all defects open senior engineer AME who is part of planning, emailed daily to all management
D
Yes
per tasks head of department to ensure times are worked to and times are based on historic data and market related for total times and split per say compressor tear down etc verbal and monitored by head of department
No
E
As quoted by planning. trying to create macros to automate times, such as a wheel change
individual planning on a board
No, all the data is in the workpack, engineers sit next to planning
There is a job sequence page at start of workpack. people sign off what they have done Every AME who sits in planning. all jobcards go to planning and are captured on quantum

Appendix C
188
5.5 Do you have standard production times for each task?
5.5a Are specific Man Hours (Mhrs) assigned to each stage of the individual tasks or is it a total Mhrs for the task? 5.5b Who determines the production time for task? 5.5c How is this data communicated to production staff?
5.6 Do you have visual controls in place to show production status?
5.6a What production information/WIP status displayed and in what format? 5.6b Who updates the visual controls and how often? 5.6c Who has access to view the visual controls?
F
Yes each stage depends on tasks, if in manual used, if not engineering manager decides its on jobcard
The respondent stated they do but not implemented yet, will not give further details. I believe in very early stages of design
G
mostly total tasks only not strong on this at present the respondent admitted printed on task card
Yes Gant chart for heavy maintenance showing % complete, deadline dates progress report for line daily showing outstanding tasks production analysis does it daily for heavy check crew chief for line on computer & emails crew chief prints copies and places on boards
H No
No
I Yes
Yes it is shown on each workcard manufacturers supplied figures used by planning & chief `engineer
Yes in hangar where boards publicly visible showing major defects/work to do, was visible to interviewer during walk about

Appendix C
189
5.7 Where is your inventory primarily obtained from (country)? 5.7awhat is the average lead time for inventory from placing order?
5.7b what is your inventory turnover 5.7c is the cost of storing inventory taken into consideration? If Yes, explain
5.8 do you have a standardised inventory list for maintenance checks?
5.8a who put the inventory list together
5.8b is this inventory just for scheduled maintenance or include common defects?
A
USA 80% EU 20% 3-5 days
unknown Company works on a consignment stock basis. Suppliers have direct access to their stock levels and supply as required and only charge company when the item is issued to an aircraft. Customers also have the option of arriving at the check with their own spares. “the respondent stated they are not a bank”
Yes Planners assemble material lists based on check. AMASIS pulls the requirements and a material planner pulls the items from stock or orders them if not available
scheduled Yes, unscheduled No
B USA 4 days DHL
Every month a stock take. (except consumables) No
filters and for a & b check
Boeing list
No. but if know of a defect before aircraft input will get the applicable spares
C USA 3 weeks
only had what required No
{computer programme name} has it {computer programme name} separate one for common defects
D
UK 15-30 days for 100% replacement parts the respondent stated they also source parts form market surplus dealers
3 to 4 times a year No. the respondent stated they take into account shipping and vat
engine & props Yes airframe No
head of department
the respondent stated they know what the respondent stated they need for standard overhauls etc the respondent stated they use engine carcasses for other spares RR have told the respondent’s company to buy cores up as they stopping making the parts
E USA 48hrs
80% is AOG, AOG is costing too much No, as stock kept is so low
No as every job that comes in is different Start from scratch each check. Camp programme prints out what is required
No
F USA, UK, European country 2 days AOG, 4 weeks normal. Some parts come overnight
unknown No
Yes engineering manager just standard checks
G UK, European country UK 3 to 4 days France 5 days
figure not at my finger tips No
Yes maintenance manual recommendation per tasks historic analysis
MRP for scheduled items min stock for common defects
H USA, European country depends, AOG is 48 hours
No inventory kept all is JIT n/a
No
I USA 3 to 7 days
Unknown. some items on shelf long time Yes absolutely due financial consideration
Yes. was shown a list of routine spares for one check
chief inspector and planning using previous history and maintenance manual
Just scheduled checks. they know high “flow” items

Appendix C
190
5.9 Do you have a formal method to determine what inventory is to be held in stock?
5.9a What method is used to determine inventory items and quantity?
5.9d How do you determine when to re-ordering inventory?
5.9b Who is responsible for determining inventory items and quantities?
5.9c Is inventory subject to regular review and by whom?
5.9e What is your target % availability 5.9f What is your actual % availability
5.9g Is all inventory in one location or subdivided amongst the various production areas?
5.9h Is the inventory issue controlled or “free access” to staff when required?
A
{Computer programme name} has a function that shows what moves and works out a ratio
{computer programme name} Used to have min/max but now consignment Company works on a consignment stock basis. Suppliers have direct access to their stock levels and supply as required and only charge company when the item is issued to an aircraft. Customers also have the option of arriving at the check with their own spares. “the respondent stated they are not a bank”
Logistics Yes by logistics
Not really n/a
One main store Strictly controlled
B
By experience Not really a formal method Min list and if the respondent stated they get a good deal on spares, will take a job lot when and if available
Chief store man and admin manager Monthly store check
The respondent stated they have got a lot of stock
Components kept in JNB consumables kept at respondent's hangar in another airport in South Africa Controlled
C
Was on computer but based on thumb suck, No math’s etc
Thumb suck Looking at it, keeping record of what the respondent stated they used, if the respondent stated they order 3 in a row order some for stock
Operations-dedicated inventory was owned & controlled by operator Operator had a person in USA responsible
Due customs issues it was a problem Each base a store Controlled
D
Yes Defect items the respondent stated they look at old usage reports and add a bit extra. min stick levels based on engine throughput, 4 per year, overhauls and the respondent stated they have historic data
Inventory based on orders for work to be done during the year based on past experience of requirements by technical persons
The respondent stated they will never have all the spares, the respondent stated they only keep 100% of replacement parts, rest rob from caresses of engines. 85% of the items the respondent stated they have in stock, which the respondent stated they rob, RR will supply o rings etc
E
Through quantum get rid of what is not moved in last 12 months
If you use 10 in a year, keep a stock of 13 quantum, has a min stock level
Computer system suggest to warehouse Monthly through computer. Ames make suggestions to warehouse and they make final update decision
None One store Controlled
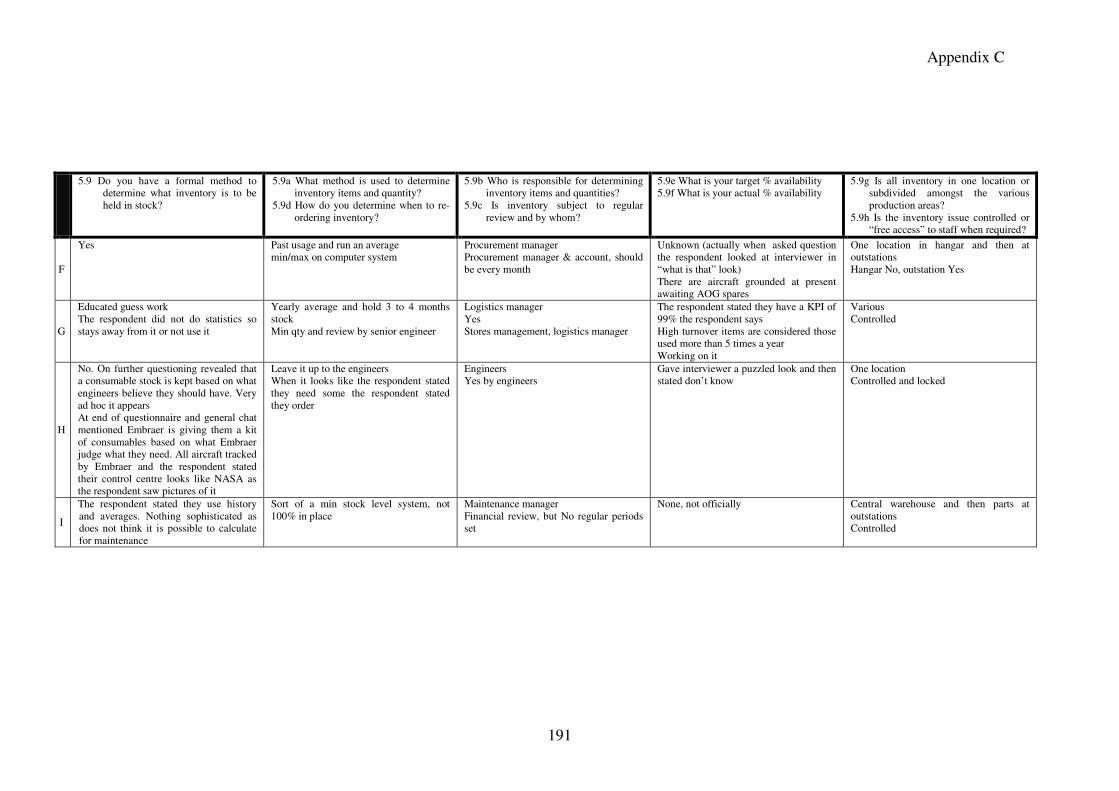
Appendix C
191
5.9 Do you have a formal method to determine what inventory is to be held in stock?
5.9a What method is used to determine inventory items and quantity?
5.9d How do you determine when to re-ordering inventory?
5.9b Who is responsible for determining inventory items and quantities?
5.9c Is inventory subject to regular review and by whom?
5.9e What is your target % availability 5.9f What is your actual % availability
5.9g Is all inventory in one location or subdivided amongst the various production areas?
5.9h Is the inventory issue controlled or “free access” to staff when required?
F
Yes Past usage and run an average min/max on computer system
Procurement manager Procurement manager & account, should be every month
Unknown (actually when asked question the respondent looked at interviewer in “what is that” look) There are aircraft grounded at present awaiting AOG spares
One location in hangar and then at outstations Hangar No, outstation Yes
G
Educated guess work The respondent did not do statistics so stays away from it or not use it
Yearly average and hold 3 to 4 months stock Min qty and review by senior engineer
Logistics manager Yes Stores management, logistics manager
The respondent stated they have a KPI of 99% the respondent says High turnover items are considered those used more than 5 times a year Working on it
Various Controlled
H
No. On further questioning revealed that a consumable stock is kept based on what engineers believe they should have. Very ad hoc it appears At end of questionnaire and general chat mentioned Embraer is giving them a kit of consumables based on what Embraer judge what they need. All aircraft tracked by Embraer and the respondent stated their control centre looks like NASA as the respondent saw pictures of it
Leave it up to the engineers When it looks like the respondent stated they need some the respondent stated they order
Engineers Yes by engineers
Gave interviewer a puzzled look and then stated don’t know
One location Controlled and locked
I
The respondent stated they use history and averages. Nothing sophisticated as does not think it is possible to calculate for maintenance
Sort of a min stock level system, not 100% in place
Maintenance manager Financial review, but No regular periods set
None, not officially
Central warehouse and then parts at outstations Controlled

Appendix C
192
6.1 Are there specific strategic goals set for the department/company?
6.1a If Yes, what is it and how often is it reviewed?
6.1b Who (or group) sets the higher strategy?
6.1c Are specific targets/goals derived from the strategy for each department?
6.1d How are these targets/goals communicated to staff? 6.1e Are the goals data collected quantitative or qualitative 6.1f How is the collected data used/reviewed and by whom and how often?
6.2 Do you have a process of continuous improvement?
6.2a If Yes, who is involved? i.e. which members of staff
6.2b How often do they meet? 6.2c Are there specific time lines set to
implement the improvements? 6.2d Are there specific budgets set to
implement the improvements?
A
Yes Goals reviewed every 2 weeks during exec meeting the board Yes
No fixed methods and varies per department. Engineering department get together once a week for a debrief from exec meeting Goals are fixed figures such as “fill all bays” No formal process. lots of reports around but No centralized system
No
B
Yes I believe there is not specific goals set except to say which ACMI contracts they entering, so No overriding company strategy that is know to staff
New routes being done Board and chairman
Verbal, email, fax No No
Yes but not a formal method Quality department Determined by audit plan and as problem crop up or observed Depends if minor or major finding (from audit) No
C
No Yes Operator, quality & planning every 2 weeks Initially Yes if CAA have findings Yes (seems only quality, CAA issues solved)
D
The respondent stated they don’t really have set goals. The respondent stated they look at total company purchases, over counter sales/spares
Yes once a year, what the respondent stated they have achieved this year and what the respondent stated they want next year e.g. 8-10% growth. The respondent stated they look at costs and try to keep costs low to improve margins gm, company owner, account The respondent stated they look at each department year on year (4 income streams, prop, eng, a/c, over counter)
The respondent stated they do not divulge financials. also union on airport (staff are not formal members) Qualitative. the respondent stated they did alright so 13th cherub issued, highlight problems area mainly warranties, verbally share highlights with staff review of financials every quarter “the situation”
Yes Driven by regulatory requirements Not internal continuous improvement. quality assurance system, they give findings and the respondent stated they improve

Appendix C
193
6.1 Are there specific strategic goals set for the department/company?
6.1a If Yes, what is it and how often is it reviewed?
6.1b Who (or group) sets the higher strategy?
6.1c Are specific targets/goals derived from the strategy for each department?
6.1d How are these targets/goals communicated to staff? 6.1e Are the goals data collected quantitative or qualitative 6.1f How is the collected data used/reviewed and by whom and how often?
6.2 Do you have a process of continuous improvement?
6.2a If Yes, who is involved? i.e. which members of staff
6.2b How often do they meet? 6.2c Are there specific time lines set to
implement the improvements? 6.2d Are there specific budgets set to
implement the improvements?
E
The respondent had to think about this and says it’s flexible according to demand. I do not think they have any
Top management (of which the respondent is a member)
Every 4 months there is a braai and staff informed of what’s coming up and what’s gone past. Nothing written down Combination Through HR & top management
No but After clarifying the question the respondent mentioned every Wednesday morning the guys sit around and given a chance to discuss items, grievances etc If safety issue done immediately The respondent stated they use non conformance reports and each non conformance gets a date
F
Yes
Yes No Weekly meeting and that’s minuted
Try to use figures- it is a new technique for the respondent’s company for now collected by accounts when the money comes into the bank and the CEO
No (when I enquired more got some response)
Every 3 months get together and say what’s happening, courses being given etc
G
Yes At least annually CEO & exec management Yes
Busy putting together KPI for each staff member Mixture Monthly report. Senior management have reporting requirements. risk management forum in maintenance review items every 2 weeks
Yes Not formal. started it up and it fell apart Ad hoc On certain projects Yes Not always
H
No. on further questioning stated that business as a whole is not set in stone and engineers give them leads for new business
Not formal. As the respondent stated they find things the respondent stated they fix them
I
Yes Goals are confidential reviewed once a year CEO, mike, operations & financial director Yes
Verbally and meetings Some figures. during the tri monthly safety meeting, quality figures, financial overview and future direction given
Yes Sub department managers Twice a week Yes. End April line maintenance must have a control manual Not really

Appendix C
194
6.3 Do you benchmark yourself against any company?
6.3a If Yes, please provide information on benchmarking undertaken and why that company selected?
A Kind of Reliability dispatch based on American
airlines and an Australian company against data on AMASIS it appears
B Don’t know
C Yes Labour benched marked against several
RSA AMOs
D
Yes The respondent stated they do market price research to the competitors e.g. Vector Aerospace on engine on propeller work. Aircraft not so much as the respondent stated they deal in such specific aircraft not maintained by many.
E No Which company could the respondent
stated they look at? Also have not got the time and where would they get the data
F No
G Yes Benchmark against fleet averages as
supplied by the owner e.g. dispatch reliability
H No
I
Trying to but difficult Difficult to do against RSA companies. They have asked a UN organisation they support for a benchmark. Has mentioned would love results of this survey so could see how they are doing They have the intention to benchmark themselves

195
END