the status of indian agriculture and role of apmc system
TRANSCRIPT
The Status of Indian Agriculture and
Role of APMC System
InfoSphereACentreforNewEconomicsStudiesInitiative
InfoSphere
AlivaSmruti,ArundhatiRajan,AshuJain,SnehalSreedhar
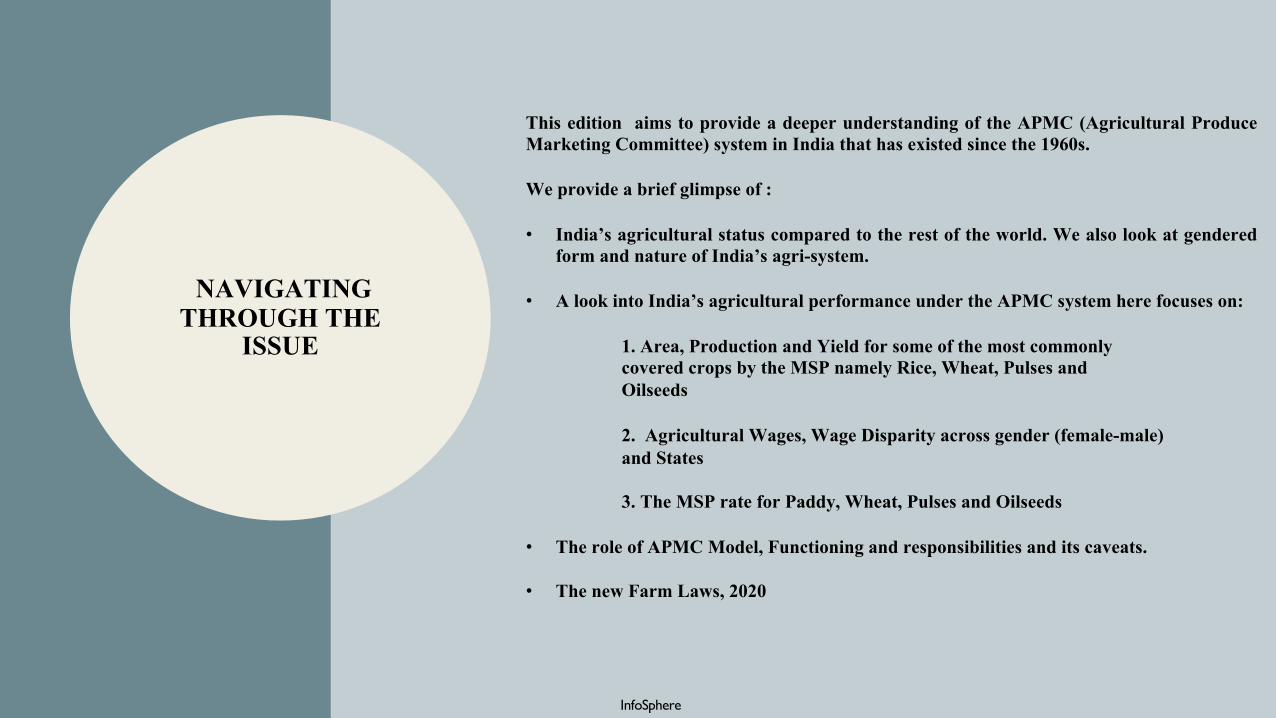
NAVIGATING THROUGH THE
ISSUE
InfoSphere
This edition aims to provide a deeper understanding of the APMC (Agricultural ProduceMarketing Committee) system in India that has existed since the 1960s.
We provide a brief glimpse of :
• India’s agricultural status compared to the rest of the world. We also look at genderedform and nature of India’s agri-system.
• A look into India’s agricultural performance under the APMC system here focuses on:
1. Area, Production and Yield for some of the most commonlycovered crops by the MSP namely Rice, Wheat, Pulses andOilseeds
2. Agricultural Wages, Wage Disparity across gender (female-male)and States
3. The MSP rate for Paddy, Wheat, Pulses and Oilseeds
• The role of APMC Model, Functioning and responsibilities and its caveats.
• The new Farm Laws, 2020
Where We Stand Today – India and the World
Source: World Bank
1.00
1.50
2.00
2.50
3.00
3.50
1995 1996 1997 1998 1999 2000 2001 2002 2003 2004 2005 2006 2007 2008 2009 2010 2011 2012 2013 2014 2015 2016 2017 2018
LN
(% G
DP)
Contribution by Agriculture to GDP( as %GDP )ln(Argi_World) ln(Argi_China) ln(Argi_India)
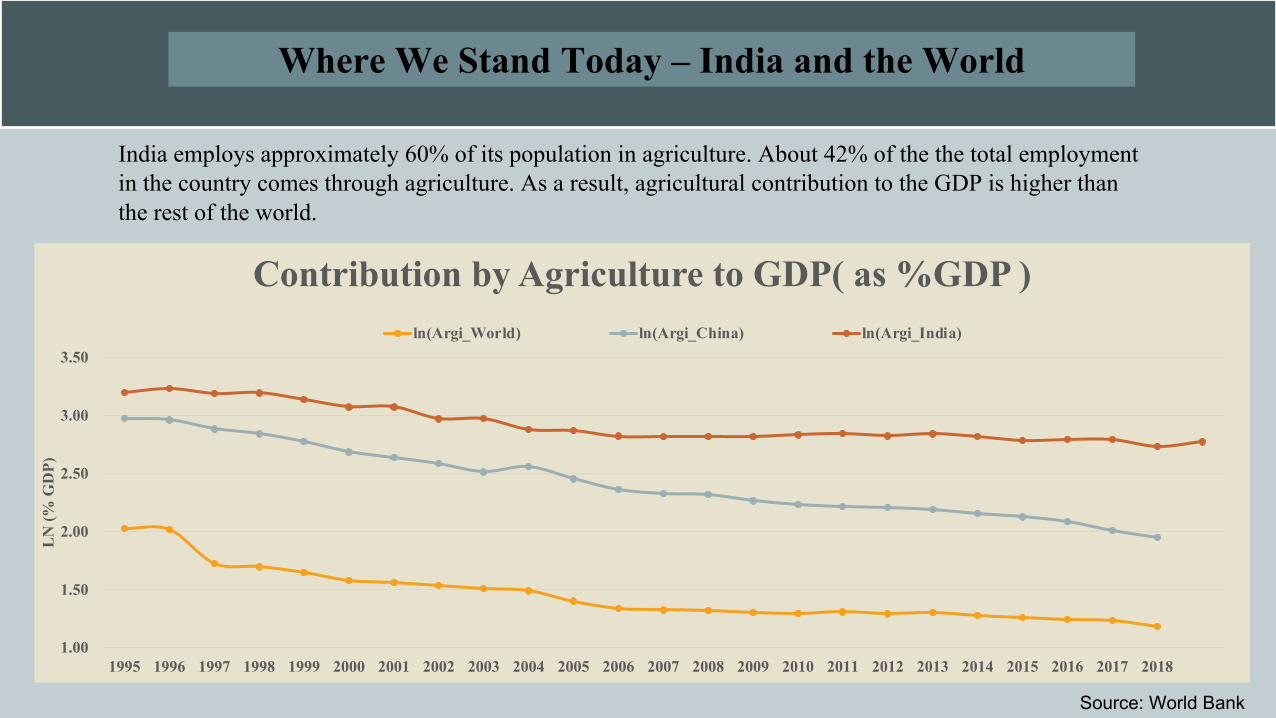
India employs approximately 60% of its population in agriculture. About 42% of the the total employment in the country comes through agriculture. As a result, agricultural contribution to the GDP is higher than the rest of the world.

0
10
20
30
40
50
60
70
80
1991
1992
1993
1994
1995
1996
1997
1998
1999
2000
2001
2002
2003
2004
2005
2006
2007
2008
2009
2010
2011
2012
2013
2014
2015
2016
2017
2018
2019
Perc
enta
ge
% of Female employed in Agriculture (as a % of agricultural worker)
China India
World
Source: World Bank
Gender-wise Comparison of Workforce Involved in Agriculture
0
10
20
30
40
50
60
70
80
1995
1996
1997
1998
1999
2000
2001
2002
2003
2004
2005
2006
2007
2008
2009
2010
2011
2012
2013
2014
2015
2016
2017
2018
Perc
enta
gee
% of Male Employment in Agriculture (as a % of agricultural worker)
China India
World
Here we see women are more likely to be working in the (unorganized) agricultural space , largely due to a lack of better, alternative employment opportunity. This might be true for the world, still, the proportion is much higher in India.
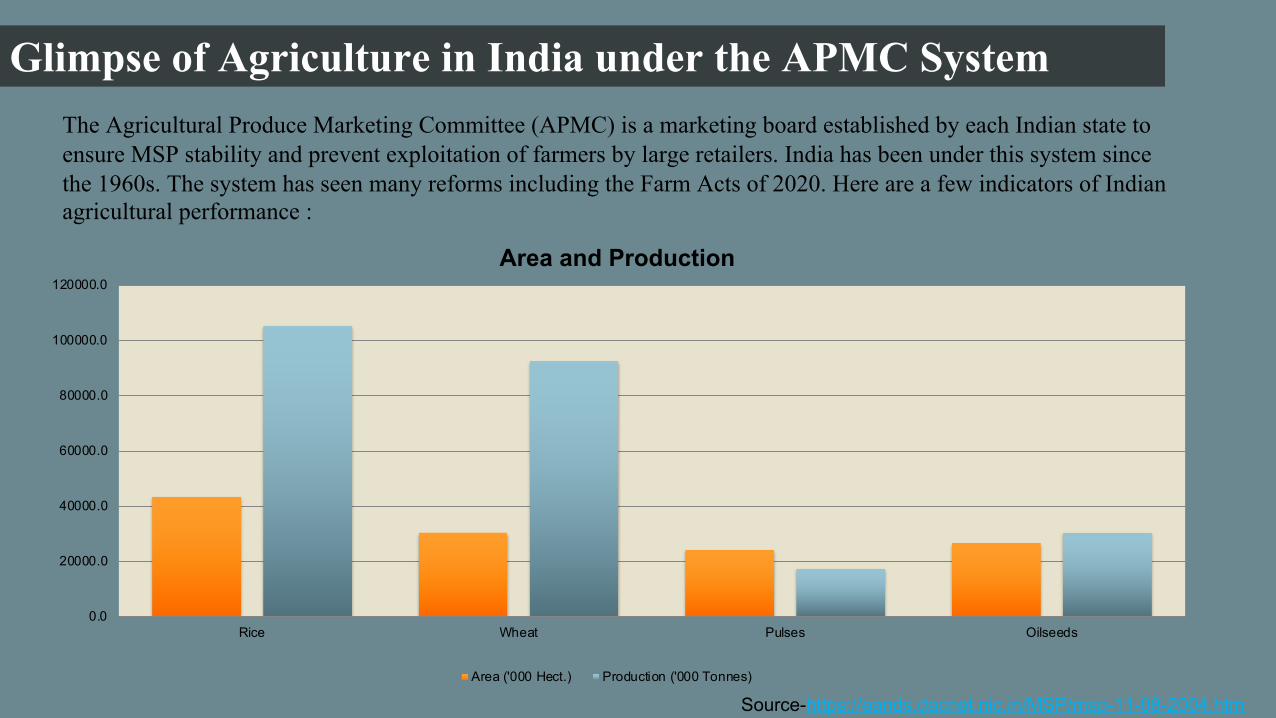
Glimpse of Agriculture in India under the APMC System
0.0
20000.0
40000.0
60000.0
80000.0
100000.0
120000.0
Rice Wheat Pulses Oilseeds
Area and Production
Area ('000 Hect.) Production ('000 Tonnes)
The Agricultural Produce Marketing Committee (APMC) is a marketing board established by each Indian state to ensure MSP stability and prevent exploitation of farmers by large retailers. India has been under this system since the 1960s. The system has seen many reforms including the Farm Acts of 2020. Here are a few indicators of Indian agricultural performance :
Source-https://eands.dacnet.nic.in/MSP/msp-11-08-2004.htm
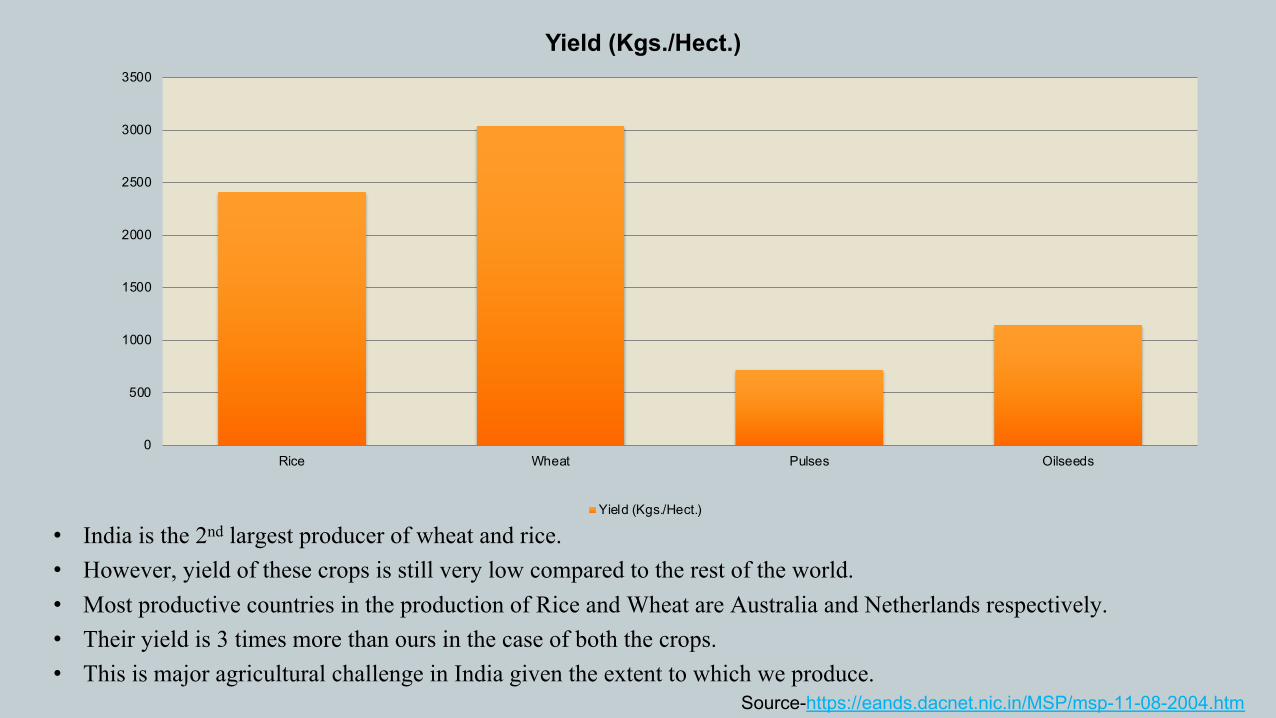
• India is the 2nd largest producer of wheat and rice.• However, yield of these crops is still very low compared to the rest of the world. • Most productive countries in the production of Rice and Wheat are Australia and Netherlands respectively. • Their yield is 3 times more than ours in the case of both the crops. • This is major agricultural challenge in India given the extent to which we produce.
0
500
1000
1500
2000
2500
3000
3500
Rice Wheat Pulses Oilseeds
Yield (Kgs./Hect.)
Yield (Kgs./Hect.)
Source-https://eands.dacnet.nic.in/MSP/msp-11-08-2004.htm

229
268281
296
315
330
180
201
218228
244
262
2013-14 2014-15 2015-16 2016-17 2017-18 2018-19
All India Average Agricultural Wage Rates for Field Labour (in Rupees)
Male Female
40
45
50
55
60
65
70
75
2013-14 2014-15 2015-16 2016-17 2017-18 2018-19
Agricultural Wage Disparity(male wage – female wage, in Rupees)
Agricultural Wages and Disparity Across GenderDespite higher female involvement in agriculture, there continues to exist wage disparities between both the genders. Wage disparity has only marginally fallen in the year 2019. It seems from the graphs that while male wage rates are rising, female rates are rising slower comparatively.
Source-https://eands.dacnet.nic.in/MSP/msp-11-08-2004.htm

State-wise Growth Rate in Average Agricultural Wages (%)
Almost all states have witnessed a rise in agricultural wage rates for men and women. However, only 8 of 20States have shown a rise in wages for women to be faster than men.Although Maharashtra has shown a significant rise in wage rates for both the genders wage rate for men is Rs.273 as opposed to Rs. 673 in Kerala.
0
20
40
60
80
100
120
140
Andhra
Prad
esh
Assam Biha
r
Chattis
garh
Gujarat
Haryan
a
Himan
chal…
Jhark
hand
Karnata
kaKera
la
Madhya
Prad
esh
Maharas
htra
Orissa
Rajasth
an
Tamil N
adu
Trupura
Uttar P
rades
h
Uttarak
hand
West Ben
gal
All Ind
ia Ave
rage
MaleFemale
Source-https://eands.dacnet.nic.in/MSP/msp-11-08-2004.htm

The Minimum Support Price (MSP)
Kharif Rabi Commercial
• Paddy• Jowar• Bajra• Maize• Ragi• Arhar• Moong• Urad• Groundnut• Soyabean• Sunflower• Sesamum• Nigerseed• Cotton
• Wheat• Barley• Gram• Masoor• Safflower• Rapeseed &
Mustard
• Jute• Copra
Pulses• Arhar• Moong• Urad• Gram• Masoor
Oilseeds• Groundnut• Soyabean• Sunflower• Sesamum• Nigerseed• Safflower• Rapeseed &
Mustard
Factors Affecting MSP
• Cost of production
• Demand-supply (world and domestic)
• Domestic and international prices
• Inter-crop parity
• Terms of trade between agricultural and non-agricultural sector
Crops Covered under the MSP
Source: 1. Ministry of Agriculture and Famers Welfare 2. Ministry of Agriculture and Famers Welfare
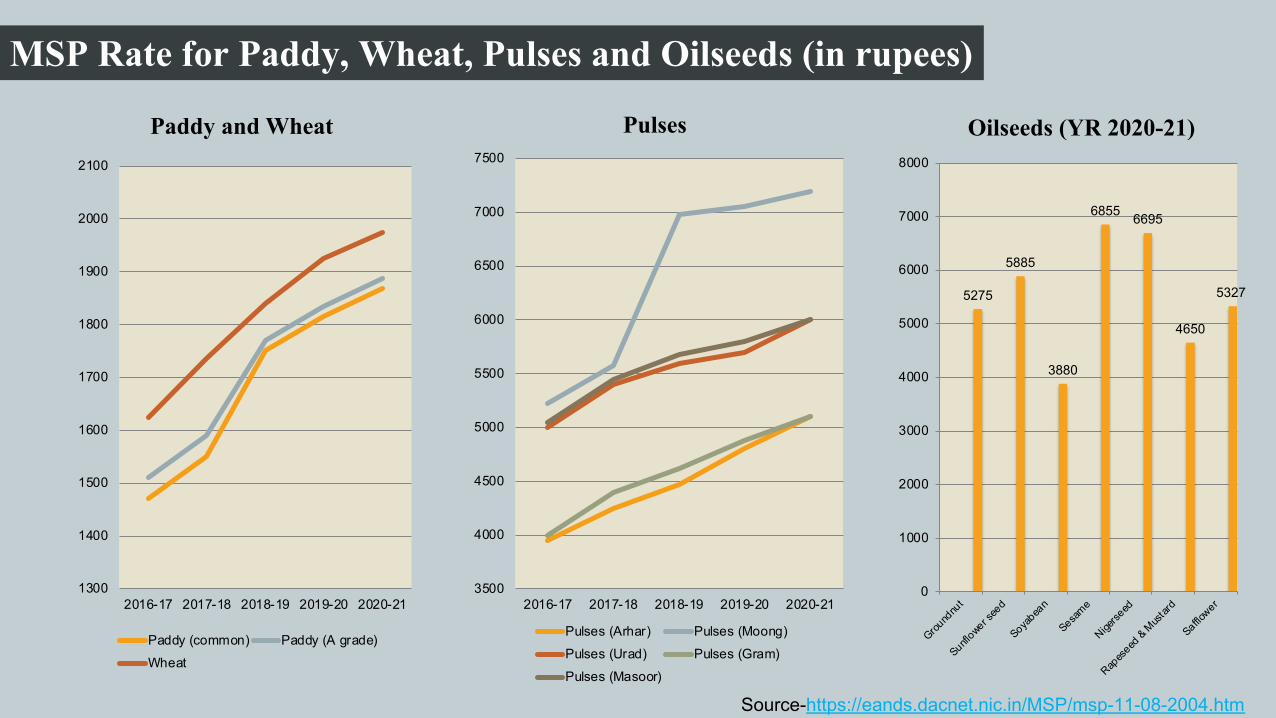
MSP Rate for Paddy, Wheat, Pulses and Oilseeds (in rupees)
1300
1400
1500
1600
1700
1800
1900
2000
2100
2016-17 2017-18 2018-19 2019-20 2020-21
Paddy and Wheat
Paddy (common) Paddy (A grade)Wheat
3500
4000
4500
5000
5500
6000
6500
7000
7500
2016-17 2017-18 2018-19 2019-20 2020-21
Pulses
Pulses (Arhar) Pulses (Moong)Pulses (Urad) Pulses (Gram)Pulses (Masoor)
5275
5885
3880
6855 6695
4650
5327
0
1000
2000
3000
4000
5000
6000
7000
8000
Ground
nut
Sunflower s
eed
Soyabea
n
Sesame
Nigerse
ed
Rapes
eed &
Mus
tard
Safflower
Oilseeds (YR 2020-21)
Source-https://eands.dacnet.nic.in/MSP/msp-11-08-2004.htm
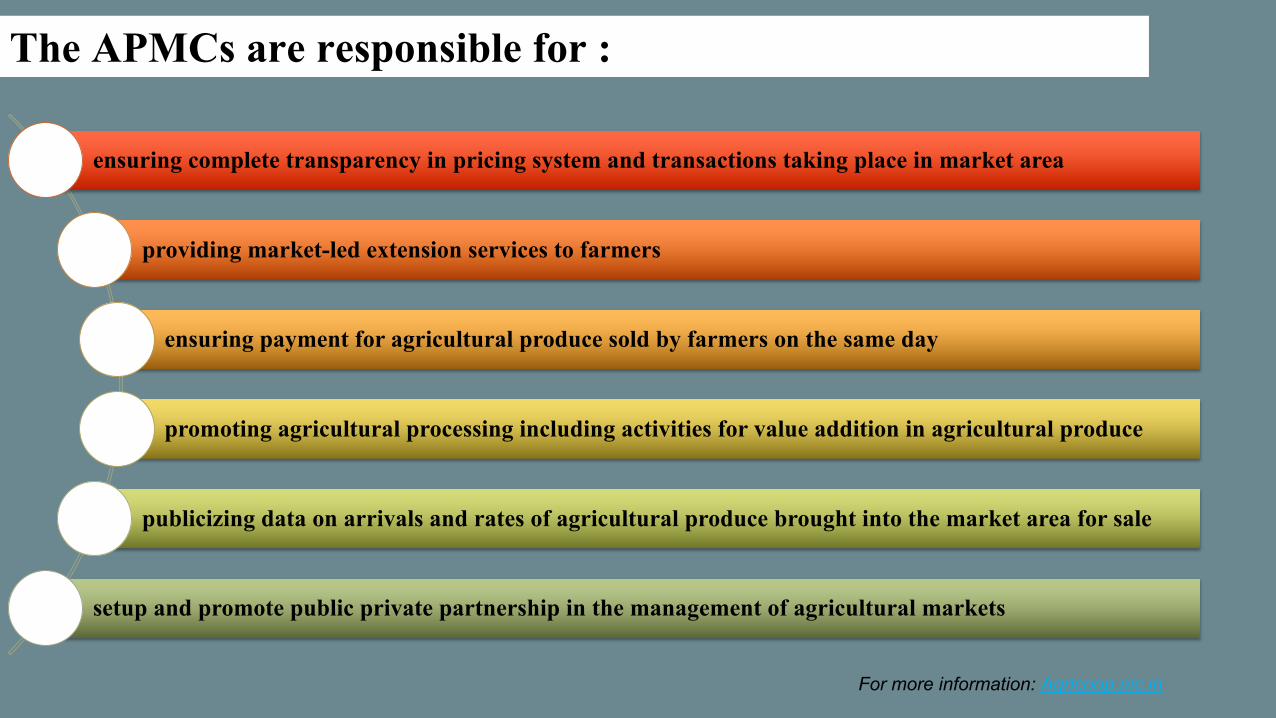
The APMCs are responsible for :
For more information: Agricoop.nic.in
ensuring complete transparency in pricing system and transactions taking place in market area
providing market-led extension services to farmers
ensuring payment for agricultural produce sold by farmers on the same day
promoting agricultural processing including activities for value addition in agricultural produce
publicizing data on arrivals and rates of agricultural produce brought into the market area for sale
setup and promote public private partnership in the management of agricultural markets

For more information: Agricoop.nic.in
Agricultural Markets in most parts of the Country are established and regulated under the State APMC Acts.
The whole geographical area in the State is divided and declared as a market area wherein the markets are managed by the Market Committees constituted by the State Governments. Once a particular area is declared a market area and falls under the jurisdiction of a Market Committee,
no person or agency is allowed freely to carry on wholesale marketing activities.
The monopoly of Government regulated wholesale markets has prevented development of a competitive marketing system in the country, providing limited help to farmers in direct
marketing, organizing retailing, a smooth raw material supply to agro-processing industries and adoption of innovative marketing system and technologies.
The APMC Model and Functioning

State-wise Details of Regulated Markets Including Principal Markets (2019)
Sl.Name of the
State/UT Area in Sq.Km
No. of APMC Markets (Regulated
PMYs)
No. of APMC Markets (Regulated
SMYs)
Total No. of APMC Markets (Regulated PMYs+SMYs) D+E
1. Andhra Pradesh 162970 22 169 1912. A & N Islands 8249 No APMC
3. Arunachal Pradesh 83743 13 0 134. Assam 78438 20 206 2265. Bihar 94163 0 0 06. Chandigarh 114 1 0 17. Chhattisgarh 136034 69 118 187
8. Dadra & Nagar Haveli 491 No APMC9. Daman & Diu 112 No APMC10. Goa 3702 1 7 811. Gujarat 196024 224 176 40012. Haryana 44212 108 173 28113. Himachal Pradesh 55673 10 46 5614. Jammu & Kashmir 222236 5 20 2515. Jharkhand 79714 17 173 19016. Karnataka 191791 162 351 51317. Kerala 38863 No APMC
The main marketing infrastructure for wholesale of agricultural produce in the country is being set up by the APMCs/RMCs. Under these APMCs/RMCs there exist: Principal Market Yards, Sub-Market Yards and Purchase Centre(s) also in some States.
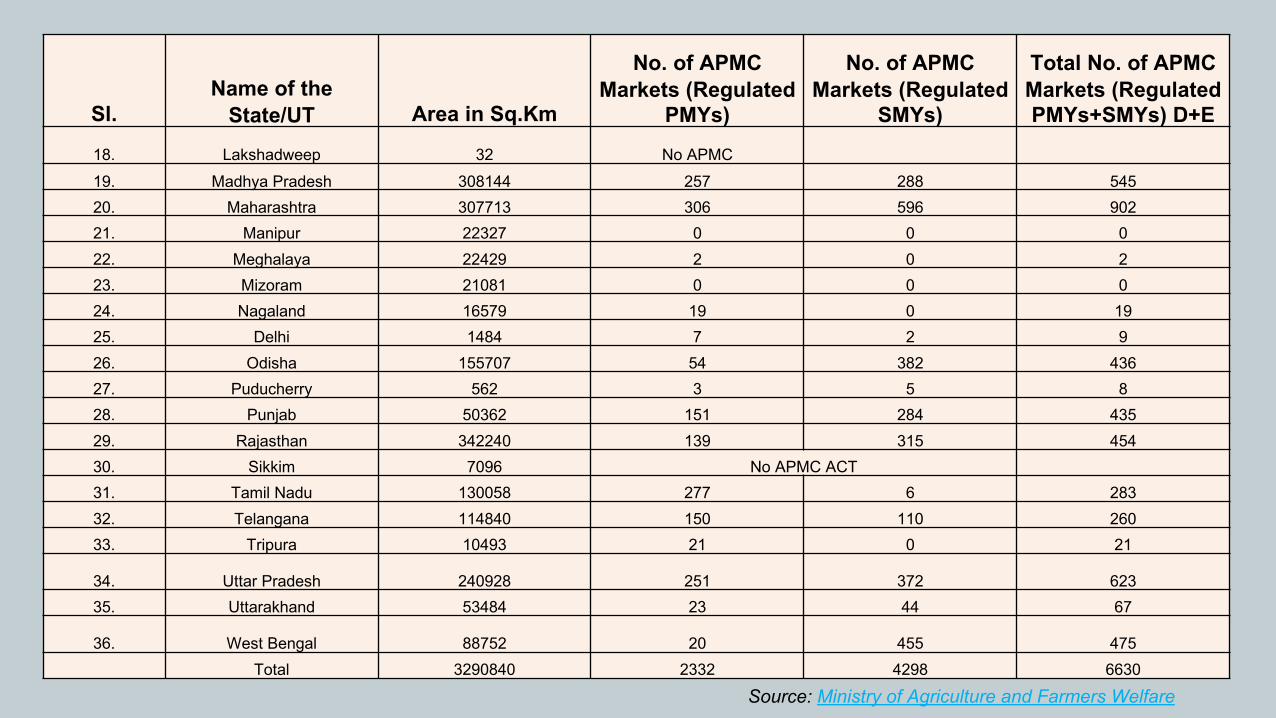
Sl.Name of the
State/UT Area in Sq.Km
No. of APMC Markets (Regulated
PMYs)
No. of APMC Markets (Regulated
SMYs)
Total No. of APMC Markets (Regulated PMYs+SMYs) D+E
18. Lakshadweep 32 No APMC19. Madhya Pradesh 308144 257 288 54520. Maharashtra 307713 306 596 90221. Manipur 22327 0 0 022. Meghalaya 22429 2 0 223. Mizoram 21081 0 0 024. Nagaland 16579 19 0 1925. Delhi 1484 7 2 926. Odisha 155707 54 382 43627. Puducherry 562 3 5 828. Punjab 50362 151 284 43529. Rajasthan 342240 139 315 45430. Sikkim 7096 No APMC ACT31. Tamil Nadu 130058 277 6 28332. Telangana 114840 150 110 26033. Tripura 10493 21 0 21
34. Uttar Pradesh 240928 251 372 62335. Uttarakhand 53484 23 44 67
36. West Bengal 88752 20 455 475Total 3290840 2332 4298 6630
Source: Ministry of Agriculture and Farmers Welfare
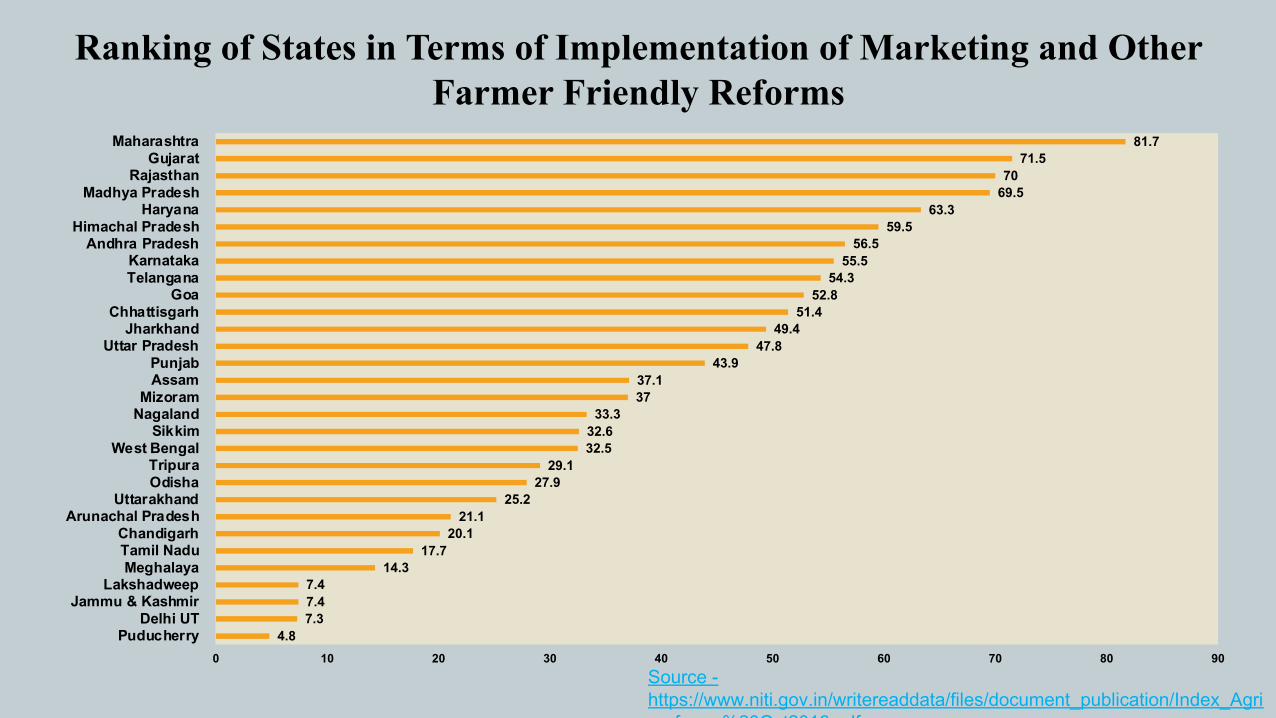
4.87.37.47.4
14.317.7
20.121.1
25.227.929.1
32.532.633.3
3737.1
43.947.849.4
51.452.854.355.556.5
59.563.3
69.57071.5
81.7
0 10 20 30 40 50 60 70 80 90
PuducherryDelhi UT
Jammu & KashmirLakshadweep
MeghalayaTamil NaduChandigarh
Arunachal PradeshUttarakhand
OdishaTripura
West BengalSikkim
NagalandMizoram
AssamPunjab
Uttar PradeshJharkhand
ChhattisgarhGoa
TelanganaKarnataka
Andhra PradeshHimachal Pradesh
HaryanaMadhya Pradesh
RajasthanGujarat
Maharashtra
Ranking of States in Terms of Implementation of Marketing and Other Farmer Friendly Reforms
Source -https://www.niti.gov.in/writereaddata/files/document_publication/Index_Agri_reform_%20Oct2016.pdf
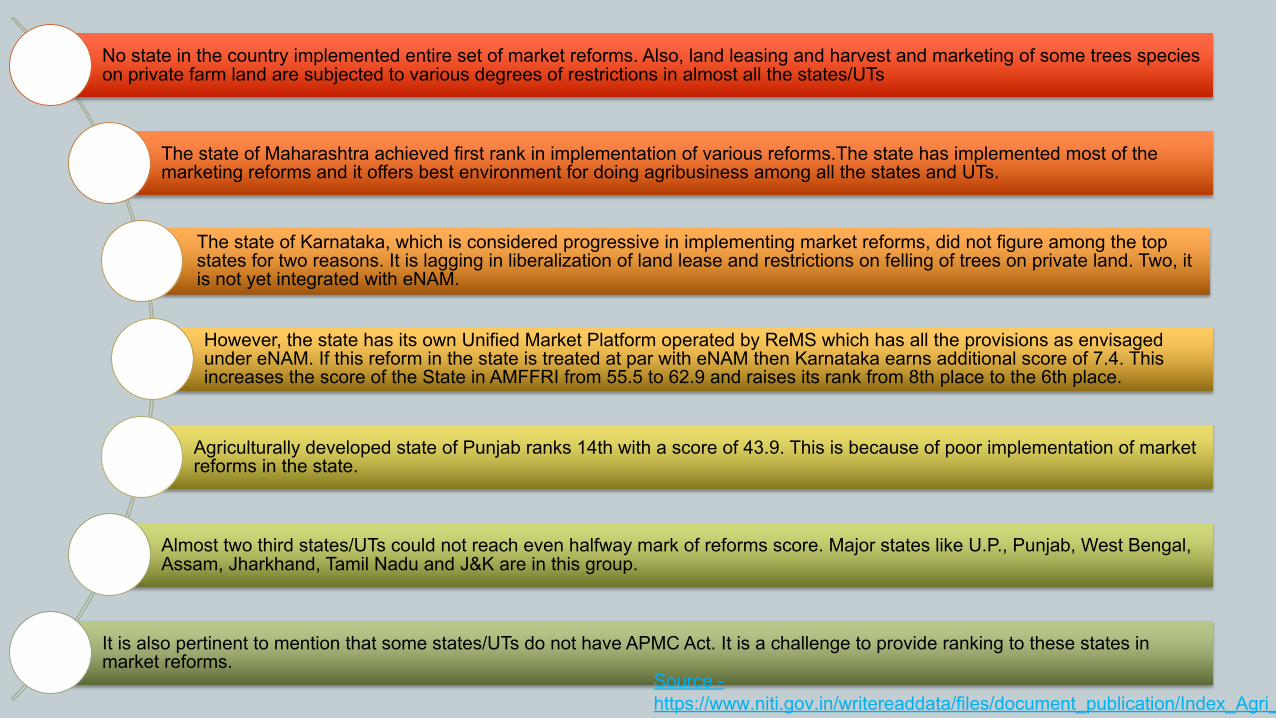
No state in the country implemented entire set of market reforms. Also, land leasing and harvest and marketing of some trees species on private farm land are subjected to various degrees of restrictions in almost all the states/UTs
The state of Maharashtra achieved first rank in implementation of various reforms.The state has implemented most of the marketing reforms and it offers best environment for doing agribusiness among all the states and UTs.
The state of Karnataka, which is considered progressive in implementing market reforms, did not figure among the top states for two reasons. It is lagging in liberalization of land lease and restrictions on felling of trees on private land. Two, it is not yet integrated with eNAM.
However, the state has its own Unified Market Platform operated by ReMS which has all the provisions as envisaged under eNAM. If this reform in the state is treated at par with eNAM then Karnataka earns additional score of 7.4. This increases the score of the State in AMFFRI from 55.5 to 62.9 and raises its rank from 8th place to the 6th place.
Agriculturally developed state of Punjab ranks 14th with a score of 43.9. This is because of poor implementation of market reforms in the state.
Almost two third states/UTs could not reach even halfway mark of reforms score. Major states like U.P., Punjab, West Bengal, Assam, Jharkhand, Tamil Nadu and J&K are in this group.
It is also pertinent to mention that some states/UTs do not have APMC Act. It is a challenge to provide ranking to these states in market reforms.
Source -https://www.niti.gov.in/writereaddata/files/document_publication/Index_Agri_reform_%20Oct2016.pdf
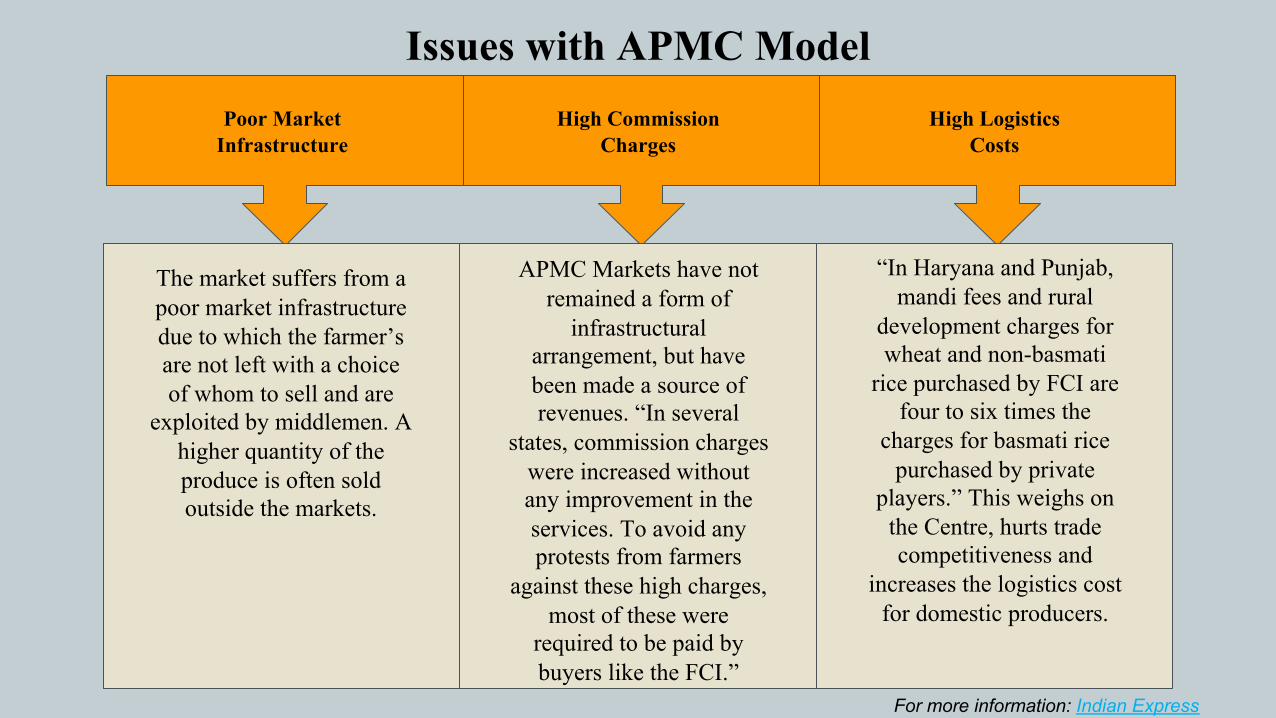
Issues with APMC ModelPoor Market
Infrastructure High Commission
ChargesHigh Logistics
Costs
The market suffers from a poor market infrastructure due to which the farmer’s are not left with a choice of whom to sell and are
exploited by middlemen. A higher quantity of the produce is often sold outside the markets.
APMC Markets have not remained a form of
infrastructural arrangement, but have been made a source of revenues. “In several
states, commission charges were increased without any improvement in the services. To avoid any protests from farmers
against these high charges, most of these were
required to be paid by buyers like the FCI.”
“In Haryana and Punjab, mandi fees and rural
development charges for wheat and non-basmati
rice purchased by FCI are four to six times the
charges for basmati rice purchased by private
players.” This weighs on the Centre, hurts trade competitiveness and
increases the logistics cost for domestic producers.
For more information: Indian Express

The Law and Price Discovery
Source: 1. Ministry of Agriculture and Famers Welfare2. Ministry of Agriculture and Famers Welfare
The reforms in agricultural marketing sector were ushered in with adoption of Agriculture Produce Marketing (Regulation) Act, popularly known as APMC Act by various States and Union Territories in 1960s and 1970s.
While they brought in a great improvement from the preceding village trader-dominated exploitative system, they failed to serve the full objective of price discovery in a fair and transparent manner.
Unfortunately, the market functionaries have over a period of time learnt to circumvent the basic objective of marketing regulation by cartelizing. More importantly, the APMCs have caused fragmentation of the markets thereby inducing inefficiency over space and time.
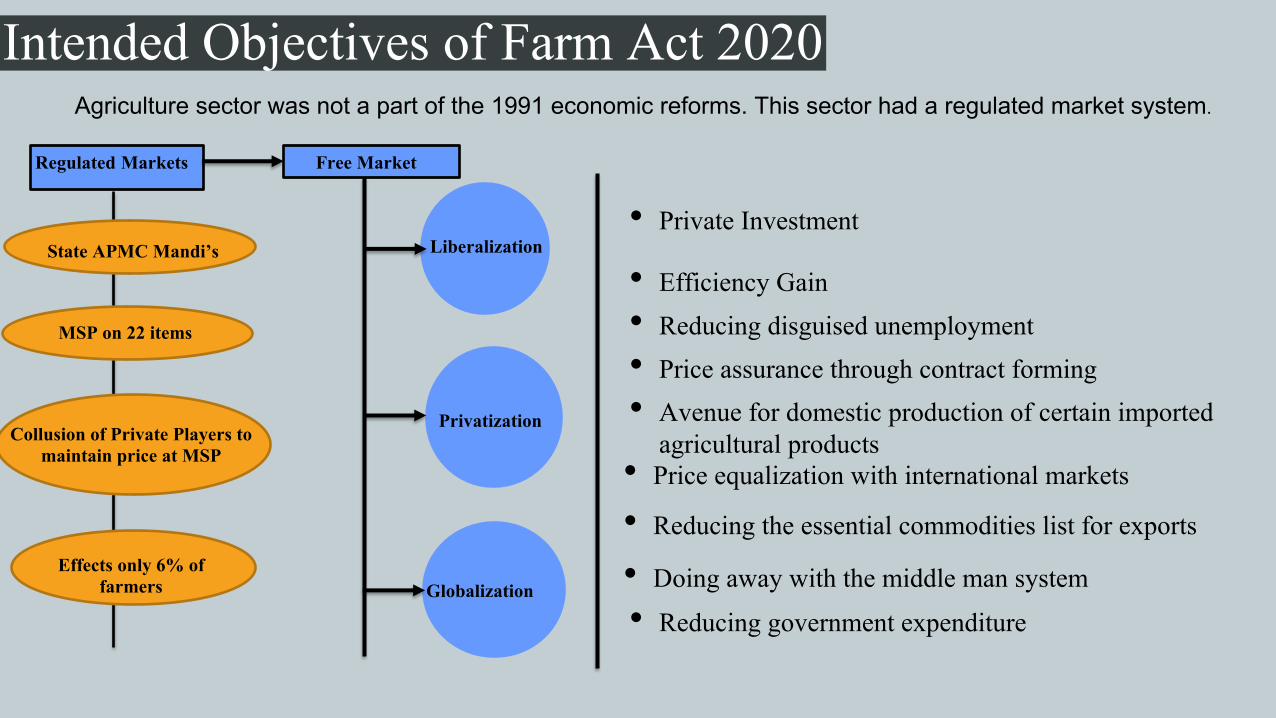
Intended Objectives of Farm Act 2020 Agriculture sector was not a part of the 1991 economic reforms. This sector had a regulated market system.
Liberalization
Regulated Markets
Globalization
Privatization
Free Market
• Private Investment
• Efficiency Gain
• Price assurance through contract forming • Avenue for domestic production of certain imported
agricultural products• Price equalization with international markets
• Reducing the essential commodities list for exports
• Doing away with the middle man system
• Reducing government expenditure
• Reducing disguised unemployment
State APMC Mandi’s
MSP on 22 items
Collusion of Private Players to maintain price at MSP
Effects only 6% of farmers

Current Act
Pre-act conditions
§ Agricultural trade only conducted in APMC market yards (mandis).
§ State governments levied taxes for agricultural produce that was bought outside the designated APMC mandi
The Farmers’ Produce Trade and Commerce (Promotion and Facilitation) Act, 2020
§ Permits intra-state and inter-state trade of farmers’ produce beyond the physical premises of Agricultural Produce Market Committee (APMC) market yards (mandis) and other markets notified under state APMC Acts.
§ Prohibits state governments from levying any market fee or cess on farmers, traders, and electronic-trading platforms for trading the produce of farmers in such areas.
Farm Act 2020
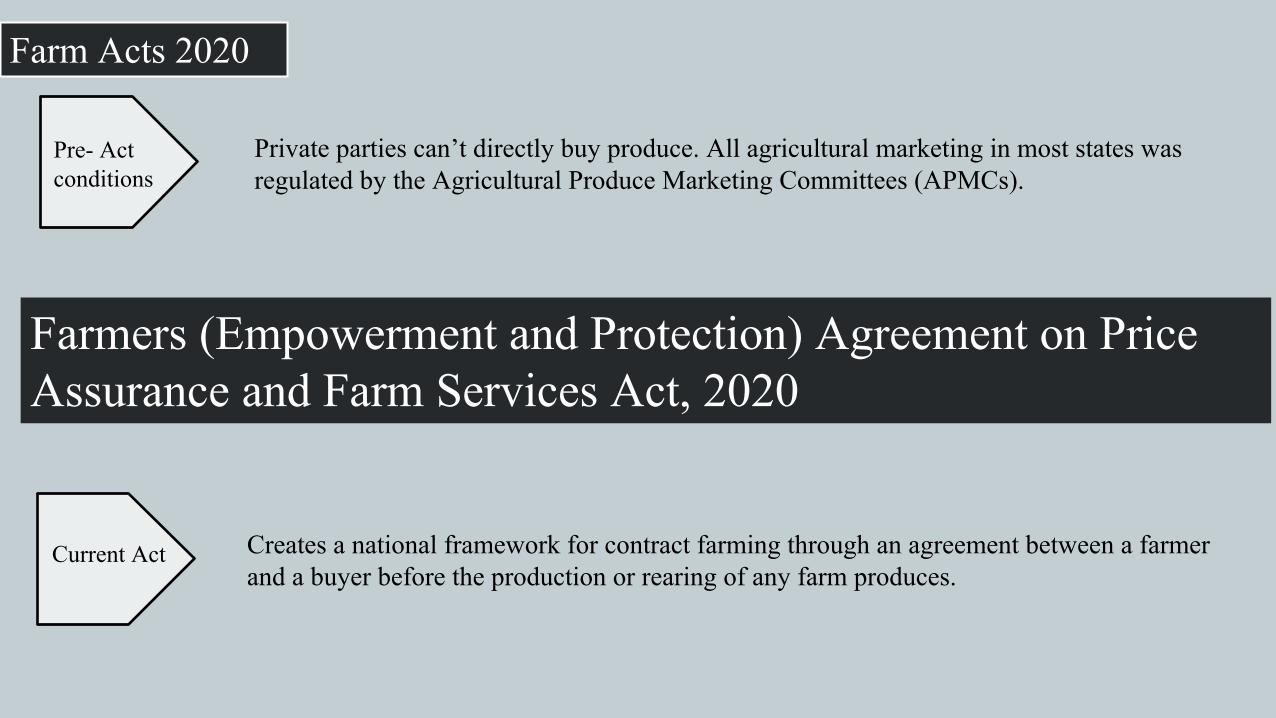
Farm Acts 2020
Current Act
Pre- Act conditions
Creates a national framework for contract farming through an agreement between a farmer and a buyer before the production or rearing of any farm produces.
Private parties can’t directly buy produce. All agricultural marketing in most states was regulated by the Agricultural Produce Marketing Committees (APMCs).
Farmers (Empowerment and Protection) Agreement on Price Assurance and Farm Services Act, 2020

Farm Acts 2020
Current Act
Pre- Act conditions
The commodities that have been deregulated are food items, including cereals, pulses, potatoes, onion, edible oilseeds, and oils.
The legislation could control the production, supply, and distribution of that commodity, and impose a stock limit listed as essential.
Essential Commodities (Amendment) Act 2020
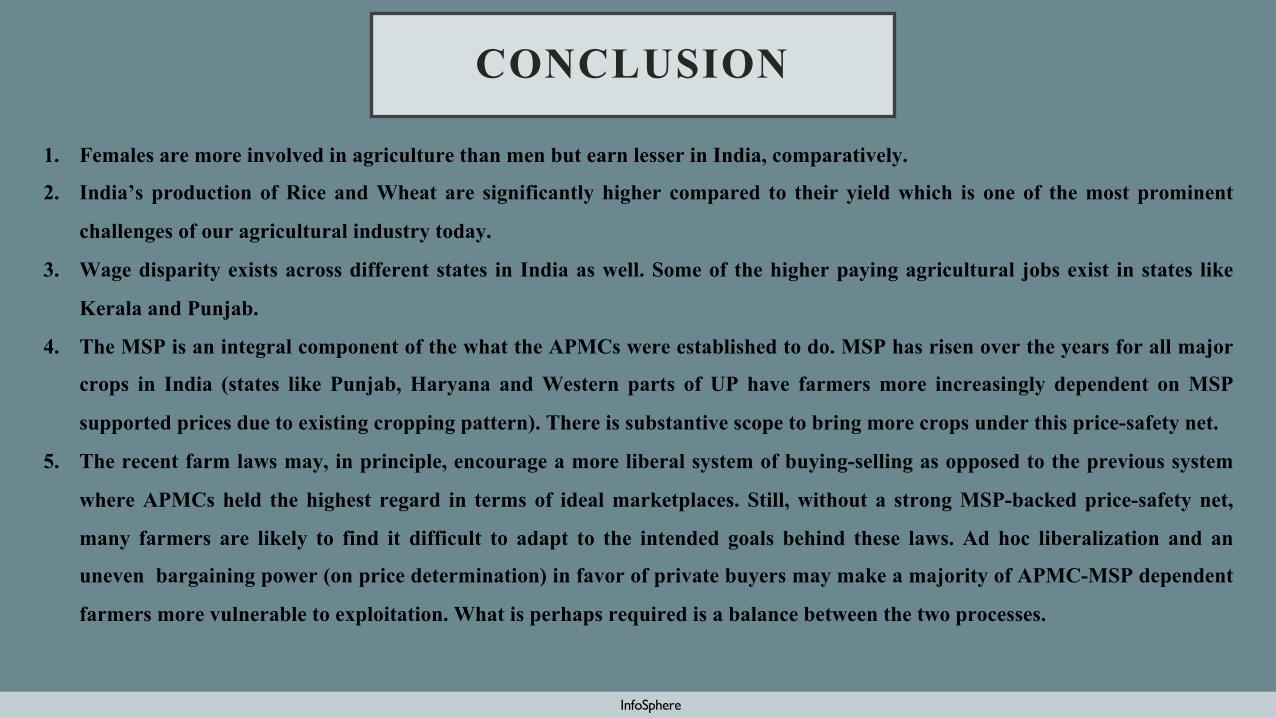
CONCLUSION
InfoSphere
1. Females are more involved in agriculture than men but earn lesser in India, comparatively.
2. India’s production of Rice and Wheat are significantly higher compared to their yield which is one of the most prominent
challenges of our agricultural industry today.
3. Wage disparity exists across different states in India as well. Some of the higher paying agricultural jobs exist in states like
Kerala and Punjab.
4. The MSP is an integral component of the what the APMCs were established to do. MSP has risen over the years for all major
crops in India (states like Punjab, Haryana and Western parts of UP have farmers more increasingly dependent on MSP
supported prices due to existing cropping pattern). There is substantive scope to bring more crops under this price-safety net.
5. The recent farm laws may, in principle, encourage a more liberal system of buying-selling as opposed to the previous system
where APMCs held the highest regard in terms of ideal marketplaces. Still, without a strong MSP-backed price-safety net,
many farmers are likely to find it difficult to adapt to the intended goals behind these laws. Ad hoc liberalization and an
uneven bargaining power (on price determination) in favor of private buyers may make a majority of APMC-MSP dependent
farmers more vulnerable to exploitation. What is perhaps required is a balance between the two processes.

For any inputs, comments or clarifications please contact The Centre for New Economics Studies at [email protected].
Thank you!
InfoSphere