the static and dynamic stability of clamped shallow circular arches thesis...
TRANSCRIPT

THE STATIC AND DYNAMIC STABILITY O F
CLAMPED SHALLOW CIRCULAR ARCHES
Thes is by
Man Cheong Cheung
In Par t i a l Fulfillment of the Requirement
For the Degree of
Doctor s f Phils sophy
California Institute of Technology
Pasadena, California
n969

ii
ACKNOWLEDGMENT
The author i s deeply indebted to Dr. C. D. Babcock, J r . for
guidance and encouragement received during the course of this investi-
gation. The valuable suggestions of Dr. E . E. Sechler a r e gratefully
acknowledged.
Appreciation i s expressed for the help received f rom Mr.
George Carlson of the Aeronautics Shop, Mr. Marvin Yessey of the
Electronics Laboratory. Very much appreciated was the help of Miss
Helen Burrus for the typing and of Mrs . Betty Wood for the graphs and
f igures.
This study was supported by the Air Force Office of Scientific.
Research, Office sf Aerospace Research, United States Air Force
under Grant No. AFOSR 68- 1424. The financial aid of a GAECIT
Fellowship is also deeply appreciated.
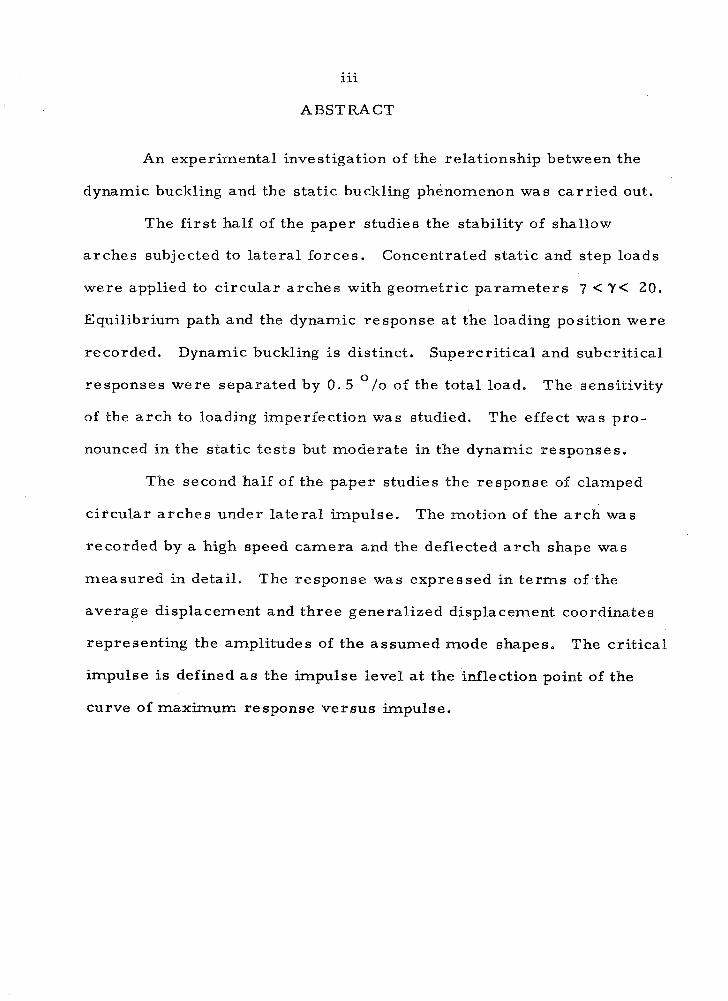
iii
ABSTRACT
An experimental investigation of the relationship between the
dynamic buckling and the static buckling e hen omen on was carr ied out.
The f i r s t half of the paper studies the stability of shallow
arches subjected to lateral forces. Concentrated static and step loads
were applied to circular arches with geometric parameters 7 < ?'< 20.
Equilibrium path and the dynamic response a t the loading position were
recorded. Dynamic buckling i s distinct. Supercritical and subcritical
responses were separated by 0 .5 O /o of the total load. The sensitivity
of the a rch to loading imperfection was studied. The effect was pro-
nounced in the static tes ts but moderate in the dynamic responses.
The second half of the paper studies the response of clamped
circular arches under lateral impulse. The motion of the a rch was
recorded by a high speed camera and the deflected a r c h shape was
measured in detail. The response was expressed in t e rms of the
average displacement and three generalized displacement coordinates
representing the amplitudes of the assumed mode shapes. The critical
impulse i s defined a s the impulse level a t the inflection point of the
curve of maximum response versus impulse.

iv
NOMENCLATURE
2 Cross sectional a r ea of the a r ch (in )
Arch width (in)
Young's Modulus (psi)
Arch thickness (in)
Central a r ch r i s e (in)
2' Specific impulse (lb- see /in )
4 Moment of inertia (in
Nondimensional impulse = 41' Jk2
h 4 ~ p
Arch length (in)
Distance between load and center of a r c h (in)
Concentrated load (1bB 7r q
Nondimensional load = PW-' A l / 2
( m
Generalized displacement coordinates
Arch radius (in)
Time (sec)
Arc11 displacement (in)
Nondimensional average displacement
weight of explosive (gm)
Arch coordinate (radians)
Arch half angle (radians)
Geometric parameter = - 4Rh
A E Percentage of eccentricity = - L 3
Mass density (slug/in )

v
NOMENCLATURE (Cont'd)
Subscripts:
CR Experimental critical value
CE Clas sicaP theoretical value
MAX Maximum value

TABLE O F CONTENTS
I. INTRODUCTION
11. STABILITY O F CLAMPED SHALLOW CIRCULAR ARCHES UNDER STATIC CONCENTRATED LOADS AND S T E P CONCENTRATED LOADS
A. Experiment
1. Tes t Specimens
2. Experimental Setup
3 . Test Procedure
B. Tes t Results
C. Conclusions
119. STABILITY O F CLAMPED SHALLOW CIRCULAR ARCHES UNDER LJNIFQRaaLY DISTRIBUTED IMPULSIVE LOAD
A. Experiment
1. Impulsive Load
2. Camera Setup
3 . Response Measurement
4. Tes t Procedure
B. Tes t Results
C. Conclusion,
REFERENCES
APPENDIX I
APPENDIX I1
TABLES
FIGURES
Page
1

LIST O F TABLES
TABLE
I Geometric Descriptions of the Tested Arches
11 Nondimensional Static Critical Load
111 Critical Step Load
IV Geometric Description of Tested Arches
V Surnnnary of Impulse Tests
Page
44
45
46
54
55
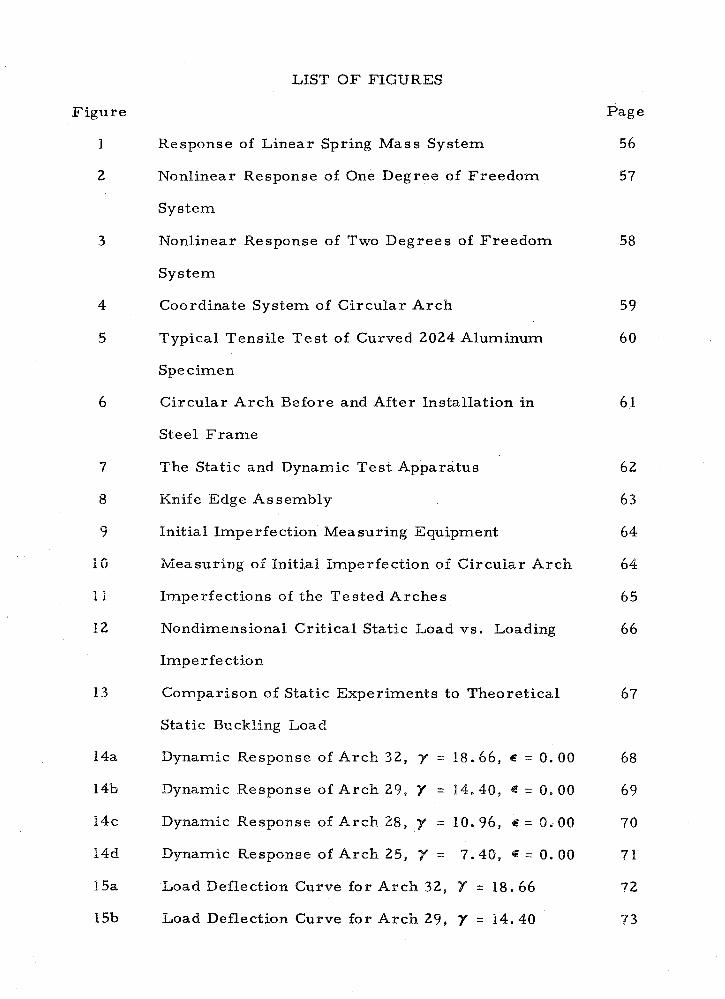
LIST O F FIGURES
F igure
I
2
Response of Linear Spring Mass System
Nonlinear Response of One Degree of Freedom
System
Nonlinear Response of Two Degrees of Freedom
System
Coordinate System of Circular Arch
Typical Tensile Tes t of Curved 2024 Aluminum
Specimen
Circular Arch Before and After Installation in
Steel F r a m e
The Static and Dynamic Tes t Apparatus
Knife Edge Assembly
Initial Imperfection Measuring Equipment
Measuring of Initial Imperfection of Circuiar Arch
Imperfections of the Tested Arches
Nondimensional Critical Static Load vs. Loading
Imperfection
Comparison of Static Experiments to Theoretical
Static Buckling Load
Dynamic Response of Arch 32, 7 = 18.66, E = 0.00
Dynamic Response of Arch 29, Y = 14.40, = 0.00
Dynamic Response of Arch 28, 7 = 10.96, g: = 0.80
Dynamic Response of Arch 25, = 7 . MCB, a = 0.00
Load Deflection Curve for Arch 32, 7 = 18.66
Load Deflection Curve for Arch 29, = 14.40
Page
56
5 7
Figure
15c
15d
16
LIST O F FIGURES' (Cont Id)
Page
Load Deflection Curve for Arch 28, = 10.96 74
Load Deflection Curve for Arch 25, = 7.40 75
Nondimensional Critical Step Load vs . Loading 76
Imperfection
Comparison of Dynamic Experiment to Theoretical 97
Step Buckling Load
Calibration of Explosive (Silver Acetylide-Silver 78
Nitrate)
Camera Setup 79
Fi lm Reader to Measure Deformed Arch Shape 79
Performance and Synchronization of the High Speed 80
Camera
Initial Imperfections of the Tested Arches 8 1
Initial Imperfections of the Tested Arches 82
Impulse vs Maximum Average Displacement for 83
Clamped Arch
Comparison of the P r e s e n t Results with Humphreys' 84
Experiments
Deformed Shapes of Arch 339 85
Deformed Shapes of Arch 338 86
Response of Arch B9, i = 8.43 87
Response of Arch B6, .: 10.45 88
Response of Arch B7, + = 12. 19 89
Response of Arch B8, ? = 14.82 90
Response of Arch C3, i = 12.60 9 1

LIST O F FIGURES (Contfd)
F igure
26f
26g
26h
26i
26j
2 6k
27a
27b
28a
28b
29
Response of Arch C2, = 15.08
Response of Arch C5, -i = 16.66
Response of A r c h C 4 , I = 16.95
Response of A r c h C8, = 20.33
Response of Arch C7, i = 21.65
Response of Arch C9, T = 27.75
Tra j ec to r i e s of Arches for Y = 10
Tra j ec to r i e s of Arches for 7 = 20
A r c h Ant i symmetr ic Response for 'j' = 10
A r c h A n t i s p m e t r i c Response for ?' = 20
Coordinate System for Finding Best Fit to the
Measured Hnitital Imperfect ions
Coordinate Sys tem fo r the Clamped Ci rcu lar
Arches
Page
92
93
94
95
96
97
98
99
100
101
102

I. INTRODUCTION
A prominent scientist, Kirchhoff, once said that "Dynamics"
i s a science of motion and forces. Thus dynamics includes statics
which deals with the state of equilibrium. This relationship stimu-
lated this research work. It i s focused on the understanding of the
dynamic buckling phenomenon of nonlinear structures a s related to
their static buckling.
The static stability of cylindrical and spherical shells was
studied intensively not long after the invention of the airplane. How-
ever , the experimental results had considerable scat ter and were only
* 30-50 "/o of the classical buckling load (Ref. P ) for some loading
** conditions. Tsien (Ref. 2) proposed an energy criterion which
seemed to be in better agreement with the experiments. However, to
achieve buckling a t the load given by the energy criterion, a perturba-
tion of unspecified magnitude i s required. ,But how and where to apply
this perturbation i s not prescribed. Therefore, this criterion i s
believed to be built on an unsound basis . In the past few years,
% The classical buckling load of a shell i s defined a s the lowest eigen- value of the linearized theory. The linearized theory i s derived by perturbing the nonlinear equations of the perfect shell about a membrane prebuckling equilibrium state. For the a r c h problems which will be considered later , the exact solution of the nonlinear equations i s the classical solution. The critical condition i s reached when either the equilibrium path yields a local maximum of the loading parameter o r the path bifurcates into additional branches.
*% The buckling load i s reached when the total energy in a possible equilibrium state is equal to the total energy in the unbuckled state.

2
experimental techniques have improved. Experimental results for
cylindrical shells under axial compression a r e closer to the classical
solution than to the energy solution (Ref. 3 ) . On the other hand, i f
initial geometric imperfections a r e included in the analysis, the
experimental buckling loads can be predicted reasonably well (Ref. 4).
The classical analysis and the energy criterion were also
applied to other nonlinear structures. Fung and Kaplan (Ref. 5) found
that the classical solution compares well with experiments on simply
supported arches. Gjelsvik and Bodner found that the experimental
resul ts for the clamped shallow a r c h subjected to a concentrated load
lie in between the two theories (Refs. 6 and 7). To confirm this point,
s imi lar tes ts were performed in this investigation.
The problem of dynamic buckling o r nonlinear response of shell
s tructures has been widely discussed in the past few years. The
question of dynamic buckling i s of concern since this phenomenon i s
associated with a large change in the structural response with a small
change in the loading conditions. This change of response character
with load i s s imilar to the stability problem of static loading and hence
the name dynamic buckling has often been adopted. However, since
the loading and response a r e functions of time, the analogy i s not quite
complete. This has led to a variety of definitions of dynamic buckling.
The definition of stability used here i s not in the conventional sense of
a bounded o r unbounded motion. It should be stated a s a finite increase
of maximum response due to a n infinitesimal increase of the loading
parameter . No matter how small this discontinuitymay be, a s long a s
3
i t exists, the load level a t which it occurs i s defined a s the dynamic
buckling load.
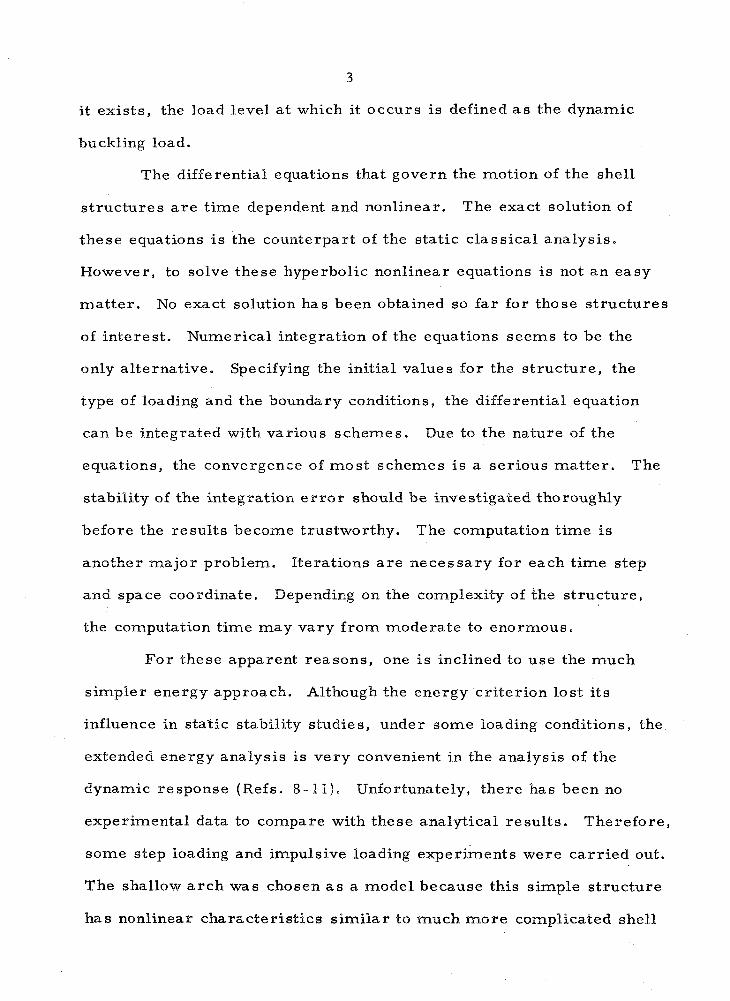
The differential equations that govern the motion of the shell
s tructures a r e time dependent and nonlinear. The exact solution of
these equations i s the counterpart of the static classical analysis.
However, to solve these hyperbolic nonlinear equations is not an easy
matter . No exact solution has been obtained so far for those structures
of interest. Numerical integration of the equations seems to be the
only alternative. Specifying the initial values for the structure, the
type of loading and the boundary conditions, the differential equation
can be integrated with various schemes. Due to the nature of the
equations, the convergence of most schemes i s a serious matter . The
stability of the integration e r r o r should be investigated thoroughly
before the results become trustworthy. The computation time i s
another major problem. Iterations a r e necessary for each time step
and space coordinate. Depending on the complexity of the structure,
the computation time may vary f rom moderate to enormous.
For these apparent reasons, one i s inclined to use the much
simpler energy approach. Although the energy criterion lost i ts
influence in static stability studies, under some loading conditions, the
extended energy analysis i s very convenient in the analysis of the
dynamic response (Refs. 8 - 11). Unfortunately, there has been no
experimental data to compare with these analytical results. Therefore,
some step loading and impulsive loading experiments were carr ied out.
The shallow a rch was chosen a s a model because this simple structure
has nonlinear characteristics similar to much more complicated shell

4
structures. A wide range of this nonlinear behavior can be exhibited
by changing the end conditions, loading, o r geometry of the arch.
The energy method i s built up by using the static equilibrium
states. Knowing the static response, one can derive some of the
interesting features of the dynamic response. Let us s tar t with the
simplest example. Figure 1 shows the response of a linear spring
m a s s system. The amount s f force applied to the m a s s i s P and q
i s the displacement of the mass . On the force-displacement diagram,
a linear static equilibrium path OA is traced. If the force is applied
a s a Heavi side step function, the response will be a simple harmonic
motion around the static equilibrium position. The dynamic response
is illustrated a t two load levels P and PE. The dotted lines along D
the time axis a r e the corresponding equilibrium positions. In this
case, the maximum dynamic response i s twice the static response.
This i s shown a s the straight line BEDB.
The relationship s f the static and dynamic response can be
clarified by the potential energy (U) s f the system. The potential
energy is a function of the external load and the displacement. It can
be decomposed into two parts. The f i rs t part i s the strain energy
stored in the spring. This strain energy is proportional to the square
of the displacement, and is always positive. The second part i s the
potential of the external load. This t e rm is' linearly proportional to
the displacement and is negative for positive displacement, For small
deformation, the second t e rm dominates and the total potential energy
decreases until a minimurn i s reached which corresponds to the stable
static equilibrium position. There a r e two energy curves shown for

PE and PD. The dynamic response i s analogous to a ball rolling
along these energy curves. If no energy is dissipated o r supplied
during the course of oscillation, the ball will r i s e to a position of the
same elevation a s the initial position and oscillates thereafter. There-
fore , positions E and D a r e the maximum dynamic responses a t the
step load level PE and PD respectively.
Next, we consider a nonlinear one degree s f freedom system.
Assume the static load deflection curve has the form OABC a s shown
on Figure 2a. 8 A and B@ represent stable branches while the AB
branch i s statically unstable under dead weight loading. Starting a t
the origin, with half the initial slope, the maximum dynamic response
i s shown by the dotted line. Influenced by the softening nonlinearity,
the curve extends with ever - les sening slope. The inter section of this
curve with the branch AB i s significant, because this determines the
unique position a t which the a rch snaps under step load. This state-
ment will be proved by using the potential energy curves (Figure 2b).
Point D i s a local maximum in the energy curve because it is
on the AB branch. This local maximum has zero potential energy
since point D is on the maximum dynamic response curve. Hence,
i f a ball rolls along the energy curve corresponding to P = PD, it
takes an infinite amount of time to a r r ive a t the static equilibrium
position D, Should the load be increased infinitesimally, the energy
of the local maximum will drop below zero and the ball will cover an
additional terr i tory. PD i s therefore defined a s the critical load.
The response histories at a. super critical and subcritical load
level a r e illustrated a t the left par t of Figure 2a where time is plotted

6
a s the third axis perpendicular to the P-ql plane. The supercritical
response has a bell shape curve since the kinetic energy i s low when
the response crosses the local maximum of the energy curve. Thus
the system moves slower through such a range.
When a two degrees-of-freedom system i s considered, the
potential energy can no longer be expressed a s a single curve, but a s
a continuous surface. On a surface, one can. move f rom one point to
another along an infinite number of paths. Therefore, the energy
method fails to yield a unique critical condition. The alternative is to
obtain necessary o r sufficient conditions for the lower and upper
bounds respectively. This i s illustrated by Figure 3 . A typical
three-dimensional static equilibrium path i s shown on the left part of
Figure 3a. The elliptic path between A and B represents the
bifurcated branch which is on a plane perpendicular to the POql plane.
The maximum dynamic response i s shown a s OED. Three energy
surfaces for load levels between P and PB a r e shown in Figure A
3b, c, d. These surfaces have five equilibrium positions: the center
one i s unstable (hill), the left and right ones a r e stable (depression),
and the upper and lower ones a r e unstable (saddle). It i s again eas ier
to visualize the dynamic response by using the analogy of the motion
of a ball on the energy surface. Figure 3b shows the energy surface
a t P = PD. The local maximum D has zero energy. If the response
is restricted to the q l component, the ball will take an infinite amount
of time to a r r ive a t E). Should the load be increased infinitesimally,
the local maximum has negative potential energy and a l l interior
points bounded by U = 0 have U < 0. With a little higher energy, the
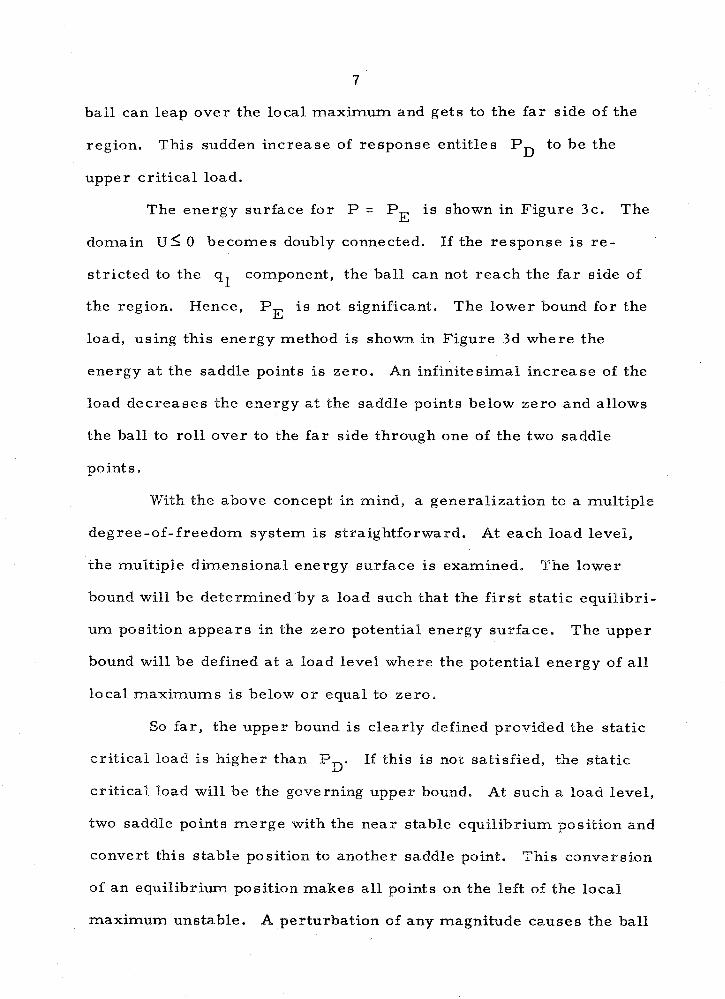
7
ball can leap over the local maximum and gets to the far side of the
region. This sudden increase of response entitles PD to be the
upper critical load.
The energy surface for P = PE i s shown in Figure 3c. The
domain US 0 becomes doubly connected. If the response i s re -
stricted to the q l component, the ball can not reach the far side of
the region. Hence, PE i s not significant. The lower bound for the
load, using this energy method i s shown in Figure 3d where the
energy a t the saddle points i s zero. An infinitesimal increase of the
load decreases the energy a t the saddle points below zero and allows
the ball to roll over to the fa r side through one of the two saddle
points.
the above concept in mind, a generalization to a multiple
degree-of-freedom system is straightforward. At each load level,
the muitiple dimensional energy surface i s examined. The Power
bound will be determined by a load such that the f i r s t static equilibri-
um position appears in the zero potential energy surface. The upper
bound will be defined a t a load level where the potential energy of al l
local maximums is below o r equal to zero,
So far , the upper bound i s clearly defined provided the static
critical load i s higher than PD. If this i s not satisfied, the static
critical load will be the governing upper bound. At such a load level,
two saddle points merge with the near stable equilibrium position and
convert this stable position to another saddle point. This conversion
s f an equilibrium position makes a l l points on the left of the Escal
maximum unstable. A perturbation of any magnitude causes the ball

8
to diverge from the q l axis, to by-pass the hill and finally to ar r ive
a t the far stable region. This bound i s named by Simitses a s the
"Minimum Guaranteed Critical Load".
Furthermore, necessary o r sufficient conditions discussed
ear l i e r a r e for elastic structures without damping. Should damping
be present, the picture would be a little different. The estimation of
the necessary condition is not affected because energy i s needed to
account for dissipation. If the undamped system can not escape from
the near stable region, it i s reasonable to think that the damped system
also will not escape. However, the sufficient condition must be re-
considered. The upper bound for the undamped system would be an
under-estimated upper bound for the damped system. As a matter of
fact, the energy dissipated i s a function of the dynamic path and thus
depends on the initial conditions. An upper bound similar to the
undamped case seems to be meaningless unless one can find a descend-
ing path on the energy surface that connects the original position to
the far stable region. This i s exactly the case for the static critical
load a s discussed in the previous paragraph. Therefore, the static
critical load is the upper bound for the damped system.
The experiments were carr ied out with many objectives. The
static tests were to confirm Gjelsvik and Bodner's experiments and to
compare with the analyses. The step loading tes ts supplied data for
comparison with the results obtained by the numerical integration of
the nonlinear differential equation (Ref. 12) and the results from the
energy analysis (Ref. 93. The sensitivity of the a rch to loading
imperfections was studied. Finally, a valuable by-product of the

9
experiment showed the non-existence of other stable equilibrium
positions upon total removal of external load. The non-existence of
these positions does not allow an impulsively loaded clamped a r ch to
be classified a s a stability problem in the str ict mathematical sense.
The experiments were divided into three sets. The f i rs t se t
was concerned with the static buckling of clamped circular arches
subjected to concentrated loads. The second set extended the f i rs t
se t to include a step function load. The last set considered a uniform-
ly distributed impulsive load. Although the f i rs t two se ts a r e different
in nature, they used similar equipment and were performed with
identical specimens. They will be presented together in P a r t 11. The
impulsive load experiments are presented in P a r t 111.

10
11. STABILITY OF CLAMPED SHALLOW CIRCULAR ARCHES
UNDER STATIC CONCENTRATED LOADS
AND STEP CONCENTMTED LOADS
Four arches with geometric parameters 7' = - 4Rh
of approxi-
mately 7, 11, 14 and 18 were used in the tes ts . The load was applied
a t various locations on the a rch . Although the ent ire deformed a r c h
shape was not measured, the displacement a t the loading point was
recorded. The combination of the static response and the maximum
dynamic response gives a c lea re r picture of the buckling phenomenon.
A. Experiment
The experimental set up used fo r static loading is s imi lar to
the one used by Cjelsvik and Bodner (Ref. 4). The step load was
developed by suddenly releasing a dead weight which initially touched
the a r ch surface. However, the inertia of the ciead weight changed the
effective force on the a r ch and in turn affected the frequency and
magnitude of the response. In fact, it was detected that the load
detached f rom the a r c h during the f i r s t few cycles. The effect of
inertia was reduced by placing a very soft spring between the a r ch and
the weight. The softer the spring, the longer the initial s t retch which
may be much l a rger than the response of the arch . With this ar range-
ment, it was found that the variation in load was l e s s than 10 O/o of the
total dead weight. The large variation occurred af ter the a r c h buckled,
thus i ts affect was small on the determination of the cr i t ical load.
11
1. Tes t Specimens
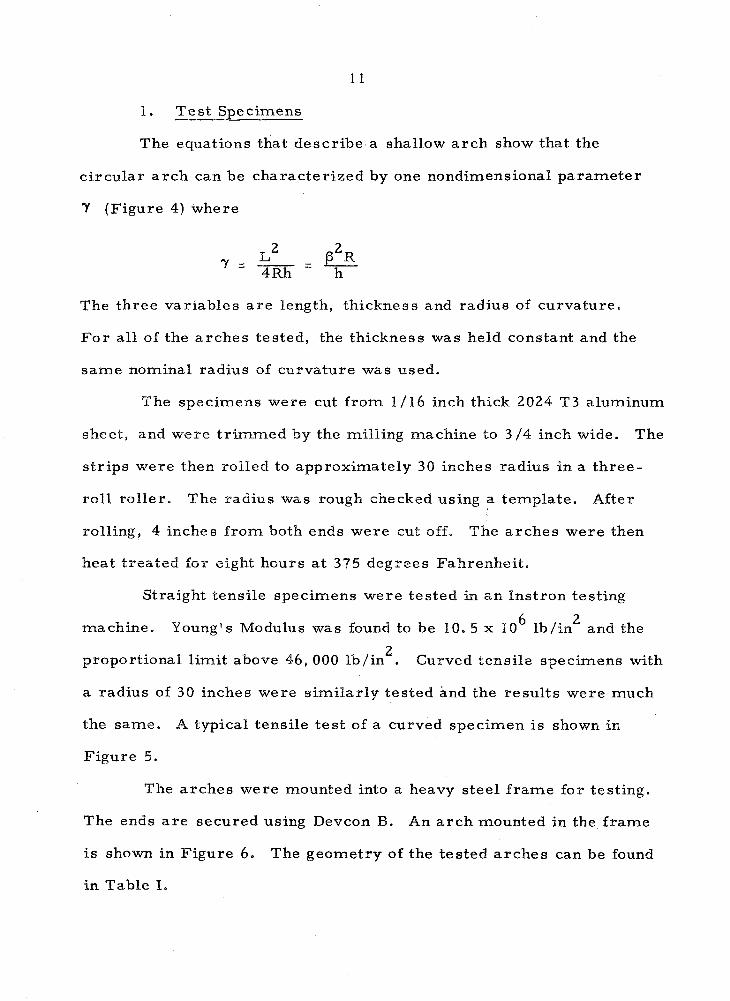
The equations that describe.a shallow a r ch show that the
circular a r ch can be characterized by one nondimensional parameter
Y (Figure 4) where
The three variables a r e length, thickness and radius of curvature.
Fo r a l l of the arches tested, the thickness was held constant and the
same nominal radius of curvature was used.
The specimens were cut from 1/16 inch thick 2024 T3 aluminum
sheet, and were tr immed by the milling machine to 3 /4 inch wide. The
str ips were then rolled to approximately 30 inches radius in a three-
rol l roller. The radius was rough checked using a template. After
rolling, 4 inches from both ends were cut off. The arches were then
heat treated for eight hours a t 375 degrees Fahrenheit.
Straight tensile specimens were tested in an Instron testing
6 2 machine. Young s Modulus was found to be 10.5 x 18 lb /in and the
2 proportional l imit above 44,008 lb/in . Curved tensile specimens with
a radius of 38 inches were similarly tested and the results were much
the same. A typical tensile tes t of a curved specimen i s shown in
Figure 5,
The arches were mounted into a heavy steel f rame for testing.
The ends a r e secured using Devcon B. An a r c h mounted in the f rame
i s shown in Figure 6. The geometry of the tested arches can be found
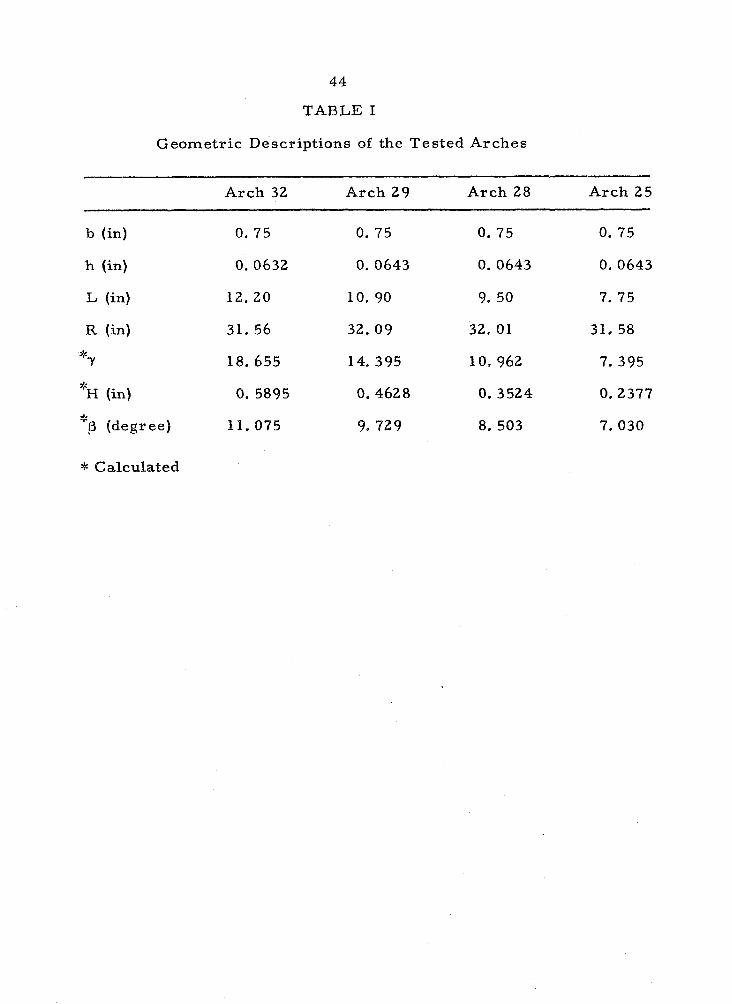
in Table I.
2. Experimental Setup
Except for the recording system, both the static and dynamic
t e s t s used the same equipment a s explained below. A schematic
drawing of the setup i s shown in Figure 7. A description of each i tem
marked by a le t ter i s a s follows.
a . Aluminum Arch
The center line and eccentricity lines were marked on
the convex side of the a r ch surface.
b. Steel Support for the Arch
This support could be moved to the left o r right in
o rder to position the point of loading directly under the
knife edge.
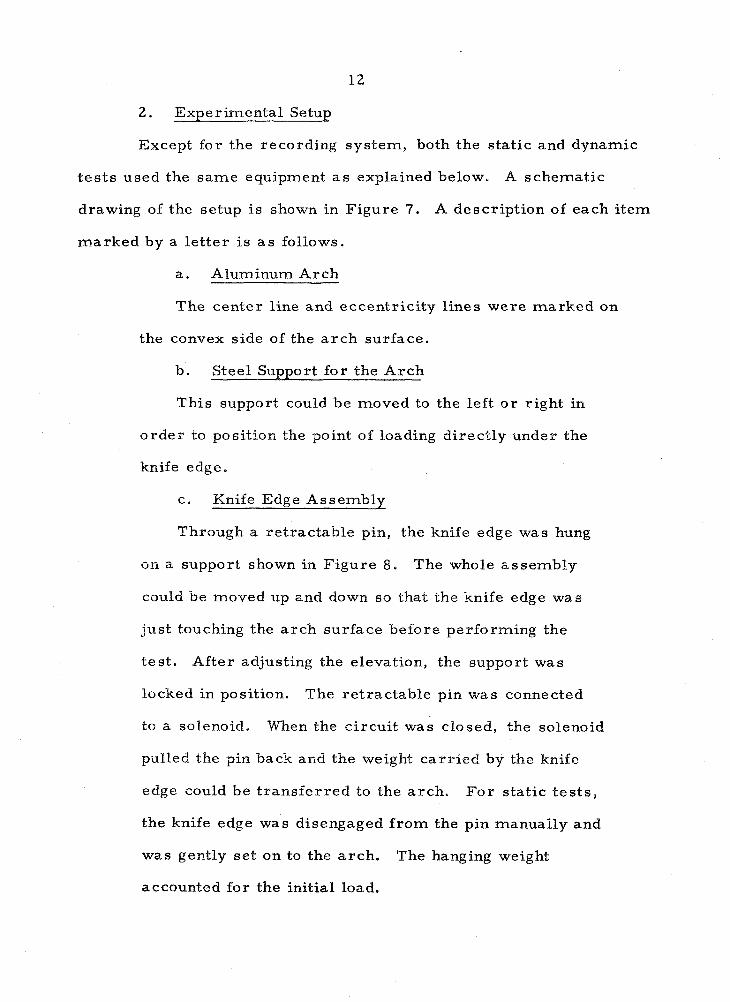
c. Knife Edge Assembly
Through a retractable pin, the knife edge was hung
on a support shown in Figure 8. The whole assembly
could be moved up and down so that the knife edge was
just touching the a rch surface before performing the
test . After adjusting the elevation, the support was
Pocked in position. The retractable pin was connected
to a solenoid. When the circuit was closed, the solenoid
pulled the pin back and the weight car r ied by the knife
edge could be t ransfer red to the arch. Fo r static t e s t s ,
the knife edge was disengaged f rom the pin manually and
was gently set on to the arch . The hanging weight
accounted for the initial load.

13
d. Displacement Transducer
The housing of the t ransducer was fixed to the
stationary part , while the sliding core was connected
to the top of the knife edge ( see Figure 8). As the
knife edge moved with the a rch , the "Lansducer
measured the vertical displacement a t the loading
point . The calibration of this transducer was linear with
a working range of 3". By adjusting the control, the
output was 100 MV per inch of the displacement.
e. Tension Spring
The spring i s connected to the bottom par t of the
knife edge. In static tes ts , i t serves a s a safety device
to avoid breakage of the fragile load cell due to ex-
cessive displacement f rom below. Ht was changed to a
very soft spring f o r dynamic t e s t s for reasons
mentioned previously.
f . Load Cell
The load cell was a 0. 01Ofs thick Mylar tensile
specimen. The s t r ip was 1.25" wide and 6. 5" long.
Two S R - 4 paper s train gages were placed in se r i es on
each side of the Mylar s t r ip a s active gages. The same
number of dummy gages were placed on the same s t r ip
and were perpendicular to the active ones. The gages
were supplied by a 12V D. C . power supply. The
working range corresponded to about one quarter of the

ultimate s t r e s s of Mylar. The calibration was l inear
and gave 0.493 MV output pe r pound weight. On top
of the initial load, this gave the total applied load for
the static tes ts . In the dynamic tes ts , the load cell
measured the variation of the effective load a s a
function of time.
g. Dead Weight
This was the main difference in the arrangement
between the dynamic and static tes ts . Fo r the fo rmer
one, a pot of weight was hung to the Boad cell and the
weight was the last in the se r i es , In static tes ts , the
weight rested on a hydraulic jack and was fastened to
the Boad cell by a nylon cord.
h. Hydraulic Jack
The hydraulic jack was used for the static tests .
It worked a s a moving platform for the weights. At
the beginning of the tes t , the piston was brought to
the upper most position. When the valve was opened
the piston sank slowly. In the process of loading, the
load regulated automatically with the displacement.
Thus this arrangement established itself a s a "near
rigid m a ~ h i n e ' ~ and was able to map the unstable
branch of the equilibrium path.
The recording system used in the static tes ts was a n X - Y
plotter. Without using an amplifier, the output f rom the displacement
t ransducer was connected to the X axis , while the output f rom the

15
load cell went to Y axis. The result was a single load deflection
curve representing the equilibriwn path.
A Honeywell Visicorder (Model 1508) was used to record the
dynamic response and the variation of the effective load. The outputs
were amplified three and one hundred times respectively for the
displacement transducer and the load cell. Inside the Visicorder,
Honeywell galvanometers were used in recording oscillographs to
t ransfer voltage variations to a photographic record. The oscillo-
graphs were recorded on Kodak extra thin Linagraph Direct Print
paper (Type 1799).
3 . Test Procedure
There were three main steps in the complete testing of an
arch. Namely, they were an initial imperfection measurement, a
quasi- static tes t and a dynamic test. Arches were reusable. They
0 ware reloaded at different locations, including from O O /o up to 6 / o
offset from the center, This gave the reduction of critical load due
to an eccentric load. In between tests , imperfections of the a rch
shape were measured in order to assure that the a r ch was not
subjected to excessive plastic deformation.
To obtain results with high accuracy, the dynamic tes ts were
to be performed following the static test a t the same loading location.
However, repeated tests showed that the response characteristics
were reproducable and were little influenced by the order of testing.
In fact, after approximately one hundred tests on the same arch, the
critical load remained within 2 O/o. Therefore, to simplify the

16
the testing procedures, static tes ts were carried out for a l l loading
positions and were followed by the dynamic tests.
In static tes ts , the critical load was defined a s the local maxi-
mum of the loading parameter on the equilibrium path. However, in
the dynamic tests , the critical load could not be determined by only
one test. Different load levels were applied to the arch. Slightly
increased amplitude of vibration resulted from a small increase in
load. At a critical load, the maximum amplitude increased abruptly.
a . Initial Imperfection Measurement
A pendulum like apparatus was built to measure
bpe r f ec t i ons of the arch. It consisted of a fixed center
and rotatable a r m which could be adjusted in length. A
dial gauge with a working range of 8.868 inches was
installed a t the tip of the a r m (see Figures 9 and 10)-
The measurement was made by f i rs t adjusting the
a r m to the appropriate radius then pressing the concave
side of the a rch gently against the dial gauge. Starting
from one end of the a rch the dial gauge readings were
taken a t half inch intervals along the a r ch until the dial
gauge could not advance another full step. This gave
the deviation of the a rch shape from the preset radius.
Applying the "Least Square Method" to the measured
data the "best fit radius" and the "best fit imperfection1'
can be found. The derivation of the equations to
accomplish this can be found in Appendix I,

17
Before the arches were mounted on the supports
the imperfections were measured. Only those arches
with imperfection amplitudes l e s s than five thousandth
of an inch were used. Also, they were cut from longer
ones so that the selected sections had a minimum
amount of asymmetric imperfection. When the a r ch
was mounted and the Devcon was hardened, the a r c h
shape was measured again to make sure that it had not
been excessively deformed due to the process of
mounting. The imperfections of the tested arches a r e
shown in Figure 11.
b. Static Test
The a r ch was put into the knife edge assembly such
that the loading position was directly under the edge.
The assembly was lowered so that the edge just touched
the a r ch surface. At this point, the output from the
displacement transducer represented zero displacement
of the arch. When this was recorded on the X - Y
plotter, the knife edge was disengaged manually f rom
the assembly. The a rch deformed a little due to the
weight of the knife edge and the spring system. This
was compensated in the plotter a s initial load.
External load was applied to the a rch gradually a s
the piston in the hydraulic jack sank slowly. After the
a r ch buckled, the load was released by raising the
piston back to the upper position.

18
c. Dynamic Test
The procedures before the disengagement of the
knife edge were the same a s in static tests . A motor
in the Visicorder was turned on and accelerated the
Linagraph paper to a constant speed of 80" per second.
0 . 2 second la ter , the knife edge was released by the
withdrawal of the retractable gin. The response of
the a r ch and the external load were transformed into
an optical signal and recorded on photo sensitive paper.
The Linagraph paper was latensified by exposing to
fluorescent light. The record t races became visible
and readable in a few seconds.
When the motion of the a rch subsided, the load was
released and the experiment was repreated with a
different amount of load. The critical Eoad was deter-
mined to within 0.05 lb. o r less.
B. Test Results
Four arches were used in the tes t program. The geometric
parameters were roughly 7, 11, 14 and 18. The arches were used
repeatedly until a l l information was acquired, Between tes ts ,
imperfection measurements showed a slight plastic deformation around
the point of loading. In spite of this, repeated tes ts showed almost
identical response characteristics.
The critical static load i s shown a s a nondirrnensional Eoad in
Table PI. It appears that higher arches have higher critical loads

19
because the nondimensional load i s the product of the applied load and
the geometric parameter . In fact, the flatter arches have a higher
buckling load. Figure 12 shows the effect of asymmetric loading. In
0 general, a 10 /o reduction of critical load was detected when the
load was applied offset from the center a n amount equal to 6 O/o of the
a r ch length. This effect was especially sensitive in the neighborhood
of the center because the curve forms a cusp a t c = 0, Similar
behavior was obtained theoretically and experimentally by Thompson
for simpler structures (Ref. 13).
Figure 13 i s a comparison of the experiments with the existing
analysis. The critical loads a r e normalized by Schreyer a d d a s u r ' s
classical solution (Ref. 7 ) and this ratio i s called the critical load
ratio. The upper curve is the classicali solution for a sinusoidal a r c h
(Ref. 9). The lowest curve i s the static energy solution for clamped
circular arches (Ref. 6 ) . Experiments performed by Gjelsvik and
Bodner have considerable scattering and the results a r e much lower
than the present ones,
It was observed on the load deflection diagram that the
equilibrium paths crossed the abscissa (disilacement axis) a t no
point other than the origin. Therefore, only the original configuration
i s a possible equilibrium position a t the zero load condition.
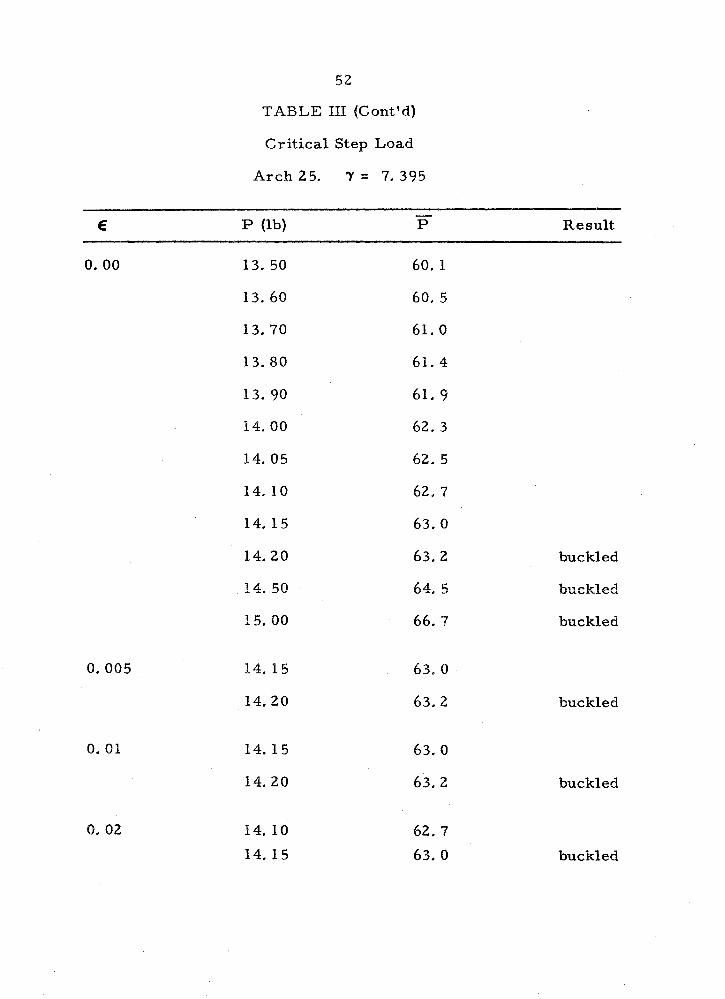
Step loading tes ts a r e summarized in Table 111. Figures l4a-
114d a r e typical deflection-time t races a t the loading point when a step
load was applied. The numbers attached to the curves a r e the load
expressed in pounds. The closest pair which change in nature defines
the critical load. At the critical range, a one-half per cent change of

20
load will result in a factor of three change in response. The dotted
straight lines represent the static equilibrium positions a t the corres-
ponding load levels. The subcritical responses were damped to the
near equilibrium positions while the super critical responses vibrated
around the fa r equilibrium positions. If damping were not present,
the supercritical response would have completed the bell shape
curves. The superposition of the static response and the maximurn
dynamic response is shown in Figures 15a-15d, One observes that
subcritical maximum dynamic response i s always less than the second
branch of the static equilibrium path. This agrees with the statement
in the introduction that the energy level a t such a branch is higher.
The effect of loading imperfections i s shown in Figure 16. In
contrast to static tes ts , the influence of the loading location i s much
l e s s and the reduction of the critical Poad appears to have a smooth
transition near the center.
Finally, the dynamic critical loads were normaiized by
Schreyer and Masurss static classical solution. The results a r e
plotted in Figure 17. In addition, the upper bound and lower bound of
the dynamic critical Poad for a sinusoidal a r ch (Ref. 9 ) and the
numerical solution for the circular a rch (Ref. 12) a r e superimposed
on the same diagram. The present experiments agree very well with
Vahidi's numerical results.
C. Conclusions
The present static experiments show higher critical loads than
those obtained previously in reference 6. Among other things, the

2 1
difference between the two experiments i s partly due to the different
way of estimating the radius of curvature. The nondimensional load
i s proportional to the square of the radius. A 5 "/o e r r o r in calculat-
0 ing the radius, therefore causes a 18 /o e r r o r in the load. The
geometric parameter Y i s also proportional to the radius. Therefore,
an accurate determination of the radius i s important in reducing the
data for comparison with the analysis. Previously, the radius was
calculated by measuring the relative positions of three points on the
arch. In present tes ts , the arch was measured a t many stations. The
calculated radius i s a best fit to a l l measured points. In addition, the
knowledge of the initial geometric imperfection provided a better
choice of specimens and avoided unnecessary complications.
Overall, the static tes ts agree reasonably well with Schreyer
and Masurs s exact solution. The results a r e sensitive to the position
of loading. The critical load i s reduced sharply when the load i s
slightly off center. On the other hand, the dynamic response i s quite
insensitive in this respect.
For al l step loading tests , the critical dynamic load was
determined to within 0.05 pound. This amount of load corresponds to
one-half per cent change in the total load which causes an increase of
the maximum displacement by a factor of three.
The step loading tests and the analyses a r e summarized in Fig.
17. The upper bound obtained by Hsu o r Simitses i s for sinusoidal
arches. They defined the static critical load a s the upper bound. For
the circular arches, the dotted lines a r e the bounds which a r e defined
in the introduction. To obtain the bounds, the static equilibrium

22
positions for each load level must be found. This i s carr ied out in
Appendix 11. These positions correspond to the local minimums,
saddle points o r the local maximums on the energy surfaces.
In the case of clamped circular arches, asymmetric equilibri-
um positions a r e possible for 7 2 11.8. Hence, for 7 < 11.0 ,
asymmetric saddle points do not exist. Consequently, the upper and
lower bounds merge together. As pointed out in the introduction, this
bound i s more appropriately called a lower bound if damping i s
considered. The static critical load will be the corresponding upper
critical load.
The reason why the lower bound i s above the critical load
obtained by Vahidi, who used numerical integration is not clear. How-
ever, the difference between the results from the two analyses is very
small. In addition, the experimental results were expected to lie
above the lower bound. i f damping affected the experiments, the
results should compare with the theory more favorably. However, the
experimental results a r e a little below the lower bound. Static experi-
ments show similar reduced critical load from the exact solution.
This may be due to the effect of the initial geometric imperfections.
The analytical results for clamped arches have shown that the
difference between an energy determination of the critical load under
step loading and the results obtained by a direct integration of the
differential equations is very small. The experiments show good
agreement with both analytical results. Therefore, the success of the
energy method has been demonstrated for this structure. It seems

23
significant to extend this type of work to more complicated structures
where a direct solution of the differential equations i s impractical.
Finally, it was found that the original res t configuration of
the a rch was the only equilibrium position a t the zero load condition.
This i s in agreement with Vahidi's calculation (Ref. 14). Since the
existence of other equilibrium positions i s a requirement in an energy
approach to determine the critical load level, the impulsive loaded
clamped circular a r ch can not be rigorously classified a s a buckling
problem.

24
111. STABILITY OF CLAMPED SHALLOW CIRCULAR ARCHES
UNDER UNIFORMLY DISTRIBUTED IMPULSIVE LOAD
For the impulsive loading experiments 11 arches were used.
They were divided into two groups. One group had a geometric para-
mete r close to 10, the other group close to 20. Silver acetylidebsilver
nitrate was sprayed directly on the arch. This light sensitive explo-
sive was detonated by a Xenon flash tube. The response of the a rch
was recorded by a high speed camera. The displacement was
measured carefully and the data analyzed on a digital computer. The
explosive load was a very short duration pressure loading, If the
duration i s much shorter than the fundamental natural period, the
loading can be treated a s giving the a rch an initial velocity. For al l
positive time, the a rch i s f ree from lateral load and i s in f ree vibra-
tion. Obviously, this i s a particular case of Pa r t 11, where the energy
surface a t zero load condition should be investigated. Although there
exists only one equilibrium position, it i s suspected that there may be
a significant change of maximum response in a relatively narrow
range of impulse parameter. If this i s the case, the determination of
the inflection point 6n the maximum response curve i s therefore
significant.
A, Expe riment
These experiments consisted of loading a clamped circular
a r ch with a very short duration uniform pressure load. The arches
were fabricated, chosen and mounted the same way a s in P a r t 11. The
resulting motion of the a r ch was recorded using high speed photography.

25
A detailed description of the experimental work i s presented in the
following sections. The resul ts a r e compared with Humphreys
experiments and analysis (Refs. 15 and 16).
1 . Impul s ive Load
Silver Acetylide-Silver Nitrate was used to apply a very short
duration p ressure loading on the arch . The advantage of this chemical
is the low level of impulse, which i s approximately one-tenth of other
commercially available explosives, and i t s ability to be detonated with
a n intense light. The general propert ies a r e discussed in references
17 and 18. Here a brief description of the preparation and calibration
of this explosive will be given.
To begin with, each 10 g rams of silver nitrate salt a r e
dissolved into 40 cc. of distilled water. Then 6 cc. of concentrated
ni tr ic acid ( s . g. 1.4) i s slowly added. The solution i s gently s t i r r ed
until a l l crystals a r e dissolved and then acetylene gas i s bubbled
through the solution. Fine grained white precipitate i s obtained by
Petting the gas come through very slowly. This i s more desirable for
spraying, After the white powder ceases to precipitate, it i s washed
with acetone. With acetone a s a thinner the precipitate i s sprayed on
the a r ch surface. It i s then dried in an oven a t about 100 degrees
Fahrenheit. Aging for more than one day i s not recommended.
The weight of explosive needed for each a r ch must be accurate-
ly calculated before spraying. The amount that i s going to be applied
to the a r c h must be sprayed very carefully so that i t differs not more
than several hundredths of a g ram to that estimated. Over spraying
26
cannot be remedied and the whole process has to be repeated f rom the
very beginning.
This explosive can be detonated by an electr ic spark o r an
intense light. It has been shown that a fairly large a r ea can be
detonated within a few microseconds i f expendable Xenon flash tubes
a r e used (Ref. 18). It was found that if one nonexpendable Xenon
flash tube was used, complete detonation over the longest a r ch could
be accomplished in l ess than 150 microseconds. This duration of
loading on the whole a r ch i s short enough that it can be considered
impulsive (Ref. 1 5).
A GE-522 Xenon flash tube, mounted in a parabolic reflector,
was used a s the detonator. The tube was driven by a 250 microfarad
capacitor charged to 5, 000 volts. The r i se time of the tube was about
20 microseconds and the duration of the light pulse was of the order of
300 microseconds.
The calibration of the impulse generated by this explosive was
carr ied out on a ballistic pendulum. The explosive was deposited
evenly on a 2 inch square steel plate and attached to the end of the
pivoted a r m of the pendulum. The calibration curve of impulse vs.
weight i s shown in Fig. 18. The offset f r om the origin i s due to the
friction a t the pivot point. Fromthese data an impulse level of
lb-sec/ in 2 2
0.152 (6.75 x 10 dyne-sec/cm ) was calculated. This gm /in2
2 gm/cm
i s about 3.6 per cent lower than previously found in Ref. 17.

27
2. Camera Setup
A 16 mm, high speed motion picture camera (HyCam, Red
Lake Laboratories) was used to record the response of the arch. The
axis of the camera was aligned perpendicular to the base line of the
arch . To eliminate a s much distortion as possible, the camera was
placed a t least 7 feet away. Two different lenses were used to cover
the size of field necessary for the different length a rches tested.
These lenses were a f /1 .9 Cosmicar Television Lens with a focal
length of 75 m m and a f/1.8 Super Talcumar f rom Asahi Optical
Company with a focal length of 55 mrn.
The light was provided by four 1 , 000 watt quartz-iodine flood
lamps. They were placed on the side of the a r ch opposite the camera
and aimed directly a t the camera. In o rder to collect more light a t
the camera, a large plastic Fresnel lens of focal length of 30 inches
was placed between the a rch and the lamps, A sheet of clear Mylar
was placed on the flat side of the Fresne l lens to help diffuse the
intense and unevenly concentrated light. A spot light mete r a t the
camera position was used to check the evenness of the lighting of the
Fresnel lens. The camera setup i s shown in Figure 19.
A 400 foot rol l of Kodak Tri-X negative (ASA rating of 400) of
standard thickness (0.006 inches) was used for each tes t shot. How-
ever , the desired framing rate s f 10, 000 pictures pe r second was
only obtained on the las t 100 feet of film. The exact framing ra te was
determined by a timing light which exposed a small dot of light on the
edge of the film every 1 /I000 of a second.

2 8
3 . Response Measurement
A detailed deflection history of the a rch motion was obtained
by reading the film frame by frame. The film was projected using a
500 watt slide projector on a m i r r o r a t a distance of about 15 feet.
The image was reflected to a screen ruled with 21 equally spaced
lines (Fig. 20). The distance to the m i r r o r was adjusted until the
a r ch image from support to support fix exactly on the twenty equal
division on the screen. The lines then serve a s the X coordinate
for the arch. The Y distance was measured using a stretched wire
perpendicular to the X lines. This wire was attached to a moving
slide whose position was measured by a linear potentiometer. The
wire was carefully moved to each intersection of the a rch image and
the lines ruled on the screen. The potentiometer reading was
automatically recorded on punched cards for digital computer
reduction. Approximately 50 frames were read for each tes t covering
about 10 milliseconds of motion.
4. Test Procedure
When a particular value of 7 was selected the arch was cut to
the appropriate length and a 3 / 16 inch hole was drilled in each end.
This hole provided a more secure support of the a r ch in the frame.
The surface of the a rch was then cleaned and the weight determined
to the nearest 1 /2000 of a gram. An estimation of the weight of the
explosive was made and then it was sprayed on the convex side of the
arch. The explosive was cured for one hour a t 100 degrees
Fahrenheit. The a rch and the explosive a r e then weighed and the
amount of deposited explosive determined. If the correct amount i s
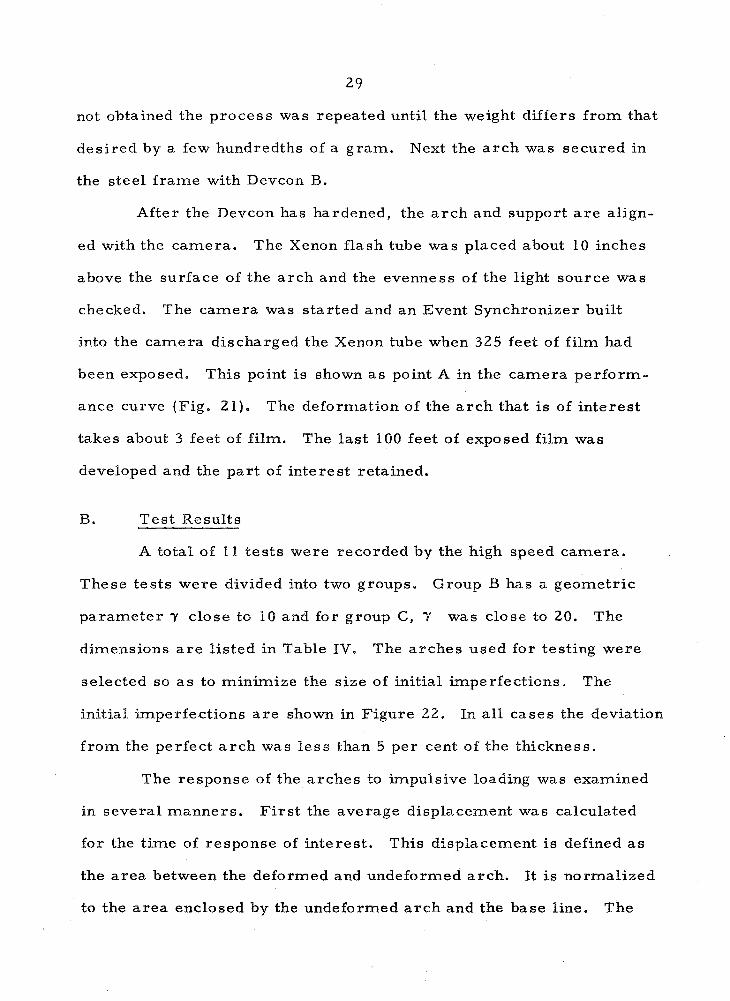
29
not obtained the process was repeated until the weight differs from that
desired by a few hundredths of a gram. Next the a r ch was secured in
the steel frame with Devcon B.
After the Devcon has hardened, the a r ch and support a r e align-
ed with the camera. The Xenon flash tube was placed about 10 inches
above the surface of the arch and the evenness of the light source was
checked. The camera was started and an Event Synchronizer built
into the camera discharged the Xenon tube when 325 feet of film had
been exposed. This point i s shown a s point A in the camera perform-
ance curve (Fig. 2 1). The deformation of the a r ch that i s of interest
takes about 3 feet of film. The last 100 feet of exposed film was
developed and the part of interest retained.
B. Test Results
A total of 11 tes ts were recorded by the high speed camera.
These tests were divided into two groups. Group B has a geometric
parameter "/ close to 10 and for group C, "/ was close to 20. The
dimensions a r e listed in Table IV. The arches used for testing were
selected so a s to minimize the size of initial imperfections. The
initial imperfections a r e shown in Figure 22. In a l l cases the deviation
f rom the perfect a r c h was less than 5 per cent of the thickness.
The response of the arches to impulsive loading was examined
in several manners. Fir st the average displacement was calculated
for the time of response of interest. This displacement i s defined a s
the area between the deformed and undeformed arch. It i s normalized
to the a rea enclosed by the undeformed a r ch and the base line. The

30
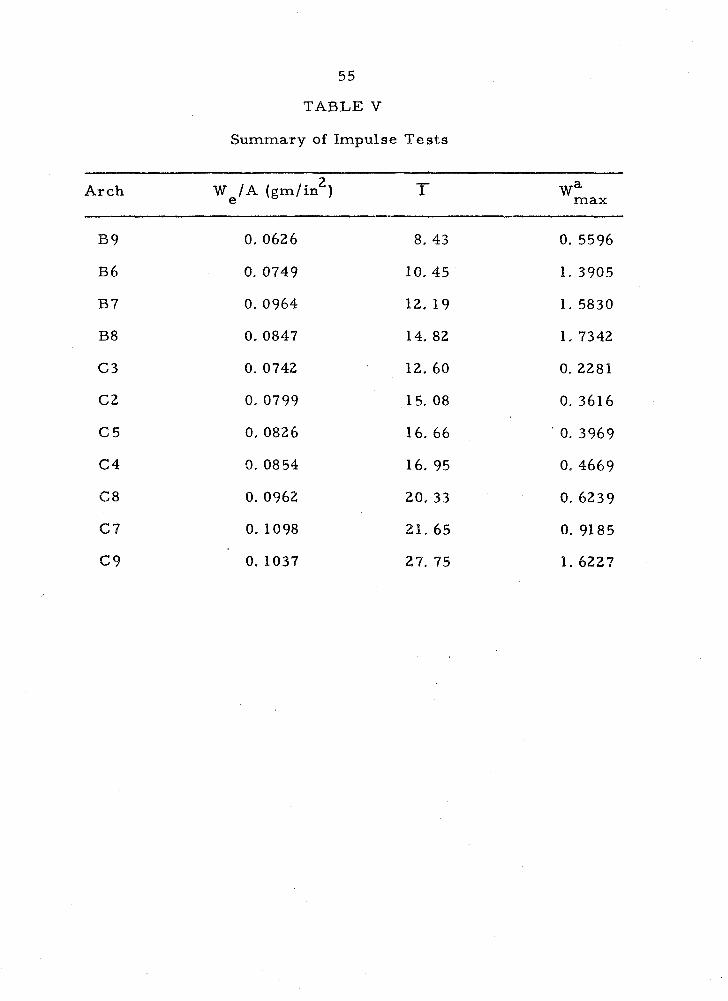
values of the maximum average displacement a r e listed in Table V
and a r e shown in Figure 23 a s a function of the nondimensional
impulseT. This figure shows that the a rch exhibits a large increase
in maximum response over a rather small range of impulse level.
The maximum rate of change of response (the inflection points for the
faired curves in Figure 23) a r e a t an impulse level 7f- of 9 and 22 for
Y equal to 10 and 20 respectively. It i s interesting to note that these
points a r e close to the point of average displacement equal to one
which was used by Humphreys (Ref. 15) to define the critical load.
However, they a r e about 6-7 times a s high a s Humphreys' experi-
mental results. The reason for this i s not known a t this time, A
comparison with Humphreyss results i s shown in Figure 24.
The deformation of the a rch can also be displayed a s successive
pictures of the a rch shape. This i s done for two representative shots
in Figure 25. Time s tar ts a t the top of the figure and the time
between successive shapes i s about 200 microseconds.
In order to get a more quantitative picture of the a rch deforma-
tion, a three mode approximation to the deformed shape was calculated,
The representation used is a s follows:
The coefficients were determined by using a "Least Square Fit" of the
experimental data f rom the high speed pictures. The time history of
the two symmetric modes is shown in Figure 26 for the arches tested.
The trajectories in a q l , q3 space can also be displayed. Figure 27

shows a supercritical and subcritical response for each group of
arches. The line of average displacement equal to one i s also shown
in the figures.
In addition to the dynamic tes ts results described above, an
attempt was made to determine the static equilibrium positions of the
clamped arch. This i s of interest since the existence of these posi-
tions i s a requirement in an energy approach to determining the
dynamic buckling loads. These tes ts were carr ied out by pushing the
a r ch through to a Barge displacement configuration by hand and
attempting to find a position where it would stay. This was unsuccess-
ful for the 4 arches used with Y z 10 and 20. In addition, the existence
of an unstable equilibrium position could not be detected. This i s
somewhat more difficult to determine experimentally since it i s like
trying to balance a ball on top of a hill. However, there did not seem
to be any equilibrium points other than the undeformed position for the
arches tested. This i s in agreement with Vahidis s calculation (Ref. 14).
C. Conclusion
The experimental work on the impulsively loaded clamped
circular a rch shows that the maximum response has a significant
increase in value for a small increase in load a t some value of
impulse. It would appear from the data available that this increase
i s a smooth transition from a small response to a large response a t
some critical impulse level. Therefore, the use of a definition of
dynamic buckling which requires a finite change in response for an
infinitesimal increase in load would not consider this problem a s a

32
dynamic buckling problem. However, from a practical point of view
the increase in deflection i s of the order of three for a small increase
in impulse level. This increase is about the same amount a s one
obtains for step loading on a simply supported arch in the range of
geometric parameter where direct snapping occurs (Ref. 11).
It i s of interest to note that this problem i s like the one of
direct snapping a s categorized by Lock (Ref. 11). In other words the
structure reaches its maximum displacement on the f i rs t oscillation
of the fundamental mode. This can be seen from the response plots
(Fig. 26) combined with the trajectories (Fig. 27). An examination
of the nonsyrnmetric response was also made. The f irst component
of the antisyrnmetric response i s shown in Figure 28. As seen from
these two cases of a subcritical and supercritical impulse, the anti-
symmetric mode was not parametrically excited by the fundamental
mode. It obtained i ts maximum o r nearly maximum early in the
motion, and did not grow until the symmetric response achieved its
maximum displacement.
In summary, while no evidence has been found that the clamp-
ed circular a rch under impulse loading can be rigorously categorized
a s a dynamic buckling problem, it i s clear that over a small range in
impulse the a rch undergoes a significant increase in response. It i s
therefore of practical significance to determine this range of
impulse. In addition, it was experimentally determined that no stable
equilibrium position exists for the clamped a rch f ree from lateral
load other than the undeformed position. Also, the existence of an
unstable equilibrium position was not detected.

33
REFERENCES
Fung, Y. C, and Sechler, E . E . : "Instability of Thin Elas t ic
Shells", Structural Mechanics, Proc . of F i r s t Symposium on
Naval Structural Mechanics, Pergamon P r e s s , New York,
pp 115-168, (1960).
Tsien, H. S. : "A Theory for the Buckling of Thin Shells", J.
Aero. Sci., Vol. 9, No. 10, pp 373-384, (Aug. 1942).
Babcock, C. D., J r . : "The Influence of the Testing Machine on
the Buckling of Cylindrical Shells under Axial Compression",
Hnt. J. Solid Structures , 3, pp 809-817, (1967).
Arbocz, J. and Babcock, C. D. , J r . : "The Effect of Genera l
Imperfections on the Buckling s f Cylindrical shell^'^, to be
published, Journal of Applied Mechanics.
Fung, Y. C. and Kaplan, A. : "Buckling of Low Arches on Curved
Beams of Small Curvature", NACA TN 2840, (Nov. 1952).
Gjelsvik, A. and Bodner, S. R. : "The Energy Cri ter ion and
Snap Buckling of Arches", J. Eng. Mech. Div., AMCE,
pp 87- 134 (October 1962).
Schreyer , PI. L. and Masur , E . F.: 91Buckling of Shallow Arches",
J. Eng, Mech. Div., P r o c . ASCE, pp 1-17 (August 1966).
Hoff, N. J. and Bruce, V. G. : "Dynamic Analysis of the
Buckling of Lateral ly Loaded Fla t Arches", J. Math Phys. , 32,
pp 276-288 (1954).
Hsu, C. S. : "Equilibrium Configurations of a Shallow Arch of
A r b i t r a r y Shape and Their Dynamic Stability Character", Int.
J. Nsn-Linear Mechanics, 3, pp 113-136 (1968).
34
10. Simitses , G. J. : "Dynamic Snap-Through Buckling of Low
Arches and Shallow Spherical Caps", Ph. D. Dissertation,
Dept. of Aero. and Astro. , Stanford University (June 1965).
11. Lock, M. H. : g'The Snapping of a Shallow Sinusoidal Arch under
a Step P r e s s u r e Load", Aerospace Corp., Space Systems Div.,
TR-65-107 (July 1965).
12. Vahidi, B. : s'Dynamic Stability of Clamped Circular Arches",
Graduate Student, University of California, San Diego,
Pr iva te Communication.
13. Thompson, J . M . T . : "Dynamic Buckling under Step Loading",
Dynamic Stability of Structures , Edited by G. Herrmann,
Pergamon P r e s s , pp 215-236 (1967).
14. Vahidi, B. : "Non-Existence of Snap- Through for Clamped
Shallow Elast ic Arches Subjected to Impulsive Load", T R No. 8 ,
University of California, San Diego, (March 1968).
15. Humphreys, J. S.: "On Dynamic Snap-Buckling of Shallow
Arches", AIAA Journal, Voll. 4, NO. 5, pp 878-886, (May 1966).
16. Humphreys, J. S. : "On the Adequacy of Energy Cr i te r ia for
Dynamic Buckling of Arches", A I M Jourmall, VoP. 4, No. 5,
pp 921-928, (May 1966).
17. Nevill, G. E. and Hoese, F. 0. : "Impulsive Loading Using
Sprayed Silver Acetylide -Silver Nitrate", Experimental
Mechanics, pp 294-298, (Sept. 1965).
18. Hoese, F. 0. ; Langner, C . G. and Baker, W. E. : seSimultaneous
Initiation over Large A r e a s of a Spray Deposited E x p l ~ s i v e ~ ~ ,
Experimental Mechanics, pp 392-397, (Sept. 1968).

3 5
APPENDIX I
LEAST SQUARE FIT OF THE IMPERFECT CIRCULAR ARCH
The concave side of the a r ch surface was marked every half an
inch. At these positions, the distance with respect to a fixed point
was measured by a rotatable a r m a s described previously (see Fig. 29).
These distances were denoted by Ri. The "Best Fit Radius" E, and
"Best Fit Center" (BFC) were found by the method of least square
e r ro r . The distance between the two centers i s r , and the angle
between a vertical line and the line joining two centers i s 8. Further-
more , express R. with respect to IBFC and call that distance E.. 1 1
The relation between E. and R., s i s a s follows: P 1
1 la: 2
R. sincx. + r. sin 8) + (R.. cosa . 9 P. cos 0 ) 1 1 1 1 (1)
Then, the deviation of the a rch surface from the "Best Fit Archu i s ei - -
where e = R-Ri i (2)
Assuming that there were N positions along the arch, the total square
e r r o r e i s given by
- The undetermined parameters R, r and 8 can be determined by the
following variational equations.
8 6 - = N(R -K1 - rK2 cos 8) = 0 aR

a € - = (K1K2 - K4) cos 9 - K3 sin 8 ar (6) r 2 + ?[(K; - K1K6) cos 2 9 - K1K5 sin 2 B t (K2+KlK7 - 2) = 0 I
where
P - N
sin 2 a. 1
N
K~ = kC - 1 cos 2 q; R:
and sin u = 0. The relation (4) has been used in (5) and (6). i
i= B Combining (5) and (6) and eliminating r , a transcendental equation
for 8 i s obtained
B tan 8 = - - A
where
1 2 A = K K -K4+ (K4K7-K K K t K4K6 - 3K K K .+ K3K5) 1 2 7 1 2 6

37
APPENDIX I1
EQUILIBRIUM POSITIONS AND THEIR ENERGY LEVELS
O F CLAMPED ARCHES UNDER CONCENTWTED LOAD
NOMENCLATURE
Cross sectional a r ea of the a r c h
Integration constant
Integration constant
Young's Modulus
Arch thickness
Central a rch r i se
Moment of inertia
Arch length
Axial thrust
Concentrated load
Nondirnensional load
Arch radius
Heaviside step function
T irne
Arch displacement
4x 2 Initial a rch shape
x Arch coordinate
- 2x x = - L Nondimensional a r ch coordinate

Nondimensional a r c h displacement
W - -2g Nondirnensionalinitialarchshape
yo 2
I3 Arch half angle
y = -=--- L' 2H Geqmetric Pa ramete r 4Rh h h
Dirac delta function
Nondimensional axial s t ra in
Potential energy of the sys tem
Nondimensional potential energy
P Mass density
Nondimensional t ime

39
A. Symmetric Equilibrium Po sitions
The coordinate system i s shown in Figure 3 0 . The equations
of motion of a shallow arch can be expressed in t e rms of the displace-
ment a s derived in reference 8.
where
Substituting the nondimensional quantities, ( 1 ) can be written
in dimensionless form a s follows,
2 y"" + p, y" + y t ??6 (x) §(+I = O
The static equilibrium positions can be obtained by letting the
inertia t e r m equal to zero. The corresponding static equation will
The homogeneous solutions of (4) a re :
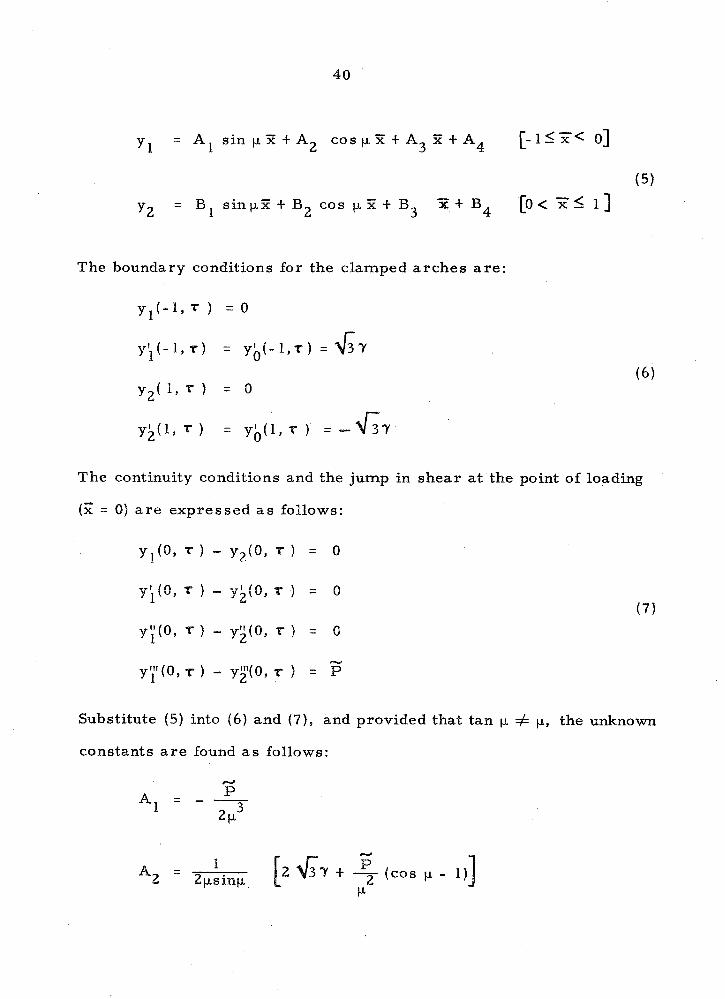
y1 = Al sin p P + A 2 c o s p % + A 3 % + A 4 [-1SX< 01
(5) - y2 = B~ s i n p ~ + B cos p~ + B x + B~ [o< F< 1 1 2 3
The boundary conditions for the clamped arches a r e :
The continuity conditions and the jump in shear a t the point of loading
(i? = 8 ) a r e expressed a s follows:
Substitute (5) into (6) and (7), and provided that tan p .fi p, the unknown
constants a r e found a s follows:

w The constants A1, A2, . . . , B4 a r e functions of p and P.
4-d
The p--P relationship can be found by substituting (5) into ( 3 ) .
2 2 2, 2 2 p = 27 + ( A ~ - + B~ - B Y ) -$ sin 2p,
2 - (AIAZ - B B )P sin (I - 2(A1A3 f BIB3) sin P 1 2 (9)
The roots of this transcendental equation correspond to the
value of p a t the equilibrium positions under the specified load level
B. Antisymmetric Equilibrium Positions
In evaluating ( 6 , 7), the following algebraic equation must be
solved
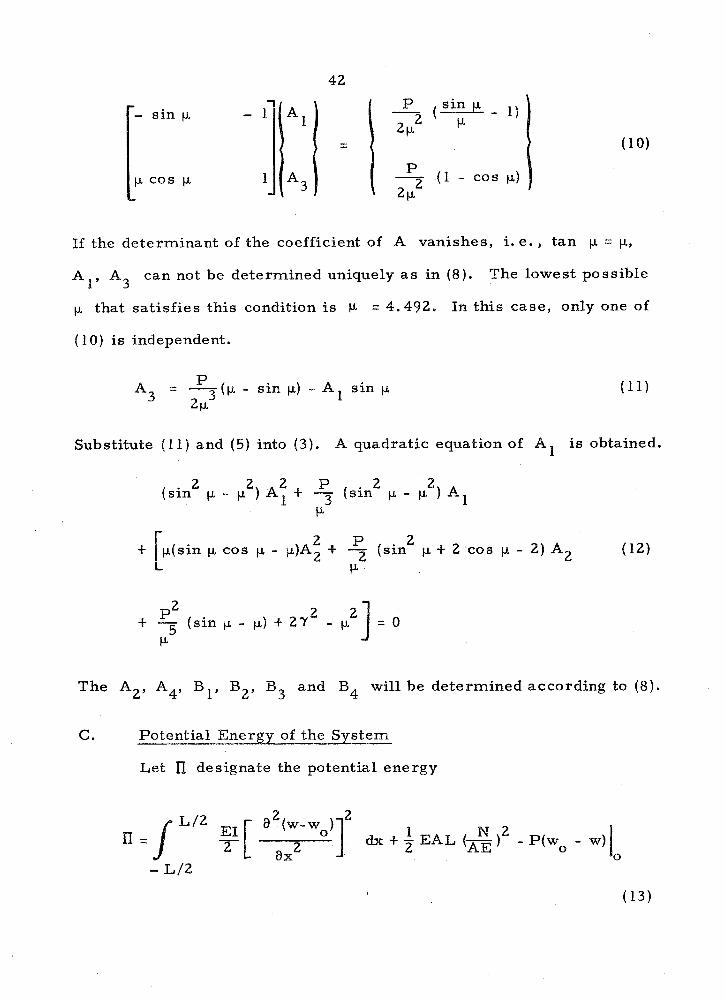
If the determinant of the coefficient of A vanishes, i. e. , tan p = p,
A1, A3 can not be determined uniquely a s in (8). The lowest possible
p that satisfies this condition i s V = 4.492. In this case, only one s f
( 10) i s independent.
P A3 = ~ ( I I - sin p) - A sin p
2~ 1
Substitute (11) and ( 5 ) into (3). A quadratic equation of A i s obtained. E
2 P 2 (s in p cos p - p)A2 + 7 (s in p 4- 2 cos p - 2) A2 (12)
b'.
The A2, A4, Bl , B2, B3 and B4 will be determined according to (8).
C. Potential Energy of the System
Let designate the potential energy

4 3
The nondimensional potential energy i s a s follows:
1 2 1 4 =J (y" - y;) d x + - p - 2i;(y0 - YII 2
1 0 - 1 Substitute (5) into (14), we get
- 2 2 2 2 1 2 2 2 2 II = p 3 B ( ~ , + A 2 + B1 + B2) - $(A1 - A2+ B - B2) sin 2p 1
- (AIA2 - BIB2) sin 2 l p + 2 4- 3Yp [ (A1 - B1)(l - cos p) (15)
The results obtained above were evaluated numerically on an IBM
360/?5 computer. The numerical results for the critical static load
agree with the results obtained by Schreyer and Masur (Ref. 7). The
values of the upper and lower bounds were n m e r i c a l l y calculated and
a r e shown in Figure 17.
44
TABLE I
Geometric Descriptions of the Tested Arches
Arch 32 Arch 29 Arch 28 Arch 25
b (in) 0. 75 0. 75 0. 75 0. 75
h (in) 0.0632 0.0643 0.0643 0.0643
L (in) 12.20 10. 90 9. 50 7. 75
R (in) 31. 56 32.09 32. 01 31. 58
9 , Y 18.655 14. 395 10. 962 7.395
" E-f (in) 0. 5895 0,4528 0. 3524 0.2377
"p (degree) 11.075 9.729 8. 503 7.030
* Calculated

TABLE 11 - Nondirnensional Static Cr i t i ca l Load P
E Arch 32 Arch 29 Arch 28 Arch 25

46
TABLE 111
Critical Step Load
Arch 32. Y = 18. 655
- P (lb) P Result
buckled
buckled
buckled
buckled
buckled
buckled
buckled
buckled

47
TABLE 111 (Contfd)
Critical Step Load
Arch 32. Y = 18.655
- E P (1b) P Result
buckled
buckled
buckled
buckled
buckled

TABLE 111 (Contld)
Critical Step Load
Arch 29, Y = 14. 3 9 5
- E P (lb) P Result
144.2
144. 8
145.4
144. 1 buckled
11.80 146. 1 buckled
buckled
buckled
buckled
buckled
buckled
buckled

49
TABLE 111 (Cont'd)
Critical Step Load
Arch 29. 9' = 14. 395
- d P (lb) P Re sult
buckled
buckled
buckled
buckled
buckled
buckled

50
TABLE 111 (Contld)
Critical Step Load
Arch 28, Y = 10. 962
Result
106. 5 buckled
107. 0 buckled
13.10 187.4 buckled
108.1 buckled
110.6 buckled
106. 5
107. 0 buckled
buckled
buckled

5 1
TABLE ILI (Contld)
Critical Step Load
Arch 28. 'Y = 10. 962
Result
104.1
104. 5 buckled
buckled
buckled
buckled
52
TABLE I11 (Contfd)
Critical Step Load
Arch25. Y = 7.395
- € P (lb) P Result
buckled
buckled
buckled
buckled
buckled
buckled

53
TABLE III (Contld)
Critical Step Load
Arch25. Y = 7.395
- € P (lb) P Result
buckled
buckled
buckled
buckled

54
TABLE IV
Geometr ic Description of Tes ted Arches
Arch Thickness Radius Length (in) (in) (in) Y
55
TABLE V
Summary of Impulse Tests
Arch wa max

FIG* I RESPONSE OF LINEAR SPRING MASS SYSTEM


FlG.3 NONLINEAR RESPONSE OF TWO DEGREES OF FREEDOM SYSTEM

FIG. 4 COORDINATE SYSTEM OF CIRCULAR ARCH

FIG* 5 TYPICAL TENSILE TEST OF CURVED 2 0 2 4 ALUMINUM SPEC1 MEN

FIG. 6. CIRCULAR ARCH BEFORE AND A F T E R INSTALLATION IN S T E E L FRAME.
F16.7 THE STATIC AND DWAMIC PEST APPARATUS

FIG. 8 . KNIFE EDGE ASSEMBLY

FIG. 9. INITLAL IMPERFECTION MEASURING EQUIPMENT
FIG. 10. MEASURING O F INITIAL IMPERFECTION O F CIRCULAR
ARCH

Arch 32
0 3 6 9 Inches
112
0 . 0 0 5 "
Inches
Arch 25
2 6 inches
f IG. I1 IMPERFECTIONS OF" THE TESTED ARCHES

FIG. 12 NONDIMENSIONAL CRITICAL STA"IIG LOAD VS. LOADING IMPERFECTION
Pcr - Pck!
1.0 (Schreyer and Masur)
Energy Sslrst ion 0.6
8.4
s BQ Present Experiments x Experiments by Gjelsvik and Bodner
FIG. 83 COMPARISON OF STAnIG EXPER! MEMfS TO THEORETICAL STATIC BUCKLING LOAD


FIG. !So LOAD DEFLECTION CURVE FOR ARCH 32 ,r= 18.66

FIG.1Sb LOAD DEFLECTION CURVE FOR ARCH 29,1=14.40
13.4
P(Lb.1
13.2
13.0
12.8
12.6
12.4
12.2
0.0 0.2 0.4 0.6 0.8 1.0 Wmax. (In.)
FiG.15~ LOAD DEFLECTION CURVE FOR ARCH 28, ys10.96

FIG.15d LOAD DEFLECTION CURVE FOR ARCH 2 5 , ~ . 7.40

Arch 25
FIG. 16 NONDIMENSIONAL CRITICAL STEP LOAD VS. LOADING IMPERFECTION

( Hsu,Simitses) 1.2
Pc r - PC l
LOWER BOUND (Hsu,Simitsss)
1.0
0.8 --
0 + Present Experiments Irr.ls-e Energy Bound (AppendixP)
FIGIT COMPARISON OF DYNAMIC EXPERIMENT TO
THEORETICAL STEP BUCKLING LOAD


FIG. 19. CAMERA SETUP
FIG. 20. F ILM READER TO MEASURE DEFORMED ARCH SHAPE


Arch 86
Arch B 7
Arch 88
Arch C 3
/ Arch i=2
FIG.22aINITIAL IMPERFECTIONS OF THE TESTED ARCHES

1 Arch C 8
Arch C 9
FIG.22blNITIAL IMPERFECTIONS OF THE TESTED ARCHES


- Present Ex per im en ts a:
Humphreyst Experiments
20
0 5 10 8 5 20 P"
F16.24 COMPARISON OF THE PIRESENMRESUCTS WITH HUMPHREYS~XPEERIWIENTS

FIG. 250 DEFORMED SHAPES OF ARCH €3 9

FIG. 25 b DEFORMED SHAPES OF ARCH B 8


PC) PC)
d @.I


FIG.27DTRAJECTORIES OF ARCHES FOR y W 10
FIG.27bTRAJECTORIES OF ARCHES FOR 7 @ 20


% TRUE ARCH SHAPE
BEST FIT CENTER
FIG.29 COORDINATE SYSTEM FOR FINDING BEST FIT TO THE MEASURED INITIAL IMPERFECTlONS

FIG. X1 COORDINATE SYSTEM FOR THE CLAMPED CIRCULAR ARCHES