the state of u.s. retail
TRANSCRIPT

The State of U.S. Retail
Taylor Coyne, JLLResearch Manager, U.S. Retail
January 2019

2© 2017 Jones Lang LaSalle IP, Inc. All rights reserved.
Retailers saw their best holiday season in 6 years
• Holiday sales are up 5.1 percent since last year
• Black Friday sales rose by ~9.0%
• Apparel sales grew 7.9% percent (best growth rate since 2010) and home improvement spending increased by 9%
• Online shopping was up 19.1%
Source: ICSC, Mastercard SpendingPulse

3© 2017 Jones Lang LaSalle IP, Inc. All rights reserved.
2018 holiday shopping indicates a shift to online and mobile
• A little less than half of holiday shoppers said they would buy most gifts online
• Top 5 retailers where consumers planned to shop were:– Amazon (22.1%)
– Walmart (15.8%)
– Target (12.3%)
– Macy’s (4.3%)
– Best Buy (4.1%)
Source: JLL Research

4© 2017 Jones Lang LaSalle IP, Inc. All rights reserved.
$
Value + experience

5© 2017 Jones Lang LaSalle IP, Inc. All rights reserved.
Value retailers see revenue growth despite lower experience scores

6© 2017 Jones Lang LaSalle IP, Inc. All rights reserved.
Vacancies remain flat despite closures
$16.
88
$17.
20
$16.
17
$15.
30
$14.
99
$14.
85
$15.
07
$15.
32
$15.
62
$16.
07
$16.
88
$17.
60
5.8%6.4%
7.3%7.1% 6.9% 6.7%
6.3%5.7%
5.3%4.7% 4.5% 4.5%
$13.00
$13.50
$14.00
$14.50
$15.00
$15.50
$16.00
$16.50
$17.00
$17.50
$18.00
0.0%
1.0%
2.0%
3.0%
4.0%
5.0%
6.0%
7.0%
8.0%
9.0%
10.0%
2007 2008 2009 2010 2011 2012 2013 2014 2015 2016 2017 YTD2018
Quoted rent
Vacancy
Source: JLL Research, Q3 2018

7© 2017 Jones Lang LaSalle IP, Inc. All rights reserved.
Construction remains limited and focused on mixed-use and urban projects
Percent of retail product under construction, Q3 2018Retail supply & demand
General Retail, 65.1%
Shopping Center, 16.5%
Mall, 12.4%
Power Center, 3.3%
Specialty Center, 2.7%
133.
2
10.3
65.2
64.9 71
.8 83.0
119.
4
107.
4 124.
5
88.7
35.2
155.
1
86.9
44.3
45.0
46.9 51.5 63
.3 72.6
71.5
75.7
40.3
.0
20.0
40.0
60.0
80.0
100.0
120.0
140.0
160.0
180.0
2008 2009 2010 2011 2012 2013 2014 2015 2016 2017 2018YTD
Net absorption (m.s.f.) Total delivered (m.s.f.)
Source: JLL Research, Q3 2018

8© 2017 Jones Lang LaSalle IP, Inc. All rights reserved.
But what about all the closures?
100100100100100100101109110
124132
150170
200200200
228250252
268379
400500
600735
bareMineralsCharming Charlie
Michael KorsSally Beauty
Sears HometownThe Children's Place
BrookstoneKmart
Foot LockerVitamin WorldClaire's Stores
StarbucksH&MGNC
Mattress FirmSignet Jewelers
SearsBest Buy Mobile
Bon-TonAscena Retail Group
TeavanaH&R Block
SubwayWalgreensToys R Us
# of announcedclosings
Source: PNC, Coresight, JLL Research, Q3 2018
• Bookstores• Electronics stores• Office supplies• Mid-priced apparel• Mid-priced grocery
– especially unionized• Casual dining
– older, struggling concepts• Stationery/Gift shops
Replaceable by internet
Mid-range retailers
Other
Retail categories contracting in the next year

9© 2017 Jones Lang LaSalle IP, Inc. All rights reserved.
$
Value + experience

10© 2017 Jones Lang LaSalle IP, Inc. All rights reserved.
Off-price retail and home furnishing stores rush to fill vacant department store space
Source: PNC, Coresight, JLL Research, Q3 2018
11© 2017 Jones Lang LaSalle IP, Inc. All rights reserved.
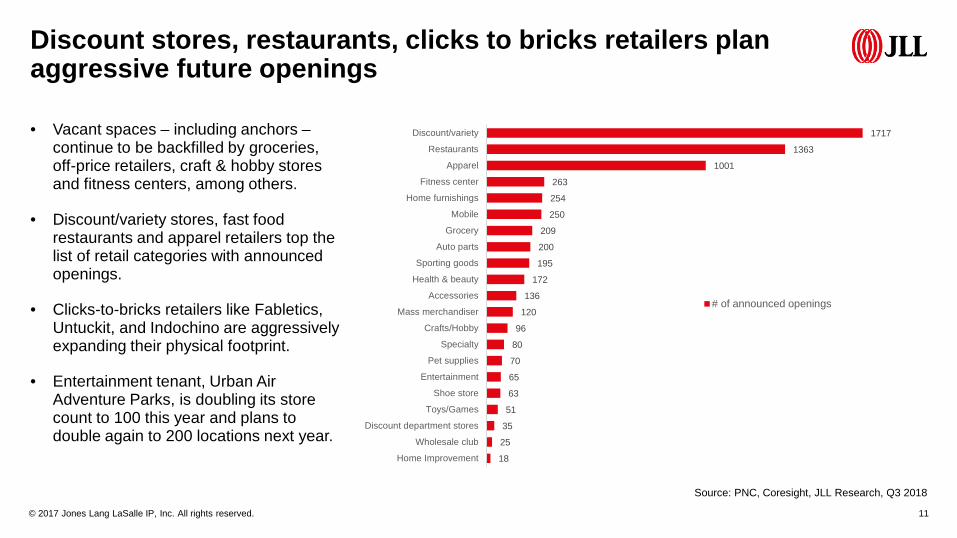
Discount stores, restaurants, clicks to bricks retailers plan aggressive future openings
• Vacant spaces – including anchors –continue to be backfilled by groceries, off-price retailers, craft & hobby stores and fitness centers, among others.
• Discount/variety stores, fast food restaurants and apparel retailers top the list of retail categories with announced openings.
• Clicks-to-bricks retailers like Fabletics, Untuckit, and Indochino are aggressively expanding their physical footprint.
• Entertainment tenant, Urban Air Adventure Parks, is doubling its store count to 100 this year and plans to double again to 200 locations next year.
18
25
35
51
63
65
70
80
96
120
136
172
195
200
209
250
254
263
1001
1363
1717
Home Improvement
Wholesale club
Discount department stores
Toys/Games
Shoe store
Entertainment
Pet supplies
Specialty
Crafts/Hobby
Mass merchandiser
Accessories
Health & beauty
Sporting goods
Auto parts
Grocery
Mobile
Home furnishings
Fitness center
Apparel
Restaurants
Discount/variety
# of announced openings
Source: PNC, Coresight, JLL Research, Q3 2018

12© 2017 Jones Lang LaSalle IP, Inc. All rights reserved.
E-commerce retailers plan 850 physical stores in the next 5 years
Apparel & Accessories,
74.3%
Furniture, Home Furnishings & Housewares,
11.4%
Specialty/Other, 5.7%
Cosmetics/Beauty, 5.7%
Consumer Electronics,
2.9%
Luxury, 1%Luxury Lite, 11%
High, 50%
Middle, 32%
Low/Discount, 7%
Source: JLL Research

13© 2017 Jones Lang LaSalle IP, Inc. All rights reserved.
$
Value + experience
Source: JLL Research

14© 2017 Jones Lang LaSalle IP, Inc. All rights reserved.
Accessible, human, immersive, intuitive
Glossier GlossierCasper

15© 2017 Jones Lang LaSalle IP, Inc. All rights reserved.
Four phases of clicks-to-bricks expansion
Source: JLL Research

16© 2017 Jones Lang LaSalle IP, Inc. All rights reserved.
Most major mall renovations fall into four categories

17© 2017 Jones Lang LaSalle IP, Inc. All rights reserved.
Upgrading food and beverage is the top renovation strategy
2.2%
2.2%
3.3%
5.6%
5.6%
7.8%
8.9%
10.0%
11.1%
12.2%
16.7%
28.9%
34.4%
41.1%
0.0% 5.0% 10.0% 15.0% 20.0% 25.0% 30.0% 35.0% 40.0% 45.0%
Medical
Distribution Center
School
Call center
Demolished
Office
Community & kid spaces
Hotel
Open space & parks
Multifamily
De-malling
Entertainment
Tenant upgrades
Food and beverage
Percent of renovated and redeveloped malls since 2014 that are in the process of or have already underwent significant renovationsSource: JLL Research

18© 2017 Jones Lang LaSalle IP, Inc. All rights reserved.
More retail isn’t always the answer
The Amazing Brentwood, Vancouver, BCAustin Community College, Austin, TX

19© 2017 Jones Lang LaSalle IP, Inc. All rights reserved.
Can co-working work at the mall?
Mall, 21.3%
Streetfront retail, 20.0%
Mixed Use, 17.3%
Neighborhood center, 12.0%
Community center, 12.0%
General/freestanding retail, 6.7%
Theme/festival, 5.3%
Power center, 5.3%
Where retail coworking spaces are located
Source: JLL Research
20© 2017 Jones Lang LaSalle IP, Inc. All rights reserved.
Want more?
www.jllretail.comWherewebuy.show

jllretail.com© 2017 Jones Lang LaSalle IP, Inc. All rights reserved.
Taylor CoyneResearch Manager, U.S. Retail+1 213 239 [email protected]
jllretail.com