the state of transportation project d … state of transportation project... · at managing...
TRANSCRIPT

1
THE STATE OF TRANSPORTATION PROJECTDELIVERY IN NORTH AMERICA
…….AND WHAT WE CAN DO ABOUT IT
Michael S. Ellegood, P.E. SASHTO 2014New Orleans

2
HOW WELL DO YOU THINK WE ARE WE DOINGAT MANAGING TRANSPORTATION PROJECTS?
According to a 2007 AASHTO report:54 % of projects exceeded the original bid 19 % exceeded the original bid by >10%
On larger projects (>$5M)82 % exceeded the original bid30% exceeded the original bid by >10%
Only 53 % of all projects were delivered on time
On larger projects (>$5M), only 35 % of projects were delivered on time.

3
WHY DO PROJECTS FAIL?Over ½ blamed on “construction surprises”• Sub‐surface conditions• Utility relocations• Environmental Issues
Lack of regularly scheduled oversight procedures• Scope• Budget & Schedule• Risk
Lack of Planning
Lack of Clear Roles &
Responsibilities
Lack of Change/Risk Management
Plans
Poor Budgeting
4
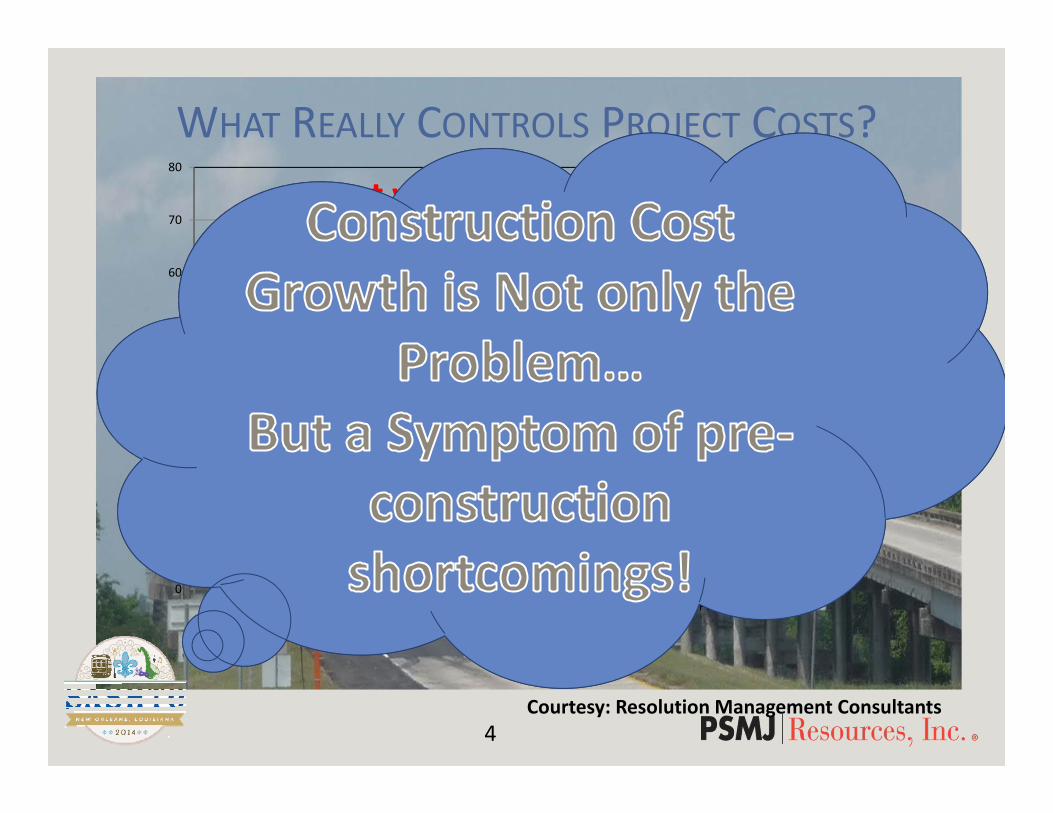
Cost vs. Influence
WHAT REALLY CONTROLS PROJECT COSTS?
Courtesy: Resolution Management Consultants
0
10
20
30
40
50
60
70
80
Design Materials Labor OVH & Profit
Cost
Influence

5
7 BEST PRACTICES
1. Build a PM Culture2. Integrate Phases3. Formal release for
construction process4. Manage ROW, Utilities
Permits like design
5. Establish a PM status reporting system6. Don’t rely on software7. Develop Risk and Change management plans

6
WHAT PSMJ SAYS:1. Empower Project Managers and
hold them accountable.2. Prepare change and risk
management plans3. Track progress regularly (monthly,
weekly)4. Remember; ROW, utilities, permits,
political issues and don’t ever short change geotech.
5. Review projects in the field with construction & O&M staff.

7
WHAT’S “PSMJ”?• PSMJ Resources Inc. – “Dedicated to the A/E/C industry.”
• Provides training for the “built environment”• Conducts surveys in: Salaries and compensation; Financial Performance; Fees and pricing
• Publishes Journals: Project Management; A/E firm management; Marketing and BD
8
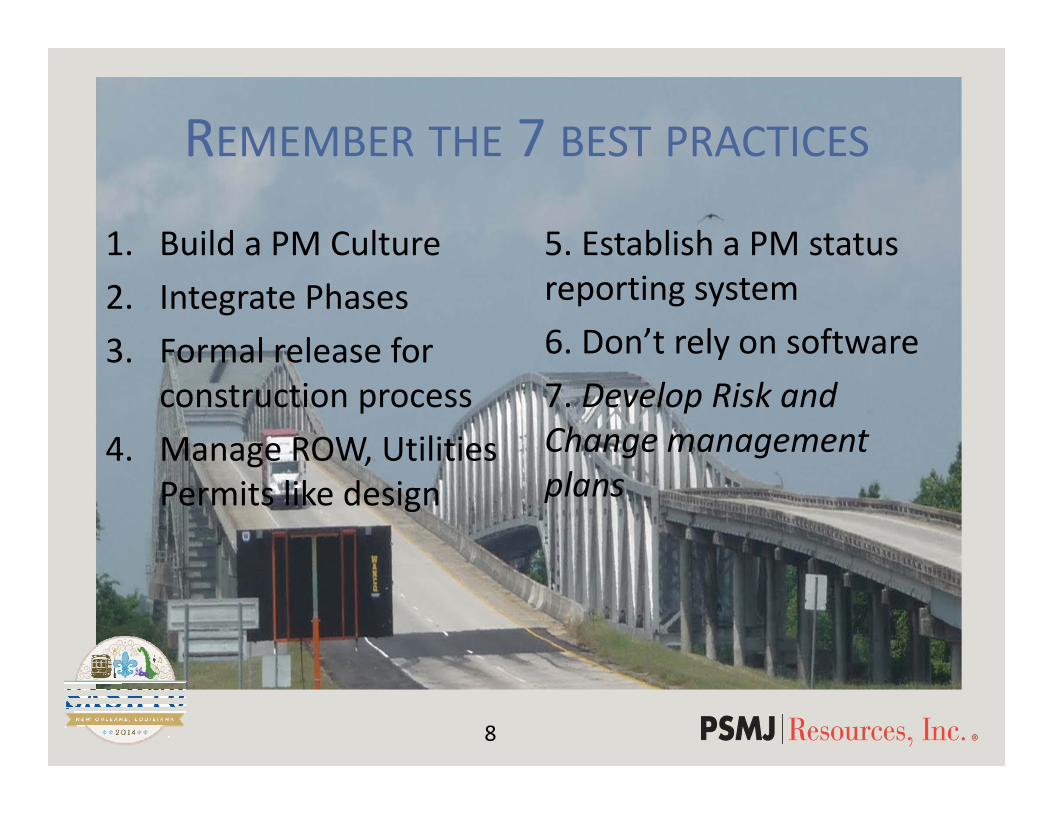
REMEMBER THE 7 BEST PRACTICES
1. Build a PM Culture2. Integrate Phases3. Formal release for
construction process4. Manage ROW, Utilities
Permits like design
5. Establish a PM status reporting system6. Don’t rely on software7. Develop Risk and Change management plans

9
1. BUILD A PM CULTURE• Instill a sense of urgency within the PM organization
• Empower the PM’s• Hold PM’s accountable• Frequent, formal project reviews, regular progress reporting

10
HOW?
1. Determine current project delivery performance.
2. Does current performance meet expectations?
3. Why or why not?

11
WHAT SHOULD THE METRICS BE?
• 85% of the annual TIP is delivered as scheduled.
• < 5% Construction cost growth(Construction cost growth = % increase in cost vs. initial contracted amount)
12
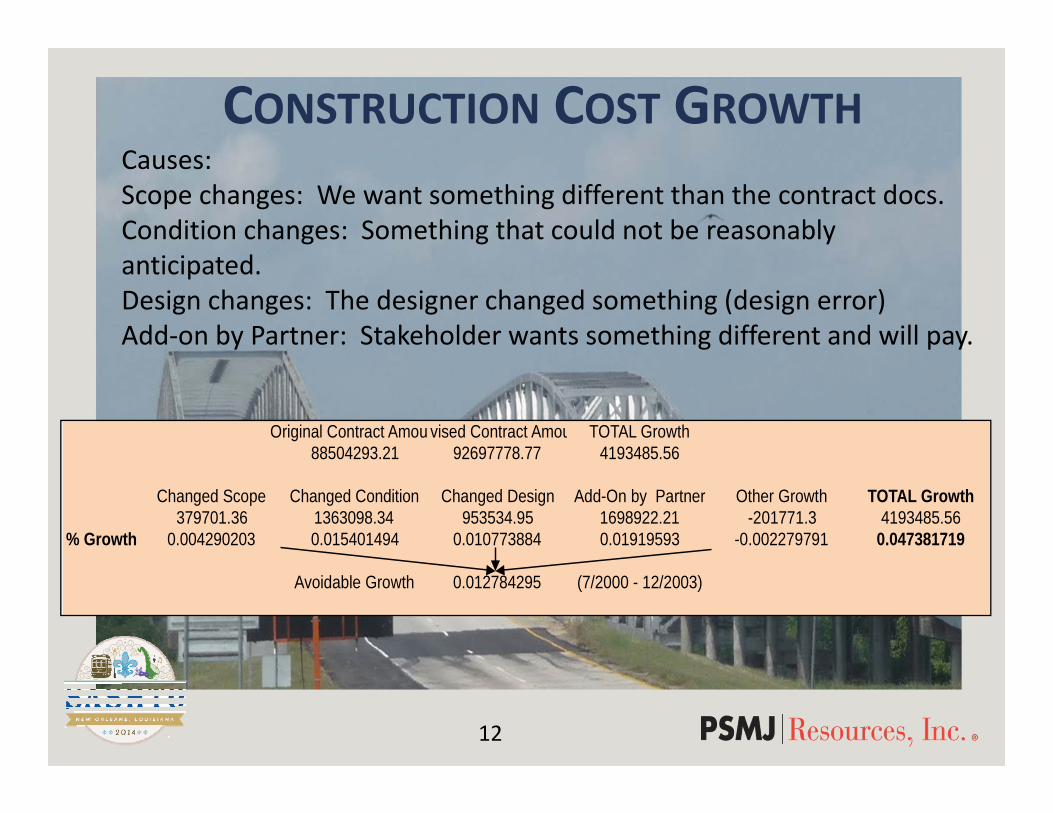
CONSTRUCTION COST GROWTH
Original Contract Amouevised Contract Amou TOTAL Growth88504293.21 92697778.77 4193485.56
Changed Scope Changed Condition Changed Design Add-On by Partner Other Growth TOTAL Growth379701.36 1363098.34 953534.95 1698922.21 -201771.3 4193485.56
% Growth 0.004290203 0.015401494 0.010773884 0.01919593 -0.002279791 0.047381719
Avoidable Growth 0.012784295 (7/2000 - 12/2003)
Causes:Scope changes: We want something different than the contract docs.Condition changes: Something that could not be reasonably anticipated.Design changes: The designer changed something (design error)Add‐on by Partner: Stakeholder wants something different and will pay.

13
2. INTEGRATE PHASES
• Planning Phase: Takes a notion and fully scopes it
• Design Phase: Takes a scoped project and “constructs it” on paper
• Construction: Takes lines on paper and builds it.

14
CHARACTERISTICS OF MAJOR PHASES OF CAPITALPROJECTS AND CONTINGENCY NEEDED (%)
Planning – 30% Design – 12‐15% Construction – 5% Scope is conceptual
Budget is conceptual
Schedule often programmed only
Low risk
Often political interest
Typically less technical than subsequent phases
Need to know “what it takes”
Scope usually defined
Budget defined but often subject to change
Schedule defined
Moderate risk
Less political involvement
Technical skills prevail
Scope well defined by contract docs.
Budget defined by bid
Schedule defined by contract terms
High risk to all parties
Typically little political involvement
Construction skills prevail

15
PHASES OF A PROJECT
Planning – Takes the project from initial concept to something that is fully scoped and can be designed.
Design – Takes the scoped project, “constructs” it on paper so that it can be built in the field.
Construction – Takes the project from ideas on paper and delivers it as a completed facility
Operations and Maintenance – Uses what we build
Charter
PS&E
ManualsTraining
16
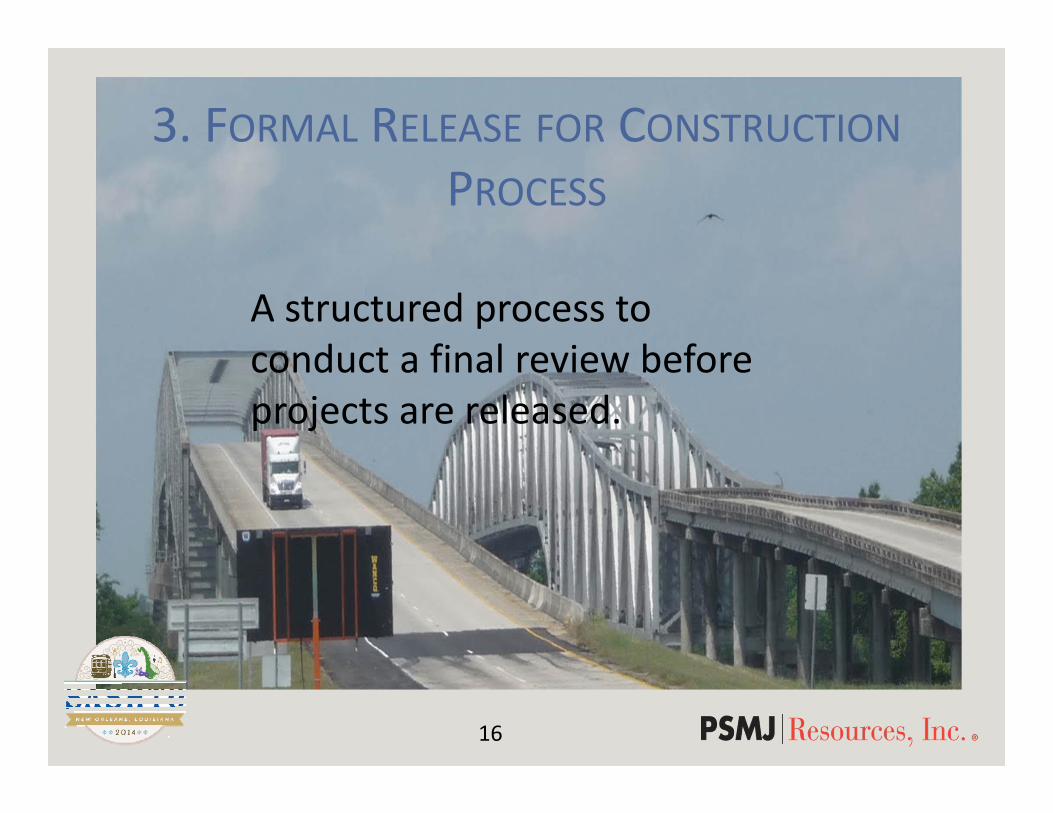
3. FORMAL RELEASE FOR CONSTRUCTIONPROCESS
A structured process to conduct a final review before projects are released.

17
WHAT TYPICALLY HAPPENS JUST BEFORE A PROJECT IS RELEASED FOR CONSTRUCTION?
17
Consultant is out of budgetSchedule is against the wireEverybody wants to review the design and commentStakeholders come out of the woodworkSite conditions change
Project success is in jeopardy!

18
“READY FOR CONSTRUCTION” VERIFICATION
Based on your agency projects
Modify as necessary for specific projects
Use past data on “things that bite us”
Monitor improvement and change/add as necessary
Make this a “must use” protocol.

19
• Plans have been checked by design team in the field within the previous thirty (30) calendar days and any resulting issues have been resolved.
• Design and construction references have been checked, are appropriate and are specifically identified by date and/or edition number.
• The spatial datum (benchmark) has been identified, properly referenced and located in the field, and adjacent existing improvements are referenced to the same datum.
• Specifications are not in conflict with the plans. In those instances where plans need to contain specifications for clarification of the design, the PM will verify that the reference is identified with the specifications.
• There is a set of check prints on file verifying that the plans have been checked
• Issues raised and errors found in the review processes (40%, 70%, etc.) are reconciled and/or corrected in the final documents.
• Pavement design has been reviewed and approved.
• The IGA, if any, has been fully executed.
• Environmental issues have been resolved.
• Utility issues have been resolved.
• Right of Way has been acquired and issues resolved.
• Possible need for updated public notice or involvement has been evaluated.

20
IF DESIGN IS NOT THE PROBLEM…THEN WHAT IS?
Usually, as a general rule, most of the time, generally speaking, the design is not the problem.
Right‐of‐WayUtilitiesPermitsPublic AcceptanceUnderground Surprises

21
• Fact: Design issues are usually not the cause of cost overrun and delay!
4. MANAGE ROW, UTILITIES PERMITS LIKE DESIGN

22
MANAGE THESE ACTIVITIES AS YOUWOULD THE DESIGN
Put these activities on your critical path and monitor progress as you monitor design.
23
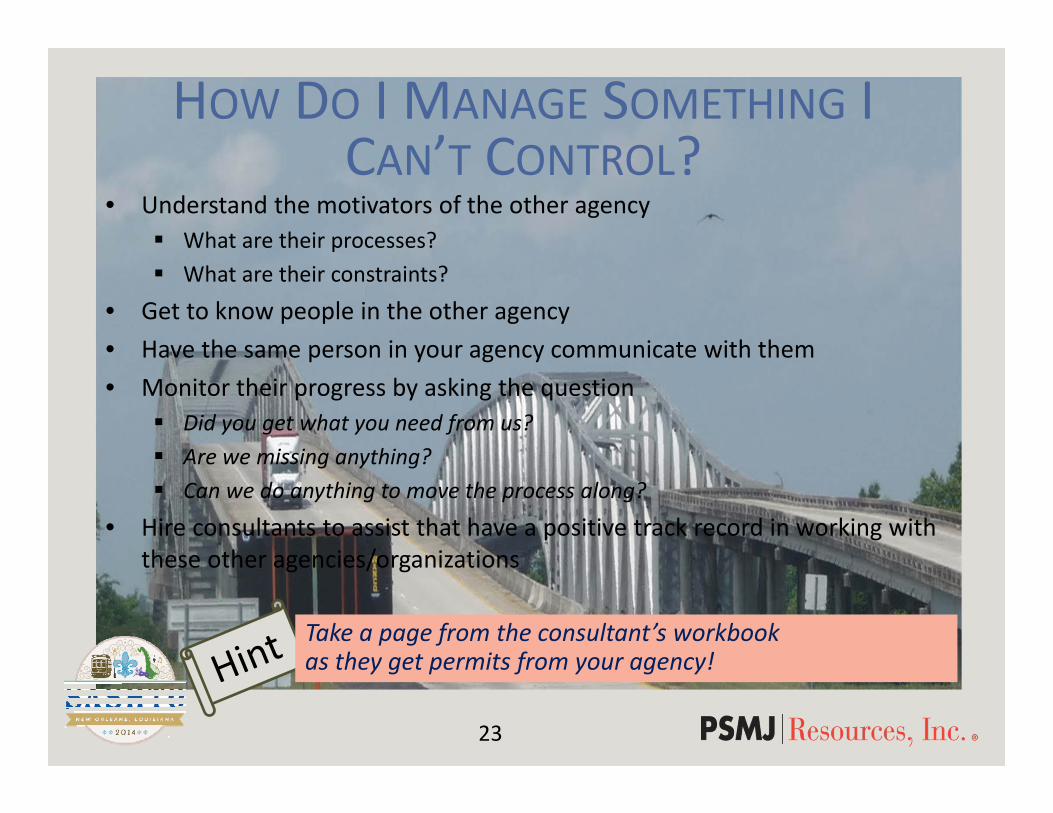
HOW DO I MANAGE SOMETHING I CAN’T CONTROL?
• Understand the motivators of the other agency What are their processes? What are their constraints?
• Get to know people in the other agency• Have the same person in your agency communicate with them• Monitor their progress by asking the question
Did you get what you need from us? Are we missing anything? Can we do anything to move the process along?
• Hire consultants to assist that have a positive track record in working with these other agencies/organizations
Take a page from the consultant’s workbook as they get permits from your agency!
24
5. ESTABLISH A PROJECT MANAGEMENTSTATUS REPORTING SYSTEMFOR THE STAKEHOLDERS AND MANAGEMENT
• For Stakeholders: Regular progress reports (tool: 7 sentence report)
• For Management: Formal Project Status Update (tool: PSU format)
25
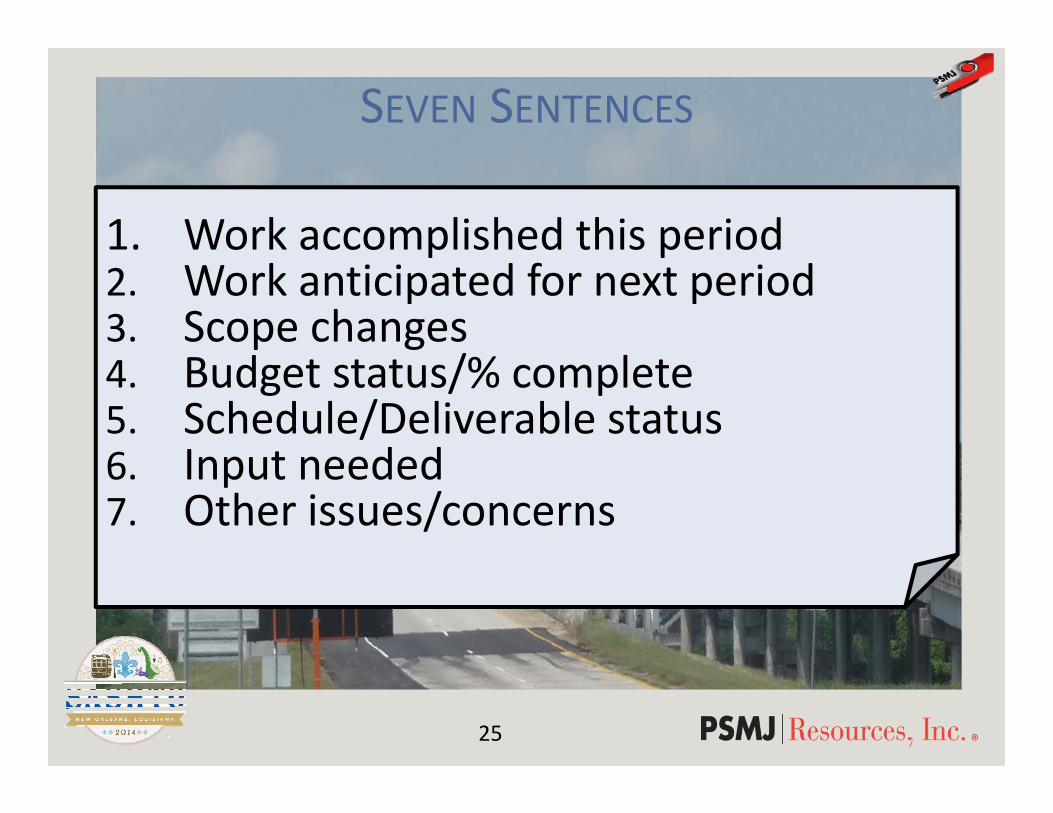
SEVEN SENTENCES
1. Work accomplished this period2. Work anticipated for next period3. Scope changes4. Budget status/% complete5. Schedule/Deliverable status6. Input needed7. Other issues/concerns

26
THE PSU
• A best practice by the most effective project delivery firms and organizations.
• Takes time – but worth it

27
YOU NEED TO KNOW THESE THINGSABOUT EACH PROJECT
1. Using Earned Value Analysis, what is the current status of scope, schedule and budget?
2. Are their subconsultants on schedule?3. If the job is behind schedule, what are they doing to correct it?4. Are invoices and payments current?5. What is the status of their quality control activities?6. Are there any work activities at risk?7. Change status?8. What is the follow up on action items from last period’s progress
meeting?9. Are they getting what they need from management on a timely basis?10. Anything else you wish to discuss?
28
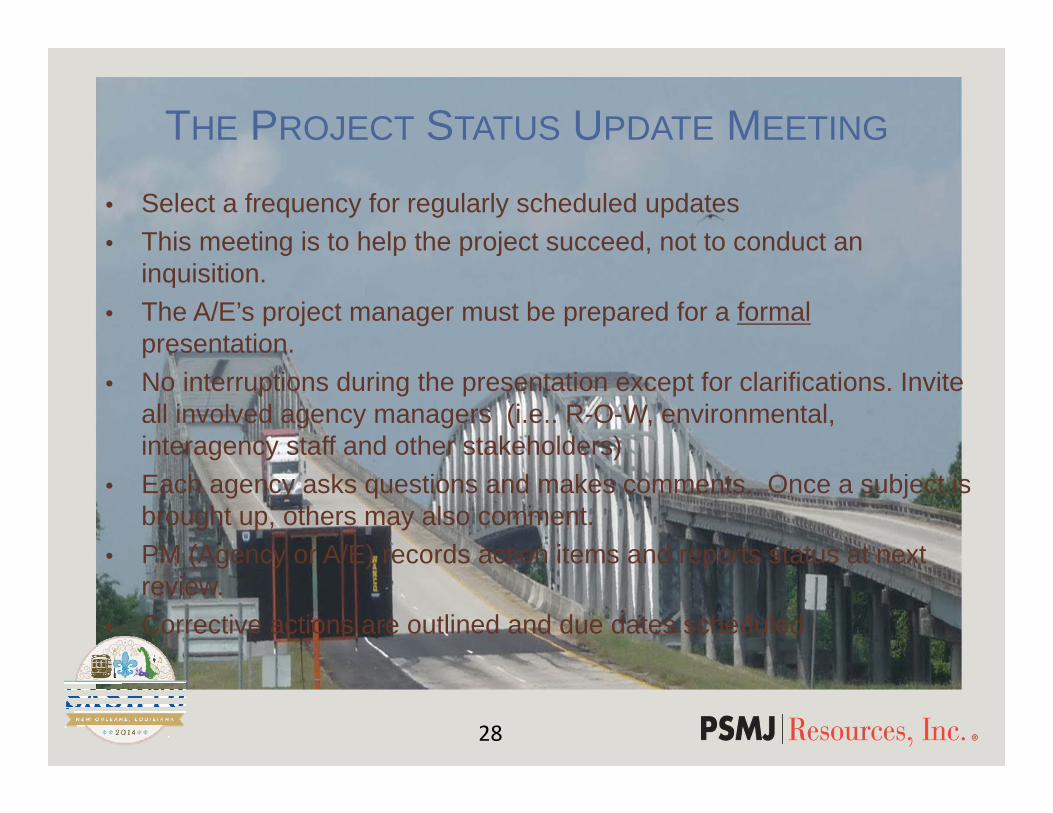
THE PROJECT STATUS UPDATE MEETING
• Select a frequency for regularly scheduled updates• This meeting is to help the project succeed, not to conduct an
inquisition.• The A/E’s project manager must be prepared for a formal
presentation.• No interruptions during the presentation except for clarifications. Invite
all involved agency managers (i.e.. R-O-W, environmental, interagency staff and other stakeholders)
• Each agency asks questions and makes comments. Once a subject is brought up, others may also comment.
• PM (Agency or A/E) records action items and reports status at next review.
• Corrective actions are outlined and due dates scheduled

PROJECT REVIEW EXAMPLE
Project Name 66th Street Pump StationAgency’s Job # 6532A/E/C Firm’s Job # 236.8Date of Review May 1Contract Type Lump sumContract Amount $248,600Agency’s Project Manager Mary SmithA/E/C Firm’s PM Alex Jones
Work Performed This Month Work Scheduled Next Month Completed pump specs Completed site grading plan Almost completed floor plans
Complete mechanical drawings Complete electrical drawings Complete earthwork specs
29
General Information

Project Budget & Schedule Status
-
24,860
49,720
74,580
99,440
124,300
149,160
174,020
198,880
223,740
248,600
1-Jan 31-Jan 28-Feb 31-Mar 30-Apr 31-May 30-Jun 31-Jul 31-Aug 30-Sep 31-Oct 30-Nov 31-Dec
Cum
ulat
ive
Expe
nditu
res
0%
10%
20%
30%
40%
50%
60%
70%
80%
90%
100%
Projected Cumulative $Expenditures Percent Complete
66th Street Pump Station
E arned V a lue T ab le -- C a lcu la tio n o f E s tim ated P ro g ressE nte r you r da ta in ligh t g reen ce lls - a ll o the r ce lls a re de te rm ined by fo rm u la
S am p le D ata C o m p any66th S tree t P um p S ta tio n E V T ab le D a te = 30 -A pr-03
T ask P ercen t E a rnedT ask D escrip tion M anager B udge t C om p le te V a lue
T o ta ls 248 ,600 35 .4% 88 ,000 A . P re lim ina ry D es ign R eview S ue 50 ,000 x 100 .0% 50 ,000
0 - - x - B . F ina l D esign P hase P e te - x - 1 . F loo r P lans - 15 ,000 x 70 .0% 10 ,500 2 . S ite P lan - 14 ,000 x 80 .0% 11 ,200 3 . A rch itectu ra l D raw ings John 35 ,000 x 10 .0% 3,500 4 . S tructu ra l D raw ings - 25 ,000 x 0 .0% - 5 . C iv il/S ite D raw ings - 15 ,000 x 0 .0% - 6 . M echan ica l D raw ings - 15 ,000 x 0 .0% - 7 . E lectr ica l D raw ings - 13 ,000 x 0 .0% - 8 . C onstruction S pecs - 11 ,000 x 0 .0% - 9 . E ne rgy, E nv iron . R eports - 8 ,000 x 10 .0% 800 10 . C ost E stim a tes - 6 ,000 x 0 .0% - 11 . C ritica l M a te ria l S chedu le - 4 ,000 x 0 .0% - 12 . F ina l D e ta iled C heck - 7 ,000 x 0 .0% - 13 . F ina l C o rrec tions - 6 ,600 x 0 .0% - 14 . P ro jec t M anagem en t - 24 ,000 x 50 .0% 12 ,000
0 - - x -
30
Monitor Schedule and BudgetUse PlanTrax® Data for a Better Picture
Sample Data Company = EV Table dateHazardous Materials Warehouse = Earned Value per % complete on EV Table
Task Completion Schedule =Task not completeFrom Oct 01 05 To May 31 06 Week ending (Saturday date) 2005 2006
EV Date = Jan 31 06Days
Ahead 1-O
ct-0
5
8-O
ct-0
5
15-O
ct-0
5
22-O
ct-0
5
29-O
ct-0
5
5-N
ov-0
5
12-N
ov-0
5
19-N
ov-0
5
26-N
ov-0
5
3-D
ec-0
5
10-D
ec-0
5
17-D
ec-0
5
24-D
ec-0
5
31-D
ec-0
5
7-Ja
n-06
14-J
an-0
6
21-J
an-0
6
28-J
an-0
6
Task Description EV % (Behind) 1 2 3 4 5 6 7 8 9 10 11 12 13 14 15 16 17 18A. Preliminary Design Review 100% -
0 0% - B. Final Design Phase 0% - 1. Floor Plans 70% (18) 2. Site Plan 80% (11) 3. Architectural Drawings 10% (24) 4. Structural Drawings 0% - 5. Civil/Site Drawings 0% - 6. Mechanical Drawings 0% - 7. Electrical Drawings 0% - 8. Construction Specs 0% - 9. Energy, Environ. Reports 10% 35 10. Cost Estimates 0% (30) 11. Critical Material Schedule 0% - 12. Final Detailed Check 0% - 13. Final Corrections 0% - 14. Project Management 50% (1)
31-Jan-06Print Sheet

31
STATUS OF DELIVERABLESAND HIGH RISK ISSUES
31
Deliverables/Milestones Due Date Actual DatePreliminary Design Submittal Feb 28 Feb 28Approved Preliminary Design March 2 March 14Design Development Submittal April 2 April 28Working Drawings Submittal June 1590% Review Set Submittal July 15Issue for Bids Sept 1Award Construction Dec 31
Potential Problems Mitigation Measures Status1. Delays in obtaining
easements Update approval status every 2
weeksSally is tracking this
2. Conflicts with existing utilities may delay construction
Pot hole congested areas Use unit prices in bid Include allowances for utility
relocation
Pot hole contract awarded to ABC Surveyors
3. Old pipelines may not withstand extra pressure
Smoke test existing lines Repair crews on 24-hour notice
during hydro-testing
No action yet
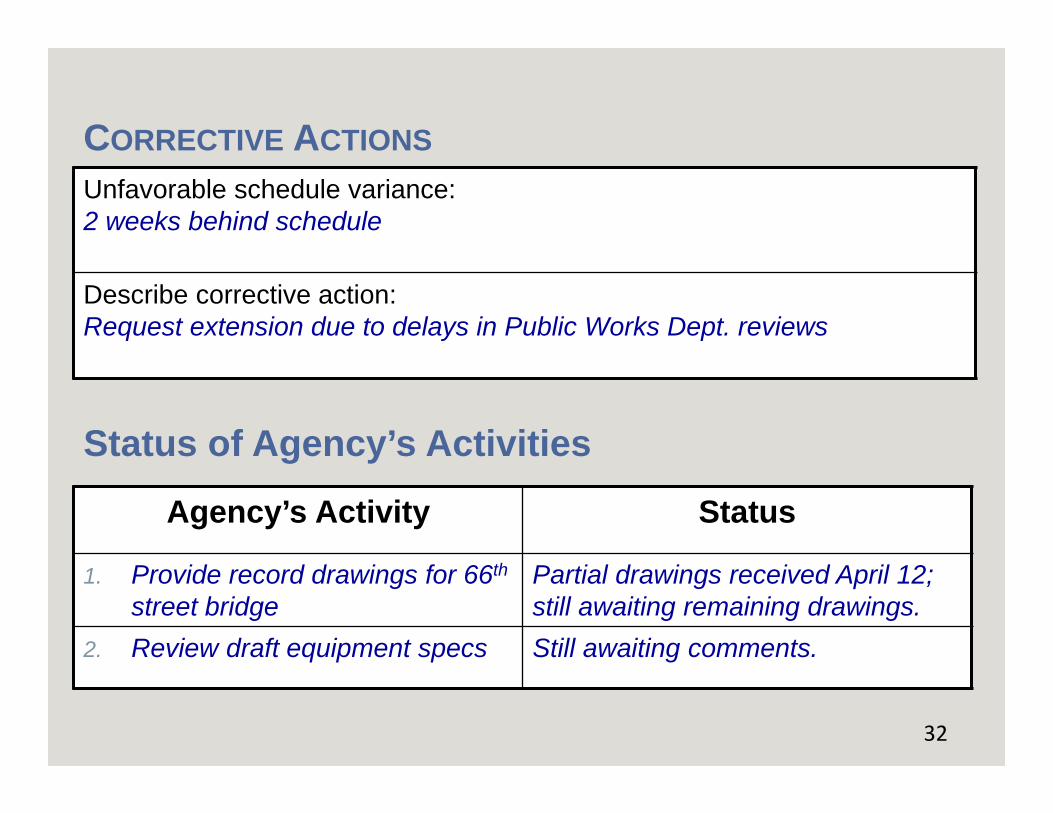
Unfavorable schedule variance:2 weeks behind schedule
Describe corrective action:Request extension due to delays in Public Works Dept. reviews
CORRECTIVE ACTIONS
32
Status of Agency’s Activities
Agency’s Activity Status
1. Provide record drawings for 66th
street bridgePartial drawings received April 12; still awaiting remaining drawings.
2. Review draft equipment specs Still awaiting comments.

QUALITY CONTROL
33
Documents Reviewer(s)Planned Review
Date
Actual Review
DatePreliminary Design Submittal Chung Feb 10 Feb 14
Design Development Chung, Sawyer
March 15 March 31
Working Drawings Chung, Sawyer,
Hernandez
June 1
Plan-in-Hand Field Review Chung July 1
Plan Review Comment Sheet Are the necessary reviews complete? Have the comments been incorporated?

34
BILLING STATUS
Invoiced to date = $20,876 Date of most recent billing 4/14 Billed through what date? 3/30 Work in process (current unbilled) = $10,301 Accounts receivable
Over 90 days =
Over 60 days =
Over 30 days =
Current =
$0
$0
$7,344
$3,230

35
STATUS OF PENDING SCOPE CHANGES ANDPREVIOUS ACTION ITEMS
Pending Scope Change Status1. Add landscaping plan Consultant is estimating costs; will submit
next week.
2. Change to variable speed pumps
Consultant’s proposal submitted; awaiting Agency’s approval to proceed with change.
Action Item Status1. Write letter to Public Works Dept.
requesting plan approvalConsultant sent to client on April 24
2. Submit topo to Agency’s PM for review
Will be done May 12
Other Issues and Concerns:Need to get faster turnaround of Public Works Dept. reviewsConsultant is increasing staff of senior designersRequest for time extension needs to be expedited
36
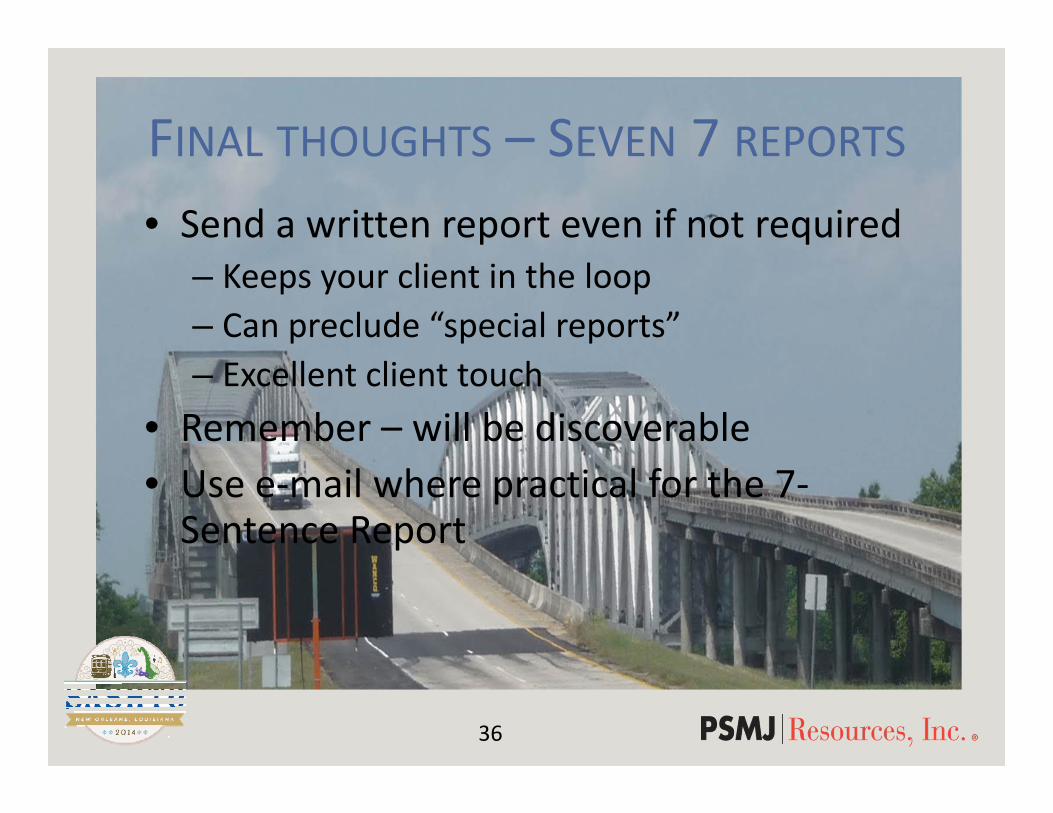
FINAL THOUGHTS – SEVEN 7 REPORTS• Send a written report even if not required
– Keeps your client in the loop– Can preclude “special reports”– Excellent client touch
• Remember – will be discoverable • Use e‐mail where practical for the 7‐Sentence Report

37
7. PREPARE RISK AND CHANGEMANAGEMENT PLANS
Rule 1: Change is inevitable – even on the simplest of projects.
Rule 2: If you are not aware of the project risks, you are setting yourself up for failure

38
MANAGING CHANGE“Change is inevitable, the trick is to discover it early (then manage it)!”

39
THE EARLIER IN THE PROJECT CHANGE ISRECOGNIZED, THE EASIER AND CHEAPER IT IS
TO MANAGE
Cos
t of t
he C
hang
e
OCCUPANCY
SCHEMATIC DESIGN
DETAILED DESIGN BID &
AWARDCONSTRUCTION
Time
40
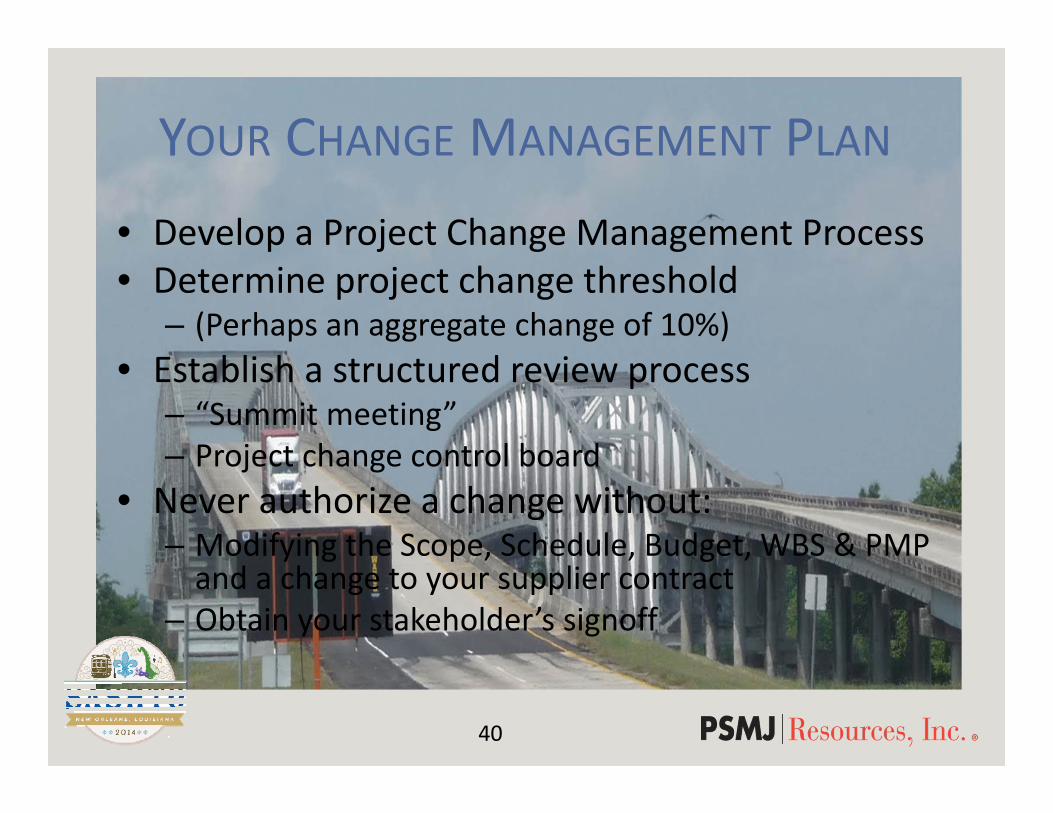
YOUR CHANGE MANAGEMENT PLAN• Develop a Project Change Management Process• Determine project change threshold
– (Perhaps an aggregate change of 10%)• Establish a structured review process
– “Summit meeting”– Project change control board
• Never authorize a change without:– Modifying the Scope, Schedule, Budget, WBS & PMP and a change to your supplier contract
– Obtain your stakeholder’s signoff

Change Management Process
Negative
Positive
Unacceptable
Acceptable
NO
NOAPPROVED
Request for Change
Project Manager Logs Does Initial Review
Impacts on Budget and Schedule
Is Request Appropriate?
Approve Change
Decline Change
YES
PM/Management Review
Impacts on Critical Success Factors and
Risk Analysis
Decline Change
! "#$%&' #( ) %*+, #%‐ . . /" , +0%
‐ 1&' " /2&3%
! "#$%&'( ! ( '
! "#$%&') "*+,‐ . +'
/0) 1213/'
42
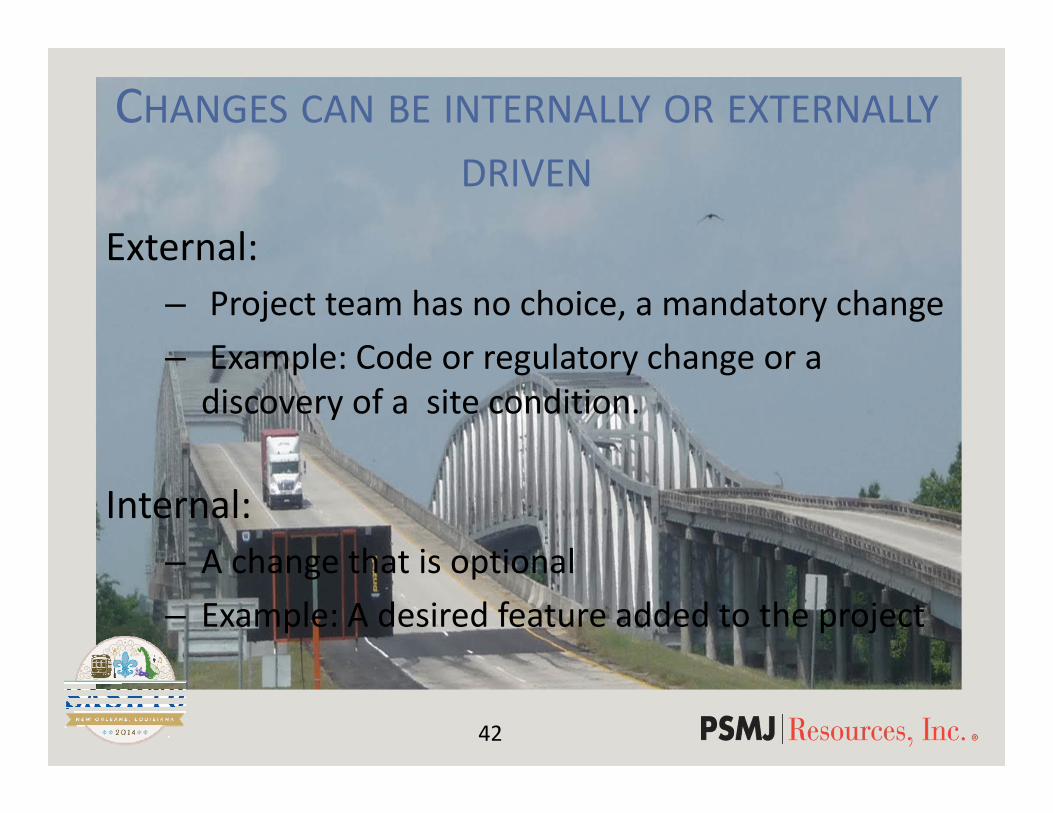
CHANGES CAN BE INTERNALLY OR EXTERNALLYDRIVEN
External: – Project team has no choice, a mandatory change – Example: Code or regulatory change or a discovery of a site condition.
Internal: – A change that is optional – Example: A desired feature added to the project

43
RECOGNIZE THE CAUSES OF CHANGE
• Changes in IT requirements• Changes in codes• Security concerns• Adjacency (land use, tenants, etc.)• Stakeholder needs/wants change• Underground conditions• Environmental and permitting changes• Political / Public Acceptance• Change in key personnel• Loss of Key Sponsor• Beware the “good idea fairy”

44
PUTTING CHANGE MANAGEMENT TOGETHER
• Develop and disseminate a project charter– Jointly developed with
the client and signed off• Develop a project change
process• Develop risk and quality
management plans• Do not short change the
underground investigation.
• Get to know the stakeholders– identify the decision makers
• Educate your client about the effects of change
• Hold periodic design reviews and consultation with the client
• Regular project communications
• Conduct a proactive public outreach program

45
EVALUATING PROJECT CHANGES• Mandatory/External or Optional/Internal?• Impact on Critical Success Factors?• Impact on Project Risk?• Who has approval authority?• Cost within budget contingency?• Schedule Impacts?• Potential impacts on stakeholders and interest groups.

46
6. DON’T RELY ON SOFTWARE
Software is a toolKeep it simple and user/reader friendly

47
IF YOU’RE NOT AWARE OF THEPOTENTIAL RISKS…
Construction will be in heavy traffic area.
Project adjacent to railroad Neighborhood may not
support without extensive landscaping.
Budget is extremely limited

48
RISK MANAGEMENT PLAN
What Risks May Affect Our Critical Success Factors?
What Are the Potential Impacts of These Risks?
What Can We Do to Eliminate These Risks?
What Can We Do to Mitigate These
Risks?
1. Delays in obtaining easements and ROWs
Delay completion date
Update approval status of each parcel every week
Contact owners as soon as delays are anticipated
2. Conflicts with existing utilities
Delay construction Increase traffic
disruptions Increase costs
Pothole congested areas
Use unit prices in bid
Include allowances for utility relocation
3. Multiple agencies in review cycle, some don’t get along well
Schedule delays Conflicting
comments during review
Agency “agendas”
Partnering session at project outset.
Establish hierarchy of review authority
Example: Design and construction of a new urban interchange.
49
Questions?

50
WHERE DO WE GO FROM HERE?
• Review your own agency’s record– Construction Cost Growth– Schedule performance
• Do a root cause analysis• Start to implement some of these best practices.

51
HOW WE CAN HELP
• Training• Consulting and analysis

52
FOR MORE INFORMATION
• Michael S. Ellegood, PE: [email protected]
• Julia Ellegood: [email protected]