the state of the workforce - south carolinalmi.dew.sc.gov/lmi...
TRANSCRIPT


The State of the Workforce report is published by the Labor Market
Information (LMI) Division of the South Carolina Department of
Employment and Workforce. The information and analysis provided
in this publication is based on data collected from many sources
throughout South Carolina and the nation, including the U.S. Census
Bureau and the U.S. Bureau of Labor Statistics. The LMI Division
produced this report under the leadership of:
Executive Director Abraham J. Turner
Assistant Executive Director Dennis King
Deputy Assistant Executive Director Michelle Paczynski
Labor Market Information Director Brenda Lisbon
South Carolina Department of Employment and Workforce
1550 Gadsden Street
Columbia, South Carolina 29201
(803) 737-2400
dew.sc.gov
scworkforceinfo.com


State of the Workforce Report
2012
Table of Contents
Page
Executive Summary ...................................................................................................................... ii
South Carolina’s Workforce Challenges ...................................................................................... iii
Introduction ................................................................................................................................... 1
I. Economic Discussion
South Carolina’s Economic Make-up .................................................................................... 2
Present Status of South Carolina’s Economy ......................................................................... 5
Future Trends of South Carolina’s Economy ......................................................................... 7
Occupational Distribution ................................................................................... 9
Occupational and Industry Projections ............................................................. 10
Economic Health .................................................................................................................. 13
II. Supply
Population ............................................................................................................................. 14
Labor Force .......................................................................................................................... 16
Employment and Unemployment ......................................................................................... 18
Education .............................................................................................................................. 21
Supply Findings .................................................................................................................... 23
III. Demand
Industry Trends ..................................................................................................................... 24
Construction and Manufacturing Sector ........................................................... 26
Healthcare and Education Service Sector ......................................................... 27
Professional and Business Service Sector ......................................................... 27
Occupational Trends ............................................................................................................. 28
Education .............................................................................................................................. 30
Demand Findings ................................................................................................................. 34
IV. Challenges
Education and Skills ............................................................................................................. 35
V. Conclusion .................................................................................................................................. 41
Final Thoughts ...................................................................................................................... 44
i


As the economy in South Carolina recovers from the recession, it is important to examine the current
state of our workforce. The economic turmoil of the last several years has had a profound impact on
the labor market, and understanding these effects can give us a glimpse into the future needs of
businesses and workers.
Like most states, South Carolina has had a slow recovery.
South Carolina has a growing population.
Employers want workers with more education and training, hard skills (industry specific
knowledge) and soft skills (teamwork and professional behavior).
Enrollment in education and training programs is on the rise.
Recent progress in the Manufacturing and Distribution industries offers a glimpse into South
Carolina’s promising future.
South Carolina’s major industries include Manufacturing, Professional and Business Services,
Tourism and Hospitality, and Retail Trade. The Construction industry has suffered greatly during the
recession and continues to struggle. Several industries have made modest gains, especially the
Healthcare sector.
South Carolina’s population grew from 2000 to 2010. Further growth is anticipated, although at a
smaller rate. This will also increase the size of the state’s labor force, which will help employers.
Enrollment in colleges, universities, and technical schools continues to rise. This is a positive trend
and bodes well for the future workforce. Employers want workers with more skills and education.
Workers recognize that in order to have a good job, especially in a tough job market, they must have
more skills. Jobs requiring middle skills (more than a high school diploma but less than a four-year
degree) make up half of the jobs in South Carolina. This proportion is expected to remain large.
South Carolina can become more competitive by further training and educating the workforce. This
will make it easier for businesses to find talent among the population.
South Carolina is well-positioned to provide a highly-trained and educated workforce to compete in
future national and international economies. We recommend that the best way to be prepared for the
future economy is to have a highly trained workforce. This benefits both businesses and workers.
The goal of The State of the Workforce report is to understand and assess South Carolina’s readiness
to meet current and future workforce challenges. It is intended to provide workforce intelligence and
guidance for policy creators, researchers, and other interested parties.
Executive Summary
ii
As South Carolina is making great strides in economic growth, the demand for workforce services is
also growing. In addition, the older workforce is increasing, bringing more attention to the challenges
of that group. One challenge is providing effective retraining to people who have been out of school
for a long time.
A significant number of South Carolinians have been unemployed for a long period and lack a high
school education. Many of those are in their prime working ages. While recovery will bring job
opportunities to some of these people, experience shows that many jobs lost during the recession will
not come back. Meeting the needs of the long-term unemployed who lack adequate education and
training will be a special challenge. Specifically, we must increase the rate of GED attainment and
then provide effective training for that group.
We are in recovery, so we are gaining jobs and will continue to do so. But the issue is how many and
what kind of jobs. The number and types of job opportunities will continue to be affected to some
degree by technology (e.g. use of self-checkout scanners in retail). Demand for healthcare will rise
further, but so will budget pressures, along with the uncertain course of healthcare reform. Contract
and temporary employment services account for an increasing number of jobs. Manufacturing needs
fewer but more-skilled workers. The number of smaller businesses is growing. They account for many
job opportunities but lack the workforce development resources of larger businesses for things such as
recruiting and training.
Growth will not be uniform across the state, meaning gains in job opportunities and impacts on
service demand will be uneven. The ongoing cycle of job and population loss in many of our smaller,
rural areas is a longstanding critical issue for South Carolina.
Our state has many higher-paying jobs that do not require a higher-level education. Those
opportunities will increase. A key challenge is preparing enough workers to take advantage of those
middle-skill opportunities. Indicators point to potential shortages of workers at that level. We have
enough workers to meet those needs, but will need to get their skills up to the necessary levels.
Existing education and training resources to serve this population must be improved through, through
an increased use of alternative education and training methods such as virtual learning and
apprenticeships.
Research shows that employers categorize new entrants to the workforce as “deficient” in four
important soft skills (professionalism/work ethic, oral and written communication, teamwork/
collaboration, critical thinking/problem solving). There needs to be more collaboration with high
schools, adult education, and/or technical colleges to leverage resources to provide soft-skills training.
South Carolina’s Workforce Challenges
iii

Introduction
For South Carolina and the workforce system, this has been a year of transition and renewed
commitment to ensuring that every investment and program strengthens our workforce and economy.
The state has focused on promoting job growth to help unemployed South Carolinians return to work.
Our state’s workforce investment system continued to develop and improve ways of helping
jobseekers find employment and businesses stay competitive in today’s economy.
The economic changes we saw this year remind us that, as a workforce system, we must adapt and
evolve to meet the needs of employers and employees. Cultivating an understanding of the workforce
allows us to respond to anticipated future needs. Analysis helps to identify the gap between what the
workforce has in the way of talent and skills (supply) and what it may need in the future (demand).
The purpose of the State of the Workforce report is to present a comprehensive view of the status of
South Carolina’s workforce and economy. The Labor Market Information (LMI) Division compiles
and publishes employment statistics, job forecasts, wage data, demographics and other labor market
information to help public and private organizations better understand today’s complex workforce.
The following report includes an analysis of South Carolina’s workforce, industries, economic
climate, and factors that will affect all three. Forecasts will be made for the workforce, industries, and
the economy. The report will start with an economic discussion and then move to an investigation of
South Carolina’s workforce supply and demand. The report will finish with a conclusion and a look at
workforce challenges.
1

Economic Discussion
South Carolina’s Economic Make-up
It is important to know where we’ve been and understand the swing of the modern economic
pendulum. From 1970 to 1989, South Carolina experienced economic growth similar to other Sunbelt
states. Low tax rates and a large nonunion workforce have attracted many firms from other states as
well as foreign countries. In the 1990s, job losses from the closing of naval facilities in Charleston
were largely offset by private undertakings; additionally, the Greenville-Spartanburg area in the
northwest has rapidly become a home to new industries.
In the 21st century, South Carolina has continued to attract new businesses by having a low corporate
income tax rate and other tax incentives. During the economic downturn in the late 2000s, South
Carolina's unemployment rate peaked at 12.0 percent in December 2009. Most industries were hit
hard, especially the construction sector. The business climate has been improving, and the
unemployment rate was 8.3 percent as of November 2012.
Many large companies (Amazon, Boeing, Google, Michelin, and Continental Tire, per Department of
Commerce) have moved operations to the Palmetto State and discovered the benefits of expanding
their businesses here. South Carolina also benefits from foreign investment, and there are many
foreign-owned firms operating in the state that employ thousands of workers. South Carolina is
recognized as one of the top business-friendly states in America (ranked 7 in 2012) and is committed
to helping businesses thrive.1 South Carolina offers solid infrastructure with direct access to airports,
railroads, waterways, highways, and provides a hospitable economic environment for a wide variety
of businesses. The state’s population has increased over the last 10 years as opportunities draw talent
from across the country.2
South Carolina's Manufacturing industries have historically depended on the state's agricultural
products as well as on water power. The Textile and Clothing industry in the Piedmont area is based
on the region's cotton crop; lumber and related enterprises (such as the manufacture of pulp and
paper) rely on the 12.5 million acres of forestland that cover the state. Other leading manufacturing
products are chemicals, machinery, and automobiles. South Carolina's mineral resources have been
important in the state's economy and include gold, stone, clays, and sand and gravel.
Our state’s natural resources are used in many ways to promote industry. Agriculture products
include tobacco, soybeans, cotton, peanuts, tomatoes, pecans, sweet potatoes, and peaches.3 The
livestock industry includes chickens, turkeys, cattle, and pigs. Fishing is a major commercial
enterprise involving shrimp, blue crabs, and mostly saltwater fish.
All branches of the military are represented in South Carolina. Military bases for the Navy, Marines,
Army, and Air Force are located throughout the state. With seven nuclear plants providing power and
two more being built, the nuclear industry provides stability and high-income for workers. The
tourism industry also ranks as a large source of income for the state, including our beaches in the
summer months and the Appalachian Mountains in the fall.
2
The words “recession” and “recovery” have dominated news headlines for several years now.
Unemployment rose dramatically during the Great Recession. South Carolina’s unemployment has
been slowly declining over this past year; however, recent months have seen fluctuating rates. A
portion of this rise can be attributed to normal and known seasonal effects. Tepid demand for goods
has hindered growth, and economic uncertainty is still the driving factor behind slow hiring.
Although there have been improvements in almost every major economic metric over the last few
years, the state and nation have not returned to pre-recession levels of employment or growth. In
addition to business uncertainty, the lingering European debt crisis has also suppressed exports and
financial markets which have limited the economic recovery worldwide.
Here in America, the recession and recovery have been unique events from the start. The real estate
industry, banking industry, ratings agencies, and a host of other parties were so connected that the
large decline hurt them all. Historically, many recoveries are started and sustained by the strength of
the housing market. The strained current housing market has had a slowdown of construction and a
surplus of foreclosed and distressed properties. It may not be able to provide much help during the
recovery. Additionally, exports have taken a hit as Europe deals with austerity and Asian markets
struggle with lowering global demand for consumption and services. A recovery is underway and still
in progress. While South Carolina still suffers the lingering effect of the recession, there is reason for
optimism. Our state is doing better than in the past few years; positive, though slow, economic growth
is expected.
Because the recession was caused by the bursting of the United States housing bubble, the
Construction sector was hit hardest, followed by Mining and Manufacturing. By 2010, when South
Carolina employment hit bottom, employment in the Construction sector lost 45,065 or 36.1 percent,
while Mining lost 255 or 18.1 percent, and Manufacturing lost 41,648 or 16.7 percent. Meanwhile
Agriculture, Forestry, Fishing and Hunting; Real Estate and Rental and Leasing; Transportation, Post
Office and Warehousing; and Wholesale Trade all suffered double digit percentage point employment
losses.
Coming out of every major recession, the economy typically experiences two things: growing itself
into a bigger economic market and re-proportioning industry sectors within the market. By re-
proportioning, businesses achieve higher efficiency in meeting new demands. By studying how the
economy is re-proportioning, knowledge can be obtained to help the workforce adjust and improve to
meet the new needs of the economy.
3

South Carolina Industry Sector Proportion Changes 2007 – 2010 5
Industry Sector 2007 Industry
Proportion
2010 Industry
Proportion
2007-2010 Proportion
Change
Healthcare and Social Assistance 10.5% 12.0% 1.5%
Educational Services 8.2% 8.9% 0.7%
Government, Excluding Post Office,
Education and Hospitals 6.7% 7.3% 0.6%
Professional, Scientific, Technical
Services 3.7% 4.1% 0.4%
Accommodation and Food Services 9.7% 9.9% 0.2%
Other Services 4.9% 5.1% 0.2%
Finance and Insurance 3.5% 3.6% 0.1%
Utilities 0.6% 0.7% 0.1%
Agriculture, Forestry, Fishing and
Hunting 1.7% 1.7% 0.0%
Retail Trade 12.3% 12.3% 0.0%
Management of Companies and
Enterprises 0.8% 0.8% 0.0%
Mining 0.1% 0.1% 0.0%
Information 1.4% 1.4% 0.0%
Administrative and Support and
Waste Management and
Remediation Services 7.0% 7.0% 0.0%
Arts, Entertainment, Recreation 1.4% 1.4% 0.0%
Wholesale Trade 3.6% 3.5% -0.1%
Real Estate and Rental and Leasing 1.5% 1.4% -0.1%
Transportation and Warehousing 3.2% 3.0% -0.2%
Manufacturing 12.8% 11.4% -1.4%
Construction 6.4% 4.4% -2.0%
As the below table shows, the most significant proportion changes from 2007 to 2010 occurred in the
Manufacturing and Construction industries. Before the recession, Manufacturing’s proportion was
12.8 percent of the employment and by 2010, it declined to 11.4 percent.
The next significant change occurred in the Healthcare and Social Assistance industry where its
proportion increased from a pre-recession level of 10.5 percent to 12.0 percent in 2010. The third
significant change happened in Construction where the proportion dropped from 6.4 percent in 2007
to 4.4 percent in 2010.
4

Present Status of South Carolina’s Economy
Entering 2012, the South Carolina economy has shown signs of steady growth as indicated by the
South Carolina Leading Index (SCLI).
Having several varied inputs into the SCLI gives us a better overall picture of our economic health
than just one metric. The SCLI was constructed in an effort to monitor and forecast the state’s
economy. When the recession ended in June 2009, the SCLI kept a mostly upward trend for eight
months, moving above the 12 month average. Then it gave back most of its gains and moved slightly
below its 12 month average from June 2010 to January 2011 before beginning another upward
movement for five months. From July 2011 to January 2012, the index moved downward slightly and
then held around its 12 month average before it rose sharply in February 2012. From July 2009 to
February 2012, the index rose 1.2 points or 1.5 percent. In February, the SCLI jumped 0.3 points to
end February at 100.4, a level not seen since June 2011. The SCLI’s February climb represented an
across-the-board improvement of all the index components. The number of the initial Unemployment
Insurance claims and building permits for new privately owned housing had the most improvement, a
36.5 percent decline and a more than 20.0 percent rise, respectively. Meanwhile, the number of
building permit units was more than 8.7 percent higher and manufacturing average weekly hours
increased to 42 hours. The fact that the index value moved back above its 12 month moving average
indicates continued economic growth for South Carolina for several months. In June and July 2012,
there was a 14.0 percent decline in building permit activity, a 0.7 percent reduction in the average
manufacturing work week, and a 6.0 percent increase in initial Unemployment Insurance claims
brought the SCLI down. While the job situation continues to fluctuate in the short-term, it is slowly
improving over the long-term.
5

South Carolina Payroll Change, June 2012, Year-to-Year Change 4
Viewing payroll changes can give a glimpse into the hiring practices of employers and show the
growth in industries across the state. While the Natural Resources and Mining sectors lead the way in
employment payroll change (technological advances have led to fewer workers needed in these
industries), the impact of the banking crisis and the housing market crash is clearly evident. In the
above graph there are two industries affected by the recent recession: Construction and Financial
Activities. Where there was once strong employment growth, there is now hiring stagnation and tepid
progress. However, there has been some overall improvement in payroll employment since the total
change is positive. The Information Technology and Manufacturing industries are leading the way in
hiring. Education and Health Services industries continue their positive and expected growth as well.
-6
-5
-4
-3
-2
-1
0
1
2
3
4
5
Perce
nt
6

Future Trends of South Carolina’s Economy
Construction Employment, 2010 – 2012 5
The economic downturn of the late 2000s hit the Construction industry most acutely. Firms held on
for several months after the housing bubble burst, but crews didn’t have much work to do as the
recession took hold. There has been an almost three-year decline in hiring for the construction
industry, which has only recently begun to post positive gains.
Several energy and manufacturing plants being built have been announced in South Carolina in the
past two years. Some of the most promising are the two nuclear reactors being built (we currently
have seven plants) and several tire and automotive manufacturing plants. Although constructing a
nuclear power plant is very different from building a house, several skills transfer over such as
concrete pouring, electrical wiring, and maintenance. The building of nuclear plants may provide the
construction industry with stable jobs for at least the next 10 years.
73
74
75
76
77
78
79
80
81
July_10 Oct Jan_11 April July Oct Jan_12 April July
Tho
usan
ds o
f Wo
rkers
7

Professional and Business Services, 2010 - 20125
The Professional and Business Services sector includes a diverse mixture of particpants like
accountants, engineers, and lawyers. Most of these businesses are small to medium sized operations
and require a college degree and other professional credentials. As more South Carolinians are
attending colleges and universities, it is reassuring to know that the Professional and Business
Services sector is hiring and continuing to grow.
Education and Health Services Employment, 2010 - 20125
210
215
220
225
230
235
July October January April July October January April July
2010 2011 2012
Tho
usan
ds o
f Wo
rkers
212
213
214
215
216
217
218
219
220
221
222
Tho
usan
ds o
f Wo
rkers
8
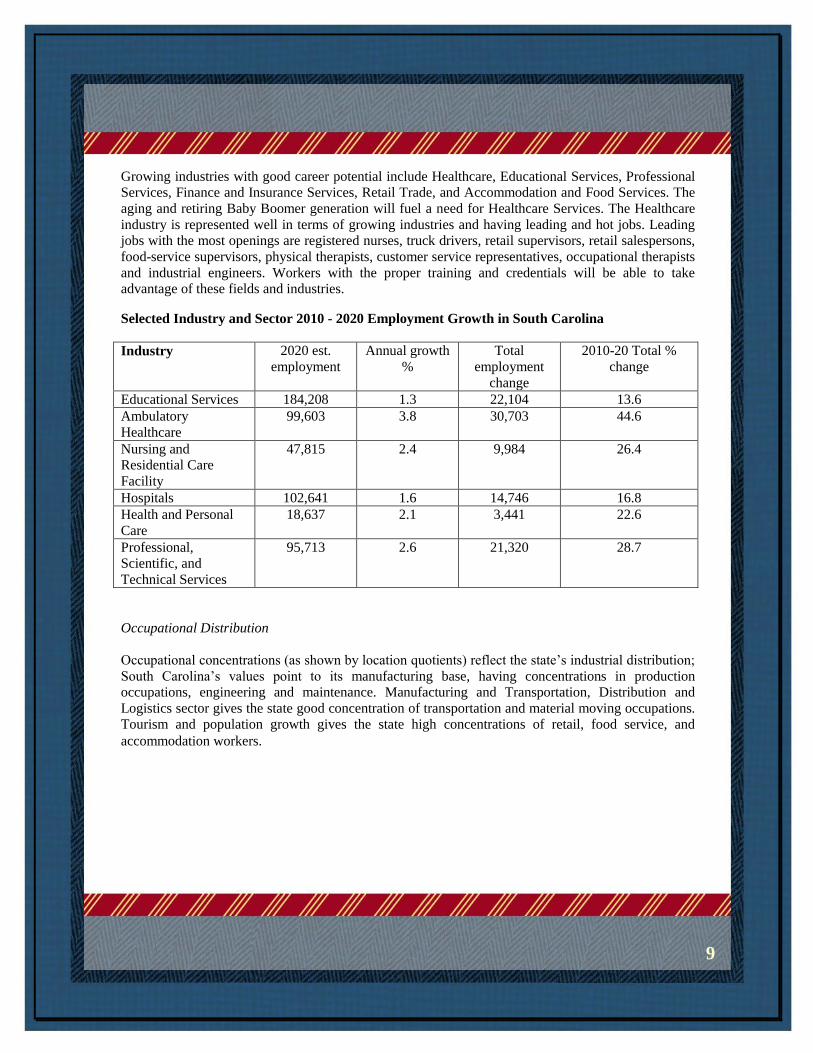
Growing industries with good career potential include Healthcare, Educational Services, Professional
Services, Finance and Insurance Services, Retail Trade, and Accommodation and Food Services. The
aging and retiring Baby Boomer generation will fuel a need for Healthcare Services. The Healthcare
industry is represented well in terms of growing industries and having leading and hot jobs. Leading
jobs with the most openings are registered nurses, truck drivers, retail supervisors, retail salespersons,
food-service supervisors, physical therapists, customer service representatives, occupational therapists
and industrial engineers. Workers with the proper training and credentials will be able to take
advantage of these fields and industries.
Selected Industry and Sector 2010 - 2020 Employment Growth in South Carolina
Industry 2020 est.
employment
Annual growth
%
Total
employment
change
2010-20 Total %
change
Educational Services 184,208 1.3 22,104 13.6
Ambulatory
Healthcare
99,603 3.8 30,703 44.6
Nursing and
Residential Care
Facility
47,815 2.4 9,984 26.4
Hospitals 102,641 1.6 14,746 16.8
Health and Personal
Care
18,637 2.1 3,441 22.6
Professional,
Scientific, and
Technical Services
95,713 2.6 21,320 28.7
Occupational Distribution
Occupational concentrations (as shown by location quotients) reflect the state’s industrial distribution;
South Carolina’s values point to its manufacturing base, having concentrations in production
occupations, engineering and maintenance. Manufacturing and Transportation, Distribution and
Logistics sector gives the state good concentration of transportation and material moving occupations.
Tourism and population growth gives the state high concentrations of retail, food service, and
accommodation workers.
9
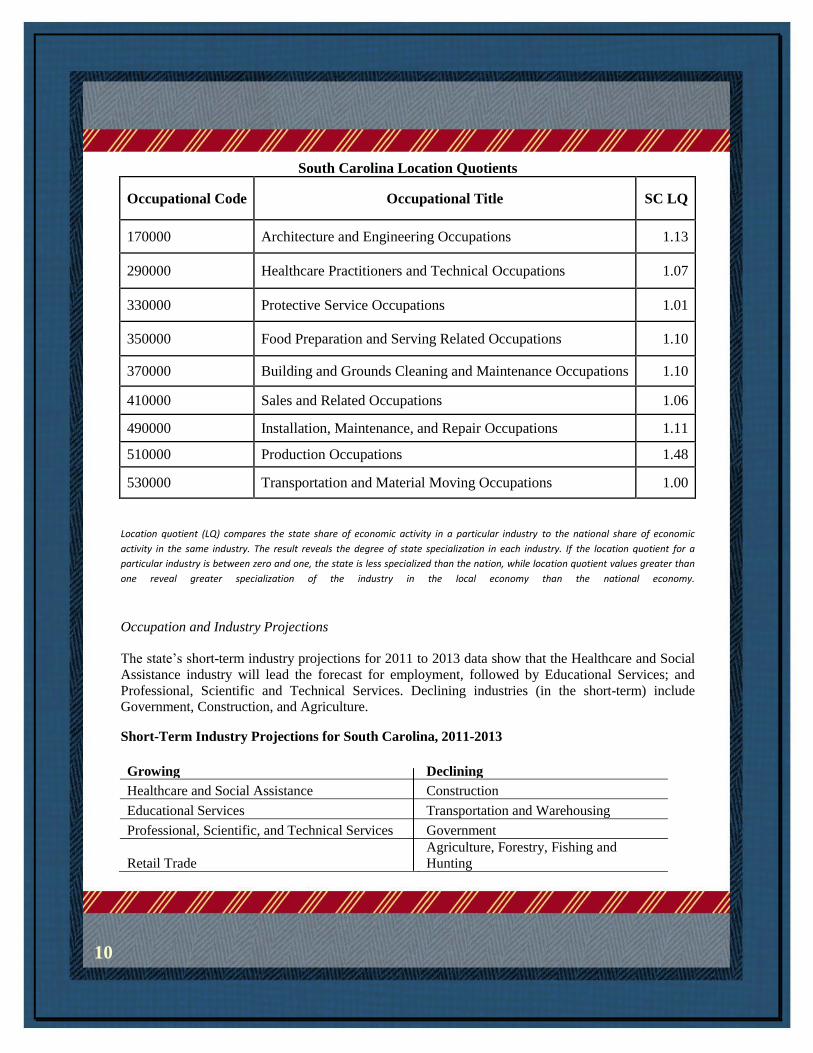
South Carolina Location Quotients
Occupational Code Occupational Title SC LQ
170000 Architecture and Engineering Occupations 1.13
290000 Healthcare Practitioners and Technical Occupations 1.07
330000 Protective Service Occupations 1.01
350000 Food Preparation and Serving Related Occupations 1.10
370000 Building and Grounds Cleaning and Maintenance Occupations 1.10
410000 Sales and Related Occupations 1.06
490000 Installation, Maintenance, and Repair Occupations 1.11
510000 Production Occupations 1.48
530000 Transportation and Material Moving Occupations 1.00
Location quotient (LQ) compares the state share of economic activity in a particular industry to the national share of economic
activity in the same industry. The result reveals the degree of state specialization in each industry. If the location quotient for a
particular industry is between zero and one, the state is less specialized than the nation, while location quotient values greater than
one reveal greater specialization of the industry in the local economy than the national economy.
Occupation and Industry Projections
The state’s short-term industry projections for 2011 to 2013 data show that the Healthcare and Social
Assistance industry will lead the forecast for employment, followed by Educational Services; and
Professional, Scientific and Technical Services. Declining industries (in the short-term) include
Government, Construction, and Agriculture.
Short-Term Industry Projections for South Carolina, 2011-2013
Growing Declining
Healthcare and Social Assistance Construction
Educational Services Transportation and Warehousing
Professional, Scientific, and Technical Services Government
Retail Trade
Agriculture, Forestry, Fishing and
Hunting
10

In the long-term (2010 to 2020), many of the same industries are projected to change. Forecasted to
grow are Healthcare and Social Assistance; Retail Trade; and Accommodation and Food Services.
Manufacturing, Agriculture, and Government are estimated to decline.
Long-Term Industry Projections for South Carolina 2010 - 2020
Growing Declining
Healthcare and Social Assistance Manufacturing
Construction Transportation and Warehousing
Accommodation and Food Services Government
Retail Trade Agriculture, Forestry, Fishing and Hunting
Note: Professional, Scientific, and Technical Services includes services related to accounting, legal,
architectural, engineering, design, computer design, consulting, scientific, and advertising.
The projections reflect an aging population through increases in healthcare, while declines are
possible due to advances in technology and movement of manufacturing.
Of the top 50 projected occupations in South Carolina, nine are in the Office and Administrative
Support group, followed closely by the Healthcare-related group. Also included in the top 50
projected occupations are the Food Preparation and Serving Related group and the Education,
Training, and Library occupational group.
Top 50 Future Jobs in South Carolina by Industry
Group Name # in Top 50
Office and Administrative Support Occupations 9
Healthcare-Related Occupations 8
Food Preparation and Serving Related Occupations 7
Education, Training, and Library Occupations 6
Sales and Related Occupations 5
Business and Financial Operations Occupations 2
Building and Grounds Cleaning and Maintenance Occupations 2
Personal Care and Service Occupations 2
Construction and Extraction Occupations 2
Installation, Maintenance, and Repair Occupations 2
Transportation and Material Moving Occupations 2
Computer and Mathematical Occupations 1
Protective Service Occupations 1
Production Occupations 1
11

Projected declining occupations include many jobs that have been eliminated due to technological
advances (i.e. order clerks) or because of the movement of manufacturing abroad (mainly in textiles).
Declining Occupations in South Carolina, 2008 - 2018
Textile Winding, Twisting, and Drawing Out Machine Setters, Operators, and Tenders
General and Operations Managers
Door-to-Door Sales Workers, News and Street Vendors, and Related Workers
Order and File Clerks
Postal Service Mail Sorters, Processors, and Processing Machine Operators
Shipping, Receiving, and Traffic Clerks
Farm Workers
First-Line Supervisors and Managers of Production and Operating Workers
Cutting, Punching, and Press Machine Setters, Operators, and Tenders
Sewing Machine Operators
Textile Bleaching and Dyeing Machine Operators and Tenders
Extruding and Forming Machine Setters, Operators, and Tenders
Chemical Plant and System Operators
Inspectors, Testers, Sorters, Samplers, and Weighers
Freight Handlers and Stock and Material Laborers
Machine Feeders and Offbearers
Packing and Package Laborers
12

Economic Health
Demand data (online advertised job openings) has consistently shown a high need for healthcare
workers in medical facilities. This is reinforced by the aging population and further industry
projections. The Healthcare industry has occupational demands in both short-term and long-term
forecasts.
Although projected industry employment indicates a potential decline in the Manufacturing industry,
current employment in this sector is healthy. Of the seven industry sectors in South Carolina that
account for almost 70.0 percent of South Carolina’s employment, the top three are Manufacturing,
Accommodation and Food Services, and Educational Services. In addition, job announcements
indicate that the Manufacturing industry is expanding in certain industrial segments such as
automobile and tire manufacturing.
Small businesses have always been the backbone of employment in South Carolina. With the number
of small employers in our state (with 49 employees or less) averaging over 105,000 in the fourth
quarter of 2011, “mom and pop” businesses will make a large difference in the state’s recovery. Since
the federal Small Business Jobs Act was signed into law in 2010, lending for small businesses has
increased in our state by $50.5 million.
These firms serve as a beacon of opportunity for the jobless. They also allow workers to enter new
industries and fields. The impact of small businesses on hiring has grown since the new millennium.
Small businesses now hire about 46 percent of total employed workers; this trend is expected to
continue to rise slowly.
13
Supply
Population
South Carolina experienced an above-average growth rate in population from 2000 to 2010 of 15.3
percent, increasing the population to 4,625,364 people in 2010. Only 11 states gained more people
during that time. The state’s growth rate of 15.3 percent over the 2000 to 2010 periods was exceeded
by only nine states.6 State population projections show continued, but slower growth through 2020.
7
South Carolina’s population growth has been affected by a positive net migration into the state. The
growing economy during this time contributed to the influx of people. The largest portion of the influx
includes young adults aged 18-24 years looking for work or education. It is also important to note the
group aged 55 years or over provided 25.4 percent of the net migration, demonstrating the power of
the Palmetto State’s draw for retirees.
South Carolina Interstate Migrants by Age, 2005 - 2008 8
Age Group In-Migration Out-Migration Net Migration % of Net
Migration
% of Total
Population in
Age Group
Under 18 122,500 107,300 15,200 10.5 23.7
18-24 139,800 103,800 35,900 24.8 10.1
25-34 121,400 102,000 19,400 13.4 12.6
35-44 82,000 65,200 16,800 11.6 13.9
45-54 61,600 40,800 20,900 14.4 14.2
55-64 41,900 19,900 21,900 15.1 12.1
Over 65 37,800 22,900 14,900 10.3 13.3
Total 606,900 461,900 145,000 100.0 100.0
South Carolina’s Hispanic population more than doubled from 2000-2010 reaching 235,682 people.
The group now represents about 5.0 percent of the state’s population, and this means a growing need
for services like job placement, language proficiency programs, and legal advisement tailored to the
Hispanic population.
Another significant population group in South Carolina is veterans. The state’s veteran population was
399,403 in 2010, up 1.4 percent from 2005. During that period, the unemployment rate for veterans
rose from 5.6 percent to 10.7 percent.6
Other notable populations are the youth population (less than
20 years) making up 26.4 percent of residents; the largest population group is 40-64 years at 27.0
percent; mostly represented by the Baby Boomer generation.6 This group has a large and important
impact on the healthcare industry.
14

Like the rest of the country, South Carolina has an aging population. For the large Baby Boomer
cohort, many workers are starting to retire. In 2000, the state’s median age was 35.4 years. Ten years
later, it was up to 37.9 years and is projected to be 40.3 years in 2020. More than 25.0 percent of
South Carolina’s population is at least 55 years old. Those 55 years or older grew by 42.6 percent
from 2000 to 2010 and are projected to grow by 30.5 percent from 2010 to 2020.6
While labor force
participation has declined in South Carolina and the United States in recent years, it has increased for
those 55 years or older.5
They remain in the workforce due to financial, social, or other needs.
Meanwhile, there were fewer of those aged 35-44 in South Carolina in 2010 than there were in 2000;
additionally, this number is expected to drop slightly by 2020.6 An aging population will also raise the
demand for the healthcare industry, which has been growing in the Palmetto State. The projected job
demand in 2020 for registered nurses and nursing aides is 53,177 and 25,397, respectively. That is a
growth of 25.6 percent for registered nurses and 25.0 percent for nursing aides.
Along with the aging population, it is important to understand the generational differences between
groups that make up most of our workforce. These groups bring varied life experiences and
expectations to the workforce.
Different
Generations9
Baby Boomers Generation X/Y Y/Millennial
Born 1946-1964 1965-1982 1983-2000
Population Size
Estimate
80 million 51 million 75 million
Events Vietnam War, Civil
Rights, Cold War,
Space program
Latchkey kids, Fall of
the Soviet Union,
Computer use rises,
Challenger disaster
Digital media, 9/11,
Iraq/Afghanistan War,
cell phone use rises,
texting
Education A person’s right A way to make
progress
Very expensive
Percentage of
Workforce Estimate
45 40 10
View of Time at Work Invented the 50-hour
workweek
Project Oriented Flexible workplace and
hours
In most cases, a growing population means a growing labor force and, consequently, continued
pressure to generate more jobs. Population growth will generate more jobs in sectors such as retail; it
will also generate more jobseekers. This means more demand for workforce services. However, that
demand may be mitigated somewhat by declining labor force participation. The state’s labor force
participation rate dropped from 65.7 percent in 2000 to 61.3 percent in 2010.5
Population growth has not been uniform across South Carolina. From 2000 to 2009, 17 counties lost
population, pointing to critical economic and workforce development needs in those areas.6
15

Labor Force
South Carolina Labor Force, 2010 - 20125
The labor force consists of the total number of people in an area that are not institutionalized, are at
least 16 years old, and are either employed or are unemployed but looking for work. South Carolina’s
labor force has fluctuated between 2.09 million and 2.17 million workers in the last several years. This
is due to industry changes, recessionary times, unemployment and other factors. Industries are always
changing and adapting; this is reflected in the labor force fluctuations.
The Manufacturing industry has lost 132,000 jobs since 1990. Construction has lost 52,000 jobs since
the recession started in 2007. While initially a laid off worker might remain unemployed and in the
labor force looking for work, as time progresses, a person may become discouraged by the job market
and stop looking for work. This removes a worker from the labor force. When the job market
improves and the person looks for work again, he is considered to be a member of the labor force. A
recession and the associated high unemployment affect the labor force as people begin to look for
work or stop looking for a job. Workers may also leave the labor force to pursue further education.
Recessionary times cause greater fluctuations in labor force participation due to unemployment and
uncertanity. Since the peak in February 2009, the state’s labor force has lost 15,606 people. 5
2,135,000
2,140,000
2,145,000
2,150,000
2,155,000
2,160,000
2,165,000
July October January April July October January April July
2010 2011 2012
16

Largest Labor Force Changes from 2007 - 2011 5
As people recognize the opportunity for work, they move to centers of commerce. The economic
gravity of some areas pulled workers from less economically vibrant places. Growing metropolitan
areas have attracted workers in the last decade and during the recession. York County is close to
Charlotte, North Carolina, and is gaining commuting workers (3,306) from Chester County due to
its strong Manufacturing, Retail and Wholesale Trade, Healthcare, and Educational industries. As
Charleston County grows, firms and workers are being attracted to surrounding counties for
employment and trade. Two of Charleston County’s neighbors have experienced labor force
growth; Williamsburg County has done well during this time also. Residents of Marion County are
finding employment in Florence and Horry counties. It appears that workers are going where the
jobs are. Abbeville, Marion and Allendale counties had a shrinking workforce from 2000 to 2007,
and Dorchester and Berkeley counties grew during the same time. Many counties have been stuck
in a job-loss rut for many years, while other traditionally prosperous counties continue to do well.
17
Allendale
-5.1%
-
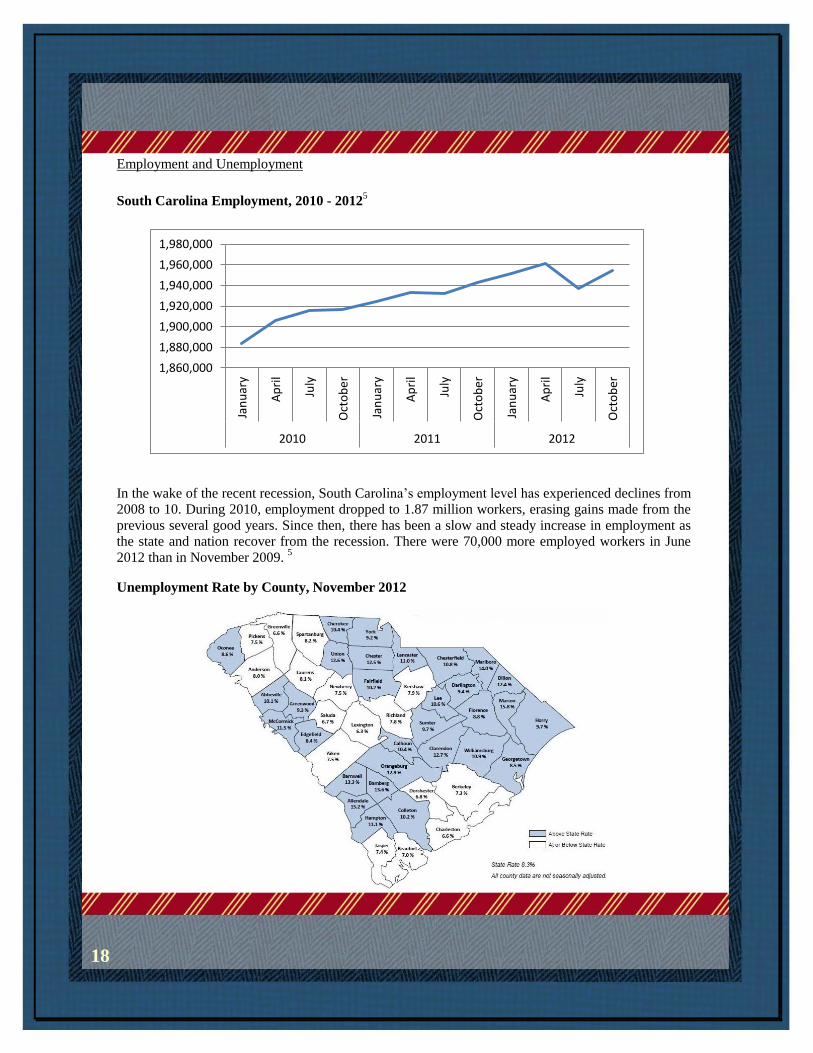
Employment and Unemployment
South Carolina Employment, 2010 - 20125
In the wake of the recent recession, South Carolina’s employment level has experienced declines from
2008 to 10. During 2010, employment dropped to 1.87 million workers, erasing gains made from the
previous several good years. Since then, there has been a slow and steady increase in employment as
the state and nation recover from the recession. There were 70,000 more employed workers in June
2012 than in November 2009. 5
Unemployment Rate by County, November 2012
1,860,000
1,880,000
1,900,000
1,920,000
1,940,000
1,960,000
1,980,000 Ja
nu
ary
Ap
ril
July
Oct
ob
er
Jan
uar
y
Ap
ril
July
Oct
ob
er
Jan
uar
y
Ap
ril
July
Oct
ob
er
2010 2011 2012
18

South Carolina and National Unemployment Rates, 2012 4
South Carolina has had employment gains in the past year. A slowly declining unemployment rate is a
positive but frustrating metric. The national unemployment rate is still lower than the Palmetto State’s
rate. The rate can fluctuate due to changes in the labor force unrelated to the economic growth.
South Carolina Unemployment Rate 2012 5
Month South Carolina United States
November 8.3% 7.7%
October 8.6% 7.9%
September 9.1% 7.8%
August 9.6% 8.1%
July 9.6% 8.3%
June 9.4% 8.2%
May 9.1% 8.2%
April 8.8% 8.1%
March 8.9% 8.2%
February 9.1% 8.3%
January 9.3% 8.3%
There are different types of unemployment. Cyclical unemployment results from normal and periodic
declines in the business cycle (recessions). During a recovery, cyclical unemployment will be reduced
as workers are hired back. Cyclical unemployment usually lags behind the business cycle by several
months as employers tend to hold onto labor in the hope that they might ride out the economic storm.
Frictional unemployment occurs when workers voluntarily leave their job and look for a different one.
It is the time period between jobs when a worker is transitioning from one job to another.
7.0%
7.5%
8.0%
8.5%
9.0%
9.5%
10.0%
South Carolina
United States
19

The most difficult to control is structural unemployment. This type of unemployment occurs when the
basic nature of the economy changes over time such that skills which unemployed workers possess are
no longer demanded by employers. Structural unemployment is involuntary unemployment and
typically requires retraining or education of displaced workers to bring their skills in line with
demand. It results from a mismatch between demand in the labor market and the skills of the workers
seeking employment. While there may be a large number of vacant jobs available, workers may lack
the skills needed to fill them. Job losses that stem from structural changes tend to be permanent. As
industries decline, jobs are eliminated, compelling workers to switch industries, sectors, locations, or
skills in order to find a new job.
Another segment of South Carolina’s current population is the long-term unemployed. Those
unemployed over 26 weeks make up about half of the state’s unemployed population. Long-term
unemployment is often an indicator of significant barriers to employment. From 2005 to 2010, the
largest job losses were suffered by those who did not have a high school diploma or GED. The
Census’ American Community Survey found that most of the people lacking a high school diploma or
GED that are unemployed and have stopped looking for work are in their 30s and 40s.
South Carolina is faced with a significant population of people in their prime working ages who lack
the most basic credential needed for a job and see little or no hope of success in the job market. Long-
term unemployment ultimately reduces the productive capacity of an economy as workers’ skills
become outdated. Unemployment, especially long-term unemployment, is costly for everyone. It
strains public funds due to the payment of unemployment benefits and reduces tax revenue when
individuals are forced to consume less.
Unemployed workers are seeking opportunities and hoping that someone sees their abilities and what
they can contribute to an organization. They are also waiting to start or continue their adult life, with
normal transitions like homeownership, marriage, and family. The average Unemployment Insurance
recipient in South Carolina has a high school diploma, is in his or her 30s, and receives benefits for
14.4 weeks. The main reasons for being unemployed are lack of work or being let go for misconduct;
73.0 percent of recipients are between the ages of 25 to 55 years. This shows that a lack of demand
and a mismatch of skills are large contributors to the unemployment number. It is important to note
that legislation has been passed to eliminate state unemployment benefits for a worker that was fired
for misconduct.
Occupational Distribution
Occupational concentrations (as shown by location quotients) reflect the state’s industrial distribution;
20
Education
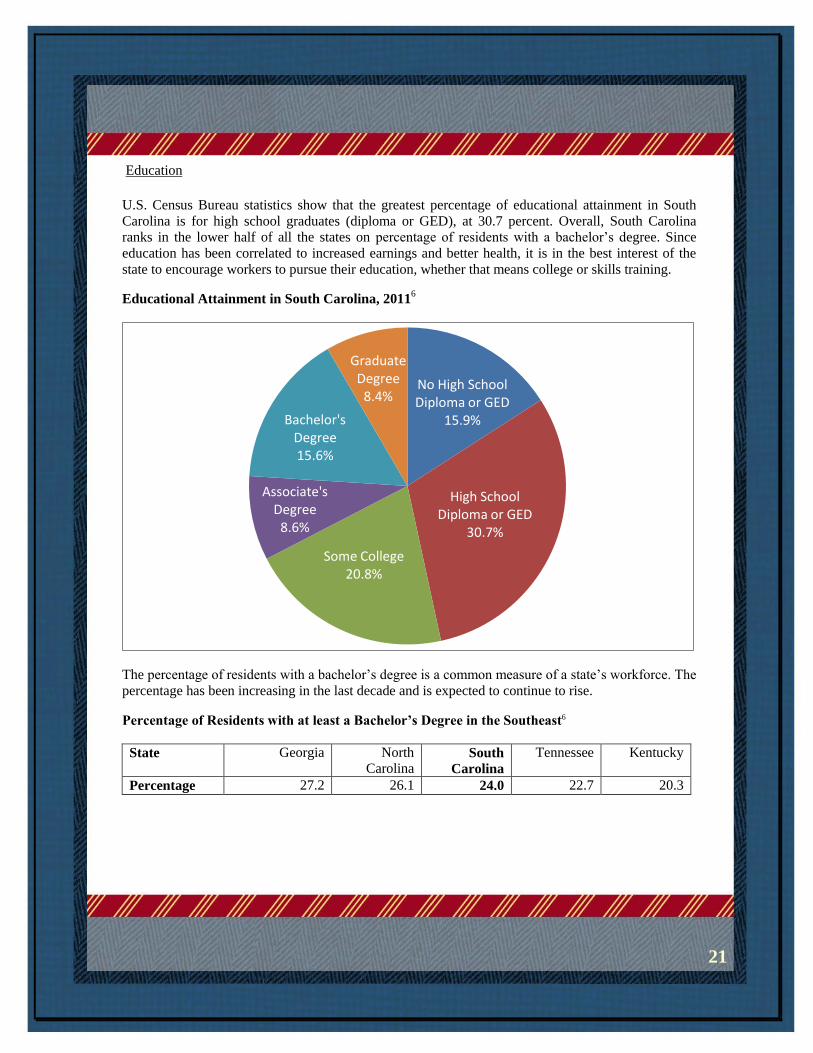
U.S. Census Bureau statistics show that the greatest percentage of educational attainment in South
Carolina is for high school graduates (diploma or GED), at 30.7 percent. Overall, South Carolina
ranks in the lower half of all the states on percentage of residents with a bachelor’s degree. Since
education has been correlated to increased earnings and better health, it is in the best interest of the
state to encourage workers to pursue their education, whether that means college or skills training.
Educational Attainment in South Carolina, 20116
The percentage of residents with a bachelor’s degree is a common measure of a state’s workforce. The
percentage has been increasing in the last decade and is expected to continue to rise.
Percentage of Residents with at least a Bachelor’s Degree in the Southeast6
State Georgia North
Carolina South
Carolina
Tennessee Kentucky
Percentage 27.2 26.1 24.0 22.7 20.3
Bachelor's Degree 15.6%
Associate's Degree
8.6%
Some College 20.8%
Graduate Degree
8.4%
High School Diploma or GED
30.7%
No High School Diploma or GED
15.9%
21

The least educated of the state’s citizens tend to suffer the highest employment losses when the
economy declines. Having an education is a start to becoming recession-proof in the workforce. All
things equal, employers have shown a willingness to hire the more-educated workers versus their less-
educated peers. When an economy shrinks, large firms with low-skill workers may close their doors
permanently or relocate operations. Because the workers are low-skilled, they may be easier to replace
than a highly-trained workforce. The graph below shows that in the economic downturn from 2007 to
2010, educated workers had positive employment growth, while less educated workers were separated
from employment the most. Their jobs were either given to workers with more skills or were lost
altogether.
South Carolina Employment Change by Educational Attainment, 2007 – 2010 5
When comparing the population’s 2010 educational attainment with projected jobs, there are some
concerns:
In both the 18 - 24 years and the 25 years and over groups, there are an abundance of people
with some college or an associate’s degree
Both age segments are below future estimates of needs for workers with a high school
diploma, GED, or some kind of post-secondary/vocational training.
Both age groups also fall below the needs for jobs requiring a bachelor’s degree.
-50
-40
-30
-20
-10
0
10
20
30
less than HS diploma HS grads, no college Some college or associate's degree
Bachelor's or higher
25
or
old
er,
th
ou
s
22

Unemployment claims filed in May 2012 shows that approximately 90.0 percent of recipients have
not earned a bachelor’s degree. Most claimants have no college experience at a critical time when
employers have a rich supply of available labor. This also provides some evidence that the least
educated workers suffer the most during an economic decline.
South Carolina Unemployment Claimants by Educational Attainment, May 2012
Supply Findings
The data show that in order to have the required levels of education for our future workforce, we will
need to increase the number of individuals with a high school diploma/GED/post-secondary
vocational training and increase the number of people with bachelor’s degrees. In addition, our
technical college system has done a good job of training workers; however, there is still a large
amount of students that have attended college or training but have not graduated. In order to get the
state’s workers the middle-skills that they need, we will need to move more individuals from not
having a high school education to getting a high school diploma or GED so they can continue on and
qualify for training related to middle-skill jobs.
188
1,864
7,446
3,526
1,470 1,415
0
1,000
2,000
3,000
4,000
5,000
6,000
7,000
8,000
No High School Some High School
High School Grad
Some College College Graduate
No Data
23

Demand Thanks to its favorable business climate, skilled workforce, transportation infrastructure, and low-cost
power, South Carolina has been a leader in the Southeast and nationwide in recruiting new
manufacturing plants and expanding its industrial base. The impact of manufacturing is immense.
There is the direct impact of local expenditures on wages and purchases that are injected into the
economy. The firms pay local workers and buy local supplies. Indirect impact represents the ripple
effects of spending on in-state suppliers. Suppliers may choose to cluster around a manufacturing
plant, which lowers transportation, carrying, and storage costs. Induced impact is the ripple effect of
expenditures from wages and involves household spending. Restaurants may open up in the area to
meet the worker’s needs. Manufacturing jobs have a high multiplier effect, meaning that for every one
direct manufacturing job, several other jobs are created as well.10
Industry Trends
South Carolina is home to many diverse businesses. The Manufacturing sector provides a wide range
of products including airplanes, automobiles, tires, and electrical components. Power is generated by
nuclear, coal, hydroelectric, and natural gas plants. The Transportation sector is large and has access
to highways, runways, railroads, waterways, and ports. The state’s lakes, mountains, beaches, and
parks contribute to the large Tourism industry.
South Carolina Economy by Industry, 2011
Professional, Scientific, and Technical Services 4.5%
Administrative and Support and Waste Management and Remediation Services 7.6%
Government 6.0%
Educational Services
9.1%
Finance and Insurance 3.7%
Other 9.9% Accommodation
and Food Services 10.4%
Manufacturing 12.1%
Healthcare and Social Services
13.0%
Trade 16.3%
Transportation and Warehousing 3.1%
Construction 4.3%
24

Industries including Manufacturing; Scientific and Technology services; Warehouse and Distribution;
Financial Services, and Healthcare typically provide jobs with higher pay and greater benefits. This
brings in better human capital and workforce development and offers opportunities for advancement
and security. A successful economic base stimulates other business sectors like housing, retail, and
tourism. All of this activity supports a strong local tax base which provides more support for
community services and improves the quality of life.
The future mixture of our economy is unknown, but by using trends and data we can anticipate sector
growth or decline.
Nonfarm Employment by Industry 2011 Percent of total jobs
Agriculture, Forestry, Fishing, Hunting 10,919 0.6
Mining 1,233 0.1
Utilities 17,020 1.0
Construction 76,698 4.3
Manufacturing 215,081 12.1
Trade 291,322 16.3
Transportation and Warehousing 54,703 3.1
Information 27,916 1.6
Finance and Insurance 65,314 3.7
Real Estate 26,366 1.5
Professional and Technical Services 80,697 4.5
Management 15,054 0.8
Administrative and Waste Services 135,058 7.6
Educational Services 162,561 9.1
Healthcare and Social Assistance 231,776 13.0
Arts, Entertainment, Recreation 28,489 1.6
Accommodation and Food Services 185,087 10.4
Other Services 48,506 2.7
Public Administration 106,950 6.0
Total 1,780,750 100.0
The largest sector in terms of employment is Trade, Transportation, and Utilities, which accounts for
over 350,000 jobs. Healthcare is a strong second, and the Manufacturing industry employs 215,081
workers and counting. The Government and Trade, Transportation, and Utilities are projected to add
employment due largely to projected population growth. The anticipated growth will affect the
demand for state and municipal services as well as consumer goods and services.
25

Construction and Manufacturing Sector
While Construction wasn’t in the top five employment sector, it is worth noting the growth potential.
Total annual 2011 employment in Construction was at 75,800 while its 2020 projected growth is over
100,000. This growth may be due to construction of several energy and manufacturing plants. There
are seven nuclear power plants providing at least half of the state’s total power. Two more nuclear
power plants are being built and are anticipated to be operational in 2017.
American-produced nuclear power can boost economic growth and support high-paying jobs that
cannot be shipped overseas. Construction on V.C. Summer units in Jenkinsville is providing 3,000
long-term construction jobs and 800 career-long utility jobs.
A wide variety of medium and long-term jobs will become available as the two new power plants
undergo construction. Construction skills like welding, with specific nuclear industry certifications,
will be required to build the power plant and support systems. Nuclear operators and technicians are
needed to maintain and control power systems. Landscapers, administrative teams, and information
technology professionals are also required to complete important functions. Plants being built and
expanded across the state include Continental Tire, two new V.C. Summer Nuclear Station units,
Michelin Tires, Bridgestone Tires, Boeing, Nephron Pharmaceuticals, and BMW. The growth in
manufacturing plants is increasing the need for construction.
South Carolina has lost many manufacturing jobs over the last 30 years and the recent recession has
accelerated this process. Recent growth in this industry in South Carolina is encouraging. Both foreign
and domestic manufacturing firms located and expanded in South Carolina. “Made in America” is no
longer a manufacturing whisper, but is becoming more of a shout as firms re-shore jobs and avoid
international entanglements, drama, and currency fluctuations.
There is a growing investment in manufacturing. The manufacturing industry is slowly becoming
stronger in South Carolina as plants are being built and staffed in new and existing areas.
26
Healthcare and Education Sector
Healthcare is a growing and important part of the state’s economy. It is needed at every stage of life. It
is a growing and usually recession-proof industry and South Carolina’s aging population will provide
demand for many years.
Industries in the hospitals subsector provide medical, diagnostic, and treatment services to inpatients.
Hospitals may also provide outpatient service as a secondary activity. There were 1,592 online job
openings for hospitals advertised on September 3, 2012.
The average weekly wage for hospital workers in South Carolina in the last quarter of 2011 was
$1,020. This would be equivalent to $25.50 per hour or $53,040 per year, assuming a 40-hour week.
The 2020 long-term projected employment for the hospital industry in South Carolina was 102,641
with a total percentage growth of 16.8 percent.
The nursing and residential care facilities group provides residential care combined with nursing,
supervision, rehabilitation, and other types of required care. There were 436 job openings advertised
online on September 3, 2012. The average wage was $13.10 per hour and $27,248 per year.
Employers are demanding more skilled workers. These skills can be gained on the job or in a
classroom. The workforce trend towards more skills and education is expected to continue, so there
will be education jobs to fill at all levels to train South Carolina citizens.
The Educational sector provides instruction and training in a wide variety of subjects. This sector
includes colleges, universities, primary and secondary schools, and professional schools. As workers
require more training and education, the need for this sector will rise. There were 1,032 online jobs
advertised on September 3, 2012. The average weekly wage was $738, equal to $18.45 per hour or
$38,376 per year.
Professional and Business Services Sector
Industries in the Professional, Scientific, and Technical Services group engage in processes where
human capital is the major input. They make available the knowledge and skills of their employees; a
team or individual is responsible for the delivery of services to the client. Examples include
architectural, engineering, accounting, design, and technical firms. There were 1,754 job openings
advertised online for professional, scientific, and technical services in South Carolina on September 3,
2012. The average weekly wage was $1,299, equal to $32.28 per hour or a $67,548 annual salary
assuming a constant 40-hour work week.
27

Occupational Trends
South Carolina has identified “hot jobs” which meet the following criteria: growth rate of at least 9.0
percent between 2010 and 2020, increase of at least 1,000 jobs, and a minimum average salary of
$37,920. These jobs include school teachers, supervisors, registered nurses, accountants, and sales
agents (insurance, retail, wholesale).
South Carolina Hot Jobs
2020
Employment
Annual
Growth
2010 - 2020
Growth
Estimated Annual
Job Openings
Registered Nurses 53,177 2.3% 25.6% 1,851
Nursing Aides,
Orderlies, Attendants 25,397 2.3% 25.0% 770
Elementary School
Teachers 23,189 1.6% 17.4% 778
Personal care aides 13,303 4.8% 60.2% 566
Self-enrichment
education teachers 3,980 2.2% 24.4% 127
Employment of self-enrichment education teachers is expected to increase over the 2010 to 2020
period by 24.4 percent, which is much faster than the average for all occupations. The need for self-
enrichment teachers is expected to grow as more people embrace lifelong learning and course
offerings expand. The demand for self-enrichment education will also increase as more people seek to
gain or improve skills that will make them more attractive to prospective employers.
Nursing aides, orderlies, and attendants provide basic patient care under direction of nursing staff.
Overall employment of nursing and psychiatric aides is projected 18.0 percent growth between 2010
and 2020, faster than the average for all occupations. Employment for nursing aides, orderlies, and
attendants will grow 25.0 percent predominantly in response to the long-term care needs of an
increasingly elderly population.
Financial pressures on hospitals to discharge patients sooner may boost admissions to nursing care
facilities. As a result, new jobs will be more numerous in nursing and residential care facilities than in
hospitals and growth will be especially strong in community-care facilities for the elderly. Modern
medical technology will also drive demand for nursing aides, because as the technology saves and
extends more lives, it increases the need for long-term care provided by aides. Growth may be
hindered by nursing facilities’ reliance on government funding, which does not increase as fast as the
cost of patient care. Government funding limits the number of nursing aides that facilities can afford
to have on staff.
28

High replacement needs for nursing aides reflect the modest entry requirements, high physical and
emotional demands, and limited opportunities for advancement within the occupation. Many aides
leave the occupation to attend training programs for other healthcare occupations.
Additionally, employment of registered nurses is expected to grow by 25.6 percent between 2010 and
2020; this partly due to an aging population. People over 55 are much more likely than younger
people to need nursing care; many also require long-term care. Many elderly patients want to be
treated at home or in residential care facilities, which will drive demand for registered nurses in those
settings. Job growth also is expected in units that provide specialized long-term rehabilitation for
stroke and head injury patients.
Employment in home healthcare is expected to increase in response to the growing number of persons
over 55 years old with functional disabilities, consumer preference for care in the home, and
technological advances that make it possible to bring increasingly complex treatments into the home.
The type of care demanded will require nurses who are able to perform complex procedures. To
attract and retain qualified nurses, hospitals may offer signing bonuses, family-friendly work
schedules, or subsidized training. In addition, all four advanced practice specialties—clinical nurse
specialists, nurse practitioners, nurse-midwives, and nurse anesthetists—will be in high demand,
particularly in medically underserved areas such as inner cities and rural locations.
Excellent job opportunities are expected for personal care aides because of rapid employment growth
and high replacement needs. This is an excellent example of a profession that is in high demand and
that demand is only expected to grow.
Other leading jobs with the most openings are truck drivers, retail supervisors, retail salespersons,
food-service supervisor, customer service representatives, and industrial engineers.
Education, training, and experience typically make a difference in the type of job and wages a worker
can expect. But not all “good” jobs require a college degree. Jobs with higher wages that don’t require
a four-year degree and that are expected to have a significant number of opportunities over the next
several years are:
Selected Jobs Avg. 2011 Salary Education/Training
Registered Nurse $61,350 Associate’s Degree
Licensed Practical and Vocational
Nurses $38,960 Postsecondary Non-degree Award
Automotive Technician $36,740 Postsecondary Vocational Training
Electrician $40,270 Long-term On-the-Job Training (OJT)
Dental Assistant $32,880 Moderate-term OJT
Truck Driver $36,840 Short-term OJT
29

Education
It is important to understand the educational level of the state’s workforce. Employers need to know if
skilled and educated workers are available to operate their firms. An analysis of the minimum
education levels for the current top 100 occupations in South Carolina shows that 46 percent require a
high school diploma or GED, 26 percent require no diploma, and 17 percent require a bachelor’s
degree. Based on this data, 54 percent of the top 100 jobs are considered middle-skill jobs (HS
diploma/GED/vocational training/some college/associate’s degree), 26 percent are low-skill jobs, and
20 percent are high-skill jobs. During August 2012, 33.2 percent of online job postings required at
least a bachelor’s degree and 24.1 percent required at least a high school diploma.
Educational Level of Top 100 Jobs in South Carolina
The state’s top jobs require middle skills and 74 percent of all top jobs exclude low-skilled labor. This
shows the shift in the last few decades from a low-skilled workforce to a higher-skilled pool of talent.
When 2008 to 2018 top jobs are forecasted, 35 percent are low-skilled, 47 percent are middle-skilled,
and 18 percent are high-skilled.12
Bachelor's Degree 17.0% No High School
Diploma or GED 26.0%
Associate's Degree or Vocational Training
6.0%
Other 5.0%
High School Diploma or GED 46.0%
30

South Carolina Top 100 Jobs by Skill Level
South Carolina Top 100 Jobs by Skill Level, 2011
There is a trend towards workers acquiring more skills to maintain proficiency and competitiveness in
their professions. Workers are expected to become better and more technically accredited. The vast
majority of South Carolina’s projected top jobs require at least a high school diploma/GED (83.0
percent). The labor force has a growing emphasis on middle-and high-skill positions. Low-skill labor
positions tend to be easily taught to a new workforce. This increases the likelihood of a firm moving
to a lower wage area when conditions allow. Many low-skill jobs have been outsourced already or
have been automated by technology and machinery.
Middle-skill jobs require more than a high school diploma, but less than a bachelor’s degree. They
make up the majority of jobs in South Carolina and the United States. Professions with middle skills
include registered nurses, dental hygienists, electrical technicians, auto mechanics, and legal
secretaries. There is an anticipated robust need for middle-skill jobs, which can provide good wages
and career paths. Low-skill workers that participate in training and/or earn a degree will be able to
enter a middle-skill field.
0% 10% 20% 30% 40% 50% 60%
Low-skill
Middle-skill
High-skill
54.0%
26.0%
31
20.0%
31

South Carolina Top 100 Projected Jobs by Skill Level
South Carolina Top 100 Projected Jobs by Skill Level, 2008 - 2018
In addition to “middle-skills” needs, the report “Are They Really Ready to Work?” suggests that the
most important soft skills needed to succeed in the workplace were:
Professionalism and work ethic
Oral and written communication
Teamwork and collaboration
Critical thinking and problem solving
This report was a survey of 400 employers across the United States conducted by a joint consortium
of The Conference Board, Partnership for 21st Century Skills, Corporate Voices for Working Families,
and the Society for Human Resource Management. Hard skills are things learned in school (bachelor’s
degree, welding certificate), while soft skills are difficult to teach and include things like punctuality
and work ethic. The employers reported deficiencies in all four soft skills in the new workers they are
seeing. Over 42.0 percent of the employers rated new entrants to the workforce with a high school
diploma as “deficient” in overall preparation for the entry level jobs that they would normally fill.
0% 10% 20% 30% 40% 50% 60%
Low-skill
Middle-skill
High-skill
17.0%
53.0%
30.0%
32
32
Comparison of Educational Requirements for South Carolina’s Top 100 Jobs 6
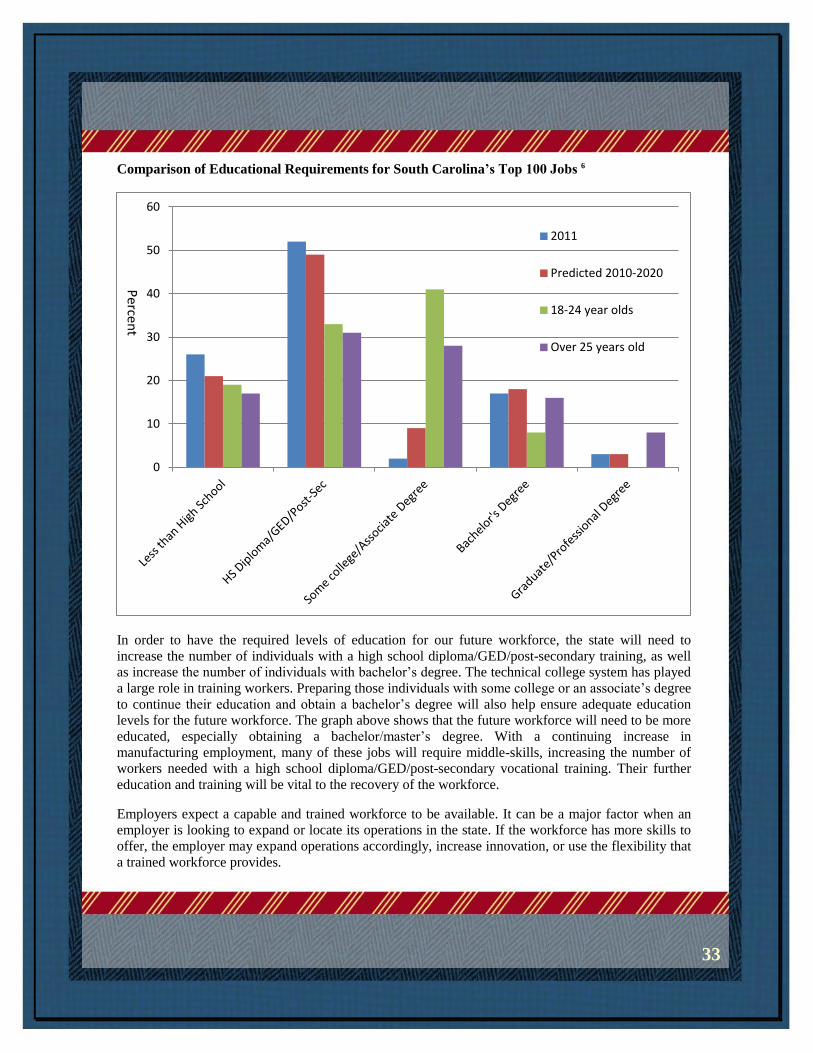
In order to have the required levels of education for our future workforce, the state will need to
increase the number of individuals with a high school diploma/GED/post-secondary training, as well
as increase the number of individuals with bachelor’s degree. The technical college system has played
a large role in training workers. Preparing those individuals with some college or an associate’s degree
to continue their education and obtain a bachelor’s degree will also help ensure adequate education
levels for the future workforce. The graph above shows that the future workforce will need to be more
educated, especially obtaining a bachelor/master’s degree. With a continuing increase in
manufacturing employment, many of these jobs will require middle-skills, increasing the number of
workers needed with a high school diploma/GED/post-secondary vocational training. Their further
education and training will be vital to the recovery of the workforce.
Employers expect a capable and trained workforce to be available. It can be a major factor when an
employer is looking to expand or locate its operations in the state. If the workforce has more skills to
offer, the employer may expand operations accordingly, increase innovation, or use the flexibility that
a trained workforce provides.
0
10
20
30
40
50
60
2011
Predicted 2010-2020
18-24 year olds
Over 25 years old
Perce
nt
33

Demand Findings
The recent recession gave South Carolina’s workforce system a new set of issues to focus on,
including a large loss of jobs that may never be replaced, high unemployment, and stagnating personal
income. A growing skills gap, rapidly advancing technology, globalization, demographic changes, and
educational dilemmas are challenges in the modern workplace. Students and workers understand the
rising demand for education and training and have responded by entering colleges, universities, and
technical schools in record numbers. Employers want a constantly advancing workforce with both
hard and soft skills. This trend is expected to continue, especially during the weak current job market.
34
Education and Skills
Although the recession has been difficult, it presents a unique opportunity for workers to pursue
further education and training. South Carolina has many institutions of learning in which to provide a
skilled workforce. Students are taught at universities, colleges, and technical schools all over the state.
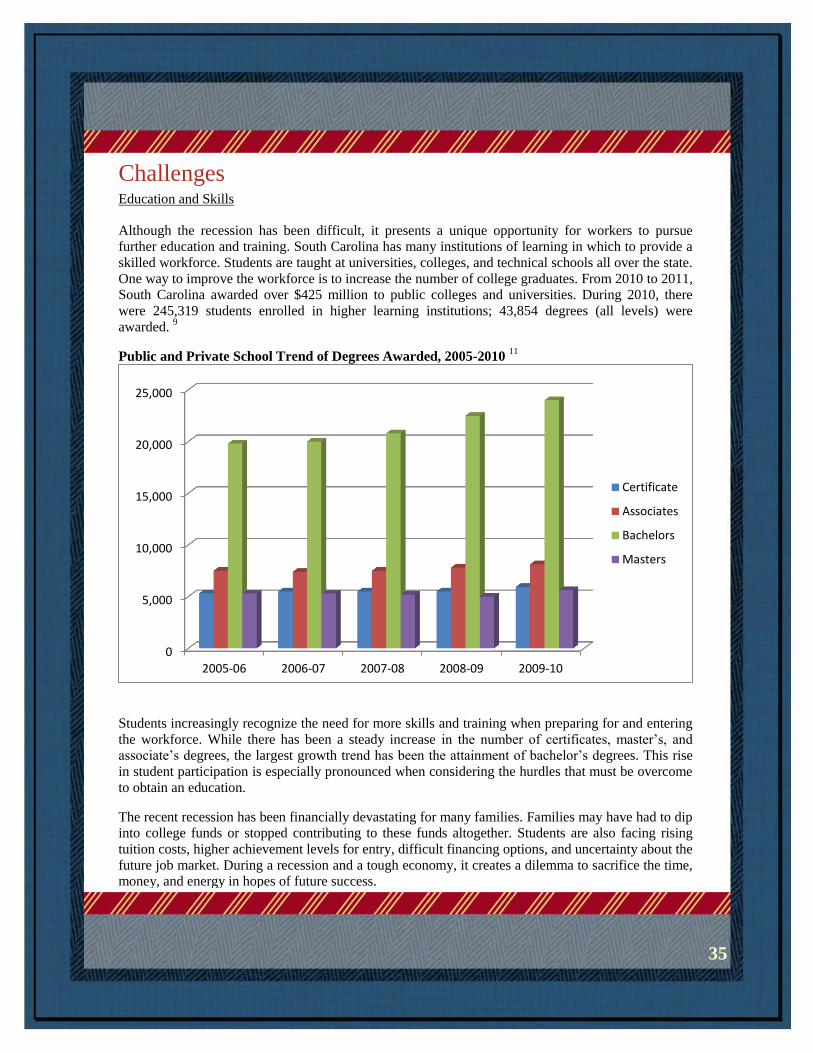
One way to improve the workforce is to increase the number of college graduates. From 2010 to 2011,
South Carolina awarded over $425 million to public colleges and universities. During 2010, there
were 245,319 students enrolled in higher learning institutions; 43,854 degrees (all levels) were
awarded. 9
Public and Private School Trend of Degrees Awarded, 2005-2010 11
Students increasingly recognize the need for more skills and training when preparing for and entering
the workforce. While there has been a steady increase in the number of certificates, master’s, and
associate’s degrees, the largest growth trend has been the attainment of bachelor’s degrees. This rise
in student participation is especially pronounced when considering the hurdles that must be overcome
to obtain an education.
The recent recession has been financially devastating for many families. Families may have had to dip
into college funds or stopped contributing to these funds altogether. Students are also facing rising
tuition costs, higher achievement levels for entry, difficult financing options, and uncertainty about the
future job market. During a recession and a tough economy, it creates a dilemma to sacrifice the time,
money, and energy in hopes of future success.
0
5,000
10,000
15,000
20,000
25,000
2005-06 2006-07 2007-08 2008-09 2009-10
Certificate
Associates
Bachelors
Masters
Challenges
35
Selected South Carolina University and College Total Headcount, 2004 - 201011
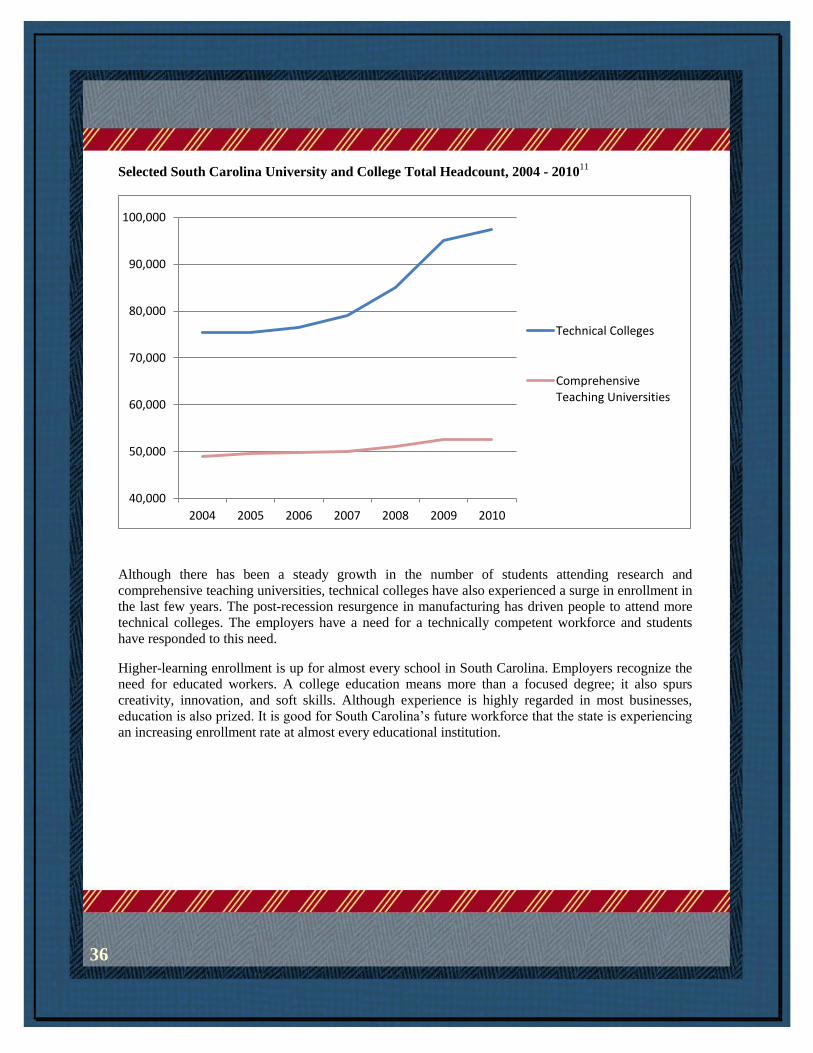
Although there has been a steady growth in the number of students attending research and
comprehensive teaching universities, technical colleges have also experienced a surge in enrollment in
the last few years. The post-recession resurgence in manufacturing has driven people to attend more
technical colleges. The employers have a need for a technically competent workforce and students
have responded to this need.
Higher-learning enrollment is up for almost every school in South Carolina. Employers recognize the
need for educated workers. A college education means more than a focused degree; it also spurs
creativity, innovation, and soft skills. Although experience is highly regarded in most businesses,
education is also prized. It is good for South Carolina’s future workforce that the state is experiencing
an increasing enrollment rate at almost every educational institution.
40,000
50,000
60,000
70,000
80,000
90,000
100,000
2004 2005 2006 2007 2008 2009 2010
Technical Colleges
Comprehensive Teaching Universities
36

Top Bachelor’s Degrees Awarded by Discipline, 2010 11
The types of bachelor’s degrees awarded can give us an insight into the makeup of our future
workforce. Several hot jobs will be targeted by education and health profession majors in these
growing fields. Business and related majors will administer programs, commerce, and ideas
throughout the state. Businesses have learned that people of all majors contribute to an organization.
A visual arts graduate may have groundbreaking ideas for a marketing firm. An education major can
write for a trade publication or work in sales. Employers desire a well-rounded team to create new
ideas, products, and services. A common college experience is working on a project as part of a team.
This teaches teambuilding skills and professional behavior, an extremely important part of any
business. While some occupations are solitary, most jobs will involve interactions with work
colleagues. The teambuilding skills learned in college strengthen this idea and further prepare the
student for successful integration into the workforce.
0 5 10 15 20 25
Engineering
Communication and Journalism
Visual and Performing Arts
Psychology
Biology and Biomedical
Health Professions
Social Science
Education
Business, Management, Marketing
37
Percent

Full-Time Student Tuition Change and Cost in 201111
Avg. 10yr
Tuition
Change
Avg. 5yr
Tuition
Change
Avg. 1 yr
Tuition
Change
Average
Annual
Tuition Cost
USC and Clemson 131.4% 25.8% 6.9% $10,820
Comprehensive Teaching Institutions (i.e.
The Citadel, College of Charleston,
Presbyterian)
131.2% 28.9% 6.3% $9,278
Technical Colleges 98.3% 16.3% 4.3% $3,438
The above table provides a glimpse of the financial burdens that students now face. When trying to
increase their educational attainment, average tuition rates had risen for several years prior to the
recent recession. Current economic woes have caused schools to raise tuition rates even further to
make up for cuts in state funding and rising operational costs. The upward trend in tuition costs is
expected to continue. The South Carolina Education Lottery (SCEL) helps fund public education
institutions. Over time, the financial burden has shifted more and more toward the SCEL.
Recurring State General Fund Appropriations for S.C. Public Universities and Colleges as a
Percentage of Total Recurring Appropriations, 2001 - 2011 11
It may be attractive to get more training while wages are lower to improve employability when the
economy resolves. Working adults can obtain a college-level education by enrolling in a two-year or
four-year university program. But working adults tend to lead very busy lives, often including children
and full-time jobs. Many may not be able to afford to stop working to become full-time college
students or pay tuition.
13.7% 12.9% 12.6%
11.9% 11.6% 11.9% 11.3%
10.2% 10.0%
8.4%
0.0%
2.0%
4.0%
6.0%
8.0%
10.0%
12.0%
14.0%
16.0%
38
Maximizing the potential of our workforce and boosting economic growth will require increased
support for education and training programs. We must understand the issues that working people face
when deciding whether or not to pursue further education and training. Changes in public policy may
lower the barriers that many face when deciding to further their educational goals.
Employers are looking for skilled workers with experience. A dynamic and well-educated workforce
equipped with science, technology, engineering and math (STEM) skills will be required in the new
economy. Firms build competitive advantages based on the talents of workers in these occupations.
Moving forward, more jobs will require at least a basic understanding of scientific and mathematical
principles, a working knowledge of computer hardware and software, and problem-solving skills
developed and refined through coursework. There may be a shortage of quality engineers, scientists,
information workers, and technicians of all types; this affects our economy.
Manufacturing firms increasingly want skilled workers and this also means being proficient in certain
computer programs. Project management software knowledge is also desired, along with word
processing and other technological familiarity. If employers want their workers to have certain skills,
and the pool of potential workers does not have these skills, this presents a skills-gap.
Job seekers face several problems. Workers may be available and qualified to take a job, but the
offered wage is too low, so the job goes unfilled. Increasing job requirements also cause a need for
diverse skills and experiences; these requirements make it difficult for a young worker or an industry
veteran to get a job in a new field.
Employers have challenges too; many report being unable to find qualified workers to take a position.
A company may want experience and skills when workers may only have one or the other. Employers
want skilled workers now and would rather not deal with on-the-job-training for new hires. A firm can
be more selective for candidates when the unemployment rate in the area is higher. Employers want
more qualified workers. The workforce will need more education and skills to compete for jobs in the
future.
39

Producing a highly-skilled workforce to help businesses compete in a global economy continues to be
a goal of South Carolina’s economic developers. By conducting business roundtable meetings and
surveys, employers have had an opportunity to explain characteristics that they desire in a workforce.
Two characteristics received particular focus: workers need more skills/certification/education (hard
skills), and workers need soft skills.
Employers need workers that can do more work and solve more problems. This creates a very flexible
and versatile workforce. It can allow the employer more operational flexibility when tough decisions
have to be made.
More certifications, skills, and education bring creativity and productivity to any workforce. This also
minimizes on-the-job training required for a new employee to a firm. This can amount to significant
savings in time and money when business moves at a fast pace. It can allow the firm to produce
different products and increase production. It also makes the hiring process easier for both parties, if
specific and desired skills are present.
The desire for soft skills has been increasingly important over the last several years as more people
have been interviewing for jobs. Hard skills are related to an organization’s specific tasks and
activities, like operating machinery and using computer protocols. They are easy to observe and teach
compared to soft skills which are typically broad, hard to observe or measure, and can be used in
many different settings. Professionalism, teamwork, communication, critical thinking, work ethic, and
listening are all considered soft skills. Conventional wisdom is that hard skills will help someone get a
job interview, but soft skills will allow them to get the job and keep it. Soft skills can help minimize
conflicts, complaints, micromanaging and ultimately lead to an efficiently run business.
40

The South Carolina workforce faces several challenges. These include transitioning workers to new
work environments and schools, structural employment changes, helping workers adapt to different
labor and market demands, and having the necessary training and education for jobs. Soft skills must
be developed and older and discouraged workers need help with employment.
From the November 2012 Federal Open Market Committee meeting, financial minds have come up
with their predictions for national unemployment for the next few months and years. As we can see in
the graph below, a downward unemployment trend is anticipated for the next several years. It also
shows that national unemployment is expected to be above 7.0 percent for the next two years; this is
especially worrisome since South Carolina’s rate is usually above the national average. These ideas
are reinforced by Chairman Bernanke in statements made on July 17, 2012, about the national
economy, saying the “…economy had decelerated…consumer confidence remains relatively low…a
reduction in unemployment rate seems frustratingly slow…” 12
The economic recovery is still on
shaky ground and the nation is having a tougher time than most people have anticipated.
Federal Reserve’s Unemployment Projections for the United States
Some workers needing to obtain further education or training may not be ready to re-enter the
classroom. Barriers to education include time, money, educational prerequisites like a diploma/GED
and language issues. It can be a daunting process to apply for school, be accepted, apply for loans, and
have the time and energy to succeed.
The skills gap is also an issue. Workforce development leaders must determine the areas in which the
workforce is deficient and take actions to close the gap. Employer needs and their hiring methods
must also be considered.
Conclusion
41

There are several questions for the current workforce: Do they have the skills needed to fill current
and emerging job openings? Do employers have the skilled workforce they need to remain
competitive and contribute to the local economy? If the skills are deficient, how does the state assist in
improving them? How can job seekers be matched with employers quickly and effectively? How do
we promote the availability of a qualified workforce in order to gain a competitive economic
development advantage?
As South Carolina is making great strides in economic growth, the demand for workforce services is
also growing. One challenge is providing effective retraining to people who have been out of school
for a long time. A significant number of South Carolinians have been unemployed for an extended
period and lack a high school education. While recovery will bring job opportunities to some of these
people, experience shows that many jobs lost during the recession will not return. Meeting the needs
of the long-term unemployed who lack adequate education and training will be a special challenge.
The ongoing cycle of job and population loss in many of our smaller, rural areas is a longstanding
critical issue for South Carolina. A key challenge is preparing enough workers to take advantage of
middle-skill job opportunities. People are ready to train but they still need more skills. Funding may
need to be sought for hard and soft skills training. Collaboration with high schools, technical colleges,
and colleges/universities would benefit workers and firms.
The current economic status is a clear improvement from where the state was two and three years ago
but still far from where it was pre-recession. A wide range of indicators suggests that the job market
has been improving, which is a welcome development. The economic horizon is hazy, with firms and
people feeling apprehensive about the future. The recession served to accelerate many of the
economic and related workforce trends, severely impacting many people.
As firms begin to rehire, they may not replace the workers they shed during the recession. They have
learned to be more efficient and to do more work with less people. Workers employed in low-skill and
middle-wage jobs are competing for fewer high-paying jobs while employers now demand more skills
for the same positions. It is becoming progressively less expensive to automate functions that used to
be performed by workers. Product cycles will get shorter and technological change will alter firms and
industries. In this environment it is important that workers be able to obtain the training they need to
keep pace with the ever-changing economy.
With recovery taking hold, employment will grow in South Carolina over the next several years.
Continued population increases will drive employment growth in retail trade. Growth, particularly
among the elderly, will continue to create demand for healthcare workers. The trends toward
outsourced business services and smaller businesses will generate more professional jobs. Tourism
growth will increase tourism-related jobs, although most will be low-wage.
42

Continued development of distribution centers and port facilities will increase transportation and
logistics employment. Manufacturing has been generating more jobs, and is expected to continue to do
so based on recent economic development successes. Those jobs often require higher levels of skills
than in the past.
The state and nation are increasingly becoming a knowledge-skill based economy. New jobs will
require workers with more advanced levels of training and education. Firms have become more
productive, requiring fewer skilled workers to produce the desired output. The most successful
workers are those with college or industry certifications. Workers who are well prepared for the future
workforce will be best able to adapt to growing and changing business needs. If firms cannot find the
workers they need, they may locate elsewhere and South Carolina could lose its competitive
advantage.
The recent recession has delayed the retirement of many in the Baby Boomer generation due to lost
value in housing and retirement funds. This delay has also slowed the career growth for many younger
workers hoping to get better jobs and move up their career ladders. While recovery will bring job
opportunities to some of this group, experience shows that many jobs lost during the recession will not
return. While in recovery, it is important to understand which types of jobs will be in demand and if
the workforce has the necessary skills to meet these needs. A challenge to the workforce is having
enough prepared and qualified workers to take advantage of these middle-skill opportunities.
Employers characterize new entrants to their workforce as deficient in several soft-skill areas such as
professionalism, communication, and teamwork. There should be more collaboration with high
schools, adult education, and technical colleges to leverage resources to provide soft-skill training.
The labor force in South Carolina is expected to increase in number over the next several years
because of continued population growth trends. The rate of growth will decelerate, though, due to
slower population growth and diminished labor force participation.
Evolving and new industries need a more skilled and educated workforce. South Carolina is working
to supply this demand through a large number of universities and technical colleges throughout the
state. Completion of high school is an important step to ensure that young adults can receive advanced
training and skills to enhance the workplace. The population of less educated and trained workers will
have fewer well-paying jobs and career opportunities. South Carolina’s opportunities for long-term
economic growth will increasingly depend on having a well-trained and educated workforce that
responds quickly to industry needs.
43

Final Thoughts
A key to reducing unemployment is economic growth, a rising demand for goods and services.
Continued weakness in aggregate demand is likely the predominant factor in unemployment. Once
business picks up in South Carolina, North America, Europe, Asia, and the rest of the world, the
unemployment rate will fall as demand stimulates the hiring of workers.
Reducing the unemployment rate is an important issue for many people. South Carolina no longer has
unemployment insurance benefits for workers past 42 weeks, and will be ending the same support for
unemployed workers past 20 weeks starting in 2013. However, services like job placement, resume
review, and job portals will be available.
The South Carolina Technical College System is comprised of 16 technical colleges located
throughout the state. The system serves 242,000 students annually. The main goal of the system is to
have a technical training program that is accessible to all South Carolina workers that want to obtain a
marketable skill. In addition to technical colleges, the system runs two important programs: readySC
and Apprenticeship Carolina. The readySC program assists with business recruiting and training,
develops a training curriculum, and oversees project management throughout the process. They
provide new, relocating, or expanding firms with access to human capital and will train and coordinate
a workforce. Apprenticeship Carolina coordinates a flexible employer-sponsored training program
that creates a highly-skilled worker. The program is involved in many industries including
construction, manufacturing, energy, information technology, healthcare, tourism, and transportation.
The South Carolina Technical College System is an important part of training high school graduates to
enter the workforce with relevant and contemporary job skills. This makes the workforce more
competitive and provides the employers with the skilled workers they want.
The South Carolina Department of Employment and Workforce offer several benefits to workers,
including having certified trainers and training available. SCWorks centers are available to help job
seekers find the training that they need for an in-demand job. They also connect workers with
employers. WORKSC provides resources like resume writing and soft skills for workers. Palmetto
Workforce Connections provides information about employment and economic conditions and news
from around the state.
The patterns and trends described in this report offer cause for both optimism and concern. This is a
time of great opportunity for South Carolina and the state has much to be proud of, including a
growing population, a strengthening economy, and an excellent credit rating. We are excited about our
state’s future and are prepared to lead the way in delivering the skilled talent and economic
opportunities that businesses and South Carolinians deserve.
44
References
1. Dolon, J.P. “Best and Worst States for Business.” Another Triumph for Texas 2012.
Chiefexecutive.net, 02 May 2012. Web. 25 July 2012.
http://chiefexecutive.net/best-worst-states-for-business-2012.
2. “SCDASH.” University of South Carolina, Moore School of Business, July 2012. Web.
July 2012. www.scdash.com
3. “SC Facts and Figures.” Geography, Climate, and Economy: South Carolina Department of
Parks, Recreation and Tourism. South Carolina Department of Parks, Recreation, and
Tourism, 2012. Web. June 2012. www.scprt.com
4. Federal Reserve Bank of Richmond
5. United States Department of Labor
6. United States Census Bureau
7. South Carolina Budget and Control Board
8. “A Study of Migration and Labor Force Growth in South Carolina.” South Carolina
Department of Commerce, Dec. 2009. Web. July 2012.
www.sccommerce.com
9. Hammill, Greg. Mixing and Managing Four Generations of Employees.” Farileigh Dickinson
University, Spring 2005. Web. July 2012. www.fdu.edu
10. South Carolina Department of Commerce
11. “South Carolina Higher Educational Statistical Abstract.” Ed. Stephanie Charbonneau. South
Carolina Commission on Higher Education, Oct. 2011. Web. July 2012. www.che.sc.gov
12. “Minutes of the Federal Open Market Committee.” Federal Reserve, 20 June 2012. Web. July
2012. www.federalreserve.gov


South Carolina Department of Employment and Workforce
1550 Gadsden Street
Columbia, South Carolina 29201
(803) 737-2400
dew.sc.gov
scworkforceinfo.com