the state of the south dakota economy · 2018-11-29 · •sd economy slowing, but not everywhere...
TRANSCRIPT

The State of the South Dakota Economy
Ron Wirtz
Regional Outreach Director
Federal Reserve Bank of Minneapolis

minneapolisfed.org
Disclaimer
The views expressed here are the presenter's and not necessarily
those of the Federal Reserve Bank of Minneapolis or the
Federal Reserve System.

Part 1: The Federal Reserve System
• Central bank of the U.S.
• Established by act of Congress in 1913
What exactly is a central bank?
• Provides financial & banking services for country's government and commercial banking system, with the broad goals of:
– Stability and uniformity of money supply
– Safety and soundness of financial system

Main responsibilities of the Fed
➢Supervise and regulate banks• Mainly bank holding companies (who own lots of banks)
➢ JPMorgan, Wells Fargo, Goldman Sachs, Citigroup
➢Offer financial services• Manage (‘clear’) financial payments between parties• Lender of last resort
➢Set monetary policy • Most familiar tool is interest rates (via FOMC)• Monetary policy guided by “dual mandate”
1) stable prices2) maximum employment

The Federal Reserve System = distributed power
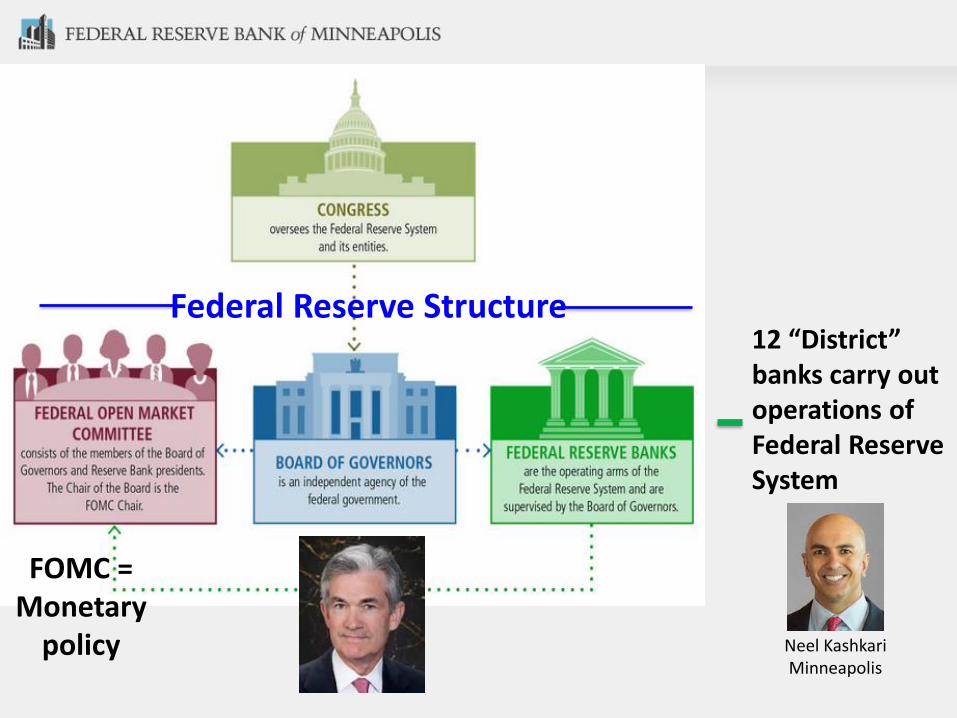
Federal Reserve Structure12 “District” banks carry out operations of Federal Reserve System
FOMC = Monetary
policy Neel KashkariMinneapolis

FOMC voting: Monetary policy in action
FOMC voting = 7 + 1 + 4
• 7 = Board of Governors (BOG)
• 1 = New York Fed president➢ Executes monetary policy in financial markets
• 4 = rotating votes of 11 other presidents• Neel Kashkari (Mpls): 2017 voter, again in 2020
Currently: 4 + 1 + 4 (three BOG vacancies)

Part 2: “The state of the South Dakota economy”
Implied question:
Is the state economy good or bad?
Answer: “Yes”

Lies, damned lies & statistics
“Now, keep in mind that these numbers are only as accurate as the fictitious data, ludicrous assumptions and wishful thinking they're based upon.”
Reprinted with permission from CartoonStock

My goal: Help inform your opinion of the South Dakota economy, via:
• a variety of performance metrics • tabulated over long(ish) timeframes• using different/peer comparisons

State comparisons• South Dakota• Minnesota• Montana• US average• What about North Dakota?
Metro comparisons• Rapid City• Sioux Falls• Peer metros

Today’s economic themes• SD economy slowing, but not everywhere
• Ag is dragging, not pulling, state economy
• Bi/tri-furcation of state economy
• Trajectory matters as much/more than current measures
• Tight labor means future growth depends on workforce, workforce, workforce
On to the charts!

Timeframe matters: Pre-recession GDPSouth Dakota on top of the pile
Annualized quarterly output, inflation adjusted
Source: Bureau of Economic Analysis
90
95
100
105
110
115
120
125
130
135
SouthDakota
UnitedStates
GDP index: 2005 Q2 = 100

Post-recession GDPSouth Dakota losing pace in recovery
Annualized quarterly output, inflation adjusted
Source: Bureau of Economic Analysis
90
95
100
105
110
115
120
125
United States
Minnesota
Montana
South Dakota
GDP index: 2009 Q2 = 100

12-month real GDP growthQ2 2017 to 2Q 2018
2.9%
2.1%
1.1%
0.8%
United States Montana Minnesota South Dakota
Source: Bureau of Economic Analysis

12-month GDP growth, by sector2017:Q2 to 2018:Q2
-10 -5 0 5 10 15
Finance and insurance
Agriculture and forestry
Accommodation and food services
Transportation and warehousing
Wholesale trade
Construction
Retail trade
Real estate and rental and leasing
Health care and social assistance
Other services (except government…
Professional, scientific, and technical…
Manufacturing
Information
Source: Bureau of Economic Analysis

South Dakota metros: Good/bad newsSF & RC similar to US, but below neighbors
Source: Bureau of Economic Analysis
90
100
110
120
130
140
150
160
Bismarck, ND
Billings, MT
Mankato, MN
US metro ave.
Rapid City, SD
Sioux Falls, SD
GDP index: 2009 output = 100

GDP: Metros vs. rest of state Opposite directions since 2015
90
95
100
105
110
115
120
2009 2011 2013 2015 2017
Rapid City
Sioux Falls
Rest of SD
GDP index: 2009 output = 100

Source: Dodge Analytics
South Dakota annual construction spending strong, but cooling in 2018*
$0
$1
$1
$2
$2
$3
$3
$4
2014 2015 2016 2017 2018*
Bill
ion
s
Residential
Nonresidential
Nonbuilding
*Projected annual figure based on the first eight months of 2018

Residential shifting toward more multi-familyAnnual permitted units
0
1,000
2,000
3,000
4,000
5,000
6,000
7,000
Multi-family
Single-family
Source: U.S. Census
*Projected annual figure based on the first eight months of 2018

Housing & population growth: What’s the relationship?
0
50
100
150
200
250
300
350
Single-family
Multi-family
Population
H & P index: 1990 = 100
Source: U.S. Census*Projected annual figure based on the first eight months of 2018

Overview of the South Dakota banking
• 64 commercial banks chartered in South Dakota
– Down 25% from 10 years ago
– Less consolidation than nationwide (32% over same period)
• Profile of typical South Dakota bank hasn’t changed much over the last decade
– Ag production loans & loans secured by farmland make up 50% of the average SD bank
• SD banks among strongest performers in the 9th District

Median SD bank has the highest capital ratio among 9th District States
7%
8%
9%
10%
11%
12%
2000 2002 2004 2006 2008 2010 2012 2014 2016 2018
Tie
r 1
Cap
ital
/ R
isk
We
igh
ted
Ass
ets
SD MN MT ND
Capital ratios have increased nearly 100 bps since 2014

Earnings steadily improving at median SD bank
0.0%
0.2%
0.4%
0.6%
0.8%
1.0%
1.2%
1.4%
1.6%
1.8%
2000 2002 2004 2006 2008 2010 2012 2014 2016 2018
Pre
tax
Ret
urn
on
Ave
rage
Ass
ets
SD MN MT ND
Pretax ROAA is back to pre-crisis levels at SD banks

Loan growth has stabilized over the past year at the median SD bank
-8%
-6%
-4%
-2%
0%
2%
4%
6%
8%
10%
12%
14%
2000 2002 2004 2006 2008 2010 2012 2014 2016 2018
Year
-ove
r-ye
ar c
han
ge in
net
loan
s
SD MN MT ND Loan growth remains at the lower end of the historical range

Continued weakness in ag is a primary concern to bank health
• Tariffs and ongoing trade disputes are likely to persist in the near future
• USDA forecast for net farm income in 2018 is the lowest in 15 years
• Debt repayment capacity is nearing its maximum level for the average farm
• Cropland values fell in SD from 2017q1 to 2018q1 (most recent data)

Farm revenue down, but still well above earlier levels in 2000s
Cash receipts from marketings
$0
$5
$10
$15
$20
$25
Bill
ion
s
Minnesota
South Dakota
Montana
Source: Bureau of Economic Analysis

Farm income has plungedTotal farm proprietors’ income
-$1
$0
$1
$2
$3
$4
$5
$6
Bill
ion
s
South Dakota
Montana
Minnesota
Source: Bureau of Economic Analysis

Production expenses swamping lower prices
Total farm production expenses
$0
$4
$8
$12
$16
$20
Bill
ion
s
Minnesota
South Dakota
Montana
Source: Bureau of Economic Analysis

Chapter 12 bankruptcies rising, still modest in South Dakota
(previous 12 months, from June of each year)
0
10
20
30
40
50
60
70
80
90
MTSDNDMNWI
Source: United States Courts

Source: Bureau of Labor Statistics
Unemployment: South Dakota well below traditional definition of “full” employment
0
2
4
6
8
10
12
2006 2008 2010 2012 2014 2016 2018
US
Montana
South Dakota
Minnesota
September of each year
Perc
ent

Metro unemployment: Ultra low
Source: Bureau of Labor Statistics
0
1
2
3
4
5
6
7
8
2006 2008 2010 2012 2014 2016 2018
Billings, MT
Rapid City, SD
Bismarck, ND
Sioux Falls, SD
Mankato, MN
September of each year
Perc
ent

Job growth South Dakota trailing nation; uptick?
Source: Bureau of Labor Statistics
90
95
100
105
110
115
2006 2008 2010 2012 2014 2016 2018
US
Minnesota
Montana
South Dakota
September of each year, seasonally unadjusted
Jobs index: 2006 = 100

SD metro jobs Sioux Falls out front, Rapid City accelerating
Source: Bureau of Labor Statistics
90
95
100
105
110
115
120
125
2006 2008 2010 2012 2014 2016 2018
Sioux Falls, SD
Mankato, MN
Bismarck, ND
Rapid City, SD
Billings, MT
Jobs index: 2006 = 100
September of each year, seasonally unadjusted

Job growth: Concentrated in Sioux Falls and Rapid City
90
95
100
105
110
115
120
125
Sioux Falls
Rapid City
Rest of SD
Jobs index: 2009 = 100
Source: Bureau of Labor Statistics

Source: Bureau of Labor Statistics
2009 2011 2013 2015 2017
Sioux Falls Rest of SD Rapid City
Goods jobs (16% of total)
90
95
100
105
110
115
120
125
2009 2011 2013 2015 2017
Services jobs(84% of total)
Jobs index: Goods vs. services
Rural service jobs are lagging

Hiring demandSouth Dakota job postings down, pivoting?
Online job postings tracked by state, September of each year
Source: South Dakota Dept. of Labor & Regulation
0
10,000
20,000
30,000
40,000
50,000
Total jobopenings
New jobpostings

Real median household incomeLower, but rising steadily in South Dakota
Source: U.S. Census
$30,000
$35,000
$40,000
$45,000
$50,000
$55,000
$60,000
$65,000
$70,000
2000 2002 2004 2006 2008 2010 2012 2014 2016
MN
US
SD
MT

Real median HH incomes flat in metros, and growing faster in rural counties
$35,000
$40,000
$45,000
$50,000
$55,000
$60,000
$65,000
$70,000
2000 2002 2004 2006 2008 2010 2012 2014 2016
Hughes
Minnehaha
Brookings
Pennington
Beadle
Source: U.S. Census

A quick recap
• GDP sluggish; tri/bi-furcation in the state• Slow ag economy• SD metros doing better, esp. Sioux Falls
• Very low unemployment • Solid hiring demand• Modest (but decelerating) job growth• Slow service job growth in rural SD
• Accelerating wage growth
So where is this all headed? And why?

Workforce, workforce, workforceJob growth and GDP/output are very connected to labor force growth, esp. when productivity is unchanged
Nonfarm labor
productivity(Annual percent change,
seasonally adjusted)
0
1
2
3
4
5
6
7
1990 1993 1996 1999 2002 2005 2008 2011 2014 2017

Labor force growth: Flat in SD
Source: Bureau of Labor Statistics, LAUS
Labor force: Those 16 and over that are working or looking for work
90
95
100
105
110
115
120
125
130
135
140
1990 1994 1998 2002 2006 2010 2014 2018
US
Montana
South Dakota
Minnesota
Labor force index 1990 = 100

Sioux Falls labor force sprinting ahead of peers
90
100
110
120
130
140
150
160
170
180
1901
99
01
99
21
99
41
99
61
99
82
00
02
00
22
00
42
00
62
00
82
01
02
01
22
01
42
01
62
01
8
Sioux Falls, SD
Rapid City, SD
Bismarck, ND
Mankato, MN
Billings, MT
Labor force index 1990 = 100

Labor force trends are tied to:
• Population growth • Demographics• Labor force participation

Population growthSouth Dakota lagging, but gap is holding
Source: U.S. Census, via FRED
95
100
105
110
115
120
125
130
135
140
1990 1994 1998 2002 2006 2010 2014 2018
Montana
US
Minnesota
South Dakota
Population index 1990 = 100

SD population projection remains pretty steady
Tho
usa
nd
s
0
200
400
600
800
1000
1200
1990 2000 2010 2020 2030 2040
Forecast
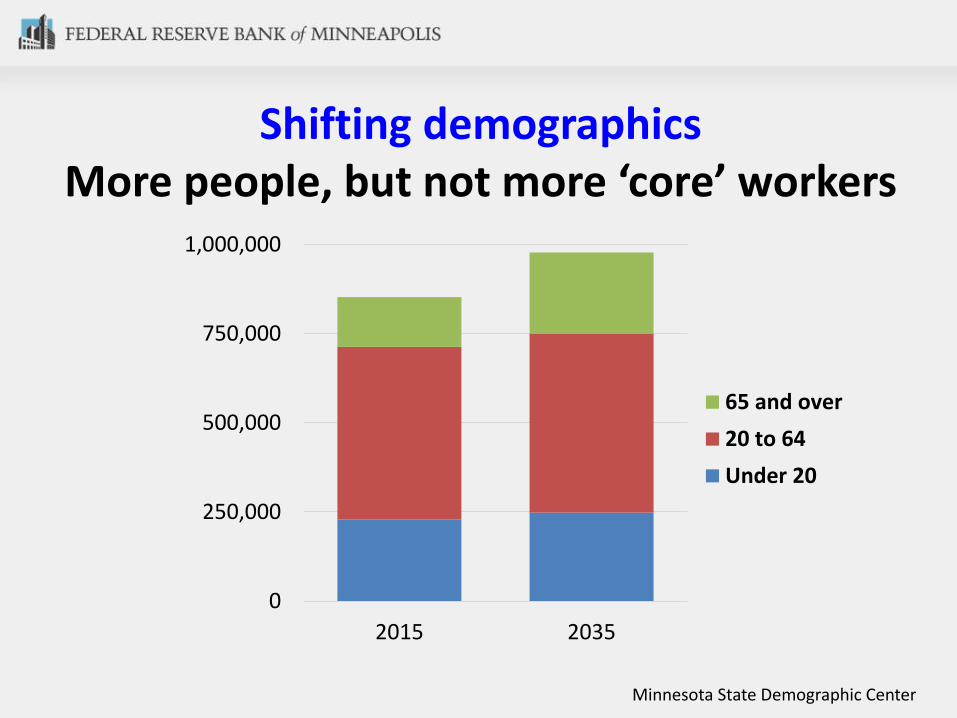
Shifting demographicsMore people, but not more ‘core’ workers
Minnesota State Demographic Center
0
250,000
500,000
750,000
1,000,000
2015 2035
65 and over
20 to 64
Under 20

Labor force participation ratesLong, slow decline; hitting plateau?
Source: Bureau of Labor Statistics
Labor force participation rate = 16 yrs old and over, employed or looking for work
55
60
65
70
75
80
Minnesota
South Dakota
U.S.
Montana
Pe
rce
nt
of
pe
op
le w
ork
ing,
16
ye
ars
or
old
er

Disability finally seeing change in trendSSI & SSDI enrollment trends
3%
4%
5%
6%
7%
8%
9%
10,000
15,000
20,000
25,000
30,000
35,000
40,000
Disability enrollment as a share of labor force
SSI & SSDI enrollment
Source: Social Security Administration

Tight labor math: Short-term
• Hiring demand can change quickly (+/-)• Labor supply changes very slowly (+/-)
The only realistic short-term relief to tight labor is for hiring demand to decrease(aka economic slowdown/recession)

• Do nothing, and except slower growth• Increase productivity above trend (hard)• Subsidize fertility ($$) • Allow/encourage immigration/migration• Embrace approaches that convince more
people to work, esp. under-utilized groups• Labor force participation is critical
Tight labor math: Long-term

U6 unemployment A better picture of “full” labor slack
U-6 unemployment rate = Total unemployed, plus all marginally attached workers, plus total employed part time for economic reasons, as a percent of the civilian labor force plus all marginally attached workers, percent, 4-quarter moving average, not seasonally adjusted.
Source: Bureau of Labor Statistics
0
2
4
6
8
10
12
14
16
18
U.S.
Montana
South Dakota
Minnesota
Last measure: January 2018
Per
cen
t

Native American unemployment incredibly high
Source: Bureau of Labor Statistics
Pe
rce
nt,
20
16
0
5
10
15
20
25
30
Minnesota Montana NorthDakota
SouthDakota
Wisconsin
Statewide rate
AIAN

Why does high minority unemployment matter? They are the future workforce
SD worker GROWTH
0
50,000
100,000
150,000
200,000
250,000
300,000
350,000
400,000
White
Other minoritygroups
American Indian
South Dakota workers
50
100
150
200
250
300
Otherminoritygroups
AmericanIndian
White
Change since 20003 of 8 new workers is nonwhite, and the rate is accelerating
Source: U.S. Census
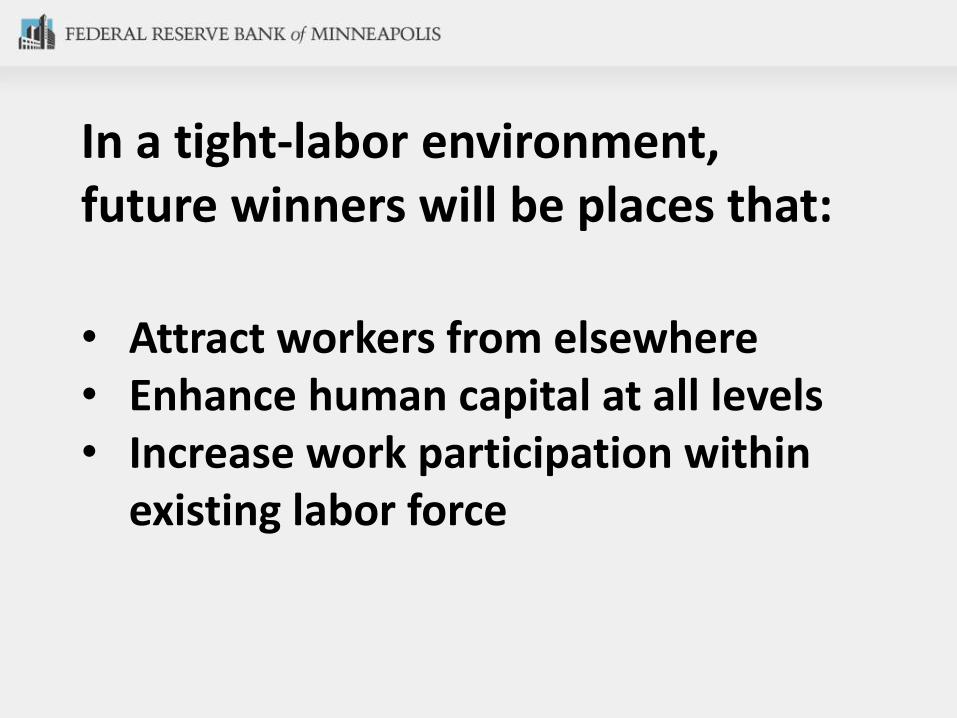
In a tight-labor environment, future winners will be places that:
• Attract workers from elsewhere• Enhance human capital at all levels• Increase work participation within
existing labor force

Increasing labor force/participation
• Wages, wages, wages• Jobs with career opportunities• Find ways to bring more workers into
the labor force➢ Available jobs – alone – not enough
for some people to work more➢ Housing, transportation, day care,
healthcare

Part 3: Tell the Fed …
What’s happening at your firm?
The Minneapolis Fed wants to know!
Step 1: Send text to 22333Step 2: Text the word: minneapolisfed

minneapolisfed.org

Thank you!
Questions for me?Comments for the Bank?
Twitter: @RonWirtz