the state of the housing market october 2021
TRANSCRIPT

The state of the housing marketOctober 2021
Summary - October
Housing market activity remained high in October. There has been a highnumber of property sales compared to previous years, although this is nowseasonally slowing down in the autumn.
The share of buyers expecting prices to rise over the next six months fell by 3 percentage points in November’s survey, from 38 percent to 35 percent, compared with the corresponding figure for October. At the same time, the share of people who say they plan to buy a home remained at a lower level than during the pandemic. Of the visitors surveyed, 39 percent were planning to buy in the next six months.
In the apartment market, both the supply and the number of properties listed decreased year-on-year, by 2 and 3 percent respectively. The decrease was most noticeable in Stockholm County, where the number of property listings fell by 13 percent compared with October 2020.
In the holiday home market, it is now clear that the high demand we have seen over the past year is starting to wane. The average sale of a holiday home took 3 days longer in October and prices went up on average 4 percent points less than the corresponding month last year.
• Fewer buyers believe in rising property prices
• Lower apartment supply than in October 2020
• Somewhat longer sales times compared to last spring
1 · THE STATE OF THE HOUSING MARKET OCTOBER 2021

The Buyers’ Barometer - fewer buyers believe in rising pricesThe survey on which the Hemnet Buyer Barometer is based is conducted at the beginning of each new month, which means that the results for price expectations and propensity to buy in this October report refer to figures from the beginning of November.
I think property prices are going to fall I think property prices are going to rise Net difference (right axis)
60%
40%
20%
0%
Hemnet’s Buyers’ Barometer
50%
25%
0%
-25%
-50%
Jan-20
Feb-20
Mar-2
0
Mar (e
xtra)
Apr-20
Apr (extr
a)
May-2
0
Jun-20
Jul-20
Aug-20
Sep-20
Oct-20
Nov-20
Dec-20
Jan-21
Feb-21
Mar-2
1
Apr-21
May-2
1
Jun-21
Jul-21
Sep-21
Oct-21
Aug-21
In Hemnet’s November Buyers’ Barometer, 35 percent of buyers surveyed said they expect prices to rise in the next six months. This is a decrease of 3 percent points since last month’s survey and the lowest share since August 2020.
The share of buyers who thought prices were falling was 19 percent in November, which is the same level as in October’s survey. Overall, this represents a net difference of 16 percent points between those who believe prices will rise and those who believe prices will fall. This is 3 percent points lower than in last month’s survey.
Nov-21
2 · THE STATE OF THE HOUSING MARKET OCTOBER 2021

”A little over a month has passed since the pandemic restrictions were lifted and
we are now out of the period where the market was largely affected by the
pandemic. Some signs of subdued demand can now also be seen in both the holiday
home and house markets, which have been most affected by the pandemic.
However, there is no dramatic decline, but rather a sideways development where
the focus on the home has decreased somewhat and thus also to some extent the
demand for housing,” says Hemnet’s market analyst, Erik Holmberg.
Proportion of Hemnet visitors planning to buy a home in the next six months
Jan Feb Mar April May June July Aug Sep Okt Nov Dec
50%
45%
40%
35%
30%
Of the visitors surveyed on Hemnet at the beginning of November, 39 percent said they were planning to buy a home in the next six months. This is the same share as in the
corresponding survey in October. As a result, the propensity to buy remains well below the levels seen during the more intense phase of the pandemic.
2018 2019 2020 2021
3 · THE STATE OF THE HOUSING MARKET OCTOBER 2021

Jan Feb Mar April May June July Aug Sep Oct Nov Dec
Supply – reduced apartment supply
2017 2018 2019 2020 2021
25 000
20 000
15 000
10 000
5 000
0
Supply of apartments on the succession market - Sweden
Jan Feb Mar April May June July Aug Sep Oct Nov Dec
20 000
15 000
10 000
5 000
0
Supply of houses - Sweden
Area (county) Supply Annual rate, supply Number of listed Annual rate, listed
SWEDENHouses 10,857 +/-0% 4,734 +1%Apartments 21,590 -2% 10,869 -3%Holiday homes 1,587 -1% 451 -3%
STOCKHOLMHouses 1,434 +/-0% 684 -8%Apartments 8,499 -10% 4,406 -13%
VÄSTRA GÖTALANDHouses 1,686 +2% 703 +1%Apartments 3,007 +2% 1,464 -5%
SKÅNEHouses 1,573 -3% 787 -2%Apartments 2,619 +3% 1,431 +3%
In October, there were 21,590 apartments for sale on Hemnet, which is 2 percent fewer than in the corresponding month of 2020. In October, the number of listed apartments also decreased on an annual basis. A total of 10,869 apartments were listed, 3 percent fewer than in October last year. In Stockholm, where trends are often most pronounced in the housing market, the number of listed apartments fell by 13 percent year-on-year. On the other hand, Stockholm was also one of the areas where the number of listed apartments increased the most during the pandemic.
The supply of houses in October remained at the same level as in October 2020, which means that it is still low compared to previous years. In total, there were 10,857 houses for sale on Hemnet during the month. Of these, 4,734 were listed in October, an increase of 1 percent year-on-year.
4 · THE STATE OF THE HOUSING MARKET OCTOBER 2021

Sales – seasonal decline
Jan Feb Mar April May June July Aug Sep Oct Nov Dec
2017 2018 2019 2020 2021
12 500
10 000
7 500
5 000
2 500
0
Apartments sold - Sweden
Jan Feb Mar April May June July Aug Sep Oct Nov Dec
6 000
4 000
2 000
0
Houses sold - Sweden
Area (county) Number sold Annual rate, sold
SWEDENHouses 4 838 -1%Apartments 10 898 +/-0%Holiday homes 564 -7%
STOCKHOLMHouses 683 -12%Apartments 4 596 -3%
VÄSTRA GÖTALANDHouses 683 -14%Apartments 1 553 +2%
SKÅNEHouses 733 -3%Apartments 1 390 +7%
In October, 10,898 apartment sales were reported in to Hemnet. This is an unchanged level compared to October 2020 but still significantly higher than the corresponding month in previous years.
On the house market, the number of sales in October decreased by 1 percent at an annual rate and a total of 4,838 sales were reported during the month. The market is now entering a period of the year when the number of sales is seasonally declining, particularly for houses.
”The number of sales continues to remain at high levels during the autumn. The high pressure we saw this spring, particularly in the house market, with high demand relative to supply, seems to have eased somewhat. But even though the pace has slowed down, there are still many sales, which is a sign of a continuing strong market,” says Erik Holmberg.
5 · THE STATE OF THE HOUSING MARKET OCTOBER 2021
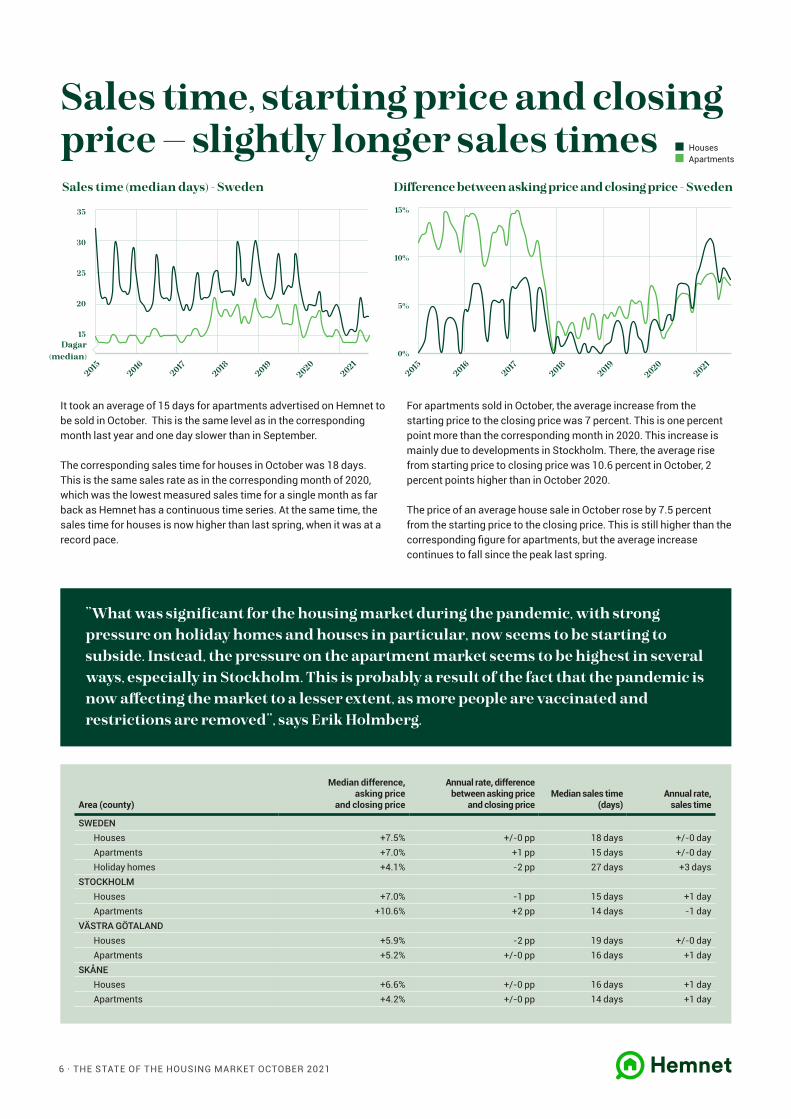
Sales time, starting price and closing price – slightly longer sales times Houses
Apartments
35
30
25
20
15
Sales time (median days) - Sweden
15%
10%
5%
0%
Difference between asking price and closing price - Sweden
20152016
20172018
20192020
2021
Dagar (median)
20152016
20172018
20192020
2021
Area (county)
Median difference, asking price
and closing price
Annual rate, difference between asking price
and closing priceMedian sales time
(days)Annual rate,
sales time
SWEDENHouses +7.5% +/-0 pp 18 days +/-0 dayApartments +7.0% +1 pp 15 days +/-0 dayHoliday homes +4.1% -2 pp 27 days +3 days
STOCKHOLMHouses +7.0% -1 pp 15 days +1 dayApartments +10.6% +2 pp 14 days -1 day
VÄSTRA GÖTALANDHouses +5.9% -2 pp 19 days +/-0 dayApartments +5.2% +/-0 pp 16 days +1 day
SKÅNEHouses +6.6% +/-0 pp 16 days +1 dayApartments +4.2% +/-0 pp 14 days +1 day
It took an average of 15 days for apartments advertised on Hemnet to be sold in October. This is the same level as in the corresponding month last year and one day slower than in September.
The corresponding sales time for houses in October was 18 days. This is the same sales rate as in the corresponding month of 2020, which was the lowest measured sales time for a single month as far back as Hemnet has a continuous time series. At the same time, the sales time for houses is now higher than last spring, when it was at a record pace.
For apartments sold in October, the average increase from the starting price to the closing price was 7 percent. This is one percent point more than the corresponding month in 2020. This increase is mainly due to developments in Stockholm. There, the average rise from starting price to closing price was 10.6 percent in October, 2 percent points higher than in October 2020.
The price of an average house sale in October rose by 7.5 percent from the starting price to the closing price. This is still higher than the corresponding figure for apartments, but the average increase continues to fall since the peak last spring.
”What was significant for the housing market during the pandemic, with strong pressure on holiday homes and houses in particular, now seems to be starting to subside. Instead, the pressure on the apartment market seems to be highest in several ways, especially in Stockholm. This is probably a result of the fact that the pandemic is now affecting the market to a lesser extent, as more people are vaccinated and restrictions are removed”, says Erik Holmberg.
6 · THE STATE OF THE HOUSING MARKET OCTOBER 2021
• Hemnet’s Buyers’ Barometer is based on a survey that is sent out to visitors to hemnet.se at the beginning of each month. The respondents who state that they plan to buy a home within six months are asked: “How do you think housing prices will develop in your area over the next six months?” In total, the survey is answered by between 2,000 and 3,000 people each month. (During March and April 2020, an additional survey was also conducted in the middle of each month.)
• In May 2021, a change was made in how we calculate sales time. The change means that we now do not count the days that a property has been ”upcoming” on Hemnet. This means that the average sales time will be slightly shorter than with the previous way of calculating. Historical data has also been corrected, which means that there will be no break in series.
• In May 2021, a review and change in methodology was carried out regarding how we calculate supply. This implies that statistics that have been communicated previously may differ somewhat from the figures we have been communicating since then. Historical data has also been corrected, which means that there will be no break in series.
• All housing data in the report are based on property in the succession market, i.e., excluding new construction.
• The aim of the report is to provide a clear overview of the housing market. The report therefore presents data for the dwelling types: house, apartment and holiday home. These make up about 90 percent of the housing ads on the succession market on Hemnet. Dwelling types not covered by the report include terraced houses and plots.
• The supply on Hemnet is defined as the number of active property listings during a given time period. In this case during one month.
• Published listings are property listings that are published for the first time during the given period.
• Sales means property that have a reported sale date to Hemnet. The statistics are based on the data available at the beginning of each month covered by the report. This means that sales reported later are not included but may have some impact on the statistics retrospectively.
• The median difference between the starting price and the closing price is the middle percentage value that a property increases with from the starting price to the closing price during a given period.
• The sale time is the average (median) number of days that a property sold has been for sale on Hemnet. The reason why the median is used as an average is because the number of days a property is for sale on Hemnet is not normally distributed and that individual extreme values otherwise have an unreasonably large impact.
About the statistics
7 · THE STATE OF THE HOUSING MARKET OCTOBER 2021

Klarabergsgatan 60 · 111 21 Stockholm
For further information please contact: Erik Holmberg, Market analyst [email protected], +46 072-55 88 050
Contact