the state of the global workplace - torben rick state of the... · the state of the global...
TRANSCRIPT
The State of the Global WorkplaceA worldwide study of employee engagement and wellbeing

Copyright © 2010 Gallup, Inc. All rights reserved. Gallup®, Gallup Consulting®, Q12®, Gallup Panel™, The Gallup Poll®, and Gallup-Healthways Well-Being Index® are trademarks of Gallup, Inc. All other trademarks are the property of their respective owners.

Copyright © 2010 Gallup, Inc. All rights reserved. 1
Table of Contents
Section 1 — A Global Perspective on Employee Engagement �������������������������������������������������2
Section 1-1: Introduction ............................................................................................................................2
Section 1-2: Engagement Improves Business Outcomes ............................................................................3
Section 1-3: Employee Engagement Relates to Personal Wellbeing ...........................................................5
Section 1-4: Examining the Elements of Engagement Worldwide .............................................................8
Section 2 — Regional Breakouts ����������������������������������������������������������������������������������������� 10
Section 2-1: Sub-Saharan Africa ............................................................................................................... 12
Section 2-2: Middle East and North Africa .............................................................................................. 13
Section 2-3: Japan and South Korea .......................................................................................................... 14
Section 2-4: Southern Asia ........................................................................................................................ 15
Section 2-5: Southeast Asia ....................................................................................................................... 16
Section 2-6: China (includes Hong Kong) ................................................................................................ 17
Section 2-7: India ...................................................................................................................................... 18
Section 2-8: Australia and New Zealand ................................................................................................... 19
Section 2-9: Canada and the United States ............................................................................................... 20
Section 2-10: Latin America ..................................................................................................................... 21
Section 2-11: Western Europe ................................................................................................................... 22
Section 2-12: Central/Eastern Europe ...................................................................................................... 23
Section 2-13: Commonwealth of Independent States ............................................................................... 24
Section 3 — Implications: What Can Leaders Do? ��������������������������������������������������������������� 25
Section 3-1: Feedback and Recognition .................................................................................................... 25
Section 3-2: Friendship ............................................................................................................................. 26
Appendix 1 — Country-Level Engagement Results �������������������������������������������������������������� 27
Appendix 2 — Work Category Descriptions ������������������������������������������������������������������������� 28
Appendix 3 — Survey Methods ������������������������������������������������������������������������������������������� 29

2 Copyright © 2010 Gallup, Inc. All rights reserved.
Section 1 — A Global Perspective on Employee Engagement
Section 1-1: Introduction
High-quality jobs keep the world moving forward. Jobs that tap the energy and creative potential of populations everywhere. Jobs that give individuals a sense of pride and dignity as they build a more secure future for themselves and their families. Jobs that allow people to apply their strengths in ways that contribute to the growth and success of businesses, industries, and even entire societies.
Unfortunately, in most of the world, those types of jobs are hard to come by. It’s not that most of those who are lucky enough to have jobs claim to be dissatisfied with them. The opposite is true — almost three in four (73%) employed respondents worldwide told Gallup in 2009 and 2010 they were satisfied with the work they do.
In terms of global development, however, basic job satisfaction is insufficient in telling us how to improve productivity or wellbeing. Employees’ level of engagement at work has — over decades of research — proven far more powerful at identifying well-functioning workplaces and pinpointing the problems with those that are less effective. For example, 29% of employees who say they are generally satisfied with their work are thriving in their overall lives, compared with 45% of those who are engaged in their work, according to Gallup’s measure that evaluates wellbeing (see page 6).
The current report is based on an unprecedented study of engagement among more than 47,000 employees in 120 countries around the world. The overall results indicate that 11% of workers worldwide are engaged. In other words, about one in nine employees worldwide are emotionally connected to their workplaces and feel they have the resources and support they need to succeed. The majority of workers, 62%, are not engaged — that is, emotionally detached and likely to be doing little more than is necessary to keep their jobs. And 27% are actively disengaged, indicating they view their workplaces negatively and are liable to spread that negativity to others.
The following pages describe the powerful relationships between employees’ engagement at work, their productivity, and their personal wellbeing. These relationships reflect employees’ desire for work that helps them fulfill their aspirations for security, self-expression, and personal development. Focusing on that means working toward a more prosperous world — and perhaps also a safer one. As the International Labour Organization (ILO) has noted, decent work — that is, work that acknowledges basic aspirations such as stability, self-expression, and personal development — ultimately provides a more secure foundation for peace in workplaces and communities.
Overall Engagement Among 47,361 Employees in 120 Countries
Engaged
Not engaged
Actively disengaged
27%
62%
11%

Copyright © 2010 Gallup, Inc. All rights reserved. 3
Section 1-2: Engagement Improves Business Outcomes
Gallup’s employee engagement metric consists of 12 questions that tap into factors strongly related to productivity such as whether employees have the right materials and equipment to do their jobs, the quality of their relationships with coworkers and managers, and their alignment with the organization’s overall mission. (See Appendix 3 – Survey Methods)
Employee engagement at the business/work unit level relates to each of nine major performance outcomes such as turnover, absenteeism, safety, productivity, and profitability. These results can be seen in Gallup’s latest meta-analysis, which aggregates data through 2009 from 199 research studies across 152 organizations in 44 industries. The study also includes workgroups in 26 countries, with 23 organizations operating exclusively outside the United States.
In the following graph, the bars represent median differences between business/work units in the top quartile of employee engagement scores and those in the bottom quartile. Perhaps the most essential findings for business leaders are:
• The median productivity level among top-quartile business/work units was 18% higher than among bottom-quartile units.
• The median profitability level among top-quartile units was 16% higher than among those in the bottom quartile.
Employee Engagement Meta-Analysis: OutcomesDifference between top and bottom engagement quartiles
-37%
-25%
-49%
-27%
-49%
-41%
-60%
12%18% 16%
-70%
-60%
-50%
-40%
-30%
-20%
-10%
0%
10%
20%
30% Turnover
Absenteeism ShrinkageSafety
Incidents
Customer Productivity Profitability
High-Turnover
Orgs.
Low-Turnover
Orgs.
PatientSafety
IncidentsQuality
(Defects)
Section1 — AGlobalPerspectiveonEmployeeEngagement

4 Copyright © 2010 Gallup, Inc. All rights reserved.
Employee Engagement and Earnings Per Share (EPS)
Another recent analysis shows that organizations’ employee engagement scores are strongly related to one of the most commonly scrutinized measures of corporate financial health: earnings per share (EPS). The study included 54 companies in Gallup’s 2010 employee engagement database, roughly 60% of which either were based outside of North America or had a worldwide presence. Selected organizations met the following criteria:
• The organization was publicly traded and EPS information was available for the company and its top three industry competitors.
• Gallup surveyed a majority of the organization (as opposed to certain divisions or subsidiaries), with a high response rate (the average was 88% of eligible respondents).
• At least two waves of employee engagement data were available during the study period of 2007–2009, so that Gallup could identify organizations experiencing significant growth in engagement levels.
From the 54 companies in the study, Gallup created three groups:
1. Twenty-four organizations included in the study fell below the top quartile of companies in Gallup’s overall database, and their engagement levels did not reach the top quartile, or they remained stable or declined during the study period.
2. Thirty organizations were identified as having high engagement levels or engagement growth — meaning their most recent scores remained in or moved up to the top quartile of Gallup’s overall database, or they moved up two or more quartiles during the study period.
3. A more select group of 14 organizations (from within the group of 30 high engagement organizations) were identified as having exceptional employee engagement levels or engagement growth — meaning their most recent scores remained in the top decile of Gallup’s database over the study period, or they moved up two or more quartiles during the study period.
Median EPS for companies in each group were compared with those of their industry competitors. The differences are stark: Those in the lowest engagement group outperformed their competitors by 19% on average. However, results among those in the higher engagement groups were far more impressive; median earnings among those in the “top decile/exceptional growth” group were more than four times those of their industry competitors.
EPS Percentage Difference From Industry EquivalentsPercentage values based on medians within each group 2008-2009
342%
98%
19%
Engagement group 3 Top decile/exceptional growth
Engagement group 2Top quartile/high growth
Engagement group 1Below top quartile/no growth
Section1 — AGlobalPerspectiveonEmployeeEngagement

Copyright © 2010 Gallup, Inc. All rights reserved. 5
Engagement and Job Growth
What do improved performance outcomes and higher earnings mean for populations around the world? Perhaps the most important implication is growth in the availability of high-quality jobs. Gallup’s global employee engagement study finds that worldwide, engaged workers are more than twice as likely as those who are actively disengaged to say their organization is hiring and expanding its workforce. Conversely, one-third of actively disengaged workers say their company is letting people go, versus just 10% of engaged workers.
Section 1-3: Employee Engagement Relates to Personal Wellbeing
It’s not just having a job that makes people rate their lives more highly; there are also dramatic differences according to how people view the quality of their jobs. And as these results indicate, the workplace conditions the Q12 measures are an important factor in those perceptions.
Two perspectives on subjective wellbeing are found in the work of renowned scientists Daniel Kahneman, Ed Diener, and Angus Deaton: an evaluative approach that simply asks people to rate the quality of their lives overall, and a more immediate experiential approach that gauges people’s specific emotional states.
Based on what you know or have seen, would you say that, in general, your company or employer is hiring new people and expanding the size of its workforce, not changing the size of its workforce, or letting people go and reducing the size of its workforce?
37%
53%
10%
30%
55%
15%17%
50%
33%
Engaged employees Not engaged employees Actively disengaged employees
Expanding the size of its workforce Not changing the size of its workforce Reducing the size of its workforce
Section1 — AGlobalPerspectiveonEmployeeEngagement

6 Copyright © 2010 Gallup, Inc. All rights reserved.
Evaluative Wellbeing
To gauge evaluative wellbeing, Gallup combines respondents’ ratings of their current lives on a 0 to 10 ladder scale (based on the Cantril Self-Anchoring Striving Scale) with predicted ratings of their lives in five years. The results are used to place individuals into one of three categories:
1. Those who rate their present lives at 7 or higher, and anticipate their lives in five years will be at 8 or higher are classified as thriving.
2. Those who rate their present lives at 4 or lower, and anticipate their lives in five years will also be at 4 or lower are classified as suffering.
3. The remainder — those who give midlevel or inconsistent ratings to their present or future lives — are classified as struggling.
Among all 47,361 employees surveyed in 120 countries worldwide, 25% gave life ratings high enough to put them in the thriving group. Among engaged workers, however, the figure rises to 45%, while among those who are actively disengaged, 13% are thriving. This relationship is consistent across global regions, though more pronounced in some.
Experiential Wellbeing
While the different life ratings among engaged, not engaged, and actively disengaged employees worldwide are revealing, questions regarding respondents’ more immediate emotional states give a clearer picture of the extent to which workplace conditions are related to their day-to-day experiences. In all countries, Gallup asked respondents a series of questions about their interactions and emotions from the previous day. Again, these relationships are present in all global regions, with some variations in degree — see Section 2 for results broken out by region.
Engaged Employees Most Likely to Be ThrivingResults aggregated from employed respondents in 120 countries
65%
25%
10%
45%51%
4%
26%
67%
7%
67%
13%20%
All employees Engaged employees Not engaged employees Actively disengaged employees
Thriving Struggling Suffering
Section1 — AGlobalPerspectiveonEmployeeEngagement

Copyright © 2010 Gallup, Inc. All rights reserved. 7
The graph below presents the relationships between employee engagement and several experiential wellbeing measures among all respondents worldwide:
• Almost all engaged employees — 95% — say they were treated with respect all day yesterday, versus about three-fourths (74%) of actively disengaged employees.
• Eighty-eight percent of engaged employees say they experienced enjoyment for much of the previous day, versus more than two-thirds (67%) of actively disengaged employees.
• Actively disengaged employees are considerably more likely than engaged employees to say they felt stressed for much of the day — a finding that has implications for physical and emotional health.
• Actively disengaged employees are nearly twice as likely as those who are engaged to say they experienced anger for much of the previous day — 27% vs. 14%, respectively. Anger in the workplace is a major concern, as it disrupts productivity and can lead to aggressive behavior that puts coworkers at risk.
Physical Health
Employees’ responses regarding their physical health are also related to engagement levels in most global regions. Worldwide, 22% of actively disengaged employees say they have health problems that keep them from doing what people their age can normally do. Engaged (13%) and not engaged (16%) employees are less likely to report such problems. The causality in this relationship may flow either way — that is, health problems may lead workers to be less engaged at their jobs, or the stress that poor workplace conditions cause may lead to higher incidence of health problems among disengaged employees.
Engaged Employees Most Likely to Have High Experiential WellbeingResults aggregated from employed respondents in 120 countries
95%88%
82%
67%
25%29%
39%
90%
74%
14%19%
27%
Treated with respectall day yesterday
Experienced enjoyment formuch of the day yesterday
Experienced stress formuch of the day yesterday
Experienced anger formuch of the day yesterday
Engaged Not engaged Actively disengaged
Section1 — AGlobalPerspectiveonEmployeeEngagement

8 Copyright © 1993-1998, 2010 Gallup, Inc. All rights reserved.
Either way, their poorer physical health almost certainly contributes to lower productivity among actively disengaged workers. Twenty percent of employees in that category say they have had three or more days in the past month when illness has kept them from doing their usual activities, versus 13% of not engaged employees and 11% of engaged employees.
The relationship between employee engagement and sick days is particularly strong in Russia and other transitional countries in the Commonwealth of Independent States (CIS), where low levels of employee productivity remain a crucial concern. Among these populations, actively disengaged employees are considerably more likely than engaged employees to say they have had three or more sick days in the past month.
Section 1-4: Examining the Elements of Engagement Worldwide
Having discussed the positive outcomes associated with employee engagement — for companies and individual workers — it is important to look more closely at the results from the first truly global application of Gallup’s engagement metric. Called the Q12, the instrument consists of 12 questions ordered in a loose hierarchy, from those addressing workers’ most basic needs — such as knowing what they’re supposed to do and having the tools to do it — to higher order needs such as positive relationships and opportunities for personal growth at work.
In virtually all 120 countries, the first Q12 item was the one that received the highest average rating: “I know what is expected of me at work.” That makes sense, because no business would last very long if its employees did not have a clear idea of why they were there. In most global regions, the second item — “I have the materials and equipment I need to do my job right” — is also rated relatively highly. The full set of 12 items are listed on the next page, ranked according to level of agreement they are rated among the entire sample of more than 47,000 workers worldwide.
During the past 30 days, for about how many days did poor health keep you from doing your usual activities?Results aggregated from employed respondents in 120 countries
8%9%
11%
8%
13%15%
6%
20%
All employees Engaged employees Not engaged employees Actively disengaged employees
One to two days Three or more days
Section1 — AGlobalPerspectiveonEmployeeEngagement

Copyright © 1993-1998, 2010 Gallup, Inc. All rights reserved. 9
Results are also broken down by region to uncover patterns that may produce insights about conditions common to workplaces around the world, as well as those that point to differences arising from culture, socioeconomic status, industry type, etc. In many areas, there were too few respondents with formal employment to analyze results at the country level, so data were aggregated by region. For example, results from all countries studied in sub-Saharan Africa were aggregated to form a single region.
In most global regions, among the 12 items, two show up as the most poorly rated: 1) “In the last seven days, I have received recognition or praise for doing good work” and 2) “In the last six months, someone at work has talked to me about my progress.” These items are important to productivity because they signify the presence of feedback and motivation in the workplace. Employees who rate them highly have a clearer idea of what success means in their organizations and in their roles. Gallup researchers have consistently demonstrated the importance of positive reinforcement as an important -— but often scarce — source of motivation.
Agreement with the “recognition or praise” item is particularly low in former socialist countries, which may in some cases lack a predisposition to highlight the unique contributions of individuals — as well as a desire to stay “under the radar” of authority figures. In their 2006 book 12: The Elements of Great Managing, Gallup researchers Rodd Wagner and Jim Harter tell the story of a warehouse manager in Poland who began to implement new feedback and recognition technique with her employees. Unused to the attention, the workers acted shy and downplayed their own efforts. In her words, they were still learning “that their heads will not be cut off if they receive public praise.”
The item asking employees whether someone has “talked to me about my progress” receives the lowest average rating worldwide. Again, this points to insufficient efforts by employers and managers to instill feedback mechanisms — processes that not only give employees the feedback they need to improve their job performance, but also give them a chance to talk about what they need to remain engaged and productive at work. Wagner and Harter note that in some ways, this item is a long-term complement to the more immediate “recognition and praise” item.
Both of these items relate to the dignity and hope of employees, as well as their day-to-day productivity. This is true in developed as well as in developing countries — regular, individualized feedback is important to workers’ success and adaptability in any environment. The finding that there is so much room for improvement in each of them represents a great opportunity for progress.
Q12 Employee Engagement Items Ranked by level of agreement among respondents worldwide
I know what is expected of me at work.
I have the materials and equipment I need to do my job right.
At work, I have the opportunity to do what I do best every day.
My associates or fellow employees are committed to doing quality work.
The mission or purpose of my company makes me feel my job is important.
I have a best friend at work.
At work, my opinions seem to count.
My supervisor, or someone at work, seems to care about me as a person.
There is someone at work who encourages my development.
This last year, I have opportunities at work to learn and grow.
In the past seven days, I have received recognition or praise for doing good work.
In the past six months, someone at work has talked to me about my progress.
Section1 — AGlobalPerspectiveonEmployeeEngagement

10 Copyright © 2010 Gallup, Inc. All rights reserved.
This section breaks down the results from Gallup’s worldwide employee engagement survey by global region. There are vast differences in the types of workplaces most commonly found in different parts of the world. Perhaps the most important distinction is between countries with advanced economies — where most businesses are formally registered, and most jobs are found in the manufacturing or service sectors — and countries with developing economies, where more businesses operate outside the formal sector, and agriculture typically accounts for a much larger share of economic activity.
Those differences can be seen in the percentage of residents among all of those interviewed in each region who say they work for an employer. Regions with more advanced economies and institutions are able to support larger, more sophisticated forms of organization, which means large businesses account for a far greater share of employees. Residents of developing countries, on the other hand, are more likely to work in informal individual or family-based endeavors — many of them subsistence activities such as farming, hunting, or fishing. Only those who said they worked for an employer were asked Gallup’s employee engagement questions.
Among those who do work for employers, the relationships between engagement at work and personal wellbeing are relatively consistent worldwide. Gallup’s employee engagement measure aims to gauge employees’ psychological needs — such as support, respect, and a sense of purpose — that are relevant across industries and cultures.
The graph below reiterates the global findings in Section 1-3 that the evaluative and experiential wellbeing of employees is related to their engagement level. Among all employees interviewed in 120 countries, almost half (45%) of those who are engaged at work rate their present lives at 7 or higher on a 0 to 10 scale and predict their lives in five years will be at 8 or higher, which classifies them as thriving. By contrast, 26% of employees who are not engaged and 13% of actively disengaged employees are thriving.
Section 2 — Regional Breakouts
Engaged Employees Most Likely to Be ThrivingResults aggregated from employed respondents in 120 countries
65%
25%
10%
45%51%
4%
26%
67%
7%
67%
13%20%
All employees Engaged employees Not engaged employees Actively disengaged employees
Thriving Struggling Suffering

Copyright © 1993-1998, 2010 Gallup, Inc. All rights reserved. 11
The following pages present these results among individual regions and country groupings, with China and India broken out separately because of their large populations and importance to the global economy. Regional breakouts reveal that though it varies somewhat by degree, the relationship between employee engagement and overall life evaluation is present in all corners of the world.
The same is true of the link between employees’ engagement level and their experiential wellbeing — that is, their emotional and physical health. The global results for several indicators of experiential wellbeing are shown here, and then these results are broken down by individual country groupings in the remainder of this section.
Though the outcomes associated with employee engagement are broadly consistent worldwide, there are significant variations among regions with different cultural backgrounds and at different socioeconomic levels, offering some insight about how such broad contextual factors may influence engagement results.
Worldwide Results for Experiential Wellbeing Indicators
79%
88%82%
67%
19%21%14%
27%
15%11% 13%
20%
Experienced enjoyment the previous day Experienced anger the previous day Had three or more sick days in the past month
All employees Not engagedEngaged Actively disengaged
Section2 — RegionalBreakouts

12 Copyright © 1993-1998 2010 Gallup, Inc. All rights reserved.
Section 2-1: Sub-Saharan Africa
Countries included: Burundi, Cameroon, Chad, Comoros, Democratic Republic of the Congo, Djibouti, Ghana, Ivory Coast, Kenya, Malawi, Mali, Mauritania, Niger, Nigeria, Rwanda, Senegal, Somaliland region, South Africa, Tanzania, Uganda, Zambia, Zimbabwe
In sub-Saharan Africa, fewer than one in five adults surveyed (16%) indicate they work for an employer, reflecting the large share of the population engaged in subsistence farming and other forms of small-scale self-employment. Among those who do work for an employer, those who are actively disengaged significantly outnumber engaged employees. However, the ratio of 0.59 to 1 is somewhat more favorable than the overall global ratio of 0.41 to 1.
Engaged
Not engaged
Actively disengaged
22%
66%
13%
One-third of engaged employees in sub-Saharan Africa (33%) give present and future life evaluations high enough to classify them as thriving, according to Gallup’s measure of evaluative wellbeing. The thriving percentage drops to 15% among those who are not engaged, and to 12% among actively disengaged employees. Sub-Saharan African employees’ likelihood to say they experienced enjoyment for much of the previous day drops steadily with their engagement levels, and actively disengaged employees are more than twice as likely as engaged employees to say they experienced three or more sick days in the past month.
4,082 Respondents Who Work for an Employer Interviewed in Sub-Saharan AfricaEmployed sample represents 16% of all adults interviewed Among all who work for an employer:
Work full time 79%Work part time 21%
Among those who work part time for employer:
Also self-employed full time 8%Also self-employed part time 39%
CATEGORIES OF WORK (among those who work full time or part time for an employer)Professional workers 27%Service workers 14%Farming/fishing/forestry workers 14%Sales workers 10%Clerical/office workers 8%Construction/mining workers 6%Transportation workers 5%Manufacturing/production workers 4%Installation/repair workers 4%Managers 4%Business owners 3%Other --
Evaluative wellbeing, by employee engagement level
33%
61%
6%15%
77%
8%
72%
12% 16%
Engaged Not engaged Actively disengaged
Thriving Struggling Suffering
Experiential wellbeing, by employee engagement level
Engaged Not engaged Actively disengaged
87%74%
59%
21% 26% 17%11%24%
Experienced enjoymentthe previous day
Experienced angerthe previous day
Three or more sick daysin the past month
15%
Section2 — RegionalBreakouts
Copyright © 1993-1998, 2010 Gallup, Inc. All rights reserved. 13
Section 2-2: Middle East and North Africa
Countries/territories included: Algeria, Bahrain, Egypt, Iraq, Israel, Jordan, Kuwait, Lebanon, Morocco, Palestinian Territories, Qatar, Saudi Arabia, Sudan, Syria, Tunisia, United Arab Emirates, Yemen
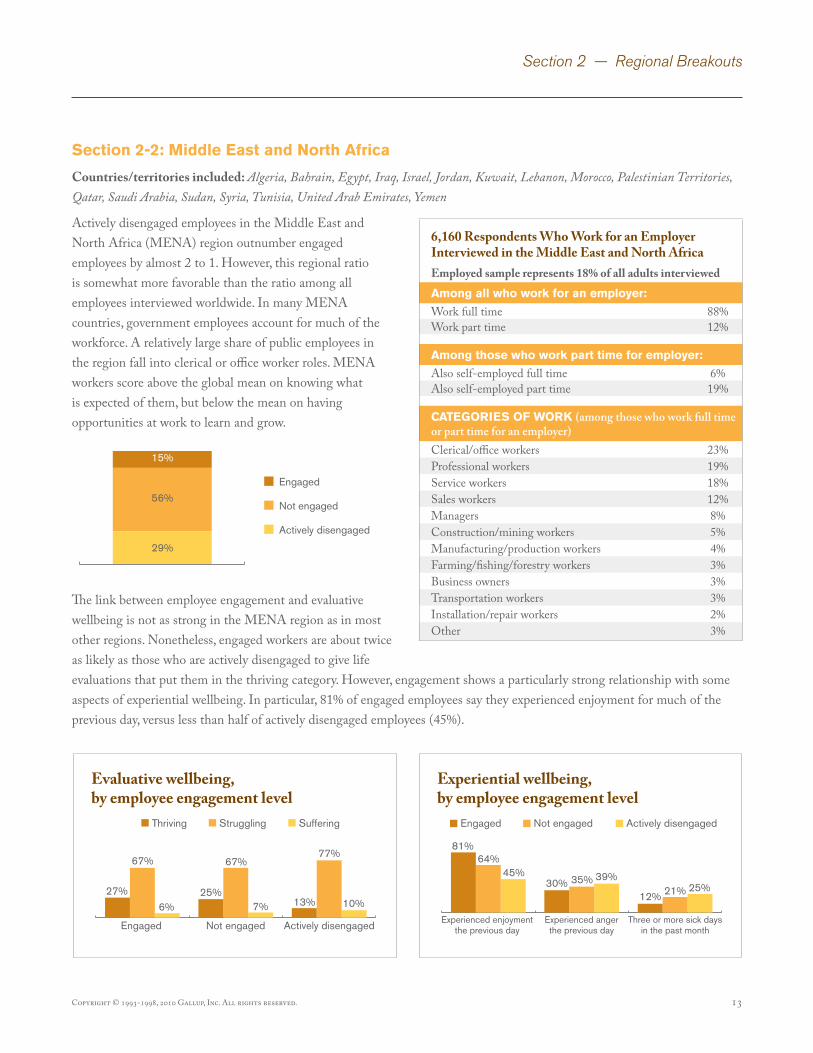
Actively disengaged employees in the Middle East and North Africa (MENA) region outnumber engaged employees by almost 2 to 1. However, this regional ratio is somewhat more favorable than the ratio among all employees interviewed worldwide. In many MENA countries, government employees account for much of the workforce. A relatively large share of public employees in the region fall into clerical or office worker roles. MENA workers score above the global mean on knowing what is expected of them, but below the mean on having opportunities at work to learn and grow.
Engaged
Not engaged
Actively disengaged
29%
56%
15%
The link between employee engagement and evaluative wellbeing is not as strong in the MENA region as in most other regions. Nonetheless, engaged workers are about twice as likely as those who are actively disengaged to give life evaluations that put them in the thriving category. However, engagement shows a particularly strong relationship with some aspects of experiential wellbeing. In particular, 81% of engaged employees say they experienced enjoyment for much of the previous day, versus less than half of actively disengaged employees (45%).
6,160 Respondents Who Work for an Employer Interviewed in the Middle East and North AfricaEmployed sample represents 18% of all adults interviewed Among all who work for an employer:
Work full time 88%Work part time 12%
Among those who work part time for employer:
Also self-employed full time 6%Also self-employed part time 19%
CATEGORIES OF WORK (among those who work full time or part time for an employer)Clerical/office workers 23%Professional workers 19%Service workers 18%Sales workers 12%Managers 8%Construction/mining workers 5%Manufacturing/production workers 4%Farming/fishing/forestry workers 3%Business owners 3%Transportation workers 3%Installation/repair workers 2%Other 3%
Evaluative wellbeing, by employee engagement level
27%
67%
6%25%
67%
7%
77%
13% 10%
Engaged Not engaged Actively disengaged
Thriving Struggling Suffering
Experiential wellbeing, by employee engagement level
Engaged Not engaged Actively disengaged
81%64%
45%35% 39%
21%12%25%
Experienced enjoymentthe previous day
Experienced angerthe previous day
Three or more sick daysin the past month
30%
Section2 — RegionalBreakouts

14 Copyright © 1993-1998, 2010 Gallup, Inc. All rights reserved.
Section 2-3: Japan and South Korea
As would be expected of populations in industrialized countries, a high proportion of employees in Japan and South Korea are office workers, professionals, or service-sector workers.
The ratio of engaged to actively disengaged employees in these two countries is relatively low at 0.29 to 1. Among the 12 individual engagement items, the mean scores for Japan and South Korea fall farthest below the global mean on “I have a best friend at work.” This item is also relatively low in other industrialized regions, including Western Europe and Canada and the U.S., suggesting a degree of skepticism among employers in industrialized countries that promoting workplace friendships is good for productivity.
Engaged
Not engaged
Actively disengaged
28%
65%
8%
Among employees in Japan and South Korea, there are relatively large differences in life evaluations by engagement level — in particular, 37% of those who are engaged fall into the thriving category, versus 7% of actively disengaged employees. Notably, this is the only country grouping in which engaged employees are more likely than those who are actively disengaged to say they have had three or more sick days in the past month. However, the incidence of sick days is low among all engagement groups.
740 Respondents Who Work for an Employer Interviewed in Japan and South KoreaEmployed sample represents 37% of all adults interviewed Among all who work for an employer:
Work full time 69%Work part time 31%
Among those who work part time for employer:
Also self-employed full time 2%Also self-employed part time 7%
CATEGORIES OF WORK (among those who work full time or part time for an employer)Clerical/office workers 28%Professional workers 19%Service workers 17%Managers 10%Manufacturing/production workers 8%Sales workers 6%Business owners 5%Construction/mining workers 4%Transportation workers 1%Installation/repair workers 1%Farming/fishing/forestry workers 1%Other 2%
Evaluative wellbeing, by employee engagement level
37%
59%
3%
24%
69%
8%
64%
7%
28%
Engaged Not engaged Actively disengaged
Thriving Struggling Suffering
Experiential wellbeing, by employee engagement level
Engaged Not engaged Actively disengaged
89%75%
57%
14% 17%5%8% 2%
Experienced enjoymentthe previous day
Experienced angerthe previous day
Three or more sick daysin the past month
12%
Section2 — RegionalBreakouts

Copyright © 1993-1998, 2010 Gallup, Inc. All rights reserved. 15
Section 2-4: Southern Asia
Countries/territories included: Afghanistan, Bangladesh, Nepal, Pakistan, Sri Lanka
Among respondents in Southern Asia who work for an employer, a relatively high 20% have jobs in the farming/fishing/forestry category. Employees in the region are just as likely to be engaged as they are to be actively disengaged; however, two-thirds fall into the not engaged category. The remaining one-third is evenly split between those who are engaged and actively disengaged. Employees in this region give particularly high ratings relative to the global averages on two items: 1) “In the last seven days, I have received recognition or praise for doing good work,” and 2) “I have a best friend at work.”
Engaged
Not engaged
Actively disengaged
17%
66%
17%
Among engaged employees in Southern Asia, one in five (20%) give life evaluations high enough to classify them as thriving. However, the relationship between life evaluation and employee engagement remains significant, with engaged employees 10 times as likely to be thriving as those who are actively disengaged. Moreover, engaged employees are much more likely than those who are actively disengaged to say they experienced enjoyment for much of the previous day.
1,450 Respondents Who Work for an Employer Interviewed in Southern AsiaEmployed sample represents 18% of all adults surveyed Among all who work for an employer:
Work full time 72%Work part time 28%
Among those who work part time for employer:
Also self-employed full time 15%Also self-employed part time 32%
CATEGORIES OF WORK (among those who work full time or part time for an employer)Farming/fishing/forestry workers 20%Professional workers 15%Service workers 12%Manufacturing/production workers 11%Clerical/office workers 10%Construction/mining workers 8%Managers 6%Sales workers 5%Transportation workers 5%Installation/repair workers 4%Business owners 3%Other 3%
Evaluative wellbeing, by employee engagement level
20%
72%
7% 14%
69%
17%
73%
2%
25%
Engaged Not engaged Actively disengaged
Thriving Struggling Suffering
Experiential wellbeing, by employee engagement level
Engaged Not engaged Actively disengaged
81%63%
48%
26% 30% 26%18%
28%
Experienced enjoymentthe previous day
Experienced angerthe previous day
Three or more sick daysin the past month
17%
Section2 — RegionalBreakouts
16 Copyright © 1993-1998, 2010 Gallup, Inc. All rights reserved.
Section 2-5: Southeast Asia
Countries/territories included: Cambodia, Indonesia, Malaysia, Philippines, Singapore, Thailand, Vietnam
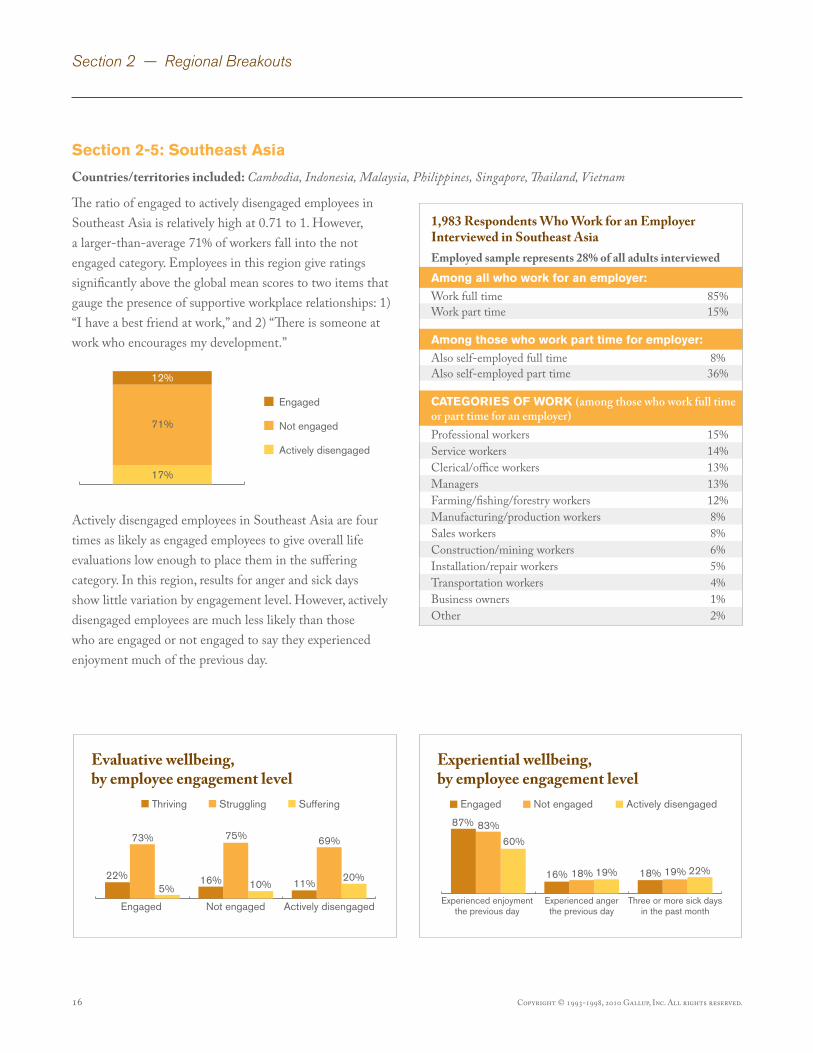
The ratio of engaged to actively disengaged employees in Southeast Asia is relatively high at 0.71 to 1. However, a larger-than-average 71% of workers fall into the not engaged category. Employees in this region give ratings significantly above the global mean scores to two items that gauge the presence of supportive workplace relationships: 1) “I have a best friend at work,” and 2) “There is someone at work who encourages my development.”
Engaged
Not engaged
Actively disengaged
17%
71%
12%
Actively disengaged employees in Southeast Asia are four times as likely as engaged employees to give overall life evaluations low enough to place them in the suffering category. In this region, results for anger and sick days show little variation by engagement level. However, actively disengaged employees are much less likely than those who are engaged or not engaged to say they experienced enjoyment much of the previous day.
1,983 Respondents Who Work for an Employer Interviewed in Southeast AsiaEmployed sample represents 28% of all adults interviewed Among all who work for an employer:
Work full time 85%Work part time 15%
Among those who work part time for employer:
Also self-employed full time 8%Also self-employed part time 36%
CATEGORIES OF WORK (among those who work full time or part time for an employer)Professional workers 15%Service workers 14%Clerical/office workers 13%Managers 13%Farming/fishing/forestry workers 12%Manufacturing/production workers 8%Sales workers 8%Construction/mining workers 6%Installation/repair workers 5%Transportation workers 4%Business owners 1%Other 2%
Evaluative wellbeing, by employee engagement level
Engaged Not engaged Actively disengaged
22%
73%
5%16%
75%
10%
69%
11%20%
Thriving Struggling Suffering
Experiential wellbeing, by employee engagement level
Engaged Not engaged Actively disengaged
87% 83%
60%
18% 19% 19%18% 22%
Experienced enjoymentthe previous day
Experienced angerthe previous day
Three or more sick daysin the past month
16%
Section2 — RegionalBreakouts

Copyright © 1993-1998, 2010 Gallup, Inc. All rights reserved. 17
Section 2-6: China (includes Hong Kong)
Two percent of Chinese employees are engaged in their jobs, while almost one-third (31%) are actively disengaged, implying that despite the country’s remarkable growth in recent decades, many of its workplaces are not as productive as they could be. Levels of employee engagement in Hong Kong are nearly identical to those in mainland China.
Chinese employees score below the global mean scores on two items that are among the most basic workplace factors: knowing what is expected of them, and feeling they have opportunities at work to do what they do best. They also give ratings well below the global average on “The mission or purpose of my organization makes me feel my job is important.”
Engaged
Not engaged
Actively disengaged
31%
67%
2%
Among Chinese employees overall, a relatively low 13% evaluate their lives highly enough to be classified as thriving. Among engaged employees however, the proportion rises to 24%. Though engaged employees are no less likely than those who are actively disengaged to have experienced enjoyment the previous day, they are significantly less likely to have experienced anger. Finally, among those employees who are engaged at work, virtually none had three or more sick days in the past month, versus 8% of actively disengaged employees.
1,333 Respondents Who Work for an Employer Interviewed in ChinaEmployed sample represents 27% of all adults surveyed Among all who work for an employer:
Work full time 83%Work part time 17%
Among those who work part time for employer:
Also self-employed full time 12%Also self-employed part time 27%
CATEGORIES OF WORK (among those who work full time or part time for an employer)Professional workers 19%Clerical/office workers 18%Service workers 17%Farming/fishing/forestry workers 12%Manufacturing/production workers 11%Sales workers 8%Managers 6%Construction/mining workers 4%Transportation workers 3%Installation/repair workers 2%Business owners 2%Other 1%
Evaluative wellbeing, by employee engagement level
Engaged Not engaged Actively disengaged
24%
75%
1%15%
77%
8%
78%
7% 15%
Thriving Struggling Suffering
Experiential wellbeing, by employee engagement level
Engaged Not engaged Actively disengaged
83% 89% 83%
14% 20%5%0% 8%
Experienced enjoymentthe previous day
Experienced angerthe previous day
Three or more sick daysin the past month
6%
Section2 — RegionalBreakouts

18 Copyright © 1993-1998, 2010 Gallup, Inc. All rights reserved.
Section 2-7: India
As in China, a relatively large share of Indian employees indicate they work in agriculture-related jobs, despite the country’s strong growth in recent years. India’s employee engagement ratio is very low by global standards, with employees more than four times as likely to be actively disengaged as they are to be engaged at work.
Engaged
Not engaged
Actively disengaged37%
55%
8%
Almost half of India’s actively disengaged workers (47%) give overall life evaluations so low that they are classified as suffering. By contrast, 11% of engaged and 10% of not engaged employees are suffering. Moreover, 44% of those who are actively disengaged say they experienced anger the previous day, about three times the percentage of engaged employees who respond this way. Actively disengaged employees are also about six times as likely as engaged employees to have had three or more sick days in the past month.
677 Respondents Who Work for an Employer Interviewed in IndiaEmployed sample represents 22% of all adults surveyed Among all who work for an employer:
Work full time 95%Work part time 5%
Among those who work part time for employer:
Also self-employed full time *Also self-employed part time *
CATEGORIES OF WORK (among those who work full time or part time for an employer)Farming/fishing/forestry workers 25%Clerical/office workers 16%Manufacturing/production workers 11%Service workers 11%Sales workers 8%Transportation workers 7%Professional workers 6%Construction/mining workers 5%Managers 3%Business owners 3%Installation/repair workers 2%Other 6%*Sample size too small to report results
Evaluative wellbeing, by employee engagement level
22%
67%
11% 8%
82%
10%
49%
4%
47%
Engaged Not engaged Actively disengaged
Thriving Struggling Suffering
Experiential wellbeing, by employee engagement level
Engaged Not engaged Actively disengaged
88% 88%
64%
32%44%
17%5%
31%
Experienced enjoymentthe previous day
Experienced angerthe previous day
Three or more sick daysin the past month
15%
Section2 — RegionalBreakouts

Copyright © 1993-1998, 2010 Gallup, Inc. All rights reserved. 19
Section 2-8: Australia and New Zealand
As in Canada and the U.S., one-fourth of employees in Australia and New Zealand fall into the “professional workers” category. Average engagement scores among employees in Australia and New Zealand are relatively high, with about one engaged employee for each of those who are actively disengaged. Employees in these countries score significantly above the global mean on the most basic workplace item, “I know what is expected of me at work.” However, they fall significantly below the global mean on the item “I have a best friend at work.”
Engaged
Not engaged
Actively disengaged
20%
61%
19%
Overall, life evaluations among employees in Australia and New Zealand are among the highest in the world, with 51% falling into the thriving category. As in most country groups, however, differences by employee engagement level are striking — two-thirds (66%) of employees are thriving, versus about one-third (35%) of actively disengaged employees. Gallup did not ask questions about employees’ emotional states in this region. However, about one-third (32%) of actively disengaged employees say they had three or more sick days in the past month, versus about one-fifth (19%) of engaged employees.
1,971 Respondents Who Work for an Employer Interviewed in Australia and New ZealandAmong all who work for an employer:
Work full time *Work part time *
Among those who work part time for employer:
Also self-employed full time *Also self-employed part time *
CATEGORIES OF WORK (among those who work full time or part time for an employer) **Professional workers 26%Service workers 14%Managers 14%Clerical/office workers 12%Skilled trades 8%Sales workers 8%Semi-skilled workers 6%Laborers 5%Technology professionals 3%Manufacturer’s representatives 1%Business owners 1%Other 6%*Question not asked in Australia or New Zealand**Some categories differ from those used in other regions
Evaluative wellbeing, by employee engagement level
Engaged Not engaged Actively disengaged
66%
33%
1%
52% 46%
3%
57%
35%
7%
Thriving Struggling Suffering
Experiential wellbeing, by employee engagement level
Engaged Not engaged Actively disengaged
* * * * *
24%19%32%
Experienced enjoymentthe previous day
Experienced angerthe previous day
Three or more sick daysin the past month
*
* Question not asked in Australia or New Zealand
Section2 — RegionalBreakouts

20 Copyright © 1993-1998, 2010 Gallup, Inc. All rights reserved.
Section 2-9: Canada and the United States
Average engagement scores among employees in Canada and the U.S. are among the highest in the world. In fact, it is the only region other than Latin America in which engaged employees substantially outnumber those who are actively disengaged. Employees in Canada and the U.S. score significantly above the global mean on the perception that their supervisor cares about them. However, they fall significantly below the global mean on the item “I have a best friend at work.” This item also receives below-average ratings in other industrialized regions, including Western Europe, Australia and New Zealand, and Japan and South Korea.
Engaged
Not engaged
Actively disengaged
18%
57%
26%
As in Australia and New Zealand, overall life evaluations among employees in Canada and the U.S. are very high by global standards. However, about one-third (32%) of actively disengaged employees give life ratings high enough to classify them as thriving, versus almost two-thirds (62%) of engaged employees. The links between employee engagement and emotional wellbeing are relatively strong in this region. For example, actively disengaged employees are more than three times as likely as engaged employees to say they experienced anger for
much of the previous day.
10,195 Respondents Who Work for an Employer Interviewed in Canada and the United StatesAmong all who work for an employer:
Work full time *Work part time *
Among those who work part time for employer:
Also self-employed full time *Also self-employed part time *
CATEGORIES OF WORK (among those who work full time or part time for an employer)Professional workers 38%Managers 14%Service workers 12%Clerical/office workers 9%Sales workers 8%Manufacturing/production workers 5%Construction/mining workers 5%Transportation workers 3%Installation/repair workers 2%Farming/fishing/forestry workers 1%Business owners 1%Other 16%*Question not asked in Canada.
Evaluative wellbeing, by employee engagement level
Engaged Not engaged Actively disengaged
62%
36%
2%
53%44%
3%
61%
32%
7%
Thriving Struggling Suffering
Experiential wellbeing, by employee engagement level
Engaged Not engaged Actively disengaged93% 85%
67%
15%26%
11%11% 17%
Experienced enjoymentthe previous day
Experienced angerthe previous day
Three or more sick daysin the past month
8%
Section2 — RegionalBreakouts

Copyright © 1993-1998, 2010 Gallup, Inc. All rights reserved. 21
Section 2-10: Latin America
Countries included: Argentina, Bolivia, Brazil, Chile, Colombia, Costa Rica, Dominican Republic, Ecuador, El Salvador, Guatemala, Honduras, Mexico, Nicaragua, Panama, Paraguay, Peru, Uruguay, Venezuela
Employees in Latin America post the most favorable employee engagement ratio of any global region, with 1.5 engaged employees for every actively disengaged employee. However, Latin American employees also tend to give unusually positive responses when asked about other aspects of their lives, possibly reflecting a cultural influence on their response style. Among all 12 engagement items, Latin American employees score significantly above the global means on “I have opportunities at work to learn and grow” and “I have opportunities to do what I do best every day.”
Engaged
Not engaged
Actively disengaged
16%
60%
24%
Two-thirds of engaged employees in Latin America (66%) are classified as thriving, according to how well they rate their present and future lives. However, that number drops sharply to just over one-third (36%) among actively disengaged employees. Regarding experiential wellbeing, there is a particularly strong relationship between employee engagement and anger among Latin American workers, with actively disengaged employees about three times as likely as engaged employees to say they experienced anger for much of the previous day.
4,939 Respondents Who Work for an Employer Interviewed in Latin AmericaEmployed sample represents 27% of all adults interviewed Among all who work for an employer:
Work full time 78%Work part time 22%
Among those who work part time for employer:
Also self-employed full time 5%Also self-employed part time 27%
CATEGORIES OF WORK (among those who work full time or part time for an employer)Service workers 21%Clerical/office workers 16%Professional workers 16%Manufacturing/production workers 12%Sales workers 9%Construction/mining workers 6%Business owners 5%Farming/fishing/forestry workers 5%Transportation workers 4%Installation/repair workers 2%Managers 2%Other 3%
Evaluative wellbeing, by employee engagement level
Engaged Not engaged Actively disengaged
66%
33%
1%
55%43%
2%
59%
36%
6%
Thriving Struggling Suffering
Experiential wellbeing, by employee engagement level
Engaged Not engaged Actively disengaged92% 86%
71%
14%26%
12%10% 16%
Experienced enjoymentthe previous day
Experienced angerthe previous day
Three or more sick daysin the past month
9%
Section2 — RegionalBreakouts

22 Copyright © 1993-1998, 2010 Gallup, Inc. All rights reserved.
Section 2-11: Western Europe
Countries included: Austria, Denmark, France, Germany, Ireland, Italy, Portugal, Slovenia, Spain, Sweden, Switzerland, United Kingdom
Among the 12 Western European countries studied, most workers are employed in office jobs or jobs in the service sector. The ratio of engaged to actively disengaged workers in this region (.81 to 1) is relatively high by global standards, though it falls well below Canada and the United States (1.44 to 1). Among the 12 engagement items, employees in Western Europe score significantly above the global mean scores on knowing what is expected of them, having the materials and equipment to do their job right, and believing their fellow associates are committed to quality.
Engaged
Not engaged
Actively disengaged
21%
63%
17%
Majorities of engaged (60%) and not engaged (53%) workers in Western Europe give evaluations of their present and future lives that are high enough to classify them as thriving. However, more than one-third (34%) of actively disengaged employees do so. Moreover, actively disengaged employees in this region are twice as likely as engaged employees to say they experienced anger for much of the previous day. (Note: “Sick days” results are not presented here because the question was not asked in this region concurrently with the employee engagement questions.)
4,267 Respondents Who Work for an Employer Interviewed in Western EuropeEmployed sample represents 39% of all adults interviewed Among all who work for an employer:
Work full time 78%Work part time 22%
Among those who work part time for employer:
Also self-employed full time 2%Also self-employed part time 10%
CATEGORIES OF WORK (among those who work full time or part time for an employer)Clerical/office workers 22%Professional workers 22%Service workers 20%Managers 11%Sales workers 7%Manufacturing/production workers 6%Construction/mining workers 4%Installation/repair workers 2%Business owners 2%Transportation workers 2%Farming/fishing/forestry workers 1%Other 2%
Evaluative wellbeing, by employee engagement level
Engaged Not engaged Actively disengaged
60%39%
1%
53%44%
3%
58%
34%
8%
Thriving Struggling Suffering
Experiential wellbeing, by employee engagement level
91%81%
67%
18%32%
Experienced enjoymentthe previous day
Experienced angerthe previous day
16%
Engaged Not engaged Actively disengaged
Section2 — RegionalBreakouts

Copyright © 1993-1998, 2010 Gallup, Inc. All rights reserved. 23
Section 2-12: Central/Eastern Europe
Countries included: Albania, Bosnia and Herzegovina, Bulgaria, Croatia, Czech Republic, Cyprus, Estonia, Greece, Kosovo, Latvia, Lithuania, Macedonia, Montenegro, Poland, Romania, Serbia, Turkey
Compared with their neighbors to the west, Central and Eastern European countries have a greater share of manufacturing workers, and a lower proportion of office/clerical workers. They also have lower average employee engagement scores, with three actively disengaged employees for every one engaged employee in the region. Mean scores for the 12 individual items reveal that the region’s employees score significantly below the global mean on “someone at work has talked to me about my progress.”
Engaged
Not engaged
Actively disengaged
30%
60%
10%
Overall, life evaluations in this set of countries are relatively low — 21% of employed respondents overall are classified as thriving, compared with 50% in Europe’s more economically developed nations. Nonetheless, evaluative wellbeing in this region is strongly related to employees’ engagement level, with 36% of engaged employees thriving versus 15% of those who are actively disengaged. Similarly, the proportion of engaged workers in Europe’s developing or transition countries who have had three or more sick days in the past month is 12%, but among actively disengaged workers the figure rises to 21%.
5,184 Respondents Who Work for an Employer Interviewed in Central/Eastern EuropeEmployed sample represents 34% of all adults interviewed Among all who work for an employer:
Work full time 88%Work part time 12%
Among those who work part time for employer:
Also self-employed full time 12%Also self-employed part time 25%
CATEGORIES OF WORK (among those who work full time or part time for an employer)Professional workers 19%Service workers 18%Clerical/office workers 16%Manufacturing/production workers 12%Sales workers 11%Construction/mining workers 7%Managers 5%Transportation workers 5%Installation/repair workers 3%Farming/fishing/forestry workers 2%Business owners 1%Other 1%
Evaluative wellbeing, by employee engagement level
Engaged Not engaged Actively disengaged
36%52%
12%24%
66%
10%
67%
15% 18%
Thriving Struggling Suffering
Experiential wellbeing, by employee engagement level
Engaged Not engaged Actively disengaged
78% 73%57%
20%30%
13%12% 21%
Experienced enjoymentthe previous day
Experienced angerthe previous day
Three or more sick daysin the past month
21%
Section2 — RegionalBreakouts

24 Copyright © 1993-1998, 2010 Gallup, Inc. All rights reserved.
Section 2-13: Commonwealth of Independent States
Countries included: Armenia, Azerbaijan, Belarus, Georgia*, Kazakhstan, Kyrgyzstan, Moldova, Mongolia**, Russia, Tajikistan, Turkmenistan***, Ukraine, Uzbekistan
The former Soviet republics now associated with the Commonwealth of Independent States (CIS), plus neighboring countries Georgia and Mongolia, form the final country group. Employees in this group post one of least favorable engagement ratios of any global region, with more than four actively disengaged employees for every one engaged employee. Results for individual items indicate these workers are significantly below the global mean in their likelihood to say they have opportunities at work to learn and grow, and to say someone at work has talked to them about their progress.
Engaged
Not engaged
Actively disengaged37%
56%
8%
The evaluative wellbeing results for this country group are similar to those for the total worldwide sample, with engaged employees about three times as likely as those who are actively disengaged to give life evaluations high enough to classify them as thriving. In all three engagement categories, employees’ likelihood to say they experienced anger the previous day is low compared with the global results. Conversely, employees in this country group are more likely than those in any other to say they have had three or more sick days in the past month. However, among actively disengaged workers in this group, the figure reaches 39%.
* Georgia is included, through it withdrew from the CIS in 2009.** Mongolia is included because of its proximity to other countries in the group.*** CIS associate member
4,389 Respondents Who Work for an Employer Interviewed in CIS Countries, plus Georgia and MongoliaEmployed sample represents 31% of all adults interviewed Among all who work for an employer:
Work full time 82%Work part time 18%
Among those who work part time for employer:
Also self-employed full time 7%Also self-employed part time 36%
CATEGORIES OF WORK (among those who work full time or part time for an employer)Professional workers 31%Service workers 16%Manufacturing/production workers 10%Sales workers 8%Clerical/office workers 8%Construction/mining workers 7%Transportation workers 6%Farming/fishing/forestry workers 5%Managers 4%Installation/repair workers 3%Business owners 1%Other 1%
Evaluative wellbeing, by employee engagement level
Engaged Not engaged Actively disengaged
40%56%
4%
27%
63%
10%
68%
13% 20%
Thriving Struggling Suffering
Experiential wellbeing, by employee engagement level
Engaged Not engaged Actively disengaged
82%73%
58%
12% 12%26%23%
39%
Experienced enjoymentthe previous day
Experienced angerthe previous day
Three or more sick daysin the past month
8%
Section2 — RegionalBreakouts

Copyright © 1993-1998, 2010 Gallup, Inc. All rights reserved. 25
Section 3 — Implications: What Can Leaders Do?
Gallup’s global employee engagement research sheds new light on the degree to which employees’ experiences at work color the way they view their lives overall. This insight alone underscores the importance of working toward a world in which more people find their jobs enjoyable and rewarding. Engaged employees are also more likely than those who are less engaged to report feeling positive emotions such as enjoyment, and less likely to report feeling stressed or angry — a finding that has implications not only for employees’ personal wellbeing, but also for the impact they have on their coworkers, families, and communities.
The results also suggest that some workplace conditions that Gallup has identified as key aspects of engagement are consistently among the lowest rated worldwide. Among these are the items “In the past seven days, I have received recognition or praise for doing good work” and “In the past six months, someone at work has talked to me about my progress.”
Section 3-1: Feedback and Recognition
Some of the conditions that are important to productivity — including regular feedback on employees’ progress and recognition for good work — are rated relatively low in every region and country grouping studied. There are many possible reasons for this, including that in many types of workplaces, managers are responsible for large numbers of employees, making it more difficult to give the kind of individualized attention required to ensure these needs are met. Moreover, when it comes to jobs with a high degree of routine, such as assembly line workers or bus drivers, feedback and recognition may be overlooked in jobs that require repetitive tasks where managers do not differentiate individual contributions.
However, in many cases it may also be that historically there has been less attention paid to these aspects of workers’ experiences, in part because, as Wagner and Harter note in their book 12: The Elements of Great Managing, “cultures of recognition” don’t tend to evolve naturally among most workgroups. “Some of the deepest human emotions are essentially selfish. We are better wired to receive praise than to give it. We feel our own hunger more than we empathize with others around us.”
Nonetheless, Gallup research has shown that feedback and recognition are important to productivity among all job types, and that the best managers are those who find ways to measure and celebrate excellence no matter what the role. In many workplaces around the world, this may represent a long-overlooked opportunity to boost employees’ motivation. In countries where workplaces are commonly hindered by low morale and high levels of absenteeism, leaders who implement and maintain consistent, individualized feedback and recognition processes may see dramatic per-person productivity gains over the long term.
26 Copyright © 1993-1998, 2010 Gallup, Inc. All rights reserved.
Section 3-2: Friendship
As countries advance socially and economically, workers typically see dramatic benefits. Gains in efficiency and productivity mean the average employee’s income rises, and more well-developed labor markets tend to make a greater variety of job opportunities available. However, employee engagement is not always higher among economically advanced countries, as results from Japan and South Korea reveal. Cultural factors may play a role in responses from different regions, but one engagement item is consistently lower among employees in more developed regions than in those that are less developed: “I have a best friend at work.”
Why might this be? Again, there are many possible reasons. However, one likely factor is that in much of the developing world, businesses are relatively small on average, many are family-based. In more advanced economies, workers are more likely to be employed by larger organizations, where personal ties among employees tend to be weaker. Some would see this as a positive development. In fact, many corporate leaders have questioned the inclusion of this question, sometimes asserting that personal relationships in the workplace are distracting and detrimental.
However, as noted in 12: The Elements of Great Managing, this item is included for a good reason — it predicts higher performance. In large corporations, just as in family businesses, workers are more likely to show a deep sense of affiliation toward their employer if they are emotionally connected to the people with whom they work.
Feedback, recognition, and positive relationships — these kinds of workplace conditions are fundamental enough that they can serve as focal points for leaders in a broad range of contexts and cultures. The positive outcomes consistently associated with employee engagement — for organizations and for individuals — suggest it is one yardstick by which we can measure progress toward greater productivity and personal fulfillment for workers worldwide.
Section3 — Implications:WhatCanLeadersDo?

Copyright © 2010 Gallup, Inc. All rights reserved. 27
In 50 of the 120 countries where Gallup asked its employee engagement questions in 2009 and 2010, the samples of respondents who worked for an employer were large enough to break out their results separately. Following are the overall engagement figures for employees in those countries, listed by region.
Asia EngagedNot
EngagedActively
Disengaged
Afghanistan 11% 58% 31%China 2% 67% 31%India 8% 55% 37%Japan 7% 64% 30%Malaysia 13% 79% 8%Pakistan 9% 74% 17%Singapore 2% 78% 21%
Commonwealth of Independent States Engaged
Not Engaged
Actively Disengaged
Belarus 6% 50% 44%Kazakhstan 8% 42% 51%Moldova 16% 62% 22%Russia 7% 56% 38%Turkmenistan 25% 48% 27%Ukraine 8% 61% 31%
Europe EngagedNot
EngagedActively
Disengaged
Albania 12% 70% 18%Austria 23% 62% 15%Bulgaria 8% 63% 28%Croatia 2% 47% 52%Czech Republic 3% 60% 37%Denmark 20% 73% 8%France 11% 61% 28%Germany 11% 66% 23%Montenegro 10% 42% 48%Poland 11% 64% 25%Portugal 13% 72% 15%Serbia 4% 44% 51%Spain 19% 59% 21%Sweden 20% 66% 14%Switzerland 23% 68% 9%Turkey 11% 58% 31%United Kingdom 20% 58% 22%
Latin America EngagedNot
EngagedActively
Disengaged
Argentina 16% 62% 22%Brazil 29% 61% 10%Chile 22% 55% 23%Costa Rica 31% 60% 9%Guatemala 30% 46% 25%Mexico 23% 58% 19%Uruguay 18% 57% 25%Venezuela 12% 65% 23%
Middle East and North Africa Engaged
Not Engaged
Actively Disengaged
Bahrain 27% 60% 13%Egypt 13% 55% 32%Israel 14% 72% 14%Kuwait 25% 60% 15%Qatar 21% 64% 16%Saudi Arabia 13% 75% 12%Tunisia 21% 44% 35%United Arab Emirates 25% 67% 8%
Canada and the United States Engaged
Not Engaged
Actively Disengaged
Canada 20% 64% 16%United States 28% 54% 18%
Australia and New Zealand Engaged
Not Engaged
Actively Disengaged
Australia 18% 61% 21%New Zealand 23% 61% 16%
Appendix 1 — Country-Level Engagement Results

28 Copyright © 2010 Gallup, Inc. All rights reserved.
Appendix 2 — Work Category Descriptions
Below are brief descriptions of the work categories presented in the tables on pages 12-24. Interviewers in each country used these descriptions as a guide for coding open-ended responses to the following question: “Could you tell me the general category of work you do in your primary job?”
Category Description/Examples
Professional worker Lawyer, doctor, scientist, teacher, engineer, nurse, accountant, computer programmer, architect, investment banker, stock broker, marketing, musician, artist
Manager, executive, or official
In a business, government agency, or other organization
Business owner Store, factory, plumbing contractor, etc. (self-employed)
Clerical or office worker
In business, government agency, or other type of organization such as a typist, secretary, postal clerk, telephone operator, computer operator, data entry, bank clerk, etc.
Sales worker Clerk in a store, door-to-door salesperson, sales associate, manufacturer’s representative, outside salesperson
Service worker Policeman/woman, fireman, waiter or waitress, maid, nurse's aide, attendant, barber or beautician, fast food, landscaping, janitorial, personal care worker
Construction or mining worker
Construction manager, plumber, carpenter, electrician, other construction trades, miner or other extraction worker
Manufacturing or production worker
Operates a machine in a factory, is an assembly-line worker in a factory, includes non-restaurant food preparation (baker), printer, print shop worker, garment, furniture, and all other manufacturing
Transportation worker Drives a truck, taxi cab, or bus, etc., works with or on aircraft (including pilots and flight attendants), trains, boats, teamster, longshoreman, delivery company worker or driver, moving company worker
Installation or repair worker
Garage mechanic, linesman, other installation, maintenance, or repair worker
Farming, fishing, or forestry worker
Farmer, farm worker, aquaculture or hatchery worker, fisherman, deck hand on fishing boat, lumberjack, forest management worker
Other (list)

Copyright © 2010 Gallup, Inc. All rights reserved. 29
For 116 of the 120 countries included in the global employee engagement analysis, Gallup collected data in 2009 as part of its annual worldwide survey research initiative. The exceptions are Australia, Canada, New Zealand, and the United States, where separate surveys were conducted. To ensure that Gallup’s global data are representative of 95% of the world’s adult population, the following methodology was employed:
• The target population is the entire civilian, non-institutionalized, population aged 15 and older.
• With some exceptions, all samples are probability based and nationally representative.*
• There is a standard set of core questions used worldwide.
• In some regions, supplemental questions are asked in addition to core questions. For example, the questions used in heavily indebted poor countries are tailored toward providing information about progress on the United Nations’ Millennium Development Goals.
• The questionnaire is translated into the major languages of each country.**
• Interviewing supervisors and interviewers are trained both on the questionnaire and on the execution of field procedures. This interviewing training usually takes place in a central location.
• Telephone surveys are used in countries where telephone coverage represents at least 80% of the population or is the customary survey methodology. In countries where telephone interviewing is employed, Random-Digit-Dial (RDD) or a nationally representative list of phone numbers is used. Telephone methodology is typical in the United States, Canada, Western Europe, Japan, Australia, etc.
• In the developing world, including much of Latin America, CIS, nearly all of Asia, and the Middle East and North Africa, an area frame design is used for face-to-face interviewing.
• Face-to-face interviews are approximately 1 hour, while telephone interviews are about 30 minutes.
• Quality control procedures are used to validate that correct samples are selected and that the correct person is randomly selected in each household.
• The typical survey includes at least 1,000 interviews of individuals. In some countries, oversamples are collected in major cities or areas of special interest. Additionally, in some large countries, such as China and Russia, sample sizes of at least 2,000 are collected. Although rare, in some instances the sample size is between 500 and 1,000.
* Exceptions include areas where the safety of the interviewing staff is threatened, scarcely populated islands in some countries, and areas that interviewers can reach only by foot, animal, or small boat.
** The translation process starts with an English, French, or Spanish version, depending on the region. A translator who is proficient in the original and target languages translates the survey into the target language. A second translator reviews the language version against the original version and recommends refinements.
Appendix 3 — Survey Methods

30 Copyright © 2010 Gallup, Inc. All rights reserved.
Sampling
STEP 1 — Selecting Primary Sampling Units (PSUs): In countries where face-to-face surveys are conducted, the first stage of sampling is the identification of PSUs, consisting of household clusters. PSUs are stratified by population size and/or geography, and clustering is achieved through one or more sampling stages. Where population information is available, sample selection is based on probabilities proportional to population size, otherwise simple random sampling is used.
STEP 2 — Selecting Households: Random route procedures are used to select sampled households. Unless an outright refusal occurs, interviewers make up to three attempts to survey the sampled household. To increase the probability of contact and completion, attempts are made at different times of the day, and where possible, on different days. If an interview cannot be obtained at the initial sampled household, a simple substitution method is used.
In countries where telephone interviewing is employed, RDD or a nationally representative list of phone numbers is used. In select countries where cell phone penetration is high, a dual sampling frame is used. At least three attempts are made to reach a person in each household.
STEP 3 — Selecting Respondents: In face-to-face and telephone methodologies, random respondent selection is achieved by using either the latest birthday or Kish grid method.
Statistical Validity
These probability surveys are valid within a statistical margin of error, also called a 95% confidence interval. This means that if the survey is conducted 100 times using the exact same procedures, the margin of error would include the “true value” in 95 out of the 100 surveys. With a sample size of 1,000, the margin of error for a percentage at 50% is ±3 percentage points.***
Because these surveys use a clustered sample design, the margin of error varies by question, and if a user is making critical decisions based on the margin of error, he or she should consider inflating the margin of error by the design effect. The design effect accounts for the potential of correlated responses and increase in the margin of error caused by the sample of clusters of households in PSU.
Contact Dr. Robert D. Tortora, Chief Methodologist of Gallup, at [email protected] for more detailed information or any questions regarding the methods used in Gallup’s global research.
*** Assuming other sources of error, such as nonresponse, some members of the targeted sample are equal. Other errors that can affect survey validity include measurement error associated with the questionnaire, such as translation issues and coverage error, where a part or parts of the target population, aged 15 and older, have a zero probability of being selected for the survey.
Appendix3—SurveyMethods

Copyright © 2010 Gallup, Inc. All rights reserved. 31
Other Surveys
U.S. data included in this report come from Gallup’s Daily tracking study, which interviews approximately 1,000 adults, aged 18 and older, each day. Employee engagement results are based on telephone interviews conducted January-April 2009 with 9,199 respondents employed full time or part time. For these results, one can say with 95% confidence that the maximum margin of sampling error is less than ±1 percentage point.
Results from Australia are based on telephone interviews conducted in September 2008 with 985 respondents, aged 18 and older, employed full time or part time. For these results, one can say with 95% confidence that the maximum margin of sampling error is less than ±3 percentage points.
Results from Canada are based on telephone interviews conducted in December 2008 with 992 respondents, aged 18 and older, employed full time or part time. For these results, one can say with 95% confidence that the maximum margin of sampling error is less than ±3 percentage points.
Results from New Zealand are based on telephone interviews conducted in September 2008 with 986 respondents, aged 18 and older, employed full time or part time. For these results, one can say with 95% confidence that the maximum margin of sampling error is less than ±3 percentage points.
In all four countries, interviews were conducted with respondents on landline telephones and cellular phones. In addition to sampling error, question wording and practical difficulties in conducting surveys can introduce error or bias into the findings of public opinion polls.
Employee Engagement Meta-Analysis
Gallup’s most recent meta-analysis on employee engagement accumulated 199 research studies across 152 organizations in 44 industries and 26 countries. Within each study, Gallup researchers statistically calculated the business/work unit-level relationship between employee engagement and performance outcomes that the organizations supplied. In total, Gallup studied 32,394 business/work units including 955,905 employees. Nine outcomes were studied: customer loyalty/engagement, profitability, productivity, turnover, safety incidents, shrinkage, absenteeism, patient safety incidents, and quality (defects).
Individual studies often contain small sample sizes and idiosyncrasies that distort the interpretation of results. Meta-analysis is a statistical technique that is useful in combining results of studies with seemingly disparate findings, correcting for sampling, measurement error, and other study artifacts to understand the true relationship with greater precision. Hunter-Schmidt meta-analysis methods were applied to 199 research studies to estimate the true relationship between engagement and each performance measure, and to test for generalizability. After conducting the meta-analysis, Gallup researchers conducted utility analysis to examine the practical meaning of the relationships.
Appendix3—SurveyMethods

32 Copyright © 2010 Gallup, Inc. All rights reserved.
Earnings Per Share Analysis
In studying the relationship between employee engagement and EPS (page 4), Gallup reviewed data from 514 organizations (6.5 million respondents) in Gallup’s 2010 employee engagement database. Of the 514 organizations, 140 were listed as publicly traded. Gallup researchers reviewed existing employee engagement data to find organizations that met the following criteria:
• Gallup surveyed the majority of the organization (versus partial organization or subsidiary), so that accurate comparisons could be made to company-level EPS data.
• High response rate for the intended survey population (median of 89%; mean of 88% for this analysis).
• Employee engagement data were available for a minimum of two administrations during the study period of 2007-2009 to examine engagement change.
• 2005-2009 EPS data were available for the organization and its three top industry competitors (to control for industry effects). EPS data were collected from various public sources.
After reviewing available data, 54 organizations met all of the criteria above. Comparing each organization’s engagement growth and/or current engagement level to Gallup’s 2010 Q12 database, 14 organizations’ engagement levels remained in the top decile (top 10%) of all organizations over the study period or achieved exceptional engagement growth (moved up two or more database quartiles during the study period); 30 remained in or moved up to the top quartile (top 25%) or achieved high engagement growth (moved up two or more database quartiles during the study period); 24 did not achieve enough growth to be ranked in the top quartile or their engagement growth remained stable or declined during the study period. The top-decile/exceptional growth organizations are also included in the top-quartile/high engagement growth grouping.
The primary analyses involved comparing change or trends in employee engagement during 2007-2009 and EPS, using the years 2005-2007 as a baseline. The 14 top-decile/exceptional growth organizations included responses from 233,473 employees, with a median response rate of 92%. The 30 top-quartile/high growth organizations included responses from 602,720 employees, with a median response rate of 91%. The remaining 24 organizations that ranked below the top quartile of the database included responses from 408,256 employees, with a median response rate of 87%.
Appendix3—SurveyMethods

