the state of palestine national export strategy · the state of palestine national export strategy...
TRANSCRIPT
THE STATE OF PALESTINE NATIONAL EXPORT STRATEGY
AGRO-PROCESSED MEAT
SECTOR EXPORT STRATEGY 2014-2018

The International Trade Centre ( ITC ) is the joint agency of the World Trade Organization and the United Nations
Street address: ITC 54-56, rue de Montbrillant 1202 Geneva, Switzerland
Postal address: ITC Palais des Nations 1211 Geneva 10, Switzerland
Telephone: +41-22 730 0111
Fax: +41-22 733 4439
E-mail: [email protected]
Internet: http://www.intracen.org
Ministry of National Economy ( MONE )
Address : Ramallah – Im Al-Sharayet
Tel : + 970 2 2981218
Fax : + 970 2 2981207
P.O.Box : Ramallah 1629
Email : [email protected]
Palestine Trade Center ( PalTrade )
Head Quarters ( Ramallah Office ) : Alwatanieh Towers Bldg | 5 th floor, Albireh
P.O. Box : 883 | Ramallah | Palestine
Tel : + 970 2 240 8383
Fax : + 970 2 240 8370
Email : [email protected]
Photo next page : PaltradeLayout : Jesús Alés ( sputnix.es )
The National Export Strategy of the State of Palestine was developed on the basis of the process, methodology and technical assistance of the International Trade Centre (ITC). The views expressed herein do not reflect the official opinion of the ITC. This document has not formally been edited by the ITC.
This publication has been produced with the assistance of the European Union. The contents of this publication can in no way be taken to reflect the views of the European Union.
THE STATE OF PALESTINE NATIONAL EXPORT STRATEGYAGRO-PROCESSED MEATSECTOR EXPORT STRATEGY • 2014-2018
Source: stu_spivack.
INTERNATIONAL TRADE CENTRE III
ACKNOWLEDGEMENTS
The Agro-Processed Meat strategy of the National Export Strategy of the State of Palestine was made possible with the support of the Trade Diversification and Competitiveness Enhancement Project of the European Union ( EU ), the sponsorship of the Palestinian Ministry of National Economy, the commit-ted leadership of PalTrade, and the Foreign Affairs, Trade and Development Canada-DFATD.
This document represents the ambitions of the private and public stakeholders who dedicated long hours to define the enhancements and future orienta-tions for the sector to increase its export performance and growth ( full list of stakeholders in Appendix 1 ).
Guidance and support were provided to the project by the following key personnel.
Sector Strategy Team : � Ayman Abu Zarour
M.A.K. Int. � Yasmeen Abu Baker
M.A.K. Int. � Samir Alfuqha
Ministry of Agriculture � Ahmad AlKarmi
Siniora Food Industries � Fuad Akra
PFIA � Issa Beitouni
BESCO � Husein Al Ahmad
PFIA � Moheeb Al – Jabari
Ministry of National Economy
� Mohammad Al – Sayyed PSI
� Anwar Kabajeh Ministry of Planning & Administrative Development
� Mohammad Tarshan Ministry of Planning & Administrative Development
� Rinda Hamouri Business Women Forum
� Iman Hassasneh Business Women Forum
� Younis Sbeih UNDP
� Samah Jaouni UNDP
� Samah Khayyat Ministry of Agriculture
� Baha’ Khader Ministry of Agriculture
� Kamal Odeh Al Salwa company
� Adnan Jaber Zadona
� Ismael Izhiman Saniora Company
� Mustafa Al Masri PCBS
� Ahmad Deeb Hulul
� Osama Abu Ali PalTrade
� Rami Kort PalTrade
� Mohammad Al Ramah PalTrade
� Rawan Salameh PalTrade
� Mary Khalil PalTrade
� Shadi Shaheen PalTrade
� Mamoun Nazzal Team Coordinator
Ministry of National Economy ( MoNE ) : � Manal Farhan
NES Navigator � Nahid Qudsi
Assistant Navigator
PalTrade and Ministry of National Economy ( MoNE ) : � Hanan Taha
Chief Executive Officer � Shawqi Makhtoub
Trade Policy Manager � Samir Maree
NES Specialist � Mohammed Al Ram’ah
NES Coordinator � Mayada Diab
Program Coordinator
International Trade Centre : � Anton J. Said
Chief, Export Strategy � Darius Kurek
Project Manager � Charles Roberge
Lead technical Advisor � Rahul Bhatnagar
Lead Author � Mamoun Nazzal
Team Coordinator in Palestine
INTERNATIONAL TRADE CENTREIV
ACKNOWLEDGEMENTS . . . . . . . . . . . . . . . . . . . . . . . . . . . . . . . . . . . . . . . . . . . . . . . . . . . . . . III
ACRONYMS . . . . . . . . . . . . . . . . . . . . . . . . . . . . . . . . . . . . . . . . . . . . . . . . . . . . . . . . . . . . . . . . . . VII
EXECUTIVE SUMMARY 1
INTRODUCTION 5
WHERE WE ARE NOW 6
STRUCTURE OF THE SECTOR . . . . . . . . . . . . . . . . . . . . . . . . . . . . . . . . . . . . . . 6
INVESTMENT NEEDS OF THE SECTOR . . . . . . . . . . . . . . . . . . . . . . . . . . . . . . 7
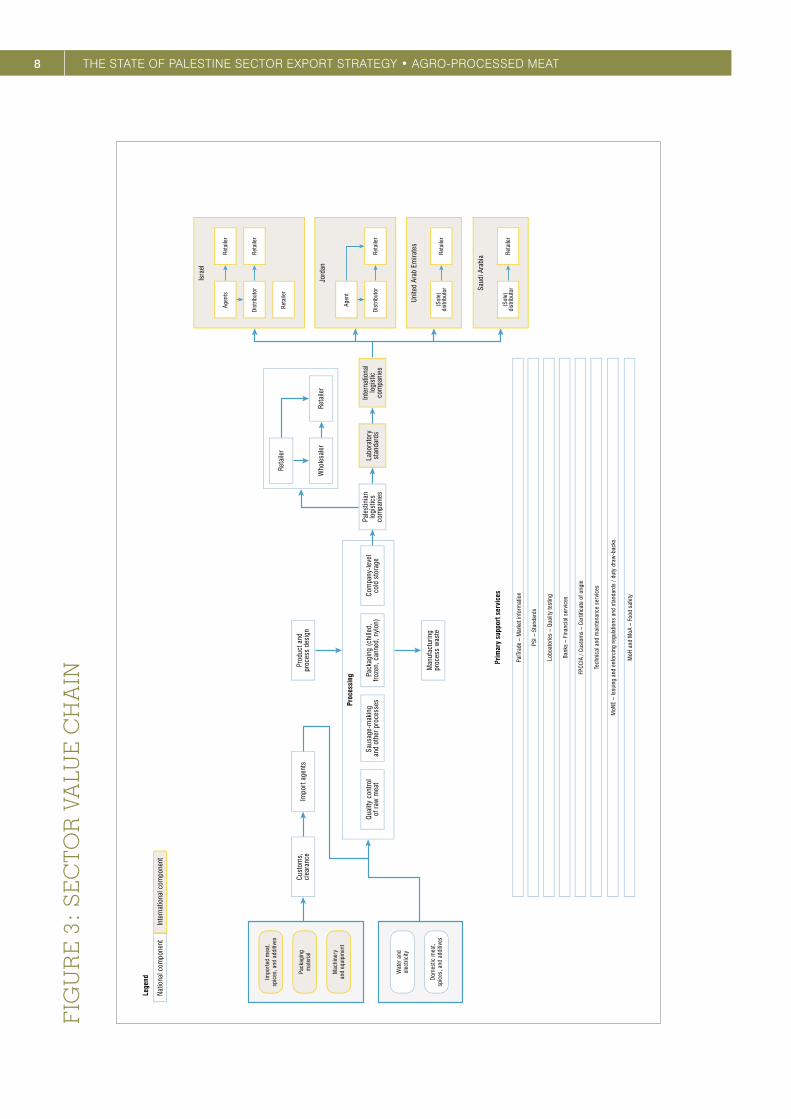
FIGURE 3 : SECTOR VALUE CHAIN . . . . . . . . . . . . . . . . . . . . . . . . . . . . . . . . . . 8
VALUE CHAIN OPERATIONS . . . . . . . . . . . . . . . . . . . . . . . . . . . . . . . . . . . . . . . 9
SECTOR IMPORTS . . . . . . . . . . . . . . . . . . . . . . . . . . . . . . . . . . . . . . . . . . . . . . . 10
GLOBAL MARKETS – A SNAPSHOT . . . . . . . . . . . . . . . . . . . . . . . . . . . . . . . . . 12
THE INSTITUTIONAL PERSPECTIVE 17
EXPORT COMPETITIVENESS ISSUES . . . . . . . . . . . . . . . . . . . . . . . . . . . . . . . . 21
THE BORDER-IN GEAR ( SUPPLY-SIDE ) . . . . . . . . . . . . . . . . . . . . . . . . . . . . . . 21
THE BORDER GEAR ( QUALITY OF THE BUSINESS ENVIRONMENT ) . . . . . . 23
THE BORDER-OUT GEAR ( MARKET ENTRY ) . . . . . . . . . . . . . . . . . . . . . . . . . . 23
DEVELOPMENT GEAR . . . . . . . . . . . . . . . . . . . . . . . . . . . . . . . . . . . . . . . . . . . . . 24
WHERE WE WANT TO GO 26
VISION . . . . . . . . . . . . . . . . . . . . . . . . . . . . . . . . . . . . . . . . . . . . . . . . . . . . . . . . . . 26
FIGURE 4 : FUTURE VALUE CHAIN . . . . . . . . . . . . . . . . . . . . . . . . . . . . . . . . . . . 27
MARKET IDENTIFICATION . . . . . . . . . . . . . . . . . . . . . . . . . . . . . . . . . . . . . . . . . 28
MARKETS . . . . . . . . . . . . . . . . . . . . . . . . . . . . . . . . . . . . . . . . . . . . . . . . . . . . . . . 28
HOW TO GET THERE 37
CONTENTS
INTERNATIONAL TRADE CENTRE V
STRATEGIC OBJECTIVES . . . . . . . . . . . . . . . . . . . . . . . . . . . . . . . . . . . . . . . . . . 37
IMPORTANCE OF COORDINATED IMPLEMENTATION . . . . . . . . . . . . . . . . . . 38
IMPLEMENTATION PARTNERS – LEADING AND SUPPORTING INSTITUTIONS
38
PLAN OF ACTION 39
BIBLIOGRAPHY 45
APPENDIX 1 : LIST OF STAKEHOLDERS 46
APPENDIX 2 : DIRECTORY OF PALESTINIAN MEAT PROCESSING COMPANIES 47
LIST OF FIGURES
Figure 1 : Share of the State of Palestine’s processed meat supply, by destination market . . . . . . . . . . . . . . . . . . . . . . . . . . . . . . . . . . . . . . . . . . . . . . . . . 6
Figure 2 : Views from food and beverage stakeholders on investment needs . . . . . . . 7
Figure 5 : Countries participating in the sausage imports of the UAE, Saudi Arabia, and Kuwait . . . . . . . . . . . . . . . . . . . . . . . . . . . . . . . . . . . . . . . . . . . . . . . . . . . . . . . . . . . 30
Figure 6 : Countries participating in the sausage imports of Japan and Canada . . . . 32
Figure 7 : Eighteen high-potential markets based on growth rate and market size ( under US $ 100 million ) . . . . . . . . . . . . . . . . . . . . . . . . . . . . . . . . . . . . . . . . . . . . . . . 32
Figure 8: A central and southeastern European cluster of dynamic markets for HS 160100 (sausages, etc.) . . . . . . . . . . . . . . . . . . . . . . . . . . . . . . . . . . . . . . . . . 33
Figure 9 : Countries participating in the sausage imports of Switzerland, Austria, Slovenia, Slovakia, & Romania . . . . . . . . . . . . . . . . . . . . . . . . . . . . . . . . . 34
INTERNATIONAL TRADE CENTREVI
TABLES
Table 1 : Average annual value of Palestinian raw meat imports ( HS-02 ), 2007-2010, by product and country ( in US $ thousands ) . . . . . . . . . . . . . . . . . . . . . . . . . . . . 10
Table 2 : Average annual values and top suppliers for all Palestinian imports under HS-16 since 2008 . . . . . . . . . . . . . . . . . . . . . . . . . . . . . . . . . . . . . . . . . . . . . . . 11
Table 3 : Palestinian exports and the world market value for all processed meat products ( at the HS six-digit level ) which are not based on fish, seafood, swine, or meat extracts . . . . . . . . . . . . . . . . . . . . . . . . . . . . . . . . . . . . . . . . . . . . . . . 12
Table 4 : Leading global importers of sausages and similar products ( HS 160100 ). . 13
Table 5 : Major global exporters of sausages and similar products ( HS 160100 ) . . . . 14
Table 6 : Average annual value of Palestinian processed meat exports, 2007-2011 ( by product and import market, in US $ thousands ) . . . . . . . . . . . . . . . . . . . . . . 15
Table 7 : Palestinian processed meat policy support network . . . . . . . . . . . . . . . . . . . . . 18
Table 8 : Palestinian processed meat trade services network . . . . . . . . . . . . . . . . . . . . . 19
Table 9 : Palestinian processed meat business services network . . . . . . . . . . . . . . . . . . 20
Table 11 : Target market group #1 for Palestinian processed meat, short-term phase ( 0-3 years ) . . . . . . . . . . . . . . . . . . . . . . . . . . . . . . . . . . . . . . . . . . . . . . . . . . . . . . . . . . . 29
Table 12 : Target market group #2 for Palestinian processed meat, short-term phase ( 0-3 years ) . . . . . . . . . . . . . . . . . . . . . . . . . . . . . . . . . . . . . . . . . . . . . . . . . . . . . . . . . . . 29
Table 13 : Most attractive markets among the leading global importers of sausages and similar products ( HS 160100 ) . . . . . . . . . . . . . . . . . . . . . . . . . . . . . . . . . . . . . . 31
Table 14 : Target market group #3 for Palestinian processed meat, short-term phase ( 0-3 years ) . . . . . . . . . . . . . . . . . . . . . . . . . . . . . . . . . . . . . . . . . . . . . . . . . . . . . . . . . . . 31
Table 15 : Target markets for Palestinian processed meat, medium-long term phase ( 3+ years ) . . . . . . . . . . . . . . . . . . . . . . . . . . . . . . . . . . . . . . . . . . . . . . . . . . . . . . . . . . . 33
INTERNATIONAL TRADE CENTRE VII
ACRONYMS
FPCCIA Federation of Palestinian Chambers of Commerce, Industry and Agriculture
GDP Gross Domestic Product
HACCP Hazard Analysis and Critical Control Points
HS Harmonized System
ISO International Organization for Standardization
ITC International Trade Centre
MoA Ministry of Agriculture
MoF Ministry of Finance
MoFA Ministry of Foreign Affairs
MoH Ministry of Health
MoL Ministry of Labour
MoNE Ministry of National Economy
MoWA Ministry of Women Affairs
NES National Export Strategy
OECD Organisation for Economic Co-operation and Development
PalTrade Palestinian Trade Centre
PCBS Palestinian Central Bureau of Statistics
PEC Palestinian Export Council
PFI Palestinian Federation of Industries
PFIU Palestinian Food Industries Union
PIPA Palestine Investment Promotion Agency
PNA Palestinian National Authority
PoA Plan of Action
PPU Palestine Polytechnic University
PSI Palestine Standards Institution
PWA Palestinian Water Authority
SME Small or Medium Enterprise
SPS Sanitary and Phytosanitary
TSI Trade Support Institution
TSN Trade Support Network
TVET Technical and Vocational Education and Training
UAE United Arab Emirates
UN United Nations
UNDP United Nations Development Programme

Source: © PalTrade.
1EXECUTIVE SUMMARY
EXECUTIVE SUMMARY
CURRENT CONTEXT
The Palestinian meat processing sector consists of 15 firms, which have collectively achieved a 90 % share of the domestic market. However, they export only about 6 % of their production 1 and have heavily over-invested in production capacity. If these firms are to continue grow-ing and earn satisfactory returns on their capital invest-ments, penetrating export markets is a necessary next step. The sector also represents one of the country’s best, untapped sources of exports. Its ready production capacity, satisfaction of international health standards, and reliably strong global market could make this sector a relatively ‘quick win’ for the country’s overall export strat-egy. The sector’s success would likely also provide posi-tive spillover effects for the domestic livestock sector and Palestinian food security, and be a powerful demonstra-tion for all other sectors with serious export aspirations.
EXPORT PERFORMANCE
Between 2007 and 2011 the State of Palestine exported an annual average of US $ 4.8 million in processed meat. Of that, 99.4 % is made up of only six products at the
1. The value of the processed meat sector’s total output in 2012 is estimated at US $ 70 million by Mr. Fuad Issa Akra, Executive Director of the Palestinian Food Industries Union ( PFIU ). According to UN Comtrade data, an average of US $ 4.6 million worth of that was exported each year from 2009 to 2011. On this basis, it is estimated that 5.75 % of Palestinian-produced processed meat is exported in a typical year.
Harmonized System ( HS ) six-digit level. Sausages and similar products ( HS-160100 ) alone account for 85 %, with half of that going to Jordan. This is a risky position as a single event, for example a health scare associated with Palestinian sausage in Jordan, could halt imports and shut out 42 % of the State of Palestine’s total exports in the sector.
Sausages are the only processed meat product consist-ently exported to several countries. Israel has been the sole importer of the other goods during this period, with the exception of an almost negligible amount of frozen, bone-in beef cuts to Jordan in 2011. Because Jordan im-ports the most sausage and Israel imports the most prod-ucts, the two countries accounted for 81 % of Palestinian processed meat exports between 2007 and 2011. Beyond its neighbours Israel and Jordan, the State of Palestine exports the most overall to the Gulf states of the United Arab Emirates ( UAE ), Saudi Arabia, and Kuwait.
OPTIONS FOR FUTURE DEVELOPMENT
The sector’s current export performance is far from its full potential. That potential is articulated by the following sector vision :
“To achieve international competitiveness and global brand recognition as a reliable supplier of quality
processed meat products, leading to high sector growth and socioeconomic impact. ”

2 THE STATE OF PALESTINE SECTOR EXPORT STRATEGY • AGRO-PROCESSED MEAT
To achieve this vision the strategy will reduce the binding constraints on trade competitiveness and capitalize on strategic options identified for the Palestinian processed meat sector. The strategic orientations for the next five years aim at developing key markets in the short and medium terms for Palestinian exporters, and facilitating structural changes in the value chain to increase its ef-ficiency and value generation.
The short term market development of the sector will fo-cus on selected products in such target destinations as the UAE, Saudi Arabia, Japan and Canada. In the me-dium term the strategy will enable exporters to expand their export reach through the supply of new products to selected target markets such as Switzerland, Austria, Slovenia, Slovakia, and Romania.
ROADMAP FOR SECTOR DEVELOPMENT
The sector strategy vision will be achieved through the implementation of the Plan of Action ( PoA ) for the sec-tor. This PoA revolves around the following four strategic objectives, each spelling out specific sets of activities intended to address both challenges and opportunities facing the sector :
� Enhance the sector’s access to trade-related informa-tion and knowledge;
� Enhance the competitiveness of meat processing companies through effective trade promotion activities;
� Formulate, adopt and improve local regulations and trade policies in favour of the sector’s growth and development;
� Enable Palestinian processed meat enterprises to pro-duce high quality products according to international standards.
This will require a number of steps to increase competi-tiveness, such as :
� Getting recognition in target markets of a Palestinian certifying body for food safety and quality;
� Providing Palestinian firms with actionable intelligence on consumer preferences and market characteristics in target markets;
� Building research, development, design, and quality management capacity to adapt products to target markets; and
� Strengthening suppliers of local content, as a way of lowering costs and deepening socioeconomic impact.
TARGET MEASURES
If the sector’s PoA is fully implemented, the sector should expect to meet the following targets :
� Increase the number of regular markets from five to nine and the number of markets importing US $ 500,000 or more each year from two to five;
� Steadily increase annual average growth from 20 % now to 40 % in five years; 2
� Quadruple the value of processed meat exports by 2020.
IMPLEMENTATION MANAGEMENT
The PoA calls for a range of activities to help achieve these ambitious targets through coordinated efforts from all relevant private and public stakeholders, as well as support from key financial and technical partners, donors, and investors.
Several institutions are designated to play a leading role in the implementation of the sector PoA and bear the over-all responsibility for successful execution of the strategy. They will be assisted by a range of support institutions that are active in the meat processing sector. Each insti-tution mandated to support the sector’s export develop-ment is clearly identified in the strategy PoA. Moreover, the proposed Palestinian Export Council ( PEC ) and its Executive Secretariat will play a coordinating and moni-toring role in the implementation of the strategy in the overall framework of the National Export Strategy. In par-ticular, PEC will be tasked with coordinating the imple-mentation of activities in order to optimize the allocation of both resources and efforts across the wide spectrum of stakeholders.
2. Ninety-three countries had positive growth in both the periods 2006-2011 and 2010-2011. These countries averaged 41 % growth for each of the years from 2007-2011, while the State of Palestine had only 20 %. Considering the strengths of processed meat in the State of Palestine, its ready production capacity, and the fact that the PoA will reorient the sector toward exports, full implementation of the PoA should allow it to achieve at least the same level of growth.
So
urc
e: ©
Pal
Trad
e.
3EXECUTIVE SUMMARY
Box 1 : Methodological note
The approach used by ITC in the strategy design process relies on a number of analytical elements such as value chain analysis, trade support network ( TSN ) analysis, problem tree, and strategic options selection, all of which form major building blocks of this sector export strategy document.
Value chain analysisA comprehensive analysis of the sector’s value chain is an integral part of the strategy development process. This analysis results in the identification of all players, processes and linkages within the sector. The process served as the basis for analysing the current performance of the value chain and for deliberating on options for the future development of the sector.
The analysis charts the main stages involved in the sector’s export process, from inputs sourcing to distribution in market segments. This is followed by the identification of key stakeholders, which includes not just the primary players ( e.g. producers, processors, distributors etc. ) but also those fulfilling support functions with direct linkages to the primary players. These support services include input providers ( meat suppliers, equipment suppliers etc. ), transportation service providers, packaging houses, and financial service providers, among others.
TSN analysisThe trade support network comprises the support services available to the primary value chain players discussed above. It is comprised of policy institutions, trade support organizations and business services providers. An analy-sis of the quality of service delivery and constraints affecting the constituent trade support institutions ( TSIs ) is an important input to highlight gaps in service delivery relative to specific sector needs. A second analysis of TSIs assessed their level of influence ( i.e. their ability to influence public policy and other development drivers in the country and therefore make things happen or change ) and their level of capacity to respond to the sector’s needs.
Problem tree analysisThe problem tree analysis used is based on the principles of root cause analysis and the Pareto principle. The reason for using the problem tree exercise is to gain a deeper understanding of what is causing the high level constraints, and where solution-seeking activities should be directed. This exercise involves a two-step process.
� First the value chain analysis, surveys, and consultations with key public and private stakeholders identify constraints affecting sector-specific export value chains. These constraints are abstract and a more thorough breakdown is required to identify the specific root causes of constraints. Multiple levels of root causes are identified for each high-level constraint.
� Second, the problem tree uses the Pareto principle to identify critical root causes in the problem tree. This is es-pecially important for resource limitations that usually exist during the strategy implementation phase. Therefore focus is needed on the 20 % of the root causes which result in 80 % of constraints affecting the sector. Critical paths through the problem tree are charted to discover the most significant root causes constraining the sector.
These steps resulted in a comprehensive problem tree detailing the constraints affecting the sector’s export value chain, along with characterisations related to the types, granularity and intensity of the root causes. The problem tree then guides the design of the solution-seeking phase of the strategy.
Defining where we want to goThe strategic options for the development of the sector are reflected in the future value chain, which is the result of consultations, surveys and analysis conducted as part of the sector strategy design process. The future perspec-tive has two components :
� A market-related component involving identification of key markets in the short and medium – to-long term for Palestinian exporters, and;
� Structural changes to the value chain that result in either strengthening of linkages, or introduction of new linkages.
Both components are integral parts of the future value chain, which is the basis of the strategic plan of action de-veloped for the sector.
Source: © PalTrade.
5INTRODUCTION
INTRODUCTION
In its simplest form the processing of meat may be min-imal, turning livestock into carcasses or cuts of meat, with or without bones, and chilled or frozen for preser-vation. These are the types of products covered by the Harmonized System of tariffs code HS-02, meat and edi-ble meat offal. HS-16, food preparations of meat, fish, and seafood, covers higher value-added processed meats such as sausages. In this strategy paper, the products under HS-02 and HS-16 are collectively referred to as ‘processed meat’.
The processed meat sector in the State of Palestine gen-erated US $ 70 million in revenue in 2012, or about 7 % of the overall food and beverage sector, 3 and 1 % of national gross domestic product ( GDP ). 4 Within the food and bev-erage sector, the Executive Director of the Palestinian Food Industries Union ( PFIU ) cites three subsectors as the most important : dairy, olive oil, and processed meat. Apart from its high annual sales, processed meat has played an important role in modernizing Palestinian in-dustry. It was the first sector to adopt internationally rec-ognized food safety management systems, and as of 2010 four companies were ISO 22000-certified. 5
The food industry in the State of Palestine began in the early 20th century with the establishment of several fac-tories and food processing shops. 6 Among these was the current domestic market leader Siniora Food Industries, 7
3. Akra, Fuad Issa, Executive Director of Palestinian Food Industries Union ( 2013 ). Interview by A. Deeb. May 2013.4. Based on 2010 gross domestic product of US $ 7.35 billion, in current dollars, as reported by : United Nations Statistics Division ( 2013 ). State of Palestine. Available from : http : / / data.un.org / CountryProfile.aspx?crName=State %20of %20Palestine. Accessed 13 June 2013.5. Akra, F. I. ( May 2010 ). The Palestinian Food-Processing Sector : Its Impact on Agricultural Development. Available from : http : / / www.thisweekinpalestine.com / details.php?id=3111&ed=182&edid=1826. Akra, F. I. ( June 2007 ). Best Foods from Palestine. Available from : http : / / www.thisweekinpalestine.com / details.php?id=2156&ed=142&edid=1427. Massar Associates ( 2002 ). Sector Report : Food and Beverage Manufacturing in West Bank / Gaza. Arlington, Virginia : The Services Group.
which was established in Jerusalem in 1920. However, the sector has never been as dynamic as in the last 20 years.
The mid-1990s saw many changes in the sector with the establishment of new companies; the acquisition of the largest meat processor by the Arab-Palestinian Investment Company; the advent of internationally rec-ognized food safety standards that enabled participation in foreign markets; and the founding of PFIU. Shortly af-ter the turn of the century, measures by the Palestinian National Authority ( PNA ) to encourage consumption of domestically produced food were successfully imple-mented. At the same time, the drop in GDP per capita which followed the beginning of the second intifada has increased demand for processed meats as a cheaper substitute for fresh meats. Relative to many other sectors in Palestinian industry, the processed meat sector has actually grown stronger since the second intifada began.
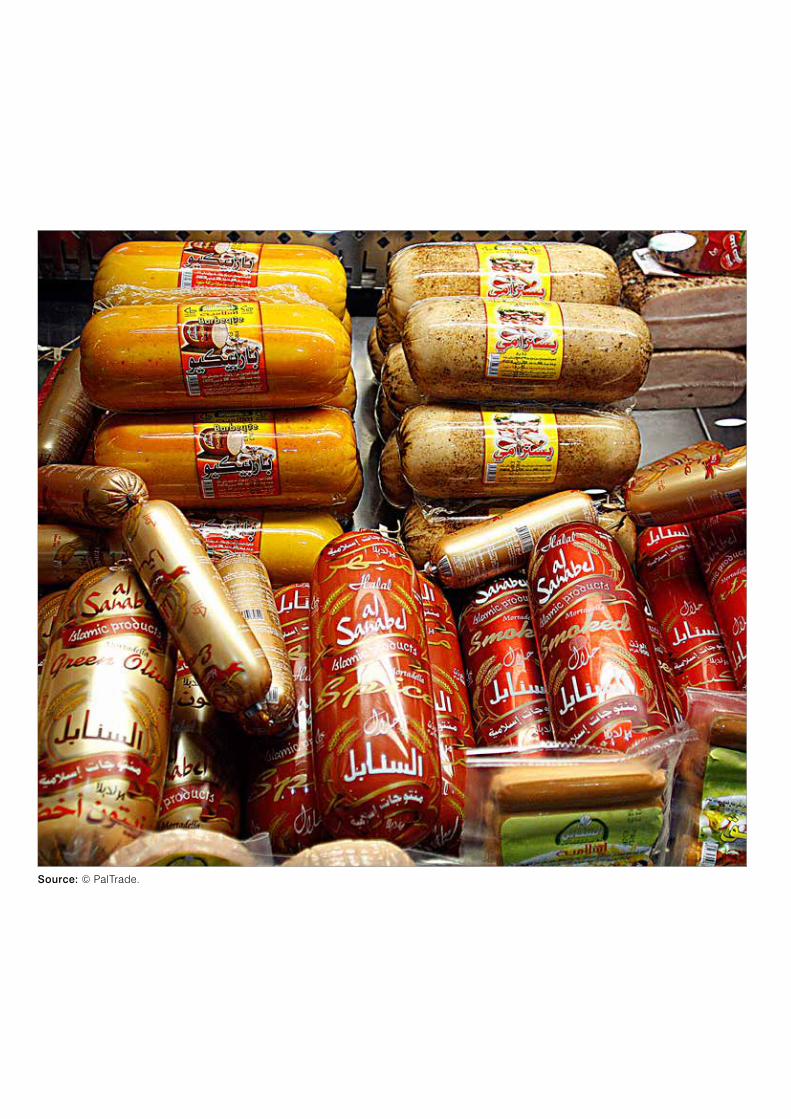
The combination of these factors has made processed meat one of the most domestically dominant sectors with 90 % 8 of market share and a wide variety of products that includes sausage, luncheon meat, hamburger, canned meat, roasts, frankfurters, prime cuts, dried beef, and mortadella. Siniora alone says it produces more than 70 varieties.
This strong domestic supply contributes to food secu-rity both directly and by linking domestic farmers to con-sumers, domestic and foreign. Several producers export significant amounts of sausage but there is much room for growth as the variety of processed meat products ex-ported, the number of importing countries, and the share of production exported are quite narrow.
8. United States Agency for International Development and Palestinian Federation of Industries ( 2009 ). The Current Status of Industrial Sector in Palestine.
6 THE STATE OF PALESTINE SECTOR EXPORT STRATEGY • AGRO-PROCESSED MEAT
WHERE WE ARE NOW
STRUCTURE OF THE SECTORThe processed meat sector in the State of Palestine con-sists of 15 factories.9 Together they produce about 1,800 tons per month. 10 Most output is sold in the Palestinian market, although at least 10 firms export to Israel, Jordan, and several Gulf states. 11
9. Akra, F. I. ( May 2010 ). The Palestinian Food-Processing Sector : Its Impact on Agricultural Development. Available from : http : / / www.thisweekinpalestine.com / details.php?id=3111&ed=182&edid=18210. Akra, Fuad Issa, Executive Director of Palestinian Food Industries Union ( 2013 ). Interview by A. Deeb. May 2013.11. Akra, F. I. ( May 2010 ). The Palestinian Food-Processing Sector : Its Impact on Agricultural Development. Available from : http : / / www.thisweekinpalestine.com / details.php?id=3111&ed=182&edid=182
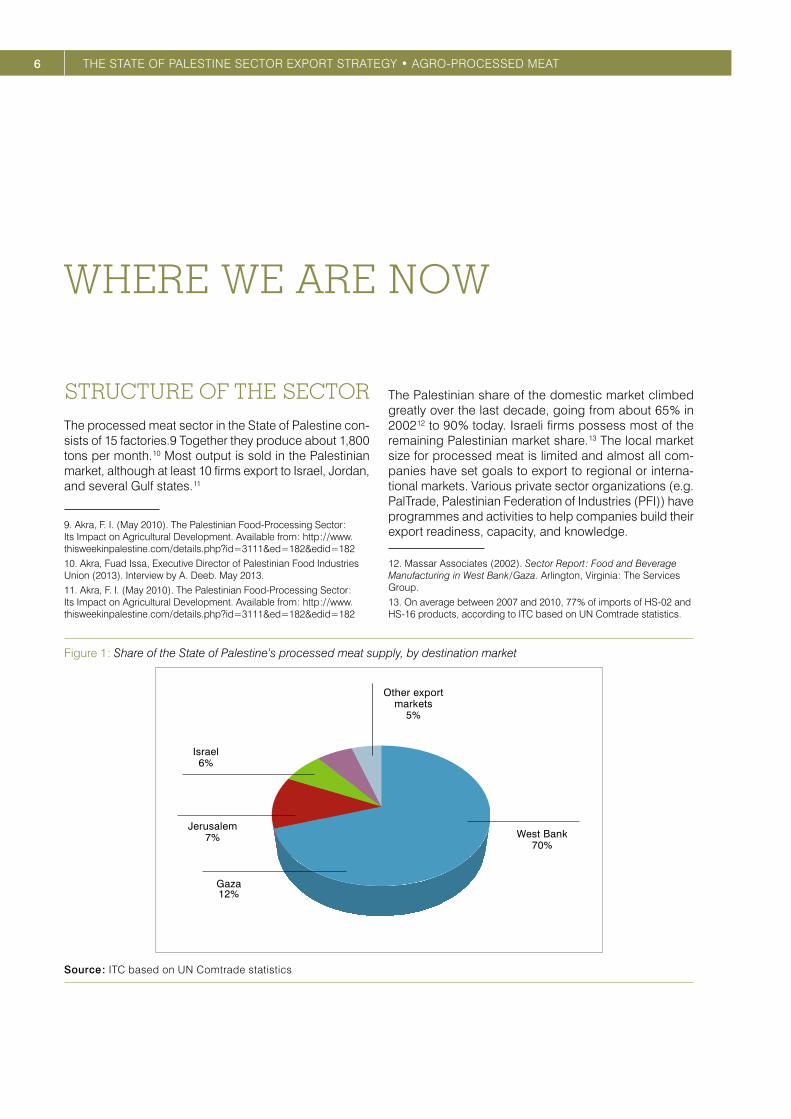
The Palestinian share of the domestic market climbed greatly over the last decade, going from about 65 % in 2002 12 to 90 % today. Israeli firms possess most of the remaining Palestinian market share. 13 The local market size for processed meat is limited and almost all com-panies have set goals to export to regional or interna-tional markets. Various private sector organizations ( e.g. PalTrade, Palestinian Federation of Industries ( PFI ) ) have programmes and activities to help companies build their export readiness, capacity, and knowledge.
12. Massar Associates ( 2002 ). Sector Report : Food and Beverage Manufacturing in West Bank / Gaza. Arlington, Virginia : The Services Group.13. On average between 2007 and 2010, 77 % of imports of HS-02 and HS-16 products, according to ITC based on UN Comtrade statistics.
Figure 1 : Share of the State of Palestine’s processed meat supply, by destination market
West Bank70%
Other exportmarkets
5%
Israel6%
Jerusalem7%
Gaza12%
Source : ITC based on UN Comtrade statistics

7WHERE WE ARE NOW
The majority of raw meat, the sector’s largest input by share of total costs ( 30 %-35 % ), is imported. This is a consequence of the high cost and low supply of do-mestic meat production, as well as inadequate industrial infrastructure.
The processed meat sector employs about 500 work-ers directly and another 2,000 indirectly on turkey farms and in product distribution.14 With an average of about 30 employees per firm, meat processing firms are among the largest employers in the overall food and beverage sector, in which only about 3 % of firms have 20 or more employees.15
Salwa Food Products, which a 2002 study by Massar Associates called the leading exporter of salami and canned meat, 16 exports only 10 % of its production. All of that goes to Jordan, although the company has plans to promote its products in Saudi Arabia and Egypt. 17
Overall, the sector is advantaged by high technical ca-pacities and decades of experience producing a good range of differentiated products, much of which already meets exacting international standards for safety and quality. Scaling up the sector to make it globally com-petitive is an obvious next step which, despite the sector’s advantages, is really more of a big leap. The sector has close to no experience with non-Arab markets, leaving it at a loss in terms of product design, marketing and dis-tribution. Skilled labour is in short supply, inputs are rela-tively expensive, and gaps in the industrial infrastructure hinder the sector’s ability to compete. Fortunately, the dis-advantages are not insurmountable. With the concerted
14. Akra, F. I. ( May 2010 ). The Palestinian Food-Processing Sector : Its Impact on Agricultural Development. Available from : http : / / www.thisweekinpalestine.com / details.php?id=3111&ed=182&edid=18215. Massar Associates ( 2002 ). Sector Report : Food and Beverage Manufacturing in West Bank / Gaza. Arlington, Virginia : The Services Group.16. Ibid.17. Salwa Food Company ( 2013 ). About Us. Available from : http : / / www.salwa.ps / en / about-us.html
efforts of the PNA, donor community and private sector, this sector is better positioned than almost any in the State of Palestine to ramp up exports and help build the country’s commercial image on the international stage.
INVESTMENT NEEDS OF THE SECTORIn a 2009 survey 18 stakeholders in the food and bever-age sector were asked about investment needs in five areas : machines and technology, certification, new mar-ket penetration, product development, and strategic al-liances and partnerships ( see figure 2 ). The area most cited ( 72 % ) as needing investment was machines and technology. This would include not only meat process-ing equipment but also slaughterhouses and cooling facilities, which could alleviate major bottlenecks in the current value chain. For example, the processed meat sector currently takes in 20 % of Palestinian turkey pro-duction, but with investment in these facilities and large turkey farms, the Executive Director of PFIU believes the processed meat sector would absorb 100 % of domestic turkey production. 19
Only two other areas were cited by a majority of stake-holders : product development ( 66 % ) and new market penetration ( 55 % ). These areas are essential to ex-port development and the fact that there is sector-wide agreement about their importance is an indication of the sector’s readiness to grow internationally. This may be especially true of the processed meat subsector, since the 90 % domestic market share it enjoys is the highest of any food and beverage subsector, leaving it almost no room to grow without more exports.
18. United States Agency for International Development and Palestinian Federation of Industries ( 2009 ). The Current Status of Industrial Sector in Palestine.19. Akra, F. I. ( May 2010 ). The Palestinian Food-Processing Sector : Its Impact on Agricultural Development. Available from : http : / / www.thisweekinpalestine.com / details.php?id=3111&ed=182&edid=182
Figure 2 : Views from food and beverage stakeholders on investment needs
72%
27%
55%66%
44%
100%
0%
Buyin machines and technology New ProductsCer tification Strategic alliances and par tnerships
Opening new markets
Source : United States Agency for International Development and Palestinian Federation of Industries ( 2009 ). The Current Status of Industrial Sector in Palestine.
8 THE STATE OF PALESTINE SECTOR EXPORT STRATEGY • AGRO-PROCESSED MEATF
IGU
RE
3 :
SE
CT
OR
VA
LUE
CH
AIN
Nat
iona
l com
pone
nt
Com
pany
-leve
lco
ld s
tora
gePa
ckag
ing
(chi
lled,
froze
n, c
anne
d, n
ylon
)Sa
usag
e-m
akin
g an
d ot
her p
roce
sses
Qua
lity
cont
rol
of ra
w m
eat
Pale
stin
ian
logi
stic
sco
mpa
nies
Labo
rato
ryst
anda
rds
Inte
rnat
iona
llo
gist
icco
mpa
nies
Man
ufac
turin
gpr
oces
s w
aste
Prod
uct a
ndpr
oces
s de
sign
Cust
oms,
clea
ranc
eIm
port
age
nts
Reta
iler
Who
lesa
ler
Reta
iler
PSI –
Sta
ndar
ds
PalT
rade
– M
arke
t inf
orm
atio
n
Prim
ary
supp
ort s
ervi
ces
Proc
essi
ng
Lobo
ator
ies
– Q
ualit
y te
stin
g
Bank
s –
Fina
ncia
l ser
vice
s
FPCC
IA /
Cust
oms
– Ce
rtifi
cate
of o
rigin
Tech
nica
l and
mai
nten
ance
ser
vice
s
MoN
E –
Issu
ing
and
enfo
rcin
g re
gula
tions
and
sta
ndar
ds /
duty
dra
w-b
acks
MoH
and
MoA
– F
ood
safe
ty
Isra
el
Agen
tsRe
taile
r
Dis
tribu
tor
Reta
iler
Reta
iler
Jord
an
Agen
t
Dis
tribu
tor
Reta
iler
Unite
d Ar
ab E
mira
tes
(Sol
e)di
strib
utor
Reta
iler
Saud
i Ara
bia
(Sol
e)di
strib
utor
Reta
iler
Mac
hine
ryan
d eq
uipm
ent
Pack
agin
gm
ater
ial
Impo
rted
mea
t,sp
ices
, and
add
itive
s
Dom
estic
mea
t,sp
ices
, and
add
itive
s
Wat
er a
ndel
ectri
city
Lege
nd
Inte
rnat
iona
l com
pone
nt

9WHERE WE ARE NOW
VALUE CHAIN OPERATIONSINPUT SOURCING
The processed meat sector relies primarily on the seven following types of inputs :
� Raw meat : primarily beef, poultry and fish purchased domestically and imported;
� Additives : for example, salt, spices, curing agents and binding agents;
� Utilities : water and electricity; � Packaging : for preservation of quality, extension of
shelf life and marketing; � Skilled labour : for product design, equipment opera-
tion and maintenance, quality assurance, packaging, marketing and management;
� Machinery : saws, slicers, grinders, scales, mixers, in-jectors, sausage stuffers, vacuum sealers and trans-portation equipment, among others;
At the beginning of the value chain is livestock, the sec-tor’s most fundamental input and largest cost, accounting for 30 %-35 % of the price of processed meats. Beef, tur-key and chicken are the meats most commonly imported and transformed for export – in the form of sausages and similar products. There is little comparable data on domestic production and imports of these live animals as raw materials, but a look at cattle in 2008 shows that Palestinians produced 5,047 tons 20 of cattle in the same year that 38,537 tons were imported. 21 Interviews with sector stakeholders validate the conclusion that 2008 was not an exceptional year and that a large majority of the raw meat input for processing is imported.
PRODUCTION AND TRANSFORMATION
Each type of processed meat goes through different production processes, although there is considerable overlap among them. Processing may be relatively low for prime cuts or hamburger, but many of the products sold by companies like Siniora and Salwa – sausages, frankfurters, mortadella, and canned meat – require more extensive processing. The following five-step process is used internationally in the production of fresh sausages, by far the State of Palestine’s largest processed meat export. Additional steps are given for the production of cooked and dried sausages.
20. Palestinian Ministry of Agriculture ( 2010 ). Agriculture Sector Strategy : “A Shared Vision,” 2011-2013.21. International Trade Centre ( 2010 ). Trade Map. Available from Trade Map : www.trademap.org. Accessed 27 May 2013.
FRESH SAUSAGE PRODUCTION PROCESSES
1. Grinding meat : this is done to chilled meat, for health reasons, or frozen meat, for quality and efficiency reasons.
2. Adding non-meat ingredients : these may include salt, spices, curing agents, and binding agents.
3. Blending : this should be done to achieve uniform dis-tribution in a way that controls unwanted chemical reactions and excessive heat from friction.
4. Stuffing : the simplest way to do this is by hand, but larger manufacturers may use automatic stuffers with air or water pistons.
5. Packaging : fresh sausages are often sold on trays and wrapped in plastic according to sanitary stand-ards, and possibly with appropriate marketing value.
ADDITIONAL STEPS FOR COOKED AND SMOKED SAUSAGES
6. Smoking : this is done to dry and cure the sausage, while adding taste and flavour. It is typically done with natural smoke from hardwoods or fruitwoods. This step may be skipped for some dry sausages.
7. Cooking : this is done to kill bacteria and parasites, as well as add flavour. Cooking may be done in an oven or a heated water bath. Temperature must be monitored. This step may be skipped for some dry sausages.
8. Showering : this done to maintain humidity, while halt-ing the cooking process.
9. Chilling : chilling for several hours prevents bacterial growth and maintains product quality.
10. Peeling : this removes inedible casings.
ADDITIONAL STEPS FOR DRY SAUSAGES
11. Blending special curing ingredients : salt, nitrates and / or nitrites, and sometimes anti-oxidants are add-ed after grinding to cure the meat. Controlled bacte-rial fermentation is then used to achieve the desired flavour.
12. Drying : this process, which can last from 10 to 120 days depending on sausage dimensions and type, and is done in a way to maintain moisture and the moisture-to-protein ratio within target ranges for health and quality.
These processes make intensive use of water, technology and skilled labour, all of which are relatively scarce and expensive in the State of Palestine. There are shortages of machines and equipment for deboning, quality assur-ance, packaging, and energy efficiency. This directly af-fects the sector’s ability to develop new products, meet international quality and health standards, market effec-tively, and keep costs down.
10 THE STATE OF PALESTINE SECTOR EXPORT STRATEGY • AGRO-PROCESSED MEAT
DISTRIBUTION TO MARKET
Most production is destined for the Palestinian mar-ket, passing directly to retailers or through wholesal-ers. Products being exported are either shipped by the manufacturer or through a customs broker to agents or distributors in the cases of Jordan, where about half of Palestinian processed meat exports were sold between 2007 and 2011, the UAE ( 9 % ) and Kuwait ( 6 % ). In the case of Israel, the second largest export market ( 31 % ), goods are sold to agents and distributors but also directly to retailers.
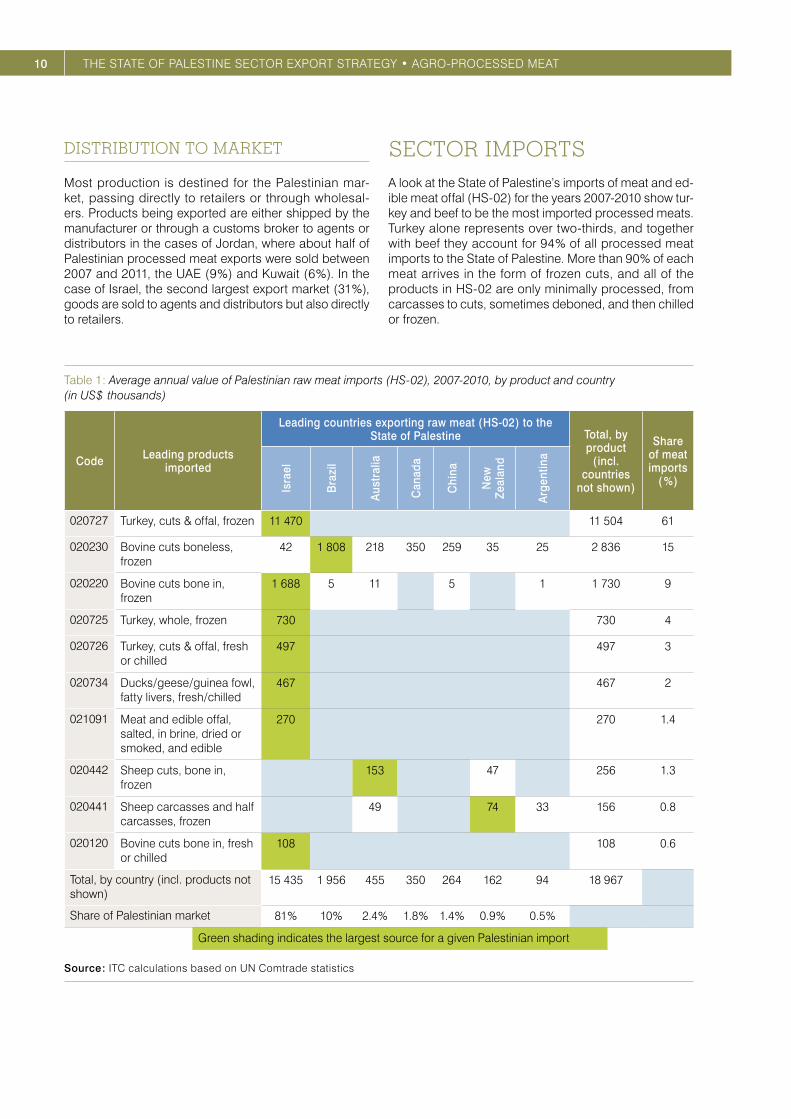
SECTOR IMPORTSA look at the State of Palestine’s imports of meat and ed-ible meat offal ( HS-02 ) for the years 2007-2010 show tur-key and beef to be the most imported processed meats. Turkey alone represents over two-thirds, and together with beef they account for 94 % of all processed meat imports to the State of Palestine. More than 90 % of each meat arrives in the form of frozen cuts, and all of the products in HS-02 are only minimally processed, from carcasses to cuts, sometimes deboned, and then chilled or frozen.
Table 1 : Average annual value of Palestinian raw meat imports ( HS-02 ), 2007-2010, by product and country ( in US $ thousands )
Code Leading products imported
Leading countries exporting raw meat ( HS-02 ) to the State of Palestine Total, by
product ( incl.
countries not shown )
Share of meat imports
( % )
Isra
el
Bra
zil
Aus
tral
ia
Can
ada
Chi
na
New
Ze
alan
d
Arg
entin
a
020727 Turkey, cuts & offal, frozen 11 470 11 504 61
020230 Bovine cuts boneless, frozen
42 1 808 218 350 259 35 25 2 836 15
020220 Bovine cuts bone in, frozen
1 688 5 11 5 1 1 730 9
020725 Turkey, whole, frozen 730 730 4
020726 Turkey, cuts & offal, fresh or chilled
497 497 3
020734 Ducks / geese / guinea fowl, fatty livers, fresh / chilled
467 467 2
021091 Meat and edible offal, salted, in brine, dried or smoked, and edible
270 270 1.4
020442 Sheep cuts, bone in, frozen
153 47 256 1.3
020441 Sheep carcasses and half carcasses, frozen
49 74 33 156 0.8
020120 Bovine cuts bone in, fresh or chilled
108 108 0.6
Total, by country ( incl. products not shown )
15 435 1 956 455 350 264 162 94 18 967
Share of Palestinian market 81 % 10 % 2.4 % 1.8 % 1.4 % 0.9 % 0.5 %
Green shading indicates the largest source for a given Palestinian import
Source : ITC calculations based on UN Comtrade statistics

11WHERE WE ARE NOW
Effectively all imported turkey comes from Israel, while frozen beef cuts are mostly split between Israel and Brazil. Israel supplies 98 % of the State of Palestine’s bone-in frozen beef, while Brazil supplies 64 % of the State of Palestine’s boneless frozen beef.
As 90 % of the Palestinian market for processed meat is supplied by domestic producers at least a majority, if not all, of these imports are destined for Palestinian meat pro-cessors. These firms use the products as inputs for the production of the higher value-added category of HS-16 : food preparations of meat and seafood.
The majority of higher value-added processed meat ( HS-16 ) imports to the landlocked State of Palestine is under-standably in seafood. Thailand, Israel and Portugal pro-vide the State of Palestine with almost US $ 5 million worth of tuna, mackerel, sardines, shrimp, and the like in an average year ( see table 2 ). 22
There are, however, significant imports in one product category which the State of Palestine exports in sig-nificant quantities. In 2007-2010, the State of Palestine exported an annual average of US $ 3.8 million worth of processed meat and seafood ( HS-16 ), with about 95 %, or US $ 3.6 million, being in sausages or similar prod-ucts ( HS-160100 ). During the same period the State of Palestine imported US $ 2.9 million per year in the same product category, all of it from Israel.
22. ITC calculations based on UN Comtrade statistics
Although the value of the State of Palestine’s exports and imports for this strategic product are comparable, it is mostly a reflection of the country’s underperformance in exports. At the moment the imported volume itself does not represent a major threat to Palestinian producers, who hold 90 % of domestic market share after two decades of strong and steady growth.
Table 2 : Average annual values and top suppliers for all Palestinian imports under HS-16 since 2008
HS code Description
Average annual value, 2007-2010
( in US $ thousands )
Top suppliers( 2010 exports, in US $ thousands )
160414 Tuna, skipjack, and Atlantic bonito, prepared / preserved, whole / in pieces, ex. minced
3 861 Thailand ( 1 624 )Israel ( 1 056 )
160100 Sausage and similar products of meat, meat offal / blood and food preparations based on these products
2 865 Israel ( 3 440 )
160415 Mackerel, prepared or preserved, whole or in pieces, but not minced
461 Portugal ( 545 )Thailand ( 127 )
160413 Sardines, sardinella, and brisling or sprats prepared or pre-served, whole or in pieces, ex. minced
392 Israel ( 164 )Portugal ( 113 )
160250 Bovine meat and meat offal not elsewhere specified, excluding livers, prepared or preserved
284 Israel ( 154 )Belgium ( 97 )
160420 Fish prepared or preserved, except whole or in pieces 25 Portugal ( 61 )
160520 Shrimps and prawns, prepared or preserved 13 Israel ( 7 )
160231 Turkey meat and meat offal prepared or preserved, excluding livers
9 Israel ( 10 )
Source : ITC calculations based on UN Comtrade statistics
Source: Alpha.
12 THE STATE OF PALESTINE SECTOR EXPORT STRATEGY • AGRO-PROCESSED MEAT
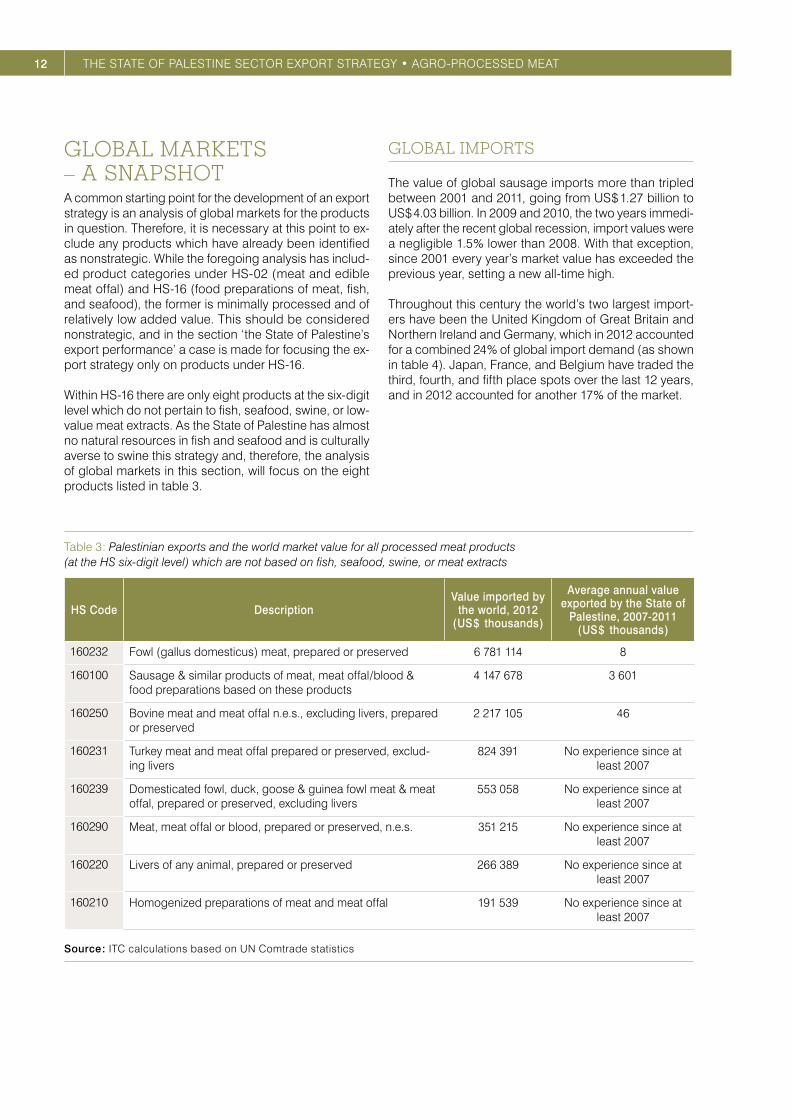
GLOBAL MARKETS – A SNAPSHOTA common starting point for the development of an export strategy is an analysis of global markets for the products in question. Therefore, it is necessary at this point to ex-clude any products which have already been identified as nonstrategic. While the foregoing analysis has includ-ed product categories under HS-02 ( meat and edible meat offal ) and HS-16 ( food preparations of meat, fish, and seafood ), the former is minimally processed and of relatively low added value. This should be considered nonstrategic, and in the section ‘the State of Palestine’s export performance’ a case is made for focusing the ex-port strategy only on products under HS-16.
Within HS-16 there are only eight products at the six-digit level which do not pertain to fish, seafood, swine, or low-value meat extracts. As the State of Palestine has almost no natural resources in fish and seafood and is culturally averse to swine this strategy and, therefore, the analysis of global markets in this section, will focus on the eight products listed in table 3.
GLOBAL IMPORTS
The value of global sausage imports more than tripled between 2001 and 2011, going from US $ 1.27 billion to US $ 4.03 billion. In 2009 and 2010, the two years immedi-ately after the recent global recession, import values were a negligible 1.5 % lower than 2008. With that exception, since 2001 every year’s market value has exceeded the previous year, setting a new all-time high.
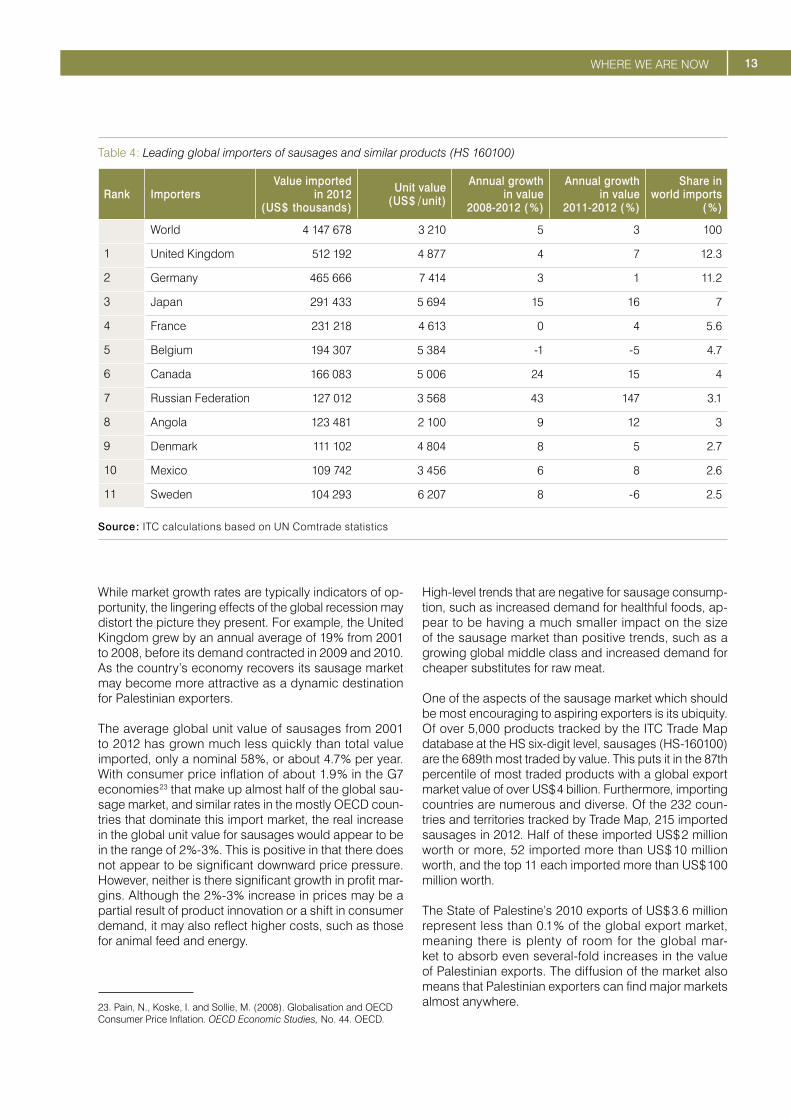
Throughout this century the world’s two largest import-ers have been the United Kingdom of Great Britain and Northern Ireland and Germany, which in 2012 accounted for a combined 24 % of global import demand ( as shown in table 4 ). Japan, France, and Belgium have traded the third, fourth, and fifth place spots over the last 12 years, and in 2012 accounted for another 17 % of the market.
Table 3 : Palestinian exports and the world market value for all processed meat products ( at the HS six-digit level ) which are not based on fish, seafood, swine, or meat extracts
HS Code DescriptionValue imported by
the world, 2012( US $ thousands )
Average annual value exported by the State of
Palestine, 2007-2011( US $ thousands )
160232 Fowl ( gallus domesticus ) meat, prepared or preserved 6 781 114 8
160100 Sausage & similar products of meat, meat offal / blood & food preparations based on these products
4 147 678 3 601
160250 Bovine meat and meat offal n.e.s., excluding livers, prepared or preserved
2 217 105 46
160231 Turkey meat and meat offal prepared or preserved, exclud-ing livers
824 391 No experience since at least 2007
160239 Domesticated fowl, duck, goose & guinea fowl meat & meat offal, prepared or preserved, excluding livers
553 058 No experience since at least 2007
160290 Meat, meat offal or blood, prepared or preserved, n.e.s. 351 215 No experience since at least 2007
160220 Livers of any animal, prepared or preserved 266 389 No experience since at least 2007
160210 Homogenized preparations of meat and meat offal 191 539 No experience since at least 2007
Source : ITC calculations based on UN Comtrade statistics
13WHERE WE ARE NOW
Table 4 : Leading global importers of sausages and similar products ( HS 160100 )
Rank ImportersValue imported
in 2012( US $ thousands )
Unit value ( US $ / unit )
Annual growth in value
2008-2012 ( % )
Annual growth in value
2011-2012 ( % )
Share in world imports
( % )
World 4 147 678 3 210 5 3 100
1 United Kingdom 512 192 4 877 4 7 12.3
2 Germany 465 666 7 414 3 1 11.2
3 Japan 291 433 5 694 15 16 7
4 France 231 218 4 613 0 4 5.6
5 Belgium 194 307 5 384 -1 -5 4.7
6 Canada 166 083 5 006 24 15 4
7 Russian Federation 127 012 3 568 43 147 3.1
8 Angola 123 481 2 100 9 12 3
9 Denmark 111 102 4 804 8 5 2.7
10 Mexico 109 742 3 456 6 8 2.6
11 Sweden 104 293 6 207 8 -6 2.5
Source : ITC calculations based on UN Comtrade statistics
While market growth rates are typically indicators of op-portunity, the lingering effects of the global recession may distort the picture they present. For example, the United Kingdom grew by an annual average of 19 % from 2001 to 2008, before its demand contracted in 2009 and 2010. As the country’s economy recovers its sausage market may become more attractive as a dynamic destination for Palestinian exporters.
The average global unit value of sausages from 2001 to 2012 has grown much less quickly than total value imported, only a nominal 58 %, or about 4.7 % per year. With consumer price inflation of about 1.9 % in the G7 economies 23 that make up almost half of the global sau-sage market, and similar rates in the mostly OECD coun-tries that dominate this import market, the real increase in the global unit value for sausages would appear to be in the range of 2 %-3 %. This is positive in that there does not appear to be significant downward price pressure. However, neither is there significant growth in profit mar-gins. Although the 2 %-3 % increase in prices may be a partial result of product innovation or a shift in consumer demand, it may also reflect higher costs, such as those for animal feed and energy.
23. Pain, N., Koske, I. and Sollie, M. ( 2008 ). Globalisation and OECD Consumer Price Inflation. OECD Economic Studies, No. 44. OECD.
High-level trends that are negative for sausage consump-tion, such as increased demand for healthful foods, ap-pear to be having a much smaller impact on the size of the sausage market than positive trends, such as a growing global middle class and increased demand for cheaper substitutes for raw meat.
One of the aspects of the sausage market which should be most encouraging to aspiring exporters is its ubiquity. Of over 5,000 products tracked by the ITC Trade Map database at the HS six-digit level, sausages ( HS-160100 ) are the 689th most traded by value. This puts it in the 87th percentile of most traded products with a global export market value of over US $ 4 billion. Furthermore, importing countries are numerous and diverse. Of the 232 coun-tries and territories tracked by Trade Map, 215 imported sausages in 2012. Half of these imported US $ 2 million worth or more, 52 imported more than US $ 10 million worth, and the top 11 each imported more than US $ 100 million worth.
The State of Palestine’s 2010 exports of US $ 3.6 million represent less than 0.1 % of the global export market, meaning there is plenty of room for the global mar-ket to absorb even several-fold increases in the value of Palestinian exports. The diffusion of the market also means that Palestinian exporters can find major markets almost anywhere.
14 THE STATE OF PALESTINE SECTOR EXPORT STRATEGY • AGRO-PROCESSED MEAT
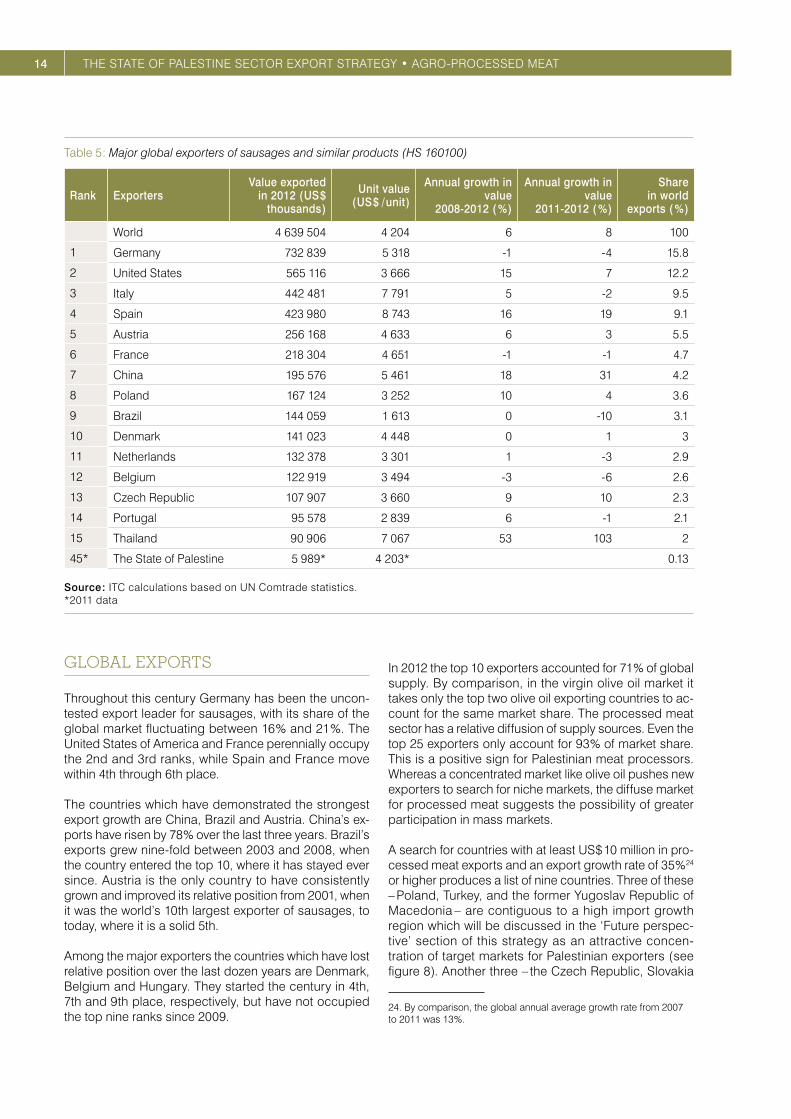
Table 5 : Major global exporters of sausages and similar products ( HS 160100 )
Rank ExportersValue exported
in 2012 ( US $ thousands )
Unit value ( US $ / unit )
Annual growth in value
2008-2012 ( % )
Annual growth in value
2011-2012 ( % )
Share in world
exports ( % )
World 4 639 504 4 204 6 8 100
1 Germany 732 839 5 318 -1 -4 15.8
2 United States 565 116 3 666 15 7 12.2
3 Italy 442 481 7 791 5 -2 9.5
4 Spain 423 980 8 743 16 19 9.1
5 Austria 256 168 4 633 6 3 5.5
6 France 218 304 4 651 -1 -1 4.7
7 China 195 576 5 461 18 31 4.2
8 Poland 167 124 3 252 10 4 3.6
9 Brazil 144 059 1 613 0 -10 3.1
10 Denmark 141 023 4 448 0 1 3
11 Netherlands 132 378 3 301 1 -3 2.9
12 Belgium 122 919 3 494 -3 -6 2.6
13 Czech Republic 107 907 3 660 9 10 2.3
14 Portugal 95 578 2 839 6 -1 2.1
15 Thailand 90 906 7 067 53 103 2
45* The State of Palestine 5 989* 4 203* 0.13
Source : ITC calculations based on UN Comtrade statistics. *2011 data
GLOBAL EXPORTS
Throughout this century Germany has been the uncon-tested export leader for sausages, with its share of the global market fluctuating between 16 % and 21 %. The United States of America and France perennially occupy the 2nd and 3rd ranks, while Spain and France move within 4th through 6th place.
The countries which have demonstrated the strongest export growth are China, Brazil and Austria. China’s ex-ports have risen by 78 % over the last three years. Brazil’s exports grew nine-fold between 2003 and 2008, when the country entered the top 10, where it has stayed ever since. Austria is the only country to have consistently grown and improved its relative position from 2001, when it was the world’s 10th largest exporter of sausages, to today, where it is a solid 5th.
Among the major exporters the countries which have lost relative position over the last dozen years are Denmark, Belgium and Hungary. They started the century in 4th, 7th and 9th place, respectively, but have not occupied the top nine ranks since 2009.
In 2012 the top 10 exporters accounted for 71 % of global supply. By comparison, in the virgin olive oil market it takes only the top two olive oil exporting countries to ac-count for the same market share. The processed meat sector has a relative diffusion of supply sources. Even the top 25 exporters only account for 93 % of market share. This is a positive sign for Palestinian meat processors. Whereas a concentrated market like olive oil pushes new exporters to search for niche markets, the diffuse market for processed meat suggests the possibility of greater participation in mass markets.
A search for countries with at least US $ 10 million in pro-cessed meat exports and an export growth rate of 35 % 24 or higher produces a list of nine countries. Three of these – Poland, Turkey, and the former Yugoslav Republic of Macedonia – are contiguous to a high import growth region which will be discussed in the ‘Future perspec-tive’ section of this strategy as an attractive concen-tration of target markets for Palestinian exporters ( see figure 8 ). Another three – the Czech Republic, Slovakia
24. By comparison, the global annual average growth rate from 2007 to 2011 was 13 %.

15WHERE WE ARE NOW
and Romania – are in the region itself. These are apparent beneficiaries of the region’s growth and the countries with which the State of Palestine could expect to compete there.
THE STATE OF PALESTINE’S EXPORT PERFORMANCE
Palestinian exports of processed meat are dangerously undiversified. Table 6 presents the six products at the HS six-digit level that have made up 99.4 % of the State of
Palestine’s processed meat exports ( HS-02 and HS-16 ). Of these, 85 % are in sausages and similar products ( HS-160100 ) and half of that goes to Jordan. This is a risky position as a single event, for example a health scare as-sociated with Palestinian sausage in Jordan, could halt imports and shut out 42 % of the State of Palestine’s total exports in the sector.
Table 6 : Average annual value of Palestinian processed meat exports, 2007-2011 ( by product and import market, in US $ thousands )
Code Leading products exported Israel Jordan UAE Saudi Arabia Kuwait Others Total, by
product
Product share in
Palestinian exports
160100 Sausages and similar prod-ucts
789 2 362 438 300 46 143 4 079 85 %
Size of import market, 2012 no data
4 138 27 565 16 199 5 937 n / a n / a n / a
020727 Frozen turkey cuts or offal 269 269 6 %
020220 Frozen beef cuts, bone-in 210 8 218 5 %
160414 Tuna, skipjack, or Atlantic bonito, prepared or pre-served
105 105 2 %
160413 Sardine, sardinella, brisling, or sprat, prepared or pre-served
82 82 2 %
160250 Beef and offal NES, excl. liv-er, prepared or preserved
46 46 1 %
Total by country 1 499 2 370 438 300 46 143 4 797
Country share in Palestinian exports 31 % 49 % 9 % 6 % 1 % 3 %
Source : ITC calculations based on UN Comtrade statistics
Only sausages are consistently imported by several countries. Israel has been the sole importer of the other four goods during this period, with the exception of an almost negligible amount of frozen, bone-in beef cuts exported to Jordan in 2011.
Because Jordan imports the most sausage and Israel imports the most products, the two countries accounted for 81 % of Palestinian processed meat exports between 2007 and 2011. Beyond its neighbours Israel and Jordan, the State of Palestine exports the most overall to the Gulf States of the UAE, Saudi Arabia and Kuwait. Likewise, these three countries round out the group of five consist-ent importers of Palestinian sausages and similar pre-pared meats.
Under Israeli travel restrictions, Palestinian exports may not travel directly from the State of Palestine to destina-tion markets. Rather, they must first go through Israel or Jordan. Palestinian processed meat producers or their transportation companies must hand shipments over to Israeli transportation companies at the border. This ob-ligatory use of third countries as intermediaries, the black market sale of Palestinian products in the restricted Israeli market, and the fact that Israel does not report goods from the State of Palestine as imports, may in fact un-derstate the importance of Israel as an export market for Palestinian processed meats.
16 THE STATE OF PALESTINE SECTOR EXPORT STRATEGY • AGRO-PROCESSED MEAT
COMPETITION IN TARGET MARKETS
As part of the NES design process sector firms and stake-holders made quantitative assessments of their collec-tive competitiveness in the State of Palestine’s four major target markets. The State of Palestine and its chief com-petitors in each market were scored against seven crite-ria – price, quality, production standards ( national and Hazard Analysis and Critical Control Points ( HACCP ) ), packaging supply consistency and delivery reliability – which were weighted for their importance in each market.
As indicated in table 6, the State of Palestine’s four largest existing markets are Jordan, Israel, the UAE and Saudi Arabia. The State of Palestine is not the most competitive source in any of these. However, it is close in Jordan and the UAE and it is a distant second in Israel and Saudi Arabia.
In the Jordanian market, where price and quality account for two-thirds of the competitiveness assessment, Brazil, the Netherlands, Germany and the State of Palestine are very close competitors. The State of Palestine is fourth, in large part because of its weaknesses in supply con-sistency and delivery reliability. However, even halving its assessment gap in these categories would be enough to make the State of Palestine the most competitive.
In the Israeli market Palestinian suppliers are rated highly for price, but they lag behind Israeli suppliers in quality. That weakness, combined with strong disadvantages in terms of supply consistency and delivery reliability, make the State of Palestine a distant second source to Israel’s domestic suppliers.
The same weaknesses prevent the State of Palestine from being the strongest competitor in the Emirati mar-ket, where it is a close second to Jordan but only slightly more competitive than third place Egypt. Slight improve-ments in price, supply consistency, or delivery reliability could make the State of Palestine the most competitive. However, at the same time, the State of Palestine’s lead over Egypt depends on only slight advantages in product quality and packaging. The State of Palestine’s position in the Emirati market is similar to its position in the Jordanian market. Both markets are highly competitive and although the State of Palestine is not the market leader, slight im-provements could make it so.
On the other hand, the State of Palestine’s position in the Saudi Arabian market is like its position in the Israeli market : it is a distant second. In Saudi Arabia, Kuwaiti suppliers have almost no advantage over Palestinian or Jordanian suppliers in terms of price or quality, which account for 60 % of competitiveness scores. However, strong advantages in terms of supply consistency and delivery reliability, as well as minor advantages in terms of packaging and volume, are enough to give Kuwaiti suppliers a clear competitive advantage.
In Jordan and Israel the sole Palestinian advantage is in price. In the UAE, it is quality and packaging; and in Saudi Arabia there are no buyer requirements for which it has a clear-cut advantage. In all of these markets, however, the major weaknesses of Palestinian processed meat are the same : supply consistency and delivery reliability. Packaging is a weakness in the State of Palestine’s big-gest existing markets, but a slight strength or non-factor in the markets it hopes to grow.
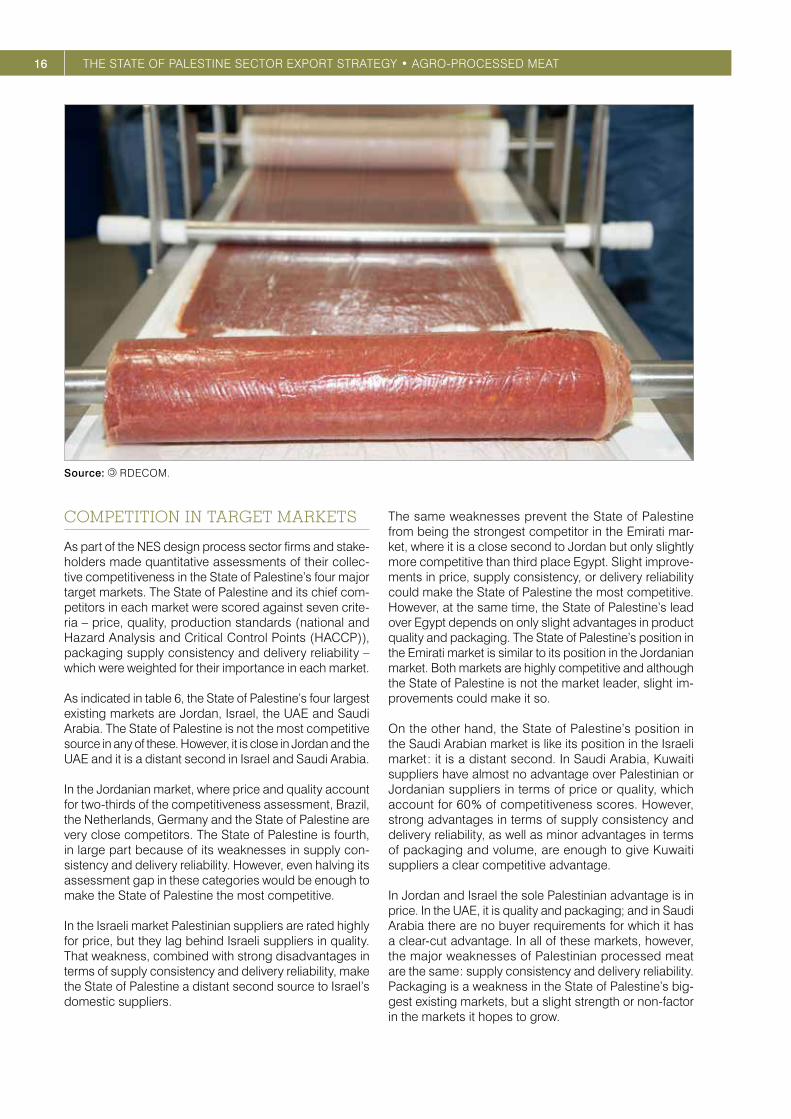
Source: RDECOM.
17THE INSTITUTIONAL PERSPECTIVE
THE INSTITUTIONAL PERSPECTIVE
The trade support institutions ( TSIs ) providing important services to the Palestinian processed meat sector can be categorized according to the following support areas :
� Policy support network � Trade service network � Business service network.
Tables 7 to 9 identify the main TSIs whose service de-livery affects the processed meat sector in the State of Palestine. An assessment ( high / medium / low ) is given for each TSI according to its overall performance in terms of coordination, human capital, financial resources, and advocacy. The assessments were made by representa-tive samples of TSI stakeholders.
POLICY SUPPORT NETWORK
The institutions in the policy support network represent ministries and competent authorities responsible for in-fluencing or implementing policies at the national level.
TRADE SERVICES NETWORK
These institutions or agencies provide a wide range of trade related services to both government and enterprises.
Source: © PalTrade.

18 THE STATE OF PALESTINE SECTOR EXPORT STRATEGY • AGRO-PROCESSED MEAT
Table 7 : Palestinian processed meat policy support network
Policy support network
Name Function / role Coordination* Human capital**
Financial sustainability
***
Advocacy****
Ministry of National Economy ( MoNE )
The Ministry of National Economy is responsible in the processed meat sector for :• Standards and regulation enforcement• Duty draw back payments• Release of financial guarantees• Industrial licences• Renewal of industrial operating licences• Verification of names• Certification of a Certificate of Origin• Re-exporting transactions• Certified Exporter certificates.
H M M H
Ministry of Agriculture ( MoA )
Implementation of state policy on agricultural and rural development supports : the planning, development, and organization of the whole value chain of plant and animal products; post-harvest handling of agricultural products; and the food industry.
M H M M
Ministry of Health ( MoH )
MoH has the mandate to ensure good governance of the health sector; leadership in policy making for and regulation of the health system; the promotion of better health; and the provision of accessible, quality health services in both the public and private sectors. For the export sector, MoH maintains quality standards for food and issues Certificates of Health.
M M L L
Ministry of Labour ( MoL )
MoL manages the formulation and administration of labour laws and legislation, managing and monitoring the labour market. It also support the development and organization of cooperatives.
L L L L
Ministry of Finance ( MoF )
MoF is responsible for the collection and administration of customs duties, as well as following up on customs revenues from Israel to the Palestinian treasury and dealing with daily problems facing importers and exporters.
L M L L
* Coordination with other TSIs : measures the strength of this institution’s linkages with other institutions, as well as the beneficiaries of their services ( in particular, the private sector ) in terms of collaboration and information sharing. ** Human capital assessment : assesses the general level of capability of this institution’s staff in terms of their training, and responsiveness to the sector stakeholders. *** Financial resources assessment : Assesses the financial resources / capacity available to the institution to provide service delivery in an efficient manner. **** Advocacy : The efficacy of this institution’s advocacy mechanisms, and how well / frequently this institution disseminates important information to the sector.
19THE INSTITUTIONAL PERSPECTIVE
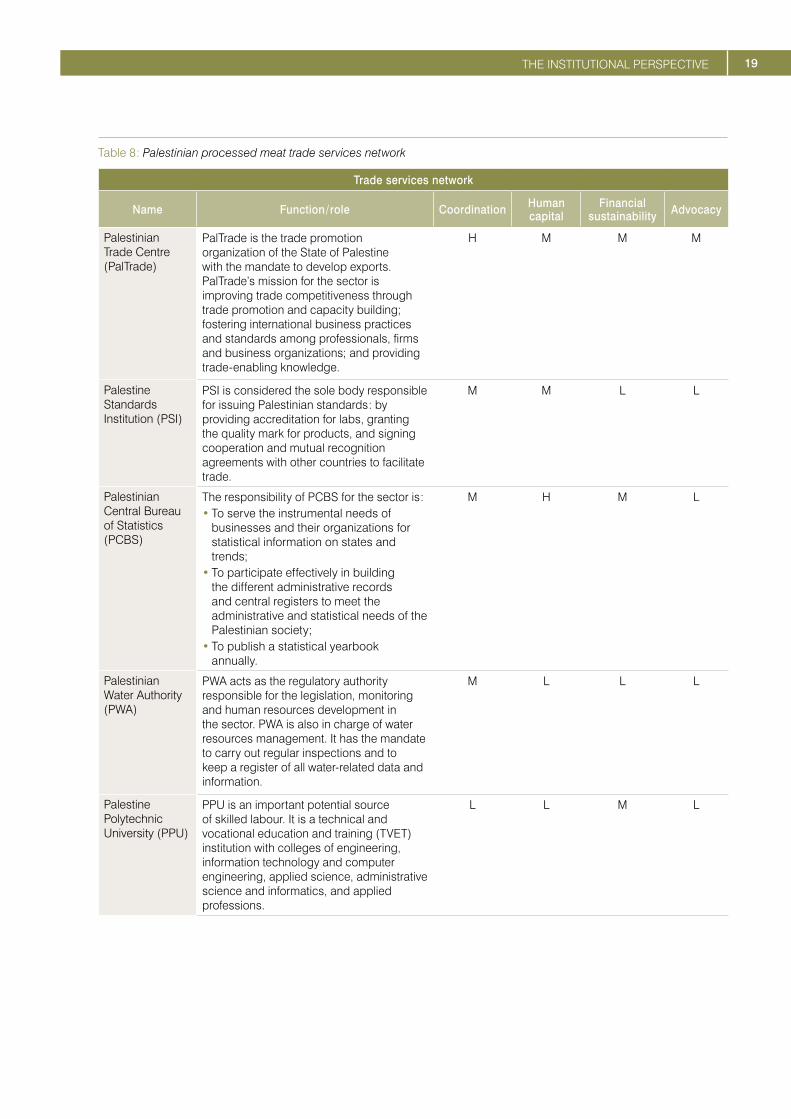
Table 8 : Palestinian processed meat trade services network
Trade services network
Name Function / role Coordination Human capital
Financial sustainability Advocacy
Palestinian Trade Centre ( PalTrade )
PalTrade is the trade promotion organization of the State of Palestine with the mandate to develop exports. PalTrade’s mission for the sector is improving trade competitiveness through trade promotion and capacity building; fostering international business practices and standards among professionals, firms and business organizations; and providing trade-enabling knowledge.
H M M M
Palestine Standards Institution ( PSI )
PSI is considered the sole body responsible for issuing Palestinian standards : by providing accreditation for labs, granting the quality mark for products, and signing cooperation and mutual recognition agreements with other countries to facilitate trade.
M M L L
Palestinian Central Bureau of Statistics ( PCBS )
The responsibility of PCBS for the sector is :• To serve the instrumental needs of
businesses and their organizations for statistical information on states and trends;
• To participate effectively in building the different administrative records and central registers to meet the administrative and statistical needs of the Palestinian society;
• To publish a statistical yearbook annually.
M H M L
Palestinian Water Authority ( PWA )
PWA acts as the regulatory authority responsible for the legislation, monitoring and human resources development in the sector. PWA is also in charge of water resources management. It has the mandate to carry out regular inspections and to keep a register of all water-related data and information.
M L L L
Palestine Polytechnic University ( PPU )
PPU is an important potential source of skilled labour. It is a technical and vocational education and training ( TVET ) institution with colleges of engineering, information technology and computer engineering, applied science, administrative science and informatics, and applied professions.
L L M L

20 THE STATE OF PALESTINE SECTOR EXPORT STRATEGY • AGRO-PROCESSED MEAT
Table 9 : Palestinian processed meat business services network
Business services network
Name Function / role Coordination Human capital
Financial sustainability Advocacy
Palestinian Food Industries Union ( PFIU )
PFIU represents the interests of food industry companies and aims to develop food processing industries. It does this by advocating policies and regulations; promoting higher quality and greater production capacity; supporting member competitiveness and export readiness; and developing support services.
M L L M
Palestinian Federation of Industries ( PFI )
PFI facilitates industrial development as the basis for economic performance. PFI’s representational role is to educate, advocate, and communicate the value of a developed, socially responsible and globally competitive industry.
M L L M
Federation of Palestinian Chambers of Commerce, Industry and Agriculture ( FPCCIA )
The Federation’s main task is to help local chambers of commerce to meet the requirements of the global business environment. FPCCIA is an advocacy institution that aims to ensure that the private sector operates freely and has a voice in policy formulation at the national level. It also strives to create strong regional and international links to global markets and works with SMEs to improve their performance, focusing on market access, quality, costing and financial management.
M L M H
BUSINESS SERVICES NETWORK
These are associations, or major representatives, of com-mercial service providers used by exporters to carry out international trade transactions.
TSI coordination is critical to allow for relevant and diver-sified services and efficient service delivery to exporting enterprises. In the absence of coordination, redundan-cies and overlaps result in wastage of effort and valuable resources, and on the other hand lead to gaps in service delivery. There is weak coordination, some redundancy, and many gaps in terms of sector-specific information and assistance made available to the processed meat sector by these institutions. MoA and PFIU are not provid-ing adequate services for the realization of the sector’s export potential. PFIU, PSI, PPU and PCBS all lack ad-equate human capital. In terms of financial stability, MoA, PFIU, PSI and PFI all face significant challenges as a re-sult of the economic crisis affecting the State of Palestine.
According to the assessment, institutions most affected by significant human capital deficiencies are those in the business services network, whereas those in the policy support and trade services networks fare slightly better,
with mostly medium scores. Either there is a need to im-prove the skills levels of the staff of these institutions or there is a need for organizational alignment.
From the point of view of financial stability, PalTrade, PCBS and FPCCIA are the only institutions considered to possess fairly adequate financial resources to com-plete their mandate. The fact that most institutions are considered financially constrained may stem from the economic crisis that is affecting the State of Palestine, due to which funds allocation is affected at all levels, including ministries.
Advocacy is a very important aspect of the work of TSIs. It serves to inform current and potential exporting enter-prises of available services, business intelligence, and other important information. This area has been cited as a significant weakness for MoA, PFIU, PPU, PSI and PCBS. This indicates a disconnect between private enterprises and the institutions established to help them through poli-cymaking, sector development, public–private dialogue, TVET provision, standards setting, and statistics collec-tion and dissemination. This has an aggregate adverse impact on the export competitiveness of the sector.
21THE INSTITUTIONAL PERSPECTIVE
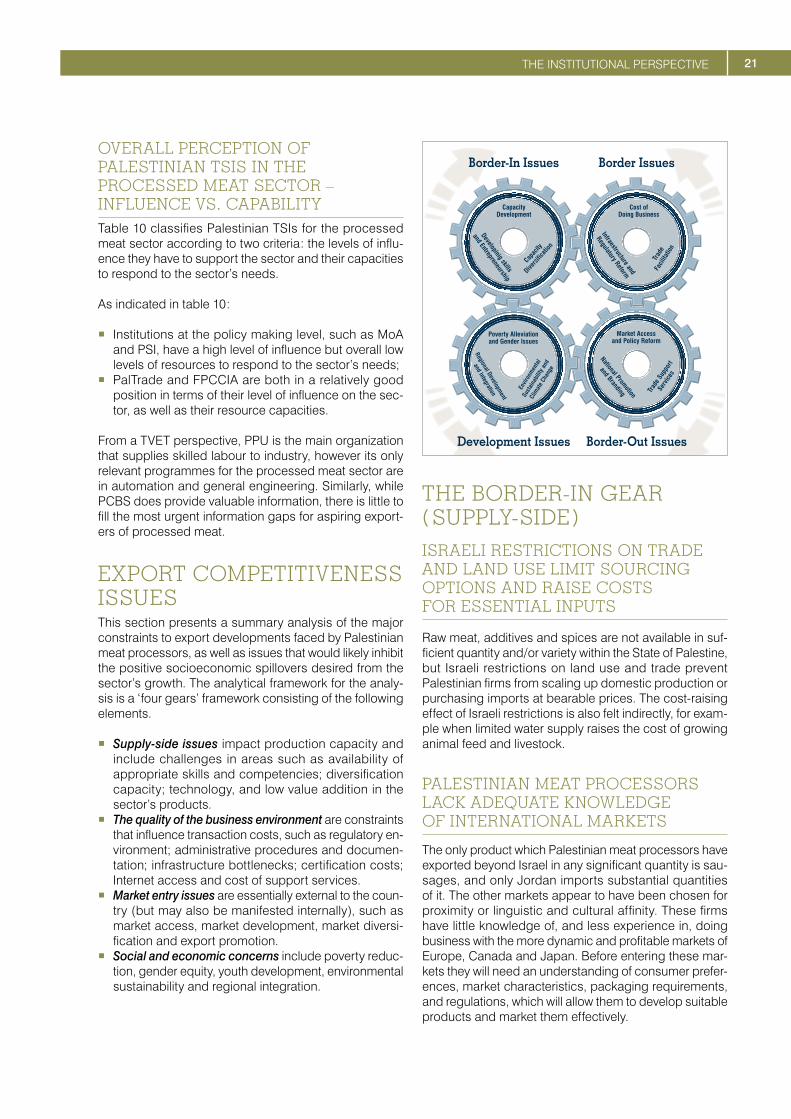
OVERALL PERCEPTION OF PALESTINIAN TSIS IN THE PROCESSED MEAT SECTOR – INFLUENCE VS. CAPABILITYTable 10 classifies Palestinian TSIs for the processed meat sector according to two criteria : the levels of influ-ence they have to support the sector and their capacities to respond to the sector’s needs.
As indicated in table 10 :
� Institutions at the policy making level, such as MoA and PSI, have a high level of influence but overall low levels of resources to respond to the sector’s needs;
� PalTrade and FPCCIA are both in a relatively good position in terms of their level of influence on the sec-tor, as well as their resource capacities.
From a TVET perspective, PPU is the main organization that supplies skilled labour to industry, however its only relevant programmes for the processed meat sector are in automation and general engineering. Similarly, while PCBS does provide valuable information, there is little to fill the most urgent information gaps for aspiring export-ers of processed meat.
EXPORT COMPETITIVENESS ISSUESThis section presents a summary analysis of the major constraints to export developments faced by Palestinian meat processors, as well as issues that would likely inhibit the positive socioeconomic spillovers desired from the sector’s growth. The analytical framework for the analy-sis is a ‘four gears’ framework consisting of the following elements.
� Supply-side issues impact production capacity and include challenges in areas such as availability of appropriate skills and competencies; diversification capacity; technology, and low value addition in the sector’s products.
� The quality of the business environment are constraints that influence transaction costs, such as regulatory en-vironment; administrative procedures and documen-tation; infrastructure bottlenecks; certification costs; Internet access and cost of support services.
� Market entry issues are essentially external to the coun-try ( but may also be manifested internally ), such as market access, market development, market diversi-fication and export promotion.
� Social and economic concerns include poverty reduc-tion, gender equity, youth development, environmental sustainability and regional integration.
Border IssuesBorder-In Issues
Border-Out IssuesDevelopment Issues
CapacityDevelopment
Cost ofDoing Business
Developinig skills
and Entrepreneurship
Capac
ity
Diversi
ficati
on
Infraestructure and
Regulatory Reform
Trad
eFa
cilita
tion
Market Accessand Policy Reform
National Promotion
and Branding Trad
e Su
ppor
t
Serv
ices
Poverty Alleviationand Gender Issues
Regional Development
and Integration
Envir
onm
enta
l
Sust
aina
bilit
y and
Clim
ate
Chan
ge
THE BORDER-IN GEAR ( SUPPLY-SIDE )ISRAELI RESTRICTIONS ON TRADE AND LAND USE LIMIT SOURCING OPTIONS AND RAISE COSTS FOR ESSENTIAL INPUTS
Raw meat, additives and spices are not available in suf-ficient quantity and / or variety within the State of Palestine, but Israeli restrictions on land use and trade prevent Palestinian firms from scaling up domestic production or purchasing imports at bearable prices. The cost-raising effect of Israeli restrictions is also felt indirectly, for exam-ple when limited water supply raises the cost of growing animal feed and livestock.
PALESTINIAN MEAT PROCESSORS LACK ADEQUATE KNOWLEDGE OF INTERNATIONAL MARKETS
The only product which Palestinian meat processors have exported beyond Israel in any significant quantity is sau-sages, and only Jordan imports substantial quantities of it. The other markets appear to have been chosen for proximity or linguistic and cultural affinity. These firms have little knowledge of, and less experience in, doing business with the more dynamic and profitable markets of Europe, Canada and Japan. Before entering these mar-kets they will need an understanding of consumer prefer-ences, market characteristics, packaging requirements, and regulations, which will allow them to develop suitable products and market them effectively.
22 THE STATE OF PALESTINE SECTOR EXPORT STRATEGY • AGRO-PROCESSED MEAT
Box 2 : Overview of supply-side issues
� Israeli restrictions on trade and land use limit sourcing options and raise costs for essential inputs.
� Palestinian meat processors lack adequate knowledge of international markets. � Quality assurance practices are not to international standards at many meat processing
companies. � There is a shortage of domestic skills in food-related research & development and design. � Management capacity at Palestinian meat processing firms is not internationally competitive.
QUALITY ASSURANCE PRACTICES ARE NOT TO INTERNATIONAL STANDARDS AT MANY MEAT PROCESSING COMPANIES
This sector is one of the most advanced in the State of Palestine in terms of meeting international quality and process standards, such as :
� The International Organization for Standardization’s ISO 22000 standard for food safety, derived from ISO 9000; and
� HACCP, the United States government standard for food safety.
However, many of the firms in this sector still do not meet this level of quality assurance, which is effectively a pre-requisite for entering foreign markets.
THERE IS A SHORTAGE OF DOMESTIC SKILLS IN FOOD-RELATED RESEARCH & DEVELOPMENT AND DESIGN
New product development should be a systematic pro-cess by which firms find innovative ways to satisfy existing market needs or develop new products to satisfy evolving consumer preferences and market circumstances. This requires skills in food science, engineering, research and statistical analysis, design and marketing, as well as the management and accounting wherewithal to effectively test and launch a new product.
Palestinian meat processors have a long history in a small market in which everyone in the company is also a consum-er. These characteristics facilitate product development and launch, as do PNA policies promoting Palestinian-made products. However, Palestinian firms will enjoy none of these advantages in large, ever-changing foreign markets; making research, development, design, and quality assur-ance capacity important factors in their success. However, existing TVET programmes do not graduate enough workers with the specific skills needed by this sector.
MANAGEMENT CAPACITY AT PALESTINIAN MEAT PROCESSING FIRMS IS NOT INTERNATIONALLY COMPETITIVE
Palestinian producers have a 90 % domestic market share, a 50 % share of the Jordanian market, and con-sistently low participation in the other Arab markets to which they export sausages at nearly double the average unit price of competitors. They satisfy this demand with monthly production of about 1,800 tons, yet they main-tain capacity for approximately 3,000. This represents a large over-investment, which not only ties up capital in a wasteful manner; it hurts overall competitiveness, as final product prices must absorb maintenance costs for this idle capacity.
Such high excess capacity gives the impression of in-vestors either riskily building up supply capacity without a clear idea of where the demand was going to come from, or not knowing how to more effectively use finan-cial resources to build international competitiveness. In either case, it appears that Palestinian meat proces-sors would benefit from entrepreneurial and managerial training specifically as it relates to competitiveness in the global market.
Source: Peter Hellberg.
23THE INSTITUTIONAL PERSPECTIVE
Box 3 : Overview of business environment issues
� There is inadequate infrastructure to link domestic raw meat suppliers to meat processors. � Unlike most competitors, Palestinian processed meat exporters must obtain costly, independ-
ent certification from a different source in each target market. � Imported packaging materials are extraordinarily expensive, accounting for 25 %-30 % of final
production costs.
THE BORDER GEAR ( QUALITY OF THE BUSINESS ENVIRONMENT )THERE IS INADEQUATE INFRASTRUCTURE TO LINK DOMESTIC RAW MEAT SUPPLIERS TO MEAT PROCESSORS
Demand by meat processors for turkey is enough that it could fully absorb all domestic turkey production but there is inadequate infrastructure in terms of slaughter-houses, cold transport and cold storage to get an ad-equate supply of domestic raw meat to Palestinian meat processors. Gaza suppliers, in particular, are challenged by the double border crossing to enter Israel and then the West Bank. Waits of up to six hours preclude transpor-tation of unrefrigerated raw meat. These circumstances make it more practical in many cases to import more expensive frozen turkey parts from Israel. Consequently, meat processors absorb only 20 % 25 of domestic turkey production, meaning lost opportunities for turkey farmers and higher prices for meat processors.
UNLIKE MOST COMPETITORS, PALESTINIAN PROCESSED MEAT EXPORTERS MUST OBTAIN COSTLY, INDEPENDENT CERTIFICATION FROM A DIFFERENT SOURCE IN EACH TARGET MARKET
The lack of international recognition of PSI increases exporter costs, complexity of procedures, and risks, by forcing them to obtain costly, time-consuming and po-tentially adverse sanitary tests for each shipment in each foreign market. Exporters from most countries can rely on a public national body to play this role, putting Palestinian
25. Akra, F. I. ( May 2010 ). The Palestinian Food-Processing Sector : Its Impact on Agricultural Development. Available from : http : / / www.thisweekinpalestine.com / details.php?id=3111&ed=182&edid=182
firms at a relative disadvantage. In this sector and others dependent on sanitary and phytosanitary ( SPS ) certifica-tion, international recognition of PSI would have a broad effect on exporter competitiveness.
IMPORTED PACKAGING MATERIALS ARE EXTRAORDINARILY EXPENSIVE, ACCOUNTING FOR 25 %-30 % OF FINAL PRODUCTION COSTS
Packaging is particularly important to food and beverage subsectors. Sanitary packaging ensures public health and minimises losses due to spoilage. At the same time, marketing aspects of packaging are critical to differenti-ate a product from a field of very similar products and to draw customers away from favourite brands. However, there is no design and production capacity for packaging materials within the State of Palestine and the materials which are imported from Israel are very expensive, ac-counting for 25 %-30 % of the final production cost. This substantially diminishes the international competitiveness of Palestinian processed meat products.
THE BORDER-OUT GEAR ( MARKET ENTRY )THERE IS A SHORTAGE OF AFFORDABLE COLD STORAGE SPACE AT BORDER CROSSINGS
Israeli export procedures can cause long delays at check-points and border crossings, threatening many processed meat exports with spoilage and making the quality and profitability of Palestinian exports unpredictable. Privately run cold storage is available at some checkpoints and border crossings but on the whole cold storage is neither affordable nor reliable. Relatively small investments in cold storage and transportation, whether by the public or private sector, could alleviate a major cross-cutting bot-tleneck to the country’s export readiness for perishable food items, several of which have been deemed strategic through the NES design process.
24 THE STATE OF PALESTINE SECTOR EXPORT STRATEGY • AGRO-PROCESSED MEAT
THE PNA HAS NOT ADEQUATELY EQUIPPED THE STATE OF PALESTINE’S TSIS TO FURNISH PROCESSED MEAT PRODUCERS WITH QUALITY TRADE INFORMATION
As a whole, the Palestinian processed meat sector is not export-minded. Palestinian production goes to satisfying local demand, with only 5 %-8 % of production being ex-ported, and with negligible imports. Breaking into foreign markets can be daunting, especially when producers are small relative to competitors, face the risks of dealing in perishable goods, and have little knowledge of foreign business, culture and language. In such a sector, there is a tremendous need for government support to achieve export success. The Palestinian government, through its TSIs, should provide detailed and regularly updated mar-ket analysis for target markets, including on customers, products, competitors, distribution channels and market access. However, Palestinian TSIs are not adequately funded or sufficiently well-publicized to stimulate potential beneficiaries to request information.
PALESTINIAN PROCESSED MEAT EXPORTS SUFFER FROM A LACK OF BRANDING
The market for mass-market processed meat products is crowded with competitors whose products may not be easily distinguished from one another. Furthermore, consumers often limit their purchases to a small range of trusted brands. Innovative product characteristics or lower prices may entice consumers to try new products, but a strong brand is needed to convert these opportuni-ties into repeat purchases.
As most meat processors are focused on meeting local demand they do little to brand themselves or create brand awareness internationally. Their export transactions are often small-scale, and business relationships may start
because of personal relationships and proximity, making branding less essential.
Similarly, a review of the State of Palestine’s export his-tory shows that it exports disproportionately to countries where common language, common culture, and pre-ex-isting awareness of the State of Palestine facilitate busi-ness. With better trade information and capacity-building extension services from the country’s TSIs, exporters may overcome the gaps in knowledge and confidence which keep them from breaking into the larger, more dynamic or more profitable markets in the world. Whatever brand-ing meat processors attempt, they should include brands designed to exploit Palestinian advantages, such as the availability of organic, halal, and fair trade products.
DEVELOPMENT GEARPALESTINIAN INFRASTRUCTURE GEOGRAPHICALLY LIMITS THE SOCIOECONOMIC BENEFITS OF THE MEAT PROCESSING SECTOR’S SUCCESS
Palestinian infrastructure discourages establishment of meat processing facilities outside of Ramallah and a few other major cities. While this keeps production clos-er to domestic consumers, it limits the ability of most Palestinians to participate in the sector’s relatively skilled employment and it hurts the exportability of products by increasing the number of time-consuming, and therefore quality-degrading, checkpoints that need to be crossed.
Considering the fact that most raw meat used by Palestinian meat processors comes from Israel, an ex-port-oriented industrial park with critical infrastructure ( e.g. water supply, slaughterhouse, cold storage ) could be placed in a smaller population centre between the border and traditional big city locations for meat process-ing plants.
Box 5 : Overview of development issues
� Palestinian infrastructure geographically limit the socioeconomic benefits of the meat process-ing sector’s success.
� The general food and beverage sector has a very low female-to-male worker ratio.
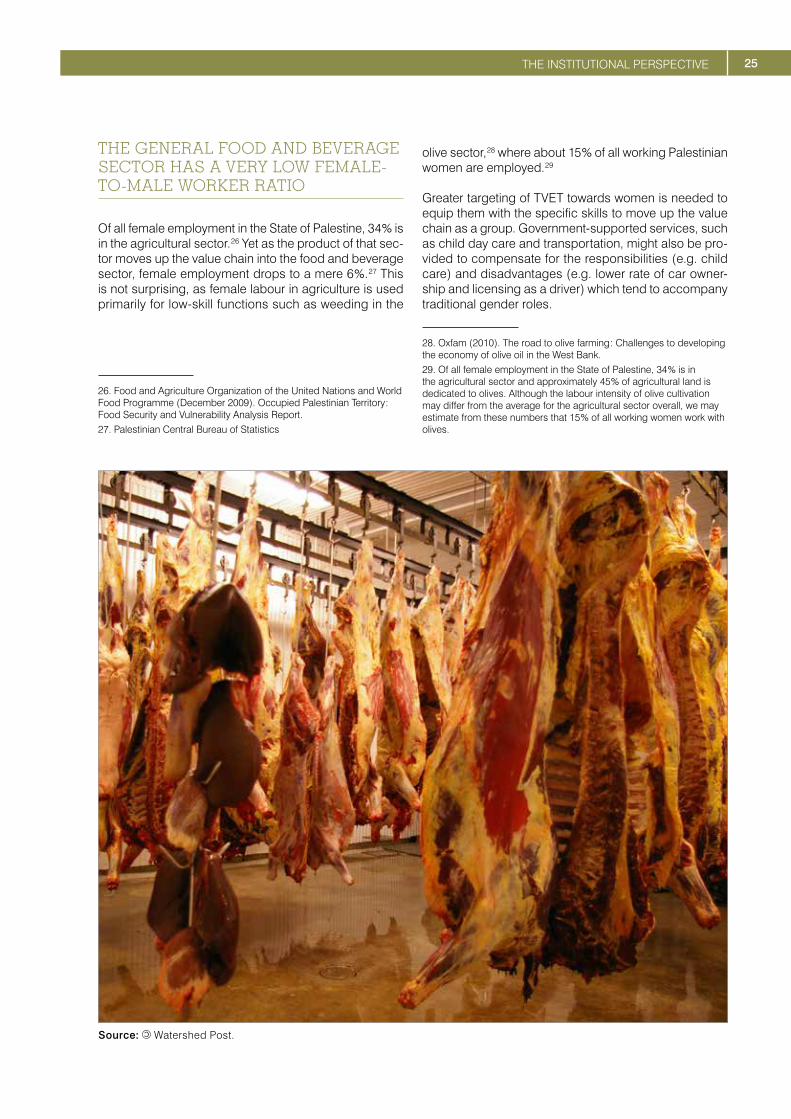
25THE INSTITUTIONAL PERSPECTIVE
THE GENERAL FOOD AND BEVERAGE SECTOR HAS A VERY LOW FEMALE-TO-MALE WORKER RATIO
Of all female employment in the State of Palestine, 34 % is in the agricultural sector. 26 Yet as the product of that sec-tor moves up the value chain into the food and beverage sector, female employment drops to a mere 6 %. 27 This is not surprising, as female labour in agriculture is used primarily for low-skill functions such as weeding in the
26. Food and Agriculture Organization of the United Nations and World Food Programme ( December 2009 ). Occupied Palestinian Territory : Food Security and Vulnerability Analysis Report.27. Palestinian Central Bureau of Statistics
olive sector, 28 where about 15 % of all working Palestinian women are employed. 29
Greater targeting of TVET towards women is needed to equip them with the specific skills to move up the value chain as a group. Government-supported services, such as child day care and transportation, might also be pro-vided to compensate for the responsibilities ( e.g. child care ) and disadvantages ( e.g. lower rate of car owner-ship and licensing as a driver ) which tend to accompany traditional gender roles.
28. Oxfam ( 2010 ). The road to olive farming : Challenges to developing the economy of olive oil in the West Bank.29. Of all female employment in the State of Palestine, 34 % is in the agricultural sector and approximately 45 % of agricultural land is dedicated to olives. Although the labour intensity of olive cultivation may differ from the average for the agricultural sector overall, we may estimate from these numbers that 15 % of all working women work with olives.
Source: Watershed Post.
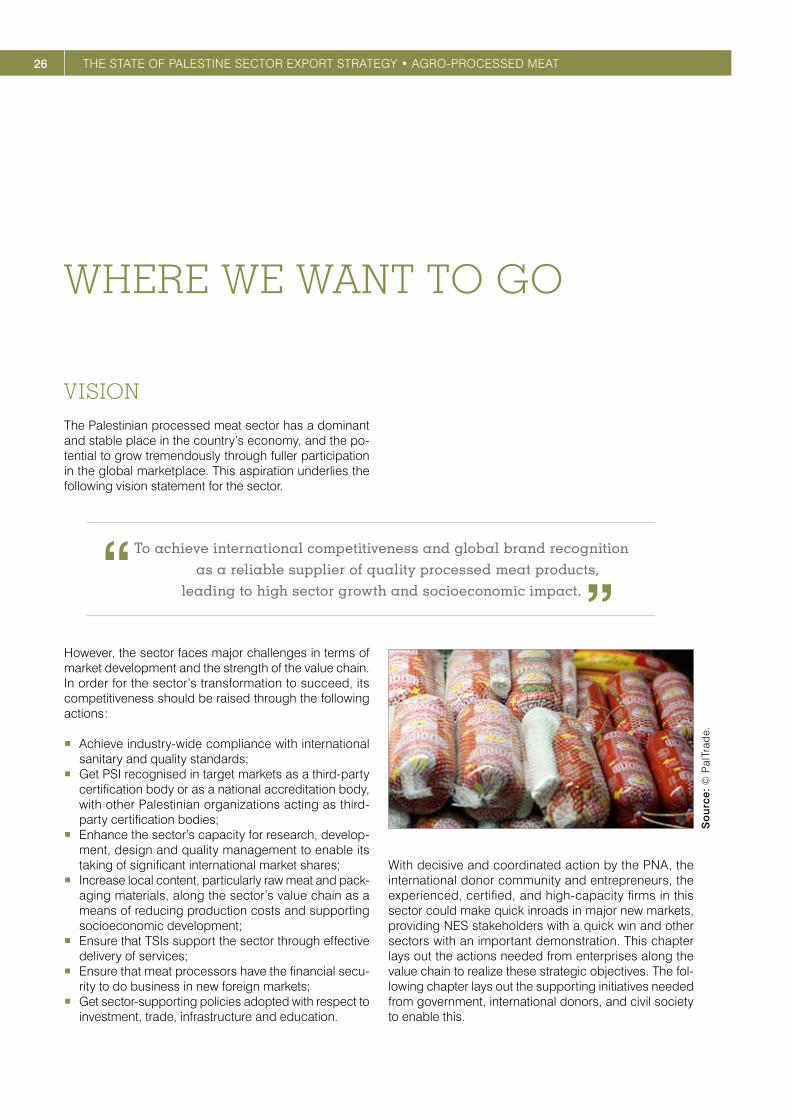
So
urc
e: ©
Pal
Trad
e.
26 THE STATE OF PALESTINE SECTOR EXPORT STRATEGY • AGRO-PROCESSED MEAT
WHERE WE WANT TO GO
VISIONThe Palestinian processed meat sector has a dominant and stable place in the country’s economy, and the po-tential to grow tremendously through fuller participation in the global marketplace. This aspiration underlies the following vision statement for the sector.
“To achieve international competitiveness and global brand recognition as a reliable supplier of quality processed meat products,
leading to high sector growth and socioeconomic impact. ”However, the sector faces major challenges in terms of market development and the strength of the value chain. In order for the sector’s transformation to succeed, its competitiveness should be raised through the following actions :
� Achieve industry-wide compliance with international sanitary and quality standards;
� Get PSI recognised in target markets as a third-party certification body or as a national accreditation body, with other Palestinian organizations acting as third-party certification bodies;
� Enhance the sector’s capacity for research, develop-ment, design and quality management to enable its taking of significant international market shares;
� Increase local content, particularly raw meat and pack-aging materials, along the sector’s value chain as a means of reducing production costs and supporting socioeconomic development;
� Ensure that TSIs support the sector through effective delivery of services;
� Ensure that meat processors have the financial secu-rity to do business in new foreign markets;
� Get sector-supporting policies adopted with respect to investment, trade, infrastructure and education.
With decisive and coordinated action by the PNA, the international donor community and entrepreneurs, the experienced, certified, and high-capacity firms in this sector could make quick inroads in major new markets, providing NES stakeholders with a quick win and other sectors with an important demonstration. This chapter lays out the actions needed from enterprises along the value chain to realize these strategic objectives. The fol-lowing chapter lays out the supporting initiatives needed from government, international donors, and civil society to enable this.
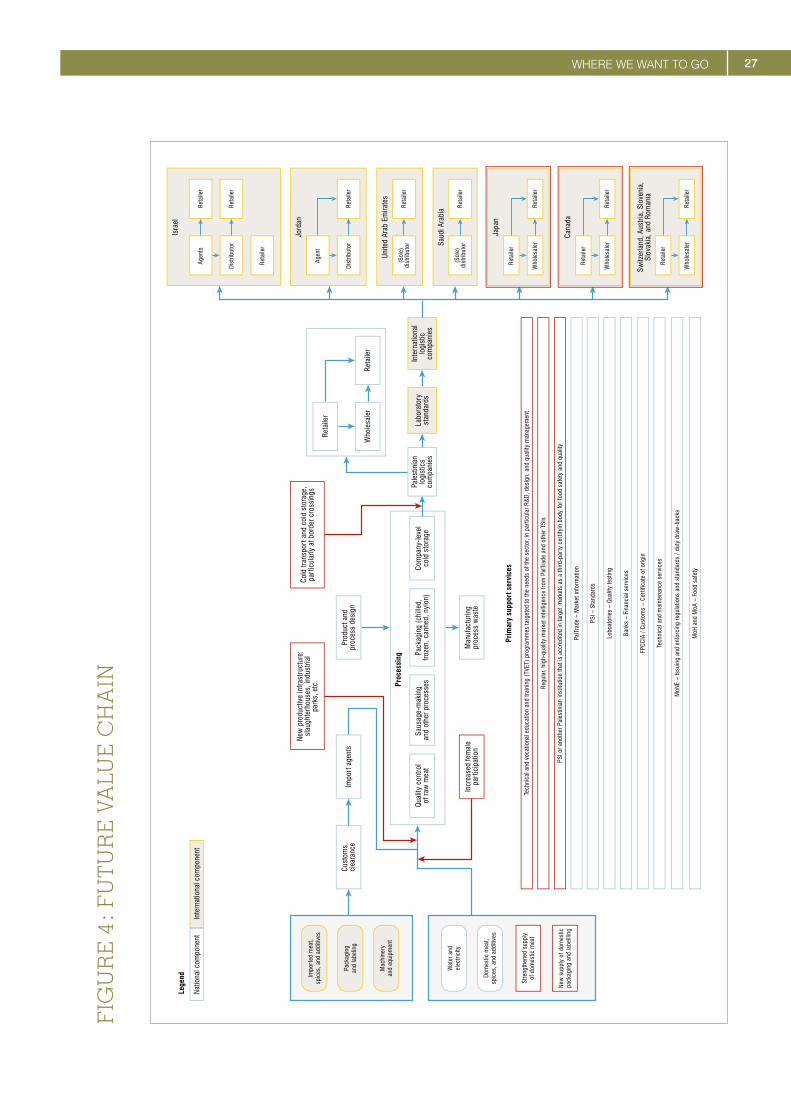
Nat
iona
l com
pone
nt
Com
pany
-leve
lco
ld s
tora
gePa
ckag
ing
(chi
lled,
froze
n, c
anne
d, n
ylon
)Sa
usag
e-m
akin
g an
d ot
her p
roce
sses
New
pro
duct
ive
infra
stru
ctur
e:sl
augh
terh
ouse
s, in
dust
rial
park
s, e
tc.
Cold
tran
spor
t and
col
d st
orag
e,pa
rtic
ular
ly a
t bor
der c
ross
ings
Qua
lity
cont
rol
of ra
w m
eat
Pale
stin
ian
logi
stic
sco
mpa
nies
Labo
rato
ryst
anda
rds
Inte
rnat
iona
llo
gist
icco
mpa
nies
Man
ufac
turin
gpr
oces
s w
aste
Prod
uct a
ndpr
oces
s de
sign
Cust
oms,
clea
ranc
eIm
port
age
nts
Incr
ease
d fe
mal
epa
rtic
ipat
ion
Reta
iler
Who
lesa
ler
Reta
iler
PSI –
Sta
ndar
ds
PalT
rade
– M
arke
t inf
orm
atio
n
PSI o
r ano
ther
Pal
estin
ian
inst
itutio
n th
at is
acc
redi
ted
in ta
rget
mar
kets
as
a th
ird-p
arty
cer
tifyi
n bo
dy fo
r foo
d sa
fety
and
qua
lity
Regu
lar,
high
-qua
lity
mar
ket i
ntel
ligen
ce fr
om P
alTr
ade
and
othe
r TSI
s
Tech
nica
l and
voc
atio
nal e
duca
tion
and
train
ing
(TVE
T) p
rogr
amm
es ta
rget
ed to
the
need
s of
the
sect
or, i
n pa
rtic
ular
R&
D, d
esig
n, a
nd q
ualit
y m
anag
emen
t
Prim
ary
supp
ort s
ervi
ces
Proc
essi
ng
Lobo
ator
ies
– Q
ualit
y te
stin
g
Bank
s –
Fina
ncia
l ser
vice
s
FPCC
IA /
Cust
oms
– Ce
rtifi
cate
of o
rigin
Tech
nica
l and
mai
nten
ance
ser
vice
s
MoN
E –
Issu
ing
and
enfo
rcin
g re
gula
tions
and
sta
ndar
ds /
duty
dra
w-b
acks
MoH
and
MoA
– F
ood
safe
ty
Isra
el
Agen
tsRe
taile
r
Dis
tribu
tor
Reta
iler
Reta
iler
Jord
an
Agen
t
Dis
tribu
tor
Reta
iler
Japa
n
Reta
iler
Who
lesa
ler
Reta
iler
Cana
da
Reta
iler
Who
lesa
ler
Reta
iler
Switz
erla
nd, A
ustri
a, S
love
nia,
Slov
akia
, and
Rom
ania
Reta
iler
Who
lesa
ler
Reta
iler
Unite
d Ar
ab E
mira
tes
(Sol
e)di
strib
utor
Reta
iler
Saud
i Ara
bia
(Sol
e)di
strib
utor
Reta
iler
Mac
hine
ryan
d eq
uipm
ent
Pack
agin
gan
d la
belin
g
Impo
rted
mea
t,sp
ices
, and
add
itive
s
Dom
estic
mea
t,sp
ices
, and
add
itive
s
Stre
ngth
ened
sup
ply
of d
omes
tic m
eat
New
sup
ply
of d
omes
ticpa
ckag
ing
and
labe
lllin
g
Wat
er a
ndel
ectri
city
Lege
nd
Inte
rnat
iona
l com
pone
nt
27WHERE WE WANT TO GO
FIG
UR
E 4
: F
UT
UR
E V
ALU
E C
HA
IN
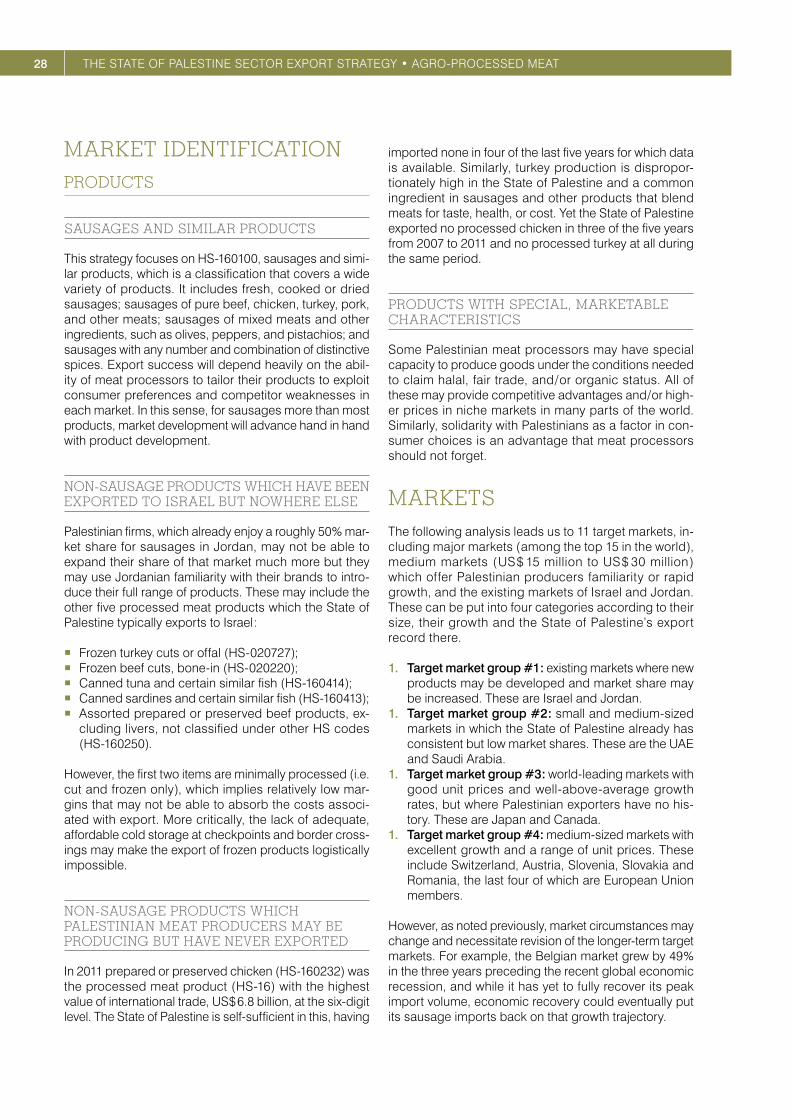
28 THE STATE OF PALESTINE SECTOR EXPORT STRATEGY • AGRO-PROCESSED MEAT
MARKET IDENTIFICATIONPRODUCTS
SAUSAGES AND SIMILAR PRODUCTS
This strategy focuses on HS-160100, sausages and simi-lar products, which is a classification that covers a wide variety of products. It includes fresh, cooked or dried sausages; sausages of pure beef, chicken, turkey, pork, and other meats; sausages of mixed meats and other ingredients, such as olives, peppers, and pistachios; and sausages with any number and combination of distinctive spices. Export success will depend heavily on the abil-ity of meat processors to tailor their products to exploit consumer preferences and competitor weaknesses in each market. In this sense, for sausages more than most products, market development will advance hand in hand with product development.
NON-SAUSAGE PRODUCTS WHICH HAVE BEEN EXPORTED TO ISRAEL BUT NOWHERE ELSE
Palestinian firms, which already enjoy a roughly 50 % mar-ket share for sausages in Jordan, may not be able to expand their share of that market much more but they may use Jordanian familiarity with their brands to intro-duce their full range of products. These may include the other five processed meat products which the State of Palestine typically exports to Israel :
� Frozen turkey cuts or offal ( HS-020727 ); � Frozen beef cuts, bone-in ( HS-020220 ); � Canned tuna and certain similar fish ( HS-160414 ); � Canned sardines and certain similar fish ( HS-160413 ); � Assorted prepared or preserved beef products, ex-
cluding livers, not classified under other HS codes ( HS-160250 ).
However, the first two items are minimally processed ( i.e. cut and frozen only ), which implies relatively low mar-gins that may not be able to absorb the costs associ-ated with export. More critically, the lack of adequate, affordable cold storage at checkpoints and border cross-ings may make the export of frozen products logistically impossible.
NON-SAUSAGE PRODUCTS WHICH PALESTINIAN MEAT PRODUCERS MAY BE PRODUCING BUT HAVE NEVER EXPORTED
In 2011 prepared or preserved chicken ( HS-160232 ) was the processed meat product ( HS-16 ) with the highest value of international trade, US $ 6.8 billion, at the six-digit level. The State of Palestine is self-sufficient in this, having
imported none in four of the last five years for which data is available. Similarly, turkey production is dispropor-tionately high in the State of Palestine and a common ingredient in sausages and other products that blend meats for taste, health, or cost. Yet the State of Palestine exported no processed chicken in three of the five years from 2007 to 2011 and no processed turkey at all during the same period.
PRODUCTS WITH SPECIAL, MARKETABLE CHARACTERISTICS
Some Palestinian meat processors may have special capacity to produce goods under the conditions needed to claim halal, fair trade, and / or organic status. All of these may provide competitive advantages and / or high-er prices in niche markets in many parts of the world. Similarly, solidarity with Palestinians as a factor in con-sumer choices is an advantage that meat processors should not forget.
MARKETSThe following analysis leads us to 11 target markets, in-cluding major markets ( among the top 15 in the world ), medium markets ( US $ 15 million to US $ 30 million ) which offer Palestinian producers familiarity or rapid growth, and the existing markets of Israel and Jordan. These can be put into four categories according to their size, their growth and the State of Palestine’s export record there.
1. Target market group #1 : existing markets where new products may be developed and market share may be increased. These are Israel and Jordan.
1. Target market group #2 : small and medium-sized markets in which the State of Palestine already has consistent but low market shares. These are the UAE and Saudi Arabia.
1. Target market group #3 : world-leading markets with good unit prices and well-above-average growth rates, but where Palestinian exporters have no his-tory. These are Japan and Canada.
1. Target market group #4 : medium-sized markets with excellent growth and a range of unit prices. These include Switzerland, Austria, Slovenia, Slovakia and Romania, the last four of which are European Union members.
However, as noted previously, market circumstances may change and necessitate revision of the longer-term target markets. For example, the Belgian market grew by 49 % in the three years preceding the recent global economic recession, and while it has yet to fully recover its peak import volume, economic recovery could eventually put its sausage imports back on that growth trajectory.

29WHERE WE WANT TO GO
It is recommended that these targets be divided into two broad phases, with groups #1 and #2 being pursued in the short term ( 0-3 years ) and group #3 in the medium term ( 3+ years ). It is expected that a significant portion of the NES and sector plans of action will have been im-plemented by the end of the first phase. This approach is aimed at staging interventions in alignment with the evolving capacities of sector TSIs and enterprises as the NES implementation moves forward.
SHORT TERM ( 0-3 YEARS )
TARGET MARKET GROUP #1 : ISRAEL AND JORDAN
Many of the State of Palestine’s meat processors lack substantial export experience. For them, the Israeli and Jordanian markets are obvious first steps, as their market requirements, distribution channels, supporting services ( e.g. laboratory testing ), and export / import procedures are well known in the State of Palestine.
For the firms already participating heavily in these mar-kets, maintaining that revenue stream will be important to the firms’ financial positions and their abilities to venture
into new markets. Israel and Jordan also provide these firms with a good testing ground for the new capacities of product development and roll-out recommended in this strategy. Mastering those processes will be important for breaking into new target markets.
Table 11 presents the two countries of target market group #1, both of which are Palestinian neighbours, and some of the fundamental market characteristics of each.
TARGET MARKET GROUP #2 : UAE AND SAUDI ARABIA
One focus in the short term will be further penetrating ex-isting markets by deepening existing trade relationships and getting more Palestinian firms to export to these markets for the first time. During this phase cultural af-finity, bilateral geographical distances and existing trade relationships are the major criteria for determining target markets. Establishing export relationships in new markets will be difficult due to the weak business environment and low capacities of firms and the trade support network.
Table 12 presents the two countries of target market group #2, both of which are on the Arabian Peninsula, and some of the fundamental market characteristics of each.
Table 11 : Target market group #1 for Palestinian processed meat, short-term phase ( 0-3 years )
Target market
Market segment Product Distribution
channel
Sector exports to market ( US $
thousands ) ( 2011 )
Average annual growth
of sector imports
2008-2012
Average annual GDP
growth estimates 2013-2017
Israel Mass consumers
Sausages and similar products ( HS-160100 )
Agents, distrib-utors, retailers
536 50 % 3.6 %
Jordan Mass consumers
Sausages and similar products ( HS-160100 )
Agents, distributors
4 353 20 % 4.0 %
Source : ITC calculations based on Comtrade’s data, IMF world economic outlook database.
Table 12 : Target market group #2 for Palestinian processed meat, short-term phase ( 0-3 years )
Target market
Market segment Product Distribution
channel
Sector exports to
market ( US $ thousands )
( 2011 )
Average annual growth
of sector imports
2008-2012
Average annual GDP
growth estimates 2013-2017
United Arab Emirates
Mass consumers
Sausages and similar products ( HS-160100 )
Distributors 702 3 % 3.5 %
Saudi Arabia Mass consumers
Sausages and similar products ( HS-160100 )
Distributors 230 16 % 4.3 %
Source : ITC calculations based on Comtrade’s data, IMF world economic outlook database.
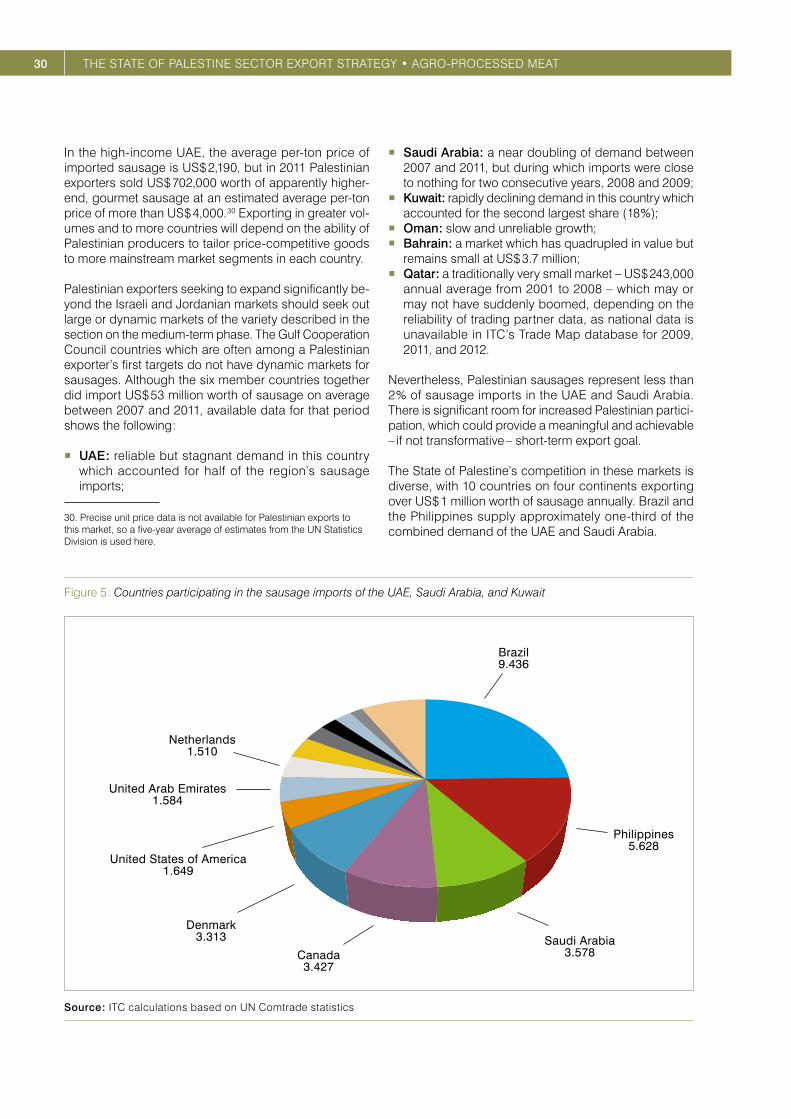
30 THE STATE OF PALESTINE SECTOR EXPORT STRATEGY • AGRO-PROCESSED MEAT
In the high-income UAE, the average per-ton price of imported sausage is US $ 2,190, but in 2011 Palestinian exporters sold US $ 702,000 worth of apparently higher-end, gourmet sausage at an estimated average per-ton price of more than US $ 4,000. 30 Exporting in greater vol-umes and to more countries will depend on the ability of Palestinian producers to tailor price-competitive goods to more mainstream market segments in each country.
Palestinian exporters seeking to expand significantly be-yond the Israeli and Jordanian markets should seek out large or dynamic markets of the variety described in the section on the medium-term phase. The Gulf Cooperation Council countries which are often among a Palestinian exporter’s first targets do not have dynamic markets for sausages. Although the six member countries together did import US $ 53 million worth of sausage on average between 2007 and 2011, available data for that period shows the following :
� UAE : reliable but stagnant demand in this country which accounted for half of the region’s sausage imports;
30. Precise unit price data is not available for Palestinian exports to this market, so a five-year average of estimates from the UN Statistics Division is used here.
� Saudi Arabia : a near doubling of demand between 2007 and 2011, but during which imports were close to nothing for two consecutive years, 2008 and 2009;
� Kuwait : rapidly declining demand in this country which accounted for the second largest share ( 18 % );
� Oman : slow and unreliable growth; � Bahrain : a market which has quadrupled in value but
remains small at US $ 3.7 million; � Qatar : a traditionally very small market – US $ 243,000
annual average from 2001 to 2008 – which may or may not have suddenly boomed, depending on the reliability of trading partner data, as national data is unavailable in ITC’s Trade Map database for 2009, 2011, and 2012.
Nevertheless, Palestinian sausages represent less than 2 % of sausage imports in the UAE and Saudi Arabia. There is significant room for increased Palestinian partici-pation, which could provide a meaningful and achievable – if not transformative – short-term export goal.
The State of Palestine’s competition in these markets is diverse, with 10 countries on four continents exporting over US $ 1 million worth of sausage annually. Brazil and the Philippines supply approximately one-third of the combined demand of the UAE and Saudi Arabia.
Figure 5 : Countries participating in the sausage imports of the UAE, Saudi Arabia, and Kuwait
Brazil9.436
Philippines5.628
Saudi Arabia3.578
Denmark3.313
Canada3.427
Netherlands1.510
United States of America1.649
United Arab Emirates1.584
Source : ITC calculations based on UN Comtrade statistics

31WHERE WE WANT TO GO
Table 13 : Most attractive markets among the leading global importers of sausages and similar products ( HS 160100 )
Rank ImportersValue imported in 2012 ( US $ thousands )
Unit value ( US $ / unit )
Annual growth in value
2008-2012 ( % )
Annual growth in value
2011-2012 ( % )
Share in world imports ( % )
World 4 147 678 3 210 5 3 100
1 United Kingdom 512 192 4 877 4 7 12.3
2 Germany 465 666 7 414 3 1 11.2
3 Japan 291 433 5 694 15 16 7
4 France 231 218 4 613 0 4 5.6
5 Belgium 194 307 5 384 -1 -5 4.7
6 Canada 166 083 5 006 24 15 4
7 Russian Federation 127 012 3 568 43 147 3.1
8 Angola 123 481 2 100 9 12 3
9 Denmark 111 102 4 804 8 5 2.7
10 Mexico 109 742 3 456 6 8 2.6
11 Sweden 104 293 6 207 8 -6 2.5
Colour legend : Beats world average unit value by more than 50 %
Beats world market growth rates by more than 100 %
Beats both unit value and market growth
Source : ITC calculations based on UN Comtrade statistics
Table 14 : Target market group #3 for Palestinian processed meat, short-term phase ( 0-3 years )
Target market
Market segment Product Distribution
channel
Sector exports to
market ( US $ thousands )
( 2011 )
Average annual growth
of sector imports, by
value,2008-2012
Average annual GDP
growth estimates 2013-2017
Japan Mass con-sumers
Sausages and similar products ( HS-160100 )
Wholesalers, large retailers
0 15 % 1.3 %
Canada Mass con-sumers
Sausages and similar products ( HS-160100 )
Wholesalers, large retailers
0 24 % 2.2 %
Source : ITC calculations based on UN Comtrade data, IMF world economic outlook database.
TARGET MARKET GROUP #3 : JAPAN AND CANADA
A typical methodology for identifying good potential tar-get markets would look for a combination of large market size, high unit value and market growth that consistent-ly beats the global market. This leads us to Japan and Canada.
Over the last four years the market value has increased by an annual average of 5 %, and last year it went up by 3 %.
Among the top 10 importing countries, three have more than doubled both of these rates : the Russian Federation ( 43 %, 2008-2012 ), Canada ( 24 % ), and Japan ( 15 % ). Among these, two offer unit values at least 50 % higher than the global average : Japan ( 77 % higher in 2012 ) and Canada ( 56 % ).
The United States, China and Thailand dominate supply to these two markets, taking a combined market share of about 80 %, but that leaves almost US $ 100,000 in imports to be supplied by a score of other countries.
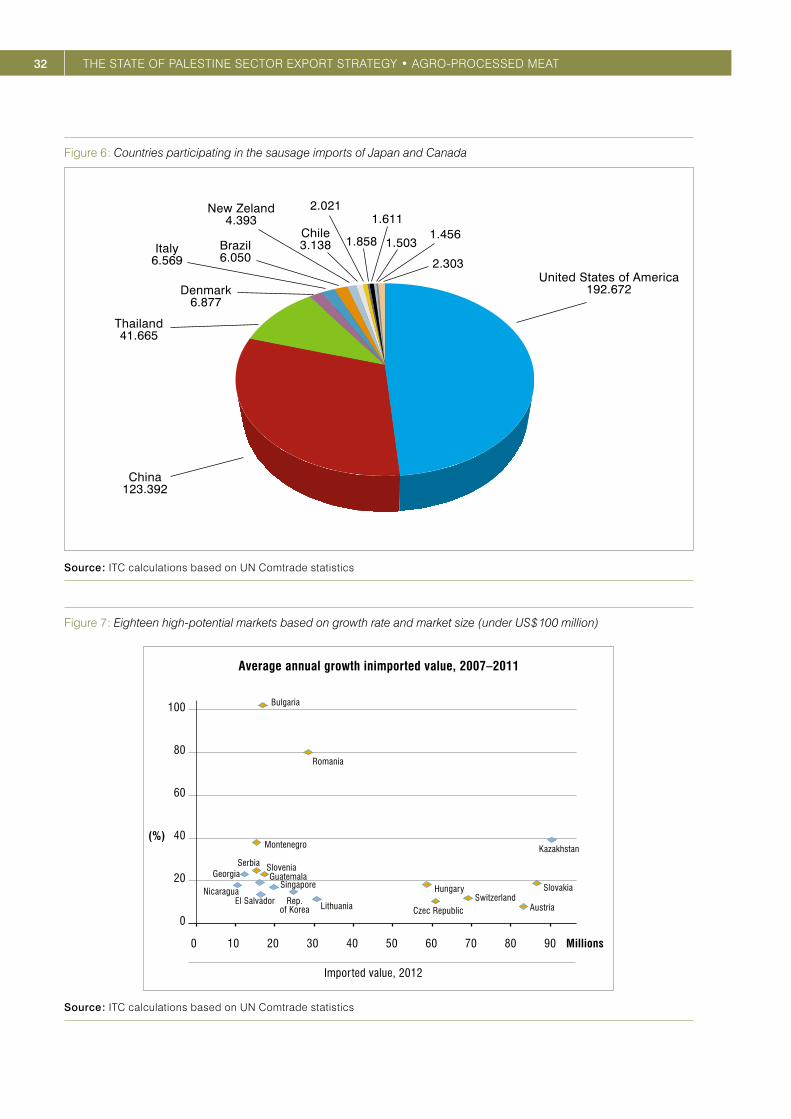
32 THE STATE OF PALESTINE SECTOR EXPORT STRATEGY • AGRO-PROCESSED MEAT
Figure 6 : Countries participating in the sausage imports of Japan and Canada
United States of America192.672
China123.392
Denmark6.877
Thailand41.665
New Zeland4.393
Chile3.138
2.021
1.858
1.611
1.5031.456
2.303Italy
6.569Brazil6.050
Source : ITC calculations based on UN Comtrade statistics
Figure 7 : Eighteen high-potential markets based on growth rate and market size ( under US $ 100 million )
(%)
0 10 20 30 40 50 60 70 9080
Average annual growth inimported value, 2007–2011
Imported value, 2012
0
20
40
80
60
100 Bulgaria
Romania
Montenegro
Serbia SloveniaGeorgia
NicaraguaEl Salvador LithuaniaRep.
of Korea
Hungary
Czec RepublicSwitzerland
Slovakia
Austria
Kazakhstan
SingaporeGuatemala
Millions
Source : ITC calculations based on UN Comtrade statistics
33WHERE WE WANT TO GO
Table 15 : Target markets for Palestinian processed meat, medium-long term phase ( 3+ years )
Target market Market segment Product Distribution
channel
Sector exports to
market ( US $ thousands )
( 2011 )
Average annual growth
of sector imports, by
value2007-2011
Average annual GDP
growth estimates 2013-2017
Switzerland Mass con-sumers
Sausages and similar products ( HS-160100 )
Wholesalers, large retailers
0 12 % 1.8 %
Austria Mass con-sumers
Sausages and similar products ( HS-160100 )
Wholesalers, large retailers
0 10 % 1.4 %
Slovenia Mass con-sumers
Sausages and similar products ( HS-160100 )
Wholesalers, large retailers
0 23 % 1.1 %
Slovakia Mass con-sumers
Sausages and similar products ( HS-160100 )
Wholesalers, large retailers
0 20 % 2.9 %
Romania Mass con-sumers
Sausages and similar products ( HS-160100 )
Wholesalers, large retailers
0 80 % 2.4 %
Sources : ITC calculations based on UN Comtrade data, IMF world economic outlook database.
Figure 8: A central and southeastern European cluster of dynamic markets for HS 160100 (sausages, etc.)
Source: ITC, created with the amMap Visited countries map widget
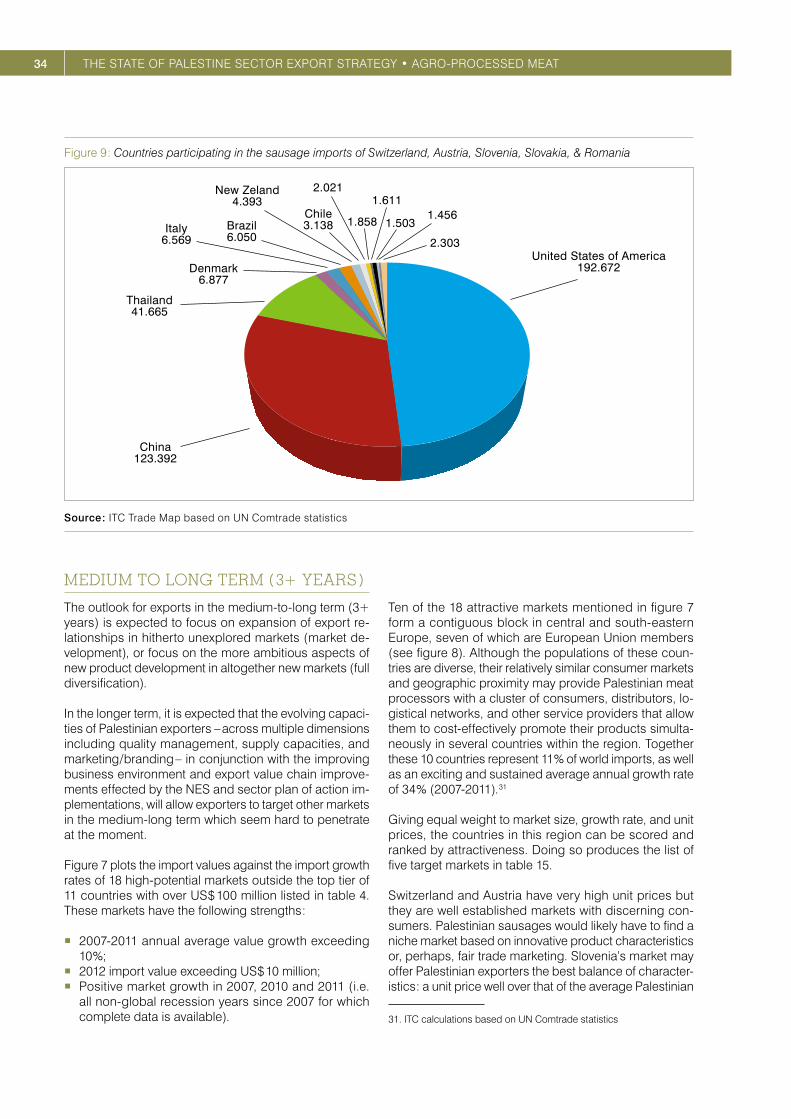
34 THE STATE OF PALESTINE SECTOR EXPORT STRATEGY • AGRO-PROCESSED MEAT
Figure 9 : Countries participating in the sausage imports of Switzerland, Austria, Slovenia, Slovakia, & Romania
United States of America192.672
China123.392
Denmark6.877
Thailand41.665
New Zeland4.393
Chile3.138
2.021
1.858
1.611
1.5031.456
2.303Italy
6.569Brazil6.050
Source : ITC Trade Map based on UN Comtrade statistics
MEDIUM TO LONG TERM ( 3+ YEARS )
The outlook for exports in the medium-to-long term ( 3+ years ) is expected to focus on expansion of export re-lationships in hitherto unexplored markets ( market de-velopment ), or focus on the more ambitious aspects of new product development in altogether new markets ( full diversification ).
In the longer term, it is expected that the evolving capaci-ties of Palestinian exporters – across multiple dimensions including quality management, supply capacities, and marketing / branding – in conjunction with the improving business environment and export value chain improve-ments effected by the NES and sector plan of action im-plementations, will allow exporters to target other markets in the medium-long term which seem hard to penetrate at the moment.
Figure 7 plots the import values against the import growth rates of 18 high-potential markets outside the top tier of 11 countries with over US $ 100 million listed in table 4. These markets have the following strengths :
� 2007-2011 annual average value growth exceeding 10 %;
� 2012 import value exceeding US $ 10 million; � Positive market growth in 2007, 2010 and 2011 ( i.e.
all non-global recession years since 2007 for which complete data is available ).
Ten of the 18 attractive markets mentioned in figure 7 form a contiguous block in central and south-eastern Europe, seven of which are European Union members ( see figure 8 ). Although the populations of these coun-tries are diverse, their relatively similar consumer markets and geographic proximity may provide Palestinian meat processors with a cluster of consumers, distributors, lo-gistical networks, and other service providers that allow them to cost-effectively promote their products simulta-neously in several countries within the region. Together these 10 countries represent 11 % of world imports, as well as an exciting and sustained average annual growth rate of 34 % ( 2007-2011 ). 31
Giving equal weight to market size, growth rate, and unit prices, the countries in this region can be scored and ranked by attractiveness. Doing so produces the list of five target markets in table 15.
Switzerland and Austria have very high unit prices but they are well established markets with discerning con-sumers. Palestinian sausages would likely have to find a niche market based on innovative product characteristics or, perhaps, fair trade marketing. Slovenia’s market may offer Palestinian exporters the best balance of character-istics : a unit price well over that of the average Palestinian
31. ITC calculations based on UN Comtrade statistics
35WHERE WE WANT TO GO
export, US $ 3,963 per tonne, 32 and high sustained growth in a market the size of Saudi Arabia. Slovakia and Romania offer the most attractive combination of market size and growth rate, but their average unit prices might be difficult for Palestinian exporters to meet. Slovakia is within 5 % of the estimated Palestinian unit price, but the average price in the booming Romanian market is almost 20 % less. To participate widely in these relatively low-income markets Palestinian producers would have to look to cost-effective mass market products, such as turkey luncheon meat, rather than higher-end gourmet goods, which appears to have been the approach in the UAE.
STRUCTURAL IMPROVEMENTS TO THE VALUE CHAIN
The foregoing analysis leads to several recommendations for value chain improvements that would :
� Improve general efficiency and competitiveness; � Reduce leakage through vertical integration; � Add value through new products and services; � Contribute to the larger development goals of employ-
ment, gender equality, and environmental sustainability. The recommendations are as follows.
ESTABLISH A PALESTINIAN INSTITUTION THAT IS ACCREDITED IN TARGET MARKETS AS A THIRD-PARTY CERTIFYING BODY FOR FOOD SAFETY AND QUALITY
This institution may be PSI or another, even private, organi-zation. It may participate in a global certifying system such as the International Accreditation Forum, a regional certify-ing system like the Euro-Retailer Produce Working Group on Good Agricultural Practices, or even company-specific certification programmes in the cases of some major re-tailers. Establishing this resource and getting industry-wide compliance would cut costs, quality-degrading time to market, and procedures, while contributing greatly to the formation of an international image of Palestinian pro-cessed meat as being safe and of high quality.
STRENGTHEN DOMESTIC SUPPLY OF RAW MEAT AND CREATE A NEW DOMESTIC SUPPLY OF PACKAGING AND LABELLING
Together these two inputs represent between half and two-thirds of the cost of exported sausages, and build-ing strong domestic supply would have a transforma-tive effect on the global competitiveness of Palestinian
32. As official export unit price data is not available, a five-year average ( 2007-2011 ) of United Nations Statistical Division estimates is used to arrive at this figure.
processed meat. Improving domestic supply of meat would also benefit food security, while packaging and labelling supply would have important cross-cutting ben-efits for Palestinian industry. Both of these supply chain links would need to be accompanied by the development of support services such as equipment manufacturing, installation and maintenance.
ESTABLISH REGULAR FLOWS OF DETAILED, HIGH QUALITY MARKET INTELLIGENCE AND TRAINING FROM TSIS TO MEAT PROCESSORS
Rather than attempting to provide some assistance on demand to meat processors looking for intelligence on foreign markets, sector-specific TSIs should take owner-ship of the goals in this strategy and proactively engage firms to encourage their sales abroad and to understand and meet their information needs. TSIs should use this engagement to identify training gaps which they can fill with regularly scheduled and well-publicized trainings.
TARGET TVET PROGRAMMES TO THE NEEDS OF THE SECTOR
Better linkages are needed to dedicated TVET institutions such as PPU for the collaborative tailoring of educational offerings and graduate job placement. Narrower, sector-specific training capacity should also be built at MoA and PFIU. For Palestinian meat processors to expand beyond the domestic market they will need new or strengthened capacities in the research, development, design, and quality management of products tailored to the require-ments of new markets in Europe, North America, and Asia.
MAKE STRATEGIC INFRASTRUCTURE IMPROVEMENTS
An infrastructure needs assessment and strategic plan-ning process should lead to targeted expansions of water supply, slaughterhouses, packaging, cold transport and cold storage in a way that maximizes uptake of domesti-cally produced raw meat and minimizes export time and spoilage. This process may lead to targeted additions to the existing infrastructure landscape or it may involve consolidation, for example in industrial parks.
INCLUDE AND EMPOWER WOMEN
Women are already deeply involved in the agricultural activities which feed into processing sectors like the one under discussion. However, in agriculture and beyond, fe-male participation drops as skill levels rise. Special initia-tives are needed to enable and encourage equal female participation in training programmes and employment.
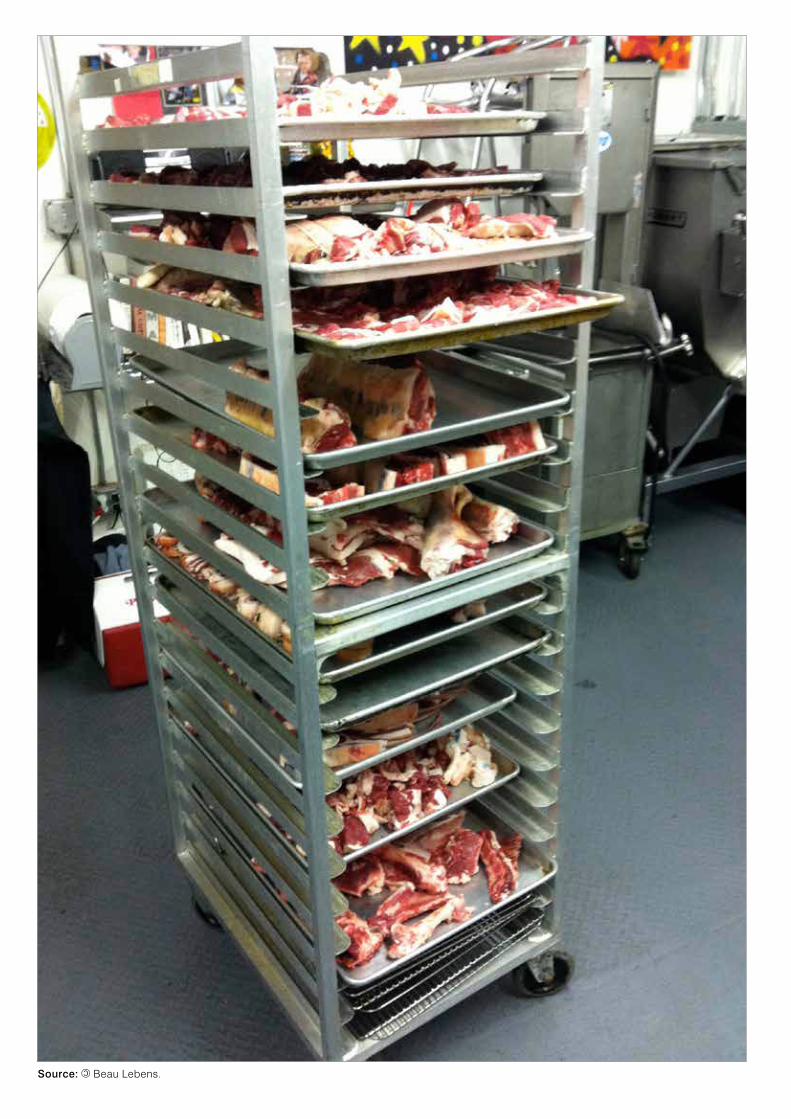
Source: Beau Lebens.

37HOW TO GET THERE
HOW TO GET THERE
STRATEGIC OBJECTIVESThe NES design process was highly inclusive of all ma-jor stakeholders in the processed meat sector. This was critical to understanding the real situation on the ground from every angle, to building consensus on the strategic steps to be taken, and to starting the work of assem-bling a coalition of actors with the interest and ability to jointly implement the strategy in a decisive and effective manner. This section contains a Plan of Action to guide the strategy’s implementation. It is broken into targeted activities or projects, each with its own concrete goals, beneficiaries and responsible parties. Each of the activi-ties contributes in one or more ways to the accomplish-ment of the following strategic objectives :
1. Enhance the sector’s access to trade-related infor-mation and knowledge. This objective will be realized through initiatives implemented along the following dimensions ( or operational objectives ) :
� Enhance the usefulness and quality of trade-related information provided to processed meat companies;
� Improve and ease processed meat sector access to trade information for target markets.
2. Enhance the competitiveness of meat processing companies through effective trade promotion ac-tivities. This objective will be realized through initia-tives implemented along the following dimensions ( or operational objectives ) :
� Increase market penetration in existing markets; � Promote and ease access of Palestinian processed
meat products in new markets.
3. Formulate, adopt and improve local regulations and trade policies in favour of the sector’s growth and development. This objective will be realized through initiatives implemented along the following dimen-sions ( or operational objectives ) :
� Lobby to grant financial institutions incentives for lending to the sector’s companies;
� Develop the sector’s branding strategy; � Lobby for modification, development and enforce-
ment of current and future trade agreements.
4. Enable Palestinian processed meat enterprises to produce high quality products according to inter-national standards. This objective will be realized through initiatives implemented along the following dimensions ( or operational objectives ) :
� Increase research and development activities in the meat processing sector;
� Gather and disseminate relevant information for prod-uct innovation and diversification in target markets;
� Improve access to quality and affordable food grade packaging material;
� Improve the sector’s capacity to provide high qual-ity products;
� Enhance the competitiveness of the sector’s companies by improving the business enabling environment;
� Enhance employee productivity and satisfaction; � Set the foundation for SPS regulation development
and implementation.
The types of activities undertaken will include training; provision of information and assistance; institutional strengthening and funding; and stakeholder outreach. The immediate outputs of these activities should be im-proved performance by : meat processors; PSI or an al-ternative certifying body for food safety and quality; and PFIU and PalTrade as critical TSIs for the sector.
Together, the activities will lead to better product quality, reduced costs and a transformative level of export pre-paredness among the State of Palestine’s meat proces-sors, many of whom will be exporting for the first time. Over several years, their success is expected to lead to a several-fold increase in the output value of the sector, which until now has been largely contained to the State of Palestine but has the potential to join the multi-billion dollar global market for processed meat.

38 THE STATE OF PALESTINE SECTOR EXPORT STRATEGY • AGRO-PROCESSED MEAT
IMPORTANCE OF COORDINATED IMPLEMENTATIONThe first step in rolling out the PoA is matching the ac-tivities to donors, many of whom were heavily consulted during the NES design process. If all activities are fully funded and implemented it is expected that the value of the State of Palestine’s processed meat exports would quadruple by 2020. The largest and most immediate export growth is expected to occur in niche markets – gourmet, organic, fair trade, Palestinian solidarity, etc. However, as the value chain strengthens and quantities and quality become reliably high, Palestinian processed meat should become more competitive in more mass markets. As Palestinian exporters get more experience in a diversity of countries they will be able to start partici-pating in relatively more exotic mass markets, like those of Central and South-eastern Europe, where the most exciting growth is occurring.
The activities needed to realize this vision are broad in scope and their coordinated implementation is a complex matter. An effective coordinator is needed to guide the broad range of stakeholders involved in implementation, ensure the efficient allocation of resources, advocate poli-cies in support of the strategy, and monitor results at both
the micro and macro levels.To this end, the Palestinian Export Council ( PEC ) will be established in order to facili-tate the public–private partnership which will elaborate, coordinate and implement the NES. Moreover, PEC will play a key role in recommending revisions and updates to the strategy so that it continues to evolve in alignment with the State of Palestine’s changing needs.
IMPLEMENTATION PARTNERS – LEADING AND SUPPORTING INSTITUTIONS
A number of institutions will play a key role in the im-plementation of this export strategy for the processed meat sector, as illustrated in the TSI section and the PoA. These are institutions that have the overall responsibility for successful execution of the strategy, as well as sup-port institutions that are active partners but not leading institutions. Each institution mandated to support the ex-port development of the processed meat sector is clearly identified in the plan of action.
Implementing partners include PalTrade, MoNE, PFI, PFIU, PSI and various consulting firms hired through these partners, among others.
Source: Beau Lebens.
PALESTINE
THE STATE OF PALESTINE NATIONAL EXPORT STRATEGY
By Oncenawhile (Own work) [CC-BY-SA-3.0 ( http: //creativecommons.org / licenses / by-sa / 3.0)], via Wikimedia Commons. Modified by: sputnix.es
PLAN OF ACTION
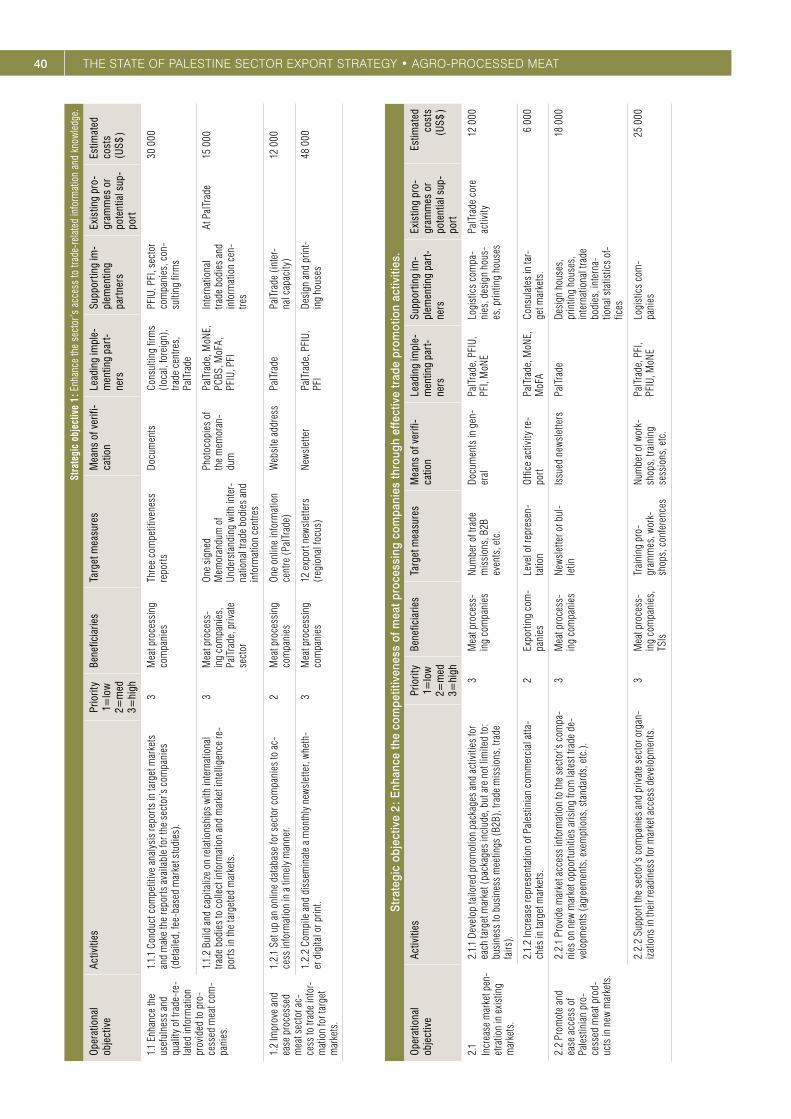
40 THE STATE OF PALESTINE SECTOR EXPORT STRATEGY • AGRO-PROCESSED MEATSt
rate
gic
obje
ctiv
e 1 :
Enh
ance
the
sect
or’s
acc
ess
to tr
ade-
rela
ted
info
rmat
ion
and
know
ledg
e.
Ope
ratio
nal
obje
ctiv
eAc
tiviti
esPr
iorit
y1=
low
2=m
ed3=
high
Bene
ficia
ries
Targ
et m
easu
res
Mea
ns o
f ver
ifi-
catio
nLe
adin
g im
ple-
men
ting
part
-ne
rs
Supp
ortin
g im
-pl
emen
ting
part
ners
Exis
ting
pro-
gram
mes
or
pote
ntia
l sup
-po
rt
Estim
ated
co
sts
( US $
)
1.1
Enha
nce
the
usef
ulne
ss a
nd
qual
ity o
f tra
de-r
e-la
ted
info
rmat
ion
prov
ided
to p
ro-
cess
ed m
eat c
om-
pani
es.
1.1.
1 Co
nduc
t com
petit
ive
anal
ysis
repo
rts in
targ
et m
arke
ts
and
mak
e th
e re
ports
ava
ilabl
e fo
r the
sec
tor’s
com
pani
es
( det
aile
d, fe
e-ba
sed
mar
ket s
tudi
es ).
3M
eat p
roce
ssin
g co
mpa
nies
Thre
e co
mpe
titiv
enes
s re
ports
Docu
men
tsCo
nsul
ting
firm
s ( lo
cal,
fore
ign )
, tra
de c
entre
s,
PalT
rade
PFIU
, PFI
, sec
tor
com
pani
es, c
on-
sulti
ng fi
rms
30 0
00
1.1.
2 Bu
ild a
nd c
apita
lize
on re
latio
nshi
ps w
ith in
tern
atio
nal
trade
bod
ies
to c
olle
ct in
form
atio
n an
d m
arke
t int
ellig
ence
re-
ports
in th
e ta
rget
ed m
arke
ts.
3M
eat p
roce
ss-
ing
com
pani
es,
PalT
rade
, priv
ate
sect
or
One
sign
ed
Mem
oran
dum
of
Unde
rsta
ndin
g wi
th in
ter-
natio
nal t
rade
bod
ies
and
info
rmat
ion
cent
res
Phot
ocop
ies
of
the
mem
oran
-du
m
PalT
rade
, MoN
E,
PCBS
, MoF
A,
PFIU
, PFI
Inte
rnat
iona
l tra
de b
odie
s an
d in
form
atio
n ce
n-tre
s
At P
alTr
ade
15 0
00
1.2
Impr
ove
and
ease
pro
cess
ed
mea
t sec
tor a
c-ce
ss to
trad
e in
for-
mat
ion
for t
arge
t m
arke
ts.
1.2.
1 Se
t up
an o
nlin
e da
taba
se fo
r sec
tor c
ompa
nies
to a
c-ce
ss in
form
atio
n in
a ti
mel
y m
anne
r.2
Mea
t pro
cess
ing
com
pani
esOn
e on
line
info
rmat
ion
cent
re ( P
alTr
ade )
Web
site
add
ress
PalT
rade
PalT
rade
( int
er-
nal c
apac
ity )
12 0
00
1.2.
2 Co
mpi
le a
nd d
isse
min
ate
a m
onth
ly n
ewsl
ette
r, wh
eth-
er d
igita
l or p
rint.
3M
eat p
roce
ssin
g co
mpa
nies
12 e
xpor
t new
slet
ters
( r
egio
nal f
ocus
)Ne
wsle
tter
PalT
rade
, PFI
U,
PFI
Desi
gn a
nd p
rint-
ing
hous
es48
000
Str
ateg
ic o
bjec
tive
2 : E
nhan
ce th
e co
mpe
titiv
enes
s of
mea
t pro
cess
ing
com
pani
es th
roug
h ef
fect
ive
trad
e pr
omot
ion
activ
ities
.
Ope
ratio
nal
obje
ctiv
eAc
tiviti
esPr
iorit
y1=
low
2=m
ed3=
high
Bene
ficia
ries
Targ
et m
easu
res
Mea
ns o
f ver
ifi-
catio
nLe
adin
g im
ple-
men
ting
part
-ne
rs
Supp
ortin
g im
-pl
emen
ting
part
-ne
rs
Exis
ting
pro-
gram
mes
or
pote
ntia
l sup
-po
rt
Estim
ated
co
sts
( US $
)
2.1
Incr
ease
mar
ket p
en-
etra
tion
in e
xist
ing
mar
kets
.
2.1.
1 De
velo
p ta
ilore
d pr
omot
ion
pack
ages
and
act
iviti
es fo
r ea
ch ta
rget
mar
ket (
pack
ages
incl
ude,
but
are
not
lim
ited
to :
busi
ness
to b
usin
ess
mee
tings
( B2B
), tra
de m
issi
ons,
trad
e fa
irs ).
3M
eat p
roce
ss-
ing
com
pani
esNu
mbe
r of t
rade
m
issi
ons,
B2B
ev
ents
, etc
.
Docu
men
ts in
gen
-er
alPa
lTra
de, P
FIU,
PF
I, M
oNE
Logi
stic
s co
mpa
-ni
es, d
esig
n ho
us-
es, p
rintin
g ho
uses
PalT
rade
cor
e ac
tivity
12 0
00
2.1.
2 In
crea
se re
pres
enta
tion
of P
ales
tinia
n co
mm
erci
al a
tta-
chés
in ta
rget
mar
kets
.2
Expo
rting
com
-pa
nies
Leve
l of r
epre
sen-
tatio
nOf
fice
activ
ity re
-po
rtPa
lTra
de, M
oNE,
M
oFA
Cons
ulat
es in
tar-
get m
arke
ts.
6 00
0
2.2
Prom
ote
and
ease
acc
ess
of
Pale
stin
ian
pro-
cess
ed m
eat p
rod-
ucts
in n
ew m
arke
ts.
2.2.
1 Pr
ovid
e m
arke
t acc
ess
info
rmat
ion
to th
e se
ctor
’s c
ompa
-ni
es o
n ne
w m
arke
t opp
ortu
nitie
s ar
isin
g fro
m la
test
trad
e de
-ve
lopm
ents
( agr
eem
ents
, exe
mpt
ions
, sta
ndar
ds, e
tc. ).
3M
eat p
roce
ss-
ing
com
pani
esNe
wsle
tter o
r bul
-le
tinIs
sued
new
slet
ters
PalT
rade
Desi
gn h
ouse
s,
prin
ting
hous
es,
inte
rnat
iona
l tra
de
bodi
es, i
nter
na-
tiona
l sta
tistic
s of
-fic
es
18 0
00
2.2.
2 Su
ppor
t the
sec
tor’s
com
pani
es a
nd p
rivat
e se
ctor
org
an-
izat
ions
in th
eir r
eadi
ness
for m
arke
t acc
ess
deve
lopm
ents
.3
Mea
t pro
cess
-in
g co
mpa
nies
, TS
Is
Trai
ning
pro
-gr
amm
es, w
ork-
shop
s, c
onfe
renc
es
Num
ber o
f wor
k-sh
ops,
trai
ning
se
ssio
ns, e
tc.
PalT
rade
, PFI
, PF
IU, M
oNE
Logi
stic
s co
m-
pani
es25
000

41PLAN OF ACTIONSt
rate
gic
obje
ctiv
e 3 :
For
mul
ate,
ado
pt a
nd im
prov
e lo
cal r
egul
atio
ns a
nd tr
ade
polic
ies
in fa
vour
of t
he s
ecto
r’s g
row
th a
nd d
evel
opm
ent.
Ope
ratio
nal
obje
ctiv
eAc
tiviti
esPr
iorit
y1=
low
2=m
ed3=
high
Bene
ficia
ries
Targ
et m
easu
res
Mea
ns o
f ve
rific
atio
nLe
adin
g im
plem
entin
g pa
rtne
rs
Supp
ortin
g im
plem
entin
g pa
rtne
rs
Exis
ting
prog
ram
mes
or
pot
entia
l su
ppor
t
Estim
ated
co
sts
( US $
)
3.1
Lobb
y to
gr
ant f
inan
cial
in
stitu
tions
in
cent
ives
fo
r len
ding
to
the
sect
or’s
co
mpa
nies
.
3.1.
1 Es
tabl
ish
agric
ultu
ral f
inan
cing
and
fund
ing
prog
ram
mes
fo
r the
pro
cess
ed m
eat s
ecto
r.3
Mea
t pro
cess
ing
indu
stry
, agr
icul
tura
l se
ctor
One
fund
ing
pro-
gram
me
Loan
app
lica-
tions
MoF
, Pal
estin
e M
onet
ary
Auth
ority
, do
nors
, inv
esto
rs
Priv
ate
sect
or o
r-ga
niza
tions
Mid
dle
East
In
itiat
ive
500
000
3.1.
2 Es
tabl
ish
an a
gric
ultu
ral i
nsur
ance
and
gua
rant
ee fu
nd.
3M
eat p
roce
ssin
g in
dust
ry, a
gric
ultu
ral
sect
or
Agric
ultu
ral i
nsur
-an
ce p
rogr
amm
esAg
ricul
tura
l in-
sura
nce
polic
ies
MoF
, Pal
estin
e M
onet
ary
Auth
ority
, do
nors
, inv
esto
rs,
Pale
stin
e Ca
pita
l M
arke
t Aut
horit
y
Priv
ate
sect
or o
r-ga
niza
tions
500
000
3.2
Deve
lop
the
sect
ors’
bra
ndin
g st
rate
gy.
3.2.
1 Fo
rmul
ate
a st
rate
gy d
evel
opm
ent t
eam
that
incl
udes
al
l act
ive
stak
ehol
ders
( priv
ate
and
publ
ic ) i
n th
e pr
oces
sed
mea
t sec
tor.
3Pr
oces
sed
mea
t sec
tor
Stra
tegy
dev
elop
-m
ent t
eam
Mee
ting
min
utes
Priv
ate
and
publ
ic
sect
orPr
ivat
e an
d pu
blic
se
ctor
inst
itutio
ns5
000
3.2.
2 Co
nduc
t a b
asel
ine
stud
y on
the
curre
nt b
rand
ing
initi
-at
ives
in th
e se
ctor
, and
ana
lyse
bra
ndin
g st
rate
gies
in c
om-
petin
g m
arke
ts.
3Pr
oces
sed
mea
t sec
tor
Base
line
stud
y co
nduc
ted
Base
line
stud
y do
cum
ent
Cons
ultin
g fir
ms
( loca
l, fo
reig
n ),
trade
cen
tres,
Pa
lTra
de
Cons
ultin
g fir
ms
15 0
00
3.2.
3 Co
ntra
ct a
n ex
tern
al c
onsu
ltant
for t
he s
trate
gy d
evel
op-
men
t ass
ignm
ent.
3Pr
oces
sed
mea
t sec
tor
Cont
ract
or s
elec
-tio
n pa
nel
Cont
ract
Cons
ultin
g fir
ms
Cons
ultin
g fir
ms
25 0
00
3.2.
4 Pr
esen
t the
bra
ndin
g st
rate
gy to
all
stak
ehol
ders
.3
Proc
esse
d m
eat s
ecto
rSt
udy
and
stra
tegy
do
cum
ents
Bran
ding
stra
te-
gy p
rese
ntat
ion
work
shop
Priv
ate
and
publ
ic
sect
orLo
gist
ics
com
-pa
nies
5 00
0
3.3
Lobb
y fo
r m
odifi
catio
n,
deve
lopm
ent a
nd
enfo
rcem
ent o
f cu
rrent
and
futu
re
trade
agr
eem
ents
.
3.3.
1 Fa
cilit
ate
trade
mis
sion
s fro
m A
rab
coun
tries
to p
rom
ote
the
sect
or’s
com
pani
es, a
nd p
rovi
de fi
rst-
hand
exp
erie
nce
for
thes
e m
issi
ons
of th
e hi
gh s
tand
ards
and
qua
lity
of th
e se
c-to
rs’ p
rodu
cts.
3Pr
oces
sed
mea
t sec
tor
Num
ber o
f tra
de
mis
sion
s wh
ich
visi
ted
loca
l pla
nts
Trad
e m
issi
on
repo
rtPa
lTra
de, P
FIU,
PF
I, M
oFA
MoN
E12
000
3.3.
2 St
udy
the
curre
nt d
efic
ienc
ies
in th
e Pa
ris P
roto
col a
nd
prep
are
a wh
ite p
aper
on
the
amen
dmen
ts n
eede
d in
favo
ur o
f th
e Pa
lest
inia
n ec
onom
y.
3Pa
lest
inia
n ec
onom
y in
gen
eral
Whi
te p
aper
dev
el-
opm
ent
Whi
te p
aper
pr
esen
tatio
nPa
lTra
de, u
nive
rsi-
ties,
MoN
EPr
ivat
e se
ctor
inst
i-tu
tions
6 00
0
3.3.
3 Pr
ovid
e a
plat
form
for a
ctiv
e pa
rtici
patio
n of
the
priv
ate
sect
or in
neg
otia
tions
of f
utur
e tra
de a
gree
men
ts.
3Pr
ivat
e se
ctor
ex
porti
ng c
ompa
nies
Impr
oved
and
tai-
lore
d tra
de a
gree
-m
ents
Pane
l ( co
mm
it-te
e ) fo
rmul
atio
nM
oNE,
MoF
A, p
ri-va
te s
ecto
r org
ani-
zatio
ns
Priv
ate
Sect
or
Coor
dina
tion
Coun
cil
9 00
0
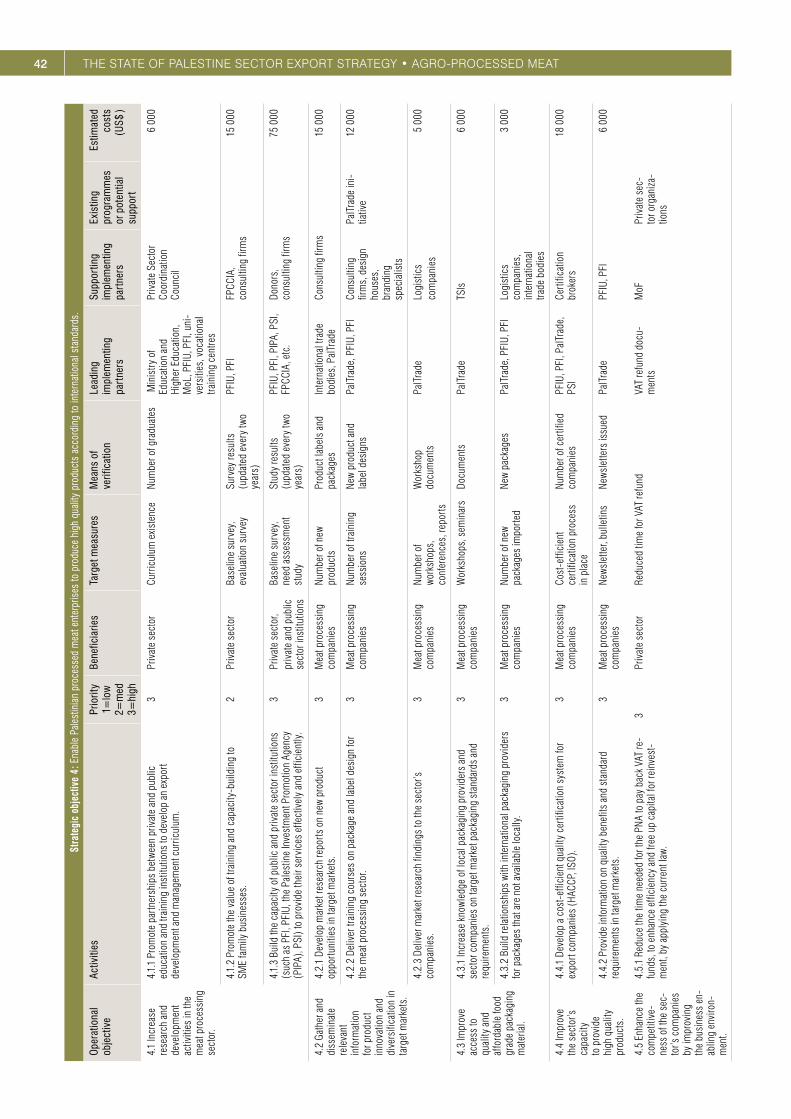
42 THE STATE OF PALESTINE SECTOR EXPORT STRATEGY • AGRO-PROCESSED MEATSt
rate
gic
obje
ctiv
e 4 :
Ena
ble
Pale
stin
ian
proc
esse
d m
eat e
nter
pris
es to
pro
duce
hig
h qu
ality
pro
duct
s ac
cord
ing
to in
tern
atio
nal s
tand
ards
.
Ope
ratio
nal
obje
ctiv
eAc
tiviti
esPr
iorit
y1=
low
2=m
ed3=
high
Bene
ficia
ries
Targ
et m
easu
res
Mea
ns o
f ve
rific
atio
nLe
adin
g im
plem
entin
g pa
rtne
rs
Supp
ortin
g im
plem
entin
g pa
rtne
rs
Exis
ting
prog
ram
mes
or
pot
entia
l su
ppor
t
Estim
ated
co
sts
( US $
)
4.1
Incr
ease
re
sear
ch a
nd
deve
lopm
ent
activ
ities
in th
e m
eat p
roce
ssin
g se
ctor
.
4.1.
1 Pr
omot
e pa
rtner
ship
s be
twee
n pr
ivat
e an
d pu
blic
ed
ucat
ion
and
train
ing
inst
itutio
ns to
dev
elop
an
expo
rt de
velo
pmen
t and
man
agem
ent c
urric
ulum
.
3Pr
ivat
e se
ctor
Curri
culu
m e
xist
ence
Num
ber o
f gra
duat
es M
inis
try o
f Ed
ucat
ion
and
High
er E
duca
tion,
M
oL, P
FIU,
PFI
, uni
-ve
rsiti
es, v
ocat
iona
l tra
inin
g ce
ntre
s
Priv
ate
Sect
or
Coor
dina
tion
Coun
cil
6 00
0
4.1.
2 Pr
omot
e th
e va
lue
of tr
aini
ng a
nd c
apac
ity-b
uild
ing
to
SME
fam
ily b
usin
esse
s.2
Priv
ate
sect
orBa
selin
e su
rvey
, ev
alua
tion
surv
eySu
rvey
resu
lts
( upd
ated
eve
ry tw
o ye
ars )
PFIU
, PFI
FPCC
IA,
cons
ultin
g fir
ms
15 0
00
4.1.
3 Bu
ild th
e ca
paci
ty o
f pub
lic a
nd p
rivat
e se
ctor
inst
itutio
ns
( suc
h as
PFI
, PFI
U, th
e Pa
lest
ine
Inve
stm
ent P
rom
otio
n Ag
ency
( P
IPA )
, PSI
) to
prov
ide
thei
r ser
vice
s ef
fect
ivel
y an
d ef
ficie
ntly
.
3Pr
ivat
e se
ctor
,pr
ivat
e an
d pu
blic
se
ctor
inst
itutio
ns
Base
line
surv
ey,
need
ass
essm
ent
stud
y
Stud
y re
sults
( u
pdat
ed e
very
two
year
s )
PFIU
, PFI
, PIP
A, P
SI,
FPCC
IA, e
tc.
Dono
rs,
cons
ultin
g fir
ms
75 0
00
4.2
Gath
er a
nd
diss
emin
ate
rele
vant
in
form
atio
n fo
r pro
duct
in
nova
tion
and
dive
rsifi
catio
n in
ta
rget
mar
kets
.
4.2.
1 De
velo
p m
arke
t res
earc
h re
ports
on
new
prod
uct
oppo
rtuni
ties
in ta
rget
mar
kets
.3
Mea
t pro
cess
ing
com
pani
esNu
mbe
r of n
ew
prod
ucts
Prod
uct l
abel
s an
d pa
ckag
esIn
tern
atio
nal t
rade
bo
dies
, Pal
Trad
eCo
nsul
ting
firm
s15
000
4.2.
2 De
liver
trai
ning
cou
rses
on
pack
age
and
labe
l des
ign
for
the
mea
t pro
cess
ing
sect
or.
3M
eat p
roce
ssin
g co
mpa
nies
Num
ber o
f tra
inin
g se
ssio
nsNe
w pr
oduc
t and
la
bel d
esig
nsPa
lTra
de, P
FIU,
PFI
Cons
ultin
g fir
ms,
des
ign
hous
es,
bran
ding
sp
ecia
lists
PalT
rade
ini-
tiativ
e12
000
4.2.
3 De
liver
mar
ket r
esea
rch
findi
ngs
to th
e se
ctor
’s
com
pani
es.
3M
eat p
roce
ssin
g co
mpa
nies
Num
ber o
f wo
rksh
ops,
co
nfer
ence
s, re
ports
Wor
ksho
p do
cum
ents
PalT
rade
Logi
stic
sco
mpa
nies
5 00
0
4.3
Impr
ove
acce
ss to
qu
ality
and
af
ford
able
food
gr
ade
pack
agin
g m
ater
ial.
4.3.
1 In
crea
se k
nowl
edge
of l
ocal
pac
kagi
ng p
rovi
ders
and
se
ctor
com
pani
es o
n ta
rget
mar
ket p
acka
ging
sta
ndar
ds a
nd
requ
irem
ents
.
3M
eat p
roce
ssin
g co
mpa
nies
Wor
ksho
ps, s
emin
ars
Docu
men
tsPa
lTra
deTS
Is6
000
4.3.
2 Bu
ild re
latio
nshi
ps w
ith in
tern
atio
nal p
acka
ging
pro
vide
rs
for p
acka
ges
that
are
not
ava
ilabl
e lo
cally
.3
Mea
t pro
cess
ing
com
pani
esNu
mbe
r of n
ew
pack
ages
impo
rted
New
pack
ages
PalT
rade
, PFI
U, P
FILo
gist
ics
com
pani
es,
inte
rnat
iona
l tra
de b
odie
s
3 00
0
4.4
Impr
ove
the
sect
or’s
ca
paci
ty
to p
rovi
de
high
qua
lity
prod
ucts
.
4.4.
1 De
velo
p a
cost
-effi
cien
t qua
lity
certi
ficat
ion
syst
em fo
r ex
port
com
pani
es ( H
ACCP
, ISO
).3
Mea
t pro
cess
ing
com
pani
esCo
st-e
ffici
ent
certi
ficat
ion
proc
ess
in p
lace
Num
ber o
f cer
tifie
d co
mpa
nies
PFIU
, PFI
, Pal
Trad
e,
PSI
Certi
ficat
ion
brok
ers
18 0
00
4.4.
2 Pr
ovid
e in
form
atio
n on
qua
lity
bene
fits
and
stan
dard
re
quire
men
ts in
targ
et m
arke
ts.
3M
eat p
roce
ssin
g co
mpa
nies
News
lette
r, bu
lletin
sNe
wsle
tters
issu
edPa
lTra
dePF
IU, P
FI6
000
4.5
Enha
nce
the
com
petit
ive-
ness
of t
he s
ec-
tor’s
com
pani
es
by im
prov
ing
the
busi
ness
en-
ablin
g en
viro
n-m
ent.
4.5.
1 Re
duce
the
time
need
ed fo
r the
PNA
to p
ay b
ack
VAT
re-
fund
s, to
enh
ance
effi
cien
cy a
nd fr
ee u
p ca
pita
l for
rein
vest
-m
ent,
by a
pply
ing
the
curre
nt la
w.
3Pr
ivat
e se
ctor
Redu
ced
time
for V
AT re
fund
VAT
refu
nd d
ocu-
men
tsM
oFPr
ivat
e se
c-to
r org
aniz
a-tio
ns
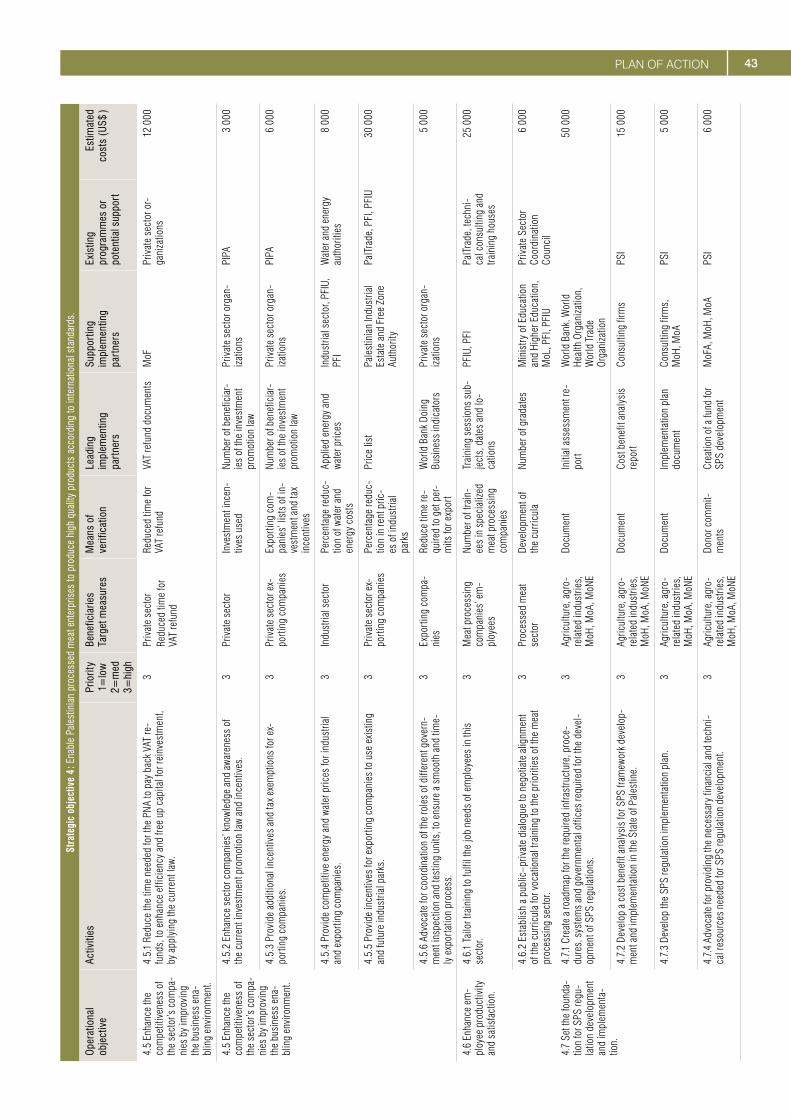
43PLAN OF ACTIONSt
rate
gic
obje
ctiv
e 4 :
Ena
ble
Pale
stin
ian
proc
esse
d m
eat e
nter
pris
es to
pro
duce
hig
h qu
ality
pro
duct
s ac
cord
ing
to in
tern
atio
nal s
tand
ards
.
Ope
ratio
nal
obje
ctiv
eAc
tiviti
esPr
iorit
y1=
low
2=m
ed3=
high
Bene
ficia
ries
Targ
et m
easu
res
Mea
ns o
f ve
rific
atio
nLe
adin
g im
plem
entin
g pa
rtne
rs
Supp
ortin
g im
plem
entin
g pa
rtne
rs
Exis
ting
prog
ram
mes
or
pote
ntia
l sup
port
Estim
ated
co
sts
( US $
)
4.5
Enha
nce
the
com
petit
iven
ess
of
the
sect
or’s
com
pa-
nies
by
impr
ovin
g th
e bu
sine
ss e
na-
blin
g en
viro
nmen
t.
4.5.
1 Re
duce
the
time
need
ed fo
r the
PNA
to p
ay b
ack
VAT
re-
fund
s, to
enh
ance
effi
cien
cy a
nd fr
ee u
p ca
pita
l for
rein
vest
men
t, by
app
lyin
g th
e cu
rrent
law.
3Pr
ivat
e se
ctor
Redu
ced
time
for
VAT
refu
nd
Redu
ced
time
for
VAT
refu
ndVA
T re
fund
doc
umen
tsM
oFPr
ivat
e se
ctor
or-
gani
zatio
ns12
000
4.5
Enha
nce
the
com
petit
iven
ess
of
the
sect
or’s
com
pa-
nies
by
impr
ovin
g th
e bu
sine
ss e
na-
blin
g en
viro
nmen
t.
4.5.
2 En
hanc
e se
ctor
com
pani
es’ k
nowl
edge
and
awa
rene
ss o
f th
e cu
rrent
inve
stm
ent p
rom
otio
n la
w an
d in
cent
ives
.3
Priv
ate
sect
orIn
vest
men
t inc
en-
tives
use
dNu
mbe
r of b
enef
icia
r-ie
s of
the
inve
stm
ent
prom
otio
n la
w
Priv
ate
sect
or o
rgan
-iz
atio
nsPI
PA3
000
4.5.
3 Pr
ovid
e ad
ditio
nal i
ncen
tives
and
tax e
xem
ptio
ns fo
r ex-
porti
ng c
ompa
nies
.3
Priv
ate
sect
or e
x-po
rting
com
pani
esEx
porti
ng c
om-
pani
es’ l
ists
of i
n-ve
stm
ent a
nd ta
x in
cent
ives
Num
ber o
f ben
efic
iar-
ies
of th
e in
vest
men
t pr
omot
ion
law
Priv
ate
sect
or o
rgan
-iz
atio
nsPI
PA6
000
4.5.
4 Pr
ovid
e co
mpe
titiv
e en
ergy
and
wat
er p
rices
for i
ndus
trial
an
d ex
porti
ng c
ompa
nies
.3
Indu
stria
l sec
tor
Perc
enta
ge re
duc-
tion
of w
ater
and
en
ergy
cos
ts
Appl
ied
ener
gy a
nd
wate
r pric
esIn
dust
rial s
ecto
r, PF
IU,
PFI
Wat
er a
nd e
nerg
y au
thor
ities
8 00
0
4.5.
5 Pr
ovid
e in
cent
ives
for e
xpor
ting
com
pani
es to
use
exi
stin
g an
d fu
ture
indu
stria
l par
ks.
3Pr
ivat
e se
ctor
ex-
porti
ng c
ompa
nies
Perc
enta
ge re
duc-
tion
in re
nt p
ric-
es o
f ind
ustri
al
park
s
Pric
e lis
tPa
lest
inia
n In
dust
rial
Esta
te a
nd F
ree
Zone
Au
thor
ity
PalT
rade
, PFI
, PFI
U30
000
4.5.
6 Ad
voca
te fo
r coo
rdin
atio
n of
the
role
s of
diff
eren
t gov
ern-
men
t ins
pect
ion
and
test
ing
units
, to
ensu
re a
sm
ooth
and
tim
e-ly
exp
orta
tion
proc
ess.
3Ex
porti
ng c
ompa
-ni
esRe
duce
tim
e re
-qu
ired
to g
et p
er-
mits
for e
xpor
t
Wor
ld B
ank
Doin
g Bu
sine
ss in
dica
tors
Priv
ate
sect
or o
rgan
-iz
atio
ns5
000
4.6
Enha
nce
em-
ploy
ee p
rodu
ctiv
ity
and
satis
fact
ion.
4.6.
1 Ta
ilor t
rain
ing
to fu
lfil t
he jo
b ne
eds
of e
mpl
oyee
s in
this
se
ctor
.3
Mea
t pro
cess
ing
com
pani
es’ e
m-
ploy
ees
Num
ber o
f tra
in-
ees
in s
peci
alize
d m
eat p
roce
ssin
g co
mpa
nies
Trai
ning
ses
sion
s su
b-je
cts,
dat
es a
nd lo
-ca
tions
PFIU
, PFI
PalT
rade
, tec
hni-
cal c
onsu
lting
and
tra
inin
g ho
uses
25 0
00
4.6.
2 Es
tabl
ish
a pu
blic
–priv
ate
dial
ogue
to n
egot
iate
alig
nmen
t of
the
curri
cula
for v
ocat
iona
l tra
inin
g to
the
prio
ritie
s of
the
mea
t pr
oces
sing
sec
tor.
3Pr
oces
sed
mea
t se
ctor
Deve
lopm
ent o
f th
e cu
rricu
laNu
mbe
r of g
rada
tes
Min
istry
of E
duca
tion
and
High
er E
duca
tion,
M
oL, P
FI, P
FIU
Priv
ate
Sect
or
Coor
dina
tion
Coun
cil
6 00
0
4.7
Set t
he fo
unda
-tio
n fo
r SPS
regu
-la
tion
deve
lopm
ent
and
impl
emen
ta-
tion.
4.7.1
Cre
ate
a ro
adm
ap fo
r the
requ
ired
infra
stru
ctur
e, p
roce
-du
res,
sys
tem
s an
d go
vern
men
tal o
ffice
s re
quire
d fo
r the
dev
el-
opm
ent o
f SPS
regu
latio
ns.
3Ag
ricul
ture
, agr
o-re
late
d in
dust
ries,
M
oH, M
oA, M
oNE
Docu
men
tIn
itial
ass
essm
ent r
e-po
rtW
orld
Ban
k, W
orld
He
alth
Org
aniz
atio
n,
Wor
ld T
rade
Or
gani
zatio
n
50 0
00
4.7.
2 De
velo
p a
cost
ben
efit
anal
ysis
for S
PS fr
amew
ork
deve
lop-
men
t and
impl
emen
tatio
n in
the
Stat
e of
Pal
estin
e.3
Agric
ultu
re, a
gro-
rela
ted
indu
strie
s,
MoH
, MoA
, MoN
E
Docu
men
tCo
st b
enef
it an
alys
is
repo
rtCo
nsul
ting
firm
sPS
I15
000
4.7.
3 De
velo
p th
e SP
S re
gula
tion
impl
emen
tatio
n pl
an.
3Ag
ricul
ture
, agr
o-re
late
d in
dust
ries,
M
oH, M
oA, M
oNE
Docu
men
tIm
plem
enta
tion
plan
do
cum
ent
Cons
ultin
g fir
ms,
M
oH, M
oAPS
I5
000
4.7.
4 Ad
voca
te fo
r pro
vidi
ng th
e ne
cess
ary
finan
cial
and
tech
ni-
cal r
esou
rces
nee
ded
for S
PS re
gula
tion
deve
lopm
ent.
3Ag
ricul
ture
, agr
o-re
late
d in
dust
ries,
M
oH, M
oA, M
oNE
Dono
r com
mit-
men
tsCr
eatio
n of
a fu
nd fo
r SP
S de
velo
pmen
tM
oFA,
MoH
, MoA
PSI
6 00
0
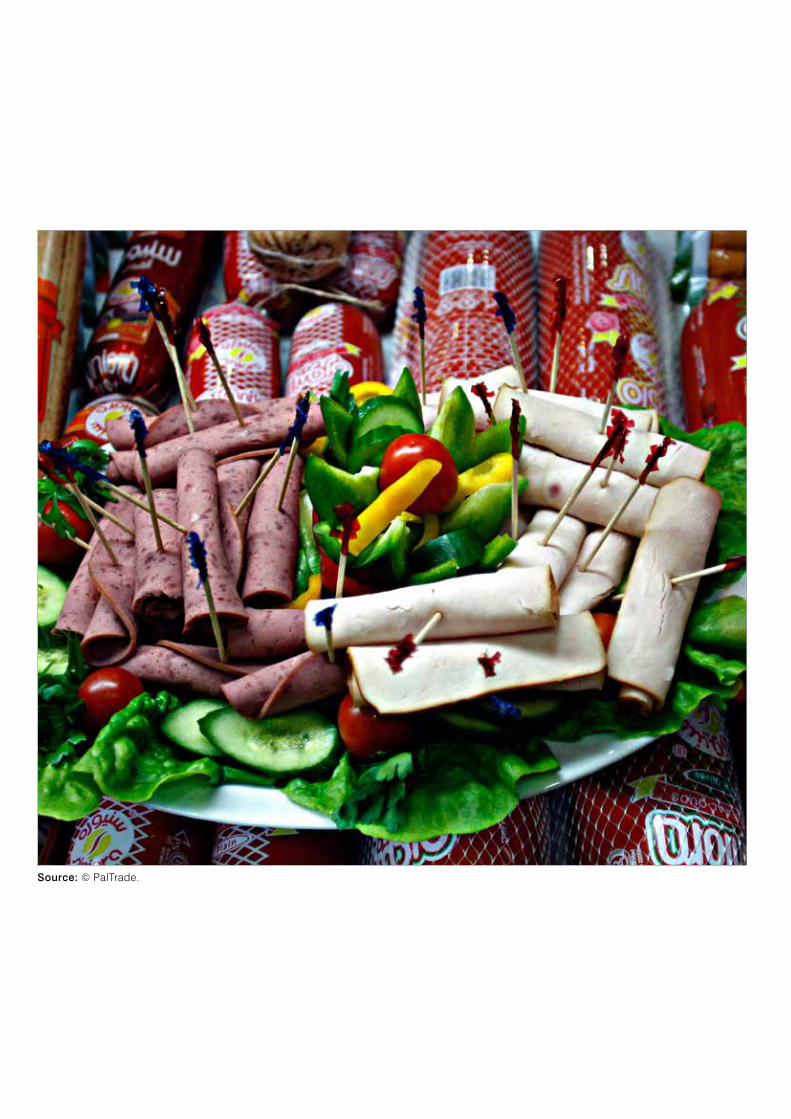
Source: © PalTrade.
45BIBLIOGRAPHY
BIBLIOGRAPHY
Akra, F. I. ( June 2007 ). Best Foods from Palestine. Avail-able from : http : / / www.thisweekinpalestine.com / de-tails.php?id=2156&ed=142&edid=142
Akra, Fuad Issa, Executive Director of Palestinian Food In-dustries Union ( 2013 ). Interview by A. Deeb. May 2013.
Akra, F. I. ( May 2010 ). The Palestinian Food-Processing Sector : Its Impact on Agricultural Development. Avail-able from : http : / / www.thisweekinpalestine.com / de-tails.php?id=3111&ed=182&edid=182
Food and Agriculture Organization of the United Nations and World Food Programme ( December 2009 ). Oc-cupied Palestinian Territory : Food Security and Vulner-ability Analysis Report.
International Trade Centre ( 2010 ). Trade Map. Available from : www.trademap.org. Accessed 27 May 2013.
Massar Associates ( 2002 ). Sector Report : Food and Bev-erage Manufacturing in West Bank / Gaza. Arlington, Vir-ginia : The Services Group.
Oxfam ( 2010 ). The road to olive farming : Challenges to developing the economy of olive oil in the West Bank.
Pain, N., Koske, I. and Sollie, M. ( 2008 ). Globalisation and OECD Consumer Price Inflation. OECD Economic Studies, No. 44. OECD.
Palestinian Ministry of Agriculture ( 2010 ). Agriculture Sec-tor Strategy : “A Shared Vision,” 2011-2013.
Salwa Food Company ( 2013 ). About Us. Available from : http : / / www.salwa.ps / en / about-us.html
United Nations Statistics Division ( 2013 ). State of Pal-estine. Available from : HYPERLINK “http : / / data.un.org / CountryProfile.aspx?crName=State %20of %20Palestine” http : / / data.un.org / CountryProfile.aspx?crName=State %20of %20Palestine . Accessed 13 June 2013.
United States Agency for International Development and Palestinian Federation of Industries ( 2009 ). The Cur-rent Status of Industrial Sector in Palestine.
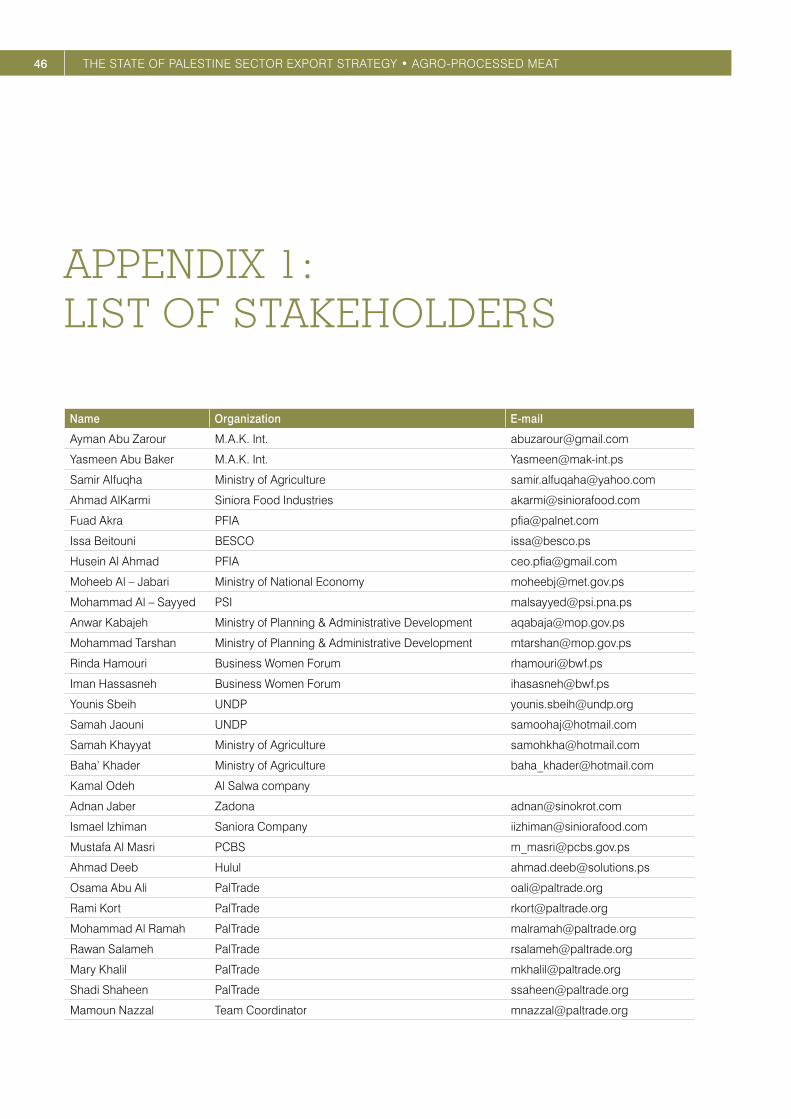
46 THE STATE OF PALESTINE SECTOR EXPORT STRATEGY • AGRO-PROCESSED MEAT
APPENDIX 1 : LIST OF STAKEHOLDERS
Name Organization E-mail
Ayman Abu Zarour M.A.K. Int. [email protected]
Yasmeen Abu Baker M.A.K. Int. [email protected]
Samir Alfuqha Ministry of Agriculture [email protected]
Ahmad AlKarmi Siniora Food Industries [email protected]
Fuad Akra PFIA [email protected]
Issa Beitouni BESCO [email protected]
Husein Al Ahmad PFIA [email protected]
Moheeb Al – Jabari Ministry of National Economy [email protected]
Mohammad Al – Sayyed PSI [email protected]
Anwar Kabajeh Ministry of Planning & Administrative Development [email protected]
Mohammad Tarshan Ministry of Planning & Administrative Development [email protected]
Rinda Hamouri Business Women Forum [email protected]
Iman Hassasneh Business Women Forum [email protected]
Younis Sbeih UNDP [email protected]
Samah Jaouni UNDP [email protected]
Samah Khayyat Ministry of Agriculture [email protected]
Baha’ Khader Ministry of Agriculture [email protected]
Kamal Odeh Al Salwa company
Adnan Jaber Zadona [email protected]
Ismael Izhiman Saniora Company [email protected]
Mustafa Al Masri PCBS [email protected]
Ahmad Deeb Hulul [email protected]
Osama Abu Ali PalTrade [email protected]
Rami Kort PalTrade [email protected]
Mohammad Al Ramah PalTrade [email protected]
Rawan Salameh PalTrade [email protected]
Mary Khalil PalTrade [email protected]
Shadi Shaheen PalTrade [email protected]
Mamoun Nazzal Team Coordinator [email protected]

47APPENDIX 2 : DIRECTORY OF PALESTINIAN MEAT PROCESSING COMPANIES
APPENDIX 2 : DIRECTORY OF PALESTINIAN MEAT PROCESSING COMPANIES
Company Contact Fax Phone
Al Sanabel for Food Products Bilal Ismail Rajabi, 09-2311476 09-2311476
Al-Sunbola Islamic Foundation for Meat Products Salah Maarouf 09-2379342 09-2379342
Islamic Foundation for Food Products Waleed Mohammed Khatib 09-2674139 09-2681115 / 6
Manar Meat Factory Masoud Othman 04-6383451 04-6383798
Salwa Company for Food Products Taher Aldoaat 02-2987174 02-2951569
Ghosheh Company for Food Industries. Majid Ghosha 02-2322320 02-2321919
Al-Aqsa Mortadella Factory Rajab Abu Arab 08-2840234 08-2820846
Siniora Food Industries. Majdi Al-Sharif 02-2799088 02-2796804
Saeed Jameel Al-Danaf & Sons Said Jamil Danaf 08-2823351 08-2822198
Meat Land Company Maher Ramadan 02-2345659 02-2340006
Palestinian National Factory for Meat Omar Abu Oud 02-2269380 02-2268491
Al-Madaen Foodstuffs Haitham Abu-Ghazaleh 02-6569982 02-2345315
Al-Hilal Mortadella Factory Muhammad Yunus 08-2804398 08-2804399
Food Land Company Azzam Al-Halawani 02-6566957 02-6566958
Al Mahareeq Investment Mohammed Mahareeq 02-2263967 02-2263966
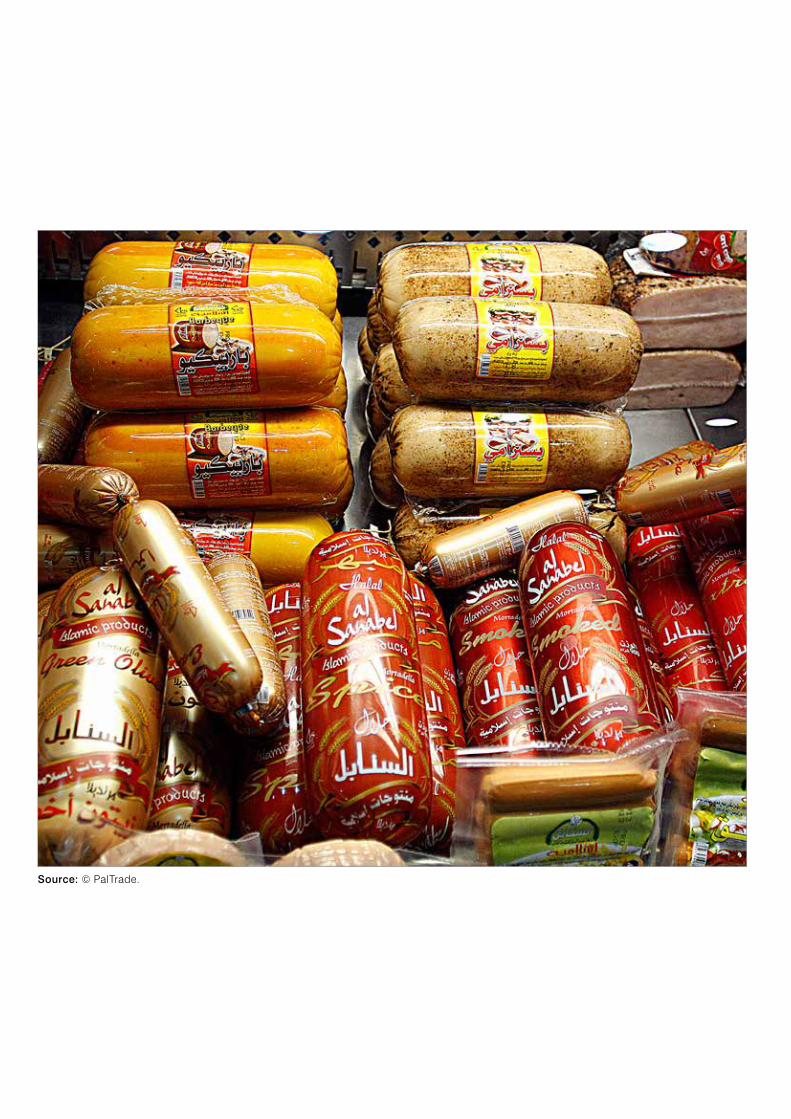
Source: © PalTrade.