the star-forming region in orion kl
TRANSCRIPT

Astronomy Letters, Vol. 29, No. 10, 2003, pp. 641–643. Translated from Pis’ma v Astronomicheskiı Zhurnal, Vol. 29, No. 10, 2003, pp. 723–726.Original Russian Text Copyright c© 2003 by Matveyenko, Zakharin, Diamond, Graham.
The Star-Forming Region in Orion KL
L. I. Matveyenko1*, K. M. Zakharin1, P. J. Diamond2**, and D. A. Graham3***
1Space Research Institute, Profsoyuznaya ul. 84/32, Moscow, 117997 Russia2Nuffield Radio Observatory, Macclesfield, Cheshire SK11, 9DL, UK
3Max-Planck-Institut fur Radioastronomie, Auf dem Hugel 69, 53121 Bonn, GermanyReceived May 12, 2003
Abstract—We have studied the fine structure of the active H2O supermaser emission region in Orion KLwith an angular resolution of 0.1 mas. We found central features suggestive of a bipolar outflow, bullets,and an envelope which correspond to the earliest stage of low-mass star formation. The ejector is a brightcompact source≤0.05 AU in size with a brightness temperature Tb
∼= 1017 K. The highly collimated bipolaroutflow∼30 has a velocity vej
∼= 10 km s−1, a rotation period of∼0.5 yr, a precession period of ∼10 yr, and aprecession angle of∼33◦. Precession gives rise to a jet in the shape of a conical helix. The envelope amplifiesthe radio emission from the components by about three orders of magnitude at a velocity v = 7.65 km s−1.c© 2003 MAIK “Nauka/Interperiodica”.
Key words: star formation, accretion disks, maser emission.
INTRODUCTION
Gravitational instabilities in gas–dust complexesgive rise to local active zones that contain protostarsin the phase of gravitational contraction. Physicalconditions and chemical reactions lead to the forma-tion of both simple and complex molecules accom-panied by intense water-vapor maser emission. Weinvestigated the fine structure of the H2O supermaserzone in Orion KL at various epochs by using globalVLBI network observations in 1985 and NRAO VL-BA observations at subsequent epochs.
THE EPOCH OF ACTIVITY 1979–1987
Outbursts of H2O supermaser emission wereobserved in Orion KL from 1979 to 1987. In Octo-ber 1985, the maser emission was concentrated in anarrow line profile with a width of ∼42 kHz; the peakflux densities reached Fpeak ∼ 2 MJy (Matveenko1981). A 10.8-AU-long chain of five groups ofcompact sources was observed; the sizes of theindividual sources were ∼ 0.1 AU (Fig. 1). The groupvelocities increased along the chain from 6.45 (west)to 8.75 km s−1 (east). The brightest components hadv = 7.7 km s−1, Tb = 5× 10¹⁶ K and v = 7.9 km s−1,Tb = 9 × 10¹⁶ K. The maser emission was linearly
*E-mail: [email protected]**E-mail: [email protected]
***E-mail: [email protected]
1063-7737/03/2910-0641$24.00 c© 2
polarized, P ≈ 70%. We interpreted the chain of com-pact components as a thin disk separated into ringsduring Keplerian motion seen edge-on (Matveenkoet al. 1988). This model assumes the presence ofa central protostar with a mass of (0.1–0.5)M�, aninner ring radius Rin
∼= 6 AU, a rotation velocityvrot = 5 km s−1, and an expansion velocity vexp
∼=3.8 km s−1. The outer ring radius is R ∼= 16.5 AUand vrot = 3 km s−1. The expansion velocity corre-sponds to “maser rings” containing sublimed water-vapor molecules accelerated by radiation pressureand stellar wind. The active region is surroundedby an envelope that amplifies the emission of the
–4
5 0 –5 –10
–2
0
2
4
CBA
D
6.4 6.36.66.5
6.5
6.97.17.2
7.57.77.8
7.8
7.8
7.9
8.0
8.8
Fig. 1. The distribution of maser spots in October 1985.Relative right ascension and declination (in mas) arealong the vertical and horizontal axes, respectively. Thecircle diameters are proportional to the logarithm of theintensity of the components. The maximum brightness isTb ≈ 1017 K.
003 MAIK “Nauka/Interperiodica”

642 MATVEYENKO et al.
–4
4
0
4
0 –4 4 0 –4
–10
10
0
10
0 –10 4 0 –4
–4
0
4
–4
0
4
ORION at 22.235 GHz 1999 Aug. 11ORION at 22.232 GHz 1999 Apr. 24
ORION at 22.235 GHz 1998 Oct. 14ORION–A at 22.233 GHz 1995 May 26
Fig. 2. The structure of the H2O supermaser emission in the active region of Orion KL (scales in mas). The synthesized beamis shown in the lower left corner of each map; the epoch of observations is given above the maps.
components with v = 7.65 km s−1 by more than twoorders of magnitude.
THE EPOCH OF QUIESCENCE
On May 25, 1995, we investigated the regionwith an ultrahigh angular resolution of 0.1 mas, or0.04 AU (Matveenko et al. 1998, 2000, 2002). A9 × 0.05 AU jet and two compact “bullet” compo-nents were detected. A bright, compact source, thepresumed ejector, and an elongated 0.5 × 0.04 AUfeature at a position angle of −44◦ with brightnesstemperature Tej
∼= 1013 K and Tjet∼= 1012 K are lo-
cated at the jet center (Fig. 2). The interaction ofbullets with the ambient medium, radiation pressure,and stellar wind form a comet-like head–tail struc-ture. The tail can be in front of or behind the head.The maser emission is linearly polarized, P ∼= 55%(Matveenko et al. 1998).
THE ACTIVITY PERIOD 1998-1999
The intensity of the H2O maser emission ex-ponentially increased, reaching 4.3 MJy in Au-gust 1998, and began to exponentially decrease inNovember. At the first stage of the outburst (March-October 1998), the structure remained virtually thesame as that in the quiescence period (Matveenkoet al. 1998), but the brightness of the componentsincreased by more than three orders of magnitude,reaching Tjet
∼= 1015 K and Tej∼= 1017 K (Matveenko
et al. 2002). At the final phase of activity in January–April 1999, the structure became more complex;additional features appeared in the central region,which can be part of a 1.2 × 0.8 AU torus ∼0.15 AUin thickness (Fig. 2). The radial outflow velocityis v|| ∼= 0.15 km s−1. The velocity in the plane ofthe sky, v⊥ ∼= 10 km s−1, is observed immediatelybefore the outburst peak; at the peak, this velocitydecreased to 6 km s−1 and reached ∼3 km s−1 at the
ASTRONOMY LETTERS Vol. 29 No. 10 2003
THE STAR-FORMING REGION IN ORION KL 643
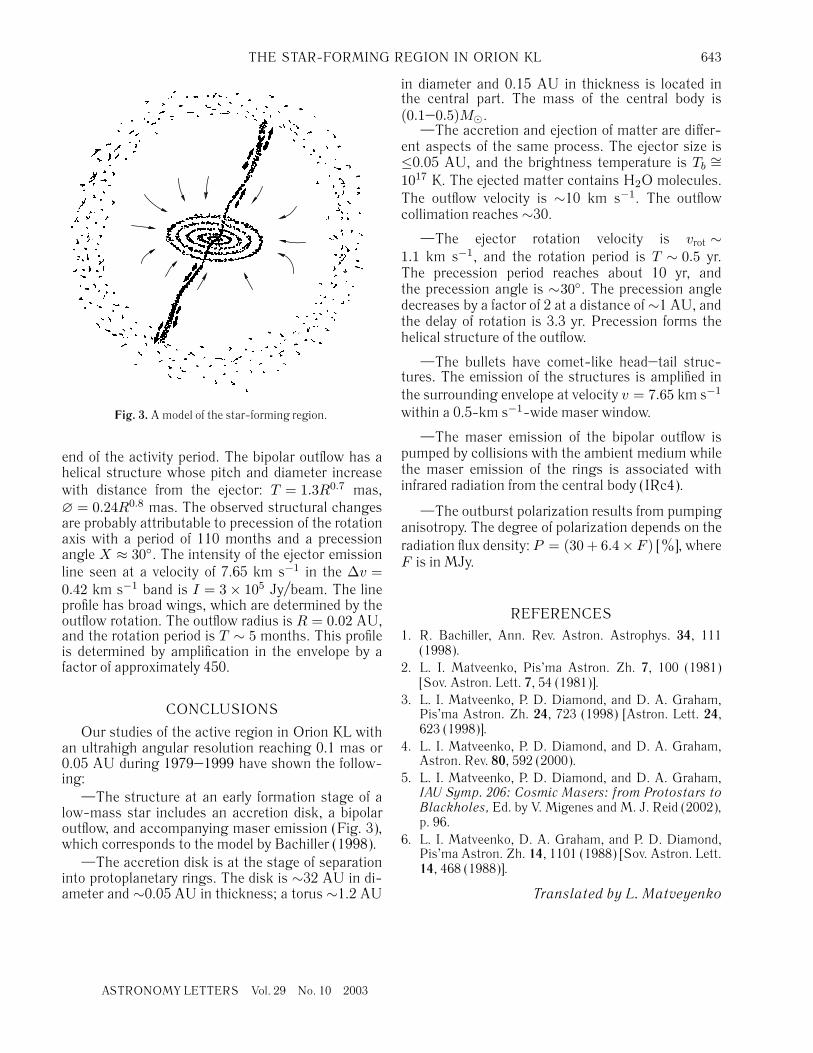
Fig. 3. A model of the star-forming region.
end of the activity period. The bipolar outflow has ahelical structure whose pitch and diameter increasewith distance from the ejector: T = 1.3R0.7 mas,∅ = 0.24R0.8 mas. The observed structural changesare probably attributable to precession of the rotationaxis with a period of 110 months and a precessionangle X ≈ 30◦. The intensity of the ejector emissionline seen at a velocity of 7.65 km s−1 in the ∆v =0.42 km s−1 band is I = 3 × 10⁵ Jy/beam. The lineprofile has broad wings, which are determined by theoutflow rotation. The outflow radius is R = 0.02 AU,and the rotation period is T ∼ 5 months. This profileis determined by amplification in the envelope by afactor of approximately 450.
CONCLUSIONS
Our studies of the active region in Orion KL withan ultrahigh angular resolution reaching 0.1 mas or0.05 AU during 1979–1999 have shown the follow-ing:
—The structure at an early formation stage of alow-mass star includes an accretion disk, a bipolaroutflow, and accompanying maser emission (Fig. 3),which corresponds to the model by Bachiller (1998).
—The accretion disk is at the stage of separationinto protoplanetary rings. The disk is ∼32 AU in di-ameter and ∼0.05 AU in thickness; a torus ∼1.2 AU
ASTRONOMY LETTERS Vol. 29 No. 10 2003
in diameter and 0.15 AU in thickness is located inthe central part. The mass of the central body is(0.1–0.5)M�.
—The accretion and ejection of matter are differ-ent aspects of the same process. The ejector size is≤0.05 AU, and the brightness temperature is Tb
∼=1017 K. The ejected matter contains H2O molecules.The outflow velocity is ∼10 km s−1. The outflowcollimation reaches ∼30.
—The ejector rotation velocity is vrot ∼1.1 km s−1, and the rotation period is T ∼ 0.5 yr.The precession period reaches about 10 yr, andthe precession angle is ∼30◦. The precession angledecreases by a factor of 2 at a distance of ∼1 AU, andthe delay of rotation is 3.3 yr. Precession forms thehelical structure of the outflow.
—The bullets have comet-like head–tail struc-tures. The emission of the structures is amplified inthe surrounding envelope at velocity v = 7.65 km s−1
within a 0.5-km s−1-wide maser window.
—The maser emission of the bipolar outflow ispumped by collisions with the ambient medium whilethe maser emission of the rings is associated withinfrared radiation from the central body (IRc4).
—The outburst polarization results from pumpinganisotropy. The degree of polarization depends on theradiation flux density: P = (30 + 6.4× F ) [%], whereF is in MJy.
REFERENCES
1. R. Bachiller, Ann. Rev. Astron. Astrophys. 34, 111(1998).
2. L. I. Matveenko, Pis’ma Astron. Zh. 7, 100 (1981)[Sov. Astron. Lett. 7, 54 (1981)].
3. L. I. Matveenko, P. D. Diamond, and D. A. Graham,Pis’ma Astron. Zh. 24, 723 (1998) [Astron. Lett. 24,623 (1998)].
4. L. I. Matveenko, P. D. Diamond, and D. A. Graham,Astron. Rev. 80, 592 (2000).
5. L. I. Matveenko, P. D. Diamond, and D. A. Graham,IAU Symp. 206: Cosmic Masers: from Protostars toBlackholes, Ed. by V. Migenes and M. J. Reid (2002),p. 96.
6. L. I. Matveenko, D. A. Graham, and P. D. Diamond,Pis’ma Astron. Zh. 14, 1101 (1988) [Sov. Astron. Lett.14, 468 (1988)].
Translated by L. Matveyenko