the stability and catalytic performance of k-modified
TRANSCRIPT

RSC Advances
PAPER
Ope
n A
cces
s A
rtic
le. P
ublis
hed
on 1
6 A
pril
2019
. Dow
nloa
ded
on 1
2/1/
2021
12:
44:0
7 A
M.
Thi
s ar
ticle
is li
cens
ed u
nder
a C
reat
ive
Com
mon
s A
ttrib
utio
n 3.
0 U
npor
ted
Lic
ence
.
View Article OnlineView Journal | View Issue
The stability and
aDepartment of Chemical Engineering, T
14115-143, Tehran, IranbDepartment of Chemical Engineering, Tarb
143, Tehran, Iran. E-mail: towghi@modar
218 288 3311cDepartment of Chemical Engineering, Ma
Mahshahr, Iran
Cite this: RSC Adv., 2019, 9, 11797
Received 28th December 2018Accepted 29th March 2019
DOI: 10.1039/c8ra10598g
rsc.li/rsc-advances
This journal is © The Royal Society of C
catalytic performance of K-modified molybdena supported on a titanatenanostructured catalyst in the oxidativedehydrogenation of propane
Ehsan Goudarzi,a Reza Asadi,a Jafar Towfighi Darian *b and Amirhossein ShahbaziKootenaeic
Titanate nanotube supported molybdena was evaluated as a catalyst in the oxidative dehydrogenation of
propane to propylene. The synthesized titanate nanotubes with high specific surface area were prepared
by a hydrothermal method. The characterization of pristine nanotubes was performed via XRD, Raman,
SEM, TEM and BET. The presence of hydrogen titanate nanostructure was confirmed in the bare support.
Incipient wetness impregnation method was used to prepare MoTNT-x (x ¼ 5, 10, and 15 wt%
molybdena). The as-prepared catalysts' characterization was investigated using Raman, XRD, SEM, EDS,
TEM, BET, TGA, and CHNS. Furthermore, H2-TPR was performed to explore reducibility of the catalysts.
XRD and Raman results indicated development of the anatase phase in MoTNT-x catalysts upon
calcination, along with specific surface area loss according to BET. Study of the catalytic performance of
the samples showed an increase in catalytic activity and a significant drop in propylene selectivity with
rising molybdena content. The maximum yield of propylene (about 9.3%) was obtained in 10 wt% of Mo
content. The effect of potassium loading as a promoter in K/MoTNT-10 catalyst was also explored
through characterization of the surface molybdena species and catalytic performance. Due to the
presence of potassium, propylene yield increased from 9.3% to 11.3% at 500 �C. The stabilities of both
catalysts were considered for 3000 min and showed only slight drops in propane conversion and
propylene selectivity.
1. Introduction
The rapid development of human societies in the second half ofthe twentieth century was made possible by oil and gas, eitheras fuel or as a raw material. Unfortunately, fossil fuels do notcontain olens and mainly consist of saturated hydrocarbonsand aromatics. Olen production requires sophisticated tech-nologies that are costly and require a large investment.Conversion of light alkanes to olens has become one of themost interesting subjects for research over the last twodecades.1–4 Olens, because of their high reactivity, have a largerole in producing polymers and other more valuable materials.
Propylene is a key product in the petrochemical industry,used as a feedstock to produce different polymers and inter-mediate products. Increasing demand for propylene in the
arbiat Modares University, P. O. Box
iat Modares University, P. O. Box 14115-
es.ac.ir; Fax: +98 218 288 3311; Tel: +98
hshahr Branch, Islamic Azad University,
hemistry 2019
global market, as well as general efforts to convert cheap andabundant raw materials and byproducts of petroleum reningprocesses into more valuable products, have resulted insubstantial research into the oxidative dehydrogenation ofpropane.5,6 Catalytic dehydrogenation of alkanes is an endo-thermic reaction which requires a comparatively high temper-ature to achieve high yield. However, this high reactiontemperature causes high thermal cracking, lowering alkane andcoke formation and resulting in a drop in product yield andquick catalyst deactivation.7 Oxidative dehydrogenation ofpropane is a viable alternative to the catalytic dehydrogenationprocess with several benets, such as being exothermic withoutany thermodynamic limitations. However, this approach suffersfrom problematic over-oxidation (combustion), which candecrease propylene productivity.8 A suitable catalyst for theODH1 of propane must be able to effectively activate the C–Hbond of propane and hamper unfavorable deep oxidation ofpropene to COx.9 Transition metal oxides are the most impor-tant catalysts used in oxidative dehydrogenation of propane.10–13
The most extensively studied catalysts involve Mo/V/Ce basedoxides.14–19 Much research has been done into molybdenumoxide catalysts supported on different metal oxides.20–24
RSC Adv., 2019, 9, 11797–11809 | 11797

RSC Advances Paper
Ope
n A
cces
s A
rtic
le. P
ublis
hed
on 1
6 A
pril
2019
. Dow
nloa
ded
on 1
2/1/
2021
12:
44:0
7 A
M.
Thi
s ar
ticle
is li
cens
ed u
nder
a C
reat
ive
Com
mon
s A
ttrib
utio
n 3.
0 U
npor
ted
Lic
ence
.View Article Online
Catalytic performance of the molybdena catalysts depends onthe specic support, promoters, molybdena loading, calcina-tion temperature, etc.20,21,25 It has been suggested that titania-supported molybdena catalysts are highly active in propaneODH,21 although conventional anatase titania suffers from lowsurface area.10,21
Recently, Kasuga26 presented a hydrothermal method toproduce titanate nanotubes and TiO2 with large specic surfacearea and ion-exchange ability, appropriate for use as supportsfor active sites in catalysts. The procedure is uncomplicated,simple and cost-efficient; furthermore, it is an eco-friendlytechnique in comparison to the template method or anodicoxidation.27
In this article, we propose hydrothermally synthesized tita-nate nanotubes as a novel support, with a surprisingly highspecic surface area, for K-doped molybdena catalyst to be usedin oxidative dehydrogenation of propane versus conventionalcatalytic systems. Molybdena loading, potassium addition,calcination temperature and reaction temperature impacts wereinvestigated through structure and catalytic performance oftitania-supported K/Mo catalysts. Catalyst deactivationphenomenon was explored in the system to study stability of theK-promoted and non-promoted catalysts for 3000 min.
2. Experimental2.1. Synthesis of titanate nanotube
Generally, to prepare the catalyst support, 1.7 g of Degussa TiO2
P25 was added to 150 ml of 10 M aqueous solution of NaOH(Merck) in an exothermic mixing process. The prepared mixturewas stirred for 30 min, then transferred into a sealed Teon-lined stainless-steel autoclave, lling about 80% of thevolume. The sample was kept in an oven at 140 �C for 24 h, thenthe resulting mixture cooled at room temperature and wasplaced in a centrifuge for 15 min. The materials were washedusing a weak acid solution of 0.1 M HNO3 until the pH of therinsing solution attained about 1. The sediment was then rinsedwith doubly deionized distillated water until the passing waterreached pH 7. The obtained sample was dried at 110 �C for 12 h.
2.2. Catalyst preparation
Two types of catalysts were prepared by the incipient wetnessimpregnation method. The rst type of catalyst (MoTNT-x,where x is the wt% of MoO3) involved a certain amount of MoO3
supported on titanate nanotubes. Briey, a calculated amountof ammonium heptamolybdate was added to a measuredvolume of doubly deionized water that corresponded to the totalpore volume of the support. Then, the support was added to thesolution. The mixture was stirred at 70 �C until forming a paste.The resulting sample dried for 12 h at 110 �C to make a powder.The powder was calcined in static air for 3 h at 500 �C. Aercooling to room temperature, the calcined sample underwenta forming process and 60–100 mesh size was chosen for thecatalytic activity and deactivation tests.
In addition to MoO3, the second type of catalyst (MoKyTNT-x, where x and y are the wt% of MoO3 and the K : Mo molar
11798 | RSC Adv., 2019, 9, 11797–11809
ratio, respectively) involved a specic amount of KOH sup-ported on titanate nanotubes. In the rst step of catalyst prep-aration, a calculated amount of KOH was added to themeasured ammonium heptamolybdate before stirring indeionized water. Next steps were identical to the preparationprocedure for the rst type of catalyst.
2.3. Catalyst characterization
X-ray diffraction (XRD) patterns of the catalysts and titanatenanotubes were recorded on a Philips PW1800 diffractometerusing Cu Ka radiation (l ¼ 0.15418 nm). The intensities weredetermined for all of the synthesized samples with 2q rangefrom 5� to 70� at a step-size D(2q) of 0.03� and a count time of 2 sper step. The indexing of attained spectra was carried out bycomparison with JCPDS les (Joint Committee on PowderDiffraction Standards). The mean crystallite size of the samplewas estimated by Scherrer's equation, from the XRD line-broadening measurement, as follows:
dXRD ¼ kl
b cos q(1)
where k is a constant equal to 0.9 (shape factor), l is the wave-length of the X-ray in nanometers, q is the diffraction angle andb is the true half-peak width.
Raman spectra were recorded with a Bruker (model SEN-TERRA (2009)) spectrophotometer. A diode laser (l ¼ 785 nm)operating at 25 mW was employed as Raman excitation sourcewith a germanium thermoelectrically cooled charged coupledevice (Andorf) as detector.
Specic surface areas of the catalysts were determined by N2
adsorption/desorption at �196.15 �C using BET method (BEL-SORPMini II apparatus) with a ten point-isotherm. The sampleswere degassed for 2 h at 200 �C prior to nitrogen adsorption.
For transmission electron microscopy (TEM), the materialwas dispersed at room temperature in isopropanol and analiquot of the prepared sample was deposited onto perforatedcarbon foil supported on a copper grid. The investigations weremade on a Zeiss EM 900 microscope.
Scanning electron microscopy (SEM) was performed bya TESCAN MIRA3 Model apparatus equipped with an analyticalsystem for energy dispersive X-ray spectrometry (EDS) todetermine the morphology of the prepared samples.
The H2-temperature programmed reduction (H2-TPR)experiments were carried out in a Quantachrome CHEMBET-3000 apparatus using 20 mg of samples with 10 sccm of 7.0%H2 in air with concomitant temperature leveling up to 700 �C ata heating rate of 10 �C min�1. A thermal conductivity detector(TCD) monitored hydrogen consumption by analyzing the TPRreactor effluent. For quantitative purposes, the TCD signal wascalibrated by reduction of Ag2O under similar conditions. Priorto this analysis, the sample was oxidized in owing air at 200 �Cfor 1 h.
Thermal gravimetric analysis (TGA) was performed usinga Netzsch-TGA 209 F1 thermo-gravimetric analyzer in airatmosphere from 25 to 900 �C with a heating rate of10 �C min�1.
This journal is © The Royal Society of Chemistry 2019

Paper RSC Advances
Ope
n A
cces
s A
rtic
le. P
ublis
hed
on 1
6 A
pril
2019
. Dow
nloa
ded
on 1
2/1/
2021
12:
44:0
7 A
M.
Thi
s ar
ticle
is li
cens
ed u
nder
a C
reat
ive
Com
mon
s A
ttrib
utio
n 3.
0 U
npor
ted
Lic
ence
.View Article Online
Elemental analysis was performed using Perkin Elmer 2400Series II CHNS analyzer. The CHNS analysis was based on theclassical Pregl-Dumas technique using a furnace temperature of1100 �C.
2.4. Catalytic activity and deactivation study
Activities of the catalysts in oxidative dehydrogenation ofpropane were investigated in a microow xed-bed quartzreactor (Fig. 1) with an internal diameter of 6 mm, externaldiameter of 7 mm and length of 50 cm at atmospheric pressure.An electric furnace was used to heat the reactor together witha thermocouple type K inside the catalyst bed. The catalytic bedwas placed in the middle of the furnace (low thermal variationswithin a suitable longitudinal range). Blank runs were executedwith the reactor packed with quartz wool at 500 �C to show thenegligibility of propane conversion in the vacant reactor.100 mg of catalyst with a mesh size of 60–100 diluted with100 mg silicon carbide for better thermal distribution of thesamples were utilized for each test. The samples were kept inthe center of the reactor on a piece of quartz wool. The catalystwas pretreated using 20 sccm dry air ow at atmosphericpressure with heating rate of 10 �C min�1 up to 300 �C; it wasthen cooled under air ow to 200 �C. Next, a mixture of propane(99.8%) and air (99.995%) was fed into the catalytic reactor bedusing calibrated mass ow rate controllers. The feed ow wasmixed in a chamber with molar ratio of propane/O2 equal to 1and ow rate of 100 sccm before contact with the catalyst. Thetemperature was increased in a stepwise fashion, with steps of50 �C up to 500 �C, such that every step of the reaction lasted30 min.
Fig. 1 Schematic of the fixed-bed quartz reactor.
This journal is © The Royal Society of Chemistry 2019
Analysis of the composition of the reaction's output productswas performed on-line by a VARIAN CP-3800 gas chromatog-raphy device equipped with two ame ionization detectors (FID)and a methanizer (Ru/Al2O3). Carbon balance was establishedfor all the catalytic tests, within 5%. Conversion, selectivity, andyield are all calculated based on carbon atoms as follows:
XPropane ¼P ðni � CiÞProducts
3 � nPropane(2)
Si ¼ ni � CiP ðni � CiÞProducts(3)
Yi ¼ ni � Ci
3 � nPropane(4)
Here, XPropane represents propane conversion. Si and Yi stand forproduct i selectivity and yield, respectively; ni and ci indicate themoles of molecule i and the number of carbon atoms in mole-cule i, respectively.
The turnover frequency (TOF) per molybdena atomic unit isdetermined according to eqn (5), with a diagram provided inFig. 8d.
TOF ¼ n�
PropaneMV
mCatWV
(5)
In this relation, _nPropane is the molar ow rate of propane inthe feed (1.17547 � 10�5 mol s�1), Xpropane represents thepropane conversion, MV is the molecular weight of molybdena(95.96 g mol�1), mCat denotes the catalyst's mass (g), Wv is the
RSC Adv., 2019, 9, 11797–11809 | 11799

Fig. 2 XRD patterns of (a) acid-treated titanate nanotubes, (b) MoTNT-5, (c) MoTNT-10, (d) MoK0.1TNT-10, (e) MoTNT-15, and (f) spentMoK0.1TNT-10.
RSC Advances Paper
Ope
n A
cces
s A
rtic
le. P
ublis
hed
on 1
6 A
pril
2019
. Dow
nloa
ded
on 1
2/1/
2021
12:
44:0
7 A
M.
Thi
s ar
ticle
is li
cens
ed u
nder
a C
reat
ive
Com
mon
s A
ttrib
utio
n 3.
0 U
npor
ted
Lic
ence
.View Article Online
weight fraction of molybdena in the catalyst, and TOF is theturnover frequency (s�1).
Deactivation studies of the catalysts were performed at500 �C for 3000 min continuously under feed ow with similarconditions to the activity tests. The reactor's effluent wassampled with a time step of 150 min. Following completion ofthe deactivation study, the feed ow was changed to He toconserve the catalyst state for further studies. The catalyst wascooled to room temperature in the reactor.
3. Results and discussion3.1. XRD analysis
XRD spectra related to the titanate nanotubes and developedcatalysts are provided in Fig. 2. Understanding the crystallinestructure of titanate nanotubes is usually difficult due to broadreections in XRD pattern, ascribed to the small size of nano-tubes.10 In addition, titanate nanotubes are relatively unstableand can experience various phase alterations during catalystpreparation methods such as acid washing and calcination,resulting in ambiguity of the exact crystal structure of titanatenanotubes.28
In Fig. 2a, the peaks at 10.7�, 24.2�, 28.6�, and 48.3� can beattributed to planes 200, 110, 310, and 020, respectively, inH2Ti5O11$H2O (JCPDS: 44-0131). Accordingly, it seems that thehydrothermal process decomposes the structure of theprecursor Degussa TiO2 P25 in the presence of alkaline solu-tion, thereby forming a completely new structure.
The XRD pattern related to MoTNT-5 in Fig. 2b only includesthe anatase phase (JCPDS: 21-1272). Absence of any MoO3
diffraction pattern might be a result of full dispersion ofmolybdena species on the support surface or formation of verytiny molybdena crystals on the surface, whose size is below the
11800 | RSC Adv., 2019, 9, 11797–11809
device detection capacity.23,25,29 The molecular structure ofmolybdena is such that, with increase in molybdena loadingand following mono-molybdena species, we observe growth oftwo-dimensional and three-dimensional species of poly-molibdate30 and a propensity for MoO3 crystals to develop,though these species can coexist as well. The probability offormation of polymeric molybdena species increases asa monolayer coating is approached.
A monolayer coating with a specic surface area of 41 m2 g�1
for commercial anatase support has been obtained in 3.9%loading of molybdena.21
The XRD pattern of MoTNT-10 catalyst represents the pres-ence of molybdena oxide along with anatase phase (JCPDS: 35-0609), as the peaks shown in Fig. 2c can be attributed to planes020, 110, 021, and 060, respectively. The relevant peaks havevery low intensity, suggesting formation of few molybdenacrystals in conjunction with mono- and poly-molybdate species.Peaks associated with rutile phase were not detectable.
Presence of potassium in the catalyst K0.1MoTNT-10improved dispersion of molybdena species on the supportsurface. Further, peaks related to molybdena crystals were notdetectable, suggesting formation of no molybdena crystals oronly microcrystals of size smaller than the detection capacity ofthe device. Moreover, the intensity of the peak related to anatasephase increased in comparison to the catalyst MoTNT-10. It canbe stated that the presence of potassium diminished theconversion of anatase phase into rutile. Supercial species ofpotassium were not detected, due to its low level in the sample.
The XRD pattern of MoTNT-15 catalyst suggests increasedintensity of peaks related to molybdena crystals and diminishedintensity of the anatase phase peaks compared to MoTNT-10catalyst. It can be concluded that the number and size ofMoO3 crystals increase with increasing molybdena loading on
This journal is © The Royal Society of Chemistry 2019

Paper RSC Advances
Ope
n A
cces
s A
rtic
le. P
ublis
hed
on 1
6 A
pril
2019
. Dow
nloa
ded
on 1
2/1/
2021
12:
44:0
7 A
M.
Thi
s ar
ticle
is li
cens
ed u
nder
a C
reat
ive
Com
mon
s A
ttrib
utio
n 3.
0 U
npor
ted
Lic
ence
.View Article Online
the titania support surface. Further, as shown in Fig. 2e, peaksassociated with rutile phase (planes 110 and 111) were detect-able in the XRD pattern of the catalyst with increase in molyb-dena loading (JCPDS:21-1276).
Disappearance of the index peak 2q ¼ 10.6�, related to thestructure of titanate hydrogen nanotubes, refers to the molyb-dena loading and catalyst calcination resulting in alteration ofthe nanotube structure and its phase conversion to the anatasephase.
Using Scherrer's equation (eqn (1)), the average crystallitesize of the catalysts was calculated considering the peak locatedat 2q ¼ 24.2� as the characteristic peak and the results areshown in Table 1. Crystallite size shows a growing trend withincreasing Mo loading, which can be attributed to furtherformation of polymeric and crystalline molybdena species anddestruction of the support structure because of anatase to rutileconversion. Lower crystallite size in MoK0.1TNT-10 can beascribed to the presence of potassium in the support surfacestructure.
The XRD pattern of spent K0.1MoTNT-10 catalyst in Fig. 2fshows lower intensity of anatase characteristic peak at 2q ¼24.2� compared to the unspent one. Moreover, the presence ofmolybdena oxide in the catalyst is proved, as the peaks can beattributed to planes 020, 021, and 060, suggesting formationand growth of both molybdena crystals and its polymericspecies. It should also be mentioned that no rutile phase wasseen in the XRD pattern of the spent catalyst.
3.2. Raman analysis
The Raman spectra of titanate nanotubes are provided inFig. 3a. The shoulders at 145 cm�1 and 402 cm�1 can beattributed to the Eg mode of the anatase phase. The intensity ofthese bands increases during the acid washing stage with thedecrease in sodium present in the titanate nanotube structure.31
This suggests the effect of sodium in prevention of conversionof titanate nanotubes to anatase. Considering the intensity ofthe 145 cm�1 and 402 cm�1 bands observed in the Ramanspectrum of the synthesized sample, it can be stated that thereis little sodium in the structure. The band at 266 cm�1 can beassigned to Ti–OH bonds, which are important for formationand stability of titanate nanotubes. By calcination of thenanotubes at high temperatures, two Ti–OH bonds are mergedto form a Ti–O–Ti bond by releasing H2O. This is the cause of
Table 1 Specific surface areas and H2-TPR results of prepared catalysts
SampleBET surface aream2 g�1
Degussa TiO2 P25 49Acid treated TNT 401MoTNT-5 76MoTNT-10 69MoK0.1TNT-10 74MoTNT-15 44Spent MoTNT-10 56Spent MoK0.1TNT-10 67
This journal is © The Royal Society of Chemistry 2019
destruction of the tubular structure of the nanotube andformation of anatase phase.10,32
The band at 448 cm�1 is related to vibrations of the Ti–O–Tibond and that at 903 cm�1 is associated with Na–O–Ti bond.33
This latter band did not exist in the Raman spectra of oursynthesized support, suggesting absence or minimal existenceof sodium in the structure of the synthesized titanate nanotube.The bands above 650 cm�1, including the bands at around 830and 926 cm�1, are sensitive to humidity and, during the dryingprocess of the support, they become weaker and move to higherfrequencies. These bands can be assigned to supercial vibra-tional modes.31 The bands at 200, 510, and 635 cm�1 can beattributed to the anatase phase.25,29,34,35
The Raman spectra related to MOTNT-5 catalyst in Fig. 3bhas bands at 410, 520, and 645 cm�1, the dominant bands ofanatase. No band related to rutile phase was observed. More-over, no peak suggesting the presence of crystal molybdenaspecies was observed, in line with the obtained results fromXRD. The band at 975 cm�1 is related to the Mo]O bond inmonomer and polymer species of molybdena.25,36 The band at265 cm�1 disappeared from the Raman spectra of MoTNT-xcatalysts, suggesting the effect of molybdena loading indestruction of the titanate nanotube structure and its conver-sion to anatase phase. The reduction in the intensity of thebands associated with anatase phase with increase in themolybdena loading on the support surface is notable in Ramanspectra of catalysts in Fig. 3c and d.
The broad and not very intense band at 820 cm�1 in theMoTNT-10 catalyst spectrum in Fig. 3c can be attributed to Mo–O–Mo bonds in the crystalline or polymeric structure ofmolybdena species.37,38 Comparison of the catalyst MoTNT-10with MoTNT-5 indicated that the presence of a band at820 cm�1 is followed by reduction in the intensity of the bandrelated to mono-molybdena species and its transference to thehigher frequency of 980 cm�1, which is in line with the results ofother reports.20,25 This suggests reduction in the presence ofmonomer molybdena species on the support surface with theincrease in its loading. This transition is due to the alteredlength of the Mo]O bond and can be attributed to decreasedinteraction with the support and production of three-dimensional polymer species of molybdena.20,39 This is fullycompatible with the obtained results from XRD. No bandrelated to rutile phase was observed.
H2-TPRresults Tmax (�C)
Mean crystallitesize (nm)
— —— —485.5 23.3496.2 28.5521.5 23.4542.6 34.7— —— —
RSC Adv., 2019, 9, 11797–11809 | 11801

RSC Advances Paper
Ope
n A
cces
s A
rtic
le. P
ublis
hed
on 1
6 A
pril
2019
. Dow
nloa
ded
on 1
2/1/
2021
12:
44:0
7 A
M.
Thi
s ar
ticle
is li
cens
ed u
nder
a C
reat
ive
Com
mon
s A
ttrib
utio
n 3.
0 U
npor
ted
Lic
ence
.View Article Online
Presence of potassium in the structure of K0.1MoTNT-10catalyst, as shown in Fig. 3d, caused the disappearance of the820 cm�1 band associated with crystal species of molybdenafrom its Raman spectra and improvement of dispersion ofmolybdena species on the support surface, such that theintensity of the band related to Mo]O bond increased signi-cantly and transferred to the lower frequency of 966 cm�1.29 Theintensity of bands related to anatase phase increased inresponse to presence of potassium compared to MoTNT-10catalyst. No band associated with rutile phase was observed.Due to the low level of potassium in the catalyst, no band sug-gesting the presence of supercial species of potassium wasobserved. Watson et al.29 attributed the bands at 900–950 cm�1
to K2MoO4 and K2Mo2O7 species in catalysts with largeramounts of potassium.
The Raman spectrum of MoTNT-15 catalyst (Fig. 3e) showedincreased intensity of the bands related to molybdena crystalsin comparison to MoTNT-10 catalyst. It can be concluded thatthe number and/or the size of MoO3 crystals increases withelevation of molybdena loading on the titania support surface.Eventually, by developing a bulk phase on the surface, it causesdiminished access to the active sites of the catalyst.20 Further,a band associated with rutile phase was observed at 230 cm�1,in line with XRD results.
3.3. The specic surface area of BET
The BET surface area of the acid-washed nanotubes was foundusing a BET isotherm. It is remarkable that the nanotubesreached a specic surface area of 401 m2 g�1, while the area of
Fig. 3 Raman spectra of (a) acid-treated titanate nanotubes, (b) MoTNT
11802 | RSC Adv., 2019, 9, 11797–11809
TiO2 P25, precursor of the nanotubes, was calculated to be 49m2 g�1, as shown in Table 1. Hydrothermal method issuccessful in preparation of a support with a high specicsurface area. The acid treating process causes increase of thesurface area by a signicant value, but the issue of thermalstability also comes into play.40,41 The specic surface area ofacid washed nanotubes obtained through hydrothermalmethod has been reported at 404 m2 g�1, 408m2 g�1 and 325m2
g�1 in the literature.10,42,43
As can be observed in Table 1, the BET specic surface areasof prepared catalysts are lower than that of the synthesizednanotube, where the area diminishes with increase in molyb-dena loading. As the nanotubes have not been calcined,calcined Mo-catalysts showed a surface area much lower thanthat of the support. The specic surface areas of MoTNT-x withloading of 5, 10, and 15 wt% reach 76, 69, and 44 m2 g�1,respectively. It is also observed that the presence of potassiumin K0.1MoTNT-10 catalyst causes the surface area to reach 74m2
g�1, an enhancement compared to MOTNT-10 catalyst. Thiscould be due to improved dispersion of molybdena species onthe surface (increased level of monomeric species of molyb-dena), also observed in XRD and Raman analyses. The proba-bility of pore plugging is considerable in response to polymerand crystal species of molybdena. Smaller species cause betterdispersion and a higher specic surface area.20 Watson et al.29
reported elevation of the specic surface area of catalystssynthesized by hydrothermal method in response to the addi-tion of potassium, which is in line with our observations.Further decline in specic surface area of MoTNT-15 could bedue to higher level of molybdena so that it's more than
-5, (c) MoTNT-10, (d) MoK0.1TNT-10, and (e) MoTNT-15.
This journal is © The Royal Society of Chemistry 2019
Paper RSC Advances
Ope
n A
cces
s A
rtic
le. P
ublis
hed
on 1
6 A
pril
2019
. Dow
nloa
ded
on 1
2/1/
2021
12:
44:0
7 A
M.
Thi
s ar
ticle
is li
cens
ed u
nder
a C
reat
ive
Com
mon
s A
ttrib
utio
n 3.
0 U
npor
ted
Lic
ence
.View Article Online
monolayer coverage of the support surface,21 because furtherloading of molybdena causes weaker interaction between itsspecies and the support surface. This causes formation ofcrystal species of molybdena, which are the cause of supportpore blocking.20,21 Furthermore, this surface area reduction canbe attributed to destruction of the nanotube structure, whichincludes stages such as thinning of the walls, blending ofnanotubes, breakdown of nanotubes, and conversion to nano-particles or nanorods.44
3.4. SEM, TEM and EDS
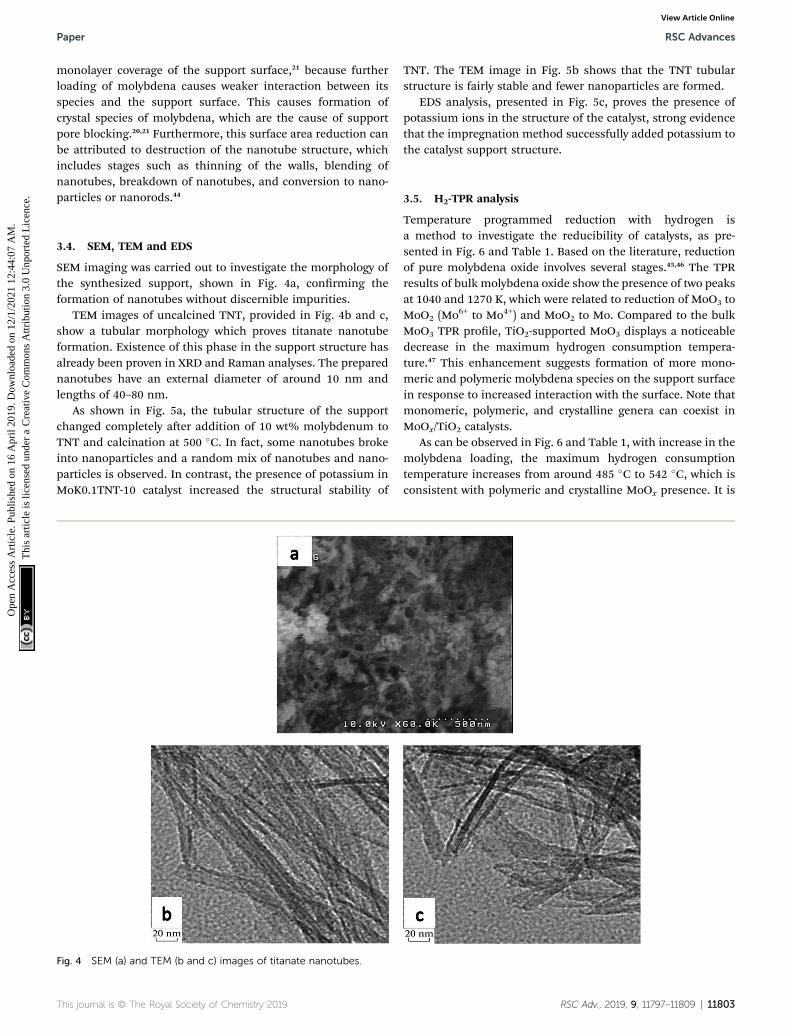
SEM imaging was carried out to investigate the morphology ofthe synthesized support, shown in Fig. 4a, conrming theformation of nanotubes without discernible impurities.
TEM images of uncalcined TNT, provided in Fig. 4b and c,show a tubular morphology which proves titanate nanotubeformation. Existence of this phase in the support structure hasalready been proven in XRD and Raman analyses. The preparednanotubes have an external diameter of around 10 nm andlengths of 40–80 nm.
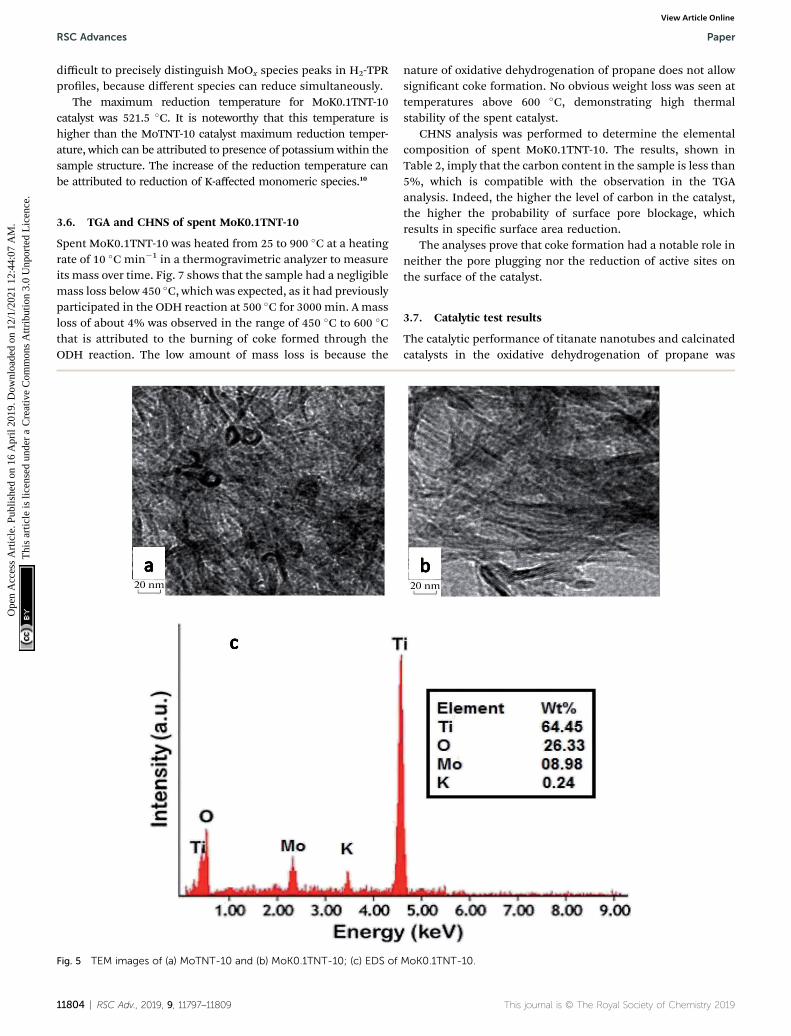
As shown in Fig. 5a, the tubular structure of the supportchanged completely aer addition of 10 wt% molybdenum toTNT and calcination at 500 �C. In fact, some nanotubes brokeinto nanoparticles and a random mix of nanotubes and nano-particles is observed. In contrast, the presence of potassium inMoK0.1TNT-10 catalyst increased the structural stability of
Fig. 4 SEM (a) and TEM (b and c) images of titanate nanotubes.
This journal is © The Royal Society of Chemistry 2019
TNT. The TEM image in Fig. 5b shows that the TNT tubularstructure is fairly stable and fewer nanoparticles are formed.
EDS analysis, presented in Fig. 5c, proves the presence ofpotassium ions in the structure of the catalyst, strong evidencethat the impregnation method successfully added potassium tothe catalyst support structure.
3.5. H2-TPR analysis
Temperature programmed reduction with hydrogen isa method to investigate the reducibility of catalysts, as pre-sented in Fig. 6 and Table 1. Based on the literature, reductionof pure molybdena oxide involves several stages.45,46 The TPRresults of bulk molybdena oxide show the presence of two peaksat 1040 and 1270 K, which were related to reduction of MoO3 toMoO2 (Mo6+ to Mo4+) and MoO2 to Mo. Compared to the bulkMoO3 TPR prole, TiO2-supported MoO3 displays a noticeabledecrease in the maximum hydrogen consumption tempera-ture.47 This enhancement suggests formation of more mono-meric and polymeric molybdena species on the support surfacein response to increased interaction with the surface. Note thatmonomeric, polymeric, and crystalline genera can coexist inMoOx/TiO2 catalysts.
As can be observed in Fig. 6 and Table 1, with increase in themolybdena loading, the maximum hydrogen consumptiontemperature increases from around 485 �C to 542 �C, which isconsistent with polymeric and crystalline MoOx presence. It is
RSC Adv., 2019, 9, 11797–11809 | 11803
RSC Advances Paper
Ope
n A
cces
s A
rtic
le. P
ublis
hed
on 1
6 A
pril
2019
. Dow
nloa
ded
on 1
2/1/
2021
12:
44:0
7 A
M.
Thi
s ar
ticle
is li
cens
ed u
nder
a C
reat
ive
Com
mon
s A
ttrib
utio
n 3.
0 U
npor
ted
Lic
ence
.View Article Online
difficult to precisely distinguish MoOx species peaks in H2-TPRproles, because different species can reduce simultaneously.
The maximum reduction temperature for MoK0.1TNT-10catalyst was 521.5 �C. It is noteworthy that this temperature ishigher than the MoTNT-10 catalyst maximum reduction temper-ature, which can be attributed to presence of potassiumwithin thesample structure. The increase of the reduction temperature canbe attributed to reduction of K-affected monomeric species.10
3.6. TGA and CHNS of spent MoK0.1TNT-10
Spent MoK0.1TNT-10 was heated from 25 to 900 �C at a heatingrate of 10 �C min�1 in a thermogravimetric analyzer to measureits mass over time. Fig. 7 shows that the sample had a negligiblemass loss below 450 �C, which was expected, as it had previouslyparticipated in the ODH reaction at 500 �C for 3000 min. A massloss of about 4% was observed in the range of 450 �C to 600 �Cthat is attributed to the burning of coke formed through theODH reaction. The low amount of mass loss is because the
Fig. 5 TEM images of (a) MoTNT-10 and (b) MoK0.1TNT-10; (c) EDS of
11804 | RSC Adv., 2019, 9, 11797–11809
nature of oxidative dehydrogenation of propane does not allowsignicant coke formation. No obvious weight loss was seen attemperatures above 600 �C, demonstrating high thermalstability of the spent catalyst.
CHNS analysis was performed to determine the elementalcomposition of spent MoK0.1TNT-10. The results, shown inTable 2, imply that the carbon content in the sample is less than5%, which is compatible with the observation in the TGAanalysis. Indeed, the higher the level of carbon in the catalyst,the higher the probability of surface pore blockage, whichresults in specic surface area reduction.
The analyses prove that coke formation had a notable role inneither the pore plugging nor the reduction of active sites onthe surface of the catalyst.
3.7. Catalytic test results
The catalytic performance of titanate nanotubes and calcinatedcatalysts in the oxidative dehydrogenation of propane was
MoK0.1TNT-10.
This journal is © The Royal Society of Chemistry 2019

Fig. 6 H2-TPR profiles of (a) MoTNT-5, (b) MoTNT-10, (c) MoK0.1TNT-10 and (d) MoTNT-15.
Paper RSC Advances
Ope
n A
cces
s A
rtic
le. P
ublis
hed
on 1
6 A
pril
2019
. Dow
nloa
ded
on 1
2/1/
2021
12:
44:0
7 A
M.
Thi
s ar
ticle
is li
cens
ed u
nder
a C
reat
ive
Com
mon
s A
ttrib
utio
n 3.
0 U
npor
ted
Lic
ence
.View Article Online
examined within the thermal range of 200–500 �C, as shown inFig. 8. In addition to propylene, other products, including H2O,CO, and CO2, were also produced. Increasing the reactiontemperature to 500 �C, slight amounts of methane and ethylenewere observed in the output products, but their selectivitiesremained below 0.2%. The oxidative dehydrogenation processof propane takes place according to an oxidation-reductionmechanism (Mars–Van–Krevelen) which involves two majorstages, illustrated in Fig. 9. In the rst stage, propane recoversthe catalyst. At this stage, the network's oxygen begins to react
Fig. 7 TGA of spent MoK0.1TNT-10 catalyst.
This journal is © The Royal Society of Chemistry 2019
with propane. In the second stage, the oxygen detached fromthe catalyst structure is substituted by oxygen adsorbed onto thecatalyst. The products, which have been adsorbed chemically,go through two different paths: they are either discharged orremain on the surface and then oxidize into other products suchas COx.48,49
As the catalytic test results in Fig. 8 show, propane conver-sion grows as the reaction temperature increases. Furthermore,propylene selectivity diminishes, followed by elevation ofselectivity of COx (CO + CO2). According to the proposed
RSC Adv., 2019, 9, 11797–11809 | 11805

Table 2 CHNS of Spent MoK0.1TNT-10 catalyst
Catalyst C% H%
Spent MoK0.1TNT-10 4.02 0.65
RSC Advances Paper
Ope
n A
cces
s A
rtic
le. P
ublis
hed
on 1
6 A
pril
2019
. Dow
nloa
ded
on 1
2/1/
2021
12:
44:0
7 A
M.
Thi
s ar
ticle
is li
cens
ed u
nder
a C
reat
ive
Com
mon
s A
ttrib
utio
n 3.
0 U
npor
ted
Lic
ence
.View Article Online
reaction mechanism, propylene is produced during the oxida-tive dehydrogenation reaction of propane, where there isa possibility for oxidation of propane and/or propylene to COx,as well.10
Calcined TNT alone showed negligible activity in the reac-tion and propane conversion remained almost zero in thetemperature range of 200 �C to 400 �C. However, it reachedpropane conversions of 1.9% and 2.6% at 450 �C and 500 �C,respectively, while propylene selectivities were 85.2% and77.3%. The activity of the nanotubes at these temperatures canbe attributed to thermal cracking arising at 450 �C and above. Asmolybdena loading increased from 5 wt% to 10 wt%, greaterconversion was observed at a constant temperature. Thisobservation has also been reported in other literature.25,30
Compared to the other catalysts, MoTNT-15 showed less activityas the degree of propane conversion diminished. This can beattributed to the presence of rutile phase as well as crystallinespecies of molybdena. This issue has also been proven by XRDand Raman analyses. It has been reported that rutile phase hasa lower capacity to maintain metal oxide species on its surface
Fig. 8 (a) Conversion of propane, (b) propylene selectivity, (c) propylene yand MoTNT-15 (:).
11806 | RSC Adv., 2019, 9, 11797–11809
compared to anatase. Consequently, lower activity was alsoobserved in ODH of alkanes in presence of rutile phase.50,51
Propylene selectivity showed a descending trend with molyb-dena loading increase at a constant temperature. This decreaseis low for MoTNT-10 catalyst. However, MoTNT-15, for thepreviously mentioned reasons, displayed an obvious reductionin selectivity of propylene compared to MoTNT-10 catalyst.Propylene selectivity increased for the synthesized catalystscompared to VOx/TNT catalysts,10 while VOx/CeTNT showeda better selectivity towards propylene.52 The MoTNT-10 catalystwith propane conversion of 23.8% and selectivity of 39% has thehighest propylene yield of 9.3% among the catalysts tested at500 �C. It can be stated that an optimal presence of molybdenaspecies is required to achieve desirable efficiency in oxidativedehydrogenation of propane in the presence of MoOx/TNTcatalysts. In fact, in addition to adequate and effective presence,good dispersion of monomeric and polymeric genera should beobserved, in addition to the absence of crystalline species ofmolybdena which cause less access to active sites of thesurface.20
The catalytic test results of MoK0.1TNT-10 catalyst can beobserved in Fig. 8. The presence of potassium caused lowerconversion of propane and more selectivity for propylenecompared to MoTNT-10 catalyst, which is consistent withresults obtained previously.23,29,53 Propylene molecules may haveinteractions at the catalyst surface through formation of weak
ield, and (d) TOF for MoTNT-5 (A), MoTNT-10 (-), MoK0.1TNT-10 (�),
This journal is © The Royal Society of Chemistry 2019

Fig. 9 Mars–Van–Krevelen mechanism (oxidation–reduction).
Paper RSC Advances
Ope
n A
cces
s A
rtic
le. P
ublis
hed
on 1
6 A
pril
2019
. Dow
nloa
ded
on 1
2/1/
2021
12:
44:0
7 A
M.
Thi
s ar
ticle
is li
cens
ed u
nder
a C
reat
ive
Com
mon
s A
ttrib
utio
n 3.
0 U
npor
ted
Lic
ence
.View Article Online
hydrogen bonds with surface OH groups. If these groups showBrønsted acidic property, their protons form hydrogen bondswith the p bonds of olens. Further, when the acidic property isvery powerful, proton transfer may occur from the surface toolen, thereby forming a carbocation. This begins a set ofreactions which cause reduction of selectivity.54 Indeed, bydecreasing the acidity of the catalyst, potassium facilitatesdischarge of propylene (as a nucleophile) off the catalystsurface. In this way, it prevents further oxidation of interme-diate products such as propylene, which causes increase in itsselectivity.53,55 In addition, it has been suggested that the pres-ence of potassium causes lower electrophilic oxygen concen-tration (O2
–, O�). These species are highly radical and causeprogressive oxidation of the products. It has also been statedthat nucleophilic species of O2� (as a factor of partial oxidation)increase in the presence of potassium.53,55,56 All the aforemen-tioned points cause decreased catalytic activity and increasedselectivity toward propylene. These results are in agreementwith those observed in H2-TPR analysis, where the maximumreduction temperature increased in the presence of potassium.
Fig. 10 (a) Conversion of propane and (b) propylene selectivity for MoT
This journal is © The Royal Society of Chemistry 2019
MoK0.1TNT-10 catalyst, with a propane conversion of 21.2%and propylene selectivity of 53.3%, has a yield of around 11.3%at 500 �C, which is an increase of over 20% in comparison withMoTNT-10 catalyst.
According to Fig. 8d, at a constant temperature, the largestTOF is related to MoTNT-5, the catalyst with the least molyb-dena loading amount, and the lowest TOF belongs to MoTNT-15catalyst. A relationship between the maximum reductiontemperature (Tmax) determined by H2-TPR and the TOF valuesmay be established, such that the highest Tmax corresponds tothe sample with the lowest TOF.
3.8. Deactivation of catalysts
Performances of MoTNT-10 andMoK0.1TNT-10 catalysts, whichhad the greatest yield among the catalysts, were evaluated for3000min at 500 �C. Balance of carbon did not obviously change.Propylene selectivity and conversion of propane are provided inFig. 10 in terms of time for both catalysts. As is shown, thecatalysts had slight drops in activity. The drops in propane
NT-10 (A) and MoK0.1TNT-10 (-) at 500 �C.
RSC Adv., 2019, 9, 11797–11809 | 11807

RSC Advances Paper
Ope
n A
cces
s A
rtic
le. P
ublis
hed
on 1
6 A
pril
2019
. Dow
nloa
ded
on 1
2/1/
2021
12:
44:0
7 A
M.
Thi
s ar
ticle
is li
cens
ed u
nder
a C
reat
ive
Com
mon
s A
ttrib
utio
n 3.
0 U
npor
ted
Lic
ence
.View Article Online
conversion for MoTNT-10 and MoK0.1TNT-10 are 13% and9.1%, respectively, while both catalysts showed steady increasesin propylene selectivity. This proves that the presence ofpotassium within the structure of molybdena increases catalyststability.
Based on the results obtained from BET analysis provided inTable 1, the specic surface area of the MoTNT-10 catalyst isreduced to 56 m2 g�1 following 3000 min time on-stream. Thisreduction can be attributed to increase of the mean diameter ofthe crystals on the surface of the catalyst, as well as destructionof anatase phase. The specic surface area of MoK0.1TNT-10catalyst diminished to 67 m2 g�1 aer the deactivation test,showing superior stability compared to MoTNT-10 catalyst. Itseems that potassium doping is absolutely effective in preven-tion of structural changes and reduction of surface areacompared to non-doped sample. Molybdena crystal develop-ment plays the main role in specic surface area reduction ofthe spent catalyst, while anatase to rutile phase conversion wasnot observed based on the XRD pattern of spent MoK0.1TNT-10catalyst in Fig. 2f.
4. Conclusion
Titanate nanotubes, synthesized by hydrothermal method, wereemployed as a support for molybdena and K-doped molybdenaspecies as a catalyst in ODH of propane. Several differentcharacterization methods conrmed the presence of titanatenanotubes and the high surface area of the support. Catalystpreparation was accompanied by support surface area loss,mainly due to calcination. The surface area reduction intensi-ed as molybdena polymeric and crystalline species formationand support phase destruction were observed through molyb-dena loading up to 15% on the support. All of the tested cata-lysts were active, but the highest yield of propylene wasobtained for the catalyst MoK0.1TNT-10, clearly different fromother catalyst yields, especially at high temperatures. Additionof potassium led to much better dispersion of molybdenaspecies on the support surface, as well as a superior yield ofpropylene and lower propane conversion. The catalysts showeda slight drop in propane conversion and a slighter enhancementin propylene selectivity aer 3000 min on-stream, which is inagreement with specic surface area reduction through thedeactivation test. MoK0.1TNT-10 catalyst showed enhancedstability in comparison to MoTNT-10 catalyst, which is attrib-uted to better dispersion of molybdena species in the crystalstructure.
Conflicts of interest
There are no conicts to declare.
Acknowledgements
Financial support from Chemical Engineering Center of Excel-lence at Tarbiat Modares University is highly appreciated.
11808 | RSC Adv., 2019, 9, 11797–11809
References
1 F. Cavani and F. Triro, Catal. Today, 1995, 24, 307–313.2 M.-X. Huang, X. Wu, X.-D. Yi, G.-B. Han, W.-S. Xia andH.-L. Wan, RSC Adv., 2017, 7, 14846–14856.
3 A. Talati, M. Haghighi and F. Rahmani, RSC Adv., 2016, 6,44195–44204.
4 S. A. Al-Ghamdi and H. I. de Lasa, Fuel, 2014, 128, 120–140.5 F. Ma, S. Chen, H. Zhou, Y. Li and W. Lu, RSC Adv., 2014, 4,40776–40781.
6 M. Fattahi, M. Kazemeini, F. Khorasheh and A. M. Rashidi,Catal. Sci. Technol., 2015, 5, 910–924.
7 B. Sarkar, C. Pendem, L. N. S. Konathala, T. Sasaki andR. Bal, Catal. Commun., 2014, 56, 5–10.
8 S. Tan, L. B. Gil, N. Subramanian, D. S. Sholl, S. Nair,C. W. Jones, J. S. Moore, Y. Liu, R. S. Dixit andJ. G. Pendergast, Appl. Catal., A, 2015, 498, 167–175.
9 H. Zhang, S. Cao, Y. Zou, Y.-M. Wang, X. Zhou, Y. Shen andX. Zheng, Catal. Commun., 2014, 45, 158–161.
10 A. H. S. Kootenaei, J. Towghi, A. Khodadadi andY. Mortazavi, Appl. Surf. Sci., 2014, 298, 26–35.
11 B. Chu, L. Truter, T. A. Nijhuis and Y. Cheng, Appl. Catal., A,2015, 498, 99–106.
12 G. Mitran, R. Ahmed, E. Iro, S. Hajimirzaee, S. Hodgson,A. Urda, M. Ole and I. Marcu, Catal. Today, 2018, 306, 260–267.
13 S. Zhang and H. Liu, Appl. Catal., A, 2018, 568, 1–10.14 P. S. N. Rao, G. Parameswaram, A. V. P. Rao and N. Lingaiah,
J. Mol. Catal. A: Chem., 2015, 399, 62–70.15 K. Alexopoulos, M.-F. Reyniers and G. B. Marin, J. Catal.,
2012, 289, 127–139.16 K. Chalupka, C. Thomas, Y. Millot, F. Averseng and
S. Dzwigaj, J. Catal., 2013, 305, 46–55.17 A. S. Kootenaei and J. Towghi, Int. J. Chem. React. Eng.,
2015, 13, 9–19.18 M. D. Putra, S. M. Al-Zahrani and A. E. Abasaeed, Catal.
Commun., 2011, 14, 107–110.19 S. Zhang and H. Liu, Appl. Catal., A, 2019, 573, 41–48.20 R. B. Watson and U. S. Ozkan, in Studies in Surface Science
and Catalysis, Elsevier, 2001, vol. 136, pp. 221–226.21 F. Meunier, A. Yasmeen and J. Ross, Catal. Today, 1997, 37,
33–42.22 B. Jibril, S. Al-Zahrani and A. Abasaeed, Catal. Commun.,
2003, 4, 579–584.23 S. N. Koc, G. Gurdag, S. Geissler, M. Guraya, M. Orbay and
M. Muhler, Mol. Catal., 2005, 225(2), 197–202.24 X. Fan, D. Liu, Z. Zhao, J. Li and J. Liu, Catal. Today, 2019,
DOI: 10.1016/j.cattod.2019.02.036.25 R. B. Watson, J. Catal., 2002, 208, 124–138.26 K. Kasuga, T. Hiramatsu, M. Hoson, A. Sekino and
T. Niihara, Langmuir, 1996, 14, 3160–3163.27 X. Chen and J. W. Schwank, Catal. Today, 2014, 225, 34–51.28 D. V Bavykin and F. C. Walsh, Titanate and Titania
Nanotubes, Royal Society of Chemistry, Cambridge, 2009.29 R. B. Watson and U. S. Ozkan, J. Catal., 2000, 191, 12–29.
This journal is © The Royal Society of Chemistry 2019

Paper RSC Advances
Ope
n A
cces
s A
rtic
le. P
ublis
hed
on 1
6 A
pril
2019
. Dow
nloa
ded
on 1
2/1/
2021
12:
44:0
7 A
M.
Thi
s ar
ticle
is li
cens
ed u
nder
a C
reat
ive
Com
mon
s A
ttrib
utio
n 3.
0 U
npor
ted
Lic
ence
.View Article Online
30 G. Xiong and J. Sang, J. Mol. Catal. A: Chem., 2014, 392, 315–320.
31 S.-J. Kim, Y.-U. Yun, H.-J. Oh, S. H. Hong, C. A. Roberts,K. Routray and I. E. Wachs, J. Phys. Chem. Lett., 2009, 1,130–135.
32 L. Qian, Z. Du, S. Yang and Z. Jin, J. Mol. Struct., 2005, 749,103–107.
33 I. Frisc, M. Plodinec, D. Ivekovic and A. Gajovic, J. Mol.Struct., 2009, 926, 183–191.
34 G. Deo, A. M. Turek, I. E. Wachs, T. Machej, J. Haber, N. Das,H. Eckert and A. M. Hirt, Appl. Catal., A, 1992, 91, 27–42.
35 E. B. Santos, J. M. D. S. Silva and I. O. Mazali, Vib. Spectrosc.,2010, 54, 89–92.
36 B. M. Weckhuysen, J.-M. Jehng and I. E. Wachs, J. Phys.Chem. B, 2000, 104, 7382–7387.
37 V. V. Atuchin, T. A. Gavrilova, T. I. Grigorieva,N. V. Kuratieva, K. A. Okotrub, N. V. Pervukhina andN. V. Surovtsev, J. Cryst. Growth, 2011, 318, 987–990.
38 E. de B. Santos, F. A. Sigoli and I. O. Mazali,Mater. Res. Bull.,2014, 60, 242–246.
39 I. E. Wachs, Catal. Today, 1996, 27, 437–455.40 R. Palcheva, L. Dimitrov, G. Tyuliev, A. Spojakina and
K. Jiratova, Appl. Surf. Sci., 2013, 265, 309–316.41 C. L. Wong, Y. N. Tan and A. R. Mohamed, J. Environ.
Manage., 2011, 92, 1669–1680.42 K. C. Sun, M. B. Qadir and S. H. Jeong, RSC Adv., 2014, 4,
23223–23230.
This journal is © The Royal Society of Chemistry 2019
43 M. S. Moghadam and J. Towghi, J. Chem. Pet. Eng., 2017,51(2), 113–121.
44 G. S. Kim, S. G. Ansari, H. K. Seo, Y. S. Kim and H. S. Shin, J.Appl. Phys., 2007, 101, 24314–24319.
45 J. W. Ha, J. Ind. Eng. Chem., 1998, 4, 191–196.46 P. Arnoldy and J. De Jonge, J. Phys. Chem., 1985, 89(21), 4517–
4526.47 K. Chary, T. Bhaskar, K. Seela, K. Lakshmi and K. R. Reedy,
Appl. Catal., A, 2001, 208, 291–305.48 F. Cavani, N. Ballarini and A. Cericola, Catal. Today, 2007,
127, 113–131.49 A. Loerg, T. Giornelli, S. Paul and E. Bordes-Richard, Appl.
Catal., A, 2011, 391, 43–51.50 Z. Y. Yuan and B. L. Su, Colloids Surf., A, 2004, 241, 173–183.51 J. L. G. Fierro and M. A. Banares, Catal. Commun., 2009, 11,
15–19.52 M. S. Moghadam and J. Towghi, Pet. Chem., 2018, 58(8),
659–665.53 B. Grzybowska, P. Mekss, R. Grabowski and K. Wcisto, Stud.
Surf. Sci. Catal., 1994, 82, 151–158.54 J. M. Thomas, Angew. Chem., Int. Ed., 2009, 48, 3390–3391.55 R. Grabowski, B. Grzybowska, K. Samson, J. Słoczynski,
J. Stoch and K. Wcisło, Appl. Catal., A, 1995, 125, 129–144.56 D. A. Bulushev, L. Kiwi-Minsker, V. I. Zaikovskii,
O. B. Lapina, A. A. Ivanov, S. I. Reshetnikov and A. Renken,Appl. Catal., A, 2000, 202, 243–250.
RSC Adv., 2019, 9, 11797–11809 | 11809